buybsmedia.business-standard.com/_media/bs/data/market-reports/equity... · kolte patil developers....
TRANSCRIPT

RESULTS REVIEW 2QFY17 07 DEC 2016
Kolte Patil Developers BUY
HDFC securities Institutional Research is also available on Bloomberg HSLB <GO>& Thomson Reuters
Looking ahead Kolte Patil Developers Ltd. (KPDL) delivered 2QFY17 Revenue, EBIDTA & Net Profit, 19.6/(2.0)/0.1% ahead of our estimate. Tuscan and Jazz were key project driving revenue growth. The impact of demonetization would reflect in 2HFY17E. Accordingly, we have re-calibrated our FY17-18E EPS estimate 5-21% lower to factor in the same.
KPDL has achieved 1.2mn sqft of pre-sales during 1HFY17 and has planned 1.3mn sqft of new launches during 2HFY17E. The company has maintained 2.4mn sqft of pre-sales guidance vs our estimate of 1.9mn sqft (revised 19.1% lower).
Whilst in the interim the demonetization may result in longer sales cycle and delay in new launches, Government push on affordable housing will drive mortgage rate lower. Property prices may remain muted. This shall result in strong pre-sales recovery from FY18-19E. We maintain BUY with reduced NAV based TP of Rs 144/sh (vs Rs 171/sh earlier).
Highlights of the Quarter
Strong financial performance: Consolidated Revenue/APAT grew 24.8/46.4% YoY. Strong revenue recognition in some of the projects viz. Jazz, Tuscan, Margosa resulted in robust sales. Pre-sales volume/value came in at 0.57mn sqft/Rs 3.3bn a growth of 23.9/17.2% YoY. Customer collection stood at Rs 2.3bn.
Presales to slow down; product reconfiguration key to future growth: To neutralize the impact of demonetization, KPDL is launching <Rs 5.5mn ticket size product in Pune (Corolla-0.8mn sqft, Life Republic-1.3mn sqft) during 1HFY18E. This shall help drive pre-sales during FY18E.
Annual Surplus of Rs 1bn to aid deleveraging: We expect KPDL to utilized surplus Rs 1-1.5bn/annum FCF towards balance sheet deleveraging. 2QFY17 net D/E stood at 0.56x. We remain constructive.
Financial Summary* (Rs mn) 2QFY17 2QFY16 YoY (%) 1QFY17 QoQ (%) FY16 FY17E FY18E FY19E Net Sales 2,260 1,810 24.8 1,798 25.7 6,854 7,887 8,386 10,870 EBITDA 570 473 20.7 591 (3.6) 1,842 2,115 2,285 3,029 APAT 187 128 46.4 191 (1.8) 591 696 806 1,206 Diluted EPS (Rs) 2.5 1.7 46.4 2.5 (1.8) 7.8 9.2 10.6 15.9 P/E (x) 12.6 10.7 9.2 6.2 EV / EBITDA (x) 6.8 5.8 5.1 3.6 RoE (%) 6.9 7.7 8.3 11.4 Source : Company, HDFC sec Inst Research, * Consolidated
INDUSTRY REAL ESTATE
CMP (as on 7 Dec 2016) Rs 98
Target Price Rs 144 Nifty 8,102
Sensex 26,237
KEY STOCK DATA Bloomberg KPDL IN
No. of Shares (mn) 76
MCap (Rs bn) / ($ mn) 7/110
6m avg traded value (Rs mn) 17
STOCK PERFORMANCE (%)
52 Week high / low Rs 167/84
3M 6M 12M
Absolute (%) (21.4) (21.6) (32.9)
Relative (%) (12.1) (18.8) (35.6)
SHAREHOLDING PATTERN (%)
Promoters 74.54
FIs & Local MFs 0.03
FIIs 11.44
Public & Others 13.99 Source : BSE
Parikshit Kandpal [email protected] +91-22-6171-7317

KOLTE PATIL DEVELOPERS : RESULTS REVIEW 2QFY17
Page | 2
Quarterly Financial Snapshot (Consolidated) Particulars 2QFY17 2QFY16 YoY (%) 1QFY17 QoQ (%) 1HFY17 1HFY16 YoY (%) Net Sales 2,260 1,810 24.8 1,798 25.7 4,058 3,701 9.6 Material Expenses (1,430) (1,002) 42.7 (937) 52.5 (2,367) (2,068) 14.5 Employee Expenses (92) (123) (25.3) (107) (14.0) (198) (264) (24.9) Other Operating Expenses (168) (213) (21.0) (163) 3.1 (331) (427) (22.4) EBITDA 570 473 20.7 591 (3.6) 1,162 943 23.2 Interest Cost (205) (177) 15.8 (236) (13.3) (441) (382) 15.4 Depreciation (35) (33) 4.8 (36) (3.3) (71) (66) 8.7 Other Income 21 34 (39.7) 35 (42.1) 56 67 (16.6) PBT 351 297 18.4 355 (0.9) 706 563 25.4 Minority Interest (15) (47) (67.4) 1 (2,001.3) (14) (34) (57.4) Tax (149) (122) 22.0 (165) (9.6) (314) (260) 20.6 APAT 187 128 46.4 191 (1.8) 378 269 40.4 Source: Company, HDFC sec Inst Research
Margin Analysis (Consolidated)
2QFY17 2QFY16 YoY (bps) 1QFY17 QoQ (bps) 1HFY17 1HFY16 YoY (bps) Material Expenses % Net Sales 63.3 55.4 791 52.1 1,115 58.3 55.9 247 Employee Expenses % Net Sales 4.1 6.8 (272) 5.9 (187) 4.9 7.1 (225) Other Operating Expenses % Net Sales 7.4 11.8 (432) 9.1 (163) 8.2 11.5 (337)
EBITDA Margin (%) 25.2 26.1 (87) 32.9 (765) 28.6 25.5 314 Tax Rate (%) 42.4 41.2 125 46.5 (409) 44.5 46.2 (175) APAT Margin (%) 8.3 7.1 122 10.6 (231) 9.3 7.3 204 Source: Company, HDFC sec Inst Research
Pre – Sales Trend Pre-sales trend 2QFY17 2QFY16 YoY (%) 1QFY17 QoQ (%) 1HFY17 1HFY16 YoY (%) Sales Volume (mn sqft) 0.57 0.46 23.9 0.66 (13.6) 1.2 1.0 28.1 Sales Value (Rs mn) 3,308 2,822 17.2 3,704 (10.7) 7,012 5,825 20.4 Average Realization (Rs/sqft) 5,804 6,174 (6.0) 5,612 3.4 5,701 6,068 (6.0) Collections (Rs mn) 2,341 2,230 5.0 2,290 2.2 4,631 4,887 (5.2) Source: Company, HDFC sec Inst Research
Revenue, EBIDTA & Net Profit grew 24.8%, 20.7% & 46.4% yoy, ahead of our estimates by 19.6%, -2.0% & 0.1% respectively EBIDTA margins contracted 87bps YoY to 25.2% owing to 791/(272)/(432)bps increase/(decrease) in material/employee/other expenses KPDL reported EBIDTA of Rs 570mn, growth of 20.7% YoY Net profit came in at Rs 187mn, 0.1% ahead of our estimate Pre-sales momentum remained muted at 0.57mn sqft. Average realization stood at Rs 5,804/sqft Collection stood at Rs 2,341mn a growth of 5% YoY

KOLTE PATIL DEVELOPERS : RESULTS REVIEW 2QFY17
Page | 3
Strong cashflows – to help retire upto Rs 1bn debt annually In the exhibit below, we highlight KPDL’s proforma
cashflows. We expect KDPL to achieve Rs 8.8-11.1bn of real estate collections annually. The spend on construction is pegged at Rs 5-7bn/annum. This will result in gross surplus of Rs 3-4.5bn from real estate operations
Employee cost and over head will consume about Rs 1.2-1.4bn annually whilst outgo on interest servicing shall be Rs 0.7-0.8bn. With limited outflow on maintenance/new land capex, KPDL would be Rs 1-1.4bn/annum cash surplus.
KPDL has guided for Rs 1bn of debt reduction during FY17E on account of surplus utilization. The strong sales in Corolla project and traction in Mumbai pre-sales will drive debt reduction.
KPDL doesn’t have any large maintenance/fixed assets capex and the company neither has big planned outlay on rental asset business. The current approval pipeline remains strong (~10.9mn sqft) and doesn’t require any aggressive land capex to be incurred.
The deleveraging efforts seem to be reasonable on back of strong real estate collections and limited capex.
Proforma Cashflows Rs mn FY17E FY18E FY19E Real Estate Collections 8,800 9,796 11,179 Construction Spend 5,160 5,676 6,698 Operating Cash flows - Dev Co 3,640 4,120 4,482 Employee+Other Expenses 1,158 1,239 1,363 Taxes 560 632 924 Total OCF 1,922 2,249 2,194 Less: Assets Capex 140 100 100 Less: Land Capex 100 250 250 Net OCF 1,682 1,899 1,844 Less: Interest Outgo 802 723 645 FCFE 880 1,176 1,199 Other Income 161 169 178 Net Surplus 1,041 1,346 1,377 Source: Company, HDFC sec Inst Research
Strong collections and limited capex on land/rental/fixed assets to help deleverage balance sheet We expect KPDL to be net cash surplus annually by Rs 1-1.4bn

KOLTE PATIL DEVELOPERS : RESULTS REVIEW 2QFY17
Page | 4
NET D/E: – may have peaked – to remain at 0.2-0.5x range (Rs mn) 2QFY16 3QFY16 FY16 1QFY17 2QFY17 FY17E FY18E FY19E Comments
Gross Debt 4,040 6,070 5,930 7,640 7,690
Debt increase on account of Corolla stake purchase, Premium towards TDR purchase and Mumbai projects expansion
Structure NCD's (1,160) (1,030) (1,030) (1,970) (2,340)
Deducting NCD & CCD as they are equity structured as debt by KPDL and JVs
Cash 520 650 820 680 431 Current investments 80 240 30 400 236
Net debt 2,280 4,150 4,050 4,590 4,684 4,860 4,266 3,573 Debt reduction from FY18E on back of annual cash surplus generation ~ Rs 1bn
Net Worth 8,740 8,970 8,770 8,860 8,370 9,381 10,048 11,093 Net Debt/ equity (x) 0.26 0.46 0.46 0.52 0.56 0.52 0.42 0.32 Source: Company, HDFC sec Inst Research
Change in Estimates
FY17E
New FY17E
Old %
Change FY18E
New FY18E
Old %
Change Comments
Pre-sales (mn sqft) 1.9 2.4 (19.1) 2.4 2.8 (14.3) Demonetization impact on volume to result in longer sales cycle
Realization (Rs/sqft) 5,542 5,755 (3.7) 5,491 5,777 (4.9) Realization to compress as product orientation shifts to affordable segment
Pre-sales (Rs mn) 10,758 13,781 (21.9) 13,189 16,315 (19.2)
Revenues (Rs mn) 7,887 8,155 (3.3) 8,386 9,490 (11.6) Demonetization to result in slower sales velocity. This may impact revenue recognition from under construction projects
EBITDA (Rs mn) 2,115 2,252 (6.1) 2,285 2,734 (16.4)
APAT (Rs mn) 696 735 (5.3) 806 1,023 (21.2) High interest costs & longer sales cycle to impact profitability
EPS (Rs) 9.2 9.7 (5.3) 10.6 13.5 (21.2) Source: HDFC sec Inst Research
We expect consolidated Net D/E to remain in the guidance range of 0.2-0.5x Rs 1bn+ of annual surplus cashflow to be utilized towards debt reduction We have cut our volume and realization estimates to factor in impact of demonetization This would result in 5-21% cut in earnings estimate. Delay in revenue recognition is the key driver of earnings cut

KOLTE PATIL DEVELOPERS : RESULTS REVIEW 2QFY17
Page | 5
Key assumptions and estimates FY17E FY18E FY19E
Growth (%) Comments
FY17E FY18E FY19E Volume assumptions
Residential (mn sqft) 1.9 2.4 3.0 (5.3) 23.7 24.4
We forecast FY17-19E pre-sales CAGR of 24.1% on back of unsold inventory of 6.2 mnsqft. We expect KPDL to downgrade its pre-sales volume guidance from 2.4mn sqft to 2mn sqft by 3QFY17E on account of demonetization impact. We have cut our volume assumption by ~19.1%
Residential (Rs/sqft) 5,542 5,491 5,416 (10.2) (0.9) (1.4) Realization to contract 0-10% across project as project configuration may change toward affordable segment
Total pre-sales 10,758 13,189 16,186 (15.0) 22.6 22.7 Sharp uptick in new sales during FY18-19E as mortgage rates/price discount propel volumes
Earnings forecast
Sales (Rs mn) 7,887 8,386 10,870 15.1 6.3 29.6 Back-ended new launches to result in 17.4% FY17-19E revenue CAGR
EBIDTA (Rs mn) 2,115 2,285 3,029 14.8 8.0 32.5 Stable margins to result in 19.7% FY17-19E EBIDTA CAGR.
EBIDTA Margin (%) 26.8 27.2 27.9 (6bps) 43bps 61bps Expansion on account of contribution from Mumbai projects
Net interest expense 802 723 645 35.7 (10.0) (10.7) No new land acquisition and robust proceeds from collections to result in reduction in debt and resultant interest expense
PAT (Rs mn) 696 806 1,206 17.8 15.7 49.7 31.6% FY17-19E PAT CAGR in line with robust execution and higher share of own projects/lower minority interest outgo
PAT Margin (%) 8.8 9.6 11.1 21bps 78bps 149bps Increase in PAT margins in line with EBIDTA expansion and lower financial cost
EPS (Rs) 9.2 10.6 15.9 17.8 15.7 49.7 Cash flows forecast CFO - a 1,139 1,427 1,541 CFI - b 1 29 (42) FCF - a+b 1,140 1,456 1,499 Sharp free cash-flow recovery during FY17-19E CFF-c (1,641) (1,412) (1,306) Total change in cash - a+b+c (501) 44 193
Source: Company, HDFC sec Inst Research
We forecast FY17-19E pre-sales CAGR of 24.1% on back of unsold inventory of 6.2 mnsqft. Key launches in affordable segment Corolla (<Rs5mn, 0.8mn sqft) and Life Republic (<Rs 6mn, 1.3mn sqft) will drive pre-sales in 1HFY18E Back-ended new launches to results in 17.4% FY17-19E revenue CAGR 31.6% FY17-19E PAT CAGR in line with robust execution and higher share of own projects/lower minority interest outgo Strong free cash-flow recovery from FY17E

KOLTE PATIL DEVELOPERS : RESULTS REVIEW 2QFY17
Page | 6
Valuation – Reduced NAV target of Rs 144/share Target Price of Rs 144/sh implies 46.9% upside
We have valued KPDL using DCF and arrived at a target price of Rs 148/share. Our valuation is based on 0.65x our end-FY18E NAV forecast. We have given a NAV discount of 35% to KPDL (vs earlier NAV discount of 25%). This is to factor in uncertainty around demonetization. Our base prices factor in a 0-10% price correction in the Pune market on account of demonetization. We have not considered the likely upside in saleable area once the township FSI increases from 0.5x to 1x, as the Maharashtra government gazette is awaited.
The State government has already increased FSI for non-agricultural land based township and is in the final stages of implementing it for townships on agricultural land. KPDL’s key projects that will be affected are (1) Life Republic Township, and (2)Sanjivani township. In terms of value, this could add about Rs64/share to NAV and about ~20mn sqft to the gross saleable area or (~10mn sqft KPDL share).
Rs mn New NAV Old NAV Change (%) Comments Gross NAV 21,545 21,833 (1.3) Less Net debt (4,860) (4,594) 5.8 Net Debt as on end FY17E Current Investment 47.6 47.6 NAV 16,732 17,286 (3.2) Change higher than GAV owing to increase in Debt Shares outstanding (mn) 76 76 As of Sep-16 NAV/share 221 228 (3.2) Discount to NAV 35% 25% NAV discount (1) due to delays in launches (2) 0-10% further
correction in property prices & (3) longer sales cycle Target Price 144 171 (16.1) Source: Company, HDFC sec Inst Research The impact of demonetization is difficult to predict.
Our channel checks suggest that over next 6-12month there could be (1) delay in pre-sales closure (2) longer sales cycle (3) reduction in new launches. This would impact cash flows timing and resultant NPV discounting.
We expect ~0-10% correction in Pune primary market. Value will be driven by resizing products lower. KPDL is resizing 2.1mn sqft in Rs 5.5mn ticket size. This will drive FY18E volumes.
Further, any stimulus on affordable housing will benefit KPDL as it has about 70% portfolio in LIG/MIG with ticket size Rs 5.5mn. Lower mortgage rate (~100bps reduction) can drive volumes 12-13% higher.
Pune contributes about 80.4% to our GNAV, followed by Bengaluru 12.2% and Mumbai 6%. The Mumbai projects are in advance stages of closure and may add about 0.6-1mn sqft saleable area to the KPDL portfolio. FSI increase will be key upside risk to our NAV estimate.
GNAV – Rs 21.5bn Rs mn Rs/sh % Pune 229 80.4 Bengaluru 35 12.2 Mumbai 17 6.0 Land Bank 4 1.3 Total GAV 284 100 Source: Company, HDFC sec Inst Research KPDL is resizing 2.1mn sqft in Rs 5.5mn ticket size. This will drive FY18E volumes KPDL has about 70% portfolio in LIG/MIG with ticket size <Rs 5.5mn. Lower mortgage rate ~100bps reduction can drive volumes 12-13% higher

KOLTE PATIL DEVELOPERS : RESULTS REVIEW 2QFY17
Page | 7
Real estate development – NAV calculation methodology We have divided KPDL’s entire land bank (with launch
visibility over the next 5 years) into residential projects (based on the information given by the company).
We have arrived at the sale price/sq ft. and the anticipated sales volumes for each project based on our discussions with industry experts.
We have deducted the cost of construction based on our assumed cost estimates, which have been arrived at after discussions with industry experts.
We have further deducted marketing and other costs that have been assumed at 5% of the sales revenue.
We have then deducted income tax based on the tax applicable for the project.
The resultant cash inflows at the project level have been discounted based on WACC of 16.1% (cost of equity 20.35% based on beta of 1.9x & debt/equity ratio of 0.4x). All the project level NAVs have then been summed up to arrive at the NAV of the company.
From the NAV, we have deducted the net debt and likely outgo on balance land payments as of FY17E to arrive at the final valuation of the company.

KOLTE PATIL DEVELOPERS : RESULTS REVIEW 2QFY17
Page | 8
Key valuation assumptions In the exhibit below we highlight our sales and cost
inflation forecasts. We expect property price appreciation in line with WPI inflation, i.e. 5% and peg cost inflation slightly higher at 6%. We forecast other costs including marketing, SGA and employee costs at 15% of sales. We have discounted the cash flows using 16.7% as hurdle rate.
Base Case Assumptions Assumptions % Discount rate 17 Annual rate of inflation - sales price 5 Annual rate of inflation - cost of construction 6 Other costs - marketing, SGA, employee cost (as % sales) 15
Tax rate 33 Source: Company, HDFC sec Inst Research
Our pricing assumptions are moderate and at a 5-10% discount to the current prevailing prices. Construction cost assumptions are higher than the KPDL estimates.
Base Property Price And Construction Cost Assumptions
Location City Prices Rs/sqft
Cost Rs/sqft
Wagholi Pune 3,750 1,800 Hinjewadi Pune 4,900 2,100 Kharadi Pune 5,000 2,200 Undri-NIBM Pune 4,500 2,200 Mohamad Wadi Pune 4,500 2,200 Aundh Annexe Pune 5,200 2,500 Boat Club Road Pune 9,100 3,500 Kondhwa Pune 3,900 2,000 Viman Nagar Pune 8,600 3,500 Aundh Pune 6,700 2,600 Kalyani Nagar Pune 7,500 2,800 Bavdhan Pune 4,600 2,000 Atria Pune 7,200 2,800 Wakad Pune 5,400 2,500 Andheri Mumbai 14,500 7,500 Vile Parle Mumbai 20,000 9,500 Koramangla Block III Bangalore 6,200 2,400 Hosur Road Bangalore 5,700 2,300 Kannur Road Bangalore 3,750 1,800 Source: Company, HDFC sec Inst Research
Our pricing assumptions are moderate and at a 5-10% discount to the current prevailing prices.

KOLTE PATIL DEVELOPERS : RESULTS REVIEW 2QFY17
Page | 9
NAV sensitivity analysis Sensitivity to our assumption of property price
Our model is sensitive to changes in the assumptions regarding property prices. For every 1% change in the base property prices, the NAV will change by approximately 2.7%.
NAV Sensitivity To Changes In Base Sale Price % change in sale price (10) (5) 0 5 10
NAV/share (Rs) 105 124 144 163 181 Change in NAV (%) (27.1) (13.4) - 13.5 26.1 Source : Company, HDFC sec Inst Research
Sensitivity of NAV to changes in sale inflation
In our base case, we have assumed annual sale price inflation of 5%. For every 100bps increase in the annual sale price inflation, the NAV will increase by approximately 6.9%.
NAV Sensitivity To Change In Sales Inflation Sales inflation rates (%) 3 4 5 6 7
NAV/share (Rs) 124 134 144 153 163 Change in NAV (%) (13.4) (6.7) - 6.9 13.7 Source: Company, HDFC sec Inst Research
Sensitivity of NAV to changes in cost inflation
In our base case, we have assumed cost inflation to be 6%. For every 100bps increase in construction cost inflation, the NAV will change by approximately 4.5%.
NAV Sensitivity To Change In Cost Inflation Cost inflation rates (%) 4 5 6 7 8 NAV/share (Rs) 157 150 144 137 130 Change in NAV (%) 9.2 4.6 - (4.5) (9.1) Source : Company, HDFC sec Inst Research The combined impact of a 100bps increase in sale price inflation and cost inflation will be a NAV increase of 2.4%.
Sensitivity of NAV to changes in discount rate
In our base case, we have assumed a discount rate of 16.1%. For every 100bps increase in the discount rate, the NAV will fall by ~1.7%.
NAV Sensitivity To Change In Wacc WACC rates (%) 14 15 16 17 18 NAV/share (Rs) 148 146 144 141 139 Change in NAV (%) 3.3 1.6 - (1.7) (3.5) Source: Company, HDFC sec Inst Research
1% increase in average base sale price impacts our NAV positively by 2.7% Every 100bps increase in sale price inflation impacts our NAV positively by 6.9% 100bps increase in cost inputs decreases our NAV by 4.5% 100bps increase in discounting rate impacts our NAV negatively by 1.7%

KOLTE PATIL DEVELOPERS : RESULTS REVIEW 2QFY17
Page | 10
Income Statement (Consolidated) Y/E March (Rs mn) FY15 FY16 FY17E FY18E FY19E Net Sales 6,966 6,854 7,887 8,386 10,870 Growth (%) (8.8) (1.6) 15.1 6.3 29.6 Material Expenses 3,798 3,869 4,614 4,862 6,478 Employee Expenses 428 423 474 522 574 Other Operating Expenses 696 720 684 718 790 EBIDTA 2,044 1,842 2,115 2,285 3,029 EBIDTA (%) 29.3 26.9 26.8 27.2 27.9 EBIDTA Growth (%) (7.5) (9.9) 14.8 8.0 32.5 Other Income 117 147 161 169 178 Depreciation 101 116 140 152 129 EBIT 2,060 1,873 2,136 2,303 3,077 Interest 440 591 802 723 645 PBT 1,621 1,282 1,334 1,580 2,432 Tax 602 529 560 632 924 PAT 1,018 753 774 948 1,508 Minority Interest (365) (162) (77) (142) (302) APAT 653 591 696 806 1,206 APAT Growth (%) (29.0) (9.6) 17.8 15.7 49.7 EPS 8.6 7.8 9.2 10.6 15.9 EPS Growth (%) (29.0) (9.6) 17.8 15.7 49.7 Source: Company, HDFC sec Inst Research
Balance Sheet (Consolidated) Y/E March (Rs mn) FY15 FY16 FY17E FY18E FY19E SOURCES OF FUNDS Share Capital 758 758 758 758 758 Reserves 7,657 8,016 8,624 9,290 10,335 Total Shareholders’ Funds 8,415 8,774 9,381 10,048 11,093 Minority Interest 1,926 2,886 2,963 3,106 3,407 Long Term Debt 3,387 5,932 5,182 4,632 4,132 Short Term Debt 398 - - - - Total Debt 3,785 5,932 5,182 4,632 4,132 Deferred Taxes (60) (66) (66) (66) (66) Long Term Provisions & Others - - - - - TOTAL SOURCES OF FUNDS 14,065 17,527 17,462 17,721 18,567 APPLICATION OF FUNDS Net Block 972 1,066 1,066 1,034 1,105 CWIP 109 126 126 126 126 Goodwill 218 1,192 1,192 1,192 1,192 Investments, LT Loans & Advs. 61 28 48 68 88 Inventories 14,672 17,382 19,447 20,219 20,847 Debtors 1,009 1,418 1,621 1,493 1,787 Cash & Equivalents 405 823 322 366 559 ST Loans & Advances, Others 3,922 3,517 3,545 3,642 3,538 Total Current Assets 20,008 23,139 24,934 25,720 26,731 Creditors 1,175 1,400 1,540 1,694 1,863 Other Current Liabilities & Provns 6,127 6,625 8,365 8,726 8,812 Total Current Liabilities 7,302 8,024 9,904 10,420 10,675 Net Current Assets 12,706 15,115 15,030 15,301 16,056 TOTAL APPLICATION OF FUNDS 14,065 17,527 17,462 17,721 18,567
Source: Company, HDFC sec Inst Research
KOLTE PATIL DEVELOPERS : RESULTS REVIEW 2QFY17
Page | 11
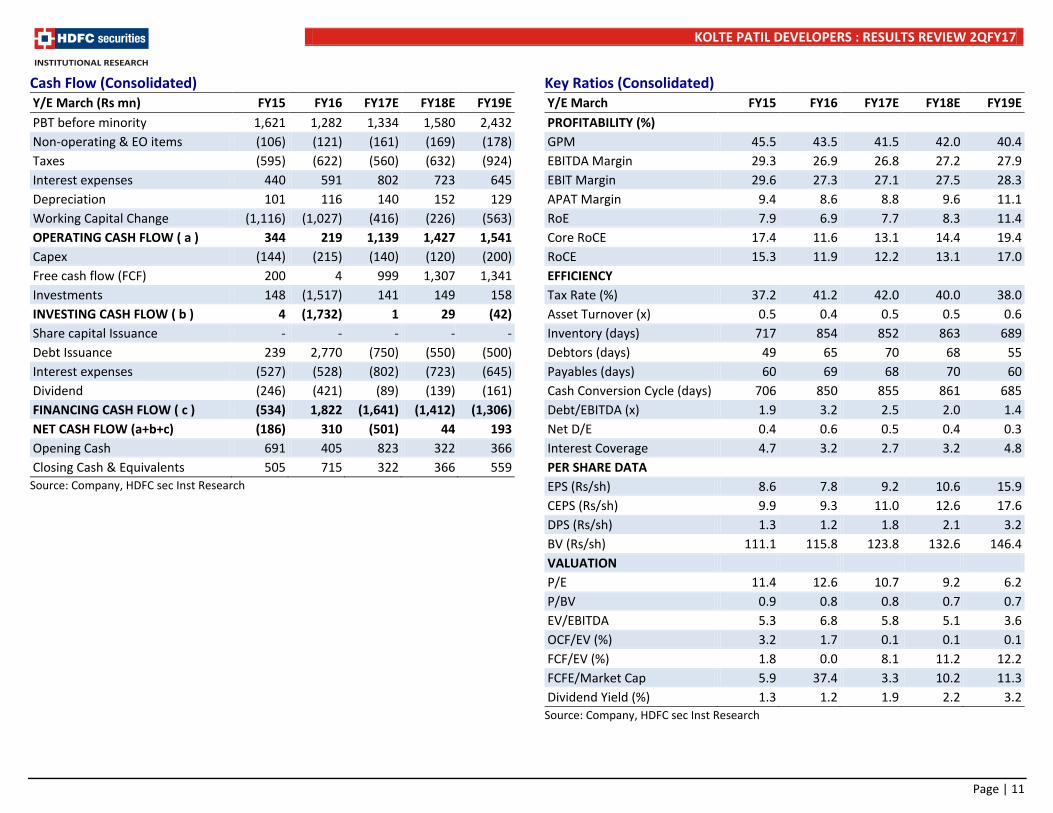
Cash Flow (Consolidated) Y/E March (Rs mn) FY15 FY16 FY17E FY18E FY19E PBT before minority 1,621 1,282 1,334 1,580 2,432 Non-operating & EO items (106) (121) (161) (169) (178) Taxes (595) (622) (560) (632) (924) Interest expenses 440 591 802 723 645 Depreciation 101 116 140 152 129 Working Capital Change (1,116) (1,027) (416) (226) (563) OPERATING CASH FLOW ( a ) 344 219 1,139 1,427 1,541 Capex (144) (215) (140) (120) (200) Free cash flow (FCF) 200 4 999 1,307 1,341 Investments 148 (1,517) 141 149 158 INVESTING CASH FLOW ( b ) 4 (1,732) 1 29 (42) Share capital Issuance - - - - - Debt Issuance 239 2,770 (750) (550) (500) Interest expenses (527) (528) (802) (723) (645) Dividend (246) (421) (89) (139) (161) FINANCING CASH FLOW ( c ) (534) 1,822 (1,641) (1,412) (1,306) NET CASH FLOW (a+b+c) (186) 310 (501) 44 193 Opening Cash 691 405 823 322 366 Closing Cash & Equivalents 505 715 322 366 559
Source: Company, HDFC sec Inst Research
Key Ratios (Consolidated) Y/E March FY15 FY16 FY17E FY18E FY19E PROFITABILITY (%) GPM 45.5 43.5 41.5 42.0 40.4 EBITDA Margin 29.3 26.9 26.8 27.2 27.9 EBIT Margin 29.6 27.3 27.1 27.5 28.3 APAT Margin 9.4 8.6 8.8 9.6 11.1 RoE 7.9 6.9 7.7 8.3 11.4 Core RoCE 17.4 11.6 13.1 14.4 19.4 RoCE 15.3 11.9 12.2 13.1 17.0 EFFICIENCY Tax Rate (%) 37.2 41.2 42.0 40.0 38.0 Asset Turnover (x) 0.5 0.4 0.5 0.5 0.6 Inventory (days) 717 854 852 863 689 Debtors (days) 49 65 70 68 55 Payables (days) 60 69 68 70 60 Cash Conversion Cycle (days) 706 850 855 861 685 Debt/EBITDA (x) 1.9 3.2 2.5 2.0 1.4 Net D/E 0.4 0.6 0.5 0.4 0.3 Interest Coverage 4.7 3.2 2.7 3.2 4.8 PER SHARE DATA EPS (Rs/sh) 8.6 7.8 9.2 10.6 15.9 CEPS (Rs/sh) 9.9 9.3 11.0 12.6 17.6 DPS (Rs/sh) 1.3 1.2 1.8 2.1 3.2 BV (Rs/sh) 111.1 115.8 123.8 132.6 146.4 VALUATION P/E 11.4 12.6 10.7 9.2 6.2 P/BV 0.9 0.8 0.8 0.7 0.7 EV/EBITDA 5.3 6.8 5.8 5.1 3.6 OCF/EV (%) 3.2 1.7 0.1 0.1 0.1 FCF/EV (%) 1.8 0.0 8.1 11.2 12.2 FCFE/Market Cap 5.9 37.4 3.3 10.2 11.3 Dividend Yield (%) 1.3 1.2 1.9 2.2 3.2
Source: Company, HDFC sec Inst Research

KOLTE PATIL DEVELOPERS : RESULTS REVIEW 2QFY17
Page | 12
Rating Definitions
BUY : Where the stock is expected to deliver more than 10% returns over the next 12 month period NEUTRAL : Where the stock is expected to deliver (-)10% to 10% returns over the next 12 month period SELL : Where the stock is expected to deliver less than (-)10% returns over the next 12 month period
Date CMP Reco Target 26-Sep-16 123 BUY 171 7-Dec-16 98 BUY 144
80
100
120
140
160
180
Dec-
15
Jan-
16
Feb-
16
Mar
-16
Apr-
16
May
-16
Jun-
16
Jul-1
6
Aug-
16
Sep-
16
Oct
-16
Nov-
16
Dec-
16
Kolte-Patil TP
RECOMMENDATION HISTORY

KOLTE PATIL DEVELOPERS : RESULTS REVIEW 2QFY17
Page | 13
HDFC securities Institutional Equities Unit No. 1602, 16th Floor, Tower A, Peninsula Business Park, Senapati Bapat Marg, Lower Parel,Mumbai - 400 013 Board : +91-22-6171 7330 www.hdfcsec.com
Disclosure: I, Parikshit Kandpal, MBA, author and the name subscribed to this report, hereby certify that all of the views expressed in this research report accurately reflect our views about the subject issuer(s) or securities. We also certify that no part of our compensation was, is, or will be directly or indirectly related to the specific recommendation(s) or view(s) in this report. Research Analyst or his/her relative or HDFC Securities Ltd. does not have any financial interest in the subject company. Also Research Analyst or his relative or HDFC Securities Ltd. or its Associate may have beneficial ownership of 1% or more in the subject company at the end of the month immediately preceding the date of publication of the Research Report. Further Research Analyst or his relative or HDFC Securities Ltd. or its associate does not have any material conflict of interest. Any holding in stock – No Disclaimer: This report has been prepared by HDFC Securities Ltd and is meant for sole use by the recipient and not for circulation. The information and opinions contained herein have been compiled or arrived at, based upon information obtained in good faith from sources believed to be reliable. Such information has not been independently verified and no guaranty, representation of warranty, express or implied, is made as to its accuracy, completeness or correctness. All such information and opinions are subject to change without notice. This document is for information purposes only. Descriptions of any company or companies or their securities mentioned herein are not intended to be complete and this document is not, and should not be construed as an offer or solicitation of an offer, to buy or sell any securities or other financial instruments. This report is not directed to, or intended for display, downloading, printing, reproducing or for distribution to or use by, any person or entity who is a citizen or resident or located in any locality, state, country or other jurisdiction where such distribution, publication, reproduction, availability or use would be contrary to law or regulation or what would subject HDFC Securities Ltd or its affiliates to any registration or licensing requirement within such jurisdiction. If this report is inadvertently send or has reached any individual in such country, especially, USA, the same may be ignored and brought to the attention of the sender. This document may not be reproduced, distributed or published for any purposes without prior written approval of HDFC Securities Ltd . Foreign currencies denominated securities, wherever mentioned, are subject to exchange rate fluctuations, which could have an adverse effect on their value or price, or the income derived from them. In addition, investors in securities such as ADRs, the values of which are influenced by foreign currencies effectively assume currency risk. It should not be considered to be taken as an offer to sell or a solicitation to buy any security. HDFC Securities Ltd may from time to time solicit from, or perform broking, or other services for, any company mentioned in this mail and/or its attachments. HDFC Securities and its affiliated company(ies), their directors and employees may; (a) from time to time, have a long or short position in, and buy or sell the securities of the company(ies) mentioned herein or (b) be engaged in any other transaction involving such securities and earn brokerage or other compensation or act as a market maker in the financial instruments of the company(ies) discussed herein or act as an advisor or lender/borrower to such company(ies) or may have any other potential conflict of interests with respect to any recommendation and other related information and opinions. HDFC Securities Ltd, its directors, analysts or employees do not take any responsibility, financial or otherwise, of the losses or the damages sustained due to the investments made or any action taken on basis of this report, including but not restricted to, fluctuation in the prices of shares and bonds, changes in the currency rates, diminution in the NAVs, reduction in the dividend or income, etc. HDFC Securities Ltd and other group companies, its directors, associates, employees may have various positions in any of the stocks, securities and financial instruments dealt in the report, or may make sell or purchase or other deals in these securities from time to time or may deal in other securities of the companies / organizations described in this report. HDFC Securities or its associates might have managed or co-managed public offering of securities for the subject company or might have been mandated by the subject company for any other assignment in the past twelve months. HDFC Securities or its associates might have received any compensation from the companies mentioned in the report during the period preceding twelve months from the date of this report for services in respect of managing or co-managing public offerings, corporate finance, investment banking or merchant banking, brokerage services or other advisory service in a merger or specific transaction in the normal course of business. HDFC Securities or its analysts did not receive any compensation or other benefits from the companies mentioned in the report or third party in connection with preparation of the research report. Accordingly, neither HDFC Securities nor Research Analysts have any material conflict of interest at the time of publication of this report. Compensation of our Research Analysts is not based on any specific merchant banking, investment banking or brokerage service transactions. HDFC Securities may have issued other reports that are inconsistent with and reach different conclusion from the information presented in this report. Research entity has not been engaged in market making activity for the subject company. Research analyst has not served as an officer, director or employee of the subject company. We have not received any compensation/benefits from the subject company or third party in connection with the Research Report. HDFC Securities Ltd. is a SEBI Registered Research Analyst having registration no. INH000002475