patient-specific pathway analysis using paradigm
TRANSCRIPT

Patient-specific pathway analysis using PARADIGM identifies key activities in
multiple cancers Josh Stuart, UC Santa Cruz
TCGA Symposium National Harbor, Nov 18, 2011

Flood of Data Analysis Challenges
Expression
DNA Methylation
Structural Variation
Exome Sequences
Copy Number Alterations
2n combos

Flood of Data Analysis Challenges
Expression
DNA Methylation
Structural Variation
Exome Sequences
Copy Number Alterations
Multiple, Possibly Conflicting Signals
This is What it Does to You

Analysis of disease samples like automotive repair (or detective work or other sleuthing)
Patient Sample 1 Patient Sample 2
Patient Sample 3 Patient Sample N
…
Sleuths use as much knowledge as possible.

5
Much Cell Machinery Known: Gene circuitry now available.
Curated and/or Collected Reactome
KEGG Biocarta NCI-PID
Pathway Commons …

6
Integration key to correct interpretation of gene function
• Expression not always an indicator of activity • Downstream effects often provide clues
TF
Inference: TF is OFF
(high expression but inactive)
TF
Inference: TF is ON
(low-expression but active )
TF
Inference: TF is ON (expression
reflects activity)
Expression of 3 transcription factors:
high high low

7
• Need multiple data modalities to get it right.
Integration key to correct interpretation of gene function
TF
Expression -> TF ON
BUT, targets are amplified
Lowers our belief in active TF because explained away by cis evidence.
Copy Number -> TF OFF

8
Probabilistic Graphical Models: A Language for Integrative Genomics
• Generalize HMMs, Kalman Filters, Regression, Boolean Nets, etc. • Language of probability ties together multiple aspects of gene function
& regulation • Enable data-driven discovery of biological mechanisms • Seminal work: J. Pearl, D. Heckerman, E. Horvitz, G. Cooper, R. Schacter,
D. Koller, N. Friedman, M. Jordan, … • Recent work: E. Segal, E Schadt, A. Hartemink, D. Pe’er, …
Nir Friedman, Science (2004) - Review

9
Integration Approach: Detailed models of gene expression and interaction
MDM2
TP53

10
Integration Approach: Detailed models of expression and interaction
MDM2
TP53
Two Parts:
1. Gene Level Model (central dogma)
2. Interaction Model (regulation)

11
PARDIGM Gene Model to Integrate Data
Vaske et al. 2010. Bioinformatics
1. Central Dogma-Like Gene Model of Activity
2. Interactions that connect to specific points in gene regulation map

12
Integrated Pathway Analysis for Cancer
• Integrated dataset for downstream analysis • Inferred activities reflect neighborhood of influence around a gene. • Can boost signal for survival analysis and mutation impact
Multimodal Data
CNV
mRNA
meth
Pathway Model of Cancer
Cohort Inferred Activities
…

13
TCGA Ovarian Cancer Inferred Pathway Activities
Patient Samples (247)
Path
way
Con
cept
s (8
67)
TCGA Network. 2011. Nature

14
Ovarian: FOXM1 pathway altered in majority of serous ovarian tumors
FOXM1 Transcription Network
Patient Samples (247)
Path
way
Con
cept
s (8
67)
TCGA Network. 2011. Nature

15
FOXM1 central to cross-talk between DNA repair and cell proliferation in Ovarian Cancer
TCGA Network. Nature 2011

16
Ovarian: IPLs statify by survival time
17
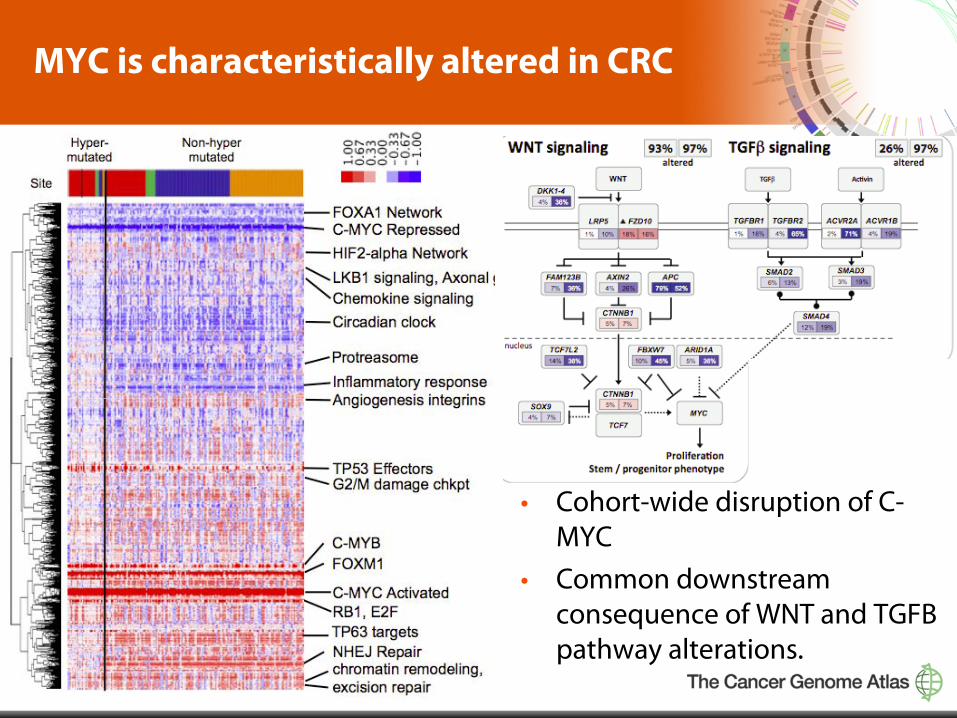
MYC is characteristically altered in CRC
• Cohort-wide disruption of C-MYC
• Common downstream consequence of WNT and TGFB pathway alterations.

18
Pathway Signatures: Differential Subnetworks from a “SuperPathway”
Pathway Activities
Pathway Activities

19
Pathway Signatures: Differential Subnetworks from a “SuperPathway”
Pathway Activities
Pathway Activities

20
Pathway Signatures: Differential Subnetworks from a “SuperPathway”
SuperPathway Activities
SuperPathway Activities
Pathway Signature

21
One large highly-connected component (size and connectivity
significant according to permutation analysis)
Higher activity in ER-
Lower activity in ER-
Triple Negative Breast Pathway Markers Identified from 50 Cell Lines
980 pathway concepts 1048 interactions
HIF1A/ARNT
Characterized by several “hubs’ IL23/JAK2/TYK2
Myc/Max
P53 tetramer
ER
FOXA1
Sam Ng, Ted Goldstein

22
Master regulators predict response to drugs: PLK1 predicted as a target for basal breast
Up Down
• DNA damage network is upregulated in basal breast cancers
• Basal breast cancers are sensitive to PLK inhibitors
Basal
Claudin-low
Luminal
GSK-PLKi
Heiser et al. 2011 PNAS
Ng, Goldstein

23
• HDAC Network is down-regulated in basal breast cancer cell lines
• Basal/CL breast cancers are resistant to HDAC inhibitors
VORINOSTAT HDAC inhibitor
HDAC inhibitors predicted for luminal breast
Heiser et al. 2011 PNAS
Ng, Goldstein

24
Predicting the Impact of Mutations On Genetic Pathways
M
Inference using all neighbors
M
Inference using downstream neighbors
M
Inference using upstream neighbors
PATHWAY DISCREPANCY
Sam Ng

25
RB1 Loss-of-Function (GBM)
Discrepancy Score PARADIGM downstream PARADIGM upstream Expression Mutation
RB1
Sam Ng

26
RB1 Network (GBM)
Sam Ng

27
TP53 Network PARADIGM upstream Expression NFE2L2 Mutation
Sam Ng

28
Pathway discrepancy gives orthogal view of the importance of mutations
• Enables probing into infrequent events • Can detect non-coding mutation impact (pseudo FPs) • Can detect presence of pathway compensation for those seemingly
functional mutations (pseudo FPs) • Extend beyond mutations • Limited to genes w/ pathway representation
NFE2L2 (29)
CDKN2A (n=30)
Pat
hway
Dis
crep
ancy
LU
SC
MET (n=7) (gefitinib resistance)
HIF3A (n=7) TBC1D4 (n=9) (AKT signaling)
MAP2K6 (n=5)
EIF4G1 (n=20)
GLI2 (n=10) (SHH signaling)
AR (n=8)
Sam Ng

29
Correlates to mutations?
Ted Goldstein

30
What about when we don’t have pathway information for a gene?
Clinical information on samples
Ted Goldstein
Pathway Inferred Levels

31
Mutation Association to Pathways
• What pathway activities is a mutation’s presence associated? • Can we classify mutations based on these associations?
Mutations
PAR
ADIG
M S
igna
ture
s
Ted Goldstein

32
Mutation Association to Pathways
• What pathway activities is a mutation’s presence associated? • Can we classify mutations based on these associations?
(Note: CRC figure below; soon for BRCA)
Mutations
PAR
ADIG
M S
igna
ture
s APC and TP53
Ted Goldstein

33
Mutation Association to Pathways
• What pathway activities is a mutation’s presence associated? • Can we classify mutations based on these associations?
Mutations
PAR
ADIG
M S
igna
ture
s
Ted Goldstein

34
Mutation Association to Pathways
• What pathway activities is a mutation’s presence associated? • Can we classify mutations based on these associations?
(Note: CRC figure below; soon for BRCA)
Mutations
PAR
ADIG
M S
igna
ture
s
TGFB Pathway mutations
Ted Goldstein

35
Mutation Association to Pathways
• What pathway activities is a mutation’s presence associated? • Can we classify mutations based on these associations?
(Note: CRC figure below; soon for BRCA)
Mutations
PAR
ADIG
M S
igna
ture
s
PIK3CA, RTK pathway, KRAS
Ted Goldstein

36
Mutation Association to Pathways
• What pathway activities is a mutation’s presence associated? • Can we classify mutations based on these associations?
(Note: CRC figure below; soon for BRCA)
Mutations
PAR
ADIG
M S
igna
ture
s
Evidence for AHNAK2 acting PI3KCA-like?
Ted Goldstein

37
Pan-Cancer: Pathway signatures will connect molecular subtypes across tissues
• Projection of CRC modulated pathways onto GBM and OVCA

38
Global Pan-Cancer Map
1382 tumor samples: 377 OV 69 KIRC 251 GBM 339 BRCA 117 LUSC 21 LUAD 67 READ 141 COAD
unpublished
39
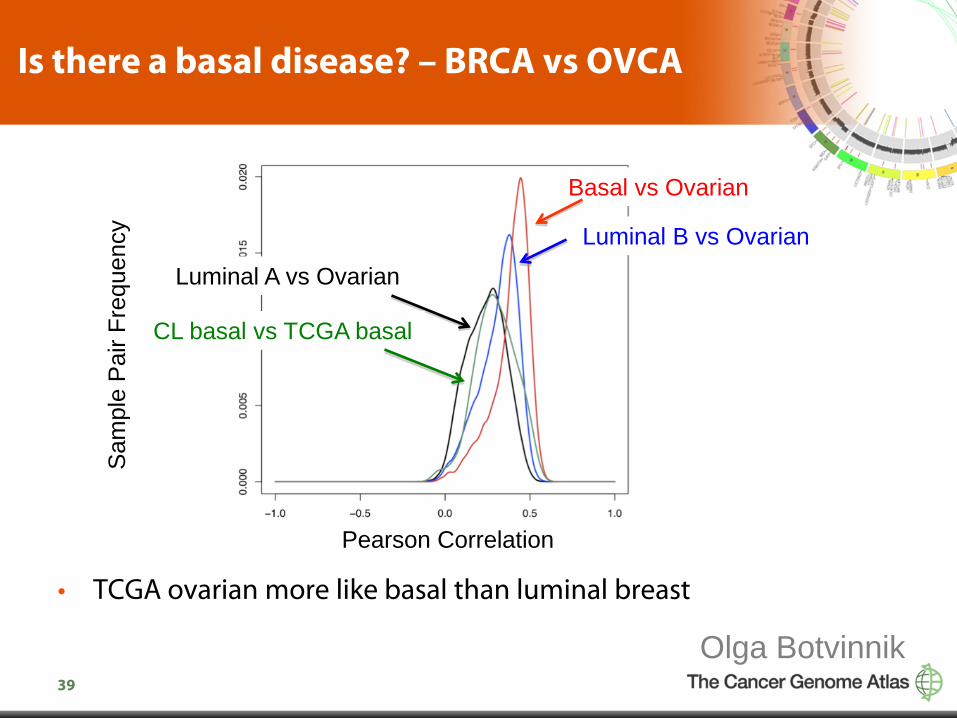
Is there a basal disease? – BRCA vs OVCA
• TCGA ovarian more like basal than luminal breast
Basal vs Ovarian
Luminal B vs Ovarian
Luminal A vs Ovarian
CL basal vs TCGA basal
Sam
ple
Pai
r Fre
quen
cy
Pearson Correlation
Olga Botvinnik

40
Summary
• Model information flow to accurately model gene activity using multi-modal data.
• Focus first on known biology • Now going after novel biology (new genes and
interactions) • Patient stratification into pathway-based subtypes • Sub-networks are predictive markers and can be used
to simulate scenarios (like drug inhibition) • Even rare mutations can be assessed for biological
significance. • Enables multi- and pan-cancer analyses

41
Connecting the dots: A drug for “rare toe carcinoma” (RTCA)
• TCGA cataloging many signatures of tumors: mutation spectrum, altered genes, and pathway activities
– E.g. patient presents w/ RTCA and has HER2 amplification
• Subtypes, and ultimately single samples can be connected by these signatures
– RTCA signature checks out w/ PAM50
• We should also engage signatures from external datasets to inform TCGA data (e.g. Connectivity Map)
– Signature matches lapatinib sensitivity signature
• Provide a basis to bootstrap clinical findings – Prescribe lapatinib to RTCA patient

42
Shout out to the Broad Team
• PARADIGM now included in Firehose – Public now can access CPU-intensive results
• Special THANKS to Daniel DeCara.

43
James Durbin Chris Szeto
UCSC Integrative Genomics Group
Sam Ng Ted Golstein Dan Carlin Evan Paull
Artem Sokolov
Chris Wong
Marcos Woehrmann
Daniel Sam

44
Acknowledgments
UCSC Cancer Genomics • Kyle Ellrott • Brian Craft • Chris Wilks • Chris Szeto • Amie Radenbaugh • Mia Grifford • Sofie Salama • Steve Benz • Tracy Ballinger
UCSC Genome Browser Staff • Mark Diekins • Melissa Cline • Jorge Garcia • Erich Weiler
Buck Institute for Aging • Christina Yau • Sean Mooney • Janita Thusberg Collaborators • Laura Esserman, UCSF • Joe Gray, LBL • Laura Heiser, LBL • Eric Collisson, UCSF Funding Agencies • NCI/NIH • SU2C • NHGRI • AACR • UCSF Comprehensive Cancer Center • QB3
Jing Zhu
David Haussler
Chris Benz,
Broad Institute • Gaddy Getz • Mike Noble • Daniel DeCara