patient safety culture in west virginia’s rural hospitals in the beginning…. west virginia...
TRANSCRIPT
Patient Safety Culture in West Virginia’s Rural Hospitals
In the beginning….
West Virginia Medical Institute

Background
The IOM Report. To Err is Human, focused attention on patient safety and medical errors
However, rural West Virginia hospitals did not have systems or infrastructure in place to improve processes as suggested by IOM
WVMI saw opportunity to assist and implemented the WV Patient Safety Improvement Program, initially with corporate funds
We received an AHRQ grant 9/2004 to expand the scope of the original project

Objectives
Improve patient safety and the culture of patient safety in rural West Virginia hospitals by:
1. Offering a free, confidential event reporting system protected from legal discovery
2. Developing a collaborative network to share information and best practices

Barriers to Implementation
Lack of IT Infrastructure in rural areas of West Virginia
Peer Review Statutes- Hospital legal staff feared data could be discoverable
Computer Literacy of hospital staff
Lack of trained IT staff
Today
23 hospitals are participating in the AHRQ project to date, 13 of these are CAH
Baseline evaluation question: What is the patient safety culture in West Virginia’s critical access hospitals?

Critical Access Hospitals
There are 1013 CAHs across the nation
Small rural hospitals differ from larger urban facilities in many different ways that can impact on their ability to implement and sustain patient safety initiatives.
Do they differ with respect to the patient safety culture in their facilities?

Hospital Survey on Patient Safety Culture: Methodology
• Distributed to staff designated by hospital administration at time of system training.*
• Completed surveys turned in at end of training session.
• Data scanned into an Excel database and analyzed used SAS.
• Data collection is ongoing as hospitals are still being recruited.

Hospital Survey: Results
Through April 2005, 860 surveys have been completed representing staff at 16 hospitals
10 of the 16 (62.5%) are CAHs

Demographic Data about Respondents
1. Primary hospital work area, department or clinical area where respondents spend most of their work time:
14.9% Many different hospital units / No specific unit 0.3% Psychiatry / mental health
11.1% Medicine (non-surgical) 3.8% Rehabilitation1.9% Surgery 2.2% Pharmacy0.6% Obstetrics 4.8% Laboratory0.3% Pediatrics 4.4% Radiology9.5% Emergency department 0.3% Anesthesiology0.3% Intensive care unit (any type) 45.4% Other
2. Staff position in the hospital:
21.2% Registered nurse 2.6% Dietician
0.3% Physician assistant / Nurse practitioner 8.3% Unit assistant / Clerk / Secretary6.0% LVN / LPN 0.6% Respiratory therapist6.1%Patient care assistant / Hospital aide / Care partner 1.3% Physical, occupational, or speech therapist0.3% Attending / Staff physician 6.1% Technician (e.g., EKG, Lab, Radiology)0.0% Resident physician / Physician in training 24.4% Administration / Management6.1% Pharmacist 20.5%Other
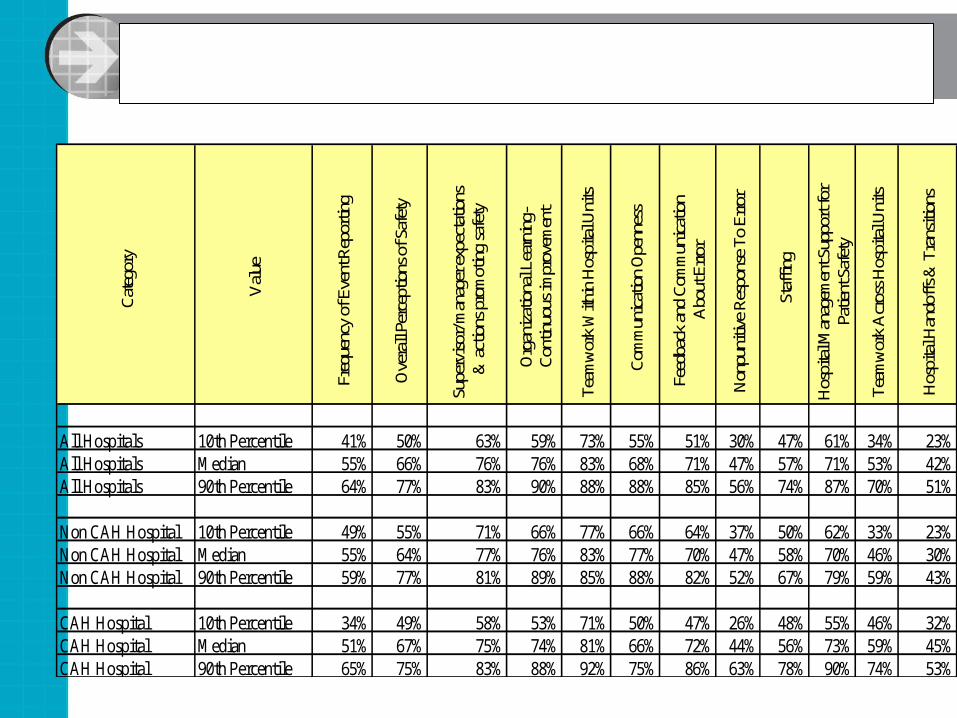
AHRQ Staff Survey Summary Results
Cat
egor
y
Val
ue
Freq
uenc
y of
Eve
nt R
epor
ting
Ove
rall
Perc
eptio
ns o
f Saf
ety
Supe
rvis
or/ m
anag
er e
xpec
tatio
ns
& a
ctio
ns p
rom
otin
g sa
fety
Org
aniz
atio
nal L
earn
ing-
Con
tinuo
us im
prov
emen
t
Team
wor
k W
ithin
Hos
pita
l Uni
ts
Com
mun
icat
ion
Ope
nnes
s
Feed
back
and
Com
mun
icat
ion
Abo
ut E
rror
Non
puni
tive
Res
pons
e To
Err
or
Staf
fing
Hos
pita
l Man
agem
ent S
uppo
rt fo
r Pa
tient
Saf
ety
Team
wor
k A
cros
s Hos
pita
l Uni
ts
Hos
pita
l Han
doff
s & T
rans
ition
s
All Hospitals 10th Percentile 41% 50% 63% 59% 73% 55% 51% 30% 47% 61% 34% 23%All Hospitals Median 55% 66% 76% 76% 83% 68% 71% 47% 57% 71% 53% 42%All Hospitals 90th Percentile 64% 77% 83% 90% 88% 88% 85% 56% 74% 87% 70% 51%
Non CAH Hospital 10th Percentile 49% 55% 71% 66% 77% 66% 64% 37% 50% 62% 33% 23%Non CAH Hospital Median 55% 64% 77% 76% 83% 77% 70% 47% 58% 70% 46% 30%Non CAH Hospital 90th Percentile 59% 77% 81% 89% 85% 88% 82% 52% 67% 79% 59% 43%
CAH Hospital 10th Percentile 34% 49% 58% 53% 71% 50% 47% 26% 48% 55% 46% 32%CAH Hospital Median 51% 67% 75% 74% 81% 66% 72% 44% 56% 73% 59% 45%CAH Hospital 90th Percentile 65% 75% 83% 88% 92% 75% 86% 63% 78% 90% 74% 53%

Demographic Data (continued)
3. Time worked
--in the hospital 8.4% Less than 1 year 33.6% 1 to 5 years 24.9% 6 to 10 years
(years)
8.7% 11 to 15 years 9.9% 16 to 20 years 14.4% 21 years or more
--in their current
hospital work area 10.2% Less than 1 year 40.7% 1 to 5 years 23.1% 6 to 10 years
(years)
9% 11 to 15 years 7.2% 16 to 20 years 9.9% 21 years or more
--in their current 4.5% Less than 1 year 24.5% 1 to 5 years 17.6% 6 to 10 yearsspecialty (years)
16.1% 11 to 15 years 11.3% 16 to 20 years 26% 21 years or more
4. Percentage of respondents with direct interaction or contact with patients: 73.2%
22
23
19
74
22
14
13
55
63
12
65
18
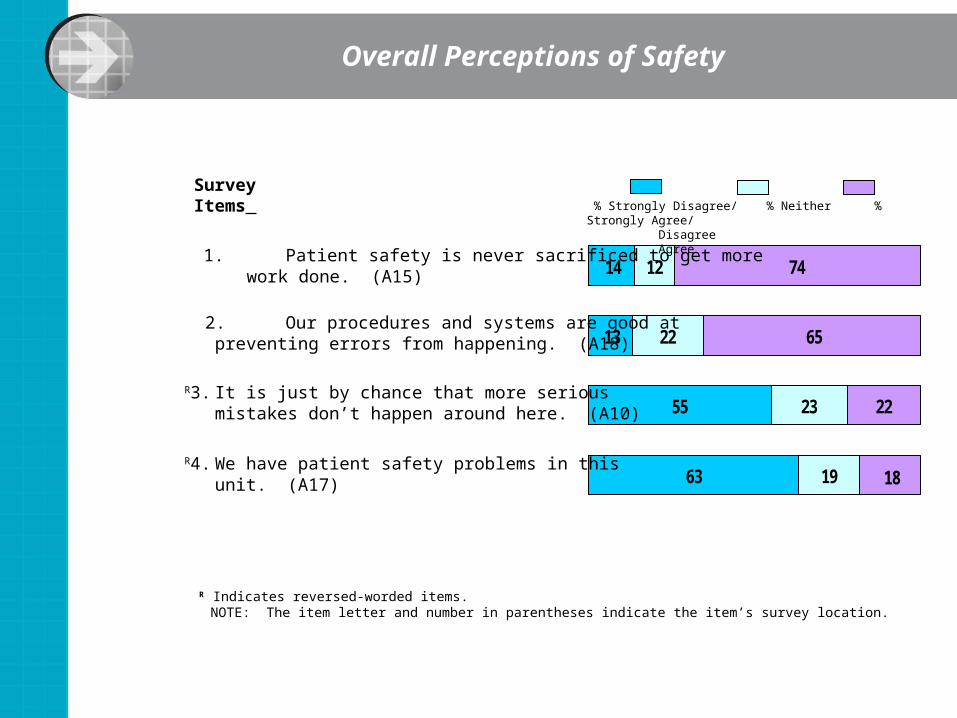
Overall Perceptions of Safety
R Indicates reversed-worded items.NOTE: The item letter and number in parentheses indicate the item’s survey location.
Survey Items % Strongly Disagree/ % Neither % Strongly Agree/ Disagree Agree
1. Patient safety is never sacrificed to get more work done. (A15)
2. Our procedures and systems are good at preventing errors from happening. (A18)
R3. It is just by chance that more serious mistakes don’t happen around here. (A10)
R4. We have patient safety problems in this unit. (A17)

34
29
20
35
6613
27
31
44
Frequency of Events Reported
1. When a mistake is made, but is caught and corrected before affecting the patient, how often is this reported? (D1)
2. When a mistake is made, but has no potential to harm the patient, how often is this reported? (D2)
3. When a mistake is made that could harm the patient, but does not, how often is this reported? (D3)
% Never/ % Sometimes % Most of the Rarely time/AlwaysSurvey Items
NOTE: The item letter and number in parentheses indicate the item’s survey location.

6
5
13
13
84
74
26
13
7
10
62
88
Teamwork Within Units
NOTE: The item letter and number in parentheses indicate the item’s survey location.
Survey Items % Strongly Disagree/ % Neither % Strongly Agree/ Disagree Agree
1. People support one another in this unit. (A1)
2. When a lot of work needs to be donequickly, we work together as a team to get the work done. (A3)
3. In this unit, people treat each other withrespect. (A4)
4. When one area in this unit gets really busy, others help out. (A11)

Communication Openness
1. Staff will freely speak up if they see something that may negatively affect patient care. (C2)
2. Staff feel free to question the decisions or actions of those with more authority. (C4)
R3. Staff are afraid to ask questions when something does not seem right. (C6)
R Indicates reversed-worded items.NOTE: The item letter and number in parentheses indicate the item’s survey location.
% Never/ % Sometimes % Most of the Rarely time/Always
Survey Items
9
18
12
78
2265
37
13
46

21
13
13
51.1
77
28
19
10
67.5
Feedback and Communication About Error
1. We are given feedback about changes putinto place based on event reports. (C1)
2. We are informed about errors that happen in this unit. (C3)
3. In this unit, we discuss ways to prevent errors from happening again. (C5)
NOTE: The item letter and number in parentheses indicate the item’s survey location.
% Never/ % Sometimes % Most of the Rarely time/Always
Survey Items

Nonpunitive Response to Error
R1. Staff feel like their mistakes are held
against them. (A8)
R2. When an event is reported, it feels like the person is being written up, not the problem. (A12)
R3. Staff worry that mistakes they make are kept in their personnel file. (A16)
R Indicates reversed-worded items.NOTE: The item letter and number in parentheses indicate the item’s survey location.
Survey Items % Strongly Disagree/ % Neither % Strongly Agree/ Disagree Agree
24
21
23
35
4631
38
42
41

Hospital Management Support for Patient Safety
R Indicates reversed-worded items.NOTE: The item letter and number in parentheses indicate the item’s survey location.
Survey Items % Strongly Disagree/ % Neither % Strongly Agree/ Disagree Agree
11
17
21
83
21
6
9
58
75
1. Hospital management provides a work climate that promotes patient safety. (F1)
2. The actions of hospital management show that patient safety is a top priority. (F8)
R3. Hospital management seems interested in patient safety only after an adverse event happens. (F9)

21
22
14
22
58
45
57
41
11
21
21
67
Teamwork Across Hospital Units
R Indicates reversed-worded items.NOTE: The item letter and number in parentheses indicate the item’s survey location.
Survey Items % Strongly Disagree/ % Neither % Strongly Agree/ Disagree Agree
1. There is good cooperation among hospital units that need to work together. (F4)
2. Hospital units work well together to provide the best care for patients. (F10)
R3. Hospital unites do not coordinate well with each other. (F2)
R4. It is often unpleasant to work with staff from other hospital units. (F6)

Hospital Handoffs & Transitions
R Indicates reversed-worded items.NOTE: The item letter and number in parentheses indicate the item’s survey location.
32
30
30
35
25
32
17
43
52
38
48
18
Survey Items % Strongly Disagree/ % Neither % Strongly Agree/ Disagree Agree
R1. Things “fall between the cracks” when transferring patients from one unit to another. (F3)
R2. Important patient care information is often lost during shift changes. (F5)
R3. Problems often occur in the exchange
of information across hospital units. (F7)
R4. Shift changes are problematic for patients in this hospital. (F11)

How Does CAH Pt. Safety Culture Differ from Larger Hospitals in WV?
At the level of composite scores the differences are minimal, with the exceptions of:
Communication Openness,
Teamwork Across Hospital Units, and
Hospital Handoffs and Transitions.
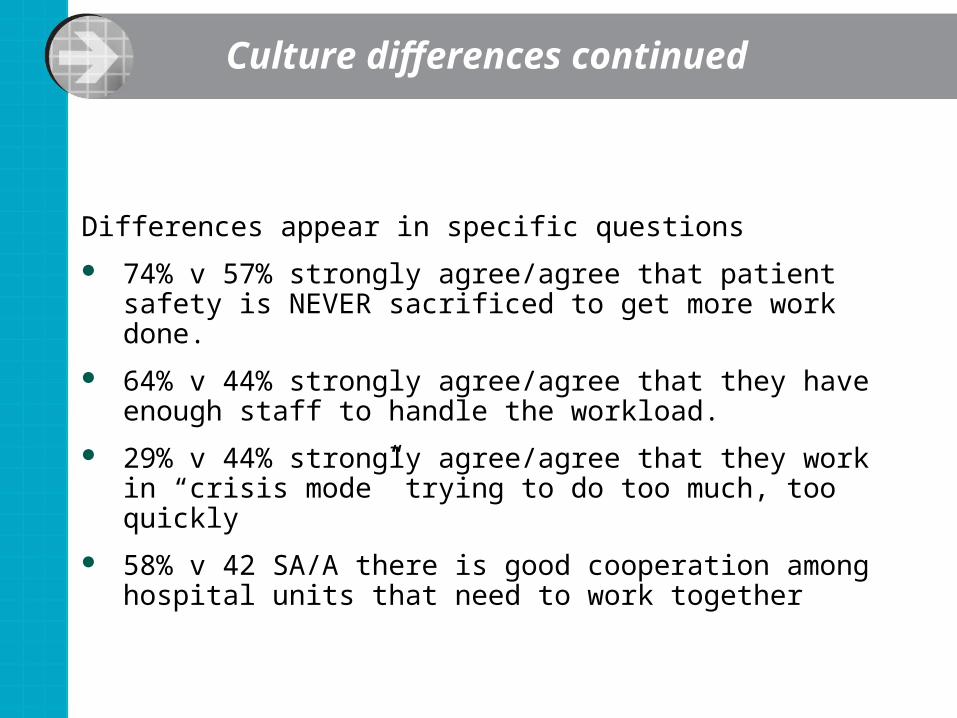
Culture differences continued
Differences appear in specific questions
74% v 57% strongly agree/agree that patient safety is NEVER sacrificed to get more work done.
64% v 44% strongly agree/agree that they have enough staff to handle the workload.
29% v 44% strongly agree/agree that they work in “crisis mode” trying to do too much, too quickly
58% v 42 SA/A there is good cooperation among hospital units that need to work together

Discussion: So What?
Reminder: Convenience sample, reflecting the opinions of those chosen or choosing to participate in training.
The patient safety culture in WV rural hospitals of all sizes still have areas needing improvement, e.g., attention to near misses, non-punitive response.
Some of the ways in which CAH culture may differ, e.g., better teamwork, better transitions could theoretically support the ease with which patient safety interventions could be implemented.

Time will tell

Contact Information
Gail Bellamy, Principal Investigator, [email protected]
Patricia Ruddick, Project Manager, [email protected]
David Lomely, Analyst,