patient responsibility in health care: an aarp bulletin survey · 2018-08-23 · patient...
TRANSCRIPT
Patient Responsibility in Health Care: An AARP Bulletin Survey
May 2011
Patient Responsibility in Health Care: An AARP Bulletin Survey
Data Collected by SSRS
Report Prepared by Teresa A. Keenan, Ph.D.
©Copyright 2011 AARP
Research & Strategic Analysis 601 E Street, NW
Washington, DC 20049 http://research.aarp.org
Reprinting with Permission
Patient Responsibility in Health Care: An AARP Bulletin Survey iii
AARP is a nonprofit, nonpartisan organization with a membership that helps people 50+ have independence, choice and control in ways that are beneficial and affordable to them and society as a whole. AARP does not endorse candidates for public office or make contributions to either political campaigns or candidates. We produce AARP The Magazine, the definitive voice for 50+ Americans and the world's largest‐circulation magazine with over 35.1 million readers; AARP Bulletin, the go‐to news source for AARP's millions of members and Americans 50+; AARP VIVA, the only bilingual U.S. publication dedicated exclusively to the 50+ Hispanic community; and our website, AARP.org. AARP Foundation is an affiliated charity that provides security, protection, and empowerment to older persons in need with support from thousands of volunteers, donors, and sponsors. We have staffed offices in all 50 states, the District of Columbia, Puerto Rico, and the U.S. Virgin Islands.
The views expressed herein are for information, debate, and discussion, and do not necessarily represent official policies of AARP.
Acknowledgements This work was done for the AARP Bulletin. The author would like to thank Barbranda Walls and Jim Toedtman for their input, Social Science Research Solutions (SSRS) for collecting and tabulating the data, and Jennifer Leslie and Lisa Costello for prepping the report for publication. For additional information, contact Teresa Keenan at (202) 434‐6274.

Patient Responsibility in Health Care: An AARP Bulletin Survey iv
Patient Responsibility in Health Care: An AARP Bulletin Survey v
Table of Contents
Executive Summary 1 Background 2 Detailed Findings 3
Healthy Lifestyle 3 Screenings in Past Five Years 3
Hearing Test and Family History 4 Adherence to Doctor’s Advice 4 Relationship with Doctor 6 Researching One’s Health Symptoms 7 Source(s) of Health Information 7 Responsibility for Treatment Decisions 8 Effect of Taking Better Care of Self 8
Summary 9 Appendix A: Demographic Characteristics of Respondents 11 Appendix B: Annotated Questionnaire 13
Patient Responsibility in Health Care: An AARP Bulletin Survey vi
List of Figures and Tables
Figure 1: How closely would you say you follow your doctor’s advice 5 Figure 2: How honest would you say are you with your doctor about your health history?
6
Table 1: Summary Table: Percentages of Respondents Who Answered “Yes” to Selected Questions, by Age, Gender, and Income
10
Patient Responsibility in Health Care: An AARP Bulletin Survey 1
Executive Summary
With an interest in learning more about what midlife and older adults think (and do) about
taking responsibility for their own health care, on behalf of the AARP Bulletin, in March 2011,
AARP Research & Strategic Analysis fielded a short telephone survey among a nationally
representative sample of 1,014 individuals ages 50 and older.
Key Findings
With roughly three‐quarters of respondents reporting that they “lead a healthy lifestyle,” it is
not surprising that their reported behaviors generally support this assertion. However, as with
many health‐related activities, respondents appear to be taking better care of themselves in
certain respects while shortchanging others.
Nearly nine in ten respondents say that they have had a vision test within the past five
years, more than eight in ten women say they’ve had a mammogram, and slightly more
than two‐thirds of men say they’ve had a prostate exam within the same time period.
But, only about half of the respondents report that they have had a colonoscopy in the
past five years (even though the Centers for Disease Control and Prevention
recommend that healthy adults begin having the exam at 50 years of age), only about
half say that they have had their hearing test as an adult, and only about four in ten say
they have compiled a family health history.
Respondents also appear to be coordinating with their health care professionals, with more
than nine in ten reporting being either extremely or very honest with their doctor about their
health history, a similar percentage saying they are extremely or very comfortable in asking
their doctor questions about medications and treatment options, and more than three‐quarter
noting that they follow their doctor’s advice extremely or very closely.
Conclusions
According to our results, a number of societal messages encouraging midlife and older adults to
lead healthier lives seem to be reaching their targets. But, clearly more still needs to be done
to encourage them to schedule a colonoscopy, have a hearing test, or take the reins of their
own or their family’s health by compiling and regularly updating a family health history. By
taking responsibility for their own health—as patients—and working closely with their health
care professionals, many midlife and older adults can remain healthy and independent for years
to come.
Patient Responsibility in Health Care: An AARP Bulletin Survey 2
Background
In March 2011, on behalf of the AARP Bulletin, AARP Research & Strategic Analysis contracted
with Social Science Research Solutions (SSRS) to field a short telephone survey among a
nationally representative sample of adults ages 50 and older to learn more about what midlife
and older adults think (and do) about taking responsibility for their own health care1,2.
Respondents were asked whether they lead a healthy lifestyle, which health screenings (if any)
they have had in the past five years, and whether they have compiled a family health history.
They were also asked how closely they follow their doctor’s advice or treatment
recommendations, how honest they are with their doctor about their health history, how
comfortable they feel asking their doctor questions about their medications and treatment, and
whether they research their health symptoms prior to a visit to the doctor. Finally, they were
asked about their primary source of health information, who they believe has the responsibility
for treatment decisions about their health, and what they believe the effect of individuals
taking better care of themselves would have on the nation’s health care costs.
1 The survey was fielded from March 30—April 10, 2011. At the conclusion of the fielding period, responses had been received from 1,014 adults ages 50 and older. The sampling error is +/‐ 3 percentage points at the 95% confidence level. This means that in 95 out of 100 samples of this size, the results would fall in a range of no more than three percentage points of what would have been obtained if every person age 50 or older had been surveyed. 2 Throughout the report, results are presented using weighted data figures.
Patient Responsibility in Health Care: An AARP Bulletin Survey 3
Detailed Findings3
Healthy Lifestyle
When asked if they would say they lead a healthy lifestyle, such as eating the right foods,
exercising regularly, and going for health screenings, more than three‐quarters (76%) of
respondents say that they do.
Notably, older respondents are more likely than younger ones to answer in the
affirmative (81% vs. 74%). Additionally, while there are no gender differences in
responses to this question, the most affluent respondents are more likely than the least
affluent ones to say they lead a healthy lifestyle (83% for those with incomes of $75,000
or more vs. 70% for those with incomes of less than $25,000).
Screenings in Past Five Years
Nearly nine in ten (86%) respondents reported that they have had a vision test in the past five
years, while roughly half (49%) said they have had a colonoscopy in the same time period.
More than eight in ten (82%) women reported having a mammogram in the past five years,
while slightly more than two‐thirds (69%) of the men reported having a prostate exam.
While there are no age differences in respondents’ reporting having had a vision test,
men are more likely than women (17% vs. 11%) to say they have not had such a test in
the past five years. However, the most affluent respondents—those with annual
household incomes of $75,000 or more—are more likely than respondents in the other
three income groups to report having had a vision test in the same time period (96% vs.
79% for those with incomes of less than $25,000; 86% for those with incomes of
$25,000‐$49,999; and 86% for those with incomes of $50,000‐$74,999).
Older respondents are more likely than younger ones to say they have had a
colonoscopy in the past five years (54% vs. 45%). Notably, there are no gender or
income differences in the likelihood of having a colonoscopy in the past five years.
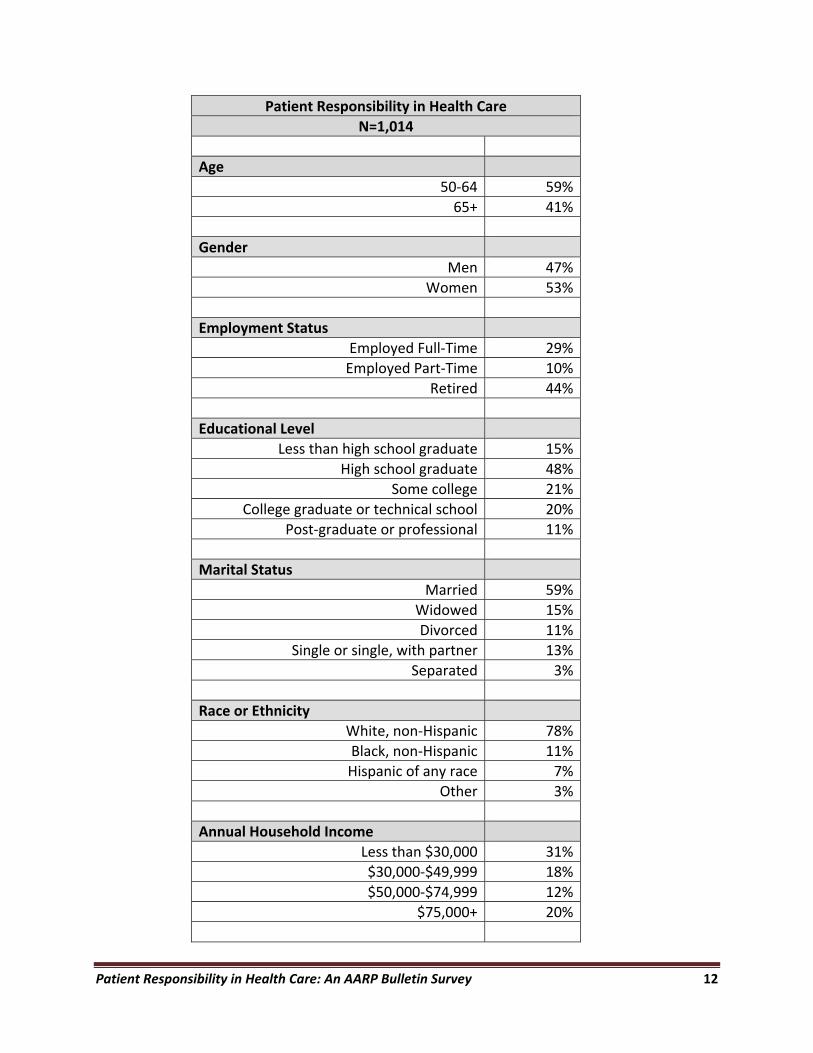
3 Respondents in this study are aged 50 and older, with nearly six in ten (59%) between the ages of 50 and 64 and roughly four in ten (41%) ages 65 and older. Slightly more than half are women (53%) and slightly less than half are men (47%). Three in ten (31%) have household incomes of less than $30,000 per year, while nearly one‐fifth (18%) have household incomes of $30,000‐$49,999 per year. Roughly one‐third (32%) of respondents reported an annual household income of $50,000 or more, with one‐fifth (20%) reporting an annual household income of $75,000 or more.
Patient Responsibility in Health Care: An AARP Bulletin Survey 4
Younger men (ages 50‐64) are more likely than older men (ages 65 and older) to report
not having a prostate exam in the past five years (33% vs. 21%). Also, men with incomes
of less than $25,000 are more likely than those with incomes of $25,000‐$49,999 or
$75,000 or more to say they have not had a prostate exam in that same time period
(47% vs. 24% and 17%).
Although women of every age are about equally likely to say they have had a
mammogram in the past five years, the most affluent ones are more likely than the least
affluent ones to report having the exam (93% vs. 76%).
Hearing Test and Family History
More than half (55%) of the respondents said they have had their hearing tested as an adult
and more than four in ten (44%) said they have compiled a family health history.
While there are no age or income differences in responses to these two questions, men
are more likely than women (66% vs. 46%) to report having had a hearing test as an
adult. But, they are about equally likely (43% and 45%) to say they have compiled a
family health history.
Adherence to Doctor’s Advice
When asked how closely they would say they follow their doctor’s advice or treatment
recommendations (such as taking medications as instructed or returning for follow‐up
appointments), more than three‐quarters of respondents said they follow it extremely closely
(34%) or very closely (43%) (see Figure 1). Another one in six (16%) said they follow the advice
somewhat closely. In contrast, five percent of respondents said they follow their doctor’s
advice or treatment recommendations not very closely (3%) or not at all closely (2%).

Patient Responsibility in Health Care: An AARP Bulletin Survey 5
Figure 1 How closely would you say you follow your doctor’s advice?
(n=1,014)
Source: Patient Responsibility in Health Care, May 2011
Younger respondents are more likely than older ones to say they somewhat closely
follow their doctor’s advice or treatment recommendations (20% vs. 12%). Additionally,
women are more likely than men to say they follow such advice very closely (47% vs.
38%). Finally, respondents with incomes between $50,000 and $74,999 are more likely
than those with incomes of $75,000 or more to say they follow their doctor’s advice
extremely closely (43% vs. 28%).
Relationship with Doctor
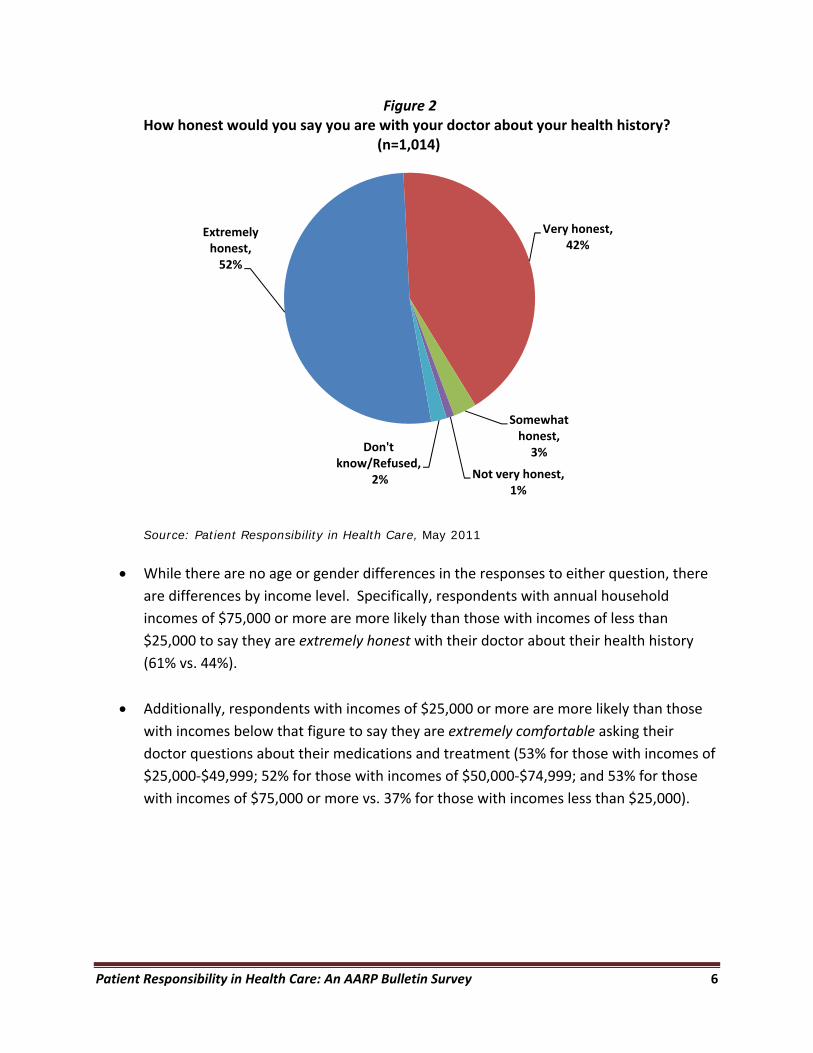
More than nine in ten (94%) respondents reported being either extremely honest (52%) or very
honest (42%) with their doctor about their health history (see Figure 2). Similarly, when asked
how comfortable they feel asking their doctor questions about their medications and
treatment, a similar figure (90%) reported feeling either extremely comfortable (49%) or very
comfortable (41%).
Extremely closely, 34%
Very closely, 43%
Somewhat closely, 16%
Not very closely, 3%
Not at all closely, 2%
Patient Responsibility in Health Care: An AARP Bulletin Survey 6
Figure 2 How honest would you say you are with your doctor about your health history?
(n=1,014)
Source: Patient Responsibility in Health Care, May 2011
While there are no age or gender differences in the responses to either question, there
are differences by income level. Specifically, respondents with annual household
incomes of $75,000 or more are more likely than those with incomes of less than
$25,000 to say they are extremely honest with their doctor about their health history
(61% vs. 44%).
Additionally, respondents with incomes of $25,000 or more are more likely than those
with incomes below that figure to say they are extremely comfortable asking their
doctor questions about their medications and treatment (53% for those with incomes of
$25,000‐$49,999; 52% for those with incomes of $50,000‐$74,999; and 53% for those
with incomes of $75,000 or more vs. 37% for those with incomes less than $25,000).
Extremely honest, 52%
Very honest, 42%
Somewhat honest, 3%
Not very honest, 1%
Don't know/Refused,
2%
Patient Responsibility in Health Care: An AARP Bulletin Survey 7
Researching One’s Health Symptoms
As for researching their symptoms prior to a visit to the doctor, respondents were split into two
nearly‐equally‐sized groups, with about half (51%) saying they do the research before the visit
and about half (47%) saying they do not.
Younger respondents are more likely than older ones (56% vs. 43%) to say they research
their symptoms prior to a visit to the doctor.
More affluent respondents are more likely than less affluent ones to also say they
research their symptoms prior to a doctor’s visit (52% for those with incomes of
$25,000‐$49,999; 63% for those with incomes of $50,000‐$74,999; and 66% for those
with incomes of $75,000 or more vs. 30% for those with incomes less than $25,000).
Source(s) of Health Information
More than half (55%) of the respondents said they get most of their health information from
their physician and one‐fifth (21%) get it from the Internet. The remaining one‐fifth of
respondents said they receive most of their health information from magazines or brochures
(8%), from a pharmacy or pharmacist (5%), from television (4%), or from some other place (5%).
Older respondents are more likely than younger ones to report getting most of their
health information from their doctor (63% vs. 49%). In contrast, younger respondents
are more likely than older ones to say they get most of their health information from
the Internet (27% vs. 13%) or television (6% vs. 2%).
In terms of income differences, less affluent respondents are more likely than those in
the highest income group (with incomes of $75,000 or more) to report getting most of
their health information from their doctor (59% for those with incomes less than
$25,000 and 58% for those with incomes of $25,000‐$49,999 vs. 45% for those with
incomes of $75,000 or more). They are also more likely than their more affluent
counterparts to report getting such information from television (7% and 7% vs. 2%).
In contrast, respondents in the highest income group are more likely than those in the
other three income groups to report getting most of their health information from the
Internet (42% vs. 6%, 20%, and 22%). Further, those with incomes in the middle of the
range—with incomes between $25,000 and $74,999—are also more likely than those in
the lowest income group to get most of their health information from the Internet (20%
and 22% vs. 6%).
Patient Responsibility in Health Care: An AARP Bulletin Survey 8
Responsibility for Treatment Decisions
Nine in ten (91%) respondents said they believe treatment decisions should be decisions made
by doctor and patient, with one in twenty (5%) saying such decisions are the sole responsibility
of the patient and one in thirty (3%) saying they are the sole responsibility of the doctor.
Although the percentages in the two age categories (ages 50‐64 and ages 65 and older)
are small, there is still a difference between them, with older respondents more likely
than younger ones (4% vs. 1%) to say that treatment decisions should be the sole
responsibility of the doctor.
Men are more likely than women (4% vs. 1%) to say that treatment decisions should be
the sole responsibility of the doctor. However, women are more likely than men (93%
vs. 88%) to report that they believe such decisions should be a combination, made by
both doctor and patient.
Notably, there are no income differences in respondents’ opinions of how treatment
decisions should be made.
Effect of Taking Better Care of Self
Respondents overwhelmingly believe that if people took better care of themselves, the nation’s
health care costs would decrease, with eight in ten (80%) respondents saying yes to the
statement. The remaining fifth are split between those who do not agree (15%) and those who
do not know (5%).
There is no age, gender, or income variation in responses to this question.
Patient Responsibility in Health Care: An AARP Bulletin Survey 9
Summary
According to our results, a number of societal messages encouraging midlife and older adults to
lead healthier lives seem to be reaching their targets. But, clearly more still needs to be done
to encourage them to schedule a colonoscopy, have a hearing test, or take the reins of their
own or their family’s health by compiling and regularly updating a family health history. By
taking responsibility for their own health—as patients—and working closely with their health
care professionals, many midlife and older adults can remain healthy and independent for years
to come.
Patient Responsibility in Health Care: An AARP Bulletin Survey 10
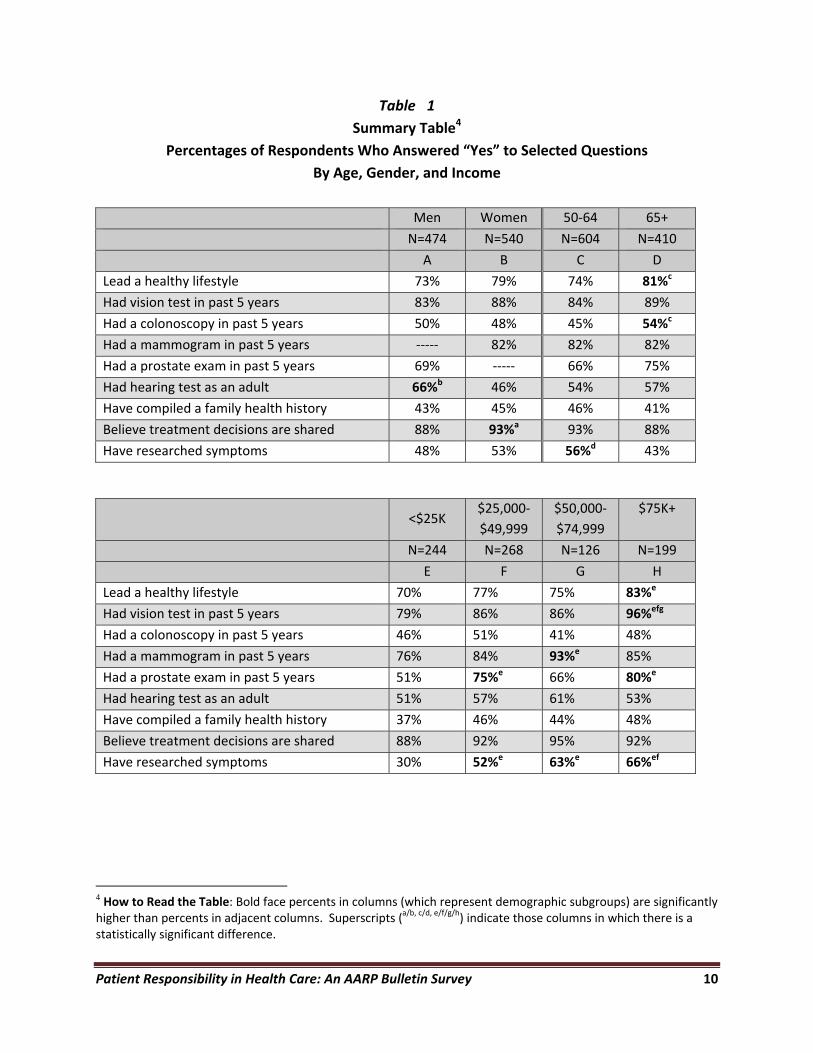
Table 1
Summary Table4
Percentages of Respondents Who Answered “Yes” to Selected Questions
By Age, Gender, and Income
Men Women 50‐64 65+
N=474 N=540 N=604 N=410
A B C D
Lead a healthy lifestyle 73% 79% 74% 81%c
Had vision test in past 5 years 83% 88% 84% 89%
Had a colonoscopy in past 5 years 50% 48% 45% 54%c
Had a mammogram in past 5 years ‐‐‐‐‐ 82% 82% 82%
Had a prostate exam in past 5 years 69% ‐‐‐‐‐ 66% 75%
Had hearing test as an adult 66%b 46% 54% 57%
Have compiled a family health history 43% 45% 46% 41%
Believe treatment decisions are shared 88% 93%a 93% 88%
Have researched symptoms 48% 53% 56%d 43%
<$25K
$25,000‐
$49,999
$50,000‐
$74,999
$75K+
N=244 N=268 N=126 N=199
E F G H
Lead a healthy lifestyle 70% 77% 75% 83%e
Had vision test in past 5 years 79% 86% 86% 96%efg
Had a colonoscopy in past 5 years 46% 51% 41% 48%
Had a mammogram in past 5 years 76% 84% 93%e 85%
Had a prostate exam in past 5 years 51% 75%e 66% 80%e
Had hearing test as an adult 51% 57% 61% 53%
Have compiled a family health history 37% 46% 44% 48%
Believe treatment decisions are shared 88% 92% 95% 92%
Have researched symptoms 30% 52%e 63%e 66%ef
4 How to Read the Table: Bold face percents in columns (which represent demographic subgroups) are significantly higher than percents in adjacent columns. Superscripts (a/b, c/d, e/f/g/h) indicate those columns in which there is a statistically significant difference.
Patient Responsibility in Health Care: An AARP Bulletin Survey 11
Appendix A: Demographic Characteristics of Respondents
Patient Responsibility in Health Care: An AARP Bulletin Survey 12
Patient Responsibility in Health Care
N=1,014
Age
50‐64 59%
65+ 41%
Gender
Men 47%
Women 53%
Employment Status
Employed Full‐Time 29%
Employed Part‐Time 10%
Retired 44%
Educational Level
Less than high school graduate 15%
High school graduate 48%
Some college 21%
College graduate or technical school 20%
Post‐graduate or professional 11%
Marital Status
Married 59%
Widowed 15%
Divorced 11%
Single or single, with partner 13%
Separated 3%
Race or Ethnicity
White, non‐Hispanic 78%
Black, non‐Hispanic 11%
Hispanic of any race 7%
Other 3%
Annual Household Income
Less than $30,000 31%
$30,000‐$49,999 18%
$50,000‐$74,999 12%
$75,000+ 20%
Patient Responsibility in Health Care: An AARP Bulletin Survey 13
Appendix B: Annotated Questionnaire
Patient Responsibility in Health Care: An AARP Bulletin Survey 14
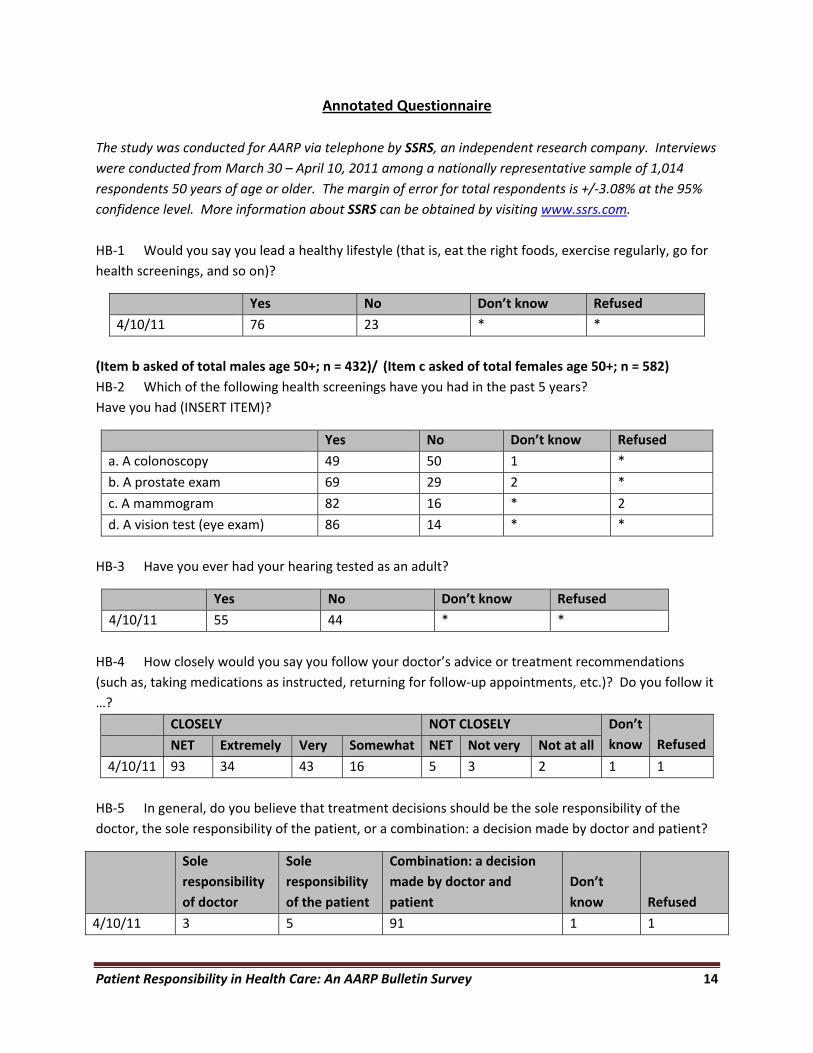
Annotated Questionnaire
The study was conducted for AARP via telephone by SSRS, an independent research company. Interviews
were conducted from March 30 – April 10, 2011 among a nationally representative sample of 1,014
respondents 50 years of age or older. The margin of error for total respondents is +/‐3.08% at the 95%
confidence level. More information about SSRS can be obtained by visiting www.ssrs.com.
HB‐1 Would you say you lead a healthy lifestyle (that is, eat the right foods, exercise regularly, go for
health screenings, and so on)?
Yes No Don’t know Refused
4/10/11 76 23 * *
(Item b asked of total males age 50+; n = 432)/ (Item c asked of total females age 50+; n = 582)
HB‐2 Which of the following health screenings have you had in the past 5 years?
Have you had (INSERT ITEM)?
Yes No Don’t know Refused
a. A colonoscopy 49 50 1 *
b. A prostate exam 69 29 2 *
c. A mammogram 82 16 * 2
d. A vision test (eye exam) 86 14 * *
HB‐3 Have you ever had your hearing tested as an adult?
Yes No Don’t know Refused
4/10/11 55 44 * *
HB‐4 How closely would you say you follow your doctor’s advice or treatment recommendations
(such as, taking medications as instructed, returning for follow‐up appointments, etc.)? Do you follow it
…?
CLOSELY NOT CLOSELY Don’t
know
Refused NET Extremely Very Somewhat NET Not very Not at all
4/10/11 93 34 43 16 5 3 2 1 1
HB‐5 In general, do you believe that treatment decisions should be the sole responsibility of the
doctor, the sole responsibility of the patient, or a combination: a decision made by doctor and patient?
Sole
responsibility
of doctor
Sole
responsibility
of the patient
Combination: a decision
made by doctor and
patient
Don’t
know
Refused
4/10/11 3 5 91 1 1
Patient Responsibility in Health Care: An AARP Bulletin Survey 15
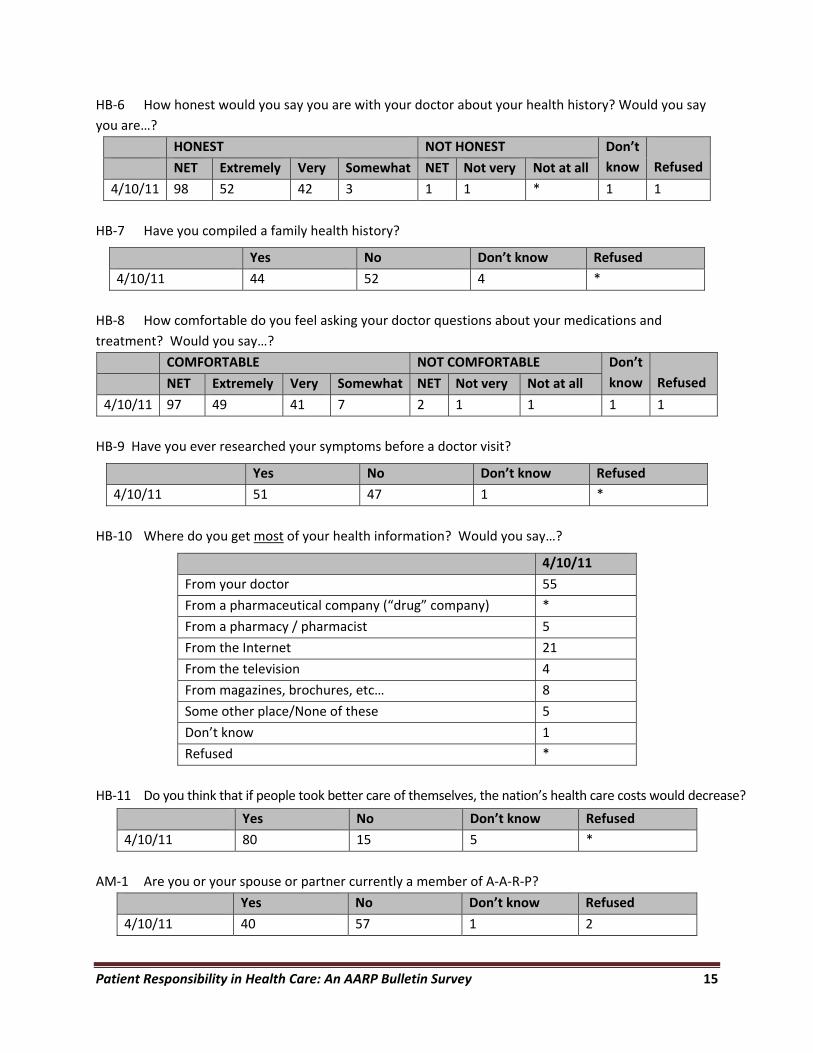
HB‐6 How honest would you say you are with your doctor about your health history? Would you say
you are…?
HONEST NOT HONEST Don’t
know
Refused NET Extremely Very Somewhat NET Not very Not at all
4/10/11 98 52 42 3 1 1 * 1 1
HB‐7 Have you compiled a family health history?
Yes No Don’t know Refused
4/10/11 44 52 4 *
HB‐8 How comfortable do you feel asking your doctor questions about your medications and
treatment? Would you say…?
COMFORTABLE NOT COMFORTABLE Don’t
know
Refused NET Extremely Very Somewhat NET Not very Not at all
4/10/11 97 49 41 7 2 1 1 1 1
HB‐9 Have you ever researched your symptoms before a doctor visit?
Yes No Don’t know Refused
4/10/11 51 47 1 *
HB‐10 Where do you get most of your health information? Would you say…?
4/10/11
From your doctor 55
From a pharmaceutical company (“drug” company) *
From a pharmacy / pharmacist 5
From the Internet 21
From the television 4
From magazines, brochures, etc… 8
Some other place/None of these 5
Don’t know 1
Refused *
HB‐11 Do you think that if people took better care of themselves, the nation’s health care costs would decrease?
Yes No Don’t know Refused
4/10/11 80 15 5 *
AM‐1 Are you or your spouse or partner currently a member of A‐A‐R‐P?
Yes No Don’t know Refused
4/10/11 40 57 1 2

Research & Strategic Analysis
601 E Street, N.W.
Washington, DC 20049