patient complaints annual report 2012 2013
TRANSCRIPT

Patient Complaints Annual Report 2012 – 2013

2 | P a t i e n t C o m p l a i n t s A n n u a l R e p o r t 2 0 1 2 / 1 3
Executive Summary This report provides a summary of patient complaints received in 2012/13. It includes details of numbers of complaints received during the year, performance in responding to complaints, Parliamentary and Health Service Ombudsman investigations, and action taken by the Trust in response to complaints. King’s has had a strong focus on improving patient experience over many years, and this continues to develop and evolve. There are well established mechanisms to capture the experience of patients and drive ongoing improvement. These include the extensive ‘How Are We Doing’ (HRWD) patient feedback programme, use of information gathered through complaints and PALS, listening to patients through initiatives such as ‘In Your Shoes’ and patient stories. Over the course of the year, around 20,000 patients feed back to us on their experience of the Trust, both good and bad. All patient experience is used to motivate and drive service improvement. The Francis Report on the inquiry into the failings in Mid Staffordshire Hospitals highlighted serious failures with the complaints process in that hospital. The review of NHS complaints being undertaken by Ann Clwyd MP and Professor Tricia Hart, due to be published in the autumn 2013, is likely to provide new guidance and statutory responsibilities for responding to complaints and concerns. The Trust has developed its own action plan to improve its processes for listening to patients and responding to their concerns. The focus is on three areas: improving feedback processes, listening to patient experience and improving feedback to patients about what we have done – You said, we did. The Trust has and continues to work hard to ensure its complaints process is personal and responds to the needs of the individual to ensure their experience is listened to and put right simply and quickly. This is demonstrated through our PALS activity which continues to report consistently high levels. This philosophy aligns with the Health Service Ombudsman’s Principles of Good Complaints Handling which promotes a customer focused complaints system. Main points to note:
638 complaints were received and 3,520 PALS contacts were recorded.
8% increase in complaints and 19% increased PALS activity compared to 2011/12.
55% of complaints were upheld after investigation.
End of year performance of 52.5% of complaints responded to within 25 working days against a target of 70%.
3% of complaints (18) were referred by complainants to the Parliamentary and Health Service Ombudsman. This is the lowest level of requests for independent review since the changes were introduced to the NHS complaints procedure in April 2009.

3 | P a t i e n t C o m p l a i n t s A n n u a l R e p o r t 2 0 1 2 / 1 3
The Trust received 638 complaints in 2012/13 which was an increase of 8% in complaints compared to 2011/12 (589) and the end of year position exceeded the Trust’s target of 540 complaints. During the year, the Trust responded to 52.5% of complaints within 25 working days which is significantly below the internal target of 70%. This position was noted by the Board, and is being closely monitored within the new financial year. The charts below illustrate complaints and PALS contacts received over a three year period, comparing activity quarter on quarter. Complaints numbers were fairly consistent throughout 2012/13 compared to last year, where there was a sharp increase in the second half of the year. PALS contacts showed a steady increase throughout 2012/13 indicating more concerns being flagged with the Trust. Overall PALS activity increased by 19% compared to 2011/12. The Trust also regularly received positive patient experience stories via patient opinion websites, HRWD, and increasingly through social media networks, Twitter and Facebook.

4 | P a t i e n t C o m p l a i n t s A n n u a l R e p o r t 2 0 1 2 / 1 3
The following chart illustrates the split of complaints between the service areas of patient care over the past three years. There was an 11% increase in inpatient complaints in 2012/13, whereas the number of outpatient complaints received in 2012/13 (199) was broadly similar to the previous year (190). Maternity and Emergency Department complaints have remained similar to previous years.
2010/11 2011/12
2012/13
Inpatient 251 282 312
Maternity 62 47 52
Outpatient 206 190 199
ED 41 70 75
In 2012/13 there were 132,379 attendances through the Emergency Department, creating additional pressures on capacity across the Trust. Complaints about the Emergency Department represented 0.6 per 1000 attendances for emergency care. This represents no change from 2011/12.
Complaints concerning outpatients were historically high (473 in 2008/09; 292 in 2009/10). However by early intervention and problem resolution we have reduced the number outpatient complaints for the past three consecutive years.
Data from complaints has fed into a number of project steering groups in 2012/13 to provide a rich source of patient experience feedback. These have included the review of cancer services following the National Cancer Patient Experience Survey results in 2012, in particular on issues surrounding communication and information, and the Outpatient Clinic Redesign Project. This project aims to improve the flow of patients attending outpatient clinics and ensure patients are fully informed about what is happening to them during their appointment.

5 | P a t i e n t C o m p l a i n t s A n n u a l R e p o r t 2 0 1 2 / 1 3
The Trust takes seriously its complaints and an escalation process for complaints rated high or above ensures that issues that could lead to an adverse incident are investigated appropriately. Responding robustly to complaints and ensuring openness and transparency in our process, are recognised as an important step in engaging trust and satisfaction. Clear explanations are provided and we regularly offer meetings with senior staff as part of the complaints process.
We have involved complainants in patient experience listening events, such as ‘In Your Shoes’, patient stories and this will continue in 2013/14 beginning with the King’s in Conversation events. From July, all complaints letters offer an opportunity to participate in King’s in conversation / listening and leaning events.
Complaints by Division
The following tables illustrate the distribution of complaints (638) by division received during 2012/13, and provide a comparison over a 3 year period.

6 | P a t i e n t C o m p l a i n t s A n n u a l R e p o r t 2 0 1 2 / 1 3
It is worth noting in particular that: Women’s Services (Obstetrics and Gynaecology) had an overall 26% increase in complaints compared to 2011/12. However the increase relates to gynaecology complaints which increased by 50% compared to 2011/12 (36 2012/13; 18 2011/12). While Maternity complaints increased by 10% they are overall similar to previous years. There was an overall increase in complaints concerning privacy and dignity compared to 2011/12. Trauma Emergency and Acute Medicine (TEAM) had an overall increase of 15% in complaints compared to 2011/12, which reflects the continued high levels of patients coming into King’s through the emergency route. Despite the overall increase, the distribution of complaints to patients attending the Emergency Department represented 0.6 per 1000 attendances for emergency care; this remains unchanged from 2011/12. Complaints within TEAM are multi-faceted and often involve other divisions, however complaints relate to discharge arrangements and planning, medical care and availability of staff. Ambulatory Services and Local Networks (including Dental) saw a reduction of 22.5% in complaints compared to 2011/12. This may reflect the improvements introduced in outpatients within the period, including the check-in kiosks and efforts to improve communication within clinics. Also the How Are We Doing (HRWD) was introduced into outpatients to capture patient feedback.
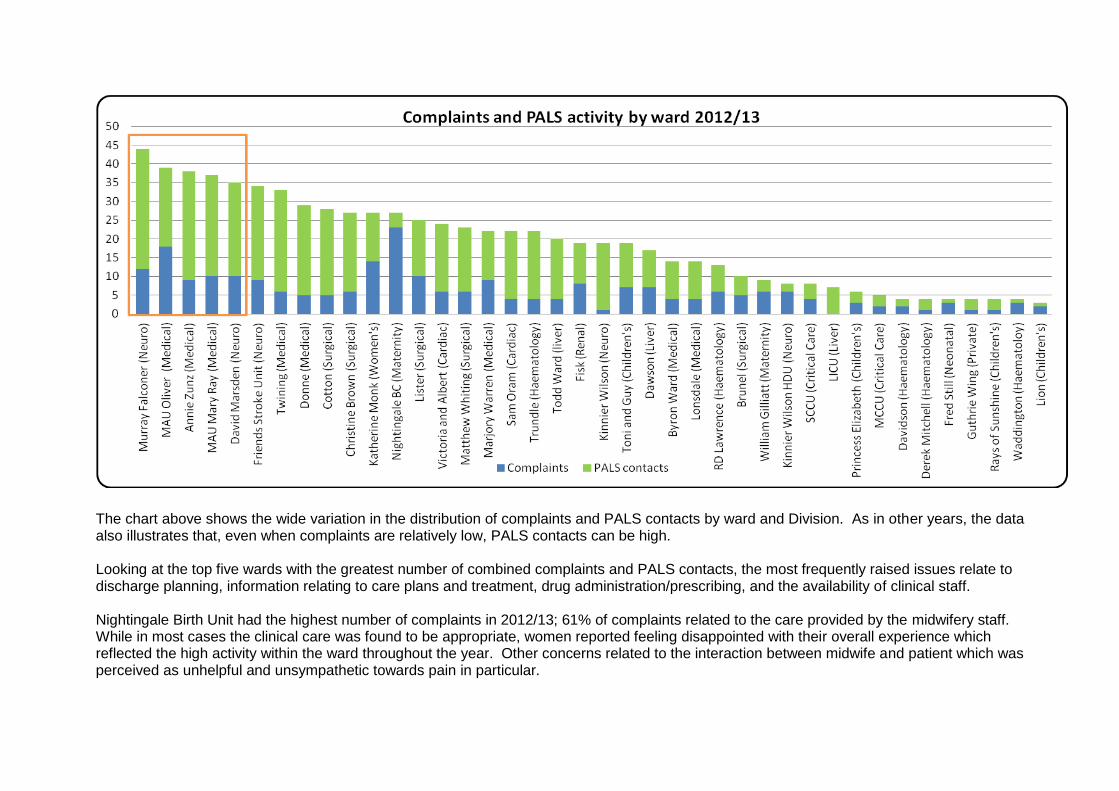
The chart above shows the wide variation in the distribution of complaints and PALS contacts by ward and Division. As in other years, the data also illustrates that, even when complaints are relatively low, PALS contacts can be high. Looking at the top five wards with the greatest number of combined complaints and PALS contacts, the most frequently raised issues relate to discharge planning, information relating to care plans and treatment, drug administration/prescribing, and the availability of clinical staff. Nightingale Birth Unit had the highest number of complaints in 2012/13; 61% of complaints related to the care provided by the midwifery staff. While in most cases the clinical care was found to be appropriate, women reported feeling disappointed with their overall experience which reflected the high activity within the ward throughout the year. Other concerns related to the interaction between midwife and patient which was perceived as unhelpful and unsympathetic towards pain in particular.

Complaints measured against Trust activity The table below illustrates the proportion of patient complaints to actual patient attendances over the past three years. The number of complaints received in 2012/13 remains the same against the Trust’s activity which has increased by 4% on the previous year.
2010/11 2011/12 2012/13
Inpatient attendances
Number of inpatient complaints 313 331 364
inpatient episodes 116,590 119,915 129,424
complaints per 1000 attendances
3 3 3
Outpatient attendances
Number of outpatient complaints 206 190 199
outpatient episodes 767,701 746,844 774,714
complaints per 1000 attendances 0.3 0.3 0.3
ED patient attendances
Number of ED complaints 41 70 75
ED episodes 125,725 129,211 132,364
complaints per 1000 attendances 0.3 0.5 0.6
The following tables show the Divisions’ complaint activity compared with activity levels. Trauma Emergency and Acute Medicine overall, have the greater levels of dissatisfaction per 1000 patients. This correlates with HRWD scores for the acute medical wards.
Inpatient complaints 2012/13 Division
No of complaints
Patient episodes
Complaints per 1000 episodes
Trauma Emergency and Acute Medicine 67 16,699 4
Liver Renal Surgery 85 24,027 3.5
Women's and Children’s 97 35,923 3
Networked Services 77 26,917 3
Ambulatory 15 25,045 0.6
Outpatient complaints 2012/13 Division
No of complaints
Patient episodes
Complaints per 1000 episodes
Liver Renal Surgery 57 143,637 0.40
Trauma Emergency and Acute Medicine 66 236,937 0.30
Networked Services 28 86,149 0.32
Women's and Children’s 23 114,905 0.20
Ambulatory 46 309,912 0.15

9 | P a t i e n t C o m p l a i n t s A n n u a l R e p o r t 2 0 1 2 / 1 3
Causes of complaint Each complaint can often be multi-faceted, particularly inpatient concerns which may cover the multi-disciplinary team and relate to events over a short or extended period of time. However, as in previous years complaints about clinical care and treatment are by far the highest cause of complaint (357) which represents 56% of all complaints received.
Primary subject of complaint 2011-12 % of
complaints 2012-13
% of complaints
Admissions, discharge and transfer arrangements 34 6 38 ↑ 6
Aids and appliances, equipment, premises (including access)
3 1 6↑ 1
Outpatient appointment delay/cancellations 17 3 35↑ 5
Inpatient delay/cancellations 37 6 28↓ 4
Attitude of staff 55 9 58↑ 9
All aspects of clinical treatment 334 57 357↑ 56
Communication 41 7 55↑ 9
Consent to treatment 4 1 2↓ 0
Patients' privacy and dignity 13 2 18↑ 3
Patients' property and expenses 3 1 3↔ 0
Personal records (including medical and/or complaints) 8 1 10↑ 2
Failure to follow agreed procedure 4 1 0↓ 0
Transport (ambulances and other) 17 3 15↓ 2
Hotel services (including food) 4 1 3↓ 0
Others 14 2 10↓ 2
Overall, the greatest increase in complaints relate to outpatient appointments (delay and cancellations) and communication (written and oral). These causes of complaint are also reflected in the PALS activity data which show that 47% of contacts related to communication and 16% of contacts related to an outpatient appointment. The roll out of the inpatient HRWD survey to all outpatient services within the period, is now gathering regular feedback from patients which together with the Outpatient Clinic

10 | P a t i e n t C o m p l a i n t s A n n u a l R e p o r t 2 0 1 2 / 1 3
Redesign Project will help to drive improvement in this area. Furthermore, it should be noted that patient feedback from HRWD has shown positive scores for Patient Engagement which include ‘when you had important questions did you get answers you could understand?’ however the final quarter was off the benchmark by 1 point. Inpatient discharges and patients’ privacy and dignity (including confidentiality) have also shown a small increase. A number of initiatives were introduced in year, such as a discharge check list, but improving patient information on discharge is an improvement priority for patient experience for the 2013/2014. While the continued high level of emergency admissions has had an adverse impact on many elective patients who have pursued the complaints process as a result, the number of complaints in 2012/13 reduced. Patient feedback from HWRD however on patient dignity, shows scores which consistently exceed the benchmark.
Complaints concerning staff attitude remains a key issue with 47% of complaints relating to nursing or midwifery staff. This is again reflected in the HRWD where scores for ‘How would your rate the courtesy of the staff treating you?’ remained off target for the period. On the flipside of this score however, the Trust consistently met the benchmark for ‘Did you have confidence and trust in the doctors/nurses treating you?’

11 | P a t i e n t C o m p l a i n t s A n n u a l R e p o r t 2 0 1 2 / 1 3
Grading and outcomes of Complaints
All complaints are graded for severity by the Complaints team using the Department of Health’s grading guide. All complaints that indicate an adverse incident may have occurred are flagged as a high priority for the investigating team and the Risk Management team are notified. The table below illustrates the severity of complaints received in 2012/13. Two cases were considered serious and also investigated as serious incidents with root cause analysis. Grading Number of complaints & % Low – Unsatisfactory service or experience 293 (46%) Medium – Service or experience below reasonable expectations
239 (37%)
High – Significant issues regarding standards and quality of care
104 (16%)
Serious – Serious failure causing serious harm 2 (1%)
During 2012/13, over half of the complaints investigated have issues (either in full or in part) which were considered to be substantiated. 55% of complaints were upheld after investigation compared to 57% in 2011/12. The following table provides information on how we assessed complaints to date in 2012/13 with their recorded outcome.
Unsatisfactory service or
experience
Service or experience below
reasonable expectations
Significant Issues regarding
standards, quality of care
Complaint not upheld 239 39 0
Complaint upheld 181 150 9
Totals: 420 189 9
Ethnicity, age of complainants, and access The ethnicity of patients has remained fairly consistent with previous years, with a slight decrease (3%) in patients stating their ethnicity as Black African. 16% of patients chose not disclose their ethnic background to the Trust. Below is a breakdown of ethnicity recorded in 2012/13.
Ethnicity % of complainants
White British 45 White Irish 3 White – other 6 Black Caribbean 8 Black African 4
12 | P a t i e n t C o m p l a i n t s A n n u a l R e p o r t 2 0 1 2 / 1 3
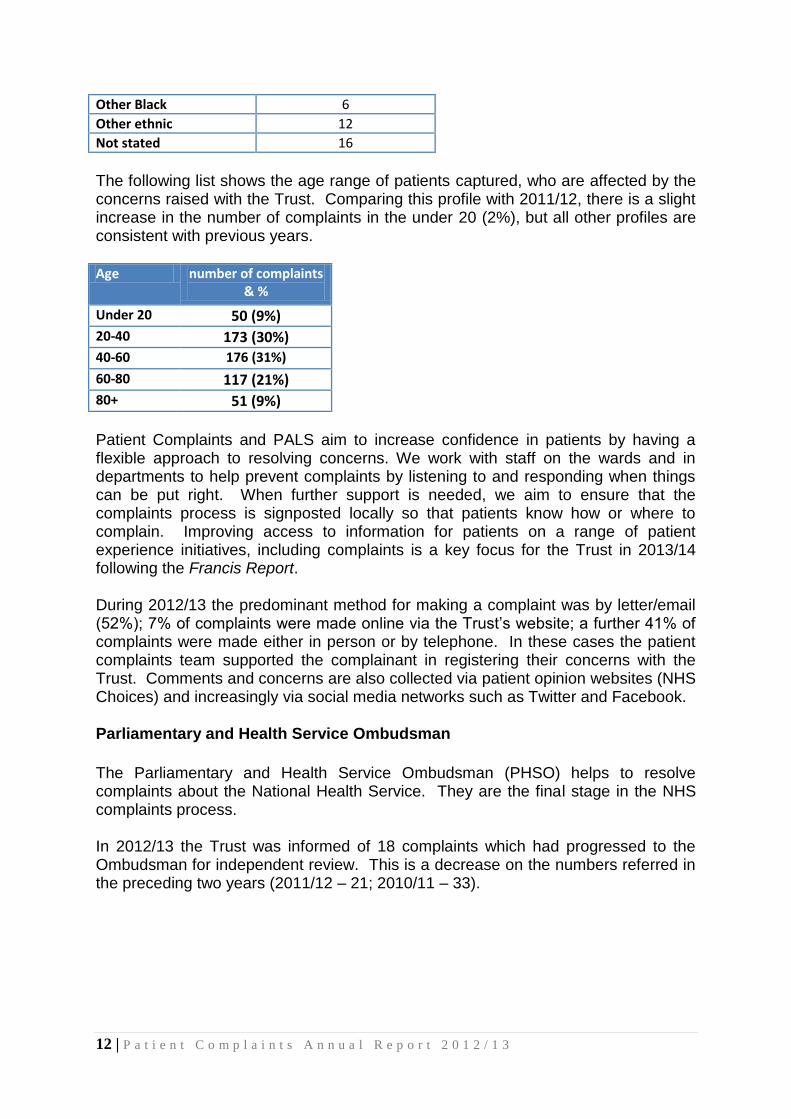
Other Black 6 Other ethnic 12 Not stated 16
The following list shows the age range of patients captured, who are affected by the concerns raised with the Trust. Comparing this profile with 2011/12, there is a slight increase in the number of complaints in the under 20 (2%), but all other profiles are consistent with previous years. Age number of complaints
& %
Under 20 50 (9%) 20-40 173 (30%) 40-60 176 (31%)
60-80 117 (21%) 80+ 51 (9%)
Patient Complaints and PALS aim to increase confidence in patients by having a flexible approach to resolving concerns. We work with staff on the wards and in departments to help prevent complaints by listening to and responding when things can be put right. When further support is needed, we aim to ensure that the complaints process is signposted locally so that patients know how or where to complain. Improving access to information for patients on a range of patient experience initiatives, including complaints is a key focus for the Trust in 2013/14 following the Francis Report. During 2012/13 the predominant method for making a complaint was by letter/email (52%); 7% of complaints were made online via the Trust’s website; a further 41% of complaints were made either in person or by telephone. In these cases the patient complaints team supported the complainant in registering their concerns with the Trust. Comments and concerns are also collected via patient opinion websites (NHS Choices) and increasingly via social media networks such as Twitter and Facebook. Parliamentary and Health Service Ombudsman
The Parliamentary and Health Service Ombudsman (PHSO) helps to resolve complaints about the National Health Service. They are the final stage in the NHS complaints process. In 2012/13 the Trust was informed of 18 complaints which had progressed to the Ombudsman for independent review. This is a decrease on the numbers referred in the preceding two years (2011/12 – 21; 2010/11 – 33).

13 | P a t i e n t C o m p l a i n t s A n n u a l R e p o r t 2 0 1 2 / 1 3
Division Number of PHSO referrals
% of complaints received by
division Ambulatory & Local Networks 2 3%
Liver Renal & Surgery 3 2%
Networked Services 5 5%
Trauma Emergency and Acute Medicine 3 4%
Women's and Children's 5 2%
Of the 18 cases, 1 case is being investigated. This relates to a patient’s outcome following neurosurgery. Additional information has been provided and we await the PHSO’s decision. 10 cases reviewed by the PSHO were not considered for further investigation or local resolution, with 7 cases referred back to the Trust for additional action to locally resolve which was successfully achieved. Learning from complaints The Trust is committed to learning the lessons from complaints to drive service improvement both at a trust-wide and local level. Throughout the year complaints have fed into staff education and learning, reflective practice across multi-disciplinary teams and changes to local practice and procedures. Drug administration
“I believe my mother wrongly received the medication of another patient over a number of unspecified days while a patient. If I had not pointed out the changes to my mother’s medication and dosages the whole clinical team would have been unaware of their mistake” At the time this was brought to the attention of the ward staff, medication for another patient was found in the patient’s own drug locker (POD) which had not been removed at the time of the previous patient’s discharge in line with Trust Policy. The Trust apologised and investigated the event as an adverse incident. The Matron has used the complaint to reinforce the importance of emptying the POD, and this situation is being monitored. Providing dignified care
“My sister who is 81 years old is not mobile and needs a wheelchair or a walking frame to get about. A porter in the transport lounge took her to the toilet but left her without the wheelchair. She had to yell out in the hope that she would be heard and helped. It was a humiliating experience and unnecessary in an area of the hospital where patients are waiting often for long periods of time”.
Maintaining patient dignity is a Trust priority, and this complaint highlighted the needs of transport patients. As a result, volunteers have been recruited from the extensive Volunteer Programme, to this area to help support transport staff to give more attention to the patients waiting. In this situation, a volunteer may have been able to ensure the patient was attended to more promptly and liaised with staff to
14 | P a t i e n t C o m p l a i n t s A n n u a l R e p o r t 2 0 1 2 / 1 3
ensure the help was followed through. Compassionate care
“My son is aged 20 and has cerebral palsy. He was walking back from the bathroom when he had a spasmodic episode and fell to the floor. A nurse came over to him, put a pillow under his head and left him on the floor whilst he continued with the paper work he was doing. My son should be treated with compassion and his needs anticipated”. The Trust investigated the complaint and confirmed that the patient was helped to the floor while he was falling during a dystonic event. Dystonia is a neurological movement disorder, in which sustained muscle contractions cause twisting and repetitive movements or abnormal postures. The patient was left to lie on the floor for his own safety, until the episode had recovered. A nurse sat with the patient throughout. The complaint has however highlighted an opportunity to provide some teaching for the nurses on dystonia and ‘conscious communication’ with input from a Consultant Psychologist. Communication
“I have attended multiple outpatient appointments at King’s and on not a single one of those appointments have I been seen on time. The communication boards do not reflect the actual waiting time and nobody seems to take responsibility for updating the patients”. A new patient calling system will be installed into Suite 3 of the Golden Jubilee Wing in July 2013. For the first time we will have real-time, automatically gathered information as to the difference between the patients’ appointment time and the time that they are called in to see the doctor. It is hoped that this system will give patients a better estimated waiting time. These improvements are part of an outpatient clinic redesign project and the initiatives will be rolled out to all outpatient clinics.
Safe and effective patient care
“My husband was discharged with the information that his oxygen levels would be increased from 2.5 litres to 3 litres but when the oxygen team came they said that they had not received notification from the hospital of the increase and was therefore unable to give it and he became unwell and had to be readmitted”. The Trust apologised for not completing the referral to the oxygen supplier and in response to the complaint the Respiratory team reviewed their system to minimise the miscommunication that this case had highlighted. In addition the team reviewed its patient information to ensure all patients receive a leaflet with the team’s contact details to minimise concern once discharged. To further support these improvements, an extended nurse-led oxygen clinic is now available 7 days a week.