patient characteristics at the beginning of esrd
Post on 30-Dec-2016
212 views
TRANSCRIPT
Two Patient
Characteristics at the Beginning of ESRD
What a piece of work is man! How noble in reason! how infinite in faculty! in form, in moving, how express and admirable! in action how like an angel! in apprehension how like a god! William Shakespeare, Hamlet
American Journal of Kidney Diseases, Vol 36, No 6, Suppl 2 (December), 2000: pp S55-S68
S 5 6 · 2 0 0 0 A T L A S O F E S R D I N T H E U N I T E D S T A T E S
This chapter presents data from the new HCFA Medical Evidence Form, introduced in 1995.
The mean age of the ESRD population increased 3.4% between 1995 and 1998, to 62.2 (fig 2.1). The distribution of males and females within the new ESRD population remains approximately equal, while the percentage of patients entering the population with a primary diagnosis of diabetes has increased slightly. Black patients account for a higher proportion of the hemodialysis population than of the population on peritoneal dialysis, while Native Americans and Asians account for approximately the same percentage of patients on each modality (figs 2.2-3).
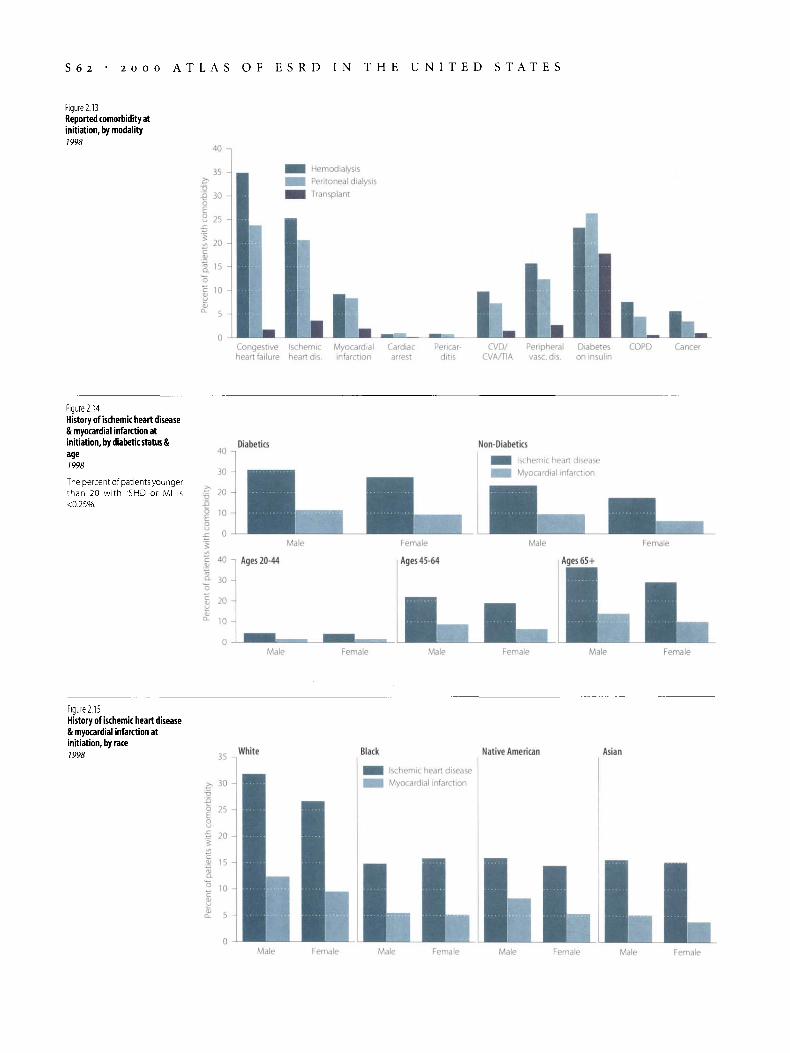
Hypertension and diabetes are the complicating comorbid conditions found most often in new patients, 73.9% and 64.4% respectively, followed by congestive heart failure (33.4%) and ischemic heart disease (24.6%, fig 2.10). The percentage of patients with no reported comorbidity or only one comorbid condition has decreased since 1995, and almost 50% of new patients have three or more comorbid conditions when they initiate ESRD therapy (fig 2.11).
Ischemic heart disease and myocardial infarction are most evident in male patients aged 45 and older and in male diabetic patients, and occur with higher frequency in white patients of both
All data underlying the genders than in patients of other races (figs 2.14— 15). Except for blacks, males have a higher inci-
figures in this chapter, dence of myocardial infarction within each race. In all races, hypertension and diabetes are the two
as well as additional related most prominent non-cardiac comorbidities at initiation (fig 2.17).
data, may be viewed & More pediatric patients receive EPO prior to ini-
downloaded at tiation than older patients, and females, regardless of age or race, are more likely to have received
www.usrds.org. EPO than males (fig 2.20).
Patients in all age groups and both genders are starting therapy with lower creatinine levels (fig 2.21). Average glomerular filtration rates (GFR), body mass indices (BMI), and body weight have increased since 1995 (fig 2.22).
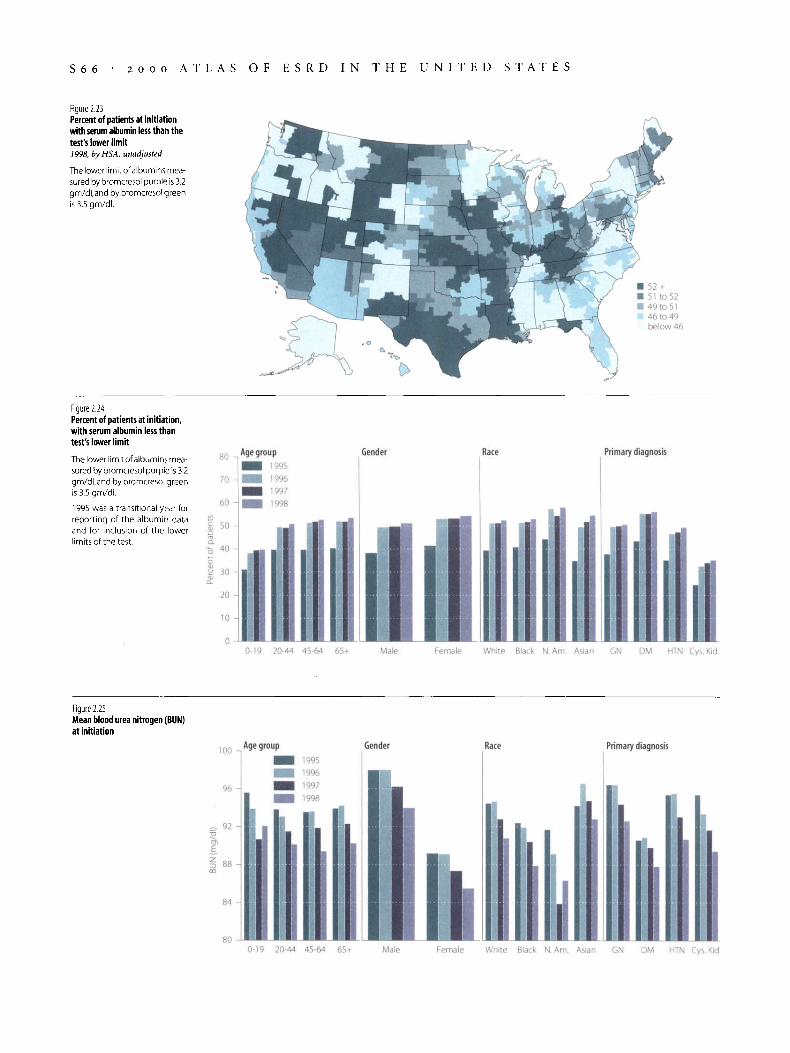
Serum albumin levels at initiation vary throughout the country (fig 2.23). In some areas, including south Texas, the Rocky Mountain region, and a band through the central part of the nation, more than 52% of new patients have albumins lower than the test's lower limit. In most areas of the country the percent of new patients initiating therapy with low albumin levels is at least 46%. These low levels may reflect patients being treated with low protein diets in order to slow the progression of renal disease; they may also, however, be more directly related to patient comorbidity and disease severity, and to diagnoses of diabetes and glomerulonephritis.
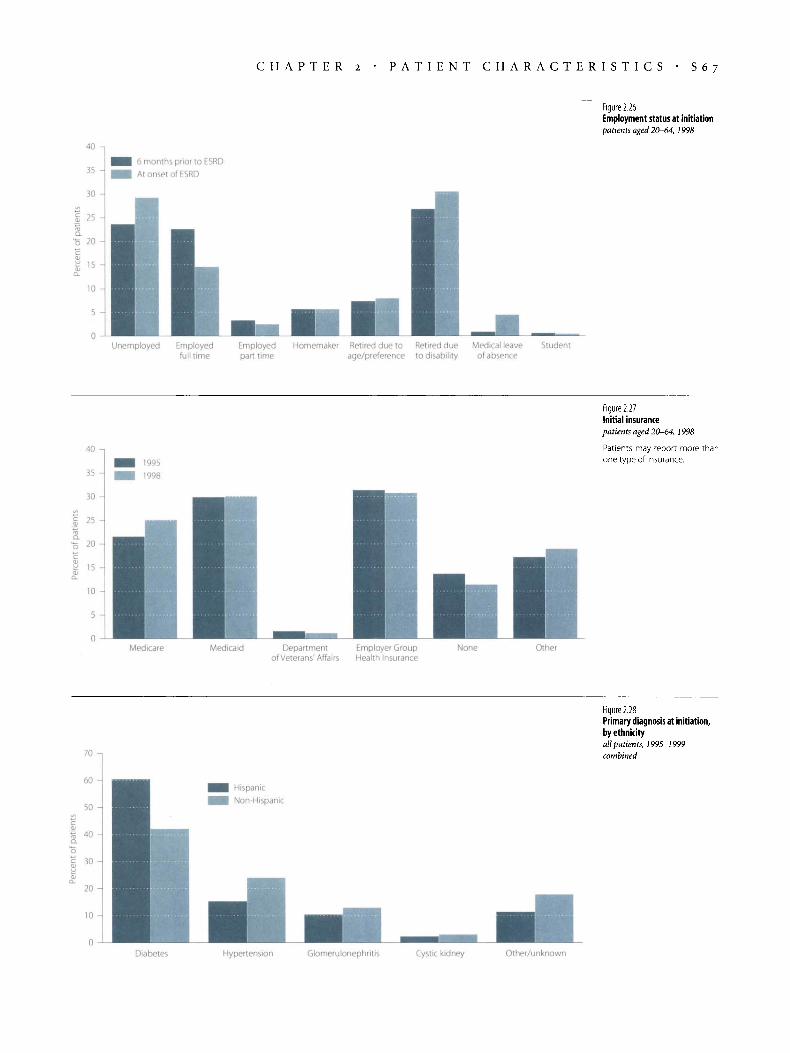
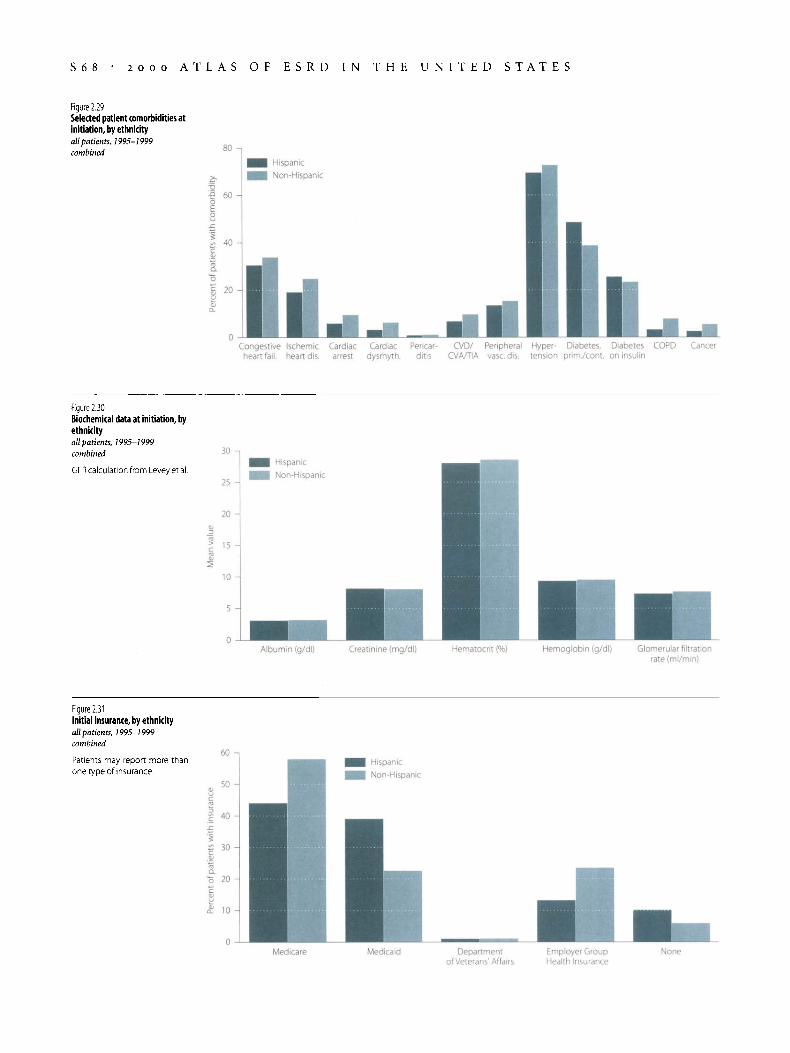
Hispanics have a higher rate of diabetes at initiation (60%) compared to non-Hispanics (42%), who tend to have slightly higher rates of other comorbidities. Biochemical data is similar for both groups; insurance coverage, however, is noticeably different. Hispanics are 15% less likely to have Medicare coverage, and almost twice as likely to be covered by state Medicaid programs. These differences suggest that Hispanic patients could be subject to more variability in state Medicaid coverage, which may influence their access to medical services required for ESRD patients, (figs 2.28-31).
♦ Graphs showing the distribution of patients by race.comorbid-ity.number of comorbid conditions.employment.and insurance
♦ Maps of patient distribution by primary diagnosis.comorbidity, and cardiac comorbidity
♦ Graphs of the distribution of patients with ISHDand Ml by age group, diabetic status, and race
♦ Graphs and maps of EPO use prior to initiation, and hematocrit, creatinine clearance.GFR.BMI,weight,serum albumin,and BUN at initiation

C H A P T E R 2 · P A T I E N T C H A R A C T E R I S T I C S · S 5 7
Figure 2.1
Age, gender, & diabetic status of new ESRD patients
The percent change from the baseline value in 1995 (age 60.2, percent male 52.4, percent diabetic 42.5) is shown underneath the lines.
Mean age Percent male Percent diabetic
Figure 2.2 New ESRD patients by race hemodialyis patients
The percent change from the baseline value in 1995 (white 62.7%, black 33%,Native American 1.9%,Asian 2.5%) is shown underneath the lines.
White Black Native American Asian
60
Figure 2.3 New ESRD patients by race peritoneal dialysis patients
The percent change from the baseline value in 1995 (white 73.2%, black 22.4%,Native American 1.6%,Asian 2.9%) is shown underneath the lines.
■* 4 0 -
1995 1996 1997
20 ■
3.9% -12%
White Black Native American Asian

S 5 8 · 2 0 0 0 A T L A S O F E S R D I N T H E U N I T E D S T A T E S
Figure 2.4 Percent of new patients with diabetes 1998, byHSA, unadjusted
Figure 2.5 Percent of new patients with glomerulonephritis 1998, byHSA, unadjusted
Figure 2.6 Percent of new patients with interstitial disease, nephritis, or pyelonephritis 1998, byHSA, unadjusted
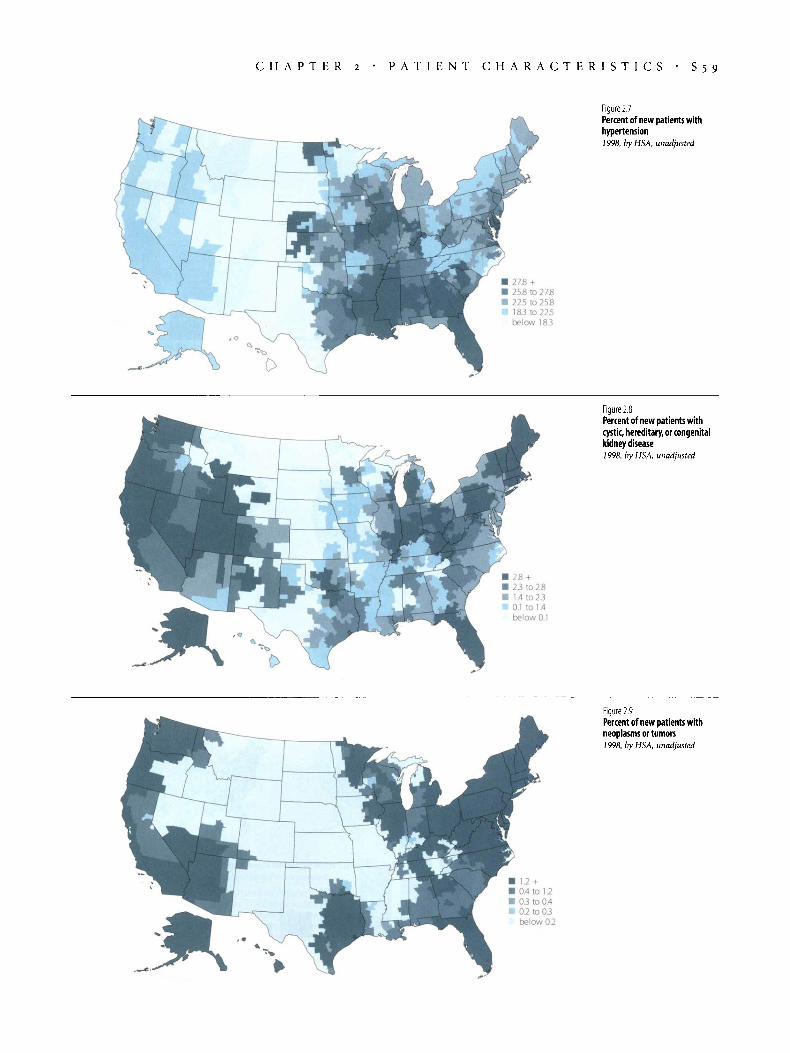
C H A P T E R 2 · P A T I E N T C H A R A C T E R I S T I C S · S 5 9
/
\i'
Figure 2.7 Percent of new patients with hypertension 1998, by HS A, unadjusted
■ 27.8 + ■ 25.8 to 275 ■ 22.5 to 25.8
8.3 to 225 below 183
Figure 2.8 Percent of new patients with cystic, hereditary, or congenital kidney disease 1998,byHSA, unadjusted
Figure 2.9 Percent of new patients with neoplasms or tumors 1998, byHSA, unadjusted

S 6 o · 2 0 0 0 A T L A S O F E S R D I N T H E U N I T E D S T A T E S
Figure 2.10 Patient comorbidity at initiation
Congestive Ischemic Myocardial Cardiac Cardiac Pericar-heartfailure heartdis. infarction arrest dysrhythmia ditis
CVD/ Peripheral History of Diabetes, CVA/TIA vase dis. hypertension prim./cont.
70 -
.9d 50
S 30
1995 1998
Diabetes COPD Current Cancer smoker
Alcohol Drug depend. depend.
AIDS HIV positive Inabiiityto Inabiiityto status ambulate transfer
Figure 2.11 Patient distribution at initiation by number of comorbid conditions
30 -, ■ ■ 1995
I" lie .III.. - Haa HI IB H H IIBIlia-2 3 4 5 6 7
Number of comorbid conditions
9 10

C H A P T E R 2 · P A T I E N T C H A R A C T E R I S T I C S · S 6 1
Congestive heart failure *lschemic heart disease Myocardial infarction
Cardiac arrest Cardiac dysrhythmia Pericarditis
'Cerebrovascular disease, CVA, TIA 'Peripheral vascular disease History of hypertension
Diabetes (primary or contributing) Diabetes, currently on insulin Chronic obstructive pulmonary disease
Malignant neoplasm, cancer Tobacco use (current smoker) Alcohol dependence
•Drug dependence »HIV positive status »AIDS
Figure 2.12 Comparative comorbidity ratio, HSA rates versus overall rate for the United States ESRD Population 1998, by comorbidity at initiation, by HSA, unadjusted & unsmoothed
"Ischemic heart disease includes prior coronary artery bypass (CABG),angioplasty,and diagnosis of coronary artery disease /coronary heart disease. Cerebrovascular disease includes history of stroke/cerebrovascular accident (CVA) and transient ischemic attack (TIA).Peripheral vascular disease includes absent foot pulses, prior typical claudication, amputations for vascular disease, gangrene,and aortic aneurysm. Drug dependence means a dependence on illicit drugs. Patients with HIV may not all be reported; the 2728 form includes a "can't disclose" box for both HIV and AIDS.
■ 125 + ■ 1.0 to 1.25 M 0.75 to 1.0 U 05 to 0.75
< 0 5
S 6 2 · 2 0 0 0 A T L A S O F E S R D I N T H E U N I T E D S T A T E S
Figure 2.13 Reported comorbidity at initiation, by modality 1998
Congestive Ischemic Myocardial heart failure heart dis. infarction
Cardiac Pericar-arrest ditis
CVD/ Peripheral Diabetes COPD Cancer CVA/TIA vase. dis. on insulin
Figure 2.14 History of ischemic heart disease & myocardial infarction at initiation, by diabetic status & age 1998
The percent of patients younger than 20 wi th ISHD or Ml is <0.25%.
Diabetics Non-Diabetics
H H Ischemic heart disease H $ ü Myocardial infarction
Male
c 40
30 -
20 -
Ages 20-44
Female
Ages 45-64
Male Female
Ages 65+
Male Female Male Female Male Female
Figure 2.15 History of ischemic heart disease & myocardial infarction at initiation, by race
White Black Native American Asian
Ischemic heart disease Myocardial infarction
Male Female Male Female Male Female Male Female

C H A P T E R 2 · P A T I E N T C H A R A C T E R I S T I C S · S 6 3
Congestive heart failure, 1995 Congestive heart failure, 1998 Figure 2.16 Cardiac comorbidity at initiation percent of patients, by HSA, unadjusted
6 to 5 to 6
below 5
Figure 2.17 Non-cardiac comorbidity at initiation 1998
White Black Native American Asian
o 50
CVD/ CVA/T1A
Cancer

S 6 4 · 2 0 0 0 A T L A S O F E S R D I N T H E U N I T E D S T A T E S
figure 2.18 Percent of patients using EPO prior to initiation 1998,byHSA
Figure 2.19 EPO use prior to initiation 1998
Age group Race
0-19 20-44 45-64 65+ White Black Nat.Am. Asian
Figure 2.20 Mean hematocrit (%) at initiation 1998, by HS A
■ 29.7 + ■ 293 to 29.7 ■ 29.0 to 29.3
285 to 29.0 below 28.5

C H A P T E R 2 ■ P A T I E N T C H A R A C T E R I S T I C S · S 6 5
Figure 2.21 Creatinine at initiation
Age group Gender
0-19 20-44 45-64 65+ Male Female
10
5 9 E
Primary diagnosis Race Modality
Ü Ü 1996 - ■ ■ 1997
■ ■ 1998 I I
hhUiull DM HTN GN Cys. Kid. White Black N. Am. Asian Hemodialysis Peritoneal dialysis
Average GFR (ml/min) Average BMI (weight(kg)/height(m)2) Average weight (kg) 85
75
Figure 2.22 Glomerularfiltration rate (GFR), body mass index (BMI),& weight at initiation
GFR calculation from Levey et al.
0-19 20-44 45-64 65+ 0-19 20-44 45-64 65+ 0-19 20-44 45-64 65+
S 6 6 · 2 0 0 0 A T L A S O F E S R D I N T H E U N I T E D S T A T E S
Figure 2.23 Percent of patients at initiation with serum albumin less than the test's lower limit 1998, byHSA, unadjusted
The lower limit of albumins measured by bromcresol purple is 3.2 gm/dl,and by bromcresol green is 3.5 gm/dl.
Figure 2.24 Percent of patients at initiation, with serum albumin less than test's lower limit
The lower limit of albumins measured by bromcresol purple is 3.2 gm/dl,and by bromcresol green is 3.5 gm/dl.
1995 was a transitional year for reporting of the albumin data and for inclusion of the lower limits of the test.
Gender Race Primary diagnosis
0-19 20-44 45-64 65+ Female White N. Am. Asian HTN Cys.Kid.
Figure 2.25 Mean blood urea nitrogen (BUN) at initiation
Age group Gender Race Primary diagnosis
0-19 20-44 45-64 65+ Female White Cys. Kid
C H A P T E R 2 · P A T I E N T C H A R A C T E R I S T I C S · S 6 7
Figure 2.26 Employment status at initiation pahents aged 20-64,1998
Unemployed Employed full time
Employed Homemaker Retired due to Retired due Medical leave Student part time age/preference to disability of absence
y 15
Medicare Medicaid Department of Veterans' Affairs
Employer Group Health Insurance
None Other
Figure 2.27 Initial insurance patients aged 20-64, 1998
Patients may report more than one type of insurance.
70 -|
Figure 2.28 Primary diagnosis at initiation, by ethnicity allpatients, 1995-1999 combined
60 ■
50 ■
Hispanic Non-Hispanic
S 40 -
30 ■
20
10 ■
Diabetes Hypertension Glomerulonephritis Cystic kidney Other/unknown
S 6 8 · 2 0 0 0 A T L A S O F E S R D I N T H E U N I T E D S T A T E S
Figure 2.29 Selected patient «morbidities at initiation, by ethnicity allpatients, 1995-1999 combined
Congestive Ischemic Cardiac Cardiac Pericar- CVD/ Peripheral Hyper- Diabetes, Diabetes COPD Cancer heart fail, heart dis. arrest dysrhyth. ditis CVA/TIA vase. dis. tension prim./cont. on insulin
Figure 2.30 Biochemical data at initiation, by ethnicity allpatients, 1995-1999 combined
GFR calculation from Levey et al.
Albumin (g/dl) Creatinine (mg/dl) Hematocrit (%) Hemoglobin (g/dl) Glomerular filtration rate (ml/min)
Figure 2.31 Initial insurance, by ethnicity allpatients, 1995-1999 combined
Patients may report more than one type of insurance.
Hispanic Non-Hispanic
Medicare Medicaid Department ofVeterans'Affairs
Employer Group Health Insurance