pathways to a healthy decatur
TRANSCRIPT

Pathways to a Healthy Decatur 0 Community Transportation Plan
City of Decatur Community Transportation Plan
Pathways to a Healthy Decatur: A Rapid Health Impact Assessment of the City of Decatur Community Transportation Plan
Prepared by the Center for Quality Growth and Regional Development Georgia Institute of Technology : College of Architecture 760 Spring Street, Suite 213, Atlanta, GA 30308 P 404.385.5144 : F 404.385.5127 : E [email protected] : W www.cqgrd.gatech.edu
In partnership with Sycamore Consulting, Inc. and Kimley-Horn and Associates, Inc.

Pathways to a Healthy Decatur 1 Community Transportation Plan
Table of Contents
Executive Summary 2
Rationale for the Study 4 What is the Decatur Community Transportation Plan?
Health Impact Assessment (HIA) 5 What is an HIA? Defining Health: The Evolution of Health Thinking Defining Health in Decatur
Profile of Decatur 6 Demographics Health Statistics
Literature Review: Health and the Built Environment 18 Health and the Neighborhood Physical Activity Universal Design Active Living Access and Affordability Environmental Threats Social Capital
HIA Workshop 30 Workshop Format Results of the Workshop
Health Impacts of Community Transportation Plan Interventions 35 Bicycle Recommendations Pedestrian Recommendations Intersection Improvements Safety Concepts
Next Steps 53 Findings Recommendations
Appendices 58 Appendix 1: Workshop Agenda Appendix 2: Workshop Participants Appendix 3: Safety Concepts Appendix 4: Establishing Baselines and Setting Targets Appendix 5: References

Pathways to a Healthy Decatur 2 Community Transportation Plan
Executive Summary
he impetus of the Decatur Community Transportation Plan is the goal of creating an Active Living Community—a place where residents and visitors can readily participate in everyday physical activity, regardless of physical limitations. From a transportation
perspective, such activity can be as simple as a short walk from your car to the store around the corner or it may mean traveling by bicycle to and from work or school. The ability to be active in a city is largely determined by transportation facilities and operations, as well as land use patterns. A city where attractive destinations are in proximity to each other and to residential areas makes active travel appealing. When these conditions are combined with a transportation system designed for multiple modes of travel, walking, biking, and using public transportation become efficient and desirable means of getting around. In turn, these more active forms of travel have the obvious result of increasing levels of physical activity, which reduces the risk of heart disease, high blood pressure, diabetes, obesity, and some cancers. The Community Transportation Plan’s goal is to set a course for a transportation/land use connection to make Decatur a healthy place to live and work; maintain a high quality of life in Decatur; and increase opportunities to use alternative modes of transportation. To evaluate the Plan’s goals from a health perspective, the City of Decatur asked Georgia Tech’s Center for Quality Growth and Regional Development to conduct a Health Impact Assessment (HIA) of the Plan. An HIA is a process that identifies and measures potential health impacts, both positive and negative, that may result from a particular policy or project. The HIA begins with the broad definition of “health” from the World Health Organization: “a state of complete physical, social and mental well-being, and not merely the absence of disease or infirmity.” It is further grounded in the Decatur community’s vision of health, which is a compilation of definitions from numerous stakeholders:
Health is a holistic sense of spiritual, mental, and physical well-being and the absence of illness and disease.
The Decatur HIA focuses on health impacts related to safety, social connections and physical activity as they are affected by the transportation and land use environment. This HIA began by investigating the concerns of Decatur residents, businesses, and institutions, then used findings from more than 100 research articles and books and insights from local, regional and national experts in planning and health to identify potential health impacts and recommend strategies to increase the number of positive health outcomes and remove or mitigate negative health outcomes.
T
Pathways to a Healthy Decatur 3 Community Transportation Plan
Findings and Recommendations The HIA found that the elements of the Community Transportation Plan, including intersection and corridor improvements, bike and pedestrian facilities, and transportation and land use connections, will have largely positive impacts on public health by increasing opportunities for physical activity, improving safety, and providing better access to health promoting goods and services. The Community Transportation Plan may ultimately lead to a slight reduction in car use by Decatur residents and visitors, and thus to a reduction in the negative health impacts of car use (reduced air quality from emissions, risk of accidents). But the more immediate results should be increased walking and bicycling, especially in the downtown area. Thus we would expect to see positive health impacts in the form of increased levels of physical activity and enhanced social capital, as Decatur residents and visitors have more opportunities to interact while walking, bicycling or spending time in public spaces. The HIA also resulted in the identification of some potential negative health impacts related to pedestrian and bicycle safety. Many of these negative health impacts can be eliminated or mitigated by incorporating the findings and results of the HIA during the design phase of the corridor and intersection improvements. Furthermore, to ensure that the health benefits derived from the Plan are shared with all members of the community, the City of Decatur should prioritize the consideration of the needs of groups that have limitations on their mobility due to physical and financial constraints, including children, older adults, people with disabilities, and low-income households.
Following are key recommendations to promote positive health outcomes from the Community Transportation Plan.
Make traffic safety a priority.
Prioritize connectivity.
Design intersections to be ADA-compliant and easily crossable.
Emphasize the mobility of Decatur’s most vulnerable populations.
Continue to partner with schools to promote childhood physical activity.
Plan for alternate modes of transportation that accommodate commuters and recreational users.
Develop a community-wide campaign to promote physical activity.
Make the Community Transportation Plan just one part of planning efforts towards a healthy Decatur.
Decatur is well on its way to becoming an Active Living Community, but a holistic and coordinated approach will be needed to reach its goal. Transportation planning must be combined with land use decisions, school policies, parks and recreation programs, economic development initiatives, and housing policies to make Decatur a healthy place as it continues to grow and evolve.

Pathways to a Healthy Decatur 4 Community Transportation Plan
Rationale for the Study The purpose of the Health Impact Assessment (HIA) of the Community Transportation Plan is to:
• Ensure the explicit consideration of the human health impacts of the proposed projects and policies, so that health costs would not be unevenly distributed among the population and all health promoting impacts would be considered.
• Provide guidance to improving and maintaining the health of Decatur residents and visitors, thus reducing the burden on the health sector.
• Inform Decatur residents, concerned community members, and decision-makers about health outcomes, so that these outcomes are considered in broad-based policy decisions that require strategic thinking.
The findings of the HIA will allow the City of Decatur to make more educated estimates and to identify the potential health outcomes of transportation projects and policies. What is the Decatur Community Transportation Plan? In 2005 the City of Decatur began to prepare a Community Transportation Plan based on the principles of an Active Living Community. The goal was to create a transportation plan that would identify the infrastructure, policies, and programs necessary to ensure efficient and effective transportation options for residents of and visitors to Decatur. The resulting plan aims to create a safe and efficient multimodal system that promotes the health and mobility of Decatur citizens and visitors. The Community Transportation Plan has been shaped by the attempts to find the answers to three questions about the future of transportation in Decatur:
1. How can Decatur become and stay a healthy place to live and work? How do we build an environment that supports Active Living?
2. How does Decatur maintain a high quality of life for residents in its neighborhoods,
while accommodating growth downtown?
3. How does Decatur increase opportunities for people to travel to, from, and around the city using alternative methods of transportation?
The Decatur Community Transportation Plan encompasses three general themes: safety; accessibility and mobility; and health and active living. These themes reflect the nature of the city as a small community that promotes walking and cycling even as it accommodates traditional traffic, both within the city and along regional arterials.

Pathways to a Healthy Decatur 5 Community Transportation Plan
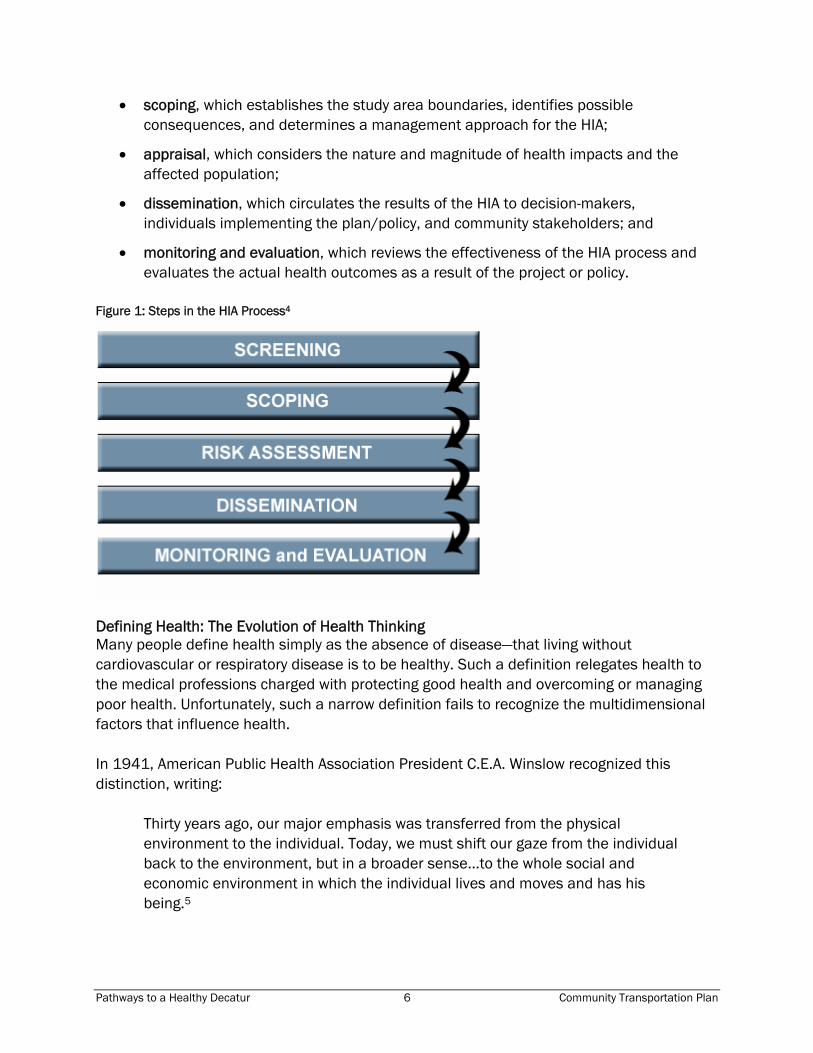
Health Impact Assessment (HIA) What is an HIA? A Health Impact Assessment, or HIA, is a process that uses a variety of methods and approaches to identify and measure potential health impacts, both positive and negative, that may result from a particular policy or project. Furthermore, an HIA seeks to link these impacts to a given segment of the population (for example, children, older adults, people living in poverty, or residents of a particular neighborhood). While causal links between chronic health conditions and the built environment are still evolving, there is evidence that a relationship exists. Therefore, a need exists for tools and methodology to understand how changes in the built environment might affect public health. One such tool is a Health Impact Assessment, or HIA. Widely used in other countries and recently rising in use in the US, an HIA is often defined as “a combination of procedures, methods, and tools by which a policy, program, or project may be judged as to its potential effects on the health of a population, and the distribution of those effects within the population.”1 Four values are integral to the HIA: democracy, equity, sustainable development, and the ethical use of evidence that emphasizes a rigorous structured analysis based on different scientific disciplines and methodologies.2 HIAs explicitly consider social and environmental justice issues, adopt a multidisciplinary and participatory process, and use both qualitative and quantitative evidence as well as transparency in the process. The HIA methodology is based on the social model of health accepted by various national and international agencies. There are three main types of HIAs. Prospective HIAs are conducted before a policy or project is implemented; retrospective HIAs take place after; and concurrent HIAs are simultaneous and are more common for projects or policies that are implemented over an extended period of time. There is also a differentiation in HIAs based on the amount of time and effort they require, leading to distinctions between rapid, intermediate, and comprehensive assessments.3 The final product of an HIA is a set of evidence-based recommendations intended to inform decision-makers and the general public about the health-related issues associated with the project. The recommendations provide practical solutions that seek to magnify positive health impacts, and remove or minimize negative impacts. While there are several different methodologies for conducting an HIA, they all share several critical steps which are illustrated in Figure 1, below. The steps include:
• screening, which determines whether or not there exists the potential for significant and unknown health impacts as the result of a policy, program, or project;
Pathways to a Healthy Decatur 6 Community Transportation Plan
• scoping, which establishes the study area boundaries, identifies possible consequences, and determines a management approach for the HIA;
• appraisal, which considers the nature and magnitude of health impacts and the affected population;
• dissemination, which circulates the results of the HIA to decision-makers, individuals implementing the plan/policy, and community stakeholders; and
• monitoring and evaluation, which reviews the effectiveness of the HIA process and evaluates the actual health outcomes as a result of the project or policy.
Figure 1: Steps in the HIA Process4
Defining Health: The Evolution of Health Thinking Many people define health simply as the absence of disease—that living without cardiovascular or respiratory disease is to be healthy. Such a definition relegates health to the medical professions charged with protecting good health and overcoming or managing poor health. Unfortunately, such a narrow definition fails to recognize the multidimensional factors that influence health. In 1941, American Public Health Association President C.E.A. Winslow recognized this distinction, writing:
Thirty years ago, our major emphasis was transferred from the physical environment to the individual. Today, we must shift our gaze from the individual back to the environment, but in a broader sense...to the whole social and economic environment in which the individual lives and moves and has his being.5

Pathways to a Healthy Decatur 7 Community Transportation Plan
This broader context of health was repeated in the 1948 World Health Organization Constitution (WHO), which defines health as “a state of complete physical, social and mental well-being, and not merely the absence of disease or infirmity.” This definition was further expanded in the 1986 Ottawa Charter for Health Promotion to include the ability of an individual or group “to identify and to realize aspirations, to satisfy needs, and to change or cope with the environment.” Although these definitions of health have been criticized as “utopian”6, they are important in their recognition that numerous factors influence the ability to be healthy (see Figure 2, below). Known as health determinants, these factors include biological, social and economic, environmental, lifestyle, services, and policy.7 Science has shown that the most significant determinants of health are very personal, based on genes, sex, and age (the biological factors) and behavior, like diet, activity levels, sexual behavior, and the consumption of drugs and alcohol. Yet many external factors—the environment where we live, work, and go to school, and those social and economic factors, policies, and services shaping the environment—affect the second half of the definition of health, the ability “to identify and to realize aspirations, to satisfy needs, and to change or cope with the environment.” Figure 2: Influences on Health8
Pathways to a Healthy Decatur 8 Community Transportation Plan
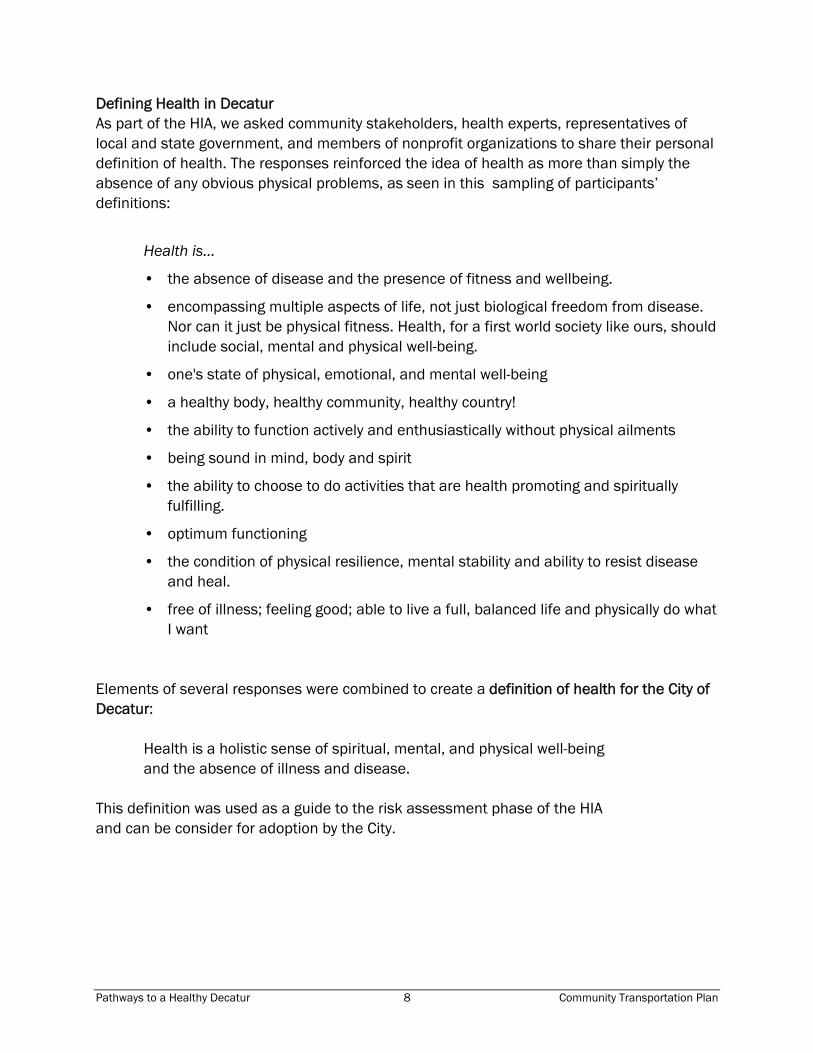
Defining Health in Decatur As part of the HIA, we asked community stakeholders, health experts, representatives of local and state government, and members of nonprofit organizations to share their personal definition of health. The responses reinforced the idea of health as more than simply the absence of any obvious physical problems, as seen in this sampling of participants’ definitions:
Health is…
• the absence of disease and the presence of fitness and wellbeing.
• encompassing multiple aspects of life, not just biological freedom from disease. Nor can it just be physical fitness. Health, for a first world society like ours, should include social, mental and physical well-being.
• one's state of physical, emotional, and mental well-being
• a healthy body, healthy community, healthy country!
• the ability to function actively and enthusiastically without physical ailments
• being sound in mind, body and spirit
• the ability to choose to do activities that are health promoting and spiritually fulfilling.
• optimum functioning
• the condition of physical resilience, mental stability and ability to resist disease and heal.
• free of illness; feeling good; able to live a full, balanced life and physically do what I want
Elements of several responses were combined to create a definition of health for the City of Decatur:
Health is a holistic sense of spiritual, mental, and physical well-being and the absence of illness and disease.
This definition was used as a guide to the risk assessment phase of the HIA and can be consider for adoption by the City.
Pathways to a Healthy Decatur 9 Community Transportation Plan
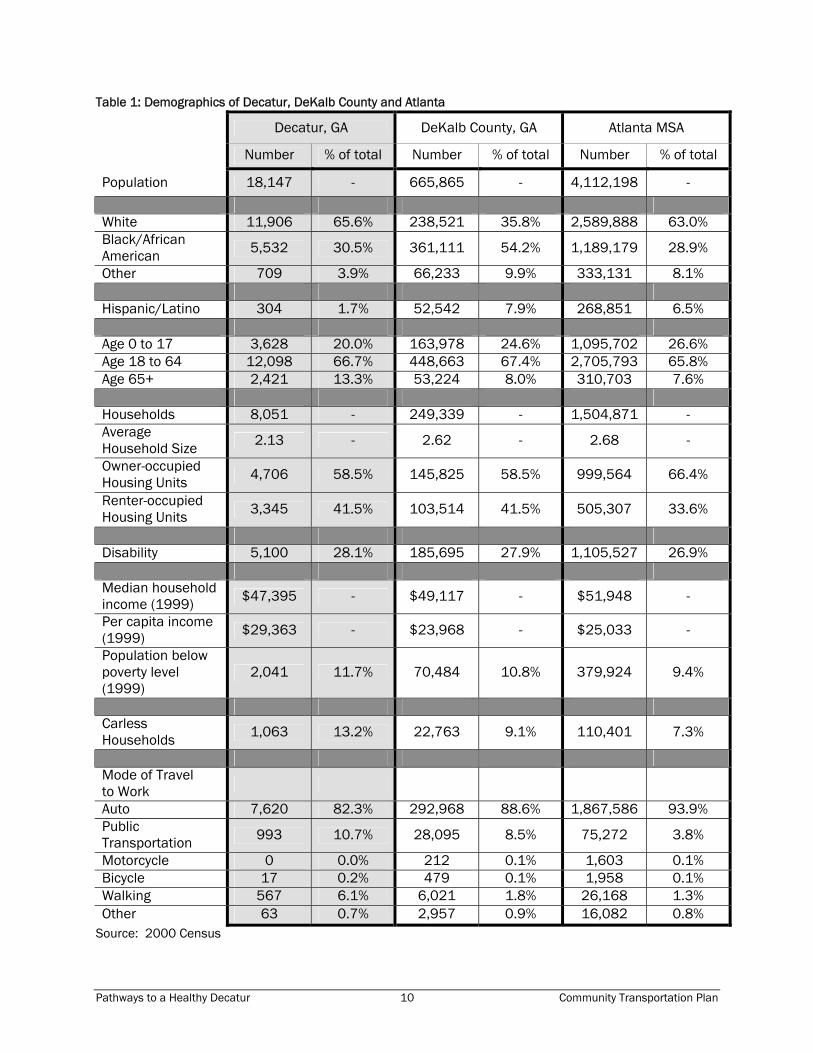
Profile of Decatur The city of Decatur, Georgia, founded in 1823, is the second-oldest metropolis in the state. Named after Stephen Decatur, a naval hero prominent during the War of 1812, the city sits six miles east of downtown Atlanta. Decatur covers a total land area of 4.2 square miles and is the county seat of DeKalb County. There are a total of 955 businesses employing 9,820 employees within a one-mile radius of Decatur’s downtown. Of those, more than half work in the service sector, another 2,000 work in government jobs and 1,100 in retail trade.1 In contrast to Atlanta’s fabled sprawl, Decatur prides itself on being a relatively compact city with a thriving downtown. The central point of the city is Decatur Square, which features the city courthouse and City Hall. Decatur Square is also the site of several annual city-sponsored festivals, including Fourth of July celebrations, the Decatur Arts Festival, and the Great Decatur Beer Tasting Festival. In addition, Metropolitan Atlanta Rapid Transit Authority (MARTA) has a heavy-rail stop just off Decatur Square, allowing Decatur residents to commute by train into downtown Atlanta. This emphasis on compact design has allowed Decatur to emphasize accessibility and alternatives to automotive travel to a degree not possible for newer suburban developments. Demographics The 2000 census put Decatur’s population at 18,147; the Atlanta Regional Commission’s 2006 population estimate is 18,127. Table 1, below, compares Decatur’s demographics to that of DeKalb County as a whole and to the Atlanta Metropolitan Statistical Area (MSA). Decatur’s population is slightly older than that of the MSA, with more than twice as high a percentage of the population age 65 and older. Decatur also has a slightly lower percentage of owner-occupied housing units (58.5% as opposed to 66.4%); a slightly higher percentage of people living under the poverty level, and much larger percentages of people who commute primarily via walking or public transportation.
1 From “Decatur Downtown Development Authority Demographic Information,” retrieved from http://decaturga.com/cgs_citysvcs_ced_demographics.aspx, on May 17, 2007.
Pathways to a Healthy Decatur 10 Community Transportation Plan
Table 1: Demographics of Decatur, DeKalb County and Atlanta
Decatur, GA DeKalb County, GA Atlanta MSA
Number % of total Number % of total Number % of total
Population 18,147 - 665,865 - 4,112,198 -
White 11,906 65.6% 238,521 35.8% 2,589,888 63.0% Black/African American 5,532 30.5% 361,111 54.2% 1,189,179 28.9%
Other 709 3.9% 66,233 9.9% 333,131 8.1% Hispanic/Latino 304 1.7% 52,542 7.9% 268,851 6.5% Age 0 to 17 3,628 20.0% 163,978 24.6% 1,095,702 26.6% Age 18 to 64 12,098 66.7% 448,663 67.4% 2,705,793 65.8% Age 65+ 2,421 13.3% 53,224 8.0% 310,703 7.6% Households 8,051 - 249,339 - 1,504,871 - Average Household Size 2.13 - 2.62 - 2.68 -
Owner-occupied Housing Units 4,706 58.5% 145,825 58.5% 999,564 66.4%
Renter-occupied Housing Units 3,345 41.5% 103,514 41.5% 505,307 33.6%
Disability 5,100 28.1% 185,695 27.9% 1,105,527 26.9% Median household income (1999) $47,395 - $49,117 - $51,948 -
Per capita income (1999) $29,363 - $23,968 - $25,033 -
Population below poverty level (1999)
2,041 11.7% 70,484 10.8% 379,924 9.4%
Carless Households 1,063 13.2% 22,763 9.1% 110,401 7.3%
Mode of Travel to Work
Auto 7,620 82.3% 292,968 88.6% 1,867,586 93.9% Public Transportation 993 10.7% 28,095 8.5% 75,272 3.8%
Motorcycle 0 0.0% 212 0.1% 1,603 0.1% Bicycle 17 0.2% 479 0.1% 1,958 0.1% Walking 567 6.1% 6,021 1.8% 26,168 1.3% Other 63 0.7% 2,957 0.9% 16,082 0.8%
Source: 2000 Census
Pathways to a Healthy Decatur 11 Community Transportation Plan
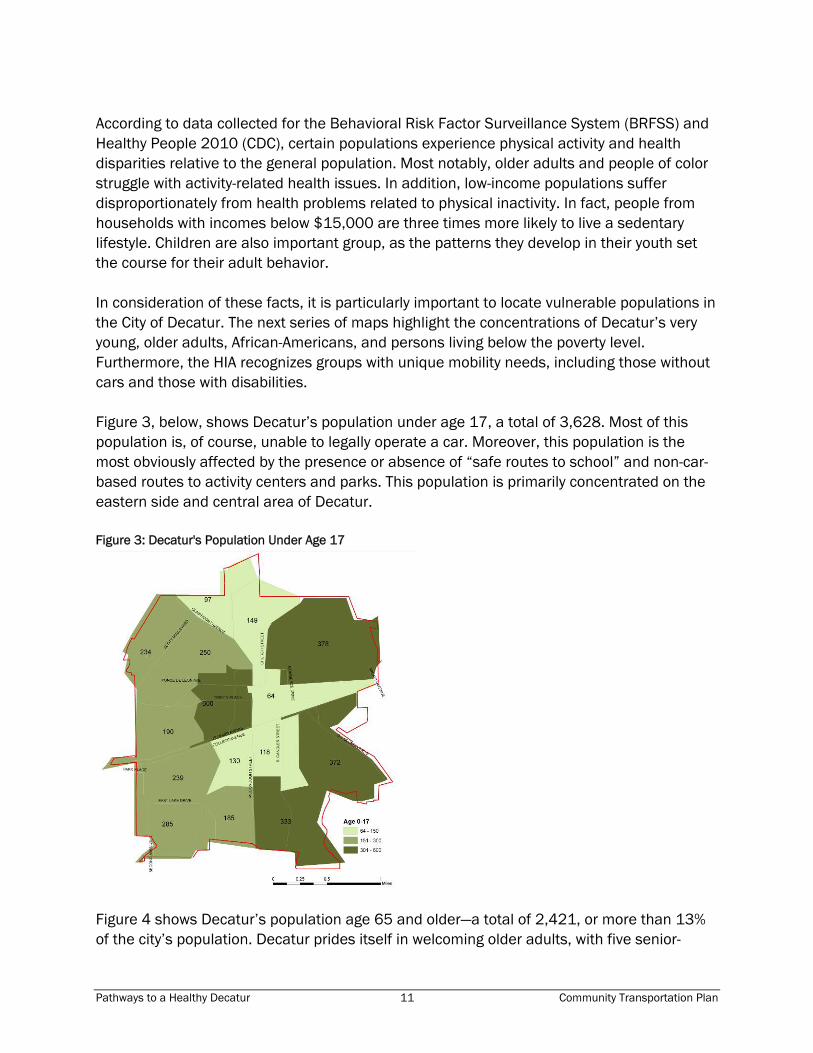
According to data collected for the Behavioral Risk Factor Surveillance System (BRFSS) and Healthy People 2010 (CDC), certain populations experience physical activity and health disparities relative to the general population. Most notably, older adults and people of color struggle with activity-related health issues. In addition, low-income populations suffer disproportionately from health problems related to physical inactivity. In fact, people from households with incomes below $15,000 are three times more likely to live a sedentary lifestyle. Children are also important group, as the patterns they develop in their youth set the course for their adult behavior. In consideration of these facts, it is particularly important to locate vulnerable populations in the City of Decatur. The next series of maps highlight the concentrations of Decatur’s very young, older adults, African-Americans, and persons living below the poverty level. Furthermore, the HIA recognizes groups with unique mobility needs, including those without cars and those with disabilities. Figure 3, below, shows Decatur’s population under age 17, a total of 3,628. Most of this population is, of course, unable to legally operate a car. Moreover, this population is the most obviously affected by the presence or absence of “safe routes to school” and non-car-based routes to activity centers and parks. This population is primarily concentrated on the eastern side and central area of Decatur. Figure 3: Decatur's Population Under Age 17
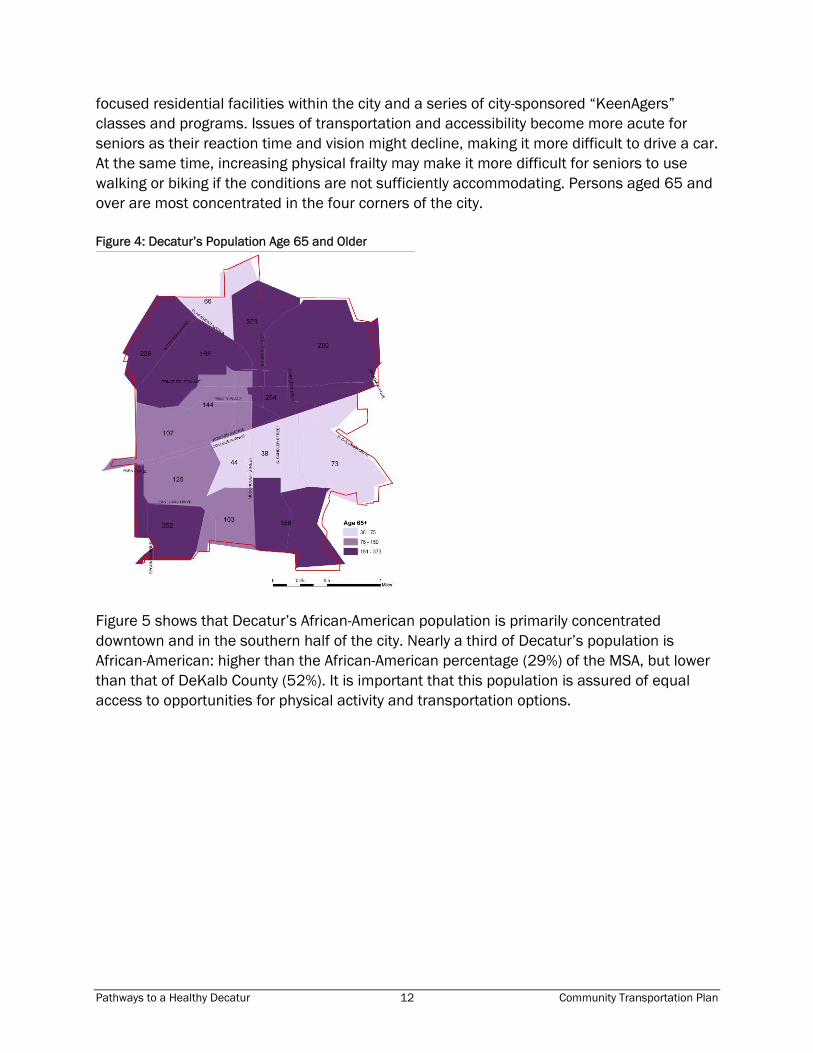
Figure 4 shows Decatur’s population age 65 and older—a total of 2,421, or more than 13% of the city’s population. Decatur prides itself in welcoming older adults, with five senior-
Pathways to a Healthy Decatur 12 Community Transportation Plan
focused residential facilities within the city and a series of city-sponsored “KeenAgers” classes and programs. Issues of transportation and accessibility become more acute for seniors as their reaction time and vision might decline, making it more difficult to drive a car. At the same time, increasing physical frailty may make it more difficult for seniors to use walking or biking if the conditions are not sufficiently accommodating. Persons aged 65 and over are most concentrated in the four corners of the city. Figure 4: Decatur’s Population Age 65 and Older
Figure 5 shows that Decatur’s African-American population is primarily concentrated downtown and in the southern half of the city. Nearly a third of Decatur’s population is African-American: higher than the African-American percentage (29%) of the MSA, but lower than that of DeKalb County (52%). It is important that this population is assured of equal access to opportunities for physical activity and transportation options.

Pathways to a Healthy Decatur 13 Community Transportation Plan
Figure 5: Decatur's African-American Population
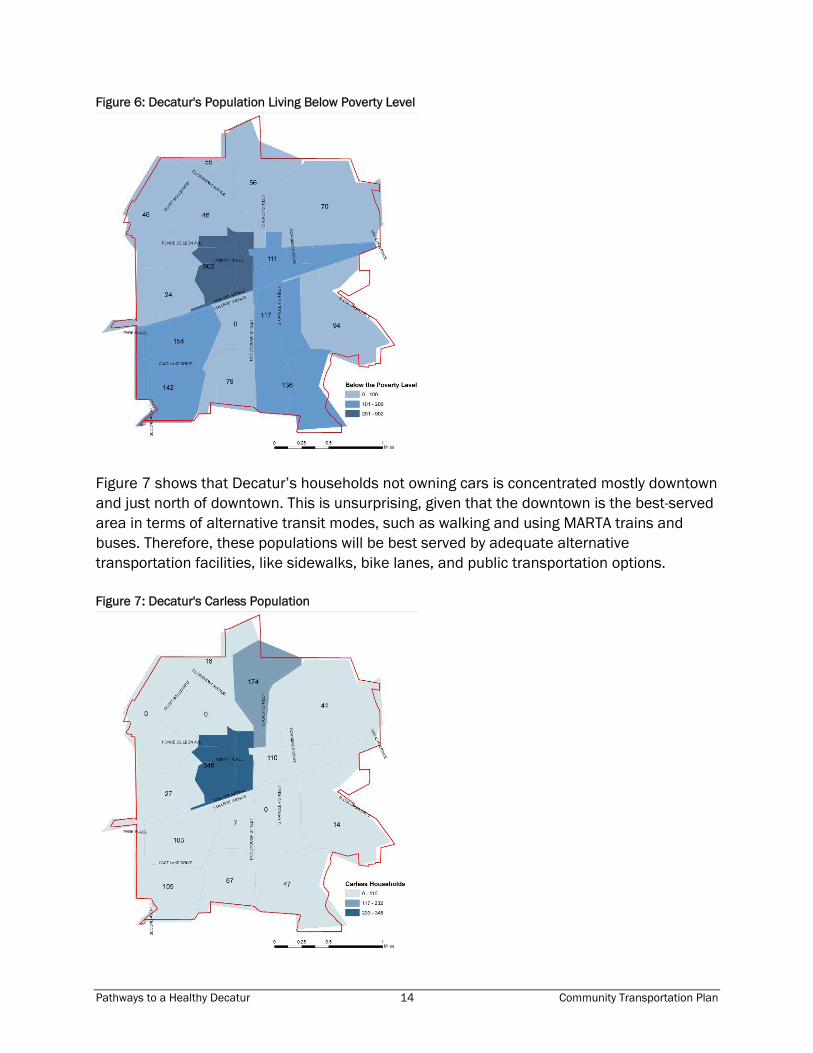
Figure 6 shows the concentrations of Decatur’s population living below the federally defined poverty level. The greatest concentration is downtown, with slightly smaller concentrations in the southwest and southeast. Residents living below the poverty level are less likely to participate in the recommended amount of physical activity. This population group may also have limited financial resources for transportation and may be dependent on public transit or walking to get to and from work, school, and errands.
Pathways to a Healthy Decatur 14 Community Transportation Plan
Figure 6: Decatur's Population Living Below Poverty Level
Figure 7 shows that Decatur’s households not owning cars is concentrated mostly downtown and just north of downtown. This is unsurprising, given that the downtown is the best-served area in terms of alternative transit modes, such as walking and using MARTA trains and buses. Therefore, these populations will be best served by adequate alternative transportation facilities, like sidewalks, bike lanes, and public transportation options. Figure 7: Decatur's Carless Population

Pathways to a Healthy Decatur 15 Community Transportation Plan
Finally, Figure 8 shows the concentration of Decatur’s population with physical or mental disabilities. As with the senior population, persons with mental or physical disabilities may not be able to operate a car safely, and thus may be more in need of alternative modes of transportation. Furthermore, according to the BRFSS people with disabilities are less likely to engage in physical activity. The population with disabilities is concentrated mainly in the northeast, the southwest, and downtown. Figure 8: Decatur's Population with Disabilities
As these maps suggest, Decatur’s more vulnerable populations are not concentrated in one particular area. This makes the need for a comprehensive, city-wide transportation plan all the more acute, but may also call for the prioritization of transportation facilities to serve a specific population’s needs. Health Statistics This profile includes vital statistics. Although such data are not available at the City scale, they are available for DeKalb County. Table 3 summarizes the 2004 mortality rates by causes of death that may be associated with physical inactivity, motor vehicle accidents, and illness that may be exacerbated by vehicle emissions. The mortality rate tells the number of deaths per 100,000 population.

Pathways to a Healthy Decatur 16 Community Transportation Plan
Table 2: Mortality Rates for DeKalb County and State of Georgia (number of deaths per 100,000) Disease Race/Ethnicity Georgia DeKalb, GA
All 161.9 132.7 White 179.7 177.3 Black 139.5 111.2 Other 31.7 40.1
Cancer
Hispanic or Latino 19.6 23.5
All 18.4 15.7 White 17.3 14.2 Black 22.6 17.5 Other 4.5 *
Diabetes
Hispanic or Latino 2.3 0
All 253.4 183.4 White 275.3 245.6 Black 233.6 151.9 Other 37.9 66.8
Cardiovascular
Hispanic or Latino 21.7 25.1
All 68.7 42.8 White 86.4 75.6 Black 37.5 24.1 Other 6.5 *
Respiratory
Hispanic or Latino 5.3 *
All 1.3 1.6 White 0.8 * Black 2.4 2.6 Other * 0
Asthma
Hispanic or Latino * 0
All 16.8 12.9 White 18.8 14.2 Black 13.5 12.4 Other 6.8 *
Motor Vehicle Accident
Hispanic or Latino 16 21.8 SOURCE; Georgia DHR, Division of Public Health, Office of Health Information & Policy. Copyright © 2003-2005 Version 2.0 Latest Release: February 2006 Georgia Department of Human Resources, Division of Public Health, Office of Health Information and Policy, all rights reserved (http://oasis.state.ga.us/oasis/qryMorbMort.aspx). Rates based on 1-4 events are not shown and indicated by an *.
Pathways to a Healthy Decatur 17 Community Transportation Plan
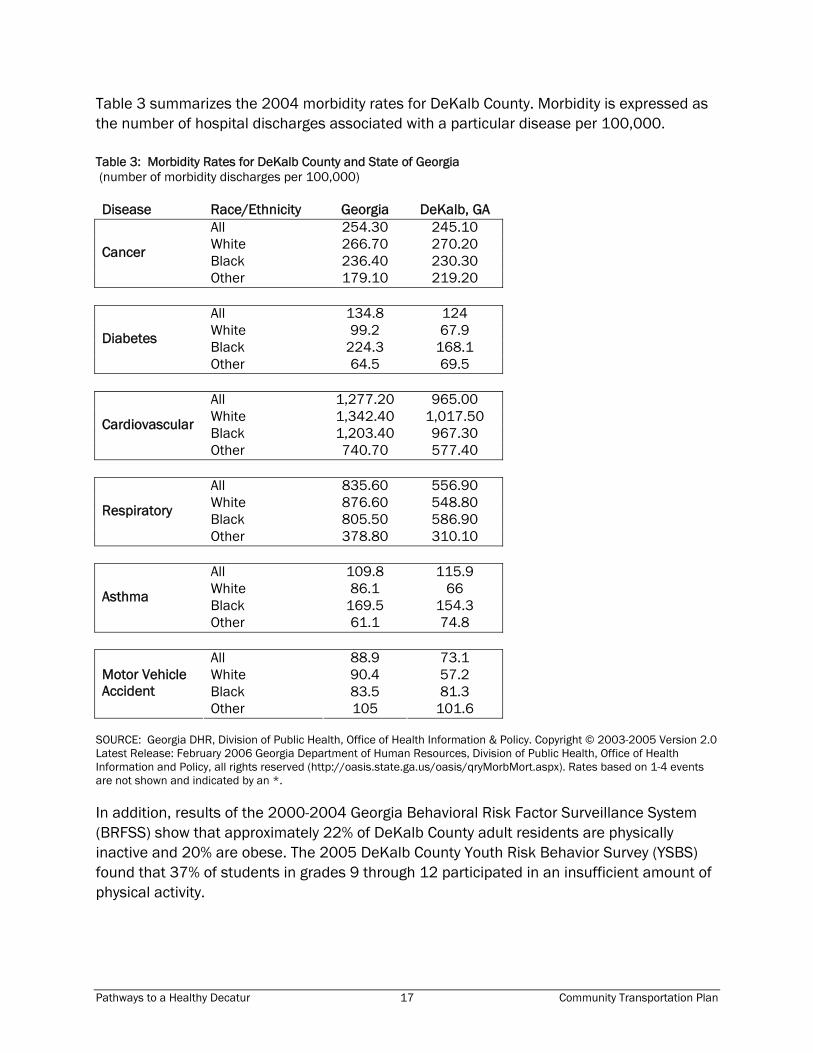
Table 3 summarizes the 2004 morbidity rates for DeKalb County. Morbidity is expressed as the number of hospital discharges associated with a particular disease per 100,000. Table 3: Morbidity Rates for DeKalb County and State of Georgia (number of morbidity discharges per 100,000) Disease Race/Ethnicity Georgia DeKalb, GA
All 254.30 245.10 White 266.70 270.20 Black 236.40 230.30
Cancer
Other 179.10 219.20
All 134.8 124 White 99.2 67.9 Black 224.3 168.1
Diabetes
Other 64.5 69.5
All 1,277.20 965.00 White 1,342.40 1,017.50 Black 1,203.40 967.30
Cardiovascular
Other 740.70 577.40
All 835.60 556.90 White 876.60 548.80 Black 805.50 586.90
Respiratory
Other 378.80 310.10
All 109.8 115.9 White 86.1 66 Black 169.5 154.3
Asthma
Other 61.1 74.8
All 88.9 73.1 White 90.4 57.2 Black 83.5 81.3
Motor Vehicle Accident
Other 105 101.6 SOURCE: Georgia DHR, Division of Public Health, Office of Health Information & Policy. Copyright © 2003-2005 Version 2.0 Latest Release: February 2006 Georgia Department of Human Resources, Division of Public Health, Office of Health Information and Policy, all rights reserved (http://oasis.state.ga.us/oasis/qryMorbMort.aspx). Rates based on 1-4 events are not shown and indicated by an *. In addition, results of the 2000-2004 Georgia Behavioral Risk Factor Surveillance System (BRFSS) show that approximately 22% of DeKalb County adult residents are physically inactive and 20% are obese. The 2005 DeKalb County Youth Risk Behavior Survey (YSBS) found that 37% of students in grades 9 through 12 participated in an insufficient amount of physical activity.

Pathways to a Healthy Decatur 18 Community Transportation Plan
Literature Review: The Built Environment and Health The potential influence of the built environment on health was first recognized in the 19th century when growing cities were characterized by crowded, poorly designed and maintained housing (often in the form of tenement housing); chaotic public space;, and deficient sanitary systems. These circumstances facilitated the spread of infectious disease. The sanitary reform movement was in response to this public health crisis. The first tenement law was enacted in 1867. It set minimum plumbing standards and required improved ventilation. However, it was not until the New York City Tenement House Act of 1901 that housing conditions saw significant improvement. This law prohibited construction of new tenements on 25-foot wide lots, required improved sanitary conditions and access to light, and mandated changes in pre-existing tenements. The 1916 Zoning Resolution of New York City continued the use of regulations to create healthier living conditions by establishing building height and setback controls to improve access to natural light and ventilation. Most importantly, the 1916 Resolution called for the separation of what were seen as incompatible land uses.9 The separation of industrial and commercial centers from housing was based on studies that showed that the noise, odor, dust, and traffic generated by businesses were not supportive of public health and safety.10 As evidence, in part, of the success of these interventions and improvements in technology, infectious disease was replaced by chronic disease as the leading cause of death in the United States in 2000.11 Chronic diseases, such as cardiovascular disease, asthma, and diabetes, are more closely associated with lifestyle or environmental factors as opposed to infection. Chronic disease accounts for 7 of every 10 deaths and affects the quality of life of 90 million Americans.12 Although chronic diseases are among the most common and costly health problems today, they are also among the most preventable. Adopting healthy behaviors such as eating nutritious foods, being physically active, and avoiding tobacco use can prevent or control the effects of these diseases. The statistics illustrate the importance of this issue. For example, physical inactivity and poor diet are responsible for an estimated 400,000 deaths annually from coronary heart disease, colon cancer, stroke and diabetes in the United States in 2000.13 In the United States, most people, both adults and children, do not achieve the recommended amounts of physical activity. As a result, approximately $24 billion a year in health care costs have been attributed to lack of physical activity.14 This change in health issues—from infectious disease to chronic disease—necessitates a more nuanced understanding of the relationship between health and the built environment. Instead of simply identifying concrete environmental exposures, we must also understand how built environments affect behavior. Of course, the built environment is not the only thing that affects behavior and lifestyle. Culture, socioeconomic status, and personal preference are important factors in shaping lifestyle choices. Furthermore, urban environments are extremely complex, making it difficult to identify the specific determinants of health in a quantitative fashion. Regardless, it is clear that environments that make everyday physical

Pathways to a Healthy Decatur 19 Community Transportation Plan
activity, and in particular active travel inconvenient or unsafe are contributing to an increasingly sedentary American population. In recent years research has suggested further linkages between the characteristics of the built environment and human health.15 16 17 18 19 20 This research has received national attention from both the public health and planning communities as well as from the popular media. It has associated the built environment with respiratory and cardiovascular health, fatal and non-fatal injuries, physical fitness, and mental health. While most research has not been able to show causality between elements of the built environment and chronic disease, it is evident that a relationship exists and is significant enough to warrant health consideration in projects and policy decisions.
Health and the Neighborhood Much of the research that links neighborhood environments with health focuses on four issues: physical activity, access and affordability, environmental exposure, and social networks. Physical activity studies explore how issues of land use can encourage or discourage physical activity. Access and affordability looks at the health consequences associated with the lack of or limited access to schools, transit, food, goods and services, recreational facilities, and public spaces. Environmental exposure deals with the health consequences of poor quality air, water, and soil, as well as noise. Finally, social capital explores the ways in which healthy neighborhoods facilitate the communication of information, provide social support, and transmit accepted behaviors. As Figure 9 illustrates, the characteristics of the neighborhood can influence an individual’s level of physical activity, lifestyle choices, social capital, and exposure to unhealthy environments. Ultimately, these intervening factors have numerous potential health impacts, such as compromised overall well being, heart disease, obesity, diabetes, some cancers, injury, and cardiovascular disease. This section provides an overview of findings from numerous studies that relate neighborhood characteristics to health. Figure 9: The neighborhood has potential health impacts
Pathways to a Healthy Decatur 20 Community Transportation Plan
Physical Activity The built environment can have an effect on the levels and frequency of physical activity. Regular physical activity, defined as 30 minutes of physical activity per day, is beneficial to people of all ages, having positive effects on health, longevity, and quality of life.21 It has been found to improve self-image, self-esteem, physical and mental wellness, and overall health. Negative health effects associated with low physical activity include heart disease, certain types of cancers, high blood pressure, stroke, osteoporosis, obesity, diabetes, and higher mortality rates.22 Physical activity occurs not only through traditional means of exercise, such as walking, running, biking, and swimming, but also through daily activities such as taking the stairs instead of the elevator or walking and biking to run errands or to get to work or school. The design of the physical environment can either facilitate or reduce the opportunities for physical activity. Greater land use mixes, population and employment density, street connectivity and continuity of the bike and pedestrian network, are all believed to contribute to positive health outcomes, as are the presence of recreational facilities and parks. Changes in street scale, design, and safety can also have impacts on the health of users.23 Some studies have found that higher density neighborhoods generally have higher rates of physical activity. 24 However, density alone does not determine rates of physical activity; demographic characteristics of households must also be taken into account.25 The evidence suggests that density leads to greater physical activity except in low-income neighborhoods, where other factors such as time, access, and fear of personal safety can result in decreased physical activity. This area of research is still evolving because of the complexity of the built environment and of behavior and lifestyle choices. In fact, some studies have placed socioeconomic factors over the built environment in the determination of physical activity levels.26 In addition, land use design—mix of land uses, density, and proximity—can significantly impact physical activity. Street design, architecture, the overall attractiveness of a community, and perceptions of crime and public safety, affect the willingness of people to physically interact with their surroundings. Street design can facilitate or hinder walking and bicycling. Streets laid out in a traditional grid system have proven to be more conducive to walking than streets designed with long blocks and less connectivity.27 Greater street connectivity and continuity encourage travel by foot.28 The presence of sidewalks, crosswalks, and bicycle lanes has a positive impact on increased physical activity.29 Building scale and the relation of architecture to the street can either encourage or discourage physical activity. Vacant or blank walls and architecture that fails to interact with the street can prove uninviting to pedestrians. The layout of cities and communities and their transportation infrastructure are important factors in determining whether people walk or drive as a means of transportation.30 31 For example, connectivity, density, and land use have all been found to influence the levels of

Pathways to a Healthy Decatur 21 Community Transportation Plan
pedestrian travel within cities even after individual variables were controlled for in the analyses.32 33 34 35 36 37 38 A survey of the literature indicates that taking transit is linked to physical activity. One study found that Americans who use transit average 19 minutes of daily walking going to and from transit. Thus increasing access to transit could significantly increase the opportunities to be physically active, as most transit trips incorporate walking to and/or from destinations. The study also found that 29% of people walking to and from transit achieve the recommended level of 30 minutes of daily physical activity. In addition, the results of the study indicated that rail users (more so than bus users), minorities, households earning less than $15,000 per year, and people in high-density urban areas were most likely to achieve recommended physical activity levels by walking to transit. These groups are also the most likely to suffer from obesity and overweight.39 Studies have shown that walking has positive effects on the accumulation of physical activity and therefore has positive effects on health. A 2006 study found that a 5% increase in walkability was associated with a 32.1% increase in time spent engaging in physically active travel, a 0.23 point reduction in BMI, and 6.5% fewer vehicle miles traveled in King County, Washington.40 Another study, conducted in 2003, found that people who live in walkable neighborhoods averaged an additional 30 minutes of walking for transportation each week and achieved more total physical activity.41 Crime or the perception of crime and personal safety are significant obstacles to physical activity. Safety is often cited as a reason for not walking, visiting parks and recreational centers, or allowing children to play outside or walk to school, all of which reduce opportunities for physical activity and increase the risk of health problems.42 Neighborhoods with declining or substandard housing stock, boarded-up houses, broken windows, vacant lots, litter, graffiti, and vandalism can affect health if people are afraid to engage in physical activity outdoors.43 Universal Design One approach to solving the problems posed by the built environment in terms of users’ health is that of Universal Design, which is defined as the design of “products and environments to be usable by all people, to the greatest extent possible, without the need for adaptation or specialized design”44. Universal Design is thus an architectural and urban design intervention that creates spaces to encourage and enable physical activity in people of all walks of life, ages, and ability levels. Seven principles of Universal Design advocate equitable use, flexibility in use, simple and intuitive use, perceptible information, tolerance for error, low physical effort, and size and space for approach and use.45

Pathways to a Healthy Decatur 22 Community Transportation Plan
Equitable use means that designs need to be useful and marketable to people with different levels of ability. The main goal is to provide one design to accommodate all users. It is crucial not to stigmatize individuals with specialized design that segregates or isolates them.
Flexibility in use recommends that products, buildings and environments should accommodate a wide range of individual preferences and abilities through various methods of use. Products and environments should be compatible with the user’s pace to accommodate the use by various ability levels.
Universal design also advocates for products and environments that enable Simple and Intuitive Use. This means that places should be simple enough to understand regardless of an individual’s experiences, knowledge, language skills, or concentration level.
Perceptible Information should be provided in diverse modes (e.g., auditory, visual, tactile) to match the skills of different users. For example, travelways should use varying texture and color for pavement of streets, sidewalks, and bike paths to provide navigational guidance to older adults and others with vision loss, as well as provide additional locational information for the general public.
Tolerance for Error requires designs that minimize hazards and accidents through warnings and the elimination, isolation, or shielding of hazardous elements. The design should seek to minimize unconscious actions for tasks requiring attention, and to encourage users to be aware of their environments.
According to the Low Physical Effort principle, products, buildings, and environments should be designed to be used efficiently and comfortably without the need of an extra operating force, awkward body position, unnecessary repetitive actions, or sustained physical effort. For example, the connectivity of neighborhoods through a web of streets and trails will decrease the time and effort spent reaching destinations compared to conventional community development with dead-end streets and cul-de-sacs.
The principle of Size and Space for Approach and Use states that a design should be an appropriate size for the intended use (i.e., sufficiently large or small) and provide enough space for approach and use by people with different body sizes, assistive devices, or personal assistants. Components should be reachable by all heights and can be operable by all hand and grip sizes.
Active Living Active living, meanwhile, can be described as a way of life that integrates physical activity into daily routines. The goal is to accumulate at least 30 minutes of activity each day. Individuals may achieve this by walking or bicycling for transportation, exercise or pleasure; playing in the park; working in the yard; taking the stairs; and using recreation facilities. An

Pathways to a Healthy Decatur 23 Community Transportation Plan
Active Living Community is designed to be pedestrian-friendly and provides opportunities and encouragement for people to incorporate physical activity into their daily activities.46 A community that emphasizes and provides for active living will especially benefit older adults and children. Since many older adults cannot perform vigorous physical activities, they typically walk for exercise.47 48 In a six-year longitudinal study, older adults who walked a mile at least once a week were significantly less likely to develop functional limitations.49 50 Walking also improves cardiovascular endurance, balance and flexibility.51 Walking as a form of regular physical activity is also important for older adults with disabilities as a means to maintain their functional abilities and independence52 53 54 and to lower the chance of increasing their disability.55 56 57 58 A study in Seattle found significant relationships between community form and level of activity among seniors.59 Environmental features which impact walking include congested paths and trails, litter, blocked curb cuts, narrow sidewalks, poor street furniture placement, steep inclines, noise, poor lighting, landscaping and weather conditions, and lack of signage, seating, ramps or curb cuts.60 61 62 63 64 65 A literature review about the influence of the built environment on children’s physical activity suggests that the same factors that affect adults also impact children, including conditions like opportunities for physical activity, accessible facilities and destinations, safety and slower traffic, and appealing physical appearance of the immediate environment. Furthermore, physical activity for children is positively associated with access to local parks, playgrounds, and schools; and availability of sidewalks, crosswalks, traffic lights, and public transportation; and negatively associated with the number of roads to cross, traffic density/speed, and crime.66 Time spent outdoors is positively associated with physical activity for children. Physical activity for adolescents is positively associated with opportunities for exercise.67 Neighborhood design has a greater impact on active travel than on other forms of neighborhood-based exercise.68 Subsequently, designation of crosswalks, traffic signals, pedestrian signage, and other amenities become important for access. Traffic speed is recognized as the key determinant for pedestrian injury risk for children.69 The following principles have been developed by Active Living by Design, a national program of the Robert Wood Johnson Foundation administered by the University of North Carolina School of Public Health, to promote and increase physical activity through interdisciplinary collaboration.
Physical activity is a behavior that can favorably improve health and quality of life.
Everyone, regardless of age, gender, language, ethnicity, economic status or ability, should have safe, convenient and affordable choices for physical activity.

Pathways to a Healthy Decatur 24 Community Transportation Plan
Places should be designed to provide a variety of opportunities for physical activity and should accommodate a wide range of individual preferences and abilities.
Development patterns should encourage mixed uses, compact design, and a variety of transportation choices.
Buildings should be designed and oriented to promote opportunities for active living, especially active transportation.
Transportation systems, including transit, should provide safe, convenient and affordable access to housing, worksites, schools and community services.
Parks and green space, including trails, should be safe, accessible and part of a transportation network that connects destinations of interest, such as housing, worksites, schools, community services and other places with high population density.
Municipalities and other governing bodies should plan for ongoing interdisciplinary collaboration, promotion of facilities, behavioral supports, policies that institutionalize the vision of active living, and routine maintenance that ensures continued safety, quality and attractiveness of the physical infrastructure.
Community governing and planning processes should address the multiple impacts of the built environment and transportation choices on residents' ability to be physically active.
Access and Affordability The ability to access schools, transit, nutritious food, goods and services, recreational facilities, parks, and other public spaces has physical and economic impacts. Lack of access typically implies that one is physically unable to access any or all of the above items because of disability or infirmity, lack of transportation options, distance, or time. Lack of access also implies an economic inability such as when quality health care is beyond the financial capabilities of a household. Crime and perceptions of personal safety can also limit access by making people fearful of leaving their homes and by discouraging businesses from locating in an area. Lack of access is a problem that plagues low-income communities and dramatically affects quality of life, financial prospects, and health. However, difficulties with access affect anyone at any income level who lives in a sprawling area lacking alternative transportation options. Those affected include children of pre-driving age, the elderly of post-driving age, those with health issues that prohibit driving (e.g. blindness and epilepsy), and those without access to a vehicle. Access to good schools contributes to a child’s well-being over the course of a lifetime. A quality education can improve the ability to make choices in life which typically has positive

Pathways to a Healthy Decatur 25 Community Transportation Plan
health consequences. Quality schools also contribute to a child’s health and well-being in the short-term. Neighborhood schools and recreational facilities that are within easy and safe walking distance encourage physical activity. Parental involvement, necessary for the success of a child, increases the closer the school is to the house.70 In addition to decreased physical activity, another downside of increased distance is the need for busing, which exposes children to air pollution and particulate matter that can exacerbate respiratory ailments; the longer the child is on the bus, the greater his or her exposure.71 The inability to access nutritious food has direct health implications. Obesity, due to a combination of poor nutrition, high caloric intake, and lack of physical activity, plagues low-income communities.72 Grocery stores, drug stores, and other retail establishments often are hesitant to locate in low-income communities, and as a result residents must travel greater distances, which takes time and money, to secure nutritious food or rely on resources at hand which are usually less healthy. The lack of access to food and goods and services is exacerbated by the lack of access to transit, which further limits options. Low-income neighborhoods are often underserved by parks, recreational facilities, and other public spaces. This lack of access, worsened by fewer transportation options, a lack of time, fear of crime, and poor maintenance, has direct health consequences on the physical, mental, and social well-being of residents. Parks and public spaces provide opportunities for community interaction, places to exercise, relax, and commune with nature. Ease of access to parks, recreational facilities, and other public spaces greatly increases the chance that the spaces will be used.73 Access to these spaces is particularly important to children who experience behavioral and physical challenges when unable to play freely. Good neighborhood design attempts to resolve the lack of access via street connectivity, and continuity of the bike and pedestrian network. Multiple modes of transportation enable the greatest amount of mobility, thereby removing physical barriers to access. Good design can also help ease financial barriers by eliminating or reducing the reliance on the automobile thereby freeing up a sizeable portion of a household’s income for more healthful pursuits. The following map identifies the Decatur locations of several destinations, including parks, schools, food stores, pharmacies, and medical facilities. All of these destinations can contribute to good health; therefore, consideration of transportation system priorities may take into account people’s ability to access these goods and services.

Pathways to a Healthy Decatur 26 Community Transportation Plan
Figure 10: Destinations in Decatur
Environmental Threats Low income persons, minorities, children, the elderly, and those with disabilities suffer disproportionately from environmental exposure.74 There are many types of environmental exposures which affect the air, soil, and water near neighborhoods. Noise pollution is also a concern. Each of these exposures has directly attributable health consequences. Communities located near heavy industry, freeways, rail yards, trucking routes, power substations, airports, landfills, hazardous waste sites, and former industrial sites or brownfields are disproportionately affected by pollutants. Poor air quality, from auto emissions or industrial sites, worsens and may even cause asthma and other respiratory

Pathways to a Healthy Decatur 27 Community Transportation Plan
ailments along with cardiovascular problems, stroke, low birth weights, and cancer. Long term exposure to air pollutants can result in premature death.75 Runoff of pollutants from industrial sites can contaminate the soil, causing gastrointestinal and other diseases through consumption of vegetables grown in a household garden for example.76 Exposure to loud noises overtime can cause both psychological and physical disorders. Exposure to traffic-related pollutants has been linked to an increasing array of health problems, including asthma, cough, reduced lung function, certain types of cancers, cardiopulmonary and stroke mortality, and premature births and low birth rates.77 Short- and long-term exposure to air pollutants can have health effects at both a regional and local scale. Increased rates of mortality and morbidity from cardiovascular and respiratory diseases have been associated with various indices of air pollution, including gaseous pollutants generated by the burning of fossil fuels, but have been most strongly associated with air pollution that contains fine particulate matter.78 79 Hospital admissions for cardiovascular and respiratory diseases in Europe and North America have been observed to be associated with PM and gaseous pollutants such as ozone, CO and NO2.80 The effects of gaseous and particulate pollutants on health have been found in both short- (acute exposure) and long-term studies (chronic exposure) with effects being seen at very low levels of exposure. However research is ambiguous on whether or not there is a threshold concentration below which no effect on health will occur.81 Both short- and long-term exposure to particulate matter (PM) have been associated with increased rates of cardio-respiratory morbidity and mortality. This includes increased lung cancer risk, along with short- and long-term non-cancer health effects such as bronchitis, asthma, and reduced lung function.82 Additionally, PM 2.5 is seen to have an adverse effect on lung development in adolescents that can lead to lifelong lung deficiency.83 84 The elderly are also at increased risk for negative health effects stemming from exposure to PM. Research has shown that common emission sources for PM have significant associations with elderly cardiovascular hospital emissions and that modest amounts of air pollutants are associated with small changes in cardiac function in the elderly.85 86 Studies have examined particulate matter’s impact on human health. PM 2.5 is generally seen to have a greater negative effect on health, since the particles are small enough to be absorbed through lung tissue into the bloodstream, but both PM 2.5 and PM 10 can have a negative effect on health.87 88 Studies have indicated that vehicle-related fine particulate matter becomes highly concentrated in areas immediately adjacent (200 meters) to major roadways. Outdoor particulate matter concentrations (PM2.5 and PM10) are an estimated 15 to 20 percent higher at homes located in high traffic intensity streets compared to low traffic homes. Vehicle-related pollutants have been associated with increased respiratory illness, impaired lung development and function, and increased infant mortality. Also, pregnant women living within 200 to 300 meters of high-volume roads face a 10 to 20 percent higher risk of early birth and of low-birth-weight babies. In addition to general vehicle exhaust, exposure to fine particulates from diesel exhaust has a negative effect on those

Pathways to a Healthy Decatur 28 Community Transportation Plan
that live near roadways or areas such as rail yards or inter-modal yards with high diesel emissions. People living in immediate proximities (200 meters) of major diesel thoroughfares are more likely to suffer from respiratory ailments, childhood cancer, brain cancer, leukemia, and higher mortality rates than those who live further away. Research shows that particulate concentrations approach normal background levels at distances greater than 200 meters.89 90 Environmental justice—defined by the Environmental Protection Agency as the “fair treatment for people of all races, cultures, and incomes, regarding the development of environmental laws, regulation, and policies”—applies specifically to the protection of those who most often bear a disproportionate burden of environmental threats. Populations not considered at risk may also live near environmental threats, but they are more likely to have options to relocate or to mitigate the unhealthful consequences of living near those threats. Poor and minority citizens are at greater risk from environmental exposure as compared to people in middle and upper income brackets.91 Good neighborhood design will mitigate some of the unhealthful effects of living near environmental threats. Buffer zones achieved through vegetation or land use mix can be effective. Parks and greenspace act as air filters improving air quality and reducing the heat island effect in urban settings. Parks and greenspace can also mitigate environmental noise, acting as a sound buffer for freeways and other high decibel land uses.92 Social Capital Social capital can be defined as the collective value of a network—social, political, and economic—whose purpose is to inspire trust in and provide support for other members of that community.93 It is the degree to which people feel that they live in and belong to a socially cohesive local environment, and the range of activities and resources that emerge as consequence of those ties. Individuals who are not well integrated into the social, political and economic networks, those with low social capital, are reportedly at increased risk for poor physical and mental health.94 On the contrary, people socially engaged in their communities live longer and are healthier both physically and psychologically.95 In addition, recent studies have explored the relationship between the built environment and its effect on the building of social capital.96 The health benefits that have been linked to high levels of social capital are extensive. Various studies have shown that isolation is a major cause of illness, and that once ill, socially isolated individuals are two to five times more likely to die than those with strong social networks. Thus social capital has been linked to prolonged life expectancy. Social capital has also been linked to better overall health, better cardiovascular health, and improved mental health (self-esteem, better self-image, greater self-worth). Social capital has even been shown to reduce incidents of violent crime and increase physical activity.97

Pathways to a Healthy Decatur 29 Community Transportation Plan
However, the link between social capital and the built environment is more tenuous, although a number of recent studies are providing data to support what thus far has been anecdotal evidence. A strong connection has been made between lowered social capital and automobile dependence.98 Walkability, on the other hand, is positively correlated to social capital. The following design components can make neighborhoods more walkable and may increase social capital: grid-street pattern, narrow streets, small lot size, mix of uses, density, traffic calming, sidewalks and crosswalks, and the presence of parks, trails, and other public spaces. These last elements are particularly important, as they provide realms that encourage both interaction and physical activity.99 The design of the built environment can have an effect not only on physical activity but also on the sense of community. The placement of entrances to residential units that are adjacent to or facing one another or that are directly connected to pedestrian paths or active common spaces, increases the likelihood of social interaction. The inclusion of certain architectural features such as stoops, porches, and communal gathering spaces also increases social interaction improving one’s sense of emotional well-being. Views of and access to nature have also been shown to have positive health impacts resulting in increased recovery times for hospital patients, decreased mortality in seniors, lower blood pressure and decreased anxiety, and higher levels of attention in school age children.100 Low-income neighborhoods are often disproportionately affected by environmental exposures, lack of access, and a spatial mismatch between jobs and affordable housing among other ills, each of which has negative health consequences. One study indicates that residents of high-poverty neighborhoods live on average eight years less than non-poverty neighborhoods.101 Involuntary displacement and gentrification also destroy social capital by removing people from their established social networks, which has physical and mental health implications.102 Social networks have bearing on healthful behavior by communicating information about available health care services, providing social support, and transmitting norms of acceptable behavior particularly related to lifestyle choices such as smoking, drinking, and diet.103

Pathways to a Healthy Decatur 30 Community Transportation Plan
HIA Workshop A workshop for a diverse group of City of Decatur stakeholders and external partners was an important component of the rapid HIA. Workshop Format On April 30, 2007, a one-day HIA workshop was hosted by the City of Decatur and facilitated by Georgia Tech’s Center for Quality Growth and Regional Development, along with public health professionals from the Centers for Disease Control and Prevention and the DeKalb County Board of Health. Approximately 60 participants attended. They included residents of the City of Decatur; representatives of government bodies such as DeKalb County, the Atlanta Regional Commission (ARC), the Centers for Disease Control and Prevention (CDC), and the Georgia Department of Transportation (GDOT); and representatives of local businesses, churches, and nonprofit organizations. The workshop began with a brief introduction and statement of key health issues by each of the participants. The following issues were identified by the participants: balance between modes
safety for kids
walking should be the norm for transportation between neighborhoods and downtown
bike/pedestrian crashes
bike safety
pedestrian safety
Figure 11: Workshop Participants Discussing Health Impacts
Pathways to a Healthy Decatur 31 Community Transportation Plan
safety and mobility for older generations
pedestrian trails
special populations
future generations
childhood obesity
related auto congestion
baby boom generation
environmental justice
connectivity
Safe Routes to School
community cohesion
active kids
physical activity
air quality
health disparities
preservation of green space
active transportation
infrastructure that encourages active living
alternative modes of commuting
infrastructure for motorized wheel chairs
emotional health
environmental health disparities
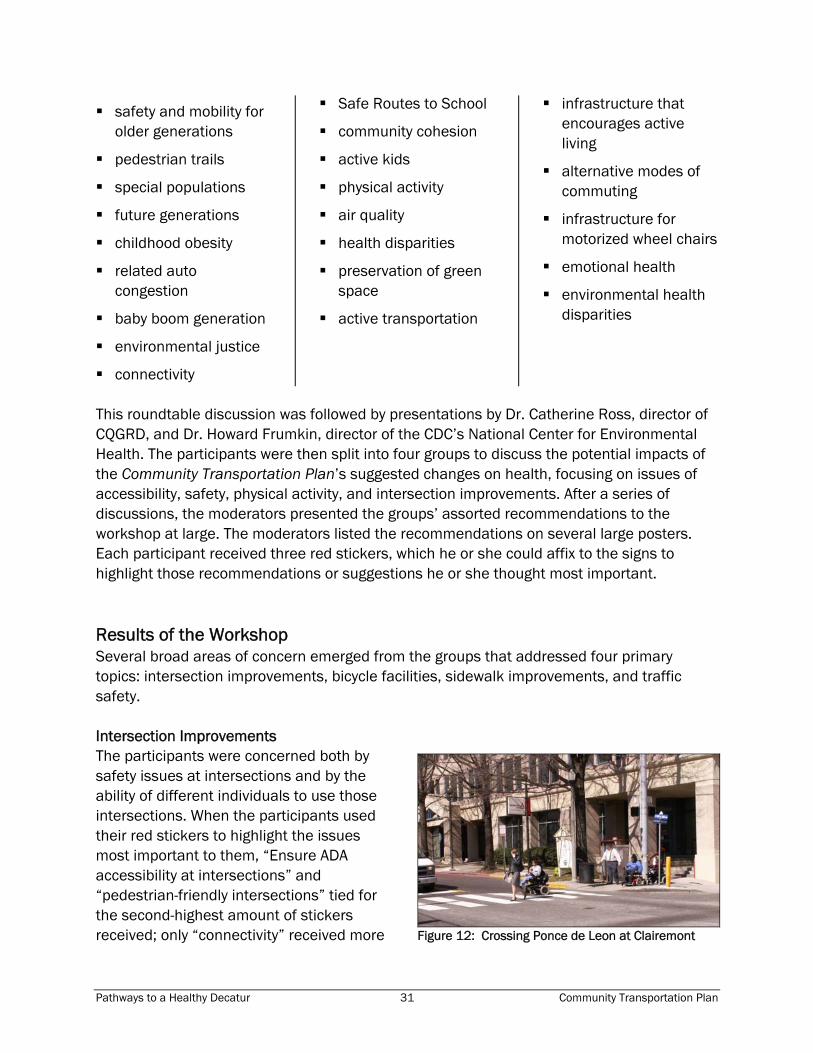
This roundtable discussion was followed by presentations by Dr. Catherine Ross, director of CQGRD, and Dr. Howard Frumkin, director of the CDC’s National Center for Environmental Health. The participants were then split into four groups to discuss the potential impacts of the Community Transportation Plan’s suggested changes on health, focusing on issues of accessibility, safety, physical activity, and intersection improvements. After a series of discussions, the moderators presented the groups’ assorted recommendations to the workshop at large. The moderators listed the recommendations on several large posters. Each participant received three red stickers, which he or she could affix to the signs to highlight those recommendations or suggestions he or she thought most important. Results of the Workshop Several broad areas of concern emerged from the groups that addressed four primary topics: intersection improvements, bicycle facilities, sidewalk improvements, and traffic safety. Intersection Improvements The participants were concerned both by safety issues at intersections and by the ability of different individuals to use those intersections. When the participants used their red stickers to highlight the issues most important to them, “Ensure ADA accessibility at intersections” and “pedestrian-friendly intersections” tied for the second-highest amount of stickers received; only “connectivity” received more
Figure 12: Crossing Ponce de Leon at Clairemont

Pathways to a Healthy Decatur 32 Community Transportation Plan
votes. There were also several requests for audible and visible countdown signals at pedestrian crossings. The specific intersection that received the most commentary was where College Avenue, Howard Street, Trinity Place, and South Candler Street intersect. There were several requests to make sure that particular intersection would be able to accommodate cyclists and pedestrians due to the presence of a PATH multiuse trail. Bicycle Facilities Participants familiar with bicycling in Decatur made their desire for increased bicycle facilities very clear: not only bicycle trails, but facilities for riders to shower and park their bicycles safely. One popular recommendation was that bicyclists want not only safe but efficient paths to their destinations—that bike paths will not be used if, in order to bike, riders have to travel a much further distance than they would driving or sharing lanes. Another frequent suggestion was education for car drivers and bike riders alike on how to share the road. A particular concern was the Citgo gas station located northeast of Atlanta Avenue’s intersection with the railroad tracks. The current layout is such that bicyclists on the path run a very high risk of being hit by cars entering or leaving the gas station. Sidewalk Improvements The participants worried that the suggested sidewalk improvements were not extensive enough. The original map of sidewalk improvements only highlighted those streets with no sidewalks; several participants wondered if streets with only one sidewalk, not targeted by the Community Transportation Plan, might still prove inadequate, as pedestrians might encounter difficulties crossing from one side of the street to the other. Generally, sidewalk connectivity, especially in relation to bike and walking trails, was a frequently cited desire. The quality of the sidewalks themselves also became an issue. There was a suggestion that sidewalks be shaded by trees and “not too bare”—a significant usability issue in the warmer months. Another request was for sidewalks to be designed with a buffer between the pedestrian and the car on the road. But participants recognized that the need for sidewalks would not be equal on every Decatur street, and called for sidewalk improvements to be coordinated with current land uses and high-priority pedestrian access areas. A large number of the comments focused attention on reconfiguring the built environment in order to increase the opportunity for physical activity.
Figure 13: Bike Parking on the Square
Pathways to a Healthy Decatur 33 Community Transportation Plan
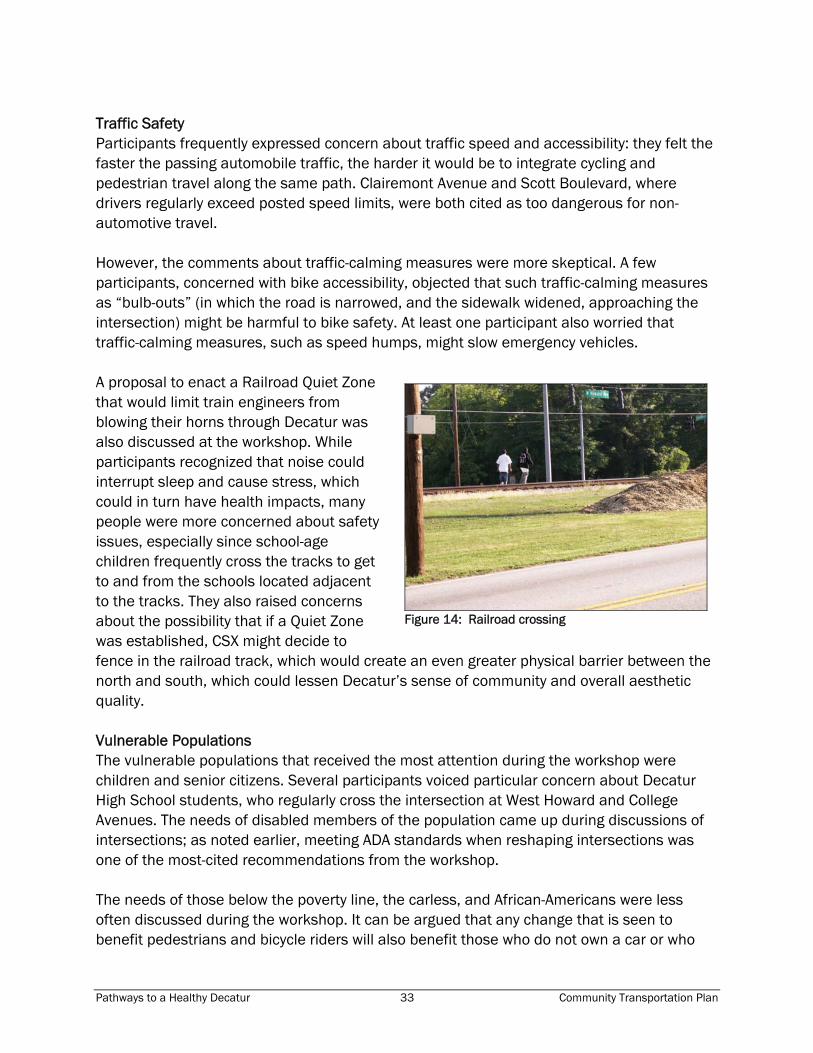
Traffic Safety Participants frequently expressed concern about traffic speed and accessibility: they felt the faster the passing automobile traffic, the harder it would be to integrate cycling and pedestrian travel along the same path. Clairemont Avenue and Scott Boulevard, where drivers regularly exceed posted speed limits, were both cited as too dangerous for non-automotive travel. However, the comments about traffic-calming measures were more skeptical. A few participants, concerned with bike accessibility, objected that such traffic-calming measures as “bulb-outs” (in which the road is narrowed, and the sidewalk widened, approaching the intersection) might be harmful to bike safety. At least one participant also worried that traffic-calming measures, such as speed humps, might slow emergency vehicles. A proposal to enact a Railroad Quiet Zone that would limit train engineers from blowing their horns through Decatur was also discussed at the workshop. While participants recognized that noise could interrupt sleep and cause stress, which could in turn have health impacts, many people were more concerned about safety issues, especially since school-age children frequently cross the tracks to get to and from the schools located adjacent to the tracks. They also raised concerns about the possibility that if a Quiet Zone was established, CSX might decide to fence in the railroad track, which would create an even greater physical barrier between the north and south, which could lessen Decatur’s sense of community and overall aesthetic quality. Vulnerable Populations The vulnerable populations that received the most attention during the workshop were children and senior citizens. Several participants voiced particular concern about Decatur High School students, who regularly cross the intersection at West Howard and College Avenues. The needs of disabled members of the population came up during discussions of intersections; as noted earlier, meeting ADA standards when reshaping intersections was one of the most-cited recommendations from the workshop. The needs of those below the poverty line, the carless, and African-Americans were less often discussed during the workshop. It can be argued that any change that is seen to benefit pedestrians and bicycle riders will also benefit those who do not own a car or who
Figure 14: Railroad crossing

Pathways to a Healthy Decatur 34 Community Transportation Plan
need to reduce their transportation expenses. However, there may be issues of accessibility and prioritizing of projects, where changes may benefit pedestrians as a whole but fail to reach the carless and those below the poverty line.

Pathways to a Healthy Decatur 35 Community Transportation Plan
Health Impacts of Community Transportation Plan Interventions The full-range of recommendations and concepts resulting from the Community Transportation Plan can have a variety of health impacts, particularly those related to physical activity, social capital (interaction and relationships with other people), safety (in this case, travel-related injury and fatalities), and equity and access. The following tables summarize the Community Transportation Plan recommendations and concepts that were the focus of the HIA Workshop. The first column contains a brief description of the plan’s recommendation or concept. The second column identifies the populations most affected by the plan recommendation, then identifies the potential health impacts. These impacts have been derived from the HIA Workshop and from an examination of the literature on health outcomes related to transportation. Each impact is categorized as:
PA = physical activity SC = social capital MH = mental health
SI = safety and injury EA = equity and access
This information can be used during the design and implementation phases, to address more specific needs of various users and opportunities to increase positive health impacts and eliminate or mitigate negative impacts.

Pathways to a Healthy Decatur 36 Community Transportation Plan
Bicycle Recommendations Plan Recommendations Affected Populations and Health Impacts
Network
Proposed network recommends 15 miles of on-street routes and 3 miles of new off-street trails (represents 500% and 100% increases in current on-street and trail facilities, respectively).
Populations Affected: Current bicyclists and carless commuters able to afford a bicycle; car owners who might find it easier to reach destinations by bicycle. Potential Health Impacts: PA - Greater use of bicycles could lead to greater physical activity, which in turn could lead to lower risks of health problems such as heart disease, high blood pressure, obesity, diabetes, and some types of cancer. PA - Creating or improving access to places for physical activity (sidewalks, trails, bike lanes, parks, etc.) can results in a 25% increase in the percent of people who exercise at least three times a week and studies show that this increase in physical activity can lead to reported weight loss or decreases in body fat.104 SI - A greater number of bicyclists could lead to a greater number (but not per capita rate) of accidents involving bicycles. Two studies of nonfatal bicycle injuries found that 75% of injuries treated in emergency departments105 and 93% of those treated during a physician or dentist visit did not involve collisions with motor vehicles.106 Approximately 6% to 11% involved collisions with other bicyclists. Nine percent of the emergency-department-treated injuries in the 2005 study occurred on bike paths (not on public roads) or shared-use pedestrian-bike paths, and 14% of injuries occurred at locations such as playgrounds, parks, and gardens.107
On-road bicycle facility types will be chosen and designed on a corridor-specific basis.
Populations Affected: Bicyclists, drivers who now share the road with bicyclists. Potential Health Impacts: SI - Greater incidences of bicycles and cars sharing the road increases the risk of bicycle-car accidents. A 1988 study of cycling crashes in an urban area and found that 92% of crashes occurred on a paved roadway, four percent occurred on the sidewalk, and four percent occurred on some other surface. The most common crash causes were cyclist being struck by a motor vehicle (28%), pedestrian or cyclist being struck by a cyclist (28%), and fall from bicycle (26%). The study did not identify whether the roadway crashes occurred in bike lanes or not, or whether bike lanes were available in this urban setting.108

Pathways to a Healthy Decatur 37 Community Transportation Plan
Plan Recommendations Affected Populations and Health Impacts
Combination of on-street bicycle facilities, off-street trails, and “Share the Road” signage to educate both cyclists and motorists. • On-street facilities may include bicycle lanes, wide outside lanes, and potentially “sharrow” style lane markings. • Off-street trails will be designated as multi-use facilities meeting AASHTO design guidelines. • “Share the Road” signage will be used to educate cyclists and motorists along high volume corridors with lower traffic speeds; will also encourage a mix of bicycle and automobile traffic within the downtown core.
Populations Affected: Bicyclists, drivers who now share the road with bicyclists. Potential Health Impacts: SI - Greater education could reduce the risk of bicycle-car crashes. SI - Bicycle lanes2 have been shown to reduce bicycle-motor vehicle crashes by 31%.109
On-street facilities should follow primarily low-volume streets with linkages along higher-volume streets.
Populations Affected: Persons using low-volume streets, bicyclists who use high-volume traffic corridors. Potential Health Impacts: SI - Reducing the number of bicyclists interacting with cars along high-volume corridors could reduce the risk of bicycle-car crashes.
Bicycle routes and facilities will be designated and implemented with consideration given to on-street car parking and the need for car parking on a corridor-specific basis.
Populations Affected: Bicyclists, those looking seriously at bicycling as an alternative to driving. Potential Health Impacts: SI - Taking bicycling into account when designing on-street car parking, and vice versa, should reduce the risk of crashes between bicyclists and people entering or exiting parked cars.
2 Note that bicycle lanes and shared-use paths are different types of facilities. Bicycle lanes are typically on-street, striped facilities, whereas a shared-use path is an off-road facility.

Pathways to a Healthy Decatur 38 Community Transportation Plan
Plan Recommendations Affected Populations and Health Impacts
Network markings and wayfinding signage to help guide cyclists between city locations.
Populations Affected: Current bicyclists, new bicyclists, visitors to Decatur who wish to ride bikes. Potential Health Impacts: MH, SI - Increasing signage should enhance wayfinding and reduce stress for bicyclists who might otherwise be lost and increase usage of novice riders. SI - Increasing signage might increase distractions for novice cyclists, increasing the risk of accidents.
Routes will be identified for connections to transit facilities, especially rail stations.
Populations Affected: Transit users, the carless, current bicyclists who do not use rail. Potential Health Impacts: PA - Increasing access to transit will increase chances for physical activity. A 2007 study found that train commuters walked an average of 30% more steps per day, reported having walked for a period of 10 minutes or more while traveling significantly more often, and were 4 times more likely to walk 10,000 steps per day than car commuters.110 PA - The benefits of walking to transit could be particularly significant for underserved populations, as a way for them to achieve recommended levels of physical activity.111 PA - New availability of non-car options could induce transit riders to bicycle instead of driving to transit stations, increasing physical activity.
Implementation
Opportunities for bicycle facilities should be considered in the design or reconstruction of new or existing streets, recreational areas, or site developments.
Populations Affected: Residents, non-cyclists. Potential Health Impacts: PA - Easier access to bicycle facilities should increase the attractiveness of bicycling and thus, in turn, increase the amount of physical activity through bicycling.
Installation and construction of bicycle facilities will be phased, with priority given to routes connecting schools.
Populations Affected: Children who might ride bicycles to school. Potential Health Impacts: PA - Non-car commuting could increase physical activity levels of Decatur children and parents accompanying them to school. Participating public schools in a California Safe Routes to School program reported an increase in school trips made by walking (64%), biking (114%), and carpooling (91%) and a decrease in trips by private vehicles carrying only one student (39%).112

Pathways to a Healthy Decatur 39 Community Transportation Plan
Plan Recommendations Affected Populations and Health Impacts
Bicycle suitability analysis will be conducted to determine the best locations for new facilities.
Populations Affected: Potential cyclists. Potential Health Impacts: PA, AQ - Increasing accessibility to bicycle facilities could lead car owners to use bicycling for short trips within Decatur, increasing physical activity and reducing vehicle emissions.
Support Facilities
Bicycle parking facilities throughout the city.
Populations Affected: Current cyclists, those who work in Decatur. Potential Health Impacts: PA - Allowing people to bicycle to work in Decatur would increase their chances to engage in physical activity. A study in Copenhagen, Denmark found that bicycling to work (average cycling time to work was three hours per week) was related to a 38% decreased risk of mortality after adjusting for leisure-time physical activity, body mass index (BMI), blood lipid levels, smoking, and blood pressure.113
Centrally located bicycle station with free air pump, water fountains, and covered secure locking facilities to support transit commuters, downtown shoppers, and weekend recreational riders.
Populations Affected: Current and potential cyclists Potential Health Impacts: PA, AQ - Centrally located bicycle stations make bicycling more attractive, thus increasing the chances that people will choose bicycling for trips into a central area. PA - Offering secure locking facilities could reduce stress and worry for bicyclists, especially those who rely on their bicycles for commuting to and from work.
With support from local bicycle shops and retailers, a bicycle station could also host vending machines selling basic maintenance items such as replacement inner tubes.
Populations Affected: Current and potential cyclists, bicycle shops and retailers. Potential Health Impacts: PA, AQ - A vending machine could reduce stress and worry for bicyclists and make a switch from driving to bicycling easier, increasing physical activity and decreasing emissions.
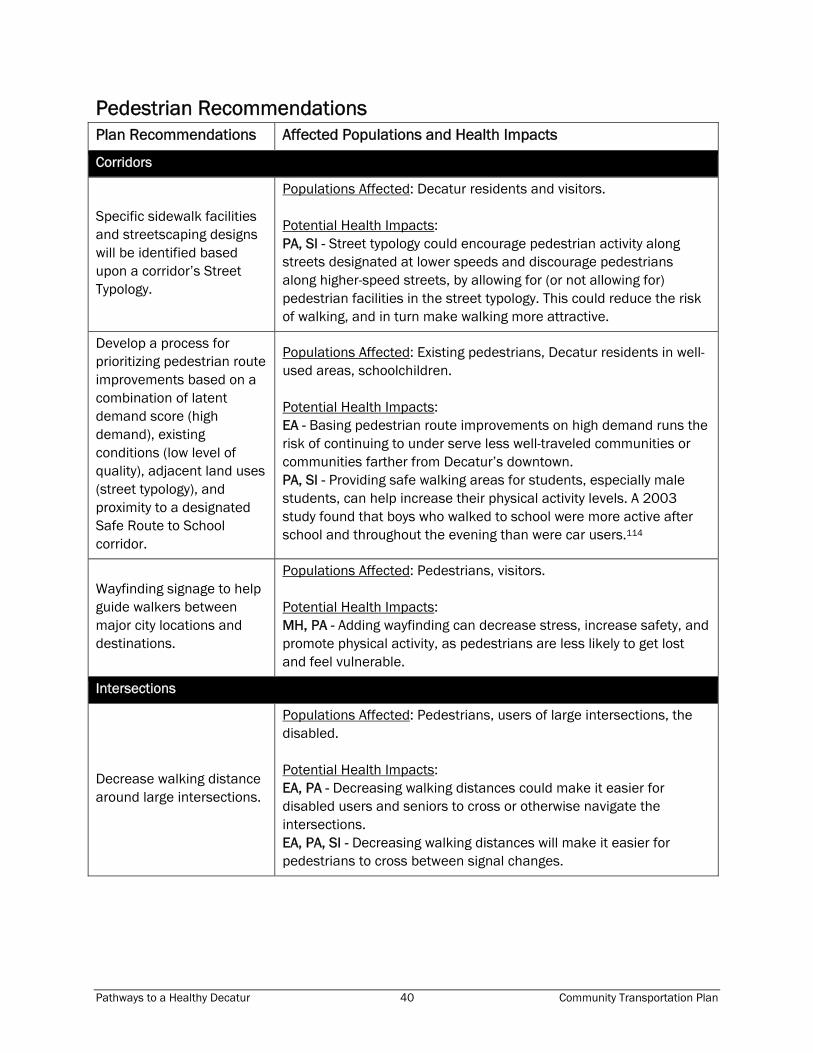
Pathways to a Healthy Decatur 40 Community Transportation Plan
Pedestrian Recommendations Plan Recommendations Affected Populations and Health Impacts
Corridors
Specific sidewalk facilities and streetscaping designs will be identified based upon a corridor’s Street Typology.
Populations Affected: Decatur residents and visitors. Potential Health Impacts: PA, SI - Street typology could encourage pedestrian activity along streets designated at lower speeds and discourage pedestrians along higher-speed streets, by allowing for (or not allowing for) pedestrian facilities in the street typology. This could reduce the risk of walking, and in turn make walking more attractive.
Develop a process for prioritizing pedestrian route improvements based on a combination of latent demand score (high demand), existing conditions (low level of quality), adjacent land uses (street typology), and proximity to a designated Safe Route to School corridor.
Populations Affected: Existing pedestrians, Decatur residents in well-used areas, schoolchildren. Potential Health Impacts: EA - Basing pedestrian route improvements on high demand runs the risk of continuing to under serve less well-traveled communities or communities farther from Decatur’s downtown. PA, SI - Providing safe walking areas for students, especially male students, can help increase their physical activity levels. A 2003 study found that boys who walked to school were more active after school and throughout the evening than were car users.114
Wayfinding signage to help guide walkers between major city locations and destinations.
Populations Affected: Pedestrians, visitors. Potential Health Impacts: MH, PA - Adding wayfinding can decrease stress, increase safety, and promote physical activity, as pedestrians are less likely to get lost and feel vulnerable.
Intersections
Decrease walking distance around large intersections.
Populations Affected: Pedestrians, users of large intersections, the disabled. Potential Health Impacts: EA, PA - Decreasing walking distances could make it easier for disabled users and seniors to cross or otherwise navigate the intersections. EA, PA, SI - Decreasing walking distances will make it easier for pedestrians to cross between signal changes.

Pathways to a Healthy Decatur 41 Community Transportation Plan
Plan Recommendations Affected Populations and Health Impacts
Provide pedestrian refuge islands or medians in large intersections to decrease crossing distance.
Populations Affected: Pedestrians. Potential Health Impacts: EA, PA - Adding pedestrian islands could make it easier for seniors to cross intersections, as they could rest on the island. Research has shown that walking at least ten blocks per day is adequate to maintain health and reduce the risk of cardiovascular events in older individuals.115 SI, PA - Increasing safety in pedestrian crossings could increase walking and therefore pedestrian activity. SI - Lower motor vehicle speeds could result in fewer accidents, with less risk of fatal or severe injury to pedestrians. Medians have been named as one of various effective traffic-calming measures to slow traffic speeds.116 EA - If not designed properly, the islands could be a barrier to bike users, forcing them to divert into traffic. If necessary, a bicycle cut-through should be provided. EA - Per universal-design principles, the islands will provide the most benefit to the greatest number of users if they are made ADA accessible.
Improve sight distances for turning cars.
Populations Affected: Drivers, pedestrians crossing the intersections. Potential Health Impacts: SI - Improving sight distances could decrease the risk of pedestrian-auto crashes. Almost half of all nonfatal pedestrian injuries occur at intersections, while only 21% of fatal injuries occur at intersections. Two-thirds of pedestrian deaths occur between 6 pm and 6 am and more than 80% of weekend deaths occur in the evening.117
Connect existing trail facilities.
Populations Affected: Trail users, Decatur residents looking for more recreation opportunities. Potential Health Impacts: PA, SC - Connectivity between trails could increase the number of trail users, which in turn could increase a sense of community and physical activity. SC - The HIA workshop named “connectivity” as one of its most popular goals.

Pathways to a Healthy Decatur 42 Community Transportation Plan
Plan Recommendations Affected Populations and Health Impacts
Implementation
Opportunities for improved pedestrian facilities should be considered in the design or reconstruction of new or existing streets, recreational areas, or site developments.
Populations Affected: Decatur residents, those wanting to walk more. Potential Health Impacts: PA - Improving pedestrian access to recreational areas would improve the likelihood of people walking as a leisure activity. However, it would not provide much benefit to commuters. EA, PA - Low-income families would benefit from having other ways than the automobile to access recreational areas.
Installation and construction of pedestrian facilities will be phased, with priority given to routes adjacent to and connecting to city schools and major destinations.
Populations Affected: Decatur residents and visitors, schoolchildren. Potential Health Impacts: PA, EA - Constructing pedestrian facilities could lead to more children walking to school. PA, EA - The presence of pedestrian facilities could lead to more pedestrian-friendly development at major destinations in Decatur.
Amenities and Support Facilities
Pedestrian amenities throughout the city, including benches, water fountains, covered shelters, and access to all recreation areas.
Populations Affected: Decatur residents and visitors. Potential Health Impacts: PA, EA - Seniors would be more likely to walk if they could rest under shade and get water at various points during their walk. PA, SC - Easier access to recreation facilities could lead to greater use of those facilities, contributing to a greater sense of community and increased physical activity.

Pathways to a Healthy Decatur 43 Community Transportation Plan
Plan Recommendations Affected Populations and Health Impacts
Officially encourage street-level land uses that are oriented towards pedestrian access: ground-floor retail, driveways with clear lines of sight, and developments accessible to pedestrian travel.
Populations Affected: Decatur residents and visitors. Potential Health Impacts: PA, SC - Greater land-use mixes, population and employment density, street connectivity and continuity of the bike and pedestrian network, are all believed to increase physical activity and contribute to positive health outcomes, as are the presence of recreational facilities and parks.118 PA - The variables that encourage physical activity include street lighting, stair accessibility, walking/bicycling paths, parks, and athletic clubs/gyms.119 120 A review of 19 environmental studies reported that greater physical activity was related to accessibility of a cycle path, access to exercise facilities, having exercise facilities on a frequently traveled route, having a park or shops within walking distance, safe footpaths, and living in a friendly, pleasant, and attractive neighborhood with enjoyable scenery.121 EA - Pedestrian-friendly housing requirements could increase housing prices, making it more difficult for low-income families to find affordable housing in Decatur.
Improve bus stops in conjunction with providing pedestrian amenities throughout the city.
Populations Affected: Commuters who use public transit; the carless; low-income populations. Potential Health Impacts: PA, EA - Improving bus stops could lead to greater commuting by bus, reducing time spent in cars. Each additional hour spent in a car per day has been associated with a 6% increase in the likelihood of obesity.122 SI - Depending on the improvements, the risk of crime at a bus stop could be reduced. EA - This improvement could be especially beneficial to low-income families and the carless, as it would further legitimize their bus use within the greater community and make waiting for the bus easier.

Pathways to a Healthy Decatur 44 Community Transportation Plan
Intersection Improvements Plan Recommendations Affected Populations and Health Impacts
Intersection 1: Commerce Drive and Clairemont Avenue
Redesigned intersection moves curbs in on the northwest and southwest corners.
Populations Affected: Drivers, pedestrians. Potential Health Impacts: PA, EA - More sidewalk space resulting from moving curbs could make it easier for disabled users and senior citizens to cross this intersection. PA, SI - More sidewalk space resulting from moving curbs could also increase pedestrian use of this intersection. One of the concerns expressed at the HIA workshop was that people would not use pedestrian facilities if they did not feel safe doing so.
Clairemont south of the intersection could also be narrowed.
Populations Affected: Drivers, bicyclists, pedestrians. Potential Health Impacts: PA, EA - A narrowing could make it easier for pedestrians to cross, but more difficult for bicyclists to share the road with cars. All users’ needs should be considered in the final design. SI, PA - Research on lane narrowing suggests that vehicle operating speeds decline as individual lanes and street sections are narrowed.123 124 125 126 127 128 Slower speeds create a more appealing and safer environment for pedestrians and bicyclists. SI - Slowing traffic speeds could also bring health benefits, in the form of decreased risk from accidents. Vehicle speeds are associated with injury occurrence and injury severity for all road users. A literature review sponsored by the National Highway Traffic Safety Administration (NHTSA) found that pedestrians have a five percent chance of fatal injury when hit by a car traveling 20 miles per hour (mph) or less. This risk increases to 40% at a vehicle speed of 30 mph, 80% at 40 mph, and nearly 100% at 50 mph or more.129 A 1997 study has estimated a 14% reduction in collisions and 16% reduction in pedestrian fatalities if a 60 kilometer/hour (kph) speed limit were reduced by 10 kilometers.130 *
* 60 kph is approximately 35 mph; and 50 kph is about 30 mph.

Pathways to a Healthy Decatur 45 Community Transportation Plan
Plan Recommendations Affected Populations and Health Impacts
The effect for pedestrians is to change what is now a 330-foot walk around the entire intersection (all 4 crosswalks) to a 100 foot walk (1/3 the existing distance).
Populations Affected: Pedestrians, especially senior citizens, children, and the disabled. Potential Health Impacts: PA - Shortening the time needed to cross the intersection on foot should lead to increased pedestrian use of the intersection. SI - Several studies have concluded that increased pedestrian and bicycle volume may reduce the risk of pedestrian or bicycle crashes—the safety in numbers concept.131 132 133 However, it is important to note that, while a given individual’s risk of crash injury may be reduced, the absolute number of injured pedestrians or cyclists may increase due to an increase in the number of these road users who are exposed to the traffic environment.
Addition of on-street bike lanes on Commerce Drive.
Populations Affected: Cyclists, drivers. Potential Health Impacts: PA - The presence of sidewalks, trails, crosswalks, and bicycle lanes has a positive impact on increased physical activity.134 SI - The creation of bike lanes could reduce the risk of car-bicycle crashes, although that may be mitigated if users are bicyclists or cars not used to sharing the road. PA, SC - Creation of bike lanes, by encouraging bicycle use, could improve both connectivity and social cohesion.
Addition of on-street parking on northwest side of Commerce Drive.
Populations Affected: Drivers, nearby businesses. Potential Health Impacts: PA, SI - In a Dutch study, parking spaces, intersections, and heavy bus and truck traffic were associated with less physical activity.135 Studies show that on-street parking accounts for a significant proportion of urban crashes,136 as much as 40% of total crashes on two-way major streets, 70% on local streets, and a higher percentage on one-way streets.137 SI - Having parked cars so close to pedestrian intersections increases the risk of pedestrian-car accidents, although the severity of these accidents should not be high.
Could improve pedestrian safety because on-street parking provides a traffic-calming effect by forcing drivers to be more aware of peripheral activities; it also provides a buffer between pedestrians on the sidewalk and moving vehicles.
On-street parking on this side could encourage drivers to cross the street mid-block in order to reach destinations.

Pathways to a Healthy Decatur 46 Community Transportation Plan
Plan Recommendations Affected Populations and Health Impacts
No on-street parking on Commerce between Clairemont and Church.
Populations Affected: Nearby businesses, users of the intersection. Potential Health Impacts: SI - Eliminating on-street parking may make it safer for bicyclists to use bicycle lanes.
Intersection 2: Commerce Drive and Church Street
Redesign intended to attract more pedestrians from the north coming downtown.
Populations Affected: Residents and visitors, especially from the north. Potential Health Impacts: PA - Redesign could increase pedestrian activity. EA - It should be noted that while some of Decatur’s more vulnerable populations (the disabled, seniors) are north of downtown, others (African-Americans, low-income families) are south of downtown and might not benefit as much from this particular development.
Reduce some traffic lanes to create more pedestrian space.
Populations Affected: Drivers, pedestrians. Potential Health Impacts: PA - Creating more pedestrian space could increase pedestrian activity. SI - Studies have found that more lanes results in more crashes138 139 140 141; therefore, the proposed lane reduction may decrease crashes.
Bicycle lanes are recommended in both directions on both streets.
Populations Affected: Bicyclists. Potential Health Impacts: PA - Adding these bike lanes could increase the number of people commuting by bicycle to the MARTA station. SI - Since there are also improvements to increase pedestrian activity, there would be an increased risk, with increased numbers of bicyclists and pedestrians, of pedestrian-bicycle accidents.

Pathways to a Healthy Decatur 47 Community Transportation Plan
Plan Recommendations Affected Populations and Health Impacts
Opportunities to add on-street parking on the north, east and south legs of intersection. On-street parking not recommended on the west leg (by McDonalds) because of the heavier volume of traffic that comes off Clairemont and goes through this intersection.
Populations Affected: Drivers, pedestrians, bicyclists. Potential Health Impacts: SC - On-street parking can facilitate community interactions and the creation of social capital by pulling drivers out of parking garages and onto the streets. EA - Disabled visitors who drive to businesses on Church and Commerce, or downtown Decatur, will have easier access to sidewalks. SI - On-street parking reduces risks of accidents by giving delivery vehicles the ability to make deliveries to local vehicles without needing to block a lane. SI - On-street parking Provides traffic-calming effects but can also increase risk to bicyclists.
Effect of these recommendations:
• Shorten the distance and time that pedestrians are in the intersection.
• Give dedicated lanes to bicyclists.
• Increase parking opportunities.
Populations Affected: Pedestrians, bicyclists, drivers. Potential Health Impacts: PA, SC - Shortening the time needed to cross the intersection on foot could increase pedestrian traffic, bringing increased levels of pedestrian activity and social capital. PA, AQ - Bicycle lanes could increase bicycle commuting, especially between downtown Decatur and the Emory University / Clifton Road area.
Intersection 3: College Avenue, South Candler Street, & Trinity Place
A safe and clearly marked PATH crossing over Trinity is recommended along a direct line from where it turns at the Dairy Queen—across Trinity at the light—and then to the Depot plaza.
Populations Affected: Pedestrians, cyclists, Decatur High School students. Potential Health Impacts: PA - A safe and clearly marked crossing could increase pedestrian and bicycle use. However, pedestrians or cyclists may not use the PATH crossing if it is perceived as less convenient or too time-consuming.

Pathways to a Healthy Decatur 48 Community Transportation Plan
Plan Recommendations Affected Populations and Health Impacts
Recommend expanding the public plaza in front of the Depot building by closing a short section of street to create the larger plaza.
Populations Affected: Residents, nearby workers, and visitors. Potential Health Impacts: PA, EA - Expanding the public plaza could bring health benefits by breaking up the crossing of Howard, making it easier for pedestrians, especially seniors and disabled users, to make the crossing. SI - Participants in the HIA workshop expressed concerns about this intersection, asking if the drawn islands were large enough to accommodate pedestrians safely. SC - Decatur residents and visitors will receive benefits from increase in greenspace and public space.
Restrict right-turns on red westbound on College to reduce conflicts with pedestrians and cyclists crossing with the light along the PATH.
Populations Affected: Drivers, pedestrians, cyclists. Potential Health Impacts: SI - While this could reduce the risk of pedestrian-car or bicycle-car accidents, other improvements, such as audible signal countdowns for pedestrians, could reduce the risk even further and make the intersection more pedestrian-friendly.
Showing widening of South Candler on the Agnes Scott side of the street – for a distance of 600 feet or so to get a second northbound through lane with tapers to help reduce the long queues now endured on South Candler Street (discussions will be needed with College).
Populations Affected: Pedestrians and drivers, especially those going to and from Agnes Scott College. Potential Health Impacts: MH - Widening the road and decreasing congestion could reduce the stress and anxiety of drivers. SI - Widening the road could make it more difficult and dangerous for pedestrians to cross.
Recommend prohibiting the northbound left-turn traffic as it crosses the railroad tracks and now turns onto Howard Street. A median island may be necessary to enforce this change.
Populations Affected: Drivers and pedestrians crossing the intersection. Potential Health Impacts: SI - If carried out properly, could decrease risk of accidents involving cars. PA, AQ - Participants in the HIA workshop were concerned that making this change would lead to greater congestion (and its attendant negative health impacts) on other streets.
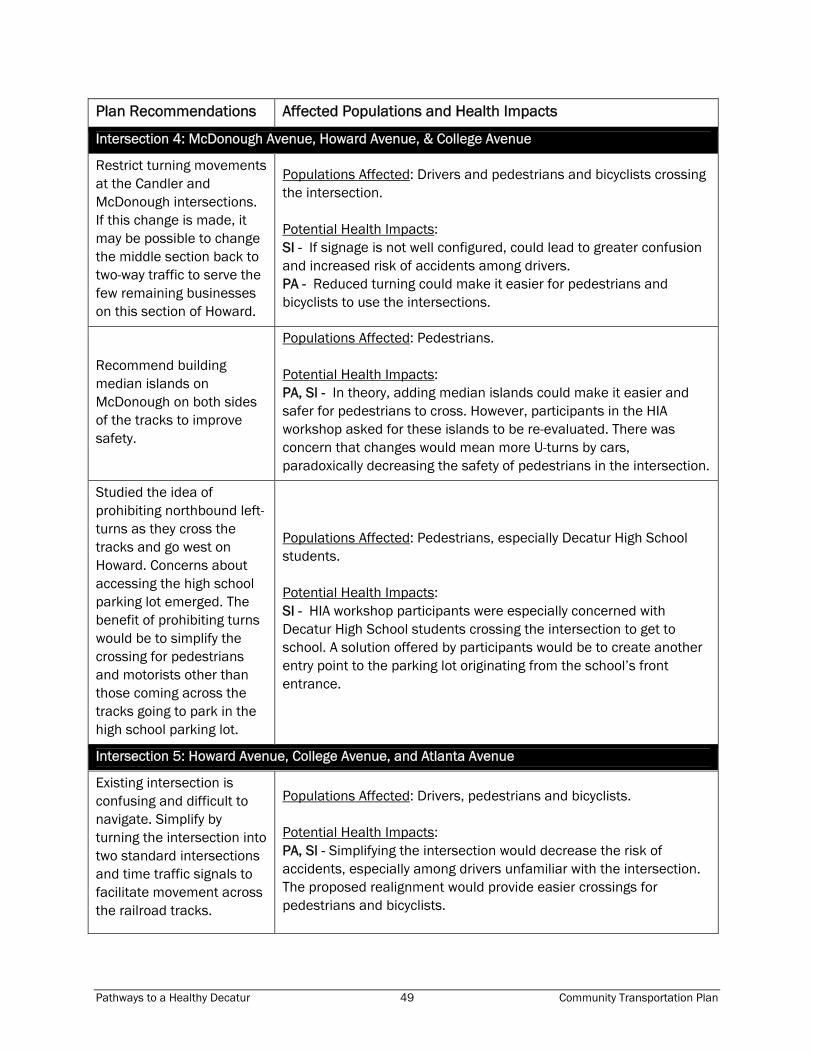
Pathways to a Healthy Decatur 49 Community Transportation Plan
Plan Recommendations Affected Populations and Health Impacts
Intersection 4: McDonough Avenue, Howard Avenue, & College Avenue
Restrict turning movements at the Candler and McDonough intersections. If this change is made, it may be possible to change the middle section back to two-way traffic to serve the few remaining businesses on this section of Howard.
Populations Affected: Drivers and pedestrians and bicyclists crossing the intersection. Potential Health Impacts: SI - If signage is not well configured, could lead to greater confusion and increased risk of accidents among drivers. PA - Reduced turning could make it easier for pedestrians and bicyclists to use the intersections.
Recommend building median islands on McDonough on both sides of the tracks to improve safety.
Populations Affected: Pedestrians. Potential Health Impacts: PA, SI - In theory, adding median islands could make it easier and safer for pedestrians to cross. However, participants in the HIA workshop asked for these islands to be re-evaluated. There was concern that changes would mean more U-turns by cars, paradoxically decreasing the safety of pedestrians in the intersection.
Studied the idea of prohibiting northbound left-turns as they cross the tracks and go west on Howard. Concerns about accessing the high school parking lot emerged. The benefit of prohibiting turns would be to simplify the crossing for pedestrians and motorists other than those coming across the tracks going to park in the high school parking lot.
Populations Affected: Pedestrians, especially Decatur High School students. Potential Health Impacts: SI - HIA workshop participants were especially concerned with Decatur High School students crossing the intersection to get to school. A solution offered by participants would be to create another entry point to the parking lot originating from the school’s front entrance.
Intersection 5: Howard Avenue, College Avenue, and Atlanta Avenue
Existing intersection is confusing and difficult to navigate. Simplify by turning the intersection into two standard intersections and time traffic signals to facilitate movement across the railroad tracks.
Populations Affected: Drivers, pedestrians and bicyclists. Potential Health Impacts: PA, SI - Simplifying the intersection would decrease the risk of accidents, especially among drivers unfamiliar with the intersection. The proposed realignment would provide easier crossings for pedestrians and bicyclists.

Pathways to a Healthy Decatur 50 Community Transportation Plan
Plan Recommendations Affected Populations and Health Impacts
Pedestrians traveling north or south will have a dedicated crossing.
Populations Affected: Pedestrians. Potential Health Impacts: SI - Pedestrians would be at lowered risk of car or bicycle accidents and feel safer.
PATH users will have a more direct crossing.
Populations Affected: Bicyclists. Potential Health Impacts: PA, AQ - A more direct crossing will make bicycling easier and thus should make bicycling more available to residents and commuters. The participants in the HIA workshop emphasized the need for bicycle routes to be not only safe but as direct as possible.
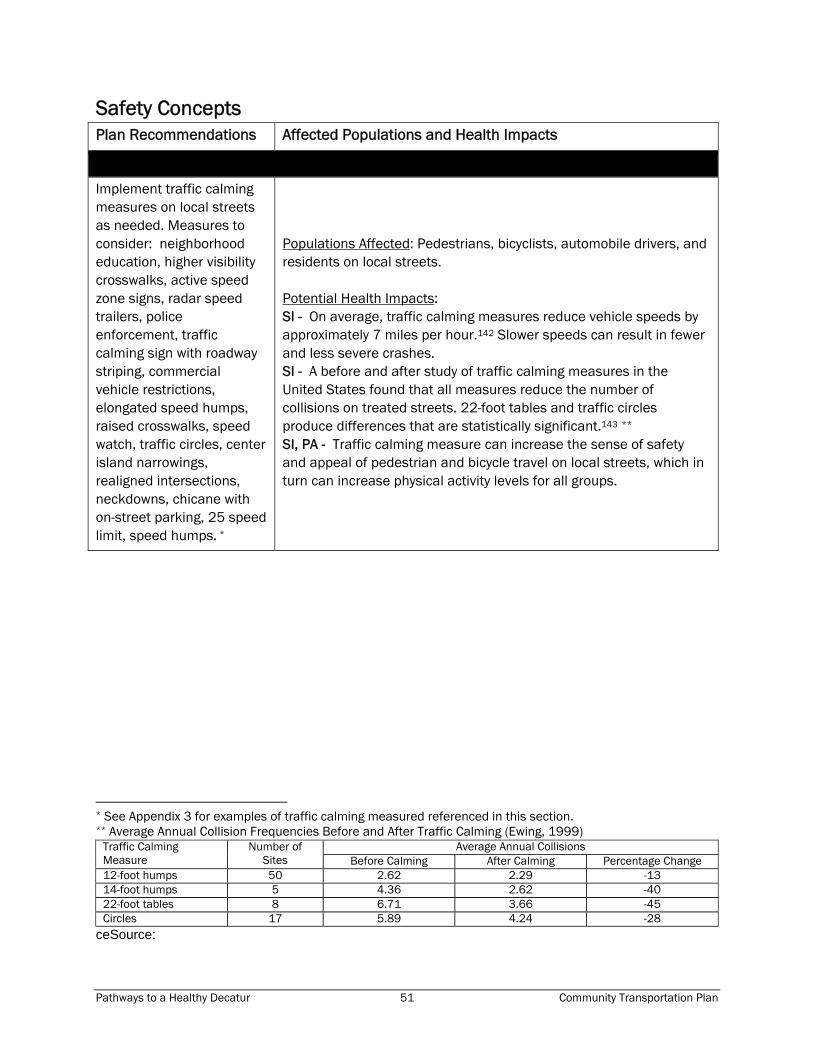
Pathways to a Healthy Decatur 51 Community Transportation Plan
Safety Concepts Plan Recommendations Affected Populations and Health Impacts
Implement traffic calming measures on local streets as needed. Measures to consider: neighborhood education, higher visibility crosswalks, active speed zone signs, radar speed trailers, police enforcement, traffic calming sign with roadway striping, commercial vehicle restrictions, elongated speed humps, raised crosswalks, speed watch, traffic circles, center island narrowings, realigned intersections, neckdowns, chicane with on-street parking, 25 speed limit, speed humps. *
Populations Affected: Pedestrians, bicyclists, automobile drivers, and residents on local streets. Potential Health Impacts: SI - On average, traffic calming measures reduce vehicle speeds by approximately 7 miles per hour.142 Slower speeds can result in fewer and less severe crashes. SI - A before and after study of traffic calming measures in the United States found that all measures reduce the number of collisions on treated streets. 22-foot tables and traffic circles produce differences that are statistically significant.143 ** SI, PA - Traffic calming measure can increase the sense of safety and appeal of pedestrian and bicycle travel on local streets, which in turn can increase physical activity levels for all groups.
* See Appendix 3 for examples of traffic calming measured referenced in this section. ** Average Annual Collision Frequencies Before and After Traffic Calming (Ewing, 1999)
Average Annual Collisions Traffic Calming Measure
Number of Sites Before Calming After Calming Percentage Change
12-foot humps 50 2.62 2.29 -13 14-foot humps 5 4.36 2.62 -40 22-foot tables 8 6.71 3.66 -45 Circles 17 5.89 4.24 -28
ceSource:

Pathways to a Healthy Decatur 52 Community Transportation Plan
Plan Recommendations Affected Populations and Health Impacts
Railroad Quiet Zone (defined by the Federal Railroad Administration as a “segment of rail line, within which is situated one or a number of consecutive public highway-rail crossings at which locomotive horns are not routinely sounded.”)
Populations Affected: Residents near the railroad, students of the Decatur high school and middle school, pedestrians, bicyclists, and automobile drivers. Potential Health Impacts: MH - Noise annoyance is characterized by feelings of displeasure or discomfort towards a particular sound and results in interference with thoughts, feelings, or activities.144 Noise annoyance can disrupt activities such as sleeping, which can impair the normal functions performed by sleep such as brain restoration and cardiovascular respite. It also has an effect on mood, fatigue, performance, cognitive abilities, vigilance, and can boost epinephrine levels which contributes to stress.145 PA, SC, SI - Workshop participants expressed concern that a quiet zone could prompt the construction of a fence along the railroad, which could create a physical and psychological barrier between the north and south portions of the city. This could result in decreases in physical activity (less walking and biking trips to and from downtown from the south side) and social capital.

Pathways to a Healthy Decatur 53 Community Transportation Plan
Next Steps The Community Transportation Plan stands to make crucial changes to the City of Decatur’s transportation infrastructure. Decatur has the advantage in that the plan does not require a thorough re-orientation of the city’s priorities; instead, Decatur’s civic leaders began the process with a commitment to maintaining a city-wide focus on Active Living. The enthusiastic response to the HIA Workshop and the participation in the workshop of representatives from many different parts of Decatur civic life, also speak to the importance of Active Living for Decatur as a community. Findings The HIA found that the elements of the Community Transportation Plan, including intersection and corridor improvements, bike and pedestrian facilities, and transportation and land use connections, will have largely positive impacts on public health by increasing opportunities for physical activity, improving safety, and providing better access to health promoting goods and services. The Community Transportation Plan may ultimately lead to a slight reduction in car use by Decatur residents and visitors, and thus to a reduction in the negative health impacts of car use (reduced air quality from emissions, risk of accidents). But the more immediate results should be increased walking and bicycling, especially in the downtown area. Thus we would expect to see positive health impacts in the form of increased levels of physical activity and increased social capital, as Decatur residents and visitors have more opportunities to interact while walking or bicycling. The HIA resulted in the identification of some potential negative health impacts related to pedestrian and bicycle safety. Many of these negative health impacts can be eliminated or mitigated by incorporating the findings and results of the HIA during the design phase of the corridor and intersection improvements. Furthermore, to ensure that the health benefits derived from the Plan are shared with all members of the community, the City of Decatur should prioritize the consideration of the needs of groups that have limitations on their mobility due to physical and financial constraints, including children, older adults, people with disabilities, and low-income households. Recommendations Following are recommendations to promote positive health outcomes from the Community Transportation Plan. These recommendations are identified by the type of intervention, including informational approaches, behavioral and social approaches, and environmental and policy approaches.
Informational approaches include community-wide campaigns and “point-of-decision” prompts, techniques which have been evaluated in the CDC’s systematic

Pathways to a Healthy Decatur 54 Community Transportation Plan
review for the Guide to Community Preventive Services146 as having sufficient or strong evidence of their effectiveness in promoting physical activity.
Successful behavioral and social approaches to increasing physical activity include individually-adapted health behavior change, school-based physical education, and social support.
Environmental and policy approaches include the creation or enhanced access to places for physical activity combined with informational outreach, transportation policy and infrastructure changes to promote non-motorized transit, and zoning and land use amendments. To date, strong evidence that intervention results in increases in physical activity only exists for increasing access to places for physical activity. The research is not yet conclusive that transportation policy and infrastructure and zoning and land use changes effectively increase physical activity, although many planning and health researchers are confident that a connection, albeit hard to quantify, exists.
Recommendation Intervention Type Possible Actors
Make traffic safety a priority. Workshop participants frequently expressed concerns about speed on high-volume arterial roads such as Clairemont Avenue and Scott Boulevard. High-speed traffic was not only an issue for drivers but for would-be bicyclists and pedestrians who might not feel safe from traffic traveling at 50 miles per hour or more, even with the buffer of a striped bike lane or a sidewalk. However, traditional traffic-calming measures, such as speed bumps and bulb-outs, were treated with some concern that they would impede bicyclists or emergency vehicles. Explore various speed reduction strategies to meet the needs and resources of the community, including enhanced and/or target enforcement, traffic calming measures, and driver education programs.
Environmental and policy, informational
City Commission, Police Department, Public Works, PEDS
Connectivity is crucial. The participants agreed that connectivity—between bicycle paths; between bicycle paths and transit; between streets via sidewalks; and between neighborhoods and destinations—would not only make non-car modes of transportation easier and more attractive to use, but would increase social capital and a feeling of community.
Environmental and policy
City Commission, Public Works, Planning and Zoning, Community and Economic Development Departments

Pathways to a Healthy Decatur 55 Community Transportation Plan
Recommendation Intervention Type Possible Actors
Intersections should be ADA-compliant and easily crossable. Whereas the Community Transportation Plan puts more emphasis on the positioning of curbs, workshop participants were particularly concerned about ADA compliance and technological assists in crossing intersections, especially audible and visual signal countdowns to let pedestrians know how much time they have to cross.
Environmental and policy
City Development Services/Public Works, Consultant/ contractors, Georgia Department of Transportation
Emphasize the mobility of Decatur’s most vulnerable populations. As has been noted, Decatur’s vulnerable populations live throughout the city, and their mobility needs and destinations are varied. Regardless, these groups often face pressing health issues and a great potential to benefit from a multimodal transportation system. When developing final plans for particular corridors and intersections, ardently seek the input of children, older adults, people with disabilities, and low-income households and their advocates.
Environmental and policy
City Commission, City Planning & Zoning and Community & Economic Development Departments, Decatur School System, Housing Authority, Senior Housing Administrators
Bicyclists need more than just safe routes. Bicyclists were well-represented at the workshop, and Decatur can expect that its community of bicyclists will grow as it looks more into promoting bicycling as an alternative transportation mode. Participants asked that bicycling routes be not only safe but efficient enough to serve as a viable alternative to commuting by car; they also emphasized the need for maintenance facilities, showers, and bicycle racks in key locations.
Environmental and policy
City Commission, City Managers Office, Public Works, Development Services, PATH Foundation, MARTA, bicycle advocacy groups
Continue to partner with schools to promote childhood physical activity. School-based physical education has been shown to promote healthy lifestyle choices that stay with kids into adulthood. The Safe Routes to Schools (SRTS) program can act as an extension of this education and can increase physical activity levels through active travel. Continue the SRTS program and integrate other city efforts to meet the SRTS goals.
Behavioral and social, Environmental and policy
Decatur Schools, Parent/Teacher Associations, City Commission, City Managers Office, Development Services, Public Works

Pathways to a Healthy Decatur 56 Community Transportation Plan
Recommendation Intervention Type Possible Actors
Planning for alternate modes of transportation must accommodate both commuters and recreational users. This is especially true for bicyclists: someone who rides a bicycle to work needs different facilities than does someone who rides for pleasure. The former may prefer more direct routes and access to showers; the latter may want a more scenic, wandering path. Moreover, the two groups are not distinct: a pleasure rider may use commuting routes on occasion, and vice versa. If Decatur wants its citizens to reap the health benefits associated with regular bicycling, its planners and policy makers must acknowledge the needs of riders for work and for pleasure alike, and the different facilities each requires. The Community Transportation Plan begins this by adding proposed on-street routes to parks and to downtown, and a proposed trail that connects to the Decatur MARTA station.
Environmental and policy
City Public Works, Development Services
Decatur should develop a community-wide campaign to promote physical activity. In concert with the DeKalb County Board of Health, the city should begin a multi-component campaign to include strategies such as physical activity counseling and programs, risk factor screening and education, community health fairs, “walk/bike to the square” advertising for shopping and entertainment, education about newly available infrastructure to support active travel, “point-of-decision” prompts that encourage drivers to park the car and walk to the various destinations downtown, and streetscape and park design and public art that promotes physical activity.
Informational
City Community Development, DeKalb County Board of Health, Decatur Schools, community churches

Pathways to a Healthy Decatur 57 Community Transportation Plan
Recommendation Intervention Type Possible Actors
The Community Transportation Plan should be just one part of planning efforts towards a healthy Decatur. The Community Transportation Plan should not be seen as an end in itself but as one component of a greater health-promoting strategy. Workshop participants repeatedly emphasized ensuring that transportation plans, land uses, and zoning worked together to accommodate alternate transportation even as Decatur’s population grows and land uses change. Furthermore, becoming an Active Living Community requires the consideration of health issues in all sectors of city planning and implementation—housing, education, economic development, greenspace, and more—and a variety of internal and external stakeholders—city government, local institutions (educational, medical, spiritual, etc.), local community leadership and county, state, and regional government, among others.
The City can capitalize on the fact that focusing on promoting community health can build consensus among a broad constituency and can help solve problems and make the most of opportunities. To make Active Living and health issues a continued element of City efforts:
The City can adopt the community’s definition of health and use it as a goal in all planning endeavors.
City staff may be educated on the goals and principles of Active Living and partnerships with external entities can help build capacity to create healthy places.
A city staff person may be identified to serve as the point-person to help ensure that all efforts contributed to or at least not intentionally harm progress toward becoming an Active Living and healthy community.
The city can adopt targets for Active Living outcomes. For example, setting a goal for the percentage of residents who walk or bike to community events, the percentage of students who walk or bike to school, and/or the percentage of residents who regularly participate in physical activity.*
Environmental and policy
City, all commissions and departments; external partners (DeKalb Board of Health, GDOT, ARC, MARTA, Agnes Scott College, Emory University, etc.)
* See Appendix 2 for information on benchmarking and setting targets.

Pathways to a Healthy Decatur 58 Community Transportation Plan
APPENDIX 1 Decatur Community Transportation Plan Health Impact Assessment Workshop Agenda: Pathways to a Healthy Decatur
11:30-noon Pre-workshop registration (optional)
noon-12:15 Registration and Pick Up Your Lunch
12:15-12:30
Welcome to Workshop Mayor pro tem Jim Baskett, City of Decatur
12:30-12:50
Understanding Transportation and Health Dr. Howard Frumkin, Centers for Disease Control and Prevention
12:50-1:10 About the Decatur Community Transportation Plan Dr. Catherine L. Ross, Director, Georgia Tech’s Center for Quality Growth and Regional Development (CQGRD)
1:10-1:20 Purpose of the Workshop Karen Leone de Nie, Georgia Tech’s CQGRD
For the remainder of the workshop you will be working in small groups. Each group will take part in three rounds of brainstorming, with each round focusing on a different set of preliminary recommendations from the transportation planning process. The recommendations address bike and pedestrian networks, intersection redesigns, and safety strategies.
1:20-1:25 Setup small groups
1:25-1:50 Task: Round 1 Brainstorming Small groups
1:50-2:10 Task: Round 2 Brainstorming Small groups
2:10-2:30 Task: Round 3 Brainstorming Small groups
2:30-2:45 BREAK
2:45-3:15 Reporting on Group Discussions of Impacts and Recommendations Facilitators
3:15-3:30 Task: Prioritization of Recommendations to Maximize Health Benefits Small groups
3:30-3:45 Reporting on Group Discussions of Priorities (time permitting) Facilitators
3:45-4:00 Closing Remarks Mayor pro tem Jim Baskett and Dr. Catherine Ross

Pathways to a Healthy Decatur 59 Community Transportation Plan
APPENDIX 2 Decatur Community Transportation Plan Health Impact Assessment Workshop Participants * indicates facilitator/speaker Kristin Allin Community Member Annie Archbold Decatur Heights Neighborhood Association Belinda Asumda Philips Tower Elise Barrella* Georgia Tech Center for Quality Growth and Regional Development Mayor Pro Tem Jim Baskett* City of Decatur Laura Beall Georgia Regional Transportation Authority Laurie Beck* Centers for Disease Control and Prevention Saskia Benjamin* Georgia Conservancy Commissioner Fred Boykin City of Decatur Mike Breunig Director of Facilities and Maintenance City of Decatur Schools Pastor James Brewer Calvert Decatur First Christian Church Paige Brown Glennwood Estates Neighborhood Assoc. Susan Cobleigh Executive Director Decatur Preservation Alliance
Andrew Dannenberg Centers for Disease Control and Prevention Sally Dobbins Director of School Health Decatur School System Caroline Enloe DeKalb County Board of Commissioners Matt Falb Georgia Division of Public Health Mayor Bill Floyd City of Decatur Felix Floyd Facilities Maintenance Superintendent City of Decatur Dr. Howard Frumkin* Centers for Disease Control and Prevention Commissioner Kathie Gannon DeKalb County Board of Commissioners David Goldberg Community Member Amy Goodwin State Bicycle and Pedestrian Coordinator Georgia DOT Liberty Gooler Georgia Tech Center for Quality Growth and Regional Development
Michelle Hall Agnes Scott College Regan Hammond Senior Planner Atlanta Regional Commission Jeff Hancock Decatur First Mortgage Decatur Business Association Kristine Hansen-Dederick Sycamore Consulting, Inc. Jessica Harbour Doyle* Georgia Tech Center for Quality Growth and Regional Development Linda Harris Assistant Director City of Decatur Community and Economic Development Department Fleur Hartmann Community Member Bob Hascall Vice President Emory University Campus Services Dr. Mine Hashas, Ph.D.* Georgia Tech Center for Quality Growth and Regional Development Susan Hobson* Centers for Disease Control and Prevention Carla Jefferies DeKalb County Board of Health Commissioner Mary Alice Kemp City of Decatur

Pathways to a Healthy Decatur 60 Community Transportation Plan
John Keys President Decatur Town Homes Association Karen Leone de Nie* Georgia Tech Center for Quality Growth and Regional Development Sheryl Lyss Fulton County Department of Health and Wellness Heather McCarey* Georgia Tech Center for Quality Growth and Regional Development Tom McGinnis Atlanta Friends Meeting Jared McKinley Representing Congressman John Lewis Lyn Menne City of Decatur Peggy Merriss City Manager City of Decatur City Manager Mary Miller Recreation Director City of Decatur Recreation and Community Service Karen Mumford, Ph.D. Rollins School of Public Health, Emory University Andrea Neiman CDC/Global Health Promotion Michael Orta Program Manager PEDS
Carlos Pavao Community Administrator DeKalb County Board of Health Scott Pendergrast Chelsea Heights Neighborhood Paul Pierce Executive Director City of Decatur Housing Authority Rebecca Rakoczy Community Member Laura Ray Associate Vice President Emory University, Transportation and Parking Dan Reuter Land Use Division Chief Atlanta Regional Commission Thayra Riley Emory University, Transportation Ken Rose Acting Associate Director for Policy, Planning & Evaluation Centers for Disease Control and Prevention Catherine Ross, Ph.D.* Georgia Tech Center for Quality Growth and Regional Development Candace Rutt, Ph.D.* Centers for Disease Control and Prevention Liz Sanford-Stepp Sycamore Consulting, Inc.
Hugh Saxon Assistant City Manager City of Decatur Debbie Schnieder DeKalb County Board of Commissioners Derek Shendell, Ph.D. Assistant Professor GSU Institute of Public Health Rae Sirott Philips Tower Katie Sobush Centers for Disease Control and Prevention Robin Tanner Steps School Health Coordinator DeKalb County Board of Health Toronto Thomas City of Decatur Police and Fire Karen Thompkins* Community Administrator DeKalb County Board of Health Scott Thompson Community Member Amanda Thompson City of Decatur Steve Walker Georgia Department of Transportation Tom Weyandt Director of Comprehensive Planning Atlanta Regional Commission Elke Wolf Davidson Executive Director Atlanta Regional Health Forum

Pathways to a Healthy Decatur 61 Community Transportation Plan
APPENDIX 4 Safety Concepts Following are illustrations of several types of traffic calming measures proposed for the City of Decatur.
Higher Visibility Crosswalks
Active Speed Zone Signs
Radar Speed Trailer
Traffic Calming Sign & Roadway Striping
Elongated Speed Humps and Raised Crosswalks
Neighborhood Traffic Circles

Pathways to a Healthy Decatur 62 Community Transportation Plan
Center Island Narrowings
Realigned Intersections
Neckdowns
Chicane with on-street parking
Parallel Shared-use Path

Pathways to a Healthy Decatur 63 Community Transportation Plan
APPENDIX 4 Establishing Baselines and Setting Targets Setting targets begins with establishing a vision, goals, and objectives and benchmarking existing conditions. Through the Community Transportation Plan the City of Decatur has already established a vision: Make Decatur a healthy place to live and work, maintain a high quality of life, and increase opportunities to use alternative modes of transportation. The plan also outlines numerous goals and objectives (see complete City of Decatur Community Transportation Plan). Among the objectives is the creation of an Active Living Community. To evaluate the effectiveness of various interventions in achieving this objective, the City of Decatur could set targets, for example the city could establish a target of 50% of students walking or biking to school by 2010. Such targets will help community leaders track successes in increasing physical activity levels for adults and children. Before targets can be adopted baseline data on existing conditions is needed. Various data sources can be used to establish baselines, including national, state, county, and local data. Although local data is preferred, it is often cost-prohibitive for communities to collect new data; therefore, data available at larger scales may be used. Some sources of baseline data include the Survey of Decatur Adults Regarding Transportation Issues (conducted as part of the Community Transportation Plan process), the DeKalb County Board of Health BRFSS and YRFSS, the national BRFSS, vital statistics, National Health Interview Survey, the National Household Travel Survey, and Census data. Tables A1 and A2 provide an overview of some of the data available to assess existing conditions. Next, targets can be adopted by the City of Decatur based on local priorities or using state and national goals. National targets for physical activity have been established for Healthy People 2010, a nationwide health promotion and disease prevention agenda by the Department of Health and Human Services. For example, Healthy People 2010 has set a target of 50% of the national adult population participating in moderate physical activity on a regular basis. The 1997 national baseline shows that only 32% of the population currently meets this objective, but DeKalb County’s adult population exceeds this goal with 73.5% regularly participating in moderate physical activity. In such cases, the City of Decatur may elect to set more ambitious targets than those established nationally.* The following tables outline several potential objectives, baseline data, and national targets related to physical activity.
* For more information on establishing health indicators and targets see the Healthy People 2010 Toolkit available at http://www.healthypeople.gov/state/toolkit/default.htm.

Pathways to a Healthy Decatur 64 Community Transportation Plan
Table A1: Baselines and potential targets for an Active Living Community, adults
Objective Healthy People 2010
Decatur Survey (2007)
DeKalb BRFSS (2001)
Census (2000)*
Healthy People 2010 Target
Participate in moderate, regular physical activity (ages 18 years and
over)
32.0% (1997)
- 73.5% - 50.0%
Participate in vigorous physical activity (ages 18 years and over)
23.0% (1997)
- 45.8% - 30.0%
Participate in community walking, trips of one mile or less (ages 18 years and over)
17.0% (1995)
- - - 25.0%
Participate in community bicycling, trips of 5 mile or less (ages 18 years and over)
0.6% (1995)
- - - 2.0%
Walk to work or school (ages 18 years and over)**
- 8.0% - - -
Bicycle to work or school (ages 18 years and over)**
- 2.0% - - -
Take a train or bus to work or school (ages 18 years and over)**
- 11.0% - - -
Walk for errands and leisure activities (ages 18 years and over)
- 8.0% - - -
Bicycle for errands and leisure activities (ages 18 years and over)
- 1.0% - - -
Take a train or bus for errands and leisure activities (ages 18 years and over)
- 8.0% - - -
Walk to work*** - - - 6.1% - Bicycle to work*** - - - 0.2% - Take a train or bus to work*** - - - 10.7% -
* Boundaries for this data are City of Decatur ** Of the adults who work or study outside the home (according to the Survey of Decatur Adults Regarding Transportation Issues 66% of adults work or study outside the home). *** Of the adults who work outside the home.
Table A2: Baselines and potential targets for an Active Living Community, children and adolescents
Objective Healthy People 2010
Decatur Survey (2007)
DeKalb YRFSS (2003)
Healthy People 2010 Target
Participate in moderate, regular physical activity (students in grades 9 through 12)
27.0% (1999)
23.2% 35.0%
Participate in vigorous, regular physical activity (students in grades 9 through 12)
65.0% (1999)
57.9% 85.0%
Participate in community walking, trips to school of one mile or less (ages 5 to 15 years)
31.0% (1995)
50.0%
Participate in community bicycling, trips to school of 2 mile or less (ages 5 to 15 years)
2.4% (1995)
5.0%

Pathways to a Healthy Decatur 65 Community Transportation Plan
APPENDIX 5 References 1 World Health Organization (1999). Brussels: Health Impact assessment: Main concepts and suggested approach. Gothenburg Consensus Paper. 2 Ibid. 3 Ison, E. (2000). Resource for Health Impact Assessment, Volume 1. London: NHS Executive.
4 Illustration created by CQGRD.
5 Krieger, J., & Higgins, D. L. (2002). Housing and health: time again for public health action. American Journal Of Public Health, 92(5 (Print)), 758–768.
6 Fehr, R. (1999). Environmental Health Impact Assessment. Epidemology, 10(5).
7 Ison, op.cit. 8 Concept developed by Healthy People 2010, www.healthypeople.gov; visualization by CQGRD.
9 Hoch, C. J., Dalton, L. C., & So, F. S. (2000). The Practice of Local Government Planning. International City/County Management Association (ICMA), Washington, DC.
10 Ibid. 11 Schilling, J., JD, LLM , & Linton, L. S., JD, MPH. (2005). The Public Health Roots of Zoning: In Search of Active Living’s Legal Genealogy. American Journal of Preventive Medicine, 28.
12 Centers for Disease Control and Prevention, "A Tool Kit to Prevent Senior Falls." Retrieved November 22, 2006, from http://www.cdc.gov/ncipc/factsheets/falls.htm.
13 Mokdad, A., Marks, J. Stroup, D., and Gerberding, J. (2004). Actual causes of death in the United States, 2000. JAMA. 291 (10): 1238-45.
14 Colditz, GA. (1999). Economic costs of obesity and inactivity. Med Sci Sprots Exerc. (suppl 11): S663-S667.
15 Booth, K. M., Pinkston, M. M., & Poston, W. S. C. (2005). Obesity and the Built Environment. Journal of the American Dietetic Association, 105(5, Supplement 1), 110–117.
16 Ewing, R., & Kreutzer, R. (2006). Understanding the Relationship Between Public Health and the Built Environment: A Report Prepared for the LEED-HD Core Committee: US Green Building Council.
17 Frank, L. (2004). Economic Determinants of Urban Form: Resulting Trade-Offs between Active and Sedentary Forms of Travel. American Journal of Preventive Medicine, 27(3, Supplement 1), 146–153.
18 Frank, L. D., Andresen, M. A., & Schmid, T. L. (2004). Obesity relationships with community design, physical activity, and time spent in cars. American Journal of Preventive Medicine, 27(2), 87–96.
19 Frank, L., Engelke, P., & Schmid, T. (2003). Health and Community Design: The impact of the Built Environment on Physical Activity. Washington, DC: Island Press.
20 Hinde, S., & Dixon, J. (2005). Changing the Obesogenic Environment: Insights from a Cultural Economy of Car Reliance. Transportation Research Part D: Transport and Environment, 10(1), 31–53.
21 Centers for Disease Control and Prevention. http://www.cdc.gov/nccdphp/dnpa/physical/importance/index.htm. Last accessed on November 13, 2006.
22 Flournoy, R. (2002). Regional Development and Physical Activity: Issues and Strategies for Promoting Health Equity. PolicyLink. 2002.
23 Ewing, R. and R. Kreutzer. (2006). Understanding the Relationship Between Public Health and the Built Environment: A Report Prepared for the LEED-HD Core Committee. US Green Building Council. May 2006.
24 Lavin, T., C. Higgins, O. Metcalfe, and A. Jordan. (2006). Health Impacts of the Built Environment: A Review. Institute of Public Health in Ireland. July 2006.

Pathways to a Healthy Decatur 66 Community Transportation Plan
25 Ewing, R. and R. Kreutzer. (2006). Understanding the Relationship Between Public Health and the Built Environment: A Report Prepared for the LEED-HD Core Committee. US Green Building Council. May 2006.
26 Garrow, L. A., M. D. Meyer, C. L. Ross, and T. D. Bodea (2006). The Influence of Socio-Demographic and Built Environment Characteristics on the Liklihoods of Being Overweight and Obese: A Cautionary Tale. Paper under review by the Journal of the American Planning Association. 27 Lavin, T., C. Higgins, O. Metcalfe, and A. Jordan. (2006). Health Impacts of the Built Environment: A Review. Institute of Public Health in Ireland. July 2006.
28 Ewing, R. and R. Kreutzer. (2006). Understanding the Relationship Between Public Health and the Built Environment: A Report Prepared for the LEED-HD Core Committee. US Green Building Council. May 2006.
29 ICMA. (2005). Active Living and Social Equity: Creating Healthy Communities for all Residents. A Guide for Local Governments. International City/County Management Association. January 2005.
30 Moudon, A. V., Hess, P. M., Snyder, C., & Stanilov, K. (1997). Effects of site design on pedestrian travel in mixed-use, medium density environments. Transportation Research Record, 1578, 48–55.
31 Frank, L. D., & Engelke, P. O. (2001). The built environment and human activity patterns: exploring the impacts of urban form on public health. Journal of Planning Literature, 16(2), 202–218.
32 Newman, P. W. G., & Kenworthy, J. R. (1989). Gasoline consumption and cities: A comparison of U.S. cities with a global survey. Journal of the American Planning Association, 55, 24–37.
33 Holtzclaw, J. (1990). Explaining urban density and transit impacts on auto use. San Francisco, CA: Sierra Club.
34 Dunphy, R., & Fisher, K. (1994). Transportation, congestion, and density: New insights. Transportation Research Record, 1552, 89–96.
35 Frank, L. D., & Pivo, G. (1994). Impacts of mixed use and density on utilization of three modes of travel: single occupant vehicle, transit, and walking. Transportation Research Record, 1466, 44–52.
36 Holtzclaw, J. (1994). Using residential patterns and transit to decrease auto dependence and costs. San Francisco, CA: Natural Resources Defense Council.
37 Kockelman, K. M. (1997). Travel behavior as function of accessibility, land use mixing, and land use balance: Evidence from San Francisco Bay Area. Washington, D.C: Transportation Research Record.
38 Pushkarev, B., & Zupan, J. M. (1997). Public Transportation and Land Use Policy. Bloomington, IN: Indiana University Press.
39 Besser, L. M., & Dannenberg, A. L. (2005). Walking to public transit: steps to help meet physical activity recommendations. AMerican Journal of Preventive Medicine, 29(4), 273–280.
40 Frank, L., Sallis, J. F., Conway, T. L., Chapman, J. E., Saelens, B. E., & Bachman, W. (2006.). Many Pathways fromLand Use to Health. Journal of the American Planning Association, 72(1), 75–87.
41 Saelens, B., Sallis, J., Black, J., & Chen, D. (2003). Neighborhood-based differrences in physical activity: An environmental scale evaluation. American Journal of Public Health, 93(1552–1558).
42 ICMA, op. cit. 43 Lavin, T., C. Higgins, O. Metcalfe, and A. Jordan. (2006). Health Impacts of the Built Environment: A Review. Institute of Public Health in Ireland. July 2006.
44 Mace, R., Hardie, G., & Place, J. (1991). Accessible environments: toward universal design. In E. White (Ed.), Innovation by Design. New York: Van Nostrand Reinhold.
45 CUD. (1997). Principles of Universal Design. Retrieved March 5, 2005, from http://www.design.ncsu.edu/cud/univ_design/princ_overview.htm
46 ICMA (2005), op.cit.

Pathways to a Healthy Decatur 67 Community Transportation Plan
47 Feskanich, D., Willett, W., & Colditz, G. (2002). Walking and Leisure-Time Activity and Risk of Hip Fracture in Postmenopausal Women. JAMA, 288(18), 2300-2306.
48 Tudor-Locke, C., Neff, L. J., Ainsworth, B. E., Addy, C. L., & Popkin, B. M. (2002). Omission of active commuting to school and the prevalence of children's health-related physical activity levels: the Russian Longitudinal Monitoring Study. Child Care Health Dev., 28(6), 507-512.
49 Miller, M. (2000). Physical Activity, functional limitations and disability in older adults. Journal of the American Geriatric Society 48: 1264-1272.
50 Feskanich et al., op.cit. 51 King, A. C., Castro, C., Wilcox, S., Eyler, A. A., Sallis, J. F., & Brownson, R. C. (2000). Personal and environmental factors associated with physical inactivity among different racial-ethnic groups of U.S. middle-aged and older-aged women. Health Psychol., 19(4), 354-364.
52 Miller, op.cit. 53 Shephard, R. J. (1997). Aging, physical activity, and health. Champaign, IL: Human Kinetics.
54 Brach, JS, S FitzGerald, AB Newman, S Kelsey, L Kuller, JM Van Swearingen, and AM Kriska. (2003). Physical activity and functional status in community-dwelling older women: A 14 year prospective study. Archives of Internal Medicine 163(21): 2565-71.
55 di Pietro, L. (1996). The epidemiology of physical activity and physical function in older people. Medicine & Science in Sports & Exercise. 28(5):596-600.
56 Ettinger, W.H. Jr,, R. Burns, S. P. Messier, W. Applegate, W. J. Rejeski, T. Morgan, S. Shumaker, M. J. Berry, M. O'Toole, J. Monu and T. Craven. (1997). A randomized trial comparing aerobic exercise and resistance exercise with a health education program in older adults with knee osteoarthritis. JAMA 277: 25-31.
57 Spirduso, W. W., and D. L. Cronin. (2001). Exercise dose-response effects on quality of life and independent living in older adults. Med. Sci. Sports Exerc. Vol. 33, No. 6, Suppl.: S598-S608.
58 Hillsdon MM, Brunner EJ, Guralnik JM, Marmot MG. (2005). Prospective study of physical activity and physical function in early old age. Am J Prev Med. Apr;28(3):323-4.
59 Frank, Engelke & Schmid, op.cit. 60 Fänge, A., S Iwarsson, and A Perrson. (2002). Accessibility to the public environment as perceived by teenagers with functional limitations in a south Swedish town centre. Disability and Rehabilitation 24(6): 318 - 326.
61 Kirschbaum, J. B., Axelson,P. W., Longmuir, P. E., Mispagel, K. M., Stein, J. A., and Yamanda, D. A. (2001). Designing Sidewalks and Trails for Access Part II of II: Best Practices Design Guide. US Dept of Transportation.
62 Matthews, H. and Vujakovic, P. 1995. Private worlds and public places: mapping the environmental values of wheelchair users. Environment and Planning A, 27(7): 1069-83.
63 Meyers, A., Anderson, J. Miller, D. R., Shipp, K., and Hoenig, H. (2002). Barriers, facilitators, and access for wheelchair users: substantive and methodologic lessons from a pilot study of environmental effects. Social Science and Medicine 55(8): 1435-46.
64 Shumway-Cook, A., Patla, A., Stewart, A., Ferrucci, L., Ciol, M. A., and Gurainik, J. M. (2002). Environmental demands associated with community mobility in older adults with and without mobility disabilities. Physical Therapy 82(7): 670-81.
65 Shumway-Cook, A., Patla, A., Stewart, A., Ferrucci, L., Ciol, M. A., and Gurainik, J. M. (2003). Environmental Components of Mobility Disability in Community-Living Older Persons. Journal of the American Geriatrics Society 51(3): 393-8.
66 Lawson, C. T. and K. K. Davison Do attributes in the physical environment influence children's physical activity? A review of literature, Submitted to Annals of Behavioral Medicine.

Pathways to a Healthy Decatur 68 Community Transportation Plan
67 Sallis JF, Prochaska JJ, Taylor WC. (2000). A Review of Correlates of Physical Activity of Children and Adolescents. Medicine and Science in Sports and Exercise, 32:963-975.
68 Handy, S. (2004). Community Design and Physical Activity: What Do We Know? - And What DON'T We Know? Obesity and the Built Environment: Improving Public Health through Community Design, Washington, DC.
69 Jacobsen, P., Anderson, C. L., Winn, D. G., Moffat, J., Agran, P. F., & Sarkar, S. (2000). Child Pedestrian Injuries on Residential Streets: Implications for Traffic Engineering. ITE Journal, 71-75.
70 Bhatia, R., T. Rivard and E. Seto. (2006). Oak to Ninth Avenue Health Impact Assessment: Public Review Draft. UC Berkley Health Impact Group. May 2006.
71 Ibid. 72 Flournoy, R. (2002). Regional Development and Physical Activity: Issues and Strategies for Promoting Health Equity. PolicyLink. 2002.
73 Lavin, T., C. Higgins, O. Metcalfe, and A. Jordan. (2006). Health Impacts of the Built Environment: A Review. Institute of Public Health in Ireland. July 2006.
74 Dannenberg, A. L., R. J. Jackson, H. Frumkin, R. A. Schreiber, M. Pratt, C. Kochtitzky, H. H. Tilson. 2003. The Impact of Community Design and Land-Use Choices on Public Health: A Scientific Research Agenda. American Journal of Public Health. 0090–0036. September 1, 2003. Vol. 93. Issue 9.
75 Ewing, R. and R. Kreutzer. (2006). Understanding the Relationship Between Public Health and the Built Environment: A Report Prepared for the LEED-HD Core Committee. US Green Building Council. May 2006.
76 Dannenberg, A. L., R. J. Jackson, H. Frumkin, R. A. Schreiber, M. Pratt, C. Kochtitzky, H. H. Tilson. (2003). The Impact of Community Design and Land-Use Choices on Public Health: A Scientific Research Agenda. American Journal of Public Health. 0090–0036. September 1, 2003. Vol. 93. Issue 9.
77 “Traffic Proximity and Density-Related Health Effects: Summary of Recent Research,” Background information summary document, Workshop on Traffic, Health, and Infrastructure Planning, 1–3 Feb 2004, Johns Hopkins Bloomberg School of Public Health, http://www.jhsph.edu/RiskSciences/_pdf/he_background_summary.pdf.
78 Health Effects Institute (1999). The Health Effects of Fine Particles: Key Questions and the 2003 Review. Communication # 8. Available online: http://www.healtheffects.org/Pubs/Comm8.htm Last accessed: December 2006.
79 Lippmann, M., K. Ito, et al. (2002). Association of Particulate Matter Components with Daily Mortality and Morbidity in Urban Populations., Health Effects Institute.
80 Health Effects Institute (1999). The Health Effects of Fine Particles: Key Questions and the 2003 Review. Communication # 8. Available online: http://www.healtheffects.org/Pubs/Comm8.htm Last accessed: December 2006.
81 Brunekreef, B. and S. Holgate (2002). "Air pollution ahd Health reivew." The Lancet 360: 1233-1242.
82 Bhatia, R., T. Rivard and E. Seto. (2006). Oak to Ninth Avenue Health Impact Assessment: Public Review Draft. UC Berkley Health Impact Group. May 2006. Available online: http://ehs.sph.berkeley.edu/hia/ Last accessed November 2006
83 Gauderman, W. J., E. Avol, et al. (2004). "The Effect of Air Pollution on Lung Development from 10 to 18 Years of Age." New England Journal of Medicine. 351(11): 1057-1067.
84 Gauderman, W. J., R. McConnell, et al. (2000). "Association between Air Pollution and Lung Function Growth in Southern California Children." American Journal of Respiratory and Critical Care Medicine 162(4): 1383-1390.
85 Barnett, A. G., G. M. Williams, et al. (2006). "The Effects of Air Pollution on Hospitilizations for Cardiovascualr Disease in Elderly People in Australian and New Zeland Cities." Environmental Health Perspectives 114(7).

Pathways to a Healthy Decatur 69 Community Transportation Plan
86 Mar, T. F., J. Q. Koenig, et al. (2005). "Fine Particulate Air Pollution and Cardiorespiratory Effects in the Elderly." Epidemiology 16(5): 681-687.
87 Health Effects Institute (1999). The Health Effects of Fine Particles: Key Questions and the 2003 Review. Communication # 8. Available online: http://www.healtheffects.org/Pubs/Comm8.htm Last accessed: December 2006.
88 Health Effects Institute (2001). Airborne Particles and Health: HEI Epidemilogical Evidence. HEI Perspectives. June 2001. Available online: http://pubs.healtheffects.org/getfile.php?u=243 Last accessed: December 2006.
89 Houston, D., J. Wu, et al. (2006). "Down to the Meter: Localized Vehicle Pollution Matters." Access 29(Fall 2006): Univeristy of California Transportation Center.
90 Fischer, P., G. Hoek, et al. (2000). "Traffic-related differences in outdoor and indoor concentrations of particles and volatile organic compounds in Amsterdam." Atmospheric Environment 34: 3713-3722.
91 Adler, N. E. and K. Newman. (2002). Socioeconomic Disparities in Health: Pathways and Policies. Inequality in education, income, and occupation exacerbates the gap between the “haves” and the “have-nots.” Health Affairs. March/April 2002. Vol. 21, No. 2.
92 Lavin, T., C. Higgins, O. Metcalfe, and A. Jordan. (2006). Health Impacts of the Built Environment: A Review. Institute of Public Health in Ireland. July 2006.
93 Dannenberg, Jackson et al., op.cit. 94 Kawachi, 1999. “Social Capital and Community Effects on Population and Individual Health. Annals of New York Academy of Sciences, v. 896; 120-130 AND
Hawe, P. King, L. Noort, M. Jordens, C. and Lloyd B. 2000. “Indicators to Help with Capacity Building in Health Promotion. NSW Health Department.
95 Kaplan, 1998; House, et al., 1988; Berkman, 1995; Berkman, 1979; Seeman et al., 1987; Kawachi et al., 1999; Berkman et al., 2000; Kawachi & Berkman, 2001; Brummett et al., 2001
96 Ewing, R. and R. Kreutzer. (2006). Understanding the Relationship Between Public Health and the Built Environment: A Report Prepared for the LEED-HD Core Committee. US Green Building Council. May 2006.
97 Ewing, R. and R. Kreutzer. (2006). Understanding the Relationship Between Public Health and the Built Environment: A Report Prepared for the LEED-HD Core Committee. US Green Building Council. May 2006. AND Adler, N. E. and K. Newman. (2002). Socioeconomic Disparities in Health: Pathways and Policies. Inequality in education, income, and occupation exacerbates the gap between the “haves” and the “have-nots.” Health Affairs. March/April 2002. Vol. 21, No. 2.
98 Ewing and Kreutzer, op.cit. 99 Ibid. 100 Lavin, T., C. Higgins, O. Metcalfe, and A. Jordan. (2006). Health Impacts of the Built Environment: A Review. Institute of Public Health in Ireland. July 2006.
101 Bhatia, R., T. Rivard and E. Seto. (2006). Oak to Ninth Avenue Health Impact Assessment: Public Review Draft. UC Berkley Health Impact Group. May 2006.
102 Ibid. 103 Ellen, I.G., Mijanovich, T., Dillman, K.N. 2001. “Neighborhood Effects on Health: Exploring the links and Assessing the Evidence.” Journal of Urban Affairs. 23(3–4): 391–408.
104 CDC. (2001). MMWR/Recommendations and Reports. Vol. 50. No. RR-18.
105 Davidson, J. (2005). Epidemiology and outcome of bicycle injuries presenting to an emergency department in the United Kingdom. European Journal of Emergency Medicine, 12, 24–29.

Pathways to a Healthy Decatur 70 Community Transportation Plan
106 Eilert-Petersson, E., & Schelp, L. (1997). An epidemiological study of bicycle-related injuries. Acc Annal Prev, 363–372.
107 Davidson, op.cit. 108 Tucci, J., & Barone, J. (1988). A study of urban bicycling accidents. American Journal of Sports Medicine, 16, 181–184.
109 Lott, D. F., & Lott, D. Y. (1976). Effect of bike lanes on ten classess of bicycle-automobile accident in Davis, California. Journal of Safety Research, 8, 171–179.
110 Wener, R. E., & Evans, G. W. (2007). A Morning Stroll: Levels of Physical Activity in Car and Mass Transit Commuting. Environment & Behavior, 39(1), 62–72.
111 Besser and Dannenberg, op.cit. 112 Staunton, C. E., Hubsmith, D., & Kallins, W. (2003). Promoting Safe Walking and Biking to School: The Marin County Success Story. American Journal Of Public Health, 93, 1431–1434.
113 Andersen, L. B., Schnohr, P., Schroll, M., & Hein, H. O. (2000). All-cause mortality associated with physical activity during leisure time, work, sports, and cycling to work. Arch.Intern.Med., 160(11), 1621–1628.
114 Cooper, A. R., Page, A. S., Foster, L. J., & Qahwaji, D. (2003). Commuting to school: are children who walk more physically active? Am.J.Prev.Med., 25(4), 273–276.
115 Sesso, H. D., Paffenbarger, R., Ha, T., & Lee, I. (1999). Physical activity and cardiovascular disease risk in middle-aged and older women. American journal of epidemiology, 150(4), 408–416.
116 Retting, R. A., Fergurson, S. A., & McCartt, A. T. (2003). A review of evidence-based traffic engineering measures designed to reduce pedestrian-motor vehicle crashes. American Journal Public Health, 93, 1456–1463.
117 NHTSA (2005). Traffic Safety Facts 2004. D. C. Washington, US Department of Transportation.
118 Ewing and Kreutzer (2006), op.cit. 119 King, A. C., Jeffery, R. W., Fridlinger, F., Dusenbury, L., Provence, S., & Hedlund, S. A. (1997). Environmental and policy approaches to cardiovascular disease prevention through physical activity: Issues and opportunities. Health Educ.Q., 22, 499–511.
120 Swinburn, B., Egger, G., & Raza, F. (1999). Dissecting obesogenic environments: the development and application of a framework for identifying and prioritizing environmental interventions for obesity. Preventive medicine, 29(6 Pt 1), 563–570.
121 Humpel, N., Marshall, A. L., Leslie, E., Bauman, A., & Owen, N. (2004). Changes in neighborhood walking are related to changes in perceptions of environmental attributes. Ann.Behav.Med., 27(1), 60–67.
122 Frank, Andresen, & Schmid, op.cit. 123 Farouki, O.T. and Nixon, W.J. (1976). The Effect of Width of Suburban Roads on the Mean Free Speed of Cars. Traffic Engineering and Control, Vol. 17, pp. 518-519.
124 Heimbach, C.L., Cribbins, P.D., and Chang, M.S. (1983). Some Partial Consequences of Reduced Traffic Lane Widths on Urban Arterials. Transportation Research Record 923. pp 69-72.
125 Clark, J.E. (1985). High Speeds and Volumes on Residential Streets: An Analysis of Physical Street Characteristics as Causes in Sacramento, California. ITE 1985 Compendium of Technical Papers, Institute of Transportation Engineers, Washington, D.C. pp. 93-96.
126 Harwood, D.W. (1990). Effective Utilization of Street Width on Urban Arterials. National Cooperative Highway Research Program Report 330. Transportation Research Board, National Research Council, Washington, D.C.
127 Gattis, J.L. (2000). Urban Street Cross Section and Speed Issues. Transportation Research E-Circular. Transportation Research Board.

Pathways to a Healthy Decatur 71 Community Transportation Plan
128 Fitzpatrick, K., Carlson, P., Brewer, M., and Wooldridge, M. (2001). Design
Factors that Affect Driver Speed on Suburban Streets. Transportation Research Record 1751. pp. 18-25.
129 Leaf, W. A., & Preusser, D. F. (1999). Literature review on vehicle travel speeds and pedestrian injuries.
130 Anderson, R., McLean, A. J., Marmer, M. J. B., Lee, B. H., & Brooks, C. G. (1997). Vehicle travel speed and the incidence of fatal pedestrian crashes. Acc Annal Prev, 29, 667–674.
131 Jacobsen, P. L. (2003). Safety in numbers: more walkers and bicyclists, safer walking and bicycling. Inj.Prev., 9(3), 205–209.
132 Robinson, D. (2005). Safety in numbers in Australia: more walkers and bicyclists, safer walking and bicycling. Health Promotion Journal 16, 47–51.
133 Garder, P., Leden, L., & Pulkkien, U. (1998). Measuring the safety effect of raised bicycle crossings using a new reseach methodology. Transport Res Record, 1636, 64–70.
134 ICMA (2005), op.cit. 135 de Vries, S. I., Bakker, I., Hopman-Rock, M., Hirasing, R. A., & van Mechelen, W. (2006). Clinimetric review of motion sensors in children and adolescents. Journal of clinical epidemiology, 59(7), 670–680.
136 Texas Transportation Institute. (1982). On Street Parking. Synthesis of Safety Research Related to Traffic Control and Roadway Elements. Federal Highway Administration. Washington, D.C. Chapter 9.
137 Box, PC. (2000). Curb Parking Findings Revisited. Transportation Research E-Circular. Transportation Research Board. Pp.B5/1-8.
138 Milton, J. and Mannering, F. (1998) The Relationship Among Highway Geometrics, Traffic-Related Elements and Motor-Vehicle Accident Frequencies. Transportation. 25. pp. 395-413.
139 Sawalha, Z. and Sayed, T. (2001). Evaluating Safety on Urban Arterial Roadways. Journal of Transportation Engineering. 127(2). pp. 151-158.
140 Vitaliano, D.F. and Held, J. (1991). Road Accident External Effects: An Empirical Assessment. Applied Econometrics. 23. pp. 373-378.
141 Noland, R. B., and Oh, L. (2004). The Effect of Infrastructure and Demographic Change on Traffic-Related Fatalities and Crashes: A Case Study of Illinois County-Level Data. Accident Analysis and Prevention 36. pp. 525-532.
142 Ewing. (1999). Traffic Calming State of the Practice. Institute of Transportation Engineers, Washington, D.C.
143 Ibid.
144 Passchier-Vermeer and Passchier. (2000). Noise Exposure and Public Health. Environmental Health Perspectives. Vol. 108. Supplement 1: Reviews in Environmental Health. pp. 123-131
145 Ibid
146 The Guide to Community Preventive Services serves as a filter for scientific literature on specific health problems. The Community Guide summarizes what is known about the effectiveness, economic efficiency, and feasibility of interventions to promote community health and prevent disease. The Task Force on Community Preventive Services makes recommendations for the use of various interventions based on the evidence gathered in the rigorous and systematic scientific reviews of published studies conducted by the review teams of the Community Guide. The Community Guide is developed by the non-federal Task Force on Community Preventive Services, whose members are appointed by the Director of the Centers for Disease Control and Prevention. The Guide is available at http://www.thecommunityguide.org/.