pathways linking education to midlife correlates …...pathways linking education to midlife...
TRANSCRIPT
Pathways Linking Education to Midlife Correlates of AD: Using Longitudinal Data
Chandra Muller
Department of Sociology & Population Research Center University of Texas at Austin

Overview
• Explanations for education gradient in health and the role(s) of schools
• What do schools do? • What are high quality schools? • How are schools organized?
• Evidence for school effects • School effects over the life course • Implications of school effects and the changing economy
Supplemental slides

Explanations for the education gradient in health & aging • Selection: Schools sort students according to background
• Selection determines educational achievement & attainment • Education serves as a credential to reproduce social inequality
• School Effects: Schools provide access to opportunities that change people and impact achievement & attainment
• Teach skills—cognitive and non-cognitive • Impart knowledge and information • Provide social networks and peers to reinforce or disrupt learning
• Teach students how to engage in lifelong learning, enabling individuals to
engage with other institutions over the life course

Opportunities to Learn in Formal and Informal Institutions over the Life Course
Pre-school
K-12 Higher Educ
Work & Occupation Lifestyle, Activities, Relationships in Civic, Religious, Community
Cognition (& correlates) at Older Age
NEIGHBORHOOD
FAMILY
Individual

What do effective schools do? Provide academically rich learning opportunities for students
Provide & foster: • Academically rigorous courses • Developmentally appropriate curriculum that builds toward
developing advanced skills and knowledge • Social climate to motivate students to engage in learning • Teachers, administrators and staff who are knowledgeable
and take students’ needs into account

Evidence of School Effects • Pre-school
• Results from experiments (e.g., Perry Pre-school) • Debate over “fade-out”
• Kindergarten through High School (partial list of evidence) • Summer set back • Catholic schools and “academic press” • Academic achievement (test scores, grades, coursework) • Class size (e.g., Tennessee Star) • Compulsory school laws • Debate over heterogeneous effects
• Higher Education • Four year college degree (bachelor’s degree or more) • Vocational college

How are schools organized?
• Age graded—as students age: • Schools may get larger, less
neighborhood based • Greater complexity of curriculum and
social dynamics • More within school stratification • More structured evaluation of
success and failure • Compulsory through high school • High school to college is crucial
transition for lifelong stratification • High school courses, esp math,
determine success in higher ed
Pre-school Kinder-12
Higher
Education
Early Childhood Childhood & Adolescence
Early Adulthood

High School Academic Organization: Courses
Algebra II Advanced Science
Foreign Language
Honors English
Honors Social
Studies
General Math
General Science
Foreign Language
Basic English
Basic Social
Studies -100%
-80%
-60%
-40%
-20%
0%
20%
40%
60%
80%
100%
1982 1990 1994 1998 2000 2005 2009
Bel
ow S
tand
ard
- At o
r Abo
ve S
tand
ard
High School Graduation Year
Below Standard Standard Midlevel RigorousSource: J. M. Carroll & C. Muller. Forthcoming. “Curricular Differentiation and Its Impact on Different Status Groups Including Immigrants and Students with Disabilities.” in Handbook of Sociology of Education.
Trends in high school curriculum levels taken by high school graduates from 1982 to 2009

High School Mathematics
Highest Level Mathematics Course Taken by the End of High School (%), HS&B, Class of 1982
28.7
20 14
22.7
14.7
05
101520253035
Percentage of Students Taking No Math Course
0%
10%
20%
30%
40%
50%
60%
1982 1992 2004 2013
HSB NELS ELS HSLS
Did NotTake MathSenior Year
Didn't TakeMath Junioror SeniorYear

High School Math Coursework and Early Adult Labor Force Outcomes
• A natural experiment in Denmark, Joensen and Nielsen (2009). Advanced math coursework ->
30% higher incomes in early adulthood. The most likely mechanism is development of knowledge and skills and it operates partially (but not entirely) through higher education.
• HS&B, Rose and Betts (2001, 2004) Advanced math coursework -> higher wages at age 27. An important threshold in determining higher wages was whether or not students completed Algebra 1 and geometry by the end of high school. Math coursework explained the wage gap by parents’ SES.
• NLSY97, Levine and Zimmerman (1995) Advanced math coursework -> technology occupations and higher wages.
• 1958 British Cohort Study, Dolton and Vignoles (2002) and 1970 British Cohort Study, Adkins and Noyes (2016) Advanced math coursework -> higher earnings at age 33. A threshold is Algebra.
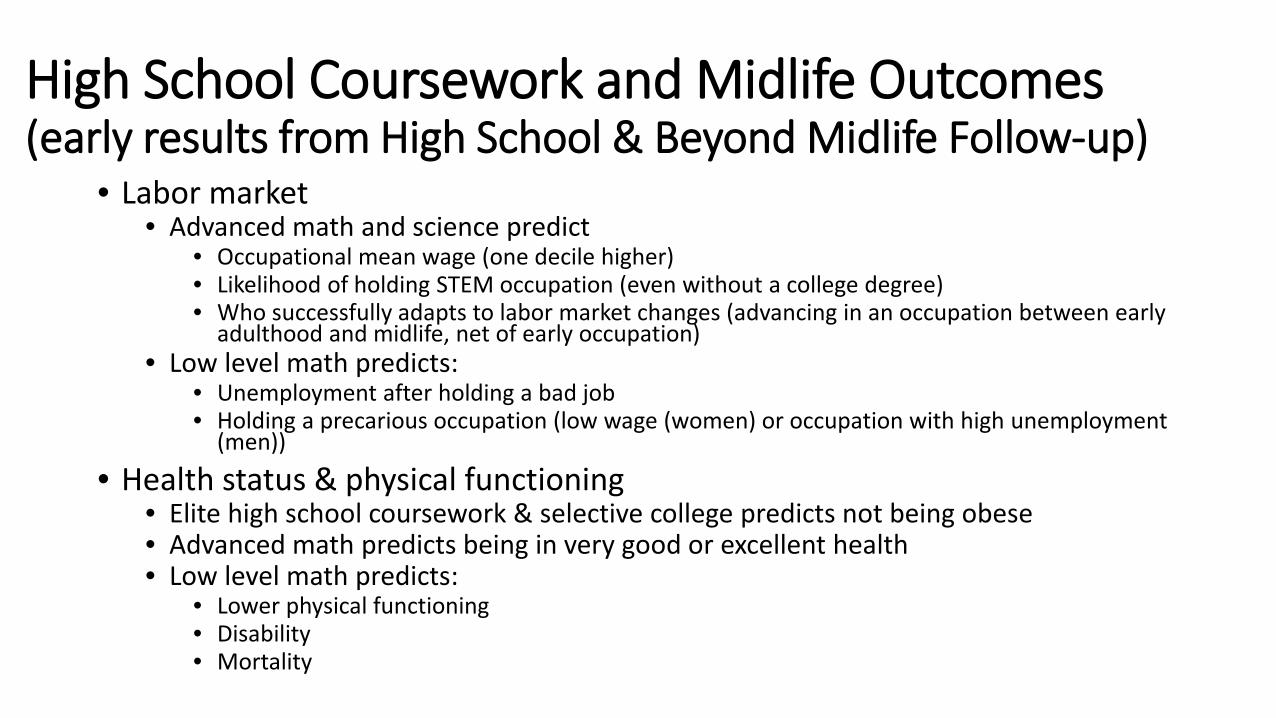
High School Coursework and Midlife Outcomes (early results from High School & Beyond Midlife Follow-up)
• Labor market • Advanced math and science predict
• Occupational mean wage (one decile higher) • Likelihood of holding STEM occupation (even without a college degree) • Who successfully adapts to labor market changes (advancing in an occupation between early
adulthood and midlife, net of early occupation) • Low level math predicts:
• Unemployment after holding a bad job • Holding a precarious occupation (low wage (women) or occupation with high unemployment
(men))
• Health status & physical functioning • Elite high school coursework & selective college predicts not being obese • Advanced math predicts being in very good or excellent health • Low level math predicts:
• Lower physical functioning • Disability • Mortality
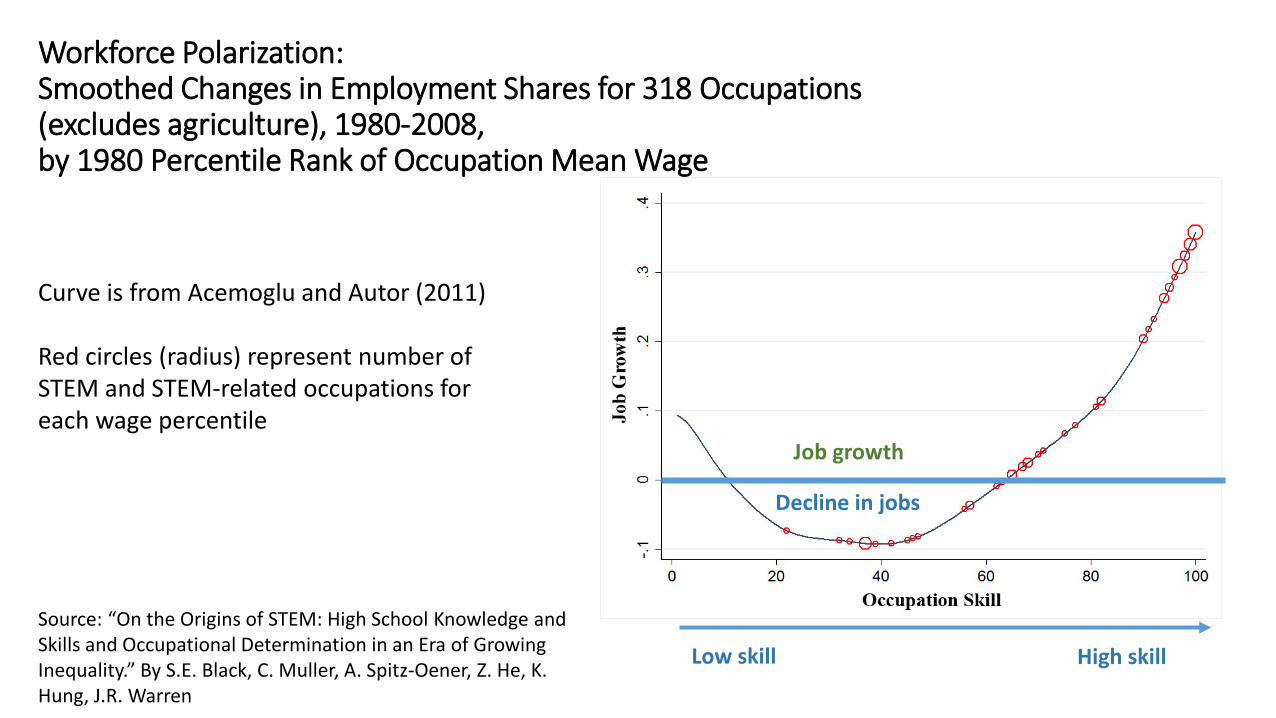
Workforce Polarization: Smoothed Changes in Employment Shares for 318 Occupations (excludes agriculture), 1980-2008, by 1980 Percentile Rank of Occupation Mean Wage
Source: “On the Origins of STEM: High School Knowledge and Skills and Occupational Determination in an Era of Growing Inequality.” By S.E. Black, C. Muller, A. Spitz-Oener, Z. He, K. Hung, J.R. Warren
Curve is from Acemoglu and Autor (2011) Red circles (radius) represent number of STEM and STEM-related occupations for each wage percentile
Decline in jobs
Job growth
Low skill High skill

Implications of Workforce Polarization for Cognitive Aging • To the extent that jobs offer individuals opportunities to learn and
continue to grow intellectually, the greater polarization of the workforce means that a very large share of the mid-adult workforce will be in low-skill jobs that offer fewer opportunities for cognitive growth.
• Job polarization is related to resources, safety nets, opportunity through
• Access to other societal institutions • Spatial stratification

Conclusions
• A substantial body of research has established effects of schools on • Early adult outcomes
• More limited research on long run effects on • Ability to adapt to societal changes • Individual’s interactions with formal institutions (e.g., work/employment,
health care)
• Society is becoming increasingly stratified (economically polarized) and segregated, which could exacerbate long run effects of education on correlates of AD

Collaborators Co-Investigators • Sandy Black, Economics, UT
Austin • Eric Grodsky, Sociology, UW
Madison • Rob Warren, Sociology, UMN
Twin Cities
Others • Amanda Bosky, UT (sociology) • Jamie Carroll, UT (sociology) • Michelle Frisco, PhD, Penn State • Ziwei He, UT (economics) • Koit Hung, UT (sociology) • Eve Pattison, UT (sociology) • Robert Reynolds, PhD, UT • April Sutton, PhD, UCSD
Funding
• We are grateful for the generous support of the High School and Beyond Midlife Follow-up project. This material is based upon work supported by the Alfred P. Sloan Foundation under grant number 2012-10-27, the National Science Foundation under grant numbers HRD 1348527, HRD 1348557, DRL 1420691, DRL 1420330, & DRL 1420572, & the Institute for Education Sciences of the U.S. Department of Education under grant number R305U140001. This research was also supported by the Eunice Kennedy Shriver National Institute of Child Health and Human Development under grants numbers 5 R24 HD042849 & 5 T32 HD007081 (Training Program in Population Studies). Thank you to the Russell Sage Foundation for the visiting scholar fellowship.
• Any opinions, findings, and conclusions or recommendations expressed in this material are those of the author(s) and do not necessarily reflect the views of the National Science Foundation or other funders.

Supplementary Slides

References • Adelman, Clifford. 1999. "Answers in the Tool Box: Academic Intensity, Attendance Patterns, and Bachelor's Degree Attainment." Vol. Washington, DC: U.S.
Department of Education. • Adelman, Clifford. 2006. The Toolbox Revisited: Paths to Degree Completion from High School through College. Washington, DC: U.S. Department of Education. • Adkins, Michael and Andrew Noyes. 2016. "Reassessing the Economic Value of Advanced Level Mathematics." British Educational Research Journal 42(1):93-116.
doi: 10.1002/berj.3219. • Altonji, Joseph G. 1995. "The Effects of High School Curriculum on Education and Labor Market Outcomes." Journal of Human Resources 30(3):409-38. doi:
10.2307/146029. • Altonji, Joseph G., Erica Blom and Costas Meghir. 2012. "Heterogeneity in Human Capital Investments: High School Curriculum, College Major, and Careers." Annual
Review of Economics 4(1):185-223. doi: 10.1146/annurev-economics-080511-110908. • Arum, Richard and Yossi Shavit. 1995. "Secondary Vocational Education and the Transition from School to Work." Sociology of Education 68(3):187-204. doi:
10.2307/2112684. • Acemoglu, Daron and David Autor. 2011. "Skills, Tasks and Technologies: Implications for Employment and Earnings." Pp. 1043-171 in Handbook of Labor
Economics, Vol. Volume 4, Part B, edited by A. Orley and C. David. Amsterdam: Elsevier • Autor, David and David Dorn. 2013. "The Growth of Low Skill Service Jobs and the Polarization of the U.S. Labor Market." American Economic Review 103(5):1553-
97. doi: 10.1257/aer.103.5.1553. • Bailey, Drew, Greg J. Duncan, Candice L. Odgers and Winnie Yu. 2017. "Persistence and Fadeout in the Impacts of Child and Adolescent Interventions." Journal of
Research on Educational Effectiveness 10(1):7-39. doi: 10.1080/19345747.2016.1232459. • Berends, Mark. 2015. "Sociology and School Choice: What We Know after Two Decades of Charter Schools." Annual Review of Sociology 41(1):159-80. doi:
doi:10.1146/annurev-soc-073014-112340. • Black, Sandra E., Chandra Muller, Alexandra Spitz-Oener, Ziwei He, Koit Hung, John Robert Warren and Eric Grodsky. Working Paper. "On the Origins of Stem: High
School Knowledge and Skills and Occupational Deterimination in an Era of Growing Inequality." • Brand, Jennie E. and Xie Yu. 2010. "Who Benefits Most from College? Evidence for Negative Selection in Heterogeneous Economic Returns to Higher Education."
American Sociological Review 75(2):273-302. doi: 10.1177/0003122410363567. • Bryk, Anthony S., Valerie E. Lee and Peter B. Holland. 1993. Catholic Schools and the Common Good. Cambridge, MA: Harvard University Press. • Carroll, Jamie M. and Chandra Muller. Forthcoming. "Curricular Differentiation and Its Impact on Different Status Groups Including Immigrants and Students with
Disabilities." in Handbook of the Sociology of Education in the 21st Century, edited by B. Schneider and G. Saw. New York: Springer. • Carroll, Jamie M., Chandra Muller, Eric Grodksy and John Robert Warren. Working Paper. “Tracking Health Inequalities from High School to Midlife.” University of
Texas at Austin, Austin, TX..

References cont. • Coleman, James, Thomas Hoffer and Sally Kilgore. 1982. "Achievement and Segregation in Secondary Schools: A Further Look at Public and Private School Differences." Sociology
of Education 55(2):162-82. doi: 10.2307/2112296. • Dolton, P. J. and A. Vignoles. 2002. "The Return on Post–Compulsory School Mathematics Study." Economica 69(273):113. doi: 10.1111/1468-0335.00273. • Downey, Douglas B., Paul T. von Hippel and Beckett A. Broh. 2004. "Are Schools the Great Equalizer? Cognitive Inequality During the Summer Months and the School Year."
American Sociological Review 69(5):613-35. doi: 10.1177/000312240406900501. • Downey, Douglas B., Paul T. von Hippel and Melanie Hughes. 2008. "Are “Failing” Schools Really Failing? Using Seasonal Comparison to Evaluate School Effectiveness." Sociology
of Education 81(3):242-70. doi: 10.1177/003804070808100302. • Evans, William N. and Robert M. Schwab. 1995. "Finishing High School and Starting College: Do Catholic Schools Make a Difference?". The Quarterly Journal of Economics
110(4):941-74. doi: 10.2307/2946645. • Frank, Kenneth A., Chandra Muller, Kathryn S. Schiller, Catherine Riegle-Crumb, Anna Strassmann Mueller, Robert Crosnoe and Jennifer Pearson. 2008. "The Social Dynamics of
Mathematics Coursetaking in High School." American Journal of Sociology 113(6):1645-96. doi: 10.1086/587153. • Gamoran, Adam. 1992. "The Variable Effects of High School Tracking." American Sociological Review 57(6):812-28. doi: 10.2307/2096125. • Gamoran, Adam and Eileen C. Hannigan. 2000. "Algebra for Everyone? Benefits of College-Preparatory Mathematics for Students with Diverse Abilities in Early Secondary School."
Educational Evaluation and Policy Analysis 22(3):241-54. doi: 10.3102/01623737022003241. • Goldin, Claudia and Lawrence F. Katz. 2008. The Race between Education and Technology. Cambridge, MA: Harvard University Press. • Heckman, James J. 2006. "Skill Formation and the Economics of Investing in Disadvantaged Children." Science 312(5782):1900-02. doi: 10.1126/science.1128898. • Heyns, Barbara. 1978. Summer Learning and the Effects of Schooling. New York: Academic Press. • Joensen, Juanna Schrøter and Helena Skyt Nielsen. 2009. "Is There a Causal Effect of High School Math on Labor Market Outcomes?". Journal of Human Resources 44(1):171-98.
doi: 10.3368/jhr.44.1.171. • Levine, Phillip B. and David J. Zimmerman. 1995a. "The Benefit of Additional High-School Math and Science Classes for Young Men and Women." Journal of Business & Economic
Statistics 13(2):137-49. doi: 10.1080/07350015.1995.10524588. • Levine, Phillip B. and David J. Zimmerman. 1995b. "A Comparison of the Sex-Type of Occupational Aspirations and Subsequent Achievement." Work and Occupations 22(1):73-84.
doi: 10.1177/0730888495022001004. • Quinn, David M., North Cooc, Joe McIntyre and Celia J. Gomez. 2016. "Seasonal Dynamics of Academic Achievement Inequality by Socioeconomic Status and Race/Ethnicity."
Educational Researcher 45(8):443-53. doi: 10.3102/0013189X16677965. • Rose, Heather and Julian R. Betts. 2001. Math Matters : The Links between High School Curriculum, College Graduation, and Eanings. San Francisco: Public Policy Institute of
California. • Rose, Heather and Julian R. Betts. 2004. "The Effect of High School Courses on Earnings." Review of Economics & Statistics 86(2):497-513. doi: 10.1162/003465304323031076. • Sutton, April 2017. "Preparing for Local Labor: Curricular Stratification across Local Economies in the United States ". Sociology of Education 90(2):172-96. doi:
10.1177/0038040717703447. • Warren, John Robert, Chandra Muller, Robert A. Hummer, Eric Grodsky and Melissa Humphries. Working Paper. “Which Aspect of Education Matters for Early Mortality? Evidence
from the High School and Beyond Cohort.” University of Minnesota, Minneapolis, MN

High School and Beyond (sophomores): The Class of 1982
1980 1982 1984 1992 1986 2014
Unemployment=7.8% (1990) Unemployment=6.3%
(2001)
Unemployment=10% (2008)
? Computerization
of Workplace
*Class of 1980 (seniors) interviewed 1980-86, 2015
Unemployment=10.8% (July 1981)
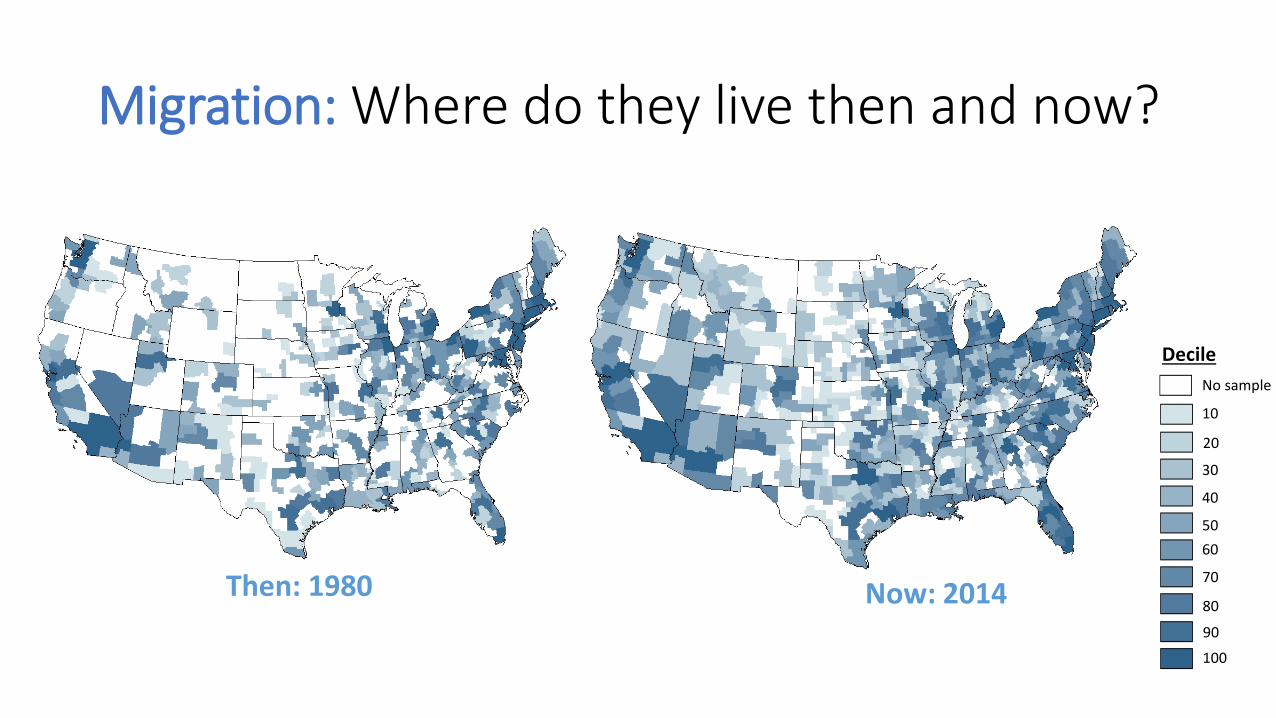
Migration: Where do they live then and now?
Then: 1980 Now: 2014
10
20
30
40
50 60
70
80
90
100
No sample
Decile

Labor Force: 2013 Occupation Wage Percentile OLS regression coefficients All models include locus of control, number of mathematics credits, science credits, and foreign language credits & background characteristics (race/ethnicity, gender, age, mother’s education, and number of siblings), 1992 educational attainment
Adaptation Models Highest math course (reference=below Alg 1)
Algebra 1 3.301* 1.450 1.236 2.585 Geometry 5.567*** 4.185* 3.883* 4.666** Algebra 2 5.609*** 4.214* 3.710 4.952** Adv math/Calculus 8.589*** 7.809*** 6.608** 7.861***
Highest science course (reference=below Bio) Biology 2.111 2.387 2.857 2.153 Chemistry 1.611 3.007 3.442 1.678 Physics 3.980* 2.949 2.622 2.321 Advanced science 2.664 1.392 1.362 2.321
Math test score 3.223*** 3.810*** 3.641*** 3.165*** STEM occup 1991 11.40*** HS Fixed effect No Yes Yes No STEM 1991=0 No No No Yes R2 0.229 0.380 0.391 0.205 N 7,240 6,870 6,870 6,330
Source: “On the Origins of STEM: High School Knowledge and Skills and Occupational Determination in an Era of Growing Inequality.” By S.E. Black, C. Muller, A. Spitz-Oener, Z. He, K. Hung, J.R. Warren
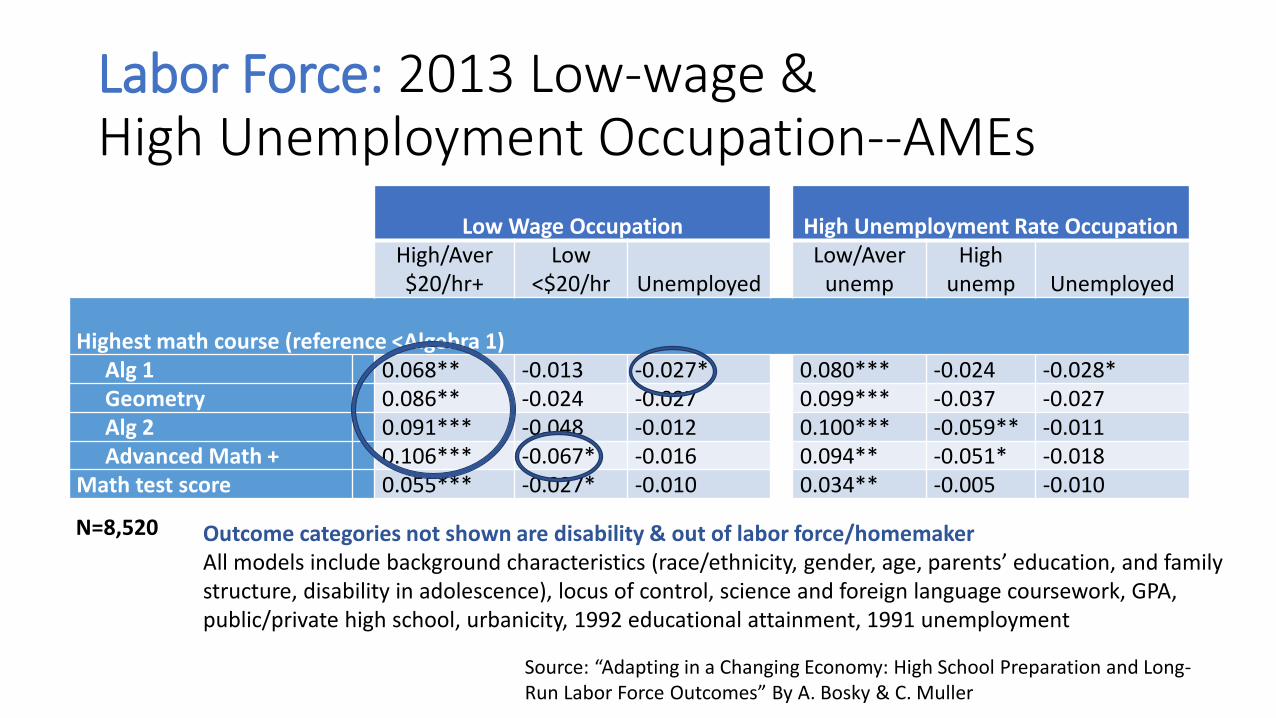
Labor Force: 2013 Low-wage & High Unemployment Occupation--AMEs
Low Wage Occupation
High Unemployment Rate Occupation High/Aver $20/hr+
Low <$20/hr Unemployed
Low/Aver unemp
High unemp Unemployed
Highest math course (reference <Algebra 1)
Alg 1 0.068** -0.013 -0.027* 0.080*** -0.024 -0.028* Geometry 0.086** -0.024 -0.027 0.099*** -0.037 -0.027 Alg 2 0.091*** -0.048 -0.012 0.100*** -0.059** -0.011 Advanced Math + 0.106*** -0.067* -0.016 0.094** -0.051* -0.018
Math test score 0.055*** -0.027* -0.010 0.034** -0.005 -0.010
N=8,520 Outcome categories not shown are disability & out of labor force/homemaker All models include background characteristics (race/ethnicity, gender, age, parents’ education, and family structure, disability in adolescence), locus of control, science and foreign language coursework, GPA, public/private high school, urbanicity, 1992 educational attainment, 1991 unemployment
Source: “Adapting in a Changing Economy: High School Preparation and Long-Run Labor Force Outcomes” By A. Bosky & C. Muller

Health: 2013 Health Status & Physical Functioning
Health Status Physical Functioning Course-taking Pattern (reference all low-level courses)
Mixed Low-Level Courses .105* .084~ .135 .105 All Medium-Level Courses .141* .088 .263** .193* Mixed High-Level Courses .191*** .137* .137 .065 All High-Level Courses .221** .141* .208* .127
Locus of Control .084** .175*** .079 .200** Test Scores -.002 -.006** .003 -.001 GPA .078** .084** .110* .089~ Degree Attainment No Yes No Yes R2 .100 .116 .104 .126 N 6850 2990
*** p<.001, ** p<.01, * p<.05, ~ p<.1
OLS regression coefficients All models include background characteristics (race/ethnicity, gender, age, parents’ education, family income, father’s occupation, home ownership, number of siblings and family structure), adolescent health, high school drop out status, school characteristics. Models with degree attainment also include change in locus of control, test scores and grades from sophomore to senior year.
Source: “Tracking Health Inequalities from High School to Midlife.” By J. Carroll, C. Muller, E. Grodsky, and J.R. Warren.
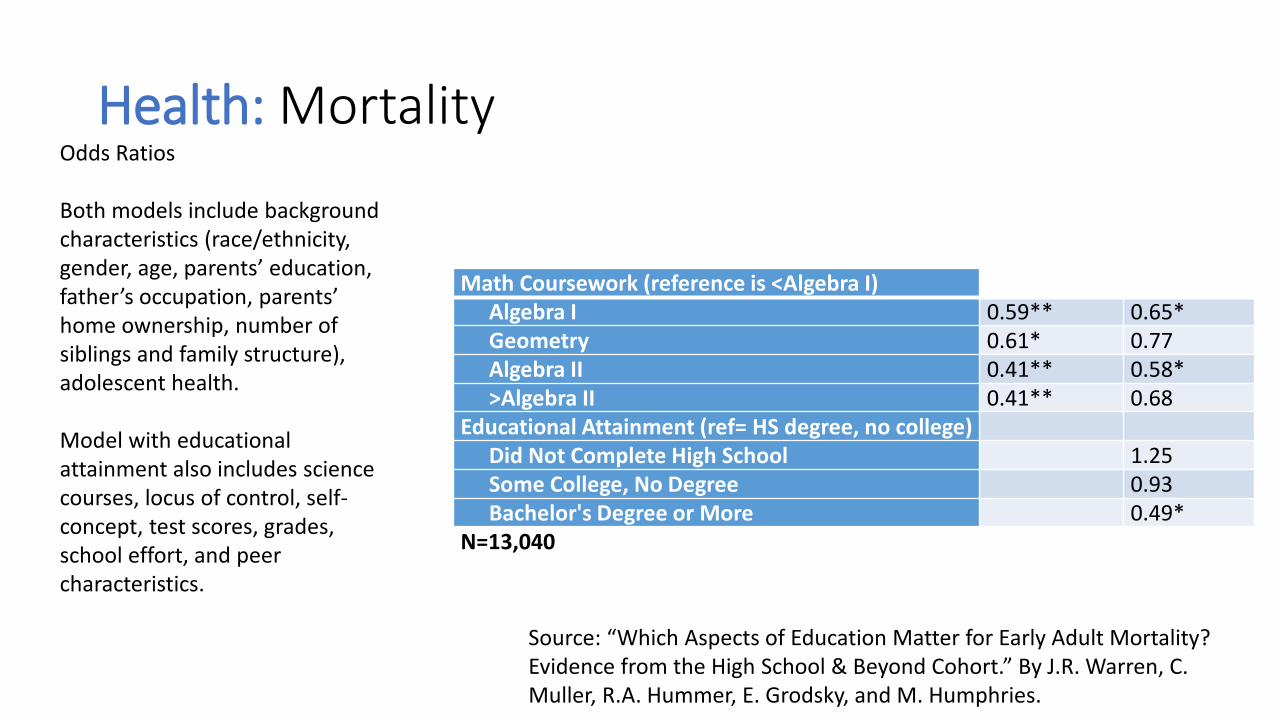
Health: Mortality
Math Coursework (reference is <Algebra I) Algebra I 0.59** 0.65* Geometry 0.61* 0.77 Algebra II 0.41** 0.58* >Algebra II 0.41** 0.68
Educational Attainment (ref= HS degree, no college) Did Not Complete High School 1.25 Some College, No Degree 0.93 Bachelor's Degree or More 0.49*
N=13,040
Odds Ratios Both models include background characteristics (race/ethnicity, gender, age, parents’ education, father’s occupation, parents’ home ownership, number of siblings and family structure), adolescent health. Model with educational attainment also includes science courses, locus of control, self-concept, test scores, grades, school effort, and peer characteristics.
Source: “Which Aspects of Education Matter for Early Adult Mortality? Evidence from the High School & Beyond Cohort.” By J.R. Warren, C. Muller, R.A. Hummer, E. Grodsky, and M. Humphries.

School Processes –Degree
Preparation: Coursework Achievement Test Scores Grades Non-Cognitive Skills
Academic Degree
Health
Childhood & Adolescence Early Adulthood Midlife & Older Adulthood
Health
Selection Effects Go Beyond Family Background

Course-taking by Adolescent Weight Status Source: High School and Beyond
0
0.05
0.1
0.15
0.2
0.25
0.3
0.35
General Algebra 1 Geometry Algebra 2 Advanced
Healthy Weight Overweight
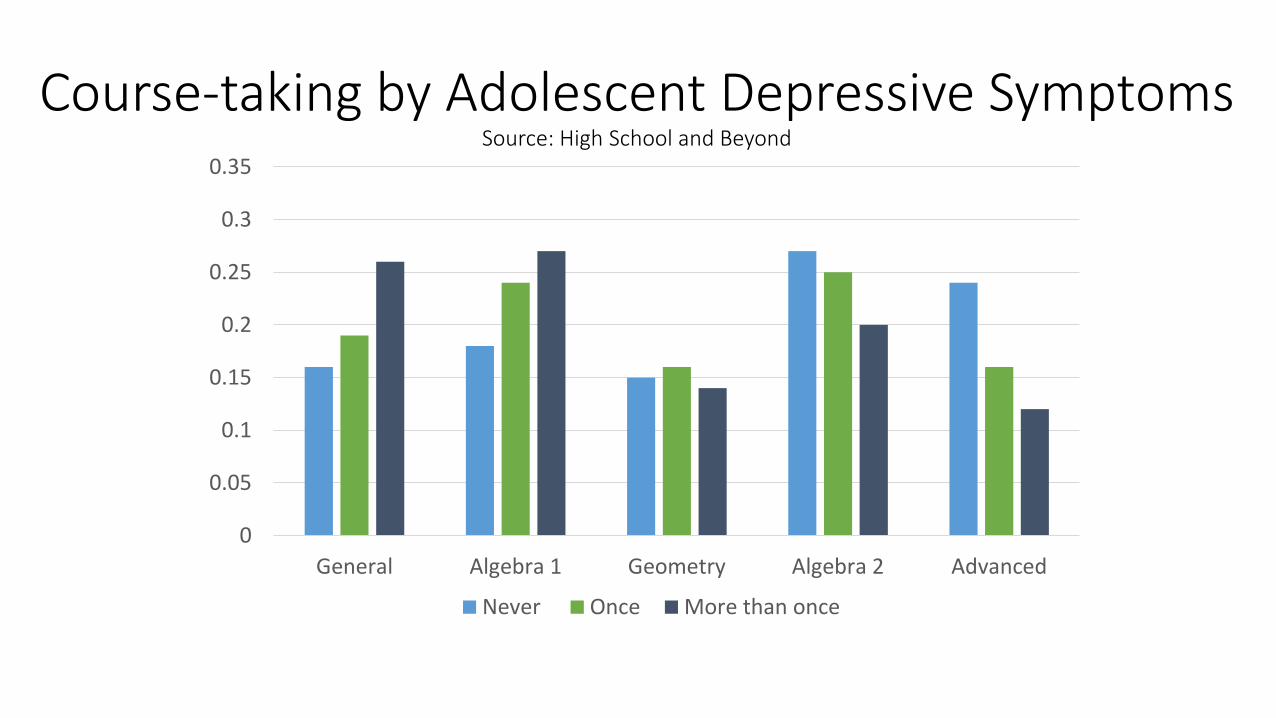
Course-taking by Adolescent Depressive Symptoms Source: High School and Beyond
0
0.05
0.1
0.15
0.2
0.25
0.3
0.35
General Algebra 1 Geometry Algebra 2 Advanced
Never Once More than once

Course-taking by Adolescent Disability Status Source: High School and Beyond
0
0.05
0.1
0.15
0.2
0.25
0.3
0.35
General Algebra 1 Geometry Algebra 2 Advanced
No Disability Physical Disability Mental Disability
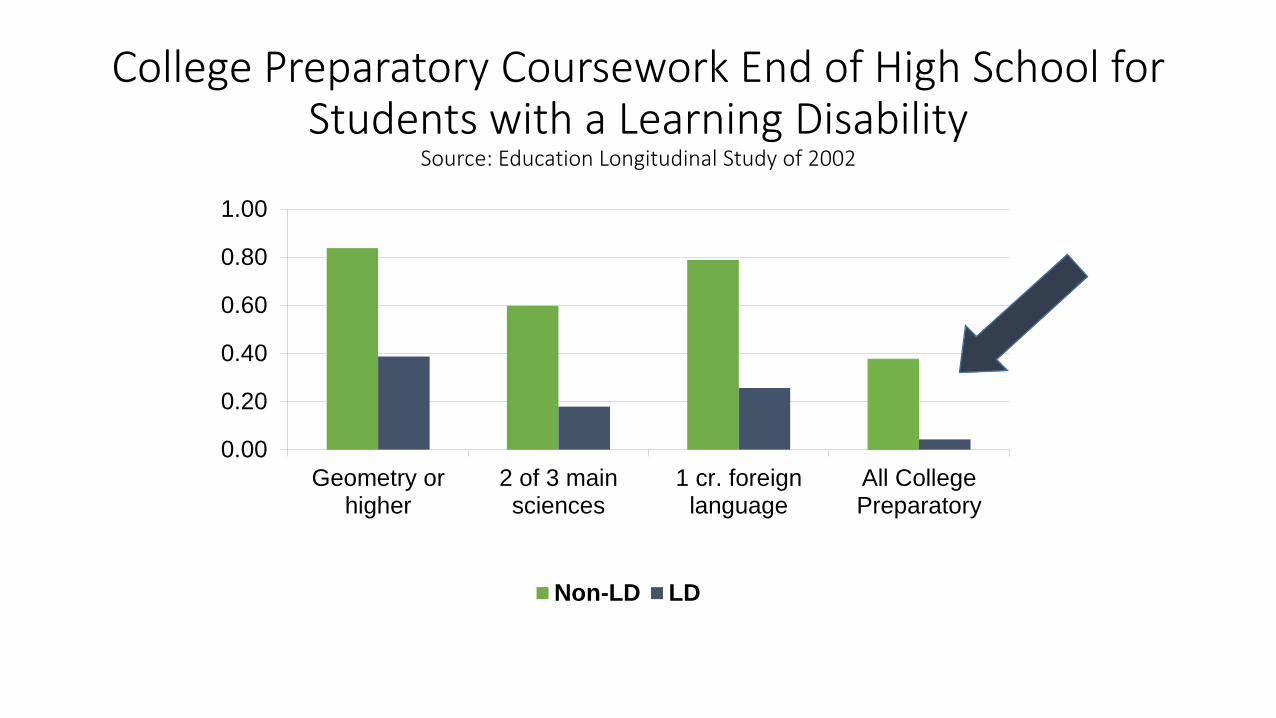
College Preparatory Coursework End of High School for Students with a Learning Disability
Source: Education Longitudinal Study of 2002
0.00
0.20
0.40
0.60
0.80
1.00
Geometry orhigher
2 of 3 mainsciences
1 cr. foreignlanguage
All CollegePreparatory
Non-LD LD