pathway to excellence: improvement update · facs/health/pe on college and career ready ......
TRANSCRIPT
1
Pathway to Excellence:
Improvement UpdateJennifer Sinsebox
Tony Mannara
December 18, 2017
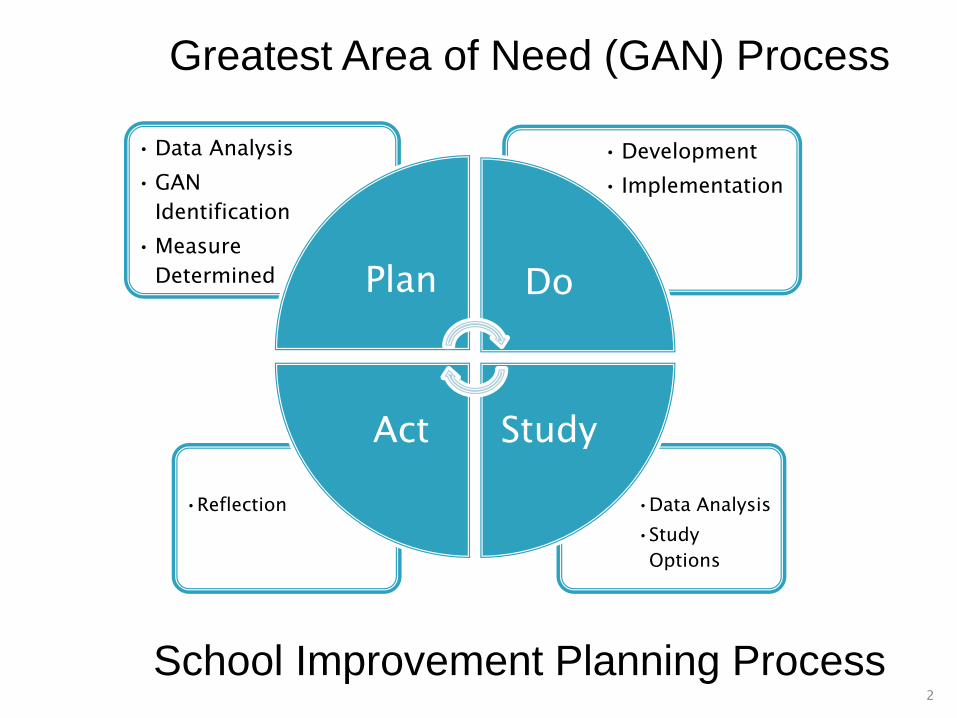
Greatest Area of Need (GAN) Process
•Data Analysis
•Study
Options
•Reflection
•Development
• Implementation
•Data Analysis
• GAN
Identification
•Measure
Determined Plan Do
StudyAct
2
School Improvement Planning Process

Data used to develop GAN Action Steps
by Grade Level and/or Department:
• 3-8 ELA and Math Assessments
• Regents Examinations
• STAR Reading and Math
• Next Steps to Guided Reading
3
Academic
Greatest Area of Needs
4
Grade Level/
DepartmentGreatest Area of Need GAN Action Step Measure
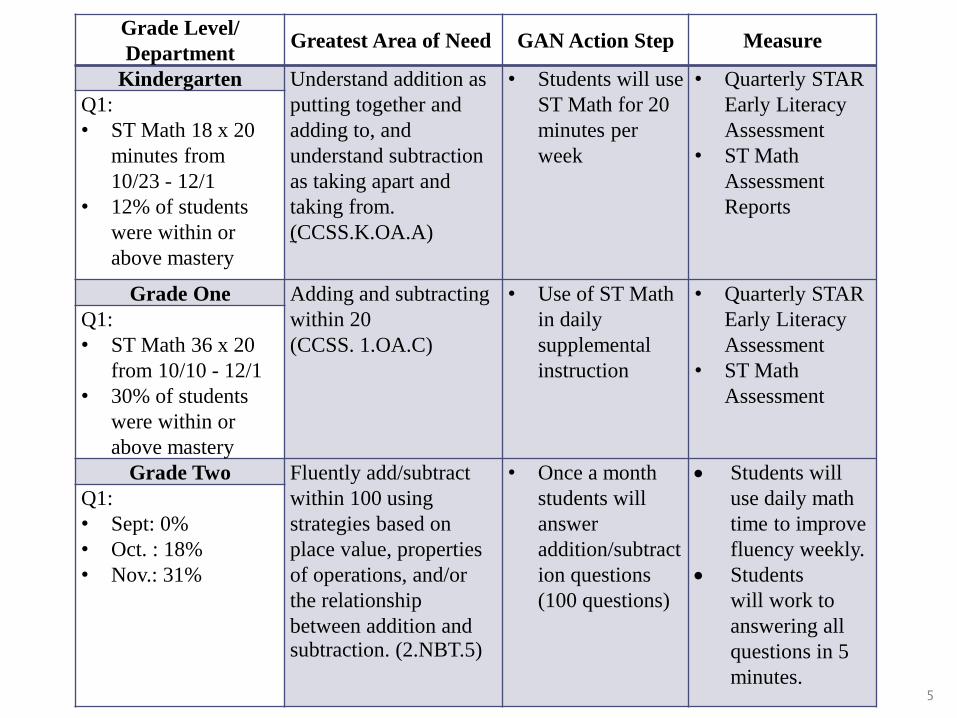
Kindergarten Understand addition as
putting together and
adding to, and
understand subtraction
as taking apart and
taking from.
(CCSS.K.OA.A)
• Students will use
ST Math for 20
minutes per
week
• Quarterly STAR
Early Literacy
Assessment
• ST Math
Assessment
Reports
Q1:
• ST Math 18 x 20
minutes from
10/23 - 12/1
• 12% of students
were within or
above mastery
Grade One Adding and subtracting
within 20
(CCSS. 1.OA.C)
• Use of ST Math
in daily
supplemental
instruction
• Quarterly STAR
Early Literacy
Assessment
• ST Math
Assessment
Q1:
• ST Math 36 x 20
from 10/10 - 12/1
• 30% of students
were within or
above mastery
Grade Two Fluently add/subtract
within 100 using
strategies based on
place value, properties
of operations, and/or
the relationship
between addition and subtraction. (2.NBT.5)
• Once a month
students will
answer
addition/subtract
ion questions
(100 questions)
• Students will
use daily math
time to improve
fluency weekly.
• Students
will work to
answering all
questions in 5
minutes.
Q1:
• Sept: 0%
• Oct. : 18%
• Nov.: 31%
5

Grade Level/
Department
Greatest Area of
NeedGAN Action Step Measure
Grade Three Responding to
constructed response
questions focusing on
supporting and
explaining written
response in both
reading and
math. (RL.3.3/RL.3.5)
• Use of RACES
strategy for ELA
(Restate, Answer the
question, Cite
evidence, Explain
your thinking,
Summarize)
• Choosing one
passage for
students to respond
to using the
strategy 1 x/week
Q1:
• Once a week/8
weeks of instruction
Grade Four Reading and
analyzing math word
problems, choosing
appropriate operations
needed and
persevering in solving.
• Use of CUBES
strategy for
multiple choice
responses
• Weekly Checklist
• Use of NYS Rubric
• Use of NYS
Released Questions
Q1:
• 4-5 times a week/ 8 weeks of instruction
Grade Five Reading and
analyzing mathematic
al word problems,
choosing appropriate
operations needed and
persevering in solving.
• Use of CUBES
strategy for
multiple choice
responses
• Weekly Checklist
• Use of NYS Rubric
• Use of NYS
Released Questions
Q1:
• 3 times per week/8
weeks of instruction
6
Grade Level/
Department
Greatest Area of
NeedGAN Action Step Measure
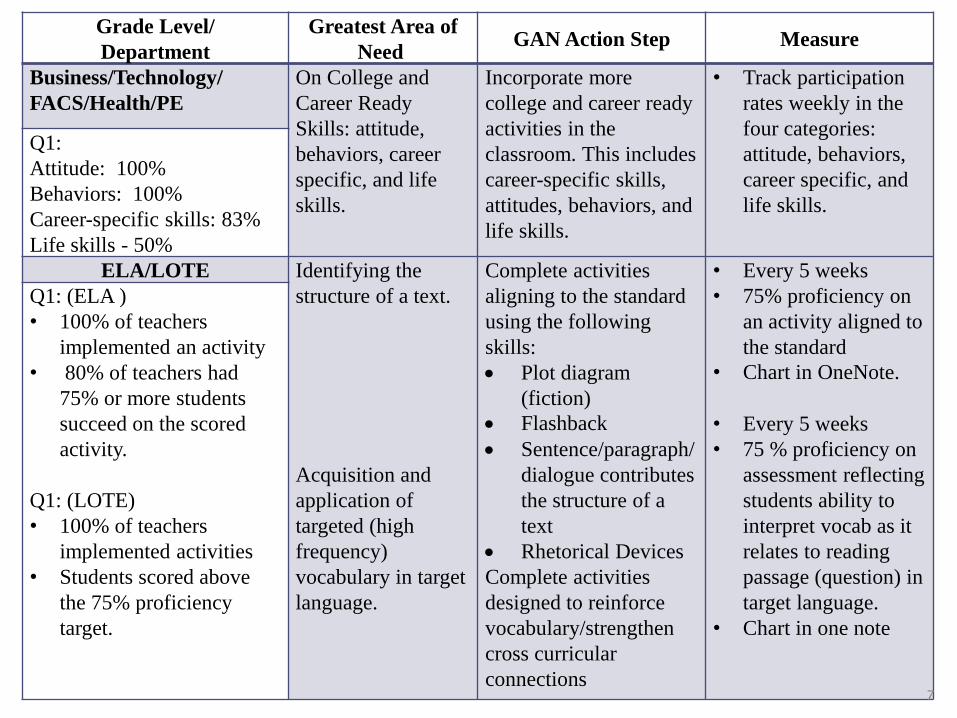
Business/Technology/
FACS/Health/PE
On College and
Career Ready
Skills: attitude,
behaviors, career
specific, and life
skills.
Incorporate more
college and career ready
activities in the
classroom. This includes
career-specific skills,
attitudes, behaviors, and
life skills.
• Track participation
rates weekly in the
four categories:
attitude, behaviors,
career specific, and
life skills.
Q1:
Attitude: 100%
Behaviors: 100%
Career-specific skills: 83%
Life skills - 50%
ELA/LOTE Identifying the
structure of a text.
Acquisition and
application of
targeted (high
frequency)
vocabulary in target
language.
Complete activities
aligning to the standard
using the following
skills:
• Plot diagram
(fiction)
• Flashback
• Sentence/paragraph/
dialogue contributes
the structure of a
text
• Rhetorical Devices
Complete activities
designed to reinforce
vocabulary/strengthen
cross curricular
connections
• Every 5 weeks
• 75% proficiency on
an activity aligned to
the standard
• Chart in OneNote.
• Every 5 weeks
• 75 % proficiency on
assessment reflecting
students ability to
interpret vocab as it
relates to reading
passage (question) in
target language.
• Chart in one note
Q1: (ELA )
• 100% of teachers
implemented an activity
• 80% of teachers had
75% or more students
succeed on the scored
activity.
Q1: (LOTE)
• 100% of teachers
implemented activities
• Students scored above
the 75% proficiency
target.
7

Grade Level/
Department
Greatest Area of
NeedGAN Action Step Measure
Music Artistic literacy—
decoding of musical
symbols
Introduce new musical
symbol and incorporate
symbol on a word wall.
• Weekly performance
task and/or quiz
• Chart in 365Q1:
• K-5- 45 minutes per
week
• 6-7-Average of 105
minutes per week
• HS band & choir in
8th-12th grade –
Average of 145
minutes per week
• AP Music – 210
minutes per week
• 75% Proficiency on
performance tasks
Art The incorporation of
practices to develop
and grow creativity
and innovative
thinking
Implement creativity
rubric for students to
use as they develop
their art pieces.
• Weekly collection of
levels of proficiency
aligned to the rubric:
Sub-Standard,
Approaching-
Standard, At-
Standard
Q1:
• 100% of K-8 teachers
• Meeting the standard
for 3-4 (out of 5)
components of
creativity and
approaching standard
in 1-2 components.
8
Grade Level/
DepartmentGreatest Area of Need GAN Action Step Measure
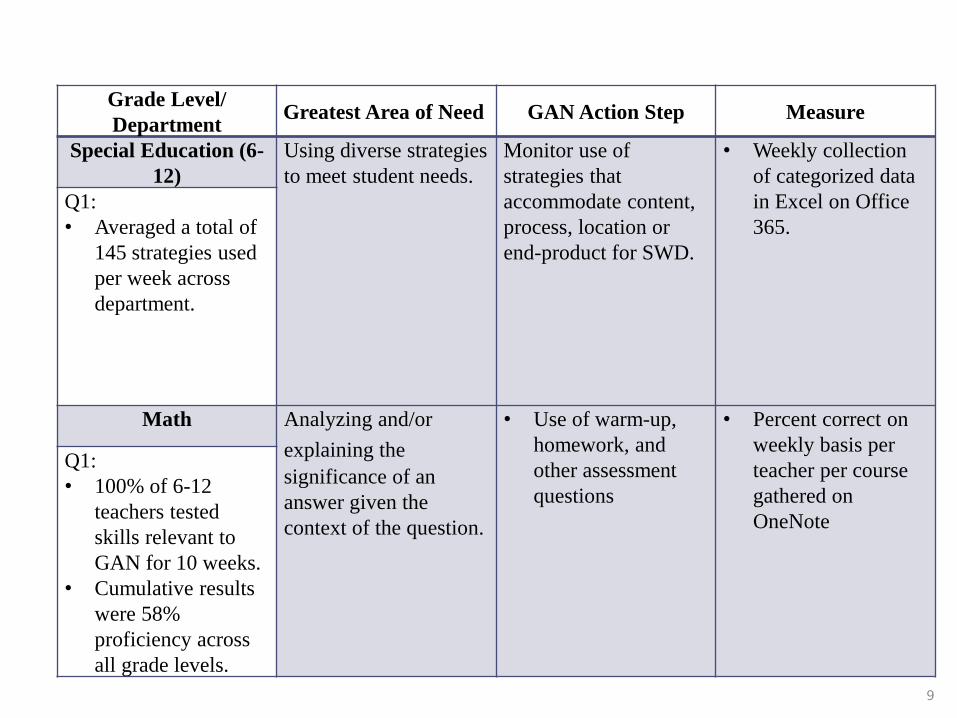
Special Education (6-
12)
Using diverse strategies
to meet student needs.
Monitor use of
strategies that
accommodate content,
process, location or
end-product for SWD.
• Weekly collection
of categorized data
in Excel on Office
365.
Q1:
• Averaged a total of
145 strategies used
per week across
department.
Math Analyzing and/or
explaining the
significance of an
answer given the
context of the question.
• Use of warm-up,
homework, and
other assessment
questions
• Percent correct on
weekly basis per
teacher per course
gathered on
OneNote
Q1:
• 100% of 6-12
teachers tested
skills relevant to
GAN for 10 weeks.
• Cumulative results
were 58%
proficiency across
all grade levels.
9
Grade Level/
DepartmentGreatest Area of Need GAN Action Step Measure
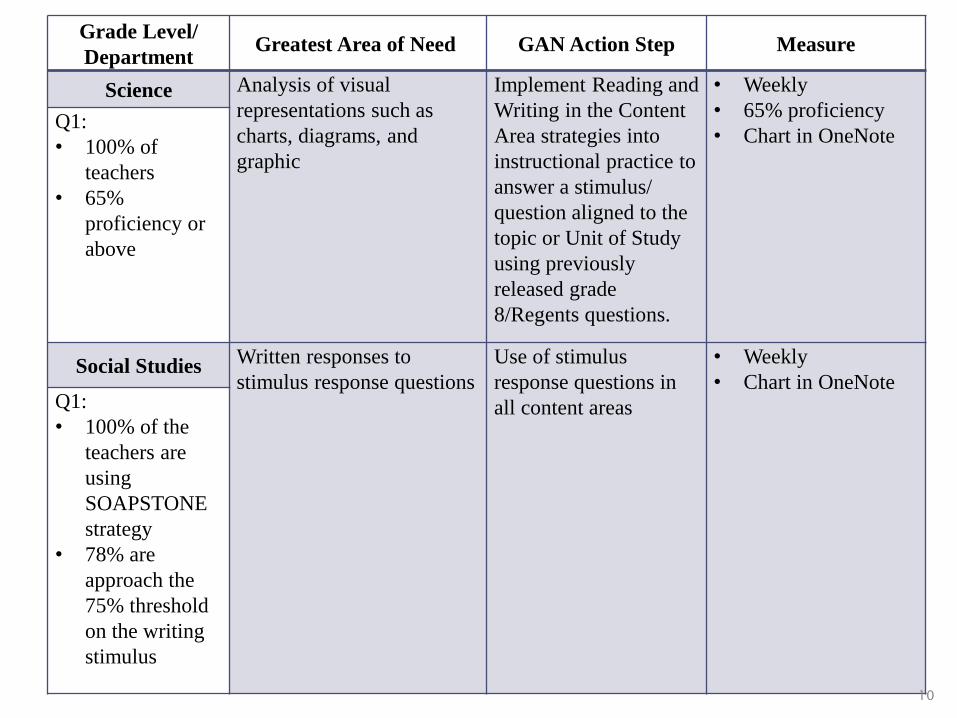
Science Analysis of visual
representations such as
charts, diagrams, and
graphic
Implement Reading and
Writing in the Content
Area strategies into
instructional practice to
answer a stimulus/
question aligned to the
topic or Unit of Study
using previously
released grade
8/Regents questions.
• Weekly
• 65% proficiency
• Chart in OneNoteQ1:
• 100% of
teachers
• 65%
proficiency or
above
Social StudiesWritten responses to
stimulus response questions
Use of stimulus
response questions in
all content areas
• Weekly
• Chart in OneNoteQ1:
• 100% of the
teachers are
using
SOAPSTONE
strategy
• 78% are
approach the
75% threshold
on the writing
stimulus
10
Communication
Greatest Area of Needs
11

12
Grade Level/
Department
GAN Action StepResource Measure
Kindergarten • Sharing academic
student progress as
measured by the
Next Steps Pre-A
Reading
Assessment.
• Next Steps to
Guided Reading
Assessment
• Quarterly data
reportsQ1:
• 100% of teachers
provided 100% of the
parents the students
scores in the first
quarter.
Grade One • Use of ClassDoJo
to update families
with academic
programs,
expectations, and
student progress
• Use of ClassDoJo • Send individualized
messages to parents
once a month
communication
student progress
Q1:
• 92% of families are
connected
to ClassDoJo.
Grade Two • Use of ClassDoJo
to update families
with academic
programs,
expectations, and
student progress
• Use of ClassDoJo • Track contacts
weekly or number
of contacts and
messages received
in a checklist
Q1:
• 92% of families are
connected to
ClassDoJo.
13
Grade Level/
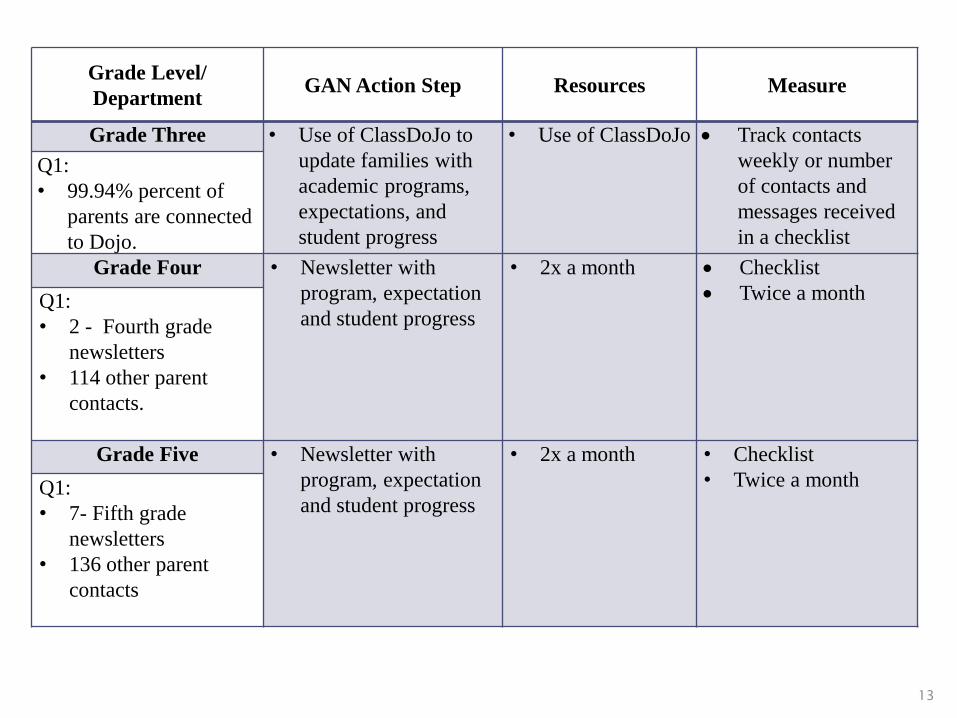
DepartmentGAN Action Step Resources Measure
Grade Three • Use of ClassDoJo to
update families with
academic programs,
expectations, and
student progress
• Use of ClassDoJo • Track contacts
weekly or number
of contacts and
messages received
in a checklist
Q1:
• 99.94% percent of
parents are connected
to Dojo.
Grade Four • Newsletter with
program, expectation
and student progress
• 2x a month • Checklist
• Twice a monthQ1:
• 2 - Fourth grade
newsletters
• 114 other parent
contacts.
Grade Five • Newsletter with
program, expectation
and student progress
• 2x a month • Checklist
• Twice a monthQ1:
• 7- Fifth grade
newsletters
• 136 other parent
contacts

14
Grade Level/
DepartmentGAN Action Step Resources Measure
Business/Technology/FACS
/Health/Physical Education
• Increase parent-teacher
communication through phone
calls, emails, meetings,
newsletters, and Growler
articles.
• Schooltool
• Website
• Log of phone calls,
emails, meetings
Q1:
• 115 Parent Contacts
and 49 Parent Contacts via
ELA/LOTE • Inform families of standards and
expectations
• Schooltool
• OneNote
Spreadsheet
• QuarterlyQ1:
• 100% of ELA teachers
sent a module 1 email
informing families of
standards and
expectations.
• 100% LOTE teachers
sent emails outlining
expectations. E-mails
sent every 5 weeks
updating families.
Math • Electronic mass communication
to parents including link to
parent portal access
• Schooltool
• Remind
• Number of
emails/Remind
Notifications
Q1:
• 100% of teachers 6
through 12 sent a
minimum of 2 emails /
Reminds per class

15
Grade Level/
DepartmentGAN Action Step Resources Measure
Music/Art • Email parents on student
progress, curricular
highlights and events.
• Schooltool
• OneNote
Spreadsheet
• Weekly
frequency will
be collected.
Q1:
• 200 emails
• 40 positive
letters/emails
• Elementary School
used Wednesday note
every week.
Science • Send email blasts to
include updates on
program, expectations
and progress including
the link to parent and
student Schooltool portal
• Schooltool
• Monthly email
updates to
parentsQ1:
• 100% of teachers 4
email blasts and/or
have communicated
directly with selected
parents by email.
Social Studies • Increase parent
communication
regarding curricular
topics and assessments.
• Remind • OneNote
Spreadsheet
• 1x per weekQ1:
• 100% of the
department sends
multiple Reminds
during the week over
the first quarter.

16
Grade Level/
DepartmentGAN Action Step Resources Measure
Special Ed. 6-12 • Use of Face-To-
Face meetings,
emails and/or
phone calls to
parents or school
personnel.
• Schooltool
• IEP Direct
• OneNote
Spreadsheet
• Weekly frequency
will be collected
• Logging into IEP
Direct Contact
Log Section
Q1:
• Department staff
averaged 196 contacts
per week (total) over 1st
quarter.
ESOL • Parent meetings
regarding student
goals
• Produce a
progress report
per student in
native language
• Schooltool
• Translator
Software
• OneNote
Spreadsheet
• Tracker of
progress notes
Q1:
• 1 parent meeting
"Students will be able to analyze and/or explain the significance of an answer given the context of
the question."
17

So…why was this chosen? 2 reasons…
1. In recent years, there has been a huge shift in Grades 3 through AP Calculus for students to not only do the math, but be able to explain the relevance of their results given the context of a real world issue.
18

Example 1 from Grade 6:
19
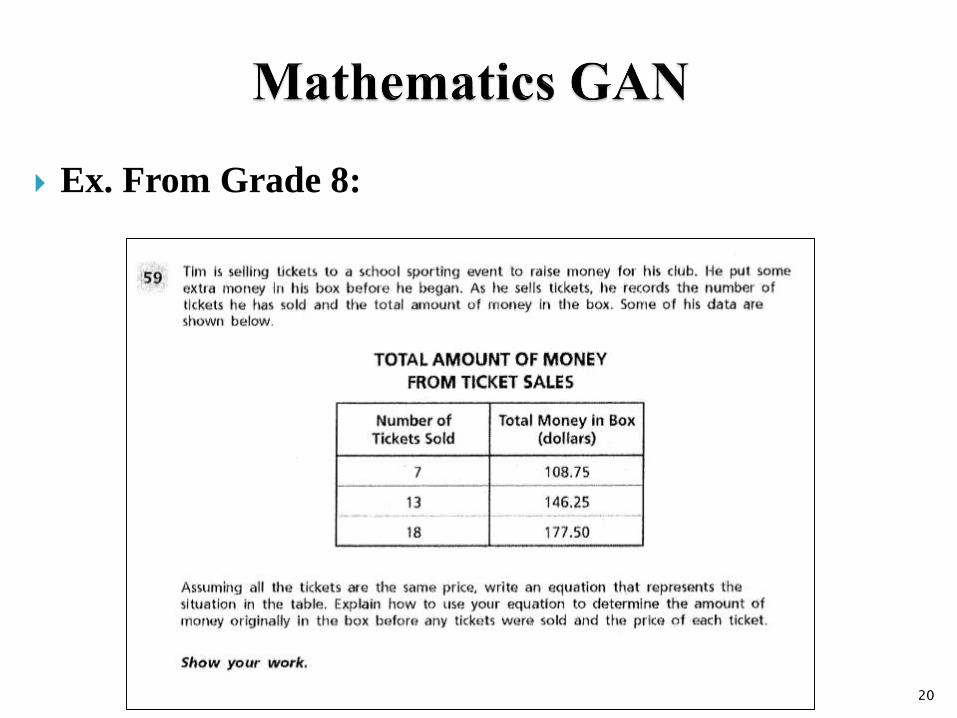
Ex. From Grade 8:
20

Example from Geometry:
21
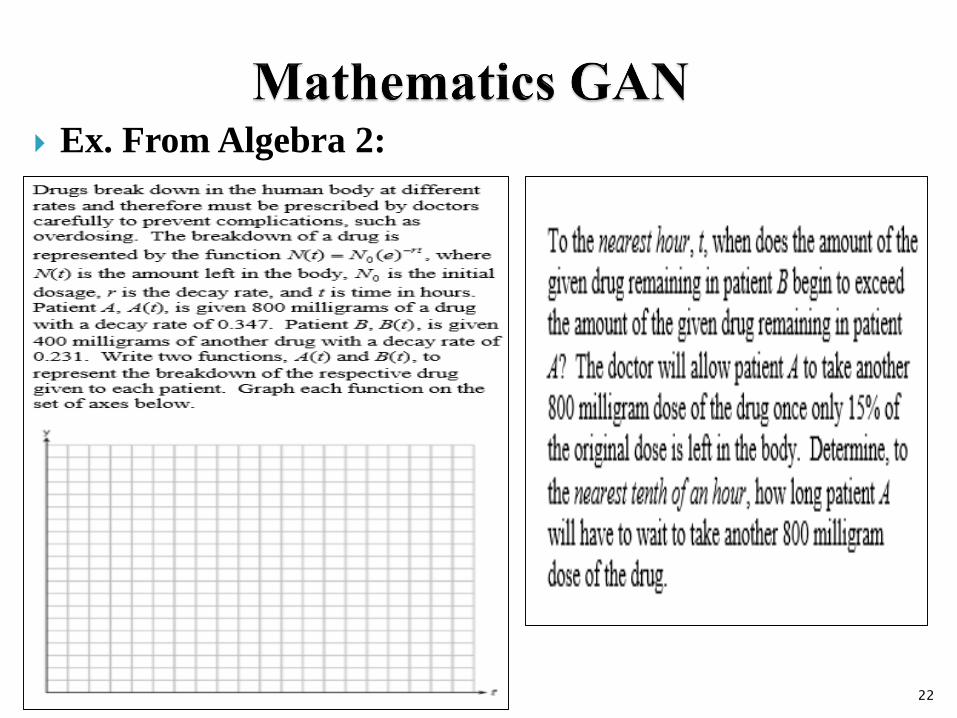
Ex. From Algebra 2:
22
For Selecting Our GAN:
2. Data across all grade levels have consistently shown that
our students are doing quite well with the math concepts on
all formative and summative assessments. However, their
ability to justify, explain, or interpret their results are in
need of improvement.
23

How is our GAN measured?
Weekly practice on warm-ups, homework, tickets out the
door, and on local assessments.
Data is collected and entered on OneNote by all
department members on a weekly basis.
24
Current Data:
Cumulative Data across all grade levels is 58% success
rate on focus questions involving “explain” and
interpretation of results.
25

Future Goals:
It’s a marathon, not a sprint…
District’s Digital Conversion…Through TI-Nspires and
STAR, we have the ability to send out problems and
gather/track data in a matter of seconds.
26
Thank you for your attention.
What questions do you have?
27