paterson area 1:250 000 scale solid geology interpretation ... · karol czarnota, ed gerner, david...
TRANSCRIPT

G E O S C I E N C E A U S T R A L I A
Karol Czarnota, Ed Gerner, David W Maidment, Anthony J Meixner & Leon Bagas
APPLYING GEOSCIENCE TO AUSTR ALIA’S MOST IMPORTANT CHALLENGES
Record
2009/16
Paterson Area 1:250 000 Scale Solid Geology Interpretation and Depth to Basement Model Explanatory notes
GeoCat # 65482
Paterson area 1:250 000-scale solid geology interpretation and depth to basement model – explanatory notes GEOSCIENCE AUSTRALIA RECORD 2009/16 by K. Czarnota1, E. Gerner1, D.W. Maidment1, A. Meixner1 and L. Bagas2,3 1 Geoscience Australia, GPO Box 378, Canberra, ACT, 2601. 2 Geological Survey of Western Australia, Department of Minerals and Energy, 100 Plain St, East Perth, WA, 6004. 3 Centre for Exploration Targeting, School of Earth and Geographical Sciences, The University of Western Australia, 35 Stirling Highway, Crawley, WA 6009, Australia. *Present address: National Mining Company LLC, PO Box 476, P.C. 321, Sohar, Sultanate of Oman
Geological Survey ofWestern Australia

Department of Resources Energy and Tourism Minister for Resources, Energy and Tourism: The Hon. Martin Ferguson, AM, MP Secretary: Mr John Pierce Geoscience Australia Chief Executive Officer: Dr Neil Williams PSM Minister for Energy, Resources, Industry and Enterprise Hon. Francis Logan MLA Geological Survey of Western Australia Executive Director: Tim Griffin © Commonwealth of Australia, 2009 This work is copyright. Apart from any fair dealings for the purpose of study, research, criticism, or review, as permitted under the Copyright Act 1968, no part may be reproduced by any process without written permission. Copyright is the responsibility of the Chief Executive Officer, Geoscience Australia. Requests and enquiries should be directed to the Chief Executive Officer, Geoscience Australia, GPO Box 378 Canberra ACT 2601. Geoscience Australia has tried to make the information in this product as accurate as possible. However, it does not guarantee that the information is totally accurate or complete. Therefore, you should not solely rely on this information when making a commercial decision. ISSN 1448-2177 ISBN 978-1-921498-69-5 Print ISBN 978-1-921498-83-1 CD-ROM ISBN 978-1-921498-70-1 Web GeoCat # 65482 Bibliographic reference: Czarnota, K., Gerner, E., Maidment D. W., Meixner A. and Bagas, L., 2009. Paterson area 1:250 000-scale solid geology interpretation and depth to basement model – explanatory notes: Geoscience Australia Record, 2009/16.

Paterson Orogen Solid Geology – Explanatory Notes
iii
Contents Executive Summary ......................................................................................... 1
Introduction.................................................................................................... 2
Geological Overview........................................................................................ 3 Palaeo- to Mesoproterozoic basement – Rudall Complex .............................................................. 4
Talbot Terrane ........................................................................................................................... 4 Connaughton Terrane ................................................................................................................ 5 Tabletop Terrane ....................................................................................................................... 6
Neoproterozoic................................................................................................................................ 6 Stratigraphy ............................................................................................................................... 6 Intrusions ................................................................................................................................. 12 Structure .................................................................................................................................. 12 Mineralisation.......................................................................................................................... 13
Phanerozoic................................................................................................................................... 13
Interpretation Methodology ............................................................................ 14 General approach .......................................................................................................................... 14 Datasets......................................................................................................................................... 14
Geological maps ...................................................................................................................... 14 Geophysics .............................................................................................................................. 15 Drilling data............................................................................................................................. 18
Limitations .................................................................................................................................... 18
Depth to basement modelling ................................................................................ 19 Euler Depth Solutions ................................................................................................................... 20 Forward modelling........................................................................................................................ 20 Seismic Data ................................................................................................................................. 22 Insights arising from the interpretation........................................................... 22
Conclusions ................................................................................................. 24
References ................................................................................................... 24
Acknowledgements ....................................................................................... 28 Appendix ...................................................................................................... 29

Paterson Orogen Solid Geology – Explanatory Notes
1
Executive Summary An interpretation of the Paterson area has been carried out to understand the distribution of Proterozoic bedrock beneath thin (<300 m) Phanerozoic cover. Numerous granitic intrusions have been identified to the north of Telfer, which intrude a pre-deformed Neoproterozoic sequence, suggesting that this shallowly covered area is prospective for Telfer-style Au-Cu mineralisation. Neoproterozoic sedimentary rocks in the south of the area previously interpreted to be part of the Tarcunyah Group might instead be part of the Yeneena Basin. The absence of Neoproterozoic granites in this part of the area means that these rocks have a reduced potential for Au-Cu mineralisation, but they have potential for base metal and unconformity-style uranium mineralisation. The solid geology interpretation has been produced as a hard copy map. Depth to Proterozoic basement modelling has also been carried out for the area, effectively mapping the depth of the surface represented by the solid geology interpretation. This has shown that much of the area has only a relatively thin cover (typically less than 300 m), making it accessible for exploration. In contrast, the Phanerozoic Waukarlycarly Embayment in the northwest of the area contains a relatively thick succession (with maximum depths exceeding 3000 m) within a NNW-trending, steep-sided graben that is 30-40 km wide.
Paterson Orogen Solid Geology – Explanatory Notes
2
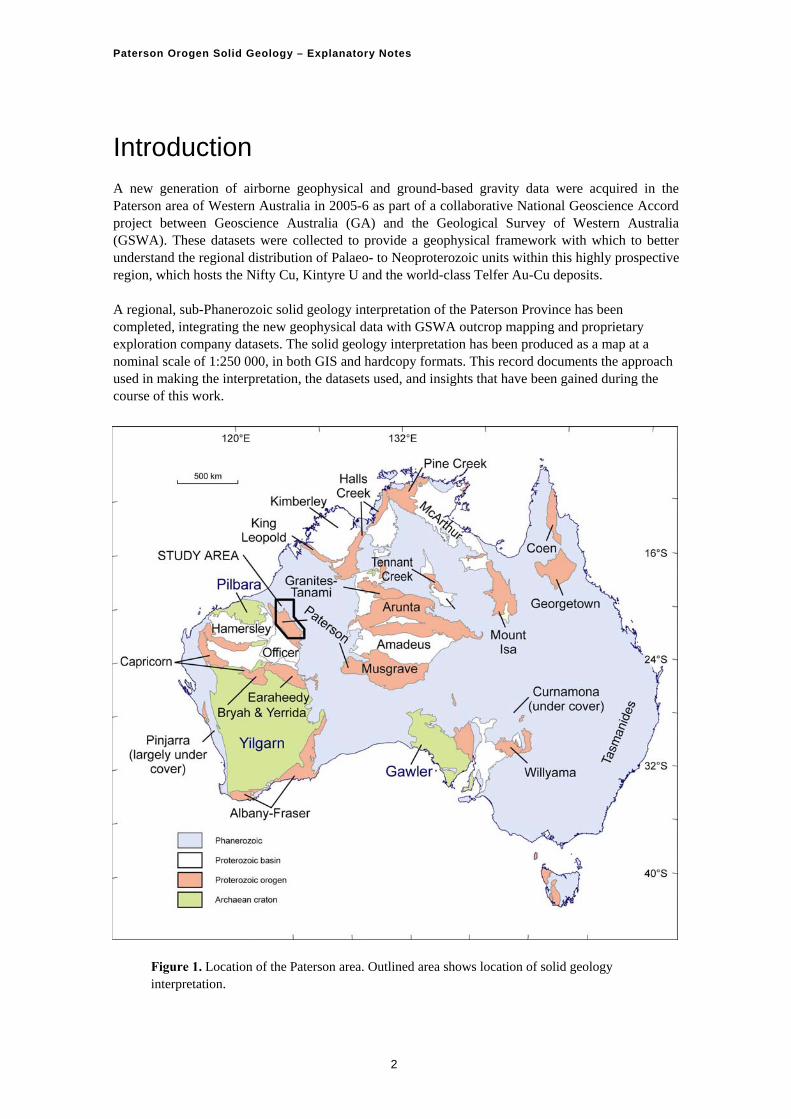
Introduction A new generation of airborne geophysical and ground-based gravity data were acquired in the Paterson area of Western Australia in 2005-6 as part of a collaborative National Geoscience Accord project between Geoscience Australia (GA) and the Geological Survey of Western Australia (GSWA). These datasets were collected to provide a geophysical framework with which to better understand the regional distribution of Palaeo- to Neoproterozoic units within this highly prospective region, which hosts the Nifty Cu, Kintyre U and the world-class Telfer Au-Cu deposits.
A regional, sub-Phanerozoic solid geology interpretation of the Paterson Province has been completed, integrating the new geophysical data with GSWA outcrop mapping and proprietary exploration company datasets. The solid geology interpretation has been produced as a map at a nominal scale of 1:250 000, in both GIS and hardcopy formats. This record documents the approach used in making the interpretation, the datasets used, and insights that have been gained during the course of this work.
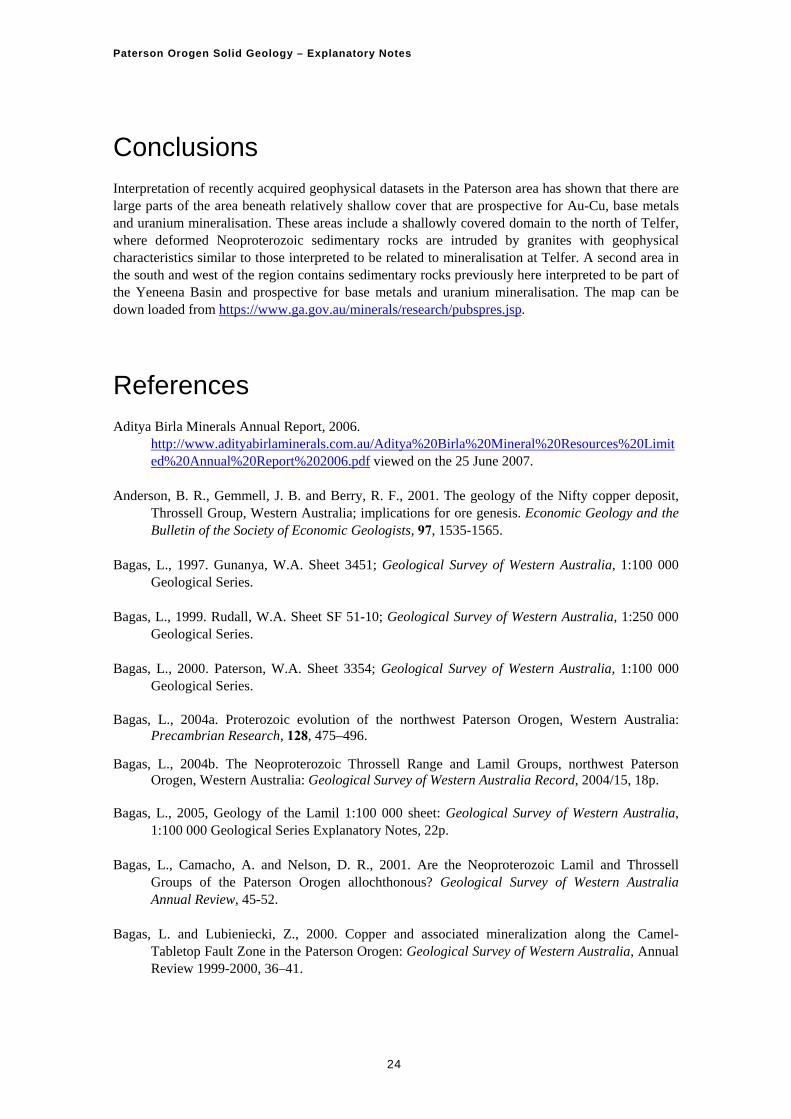
Figure 1. Location of the Paterson area. Outlined area shows location of solid geology interpretation.

Paterson Orogen Solid Geology – Explanatory Notes
Geological Overview The Paterson area is located to the east of the Archaean Pilbara Craton (Fig. 1). Multiply deformed and metamorphosed Palaeo- to Mesoproterozoic sedimentary and igneous rocks of the Rudall Complex form basement in the area (Hickman and Bagas, 1999; Bagas, 2004a), and are overlain by sedimentary rocks of the Neoproterozoic Yeneena and northwest Officer basins (Fig. 2). These are in turn overlain by Phanerozoic sedimentary rocks of the Canning Basin. The Geological Survey of Western Australia (Tyler and Hocking, 2002) considers the Paterson area to be part of a larger geological domain, the Paterson Orogen, defined as a 2000 km long arcuate belt of folded and metamorphosed Palaeoproterozoic to Neoproterozoic sedimentary and igneous rocks that were deformed during the Neoproterozoic (ca. 650 Ma) Miles Orogeny (Williams and Myers, 1990; Bagas and Smithies, 1998) and ca. 550 Ma Paterson and Petermann orogenies (Tyler et al., 1998; Scrimgeour et al., 1999). In this record, we refer to the region studied as the Paterson area, a spatial term that makes no connection between this geological domain and others that may have shared a similar Neoproterozoic deformational history. The Paterson area contains several significant mineral deposits and prospects, which include the Telfer Au-Cu, the Nifty Cu and the Kintyre U deposits.
Figure 2. Simpified geological map of the Paterson area, Western Australia (modified after Ferguson and Bagas, 2005).
3

Paterson Orogen Solid Geology – Explanatory Notes
PALAEO- TO MESOPROEROZOIC BASEMENT - RUDALL COMPLEX The Rudall Complex consists of Palaeoproterozoic to Mesoproterozoic supracrustal and intrusive rocks that have been multiply deformed and metamorphosed at up to granulite facies. The complex has been subdivided into three tectonically juxtaposed and lithologically distinct packages of rocks: the Talbot, Connaughton and Tabletop terranes (e.g. Bagas, 2004a). Although there are relatively few geochronological data constraining the ages of the supracrustal successions in these terranes, what is available suggests that the Talbot and Connaughton terranes have undergone a similar geological evolution, despite having significant lithological differences. In contrast, the poorly exposed Tabletop Terrane to the east, which is separated from the Talbot and Connaughton terranes by the NW-trending Camel-Tabletop Fault Zone, appears to be significantly different, particularly in terms of the timing of magmatism (Bagas, 2004a). The three terranes have undergone faulting, folding and low-grade metamorphism during the ca. 650 Ma Miles Orogeny and minor faulting and folding during the ca. 550 Ma Paterson Orogeny (Bagas, 2004a). Talbot Terrane The Talbot Terrane consists of supracrustal rocks and felsic intrusives that have been deformed and metamorphosed at up to amphibolite facies (Smithies and Bagas, 1997a). The supracrustal rocks consist of quartzite, metapelite, rare amphibolite, banded iron-formation, and ultramafic intrusives. These rocks have been intruded by voluminous felsic intrusives termed the Kalkan Supersuite by Smithies and Bagas (1997b) and Budd et al. (2002), which constitute about 50% of the terrane by area (Hickman and Bagas, 1998). The felsic intrusives, which intrude all levels of the supracrustal succession, were emplaced between ca. 1800 Ma and ca. 1760 Ma (Nelson, 1995, 1996; Maidment et al., in prep.). This provides a minimum age constraint on the depositional age of the protoliths to the metasedimentary succession, which have few detrital zircon dates to provide maximum age constraints. The compositionally distinct layered orthogneiss in the western part of the terrane (Rx) is distinguished on the map from the more widespread granitic orthogneiss (Rg), which is also present in the Connaughton Terrane. The only unit for which detrital zircon data are available, the Fingoon Quartzite, has an essentially unimodal population of zircon at 1800-1790 Ma (Nelson, 1995; Maidment et al., in prep.), consistent with derivation from the oldest felsic intrusive rocks in the region. Two samples of layered orthogneiss from the terrane yielded populations at 2015 ± 26 and 1972 ± 4 Ma, interpreted as intrusive ages (Nelson, 1995), which would indicate that some metasedimentary units in the succession are significantly older than the ca. 1800-1760 Ma depositional age of the Fingoon Quartzite. However it is not clear to what extent these age populations might reflect inheritance and it remains an open question whether the Talbot Terrane contains an older metasedimentary succession. In the interpretative map, the metasedimentary rocks are represented as three major units (it is emphasized that no stratigraphic succession is implied here for these high-grade and multiply deformed metamorphic rocks):
Rf - ‘Fingoon Package’ consisting of the Larry Formation, Fingoon Quartzite, Butler Creek Formation and Poynton Formation (Hickman and Bagas, 1999).
Ry - Yandagooge Formation, comprising part of the Fingoon Package. This has been represented as a separate unit owing to its distinctive lithological assemblage, which forms a marker unit within the succession. The unit is predominantly a pelitic to semi-pelitic assemblage of quartz-muscovite schist, haematitic biotite schist, and minor intercalations of muscovite quartzite with minor psammitic gneiss, graphitic schist, chert, and banded iron-formation.
Rs - Undifferentiated metasedimentary rocks of the Rudall Complex. Metapelite, quartzofeldspathic schist, amphibolite and quartzite of uncertain relationship to the Fingoon Package.
4

Paterson Orogen Solid Geology – Explanatory Notes
Banded iron formation (Ri) and ultramafic rock (Ru) comprise a relatively small proportion of the Talbot Terrane and only individual units of sufficient thickness are represented on the map. The precise timing of metamorphic and deformational events within the Talbot Terrane remains to be established. The terrane experienced two high-grade events in the Palaeoproterozoic (D1/D2), comprising phases of the Yapungku Orogeny (Bagas, 2004a). The Yapungku Orogeny has not been directly dated, but the D2 event is interpreted to be broadly synchronous with the emplacement of the Kalkan Supersuite at ca. 1800-1760 Ma (Bagas, 2004a; Hickman and Bagas, 1999). A SHRIMP U-Pb zircon age of 1778 ± 16 Ma age obtained for an aplite dyke (Nelson, 1995) has been used to constrain the minimum age of the D2 event, based on an interpretation that it post-dates the S2 foliation (e.g. Hickman and Bagas, 1999). However, more recent examination of aplite dykes in the area suggests that these dykes were variably foliated during the D2 event and thus were emplaced either during or before D2 (Maidment et al., in prep.). Three analyses of low-U metamorphic rims from a ca. 1800 Ma felsic orthogneiss yielded an imprecise age of 1680 ± 29 Ma (Maidment et al., in prep.), but until further metamorphic ages are obtained, it remains uncertain whether this age reflects metamorphism of the Yapungku Orogeny or a younger thermal event. Connnaughton Terrane The Connaughton Terrane has a significantly higher proportion of amphibolite than the Talbot Terrane, derived from metamorphism of tholeiitic basaltic precursors (Bagas and Smithies, 1998). The amphibolite is interlayered with banded iron formation, quartzite, metapelite, chert and ultramafic rocks. A locally restricted mafic-rich succession (Ra) is distinguished on the interpretative map from the metasedimentary successions in the Talbot Terrane. Only one sample of the supracrustal succession has been dated using detrital zircon, a quartzite which yielded a maximum depositional age of ~2300 Ma (Maidment et al., in prep.). The provenance signature of this metasedimentary rock is significantly different from those obtained from the Fingoon Quartzite in the Talbot Terrane, but there are insufficient data available to determine whether the metasedimentary successions in the two terranes are of different ages. Felsic intrusives with similar ages to those dated in the Talbot Terrane are present in the Connaughton Terrane (Rg). Felsic orthogneisses have yielded ages of 1781 ± 5 Ma, 1777 ± 7 Ma, 1769 ± 7 Ma (Nelson, 1995; Bagas and Smithies, 1998, Maidment et al., in prep.), indicating that at least some of the protoliths to the metasedimentary rocks in the terrane were deposited between ca. 2300 Ma and 1777 Ma. A pegmatite with an age of 1291 ± 10 Ma close to the Camel-Tabletop Fault Zone (Nelson, 1995) reflects a later thermal event. The rocks of the Connaughton Terrane have been metamorphosed at up to the granulite-facies (peak 800 ºC, 12 kbar), interpreted to reflect collision between the West Australian Craton and a continent to the northeast (Smithies and Bagas, 1997a). The timing of this metamorphism remains unclear, but has been interpreted as coeval with the second phase of the Yapungku Orogeny (D2) in the Talbot Terrane (Smithies and Bagas, 1997a; Hickman and Bagas, 1999; Bagas, 2004a). The only sample with dated metamorphic zircon overgrowths from the Connaughton Terrane yields an age of ca. 1334 Ma (Maidment et al., in prep.), but again this may record the effects of a later tectonic event. SHRIMP U-Pb dating of a sheared garnet microgneiss in the Harbutt Range yielded three populations at ~1800 Ma, 1672 ± 70 Ma and 1222 ± 63 Ma (Nelson, 1995), with the youngest group interpreted to date crystallisation of the felsic intrusive precursor. However, other interpretations are possible and the two younger events might record the effects of overprinting tectonic events (Bagas, 2004a).
5

Paterson Orogen Solid Geology – Explanatory Notes
Tabletop Terrane Exposures of the Tabletop Terrane are dominated by weakly deformed and metamorphosed felsic and mafic igneous rocks, with minor quartzite, banded iron formation, ultramafic rock and calc-silicate (Bagas, 1999). The first felsic intrusive samples to be dated from the terrane yielded ages of 1476 ± 10 Ma (PNC unpubl. data, referred to in Bagas, 2004a) and 1310 ± 4 Ma (Nelson, 1996). Recent geochronology in the terrane has revealed that many of the felsic and mafic intrusives away from the Camel-Tabletop Fault Zone (termed the Krackatinny Supersuite by Smithies and Bagas, 1997b) were emplaced during ca. 1590-1550 Ma (Maidment et al., in prep.). The Tabletop Terrane has a generally high Bouguer gravity signature, indicating that mafic rocks are more widespread than outcrop exposures would suggest. Detrital zircon dating of a quartzite from the Tabletop Terrane gave a maximum depositional age of ca. 2840 Ma (Maidment et al., in prep.), with a significantly different provenance spectrum to sedimentary rocks in the Talbot or Connaughton terranes. There are not enough detrital zircon data for the Rudall Complex as a whole to evaluate whether this difference in provenance indicates that there is a significant difference between the supracrustal successions in the Talbot-Connaughton and Tabletop terranes. However, the apparent absence of ca. 1800-1760 Ma magmatism in the Tabletop Terrane and the apparent lack of ca. 1590-1550 Ma magmatism in the Talbot-Connaughton terranes confirms that the Camel-Tabletop Fault Zone is a major and long-lived crustal boundary (e.g. Bagas and Lubieniecki, 2000). NEOPROTEROZOIC Stratigraphy Lithostratigraphic correlations of the Neoproterozoic sedimentary rocks of the Paterson area have undergone multiple and significant revisions, reflecting the difficulty of correlating spatially separated sedimentary successions with few age constraints. The following correlation (Fig. 3) relies heavily, and builds upon, the subdivision of the Neoproterozoic sedimentary succession by Grey et al. (2005) and references therein. Grey et al. (2005) subdivided the lithostratigraphy of the region into two basin successions: (1) the Yeneena Basin in the north east and (2) the northwest Officer Basin in the southwest, separated by the Vines – McKay Fault Zone. However more recent study of the region applying sequence stratigraphy, structural analysis and geochronology indicates the age of the Yeneena Basin is constrained to between ca. 850 and 830 Ma (for timing constraints see below). This age constraint indicates that the Yeneena Basin is a time correlative of Supersequence 1 of the Centralian Superbasin (Walter et al., 1995), allowing broad correlations to be made across the Vines – McKay Fault Zone. The northwest Officer Basin in the Paterson area is comprised of the Tarcunyah Group, Sunbeam Group, Boondawari Formation and Disappointment Group. The available timing constraints for the Tarcunyah and Sunbeam groups equate them with Supersequence 1 of the Centralian Superbasin (Grey et al., 2005) and hence they are viewed as broad correlatives of the Yeneena Basin successions (Fig. 3). However it is still unclear as to whether these groups are lateral facies equivalents of the Yeneena Basin. This broad correlation implies the Yeneena Basin successions could be incorporated into the northwest Officer or Amadeus basins of the former Centralian Superbasin of Walter et al., (1995). The Boondawari Formation and Disappointment Group are older than dolerite dykes that intrude the succession at 508 ± 5 Ma (unpublished age noted in Grey et al., 2005) and show lithological and isotopic similarities to Supersequences 3 and 4 (ca. 580-540 Ma) of the Centralian Superbasin (Grey et al., 2005).
6

Paterson Orogen Solid Geology – Explanatory Notes
Figure 3. Time space correlation chart of the Paterson area. Yeneena Basin The Yeneena Basin has been subdivided into the Throssell Range Group, which crops out in the southwestern part of the region and the Lamil Group, which crops out in the northeastern part (Bagas, 2004a). The constituent formations of the Throssell Range Group, from stratigraphically lower to higher are:
Taliwanya Formation – locally developed, immature, coarse conglomerate unconformably overlying basement;
Pungkuli Formation – locally derived sandstones and shales; Coolbro Sandstone - regionally extensive (up to 2.5 km thick) fluviatile sandstone with
minor shale interbeds that fine upwards; Broadhurst Formation – thinly laminated sandstones, siltstones and black shales with
discontinuous carbonate lenses that generally fine upwards; and, Isdell Formation – deep water carbonate with a higher silt component in the upper parts,
which are intruded by dolerite sills. The Isdell Formation was included in the Throssell Range Group by most authors until the work of Bagas (2004b) and Grey et. al. (2005), who placed the Isdell Formation in the Lamil Group. For the
7
Paterson Orogen Solid Geology – Explanatory Notes
purpose of constructing the solid geology the Taliwanya and Pungkuli Formations were mapped as one unit, termed the Taliwanya Formation. The constituents of the Lamil Group are:
Malu Formation – turbiditic sandstone interbedded with calcareous siltstones; Puntapunta Formation – finely bedded silty to sandy carbonate; and, Wilki Formation – mature quartzitic sandstone comprised of upward-coarsening fine to
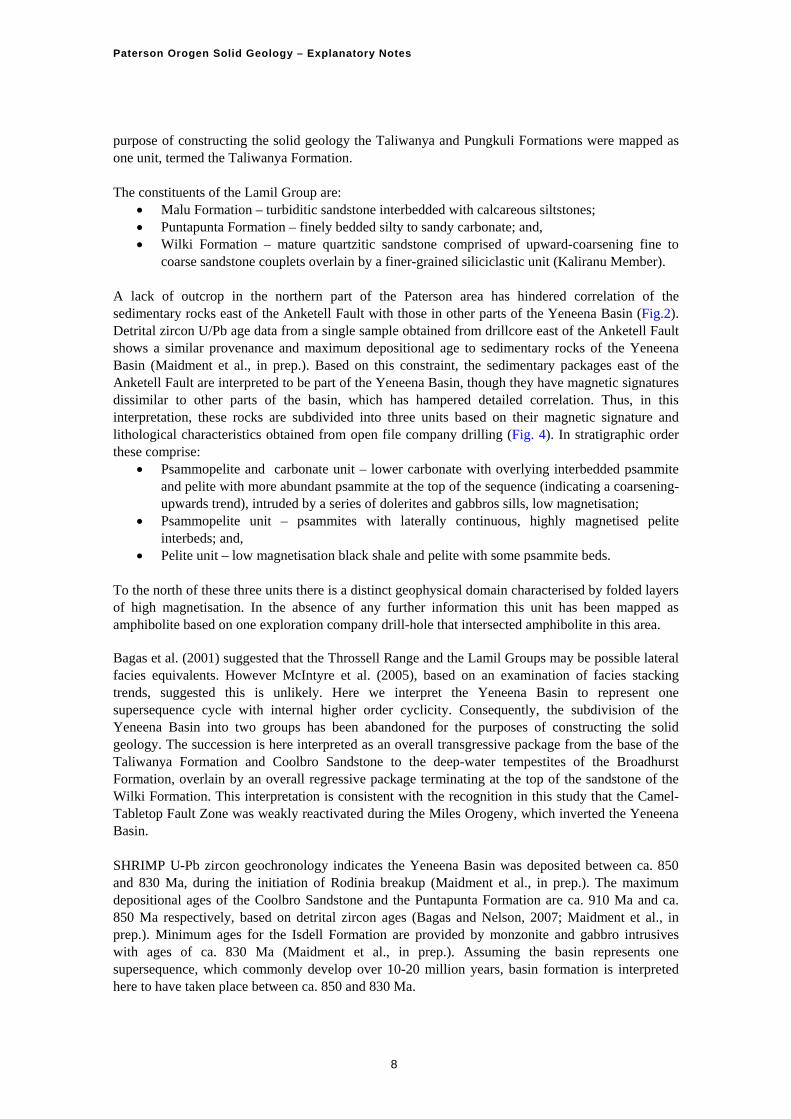
coarse sandstone couplets overlain by a finer-grained siliciclastic unit (Kaliranu Member). A lack of outcrop in the northern part of the Paterson area has hindered correlation of the sedimentary rocks east of the Anketell Fault with those in other parts of the Yeneena Basin (Fig.2). Detrital zircon U/Pb age data from a single sample obtained from drillcore east of the Anketell Fault shows a similar provenance and maximum depositional age to sedimentary rocks of the Yeneena Basin (Maidment et al., in prep.). Based on this constraint, the sedimentary packages east of the Anketell Fault are interpreted to be part of the Yeneena Basin, though they have magnetic signatures dissimilar to other parts of the basin, which has hampered detailed correlation. Thus, in this interpretation, these rocks are subdivided into three units based on their magnetic signature and lithological characteristics obtained from open file company drilling (Fig. 4). In stratigraphic order these comprise:
Psammopelite and carbonate unit – lower carbonate with overlying interbedded psammite and pelite with more abundant psammite at the top of the sequence (indicating a coarsening- upwards trend), intruded by a series of dolerites and gabbros sills, low magnetisation;
Psammopelite unit – psammites with laterally continuous, highly magnetised pelite interbeds; and,
Pelite unit – low magnetisation black shale and pelite with some psammite beds. To the north of these three units there is a distinct geophysical domain characterised by folded layers of high magnetisation. In the absence of any further information this unit has been mapped as amphibolite based on one exploration company drill-hole that intersected amphibolite in this area. Bagas et al. (2001) suggested that the Throssell Range and the Lamil Groups may be possible lateral facies equivalents. However McIntyre et al. (2005), based on an examination of facies stacking trends, suggested this is unlikely. Here we interpret the Yeneena Basin to represent one supersequence cycle with internal higher order cyclicity. Consequently, the subdivision of the Yeneena Basin into two groups has been abandoned for the purposes of constructing the solid geology. The succession is here interpreted as an overall transgressive package from the base of the Taliwanya Formation and Coolbro Sandstone to the deep-water tempestites of the Broadhurst Formation, overlain by an overall regressive package terminating at the top of the sandstone of the Wilki Formation. This interpretation is consistent with the recognition in this study that the Camel-Tabletop Fault Zone was weakly reactivated during the Miles Orogeny, which inverted the Yeneena Basin. SHRIMP U-Pb zircon geochronology indicates the Yeneena Basin was deposited between ca. 850 and 830 Ma, during the initiation of Rodinia breakup (Maidment et al., in prep.). The maximum depositional ages of the Coolbro Sandstone and the Puntapunta Formation are ca. 910 Ma and ca. 850 Ma respectively, based on detrital zircon ages (Bagas and Nelson, 2007; Maidment et al., in prep.). Minimum ages for the Isdell Formation are provided by monzonite and gabbro intrusives with ages of ca. 830 Ma (Maidment et al., in prep.). Assuming the basin represents one supersequence, which commonly develop over 10-20 million years, basin formation is interpreted here to have taken place between ca. 850 and 830 Ma.
8
Paterson Orogen Solid Geology – Explanatory Notes
Figure 4. End-of-hole lithology overlain on the first vertical derivative of the new total magnetic intensity (reduced to pole) magnetics in the Anketell area, with a translucent overlay of the new solid geology interpretation.
Tarcunyah Group Most sedimentary rocks of the Tarcunyah Group are restricted to the western side of the Vines Fault except for the Karara Formation which crops out in the vicinity of the Camel-Tabletop Fault Zone. Grey et al. (2005) identified five broadly conformable formations east of the Vines fault. These are as follows:
9

Paterson Orogen Solid Geology – Explanatory Notes
Googhenama Formation – interbedded fine- to coarse-grained sandstone and granular to pebbly conglomerate unconformably overlying Archaean basement;
Waroongunyah Formation – interbedded dolomite with siltstone, shale and fine-grained sandstone;
Brownrigg Sandstone – fine- to coarse-grained quartz sandstone with minor interbedded carbonate siltstone;
Yandanunyah Formation – interbedded siltstone and shale, calcareous shale and minor silicified oolitic, laminated and locally stromatolitic carbonate; and
Wongarlong Formation – medium- to fine-grained sandstone interbedded with laminated and micaceous siltstone and shale forming upward-coarsening successions, also associated with restricted basalt or fine grained dolerite.
Lithological mapping of the 1:250 000-scale Balfour Downs (Williams, 1989) and 1:100 000-scale Pearana (Williams and Trendall, 1998a), Throssell (Williams and Bagas, 1999) and Lamil (Bagas, 2005) map sheets identified nine mappable formations. These nine formations have been re-classified to be consistent with the five-formation scheme constructed by Grey et al. (2005) for the Tarcunyah Group west of the Vines Fault. The Googhenama Formation east of the Marloo Fault has been tentatively mapped as part of the Brownrigg Sandstone to honour structural trends. The difficulty in reconciling the various structural and lithostratigraphic interpretations in this area highlights the need for a reappraisal of the stratigraphy of the Tarcunyah Group and its relationship with sedimentary rocks of the Yeneena Basin. The Nooloo Formation crops out on the western side of the Vines Fault. It consists of a wide variety of rock types from fine- to coarse-grained sandstone, siltstone and shale, through to thinly bedded carbonate (Grey et al., 2005). Due to the sparse exposure, lack of geophysical signature and uncertain correlation with other units in the area, only the carbonates of the Nooloo Formation mapped on the Poisonbush 1:100 000-scale map sheet west of the Vines Fault were incorporated in the solid geology. The remainder of the formation was mapped as undifferentiated units of the Tarcunyah Group. The Choorun Formation is predominantly an upward-fining, fluviatile succession consisting of a coarse to medium-grained sandstone (Grey et al., 2005) which appears to be folded by the Miles Orogeny. It unconformably overlies the Rudall Complex and is overlain by siltstones and carbonates of the Nooloo Formation (Grey et al., 2005). The relationship between the Choorun Formation and other units in the area is unclear. The Choorun Formation mapped on the Poisonbush 1:100 000-scale map sheet on the eastern side of the Vines Fault and south western side of the McKay Fault has been reclassified as part of this study as part of the Throssell Range Group, and it is correlated with the Coolbro Sandstone. This is based on the recognition of a similar stratigraphic position, lithofacies and structural relationships to the Coolbro Sandstone. The Gunanya Sandstone and Waters Formation, classified as part of the Tarcunyah Group by Grey et al. (2005), have here been included as part of the Throssell Range Group and correlated with the Coolbro Sandstone and Broadhurst Formation respectively. The rationale for this interpretation is based on the recognition that these formations have similar facies stacking trends, thicknesses and palaeocurrent directions as the basal formation in the Yeneena Basin. In the McKay Range area these units are underlain by units currently assigned to the Taliwanya and Pungkuli formations. Elsewhere in the region, the ~1 km thick Taliwanya and Pungkuli formations do not underlie the Coolbro Sandstone, however these units are all proximally derived and are interpreted to represent local growth fault depressions associated with rift initiation. Similar facies, although much thinner
10
Paterson Orogen Solid Geology – Explanatory Notes
than the Taliwanya and Pungkuli formations, have been observed underlying the Coolbro Sandstone (A. McIntyre pers. comm., 2006). The Karara Formation is the only part of the Tarcunyah Group mapped north of the McKay Fault. It is restricted in distribution to the region around the Camel-Tabletop Fault Zone and unconformably overlies the Rudall Complex and sandstone in the Throssell Range Group here interpreted as the Coolbro Sandstone. The formation consists of conglomerate that fines upward into well-bedded, fine grained sandstone (Grey et al., 2005), which Bagas and Smithies (1998) correlated with the Gunanya Sandstone. Sunbeam Group The Sunbeam Group in the region of the solid geology map consists of the Mundadjini Formation. The age of the group is based on its stratigraphic position and the recognition of the Acaciella australica stromatolite assemblage in the Skates Hill Formation elsewhere in the northwest Officer Basin (Grey et al., 2005). This assemblage indicates correlation with the Bitter Springs Formation of the Amadeus Basin and the Coominaree Dolomite of the Adelaide Rift Complex and hence the Skates Hill Formation is inferred to be older than 800 Ma and possibly older than ca. 827 Ma, which is the age of the Gairdner Dyke Swarm (Grey et al., 2005). The Mundadjini Formation is a sandstone-dominated unit with lesser interbedded siltstone, shale and dolomite and is inferred to be a lateral facies equivalent to the Skates Hill Formation (Grey et al., 2005). Boondawari Formation The Boondawari Formation consists of three main lithological units. A lower diamictite unit, overlain by mostly coarse- to fine-grained, cross-bedded sandstone, and an upper argillaceous carbonate-rich package which consists of upward-coarsening units, ranging from shale to fine- and coarse-grained sandstone (Grey et al., 2005). The Boondawari Formation has disconformable or angularly unconformable relationships with older and younger units in the northwest Officer Basin (Grey et al., 2005). The extent of the unit on the solid geology map is restricted to the core of a broad anticline in the southwestern edge of the map where it overlies the Mundadjini Formation and is overlain by the Tchukardine Formation. A minimum age for the formation is provided by an intrusive dolerite crystallisation age of ca. 508 Ma (Grey et al., 2005). Disappointment Group The Disappointment Group disconformably overlies the Sunbeam Group and Boondawari Formation. The constituent formations of the Disappointment Group are:
McFadden Formation – fine- to coarse-grained, sandstone, with local siltstone and conglomeratic interbeds;
Tchukardine Formation – medium-grained sandstone, with rare intercalations of silty shale, siltstone and conglomerate;
Woora Woora Formation – medium-grained sandstone with locally common interbeds of siltstone and silty claystone.
The Tchukardine and Woora Woora formations are similar to the lower and upper McFadden Formation, however unequivocal correlations cannot be demonstrated. The Woora Woora Formation is disconformable on the Tchukardine Formation (Grey et al., 2005), and as suggested by Williams (1992) is inferred to be related to contractional tectonism. Intrusions The Yeneena Basin is intruded by mafic sills and rare intermediate intrusives related to basin formation, and by granite related to deformation associated with the Miles Orogeny. Mafic dolerite sills and monzonites intrude the Isdell, Malu and Puntapunta formations as well as unnamed
11
Paterson Orogen Solid Geology – Explanatory Notes
sedimentary units in the northeastern part of the area. SHRIMP U-Pb dating of zircon from monzonite at the Duke prospect and baddeleyite and zircon from a dolerite sill about 10 km SW of the Telfer gold mine yields intrusive ages of ca. 830 Ma (Maidment et al., in prep.). This magmatism is conceivably related to mafic magmatism of the ca. 827 Ma Gairdner Dyke Swarm, which extends from the eastern margin of the Gawler Craton through the Musgrave Complex and into the Paterson area (Pirajno and Bagas, 2007). Syn-tectonic monzogranite to syenogranite bodies of the O’Callaghans Supersuite (Budd et al., 2002), with emplacement ages between ca. 654 Ma and 630 Ma (Dunphy and McNaughton, 1998; Maidment et al., in prep.) intrude the Lamil Group near Telfer. Two broadly NE-striking granite trends are evident in the region, indicating intrusion under a NE-SW directed stress field, inferred to be the waning stages of the Miles Orogeny. The granites are highly fractionated, I-type and have differing oxidation states. The supersuite can be subdivided into the oxidised, magnetite-bearing Mount Crofton Suite which forms magnetic highs, and the reduced, ilmenite-bearing O’Callaghans Suite which forms magnetic lows. Due to the clear difference of geophysical signature of the two suites it was possible to differentiate them under cover. This is particularly significant with respect to Au mineralisation since Budd et al. (2002) argued that it is the O’Callaghans Suite that has the greater potential for gold. Structure Both the Yeneena Basin and Tarcunyah Group underwent inversion during the ca. 650 Ma SW-directed Miles Orogeny. Deformation is characterised by dextral movement along the NNW-striking Vines Fault on the western margin of the basin, and SW-verging thrusts on the McKay Fault system in the south. Towards the northeast, away from these loci of deformation, the structural style is dominated by NW-trending, doubly plunging folds. Basin-forming normal faults were reactivated as dextral and reverse oblique-slip faults during the Miles Orogeny and controlled the location of greatest basin inversion. Thrust faulting was predominantly accommodated along NW-SE oriented structures parallel to the structural grain of the underlying Rudall Complex. Structures are most complex in the vicinity of the Vines Fault, where two fold trends are evident: a NNW-striking set overprinted by a WNW trending set. Since these two fold trends are absent in areas away from the Vines Fault, this complexity is attributed to progressive dextral deformation adjacent to the fault. The Miles Orogeny is associated with lower greenschist-facies metamorphism previously dated at ca. 655 Ma by 40Ar-39Ar muscovite ages (Durocher et al., 2003). Neoproterozoic granites of the O’Callaghans Supersuite intruded a previously folded sequence between 654 and 630 Ma (Dunphy and McNaughton, 1998; Maidment et al., in prep.), providing a minimum age for this deformation. The overlap of metamorphic and granite ages, together with field relationships indicate the granites were emplaced late in the orogenic cycle. Following the Miles Orogeny, the Yeneena Basin was affected by the Paterson Orogeny, characterised by NE-trending cross folds under a NNW-SSE to NW-SE compression direction. The age of this event is poorly-constrained, but is inferred to have taken place at about 550 Ma based on a 40Ar-39Ar K-feldspar age from the Kintyre area (Durocher et al., 2003). Mineralisation Although most significant deposits in the Paterson area are hosted by Neoproterozoic sedimentary rocks of the Yeneena Basin, Palaeoproterozoic rocks of the Rudall Complex contain a large number of small uranium occurrences along with the major Kintyre uranium deposit. A carbonate U-Pb
12

Paterson Orogen Solid Geology – Explanatory Notes
isochron from the Yeneena Basin at 858±29 Ma, which is interpreted as a diagenetic age (Maas and Huston, unpubl. data), provides the best estimate of the age of Yeneena Basin sedimentation and a maximum age for unconformity-related uranium, stratabound copper, carbonate-hosted Zn-Pb and stratabound Au-Cu deposits hosted by the Yeneena Group and the underlying Rudall Complex. The Rudall Complex contains over 40 separate uranium and base metal prospects. In the Talbot terrane, these deposits are hosted mostly by pelitic and graphitic schist, chert and banded iron-formation in the Yandagooge Formation (Ferguson et al., 2005), and are interpreted to be related to the unconformity with the overlying Yeneena Basin. The most significant of these deposits is the Kintyre group of deposits, which collectively contain a resource of 36 000 tonnes of uranium, with minor bismuth, gold and platinum-group elements (Jackson and Andrew, 1990). The orebodies are shallowly-dipping lenses hosted by sheared chlorite-carbonate-quartz schist in contact with dolomitic metacarbonate and graphitic schist (Ferguson et al., 2005; Maas and Bagas, in prep.). The age of the Kintyre uranium deposit is ca. 850-840 Ma (Maas and Bagas, in prep.), consistent with mineralisation during basin development. The Nifty and Maroochydore deposits, with global resources of 99 Mt @ 1.7% Cu (Ferguson et al., 2005) and 51 Mt @ 1.0% Cu (Aditya Birla Minerals Annual Report, 2006), respectively, are the most significant stratabound copper deposits. These deposits and a number of prospects are hosted in interbedded black shale and carbonate in the Broadhurst Formation. As the black shale can be recognised using electromagnetic data, highly conductive zones in this unit have been mapped from proprietary company data in the solid geology map. Two models have been advanced for the stratabound copper deposits: (1) a syn- or diagenetic model in which mineralisation took place during basin formation (Haynes et al., 1993); and (2) a syn-tectonic model in which mineralisation took place during the Miles Orogeny (Anderson et al., 2001). Carbonate rocks of the Isdell Formation host stratabound Zn-Pb prospects, the most notable of which is at Warrabarty (Smith, 1996). Although stratabound, the mineralisation fills open space within the carbonate and has been interpreted by Smith (1996) to be a Mississippi Valley-type deposit. Other prospects, such as at Duke, are closely associated with ca. 830 Ma intermediate intrusions and are interpreted as skarn deposits. The most significant deposit in the Paterson area is the Telfer Au-Cu deposit with a resource of over 1300 t Au and 1.6 Mt Cu (Ferguson et al., 2005). Much of this deposit, which is hosted by siltstone and quartzite of the Malu Formation, has a strong stratigraphic control, hosted by bedding-parallel quartz reefs within the Telfer Dome. However, exploration at depth has defined cross-cutting breccia and sheeted veins (Ferguson et al., 2005). The age of the Telfer deposit is generally thought to overlap the age of the O’Callaghans Supersuite which is ca. 650-630 Ma (Dunphy and McNaughton, 1998; Maidment et al., in prep.), but this requires further studies to confirm. PHANEROZOIC The Palaeo- to Neoproterozoic rocks of the Paterson area are overlain by Permian to Cretaceous sedimentary rocks of the western Canning Basin. Permian sedimentary rocks in the central part of the region consist of fluvioglacial sedimentary rocks and tillite deposited within Permian glacial palaeovalleys (Hickman and Clarke, 1993; Hickman and Bagas, 1998). The sedimentary succession of the Canning Basin thickens eastwards towards the main part of the basin and also fills a deep embayment in the northwest of the area (the Waukarlycarly Embayment). Cainozoic sediments, including extensive dune fields, colluvial deposits and salt-lake sediments overlie large parts of the area, comprising parts of the Great Sandy Desert and Little Sandy Desert.
13

Paterson Orogen Solid Geology – Explanatory Notes
Interpretation Methodology GENERAL APPROACH The solid geology map represents the distribution of geological units beneath Phanerozoic cover (i.e. the base of the Canning Basin). The solid geology was compiled using a combination of five data sets, including outcrop geology, drilling information, aeromagnetics, gravity and ground electromagnetics (EM). The solid geology interpretation was constructed following the rationale outlined below:
1:100 000- and 1:250 000-scale outcrop geology maps produced by GSWA were used as the principal data set in the interpretation.
Geophysical data sets were used to extrapolate from outcrops to beneath cover. In cases where there was a discrepancy between outcrop and interpretation of geophysical data the outcrop geology was used as a control point.
Interpretations were made at 1:100 000-scale and compiled at a nominal scale of 1:250 000. No attempt was made to interpret geology beneath cover with a depth greater than 1000 m, because of a lack of constraining information. In the northwestern part of the region the Waukarlycarly Embayment of the Canning Basin has a maximum depth exceeding 3000 m (Bagas, 2005) and thus forms an elongate domain without interpretation.
The stratigraphic and structural model outlined above was used to constrain the range of possible solid geology interpretations.
Potential field modelling of suitable magnetic anomalies to determine dip of stratigraphic units was carried out in some areas to aid in the interpretation.
Linear magnetic anomalies considered to reflect stratigraphic and lithological trends were superimposed on the interpreted geological polygons to illustrate general geological trends. In the case where geophysical anomalies coincide with inferred geological formation contacts a trend line was not added to the solid geology interpretation. In areas of outcrop, trend lines were added from GSWA geological maps.
DATASETS Geological maps Most of the region coinciding with the solid geology map is covered by 1:100 000-scale geological maps. Where 1:100 000-scale maps were not available, 1:250 000-scale maps were used. All geological maps were produced by GSWA except for Paterson Range and Tabletop 1:250 000-scale map sheets which were produced by the Bureau of Mineral Resources, Geology and Geophysics (now GA) in conjunction with GSWA. The following lists the map sheets used to constrain the solid geology map:
Blanche-Cronin 1:100 000-scale part sheets 3551 and 3552, 1998 (Bagas and Smithies, 1999).
Braeside 1:100 000-scale map sheet 3155, first edition 1996 (Williams and Trendall, 1998b).
Broadhurst 1:100 000-scale sheet 3353, first edition 1993 (Hickman and Clarke, 1993). Connaughton 1:100 000-scale sheet 3452, first edition 1996 (Bagas and Smithies, 1998). Gunanya 1:100 000-scale sheet 3451, first edition 1997 (Bagas, 1997). Gunanya 1:250 000-scale map sheet SF 51-14, first edition 1980 (Williams and Williams,
1980). Isabella 1:100 000-scale sheet 3156, first edition 1996 (Williams and Trendall, 1998c). Lamil 1:100 000-scale sheet 3254, first edition 2004 (Bagas, 2005).
14
Paterson Orogen Solid Geology – Explanatory Notes
Paterson 1:100 000-scale sheet 3354, first edition 2000 (Bagas, 2000). Paterson Range 1:250 000-scale map sheet SF 51-6, second edition (Chin et al., 1982). Pearana 1:100 000-scale sheet 3154, first edition 1996 (Williams and Trendall, 1998a). Poisonbush 1:100 000-scale sheet 3252, first edition 1998 (Williams and Bagas, 1998). Rudall 1:100 000-scale sheet 3352, first edition 1996 (Hickman and Bagas, 1996). Rudall 1:250 000-scale map sheet SF 51-10, second edition 1999 (Bagas, 1999). Tabletop 1:250 000-scale map sheet SF 51-11, second edition (Yeates and Chin, 1979). Throssell 1:100 000-scale sheet 3253, first edition 1996 (Williams and Bagas, 1998).
Geophysics The following airborne geophysical surveys were used to constrain the solid geology interpretation (Fig. 5):
1. Paterson North magnetic and radiometric survey acquired by GSWA in 2005. This survey was flown by Fugro Airborne Surveys Pty Ltd on 400 m line spacing, 60 m above ground level, 090° line direction. Data obtained from Geoscience Australia.
2. Paterson Central magnetic and radiometric survey acquired by GSWA in 2005. This survey was flown by UTS Geophysics Pty Ltd on 400 m line spacing, 60 m above ground level, 090° line direction. Data obtained from GA.
3. Paterson Southeast magnetic and radiometric survey acquired by GSWA in 2005. This survey was flown by UTS Geophysics Pty Ltd on 400 m line spacing, 60 m above ground level, 180° line direction. Data obtained from GA.
4. Anketell magnetic and radiometric survey acquired by Teck Cominco Australia Pty Ltd in 2002. This survey was flown by UTS Geophysics Pty Ltd on 150 m line spacing, 25 m above ground level, 060° line direction. The data were purchased by GSWA in 2005. Data obtained from GA.
5. Gunanya magnetic and radiometric survey acquired by CRA Exploration Pty Ltd, in 1991. This survey was flown by Tesla Airborne Geoscience Pty Ltd on 300 m line spacing, 60 m above ground level, 180° line direction. The data were purchased by GSWA in 2006. Data obtained from GA.
6. Miles Ridge magnetic and radiometric survey acquired by CRA Exploration Pty Ltd., in 1986. This survey was flown by Tesla Airborne Geoscience Pty Ltd on 100 m line spacing, 70 m above ground level, 025° line direction. Data are from open file data distributed by GSWA under the terms of the WA Mining Act 1971. Data obtained from GSWA.
7. Canning magnetic and radiometric survey acquired by CRA Exploration Pty Ltd, in 1986. This survey was flown by Tesla Airborne Geoscience Pty Ltd on 100 m line spacing, 70 m above ground level, 025° line direction. Data are from open file data distributed by GSWA under the terms of the WA Mining Act 1971. Data obtained from GSWA.
A seamless grid of the total magnetic intensity with a cell size of 80 m was produced by grid merging the above data (Minty et al., 2003) with older regional data (1500 – 1600 m line spacing) extracted from the fourth edition of the magnetic anomaly map of Australia (Milligan and Franklin, 2004). Filters were applied to the merged grid to produce reduced-to-pole and first vertical derivative grids. The magnetic interpretation was conducted on a set of images produced from the merged grid. The images included colour and grey-scale versions, with and without sun-shading enhancement, of the total magnetic intensity, reduced-to-pole grid and grey-scale images of the vertical derivative grid with varying degrees of linear and histogram equalisation colour stretches.
15

Paterson Orogen Solid Geology – Explanatory Notes
Figure 5. Image of total magnetic intensity, reduced-to-pole with a north-easterly sun-shading, showing the locations of airborne geophysical surveys in the Paterson area. 1 – Paterson North, 2 – Paterson Central, 3 – Paterson Southeast, 4 – Anketell, 5 – Gunanya, 6 – Miles Ridge, 7 – Canning. The purple line shows the extent of the solid geology map.
Seamless potassium, uranium, thorium and total count grids were produced by grid merging the above surveys, with the exception of the Miles Ridge and Canning company surveys where no radiometric data were available. Pseudocolour images with a linear colour stretch were produced from the four merged grids as well as a RGB (red - potassium, green - thorium, blue - uranium) ternary image with both linear and histogram equalised colour stretches. The majority of the solid geology map is covered by ground gravity observations jointly acquired in 2005 by GA and GSWA (Fig. 6). The observations generally have a station spacing of 2.5 km, with
16

Paterson Orogen Solid Geology – Explanatory Notes
17
some infill stations purchased from Barrick Gold Corporation. The remainder of the map is covered by older regional data at mostly 11 km station spacing. Filtering was applied to the gridded Bouguer data to produce a first vertical derivative grid. The gravity interpretation was conducted on colour images of the Bouguer and first vertical derivative grids with and without sun-shading enhancement using linear and histogram equalisation colour stretches.
Figure 6. Image of the Bouguer gravity data with a north-easterly sun-shading showing the location of the detailed (2.5 km station spacing) survey. The purple line shows the extent of the solid geology map.

Paterson Orogen Solid Geology – Explanatory Notes
Drilling data The results of over 400 drillholes were available for the interpretation, mostly in the region of the southern Anketell 1:250 000 map sheet. Approximately 120 of the drillholes intersected rocks interpreted as Proterozoic ‘basement’. The locations of these holes are shown in Figure 7. The data were accessed from the GSWA Western Australia Mineral Exploration Index in 2005. Table 1 provides a summary of the drilling data.
Table 1. Summary of drilling data used for the solid geology interpretation.
REPORT NO: PROJECT COMPANY DATE
A38504 Anketell Project BHP Minerals 1992, 1993
A41252 Anketell Central Tenement BHP Minerals 1992, 1993
A50182 Paterson Gold Project, Central Anketell Tenement Group BHP Minerals 1991-1996
A30395 Anketell Shelf Diamond Exploration ACM Exploration 1989
A38505 Anketell Project BHP Minerals 1992
A40979 Anketell Project BHP Minerals 1993
A44911 Anketell Project, Central Tenement Group BHP Minerals 1994
A48384 Anketell Project, Central Tenement Group BHP Minerals 1995
A51334 Central Anketell Tenement Group BHP Minerals 1996
A53203 Anketell JV Project Croesus Mining NL 1997
A59483 Anketell JV Project Croesus Mining NL 1998
LIMITATIONS In some areas of the area, factors such as a paucity of outcrop, the non-unique geophysical signatures of geological units, uncertainty in stratigraphic position and a lack of variation in geophysical response have made interpretation problematic. In these areas, the geological interpretations are consistent with available data, but the constraints are such that other interpretations are possible. Several of these areas and some alternative interpretations are outlined below.
Large areas of granite are interpreted to be present under cover to the north and east of the Telfer deposit. This interpretation is based on the truncation of magnetic anomalies interpreted to be reflecting stratigraphic trends and the generally homogenous nature of the magnetic signature, which is coincident with a low Bouguer gravity response. However, the largest interpreted area of granite intrusion extends beyond the coverage of the high-resolution surveys and there is thus some uncertainty regarding the extent and position of granites within this area. There is a single open file company drillhole which intersected granite below cover (see drilling report no. A40979) towards the centre of this homogeneous geophysical domain.
In some areas, particularly in the Talbot Terrane, some linear magnetic features are at a high
angle to geological trends, suggesting that there is locally a structural control on the distribution of magnetite. Where there is local geological control, the interpretation of these features is relatively straightforward; however in areas beneath significant cover, the assumption that linear magnetic trends reflect stratigraphy might not always be valid.
18

Paterson Orogen Solid Geology – Explanatory Notes
Interpretation of lithological units within the poorly exposed Tabletop Terrane is hampered by: (1) a general lack of coherent magnetic features; (2) a lack of clear correlation between magnetic features and known geology; and (3) the low resolution of data in some areas of the terrane. As a result, the Tabletop Terrane has not been subdivided into distinct lithological units in this interpretation, though faults and shear zones have been interpreted where magnetic features are truncated or offset.
A large area of Coolbro Sandstone with no outcrop control has been interpreted to the north
of the Camel-Tabletop Fault Zone. This interpretation is based on a continuous low magnetic signature and coincident low Bouguer gravity response characteristic of the Coolbro Sandstone in other areas. However the structural relationship between this large area of interpreted Coolbro Sandstone and outcrop to the southwest was difficult to determine and the large-scale interpreted folding is only one of several possible structural interpretations
A large area of Malu Formation has been interpreted north of the Warrabarty prospect based
on the presence of a low Bouguer gravity response. While this interpretation has been linked to outcrop of the Malu Formation in the area around Muttarbarty Hill, the map pattern is noticeably different to elsewhere in the region and hence the outline on the solid geology should only be viewed as a rough guide to the location of the Malu Formation in this area.
It proved difficult to correlate the lithostratigraphy and structure across the Balfour Downs
1:250 000 and Throssell 1:100 000-scale map sheets. A reclassification of sedimentary rocks in this area was tentatively attempted. However, further work is recommended to adequately understand the architecture of this area and the significance of the Maroo Fault.
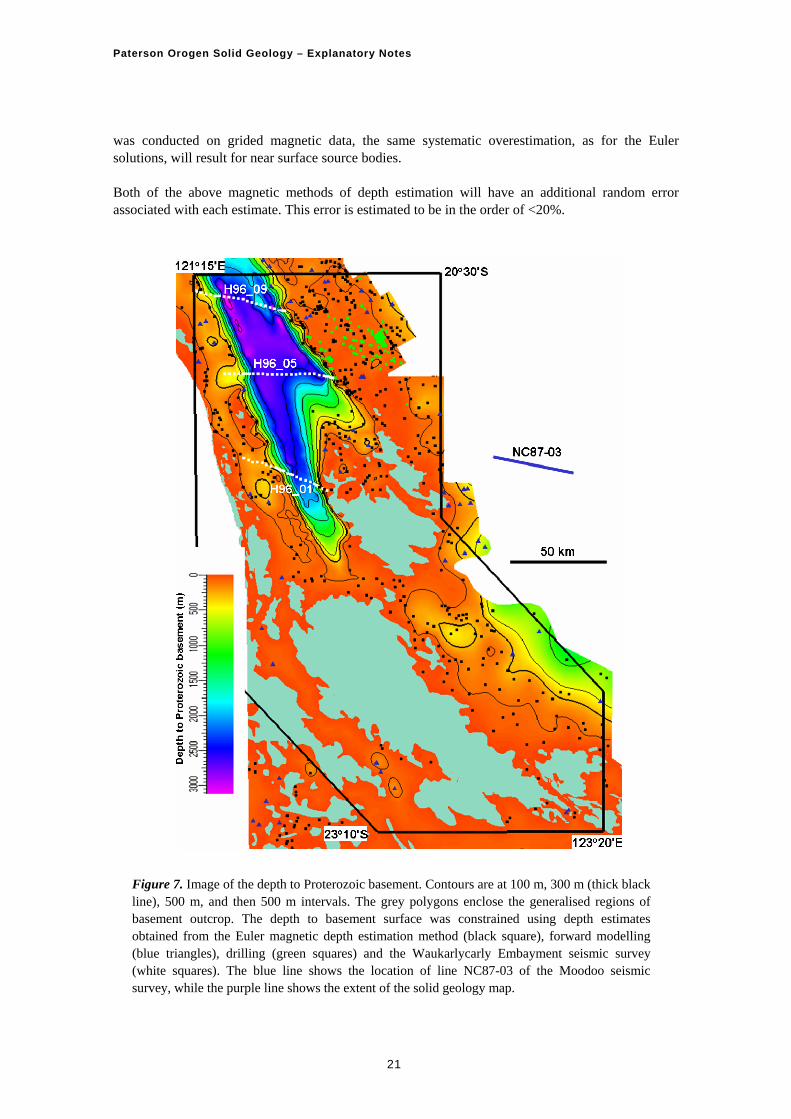
Depth to basement modelling A depth to Proterozoic basement surface was constructed in order to delineate the thickness of Phanerozoic cover rocks and unconsolidated sediment (Fig. 7). For the purposes of this study ‘basement’ refers to the Neoproterozoic and older rocks underlying the Canning Basin (i.e. the surface at which the solid geology interpretation has been generated). The 3D surface, constructed using GoCad software was constrained by drill-hole data, Euler depth solutions, forward modelling of magnetic data and interpreted depths from three seismic lines crossing the Waukarlycarly Embayment. The depth to Proterozoic basement is generally within 300 m of the surface with the following exceptions. The north-northwest trending Waukarlycarly Embayment in the northwest of the study area reaches depths of over 3000 m along seismic line h96_09 (Fig. 7) in the north, shallowing gradually to the south. The embayment also shallows to the north of this line, with a number of modelled depths to magnetic anomalies of 1600 m constraining the depths. The embayment shallows gradually to the southeast in the vicinity southeast of line h96_05 as delineated by Euler depth solutions. In the eastern part of the area, depth to Proterozoic basement increases towards the east, to a depth of approximately 300 m at the edge of the higher resolution airborne surveys. The basement is interpreted to gradually increase in depth eastwards into the Canning Basin. The basement surface reaches depths of approximately 1000 m further south at its eastern edge. These depths are supported by the Moodoo seismic line (NC87-03, Fig. 7) where the depth of what is interpreted as Proterozoic basement is approximately 1000 m at the western end of the line (based on velocity data see below),
19

Paterson Orogen Solid Geology – Explanatory Notes
and gradually increasing in depth until it crosses a graben with a depth of approximately 4000 m near the eastern end of the line. The depth to basement surface should be used as a guide. With the exception of the drill-hole data, there are uncertainties involved in estimating the depths based on the magnetic methods (Euler depth solutions and forward modelling), as well as the seismic data (see below). EULER DEPTH SOLUTIONS The Euler depth solutions were generated using the Intrepid geophysical software, applied to grided magnetic data. The solutions were generated using the ‘extended’ Euler deconvolution method as implemented by FitzGerald et al. (2004) following the methods of Mushayandebvu et al. (2001) and Nabighian and Hansen (2001). The method tends to generate a number of solutions for a single anomaly corresponding to different values of structural index (SI). The SI of a solution is used as a way of associating the ‘shape’ of the magnetic anomaly with a particular source body. The most accurate depth estimate is given by the appropriate SI for a particular source body. Experience from previous depth to basement studies suggests that the most accurate depth solutions are those for a SI of 0.5 that are associated with curvilinear magnetic anomalies. An SI of 0.5 theoretically represents a solution for a thick dyke-like, or tabular source body (FitzGerald et al., 2003). In this study, therefore, only solutions for discrete elongate shaped anomalies were considered and for these anomalies the solutions for an SI of 0.5 were considered to be appropriate. The Euler depth solutions represent the depth to the top of tabular (dyke-like) magnetic bodies within the Proterozoic basement. Mafic dykes are widespread in the area, intruding Neoproterozoic and older rocks and overlain by Phanerozoic sedimentary rocks of the Canning Basin. Only depth solutions to magnetic sources interpreted to be at or near the top of basement were included. Magnetic sources interpreted to exist within the Phanerozoic cover, such as palaeochannels and strand lines, were excluded. Basement rocks in the Paterson area are variably weathered, with weathering depths of up to 100 m or more. The magnetic properties of rocks tend to decrease with increased weathering due to magnetite destruction. The effects of weathering will, therefore, result in an overestimation of the depth to basement with the Euler depth solution lying somewhere between the basement to cover contact and the base of the weathering profile. The quality of the depth solution is also dependent on the data resolution. The majority of the study area is covered by airborne surveys with a line spacing of 400 m (Figure 5), which were then grided to an 80 m cell size. Unfortunately high frequency anomalies, sourced from near surface bodies, are not adequately sampled by the 80 m grid data, resulting in inaccuracies when estimating the depth to these bodies. Depth estimates of less than approximately 150 m systematically overestimate the true depth to the top of the magnetic source. Depth solutions for the Anketell airborne survey (150 m line spacing) were generated from a grid with a 30 m cell size. The high frequency magnetic anomalies sourced by near surface magnetic bodies are adequately sampled by the 30 m cell size grid resulting in no systematic overestimating of depths. FORWARD MODELLING Forward modelling, using ModelVision, was carried out on selected anomalies where the Euler process failed to generate valid depth solutions. Only discrete anomalies were chosen that were interpreted as sourced by a tabular magnetic (dyke-like) body. The widths of the ‘dykes’ were set as the width of the anomaly at half maximum amplitude and are, therefore, simulating a thick dyke source or the theoretical equivalent of an Euler solution with an SI of 0.5. As the forward modelling
20
Paterson Orogen Solid Geology – Explanatory Notes
was conducted on grided magnetic data, the same systematic overestimation, as for the Euler solutions, will result for near surface source bodies. Both of the above magnetic methods of depth estimation will have an additional random error associated with each estimate. This error is estimated to be in the order of <20%.
Figure 7. Image of the depth to Proterozoic basement. Contours are at 100 m, 300 m (thick black line), 500 m, and then 500 m intervals. The grey polygons enclose the generalised regions of basement outcrop. The depth to basement surface was constrained using depth estimates obtained from the Euler magnetic depth estimation method (black square), forward modelling (blue triangles), drilling (green squares) and the Waukarlycarly Embayment seismic survey (white squares). The blue line shows the location of line NC87-03 of the Moodoo seismic survey, while the purple line shows the extent of the solid geology map.
21

Paterson Orogen Solid Geology – Explanatory Notes
SEISMIC DATA Three east-west trending seismic lines cross the Waukarlycarly Embayment in the northwest of the study area (Figure 7) were used to constrain depth to basement. The seismic lines were acquired for the Hunt Oil Company in 1986 and consist of 168 km of 2D reflection data (data provided by GA). Plots of the migrated seismic lines reveal a relatively simple graben structure bounded by steeply dipping faults and flanked by thin shelf sediments. The Permian to Cretaceous Canning Basin sediments, which constitute the embayment, are sub-horizontal, highly reflective and easily differentiated from rocks interpreted as Proterozoic basement. Average velocities of 2.5 km/s above 0.5 s two-way-time (twt) and 3.0 km/s below 0.5 s twt were used to generate estimated depths to the base of the embayment. These averaged velocities were based on a velocity analysis of seismic line NC87-03 from the 1987 Moodoo survey acquired by Nomeco Command NL. This line to the east of the study area (Figure 7), also crosses Permian to Cretaceous Canning Basin sediments that are assumed to have similar velocities to those within the Waukarlycarly Embayment. Depth estimates along the lines were generated for every 200th common depth point (CDP, approximately 2500 m) except where there was a sharp change in depths, in the vicinity of the bounding faults, where depth estimates were generated every 100th CDP. Construction lines were generated in GoCad linking the lines along the strike of the embayment in order to constrain the 3D surface between seismic lines.
Insights Arising from the Interpretation
Depth to basement modelling indicates that much of the Paterson area is covered by less than 300 m of Phanerozoic cover, making it accessible to under cover exploration. In contrast, the restricted Waukarlycarly Embayment has maximum basement depths of greater than 3000 m.
The northern part of the area is covered by a veneer of recent sediment, but contains many
of the elements considered important in the development of Au-Cu mineralisation at Telfer. These include: (1) a suitably aged sedimentary succession (Maidment et al., in prep.); (2) granites that have intruded a previously deformed succession; (3) anticlinal structures suitable for focusing fluids; and (4) interbedded pelite and psammite, indicating a favourable rheological contrast for dilation and fluid focusing during deformation.
Numerous granitic bodies have been interpreted beneath relatively shallow cover to the
north and east of Telfer. These include both oxidised (high magnetisation) and reduced (low magnetisation) intrusives (Budd et al., 2002), with a large igneous complex interpreted to occur ca. 75 km NNE of Telfer. In the Telfer area, Au mineralisation is considered to be related to the intrusion of similar granites (Goellnicht et al., 1989, 1991; Ferguson et al., 2005) and thus the area to the north and east of Telfer can be considered prospective for similar styles of mineralisation.
Sedimentary rocks in the McKay Range area in the southern part of the study area have
previously been assigned to the Tarcunyah Group. However, an alternative interpretation, adopted in this study, is that the units in this area are instead part of the Yeneena Basin. This interpretation is consistent with the stratigraphic position of these sedimentary rocks, which unconformably overlie metamorphic rocks of the Rudall Complex, and the general order of superposition of rock units. This area has a higher prospectivity for base metals and uranium rather than gold, given that no Neoproterozoic granites have been identified in this part of the region. In this interpretation the Broadhurst Formation, which is prospective for base metal mineralisation, is interpreted to be present beneath relatively shallow cover extending away from the McKay Range.
22

Paterson Orogen Solid Geology – Explanatory Notes
The presence of the Malu Formation in the area around Muttarbarty Hill (mapped on the Braeside 1:100 000 map sheet) was confirmed, indicating that the Telfer stratigraphy crops out on the western side of the Waukarlycarly embayment. A gravity low north of Muttarbarty Hill has been interpreted to represent further extensions of the Malu Formation. On structural grounds it is inferred that this formation continues north parallel to the Vines Fault in the region mapped as undifferentiated Yeneena Basin.
The contact between the Coolbro Sandstone and the overlying Broadhurst Formation is a
zone of higher magnetisation in the vicinity of the Camel-Tabletop Fault Zone. The magnetisation has an irregular distribution, but can be used to trace the stratigraphic contact beneath cover in several areas. The magnetisation has been linked to hydrothermal alteration in the Cottesloe Syncline area (Czarnota et al., in prep.), and it is interpreted that the stratigraphic boundary acted as a barrier to fluid flow and as a redox boundary. The coincidence of this magnetisation with the general trend of the Camel-Tabletop Fault Zone suggests that this basement structure was associated with hydrothermal alteration in the area (cf. Bagas and Lubieniecki, 2000).
During the Miles Orogeny NNW-striking faults such as the Vines and other related
structures underwent dextral strike-slip offset and south of Kintyre are related to significant stratigraphic thickness variations, indicating these structures are reactivated growth faults. Reverse movement was predominantly taken up on steeply dipping NW-SE striking structures, which reactivate Mesoproterozoic structures in the Rudall Complex. An exception to this pattern is the Camel-Tabletop Fault Zone, which accommodated significant movement in the Palaeo- to Mesoproterozoic, but was only marginally reactivated during the Miles Orogeny, as shown by the continuity of Yeneena Basin sedimentary rocks in the Cottesloe Syncline area.
The curvilinear magnetic anomalies north of Minyari are interpreted to be related to the
magnetic high at the base of the Wilki Formation. This interpretation is supported by field examination of outcropping sandstone units which overlay these lineaments. Sandstone in this area consists of upward-coarsening, fine to coarse sandstone couplets characteristic of the Wilki Formation. The implication of this correlation is that the Lamil Group (which hosts Telfer) likely continues north under cover.
Several small Neoproterozoic granites have a zone of high magnetisation at their margin,
which could reflect magnetite formation during contact metamorphism or metasomatism. This feature has assisted in identifying buried, reduced granites that have a low magnetisation, similar to their host rocks.
Units mapped as banded iron-formation in the Rudall Complex range from highly
magnetised to weakly magnetised. This could reflect original Fe content of these metasedimentary rocks and/or oxidisation of magnetite due to weathering or alteration. Thus, detailed mapping of Fe-rich units beneath cover should not solely focus on high intensity magnetic anomalies.
Most faults and shear zones in the region form linear magnetic lows, however some linear
magnetic anomalies in the Rudall Complex cross-cut stratigraphic trends, suggesting that shear zones or structural foliations were sites of magnetite formation and possibly other metals. These zones of higher magnetisation might thus form markers indicating fluid flow pathways.
23
Paterson Orogen Solid Geology – Explanatory Notes
Conclusions Interpretation of recently acquired geophysical datasets in the Paterson area has shown that there are large parts of the area beneath relatively shallow cover that are prospective for Au-Cu, base metals and uranium mineralisation. These areas include a shallowly covered domain to the north of Telfer, where deformed Neoproterozoic sedimentary rocks are intruded by granites with geophysical characteristics similar to those interpreted to be related to mineralisation at Telfer. A second area in the south and west of the region contains sedimentary rocks previously here interpreted to be part of the Yeneena Basin and prospective for base metals and uranium mineralisation. The map can be down loaded from https://www.ga.gov.au/minerals/research/pubspres.jsp.
References Aditya Birla Minerals Annual Report, 2006.
http://www.adityabirlaminerals.com.au/Aditya%20Birla%20Mineral%20Resources%20Limited%20Annual%20Report%202006.pdf viewed on the 25 June 2007.
Anderson, B. R., Gemmell, J. B. and Berry, R. F., 2001. The geology of the Nifty copper deposit,
Throssell Group, Western Australia; implications for ore genesis. Economic Geology and the Bulletin of the Society of Economic Geologists, 97, 1535-1565.
Bagas, L., 1997. Gunanya, W.A. Sheet 3451; Geological Survey of Western Australia, 1:100 000
Geological Series. Bagas, L., 1999. Rudall, W.A. Sheet SF 51-10; Geological Survey of Western Australia, 1:250 000
Geological Series. Bagas, L., 2000. Paterson, W.A. Sheet 3354; Geological Survey of Western Australia, 1:100 000
Geological Series. Bagas, L., 2004a. Proterozoic evolution of the northwest Paterson Orogen, Western Australia:
Precambrian Research, 128, 475–496.
Bagas, L., 2004b. The Neoproterozoic Throssell Range and Lamil Groups, northwest Paterson Orogen, Western Australia: Geological Survey of Western Australia Record, 2004/15, 18p.
Bagas, L., 2005, Geology of the Lamil 1:100 000 sheet: Geological Survey of Western Australia,
1:100 000 Geological Series Explanatory Notes, 22p. Bagas, L., Camacho, A. and Nelson, D. R., 2001. Are the Neoproterozoic Lamil and Throssell
Groups of the Paterson Orogen allochthonous? Geological Survey of Western Australia Annual Review, 45-52.
Bagas, L. and Lubieniecki, Z., 2000. Copper and associated mineralization along the Camel-
Tabletop Fault Zone in the Paterson Orogen: Geological Survey of Western Australia, Annual Review 1999-2000, 36–41.
24

Paterson Orogen Solid Geology – Explanatory Notes
Bagas, L., and Nelson, D.R., 2007. Provenance of Neoproterozoic sedimentary rocks in the northwest Paterson Orogen, Western Australia: Northern Territory Geological Survey, Special Publication, Central Australian Basins Symposium.
Bagas, L. and Smithies, R. H., 1998. Connaughton, W.A. Sheet 3452; Geological Survey of Western
Australia, 1:100 000 Geological Series. Bagas, L. and Smithies, R. H., 1999. Blanche-Cronin, W.A. Part Sheets 3551 and 3552; Geological
Survey of Western Australia, 1:100 000 Geological Series Special. Budd, A. R., Wyborn, L. A. I. and Bastrakova, I. V., 2002, The metallogenic potential of Australian
Proterozoic granites: Geoscience Australia Record, 2001/12. Chin, R. J., Hickman, A. H. and Towner, R. R. 1982. Paterson Range, W.A. (2nd edition) Sheet SF-
51-6; Geological Survey of Western Australia, 1:250 000 Geological Series. Dunphy, J. M. and McNaughton, N. J., 1998, Geochronology of the Telfer granitoids: zircon and
titanite U–Pb SHRIMP data: Geological Society of Australia, Abstracts, 49, 127. Durocher, K. E., Kyser, T. K., Marlatt, J. and Hanly A. 2003. New 40Ar/39Ar ages from the central
Paterson Orogen Western Australia. Australian Journal of Earth Sciences, 50, 601-610. Ferguson, K. M., Bagas, L. and Ruddock, I., 2005. Mineral occurrences and exploration potential of
the Paterson area. Geological Survey of Western Australia, Record, 97, 43p. FitzGerald, D., Reid, A. and McInerney, P., 2003. New discrimination techniques for Euler
deconvolution: 8th SAGA Biennial Technical Meeting and Exhibition, October 2003. FitzGerald, D., Reid, A. and McInerney, P., 2004. New discrimination techniques for Euler
deconvolution: Computers and Geosciences, 30, 461-469. Goellnicht, N. M., Groves, D. I. and McNaughton, N. J., 1991. Late Proterozoic fractionated
granitoids of the mineralized Telfer area, Paterson Area, Western Australia. Precambrian Research, 51, 375-391.
Goellnicht, N. M., Groves, D. I., McNaughton, N. J. and Dimo, G., 1989. An epigenetic origin for
the Telfer gold deposit. In: The geology of gold deposits: the perspective in 1988, edited by R. R. Keays, W. R. H. Ramsay and D. I. Groves, Economic Geology, Monograph, 6, 151-167.
Grey, K., Hocking, R. M., Stevens, M. K., Bagas, L., Carlsen, G. M.., Irimies, F., Pirajno, F.,
Haines, P. W. and Apak, S. N., 2005. Lithostratigraphic nomenclature of the Officer Basin and correlative parts of the Paterson Orogen, Western Australia: Geological Survey of Western Australia, Report 93, 89p.
Haynes, D. W., Brooke, W. J. L. and Mazzoni, P. P., 1993. Application of conceptual models for
sediment-hosted ore deposits in the discovery of the Nifty copper and adjacent zinc-lead deposits, Yeneena Basin, Western Australia. Special Paper - Geological Association of Canada, 40, 75-88.
Hickman, A. H. and Bagas, L., 1996. Rudall, W.A. Sheet 3352; Geological Survey of Western
Australia, 1:100 000 Geological Series.
25

Paterson Orogen Solid Geology – Explanatory Notes
Hickman, A. H. and Bagas, L., 1998. Geology of the Rudall 1:100,000 sheet, Western Australia.
Geological Survey of Western Australia 1:100,000 Geology Series Explanatory Notes, 30 pp. Hickman, A. H. and Bagas, L., 1999. Geological evolution of the Palaeoproterozoic Talbot Terrane
and adjacent Meso and Neoproterozoic successions, Paterson Orogen, Western Australia. Geological Survey of Western Australia, Report 71, 91 pp.
Hickman, A. H. and Clarke, G. L., 1993. Broadhurst, W.A. Sheet 3353; Geological Survey of
Western Australia, 1:100 000 Geological Series. Jackson, D. G. and Andrew, R. L., 1990. Kintyre uranium deposit.; In: Geology of the mineral
deposits of Australia and Papua New Guinea. Ed: F. E. Hughes, Australasian Institute of Mining and Metallurgy, Melbourne, Monograph 14, 653-658.
McIntyre, A., Bagas, L., Cassidy, K., Czarnota, K., Neumann, N., Meixner, T. and Huston, D., 2005.
Proterozoic geology of the northwest Paterson Orogen, Western Australia: prospectivity, possibilities, progress, and the Permian Problem. Central Australian Basins Symposium Abstracts, Northern Territory Geological Survey, Darwin.
Milligan, P. R. and Franklin, R., 2004. Magnetic anomaly map of Australia, fourth edition (1:5 000
000 scale). Geoscience Australia. Minty, B. R. S., Milligan, P. R., Luyendyk, A. P. J. and Mackey T., 2003. Merging airborne
magnetic surveys into continental-scale compilations. Geophysics, 68, 988-995. Mushayandebvu, M. F., van Driel, P., Reid, A. B. and Fairhead, J. D., 2001. Magnetic source
parameters of two-dimensional structures using extended Euler deconvolution. Geophysics, 66, 814-823.
Nabghian, M. N. and Hansen, R. O., 2001. Unification of Euler and Werner deconvolution in three
dimensions via the generalised Hilbert transform: Geophysics, 66, 1805-1810. Nelson, D. R., 1995. Compilation of SHRIMP U–Pb zircon geochronology data, 1994. Geological
Survey of Western Australia Record 3, 244 pp. Nelson, D. R., 1996. Compilation of SHRIMP U–Pb zircon geochronology data, 1995. Geological
Survey of Western Australia Record 5, 168 pp.
Pirajno, F. and Bagas, L., 2007. A review of Australia's Proterozoic mineral systems and genetic models. Precambrian Research (in press).
Scrimgeour, I. R., Close, D. F. and Edgoose, C. J., 1999. Petermann Ranges, N.T., 2nd ed. Northern
Territory Geological Survey 1:250 000 Geological Series Explanatory Notes, 59 pp. Smith, S. G., 1996. Geology and geochemistry of the Warrabarty carbonate hosted Zn-Pb prospect,
Paterson orogen, Western Australia: Unpublished Ph.D. thesis, Hobart, Australia, University of Tasmania, 162 p.
26

Paterson Orogen Solid Geology – Explanatory Notes
Smithies, R. H. and Bagas, L., 1997a. High pressure amphibolite–granulite facies metamorphism in the Palaeoproterozoic Rudall Complex, central Western Australia. Precambrian Research, 83, 243–265.
Smithies, R. H. and Bagas, L., 1997b. The Tabletop Terrane of the Proterozoic Rudall Complex:
preliminary notes on the geology, granitoid geochemistry and tectonic implications. Geological Survey of Western Australia, Annual Review 1996–97, 89–94.
Tyler, I. M., Pirajno, F., Bagas, L., Myers, J.S. and Preston, W., 1998. The geology and mineral
deposits of the Proterozoic in Western Australia. AGSO Journal of Australian Geology and Geophysics, 17, 223–244.
Tyler, I. M. and Hocking, R. M., 2002. A revision of the tectonic units of Western Australia.
Geological Survey of Western Australia, Annual Reviews 2000-01, 33-44. Walter, M. R., Veevers, J. J., Calver, C. R. and Grey, K., 1995, Neoproterozoic stratigraphy of the
Centralian Superbasin, Australia. Precambrian Research, 73, 173–195. Williams, I. R., 1989. Balfour Downs, W.A. (2nd edition); Geological Survey of Western Australia,
1:250 000 Geological Series Williams, I. R., 1992, Geology of the Savory Basin, Western Australia: Geological Survey of
Western Australia, Bulletin 141, 115p. Williams, I. R. and Bagas, L., 1998. Poisonbush, W.A. Sheet 3252; Geological Survey of Western
Australia, 1:100 000 Geological Series. Williams, I. R. and Bagas, L., 1999. Throssell, W.A. Sheet 3253; Geological Survey of Western
Australia, 1:100 000 Geological Series. Williams, I. R., and Myers, J. S., 1990. Paterson Orogen. In: Geology and Mineral Resources of
Western Australia. Geological Survey of Western Australia, Memoir 3, 282–283. Williams, I. R. and Trendall, A. F., 1998a. Pearana, W.A. Sheet 3154; Geological Survey of Western
Australia, 1:100 000 Geological Series. Williams, I. R. and Trendall, A. F., 1998b. Braeside, W.A. Sheet 3155; Geological Survey of
Western Australia, 1:100 000 Geological Series. Williams, I. R. and Trendall, A. F., 1998c. Isabella, W.A. Sheet 3156; Geological Survey of Western
Australia, 1:100 000 Geological Series. Williams, I. R. and Williams, S. J., 1980. Gunanya, W.A. Sheet SF51-14; Geological Survey of
Western Australia, 1:250 000 Geological Series. Yeates, A. N. and Chin, R. J., 1979. Tabletop, W.A. Sheet SF51-11; Geological Survey of Western
Australia, 1:250 000 Geological Series.
27

Paterson Orogen Solid Geology – Explanatory Notes
Acknowledgements Aditya Birla kindly provided access to detailed EM data in the Nifty area. David Huston and Richard Lane (GA) provided constructive reviews.
28

Paterson Orogen Solid Geology – Explanatory Notes
29
Appendix – Interpretation and datasets used
Figure A1a. Solid geology interpretation of the Paterson Area.

Paterson Orogen Solid Geology – Explanatory Notes
30
Figure A1b. Legend for solid geology interpretation of the Paterson Area.

Paterson Orogen Solid Geology – Explanatory Notes
31
Figure A2. Geological domains in the Paterson Area, derived from generalisation of the solid geology interpretation.
121º 15’E 20º 30’S
23º 10’S 123º 20’E
Legend

Paterson Orogen Solid Geology – Explanatory Notes
32
Figure A3. Locations of drillholes accessible for this study.
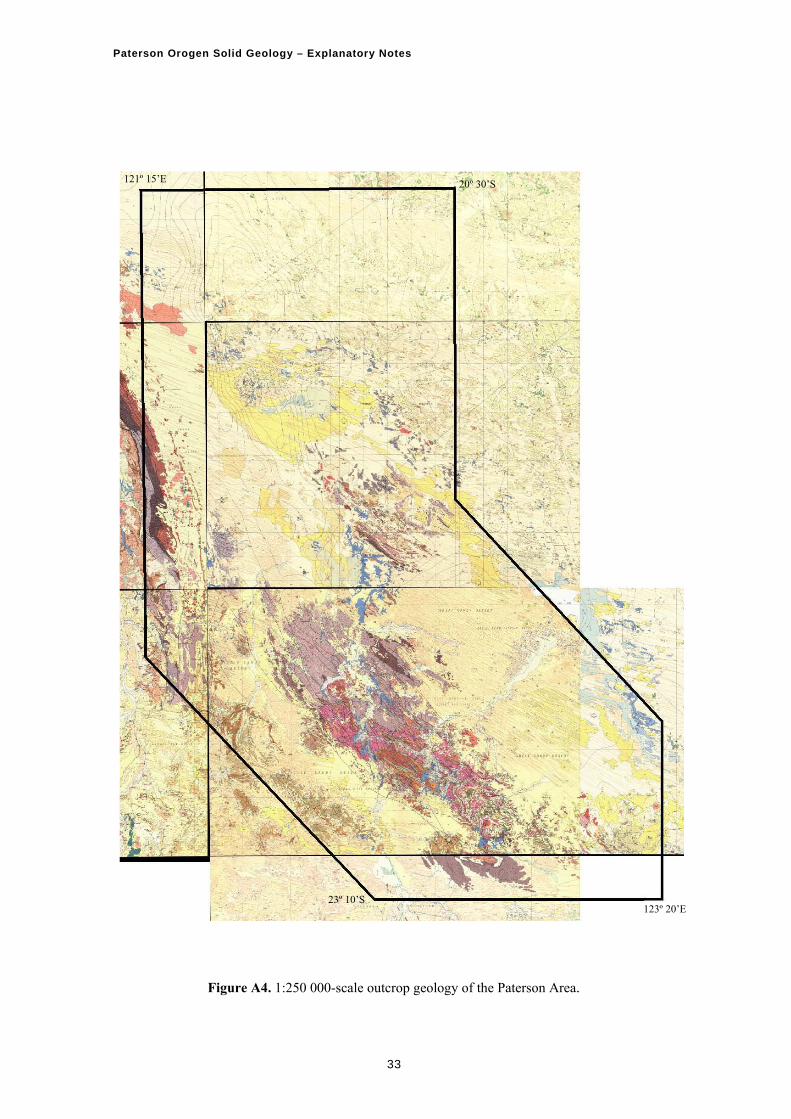
Paterson Orogen Solid Geology – Explanatory Notes
33
Figure A4. 1:250 000-scale outcrop geology of the Paterson Area.
121º 15’E 20º 30’S
23º 10’S 123º 20’E

Paterson Orogen Solid Geology – Explanatory Notes
34
Figure A5. Total magnetic intensity (reduced to pole) image of the Paterson Area.
121º 15’E 20º 30’S
23º 10’S 123º 20’E

Paterson Orogen Solid Geology – Explanatory Notes
35
Figure A6. Ternary radiometric image (Potassium – red; Thorium – green; Uranium – blue)
121º 15’E 20º 30’S
23º 10’S 123º 20’E
Paterson Orogen Solid Geology – Explanatory Notes
36
.
Figure A7. Bouguer gravity image of the Paterson Area.
121º 15’E 20º 30’S
23º 10’S 123º 20’E

Paterson Orogen Solid Geology – Explanatory Notes
37
Figure A8. Interpreted depth to Proterozoic basement of the Paterson Area.