patent value and the tobin’s q ratio in … · 0 . patent value and the tobin’s q ratio in...
TRANSCRIPT

0
PATENT VALUE AND THE TOBIN’S q RATIO IN MEDIA SERVICES*
by
Kathryn Rudie Harrigan
Henry R. Kravis Professor of Business Leadership
Columbia University, 701 Uris Hall, New York, NY 10027 USA, 001-212-854-3494,
[email protected] [corresponding author]
Maria Chiara DiGuardo
Associate Professor
University of Cagliari, Viale Fra Ignazio 74 – 09123, Cagliari, Italy, 039- 0706753360, [email protected]
JEL Codes: L10, L25, L29, L82, O31, O32 KEYWORDS: Backward citations; Tobin’s q; radical invention; patent scores; innovation
* Suggestions were offered by Douglas Miller, Damon Phillips, Evan Rawley, David Ross and Andrea Prat. Research assistance was provided by Jesse Garrett, Donggi Ahn, Hongyu Chen, Elona Marku-Gjoka, the Patent Office of the Sardegna Ricerche Scientific Park and Thomson Reuters

1
PATENT VALUE AND TOBIN’S q RATIO IN THE MEDIA-SERVICES INDUSTRY
Abstract
Changes in a firm’s backward-dispersion patent-citation score are a useful, non-financial
indicator of patent value that is positively-related to Tobin’s q. V-scores, which analyze content
patterns between patents’ technological-class codes and those of their antecedents, provide con-
temporaneous information for investors to assess firms’ economic prospects that is more time-
sensitive than forward-looking information such as forward citations. V-score analysis offers
useful insights about the nature of post-acquisition learning within technologically-tumultuous
industries like media-services.
KEYWORDS: L10, L25, L29, L82, O31, O32

2
PATENT VALUE AND THE TOBIN’S Q RATIO IN MEDIA SERVICES
Patents represent valuable corporate resources which can reflect an inventive organiza-
tion’s potential to remain competitive by offering new (or improved) products. Prior-art citations
(contained in patent examiners’ reports) list the technologies which inventors have built upon in
order to be granted a particular patent. The value created by patents arises, in part, from the or-
ganizational learning which their patented inventions embody. For investors, patents are positive
indicators of a firm’s future earnings potential (Bessen, 2009; Bosworth and Rogers, 2001; Hall,
Jaffe, and Trajtenberg, 2005); clues about the nature of the firm’s organizational learning may
inform investors about the firm’s future value.
Fleming (2001) and Fleming and Sorenson (2001) used focal patents’ prior-art cita-
tions—including the age and frequency with which focal patents’ technology-classification codes
and combinations of other technology-classification codes occurred—to predict technological
value (often termed “patent quality”), but they did not relate their results to the valuation of par-
ticular firms. Patent counts and numbers of cited prior-art patents were used by Hirschey, Rich-
ardson, and Scholz (2001) to help investors to assess specific firms’ economic prospects (by as-
sessing the market value of their R&D expenditures), but they did not use measures of the con-
tent patterns of patents’ backward citations in their assessment of patent quality—although they
did consider the relative newness of the backward-cited patents (which they counted as an addi-
tional indicator of patent quality), as did Sørensen and Stuart (2000) in their study of organiza-
tional aging and innovation. With these notable exceptions, much research concerning patent
value has used patent counts or forward-looking, future prior-art measures to predict patent qual-
ity, e.g., how many citations each patent has garnered from subsequent inventors (Aggarwal and
Hsu, 2014; Hall, Jaffe, and Trajtenberg, 2005). Forward-looking, future prior-art citation analysis

3
is a less-helpful indicator for investors because forward citations require time for a patent to
amass (Jaffe, Trajtenberg, and Henderson, 1993)—which reduces their usefulness for investors
as a contemporaneous, non-financial indicator of patent value.
Tobin’s q (which compares a firm’s market value to book value) reflects investors’ ex-
pectations that are based upon then-available evidence. Information about patent content which
is available at the time when such patents are granted (such as backward-looking, prior-art cita-
tion analysis) provides a more-timely prediction for investors about an organization’s economic
prospects than do forward-oriented measures of patent phenomena. This paper examines timely,
non-financial indicators of patent value by analyzing the content patterns of their prior-art cita-
tions vis-a-vis a focal patent’s grant. Our measure is a “backward-dispersion patent-citation
score” that is similar in spirit to the originality measure of Trajtenberg, Henderson, and Jaffe
(1997) because it emphasizes variance in the content of backward citations as they relate to the
technology-class codes of a focal patent. We use the backward-dispersion patent-citation score
(hereinafter called the V-score) to suggest expectations which investors may hold concerning the
value of a patent’s provenance as reflected in its Tobin’s q ratio. Using acquisitions as a catalyst
for finding potential novelty in combining firms’ intellectual antecedents, we test the relationship
of V-scores to investor expectations. We propose that patent-content patterns should be consid-
ered when predicting streams of future revenues that will be enjoyed when firms’ patents are ex-
ploited commercially.
1.0.PATTERNS OF PATENT CONTENT
When a firm’s market value rises or falls, its stock price fluctuations reflect the factoring
in of newly-available information which affects investors’ expectations of how well a firm will
perform. Backward-citation analysis of patent content is an example of information which may

4
be valuable for (but has not yet been widely applied to) assessing a firm’s knowledge-based
sources of advantage. If patents are indeed valuable corporate resources, they represent a reposi-
tory of knowledge in which the inventive organization has invested. The record of a focal pa-
tent’s prior-art citations—which is prepared by firms’ lawyers and patent examiners in order to
grant a patent’s claims of novelty (Alcácer and Gittelman, 2006; Alcácer, Gittelman, and Sam-
pat, 2009)—indicates the range of technological streams that were synthesized in order to create
an invention. Comparison of a focal patent’s granted claims with those of its knowledge anteced-
ents (as evidenced by its V-score patterns) can suggest the relative novelty (for that particular
firm) of its invention.
Our dependent variable, Tobin’s q, is a measure which has been used to reflect investors’
expectations concerning the value of firms’ strategic decisions, e.g., diversification strategy
(Montgomery, 1982; Montgomery and Wernerfeldt, 1988), acquisitions (Anand and Singh, 1997;
Lang and Stulz, 1994), or expectations concerning the quality of firms’ resources, e.g., “patent
quality” (Chen and Shih, 2011). Because of the way in which focal-patent quality has largely
been measured in the past (by looking forward—at users’ citations—instead of looking backward
for other patterns of value creation), studies which have related Tobin’s q to focal-patent quality
have inferred the value of the firm’s patents by counting them, using proxies like the number of
citations that a focal patent has received (forward citations) or calculating other forward-oriented
measures of patent quality (Griliches, 1981; Hall, Jaffe and Trajtenberg, 2005). Forward citations
may suggest the relative importance of an invention as a precedent for subsequent innovations;
focal patents receiving many user citations have been built upon in many successive inven-
tions—demonstrating the patent’s usefulness or technological importance (Fleming, 2001)—and

5
such inventions are sometimes called “gateway” or “high-quality” patents because they can gar-
ner substantial licensing fees or block subsequent economic activity if the knowledge that they
control is not licensed out (Galasso and Schankerman, 2010; 2014; Lanjouw and Schankerman,
2001; Lemly and Shapiro, 2007; Serrano, 2010; Ziedonis, 2004).
1.1. Forward-Citation Analyses and External Users of Technology
Forward-looking analyses of patent value (such as those using counts of future prior-art
citations) are tests of user efficacy; forward-citation counts offer evidence that patented
knowledge has been built upon by independent researchers, as well as by the firm owning the fo-
cal patent (which Sørensen and Stuart (2000) termed “self-citing” patents). By looking forward,
focal-patent value can be inferred from whether particular patent applications are renewed, or not
(Harhoff, Narin, Scherer, and Vopel, 1999; Lanjouw, Pakes and Putnam, 1998), whether patent
holders receive licensing rents in the form of royalties (Kamien and Tauman, 1986; Sherry and
Teece, 2004) and at what price focal patents have been sold (Gambardella, Giuri, and Luzzi,
2007; Hirschey and Richardson, 2003; Nair, Mathew, and Nag, 2011; Serrano, 2010). Because
patents can possess hold-up value if they are highly-cited, royalty revenues would increase if
they were licensed (Bessen, 2009; Branstetter, Fisman and Foley, 2006; Lemley and Shapiro,
2007; Ziedonis, 2004).
Forward-looking measures, such as the number of forward citations that focal patents
garner, are plausible discriminators of valuable patents because highly-cited patents are pre-
sumed to cover the gateway knowledge which subsequent patents must build upon (Fleming and
Sorenson, 2001; Mariani, 2004; Nemet and Johnson, 2012). Future prior-art citations of patents
have been used to indicate the presence of valuable resources (Miller, 2004; 2006), as a measure

6
of focal patent quality (Hagedoorn and Cloodt, 2003; Hall, Jaffe, and Trajtenberg, 2001; Trajten-
berg, 1990), as an indicator of knowledge flows―especially in spillovers (Danguy, De Rassen-
fosse, and Van Pottelsberghe de la Potterie, 2013; Jaffe, 1986; Jaffe, Fogarty, and Banks, 1998;
Mowery, Oxley, and Silverman, 1996), as an indicator of the relative importance of a focal in-
vention (Lee, Lee, Song, and Lee, 2007), and as evidence of firms’ strategic intent (Lanjouw and
Schankerman, 2001). The value of firms’ “knowledge stocks” is frequently estimated by using
absolute patent counts (Griliches, 1981; Hall, Griliches, and Hausman, 1986) or forward-citation
counts (Hall, Jaffe, and Trajtenberg, 2001; 2005) and through these types of studies, the value of
firms’ knowledge stocks has been linked to market value.
The Tobin’s q ratio reflects perceived value from focal-patent ownership as a stream of
rents whose nature is initially unknown (without further information). Analysis of forward-cita-
tion counts may provide some additional information about earnings potential, but forward cita-
tions are notoriously skewed in their distribution (Bessen, 2009) because the top ten percent of
all patents have garnered 48 percent to 93 percent of such financial payoffs (Scherer and Har-
hoff, 2000). Reliance on forward-citation indicators suggests that the market speculates about
the promise of unknown future customers and values highly the most-cited patents—not the ones
that prove to be most-widely cited by users from diverse technological streams (Hall, Jaffe, and
Trajtenberg, 2005).
We tested “straw man” hypotheses to reflect the assumption that Tobin’s q is sensitive to
patent counts, especially to patents having many forward citations, and a negative relationship
was found for all periods. The negative relationship persisted whether the patent count was
based on a lagged seven-year count of patents or a cumulative count based on post-acquisition

7
patents only. We found no support for the argument that investors seeking variously-timed re-
turns would value firms having several patents more highly than firms who had only a few pa-
tents. We found no support for the argument that investors valued the number of forward cita-
tions that firms’ patents received, but we found that the Tobin’s q ratio was positively influenced
by possession of highly-cited patents in the seventh year after an acquisition was consum-
mated—suggesting that investors consider past patenting successes when valuing firms’ futures.
Ahuja and Lampert (2001) might argue that our research design did not allow enough time for
forward-citation evidence to accumulate—which is a reasonable objection, except that our count
was forward-biased to include all possible forward citations that were garnered for as many as
twelve years while the bulk of forward citations typically occur shortly after a patent’s grant
(Jaffe, Trajtenberg, and Henderson, 1993).
We concluded from our “straw hypothesis” tests that having highly-cited patents repre-
sented market signals that firms have been innovative, but absolute patent counts did not have
predictive value for investors in the case of media services. Forward citations of patents indi-
cated the relative strength of the innovation signal as it pertained to forward-looking knowledge
streams, but neither patent counts nor forward-citation counts proved to be useful contemporane-
ous data for predicting post-acquisition patenting performance. Forward-looking approaches to
describing valuable focal patents―royalties, selling prices, and forward-looking, future prior-art
citation measures―do not adequately capture the strategic potential of patents as being the type
of organizational asset which can improve firms’ competitiveness; they do not anticipate the ef-
fect of a patent’s grant on higher shareholder returns. Forward-looking measures are ex ante and
do not adequately capture the potential value that is created at the time when an organization
8
learns how to integrate knowledge acquired from diverse technological cores and incorporate in-
sights (which may be radical for them) into product offerings. Backward-looking, prior-art-cita-
tion information better indicates an organization’s inventive prowess at the time of a patent’s in-
vention; the time-value of money favors performance indicators that are more contemporaneous
than the duration of time that elapses before evaluations based on forward citations can be made.
Using our V-score methodology, we examined whether investors would value firms more highly
who had broadly expanded the diversity of knowledge which is synthesized in their patents.
1.2. Backward-Citation Analysis and Organizational Learning
The market values the possession of patents as a proxy for the underlying R&D activities
in which firms have engaged (Bosworth and Rogers, 2001; Patel and Ward, 2011) and for other
positive attributes associated with organizational learning. The granting of patents reflects an as-
signee’s competence in a core technological field (Chen, 2010; Patel and Pavitt, 1997;
Vanhaverbeke, Gilsing, Beerkens, and Duysters, 2009) and we treated the technology-class
codes of a focal patent’s grant as core in our analysis of the nature of organizational learning.
Fleming (2001) established the value of incremental learning—that recombination of familiar
components increases an invention’s usefulness by enabling inventors to leverage past learnings
and that combination familiarity facilitates the improvement of previous inventions (through in-
cremental improvement). But Fleming (2001) also argued that novelty arises from those recom-
binations which were previously untried. The paucity of continuing investigation concerning the
content of firms’ patent antecedents is puzzling, given the ready availability of patent-examiner
information and the importance of knowledge-based explanations of firm performance in under-
standing how organizations can create new knowledge to renew themselves (Felin and Hesterly,
2007; Grant, 1996; Kapoor and Lim, 2007). The richness of information available in the patent

9
examiner’s report can be mined extensively for meaningful measures of firms’ knowledge-syn-
thesis capabilities that could be of interest to investors (Roach and Cohen, 2013).
The backward citations that should be of greatest interest for predicting Tobin’s q are
those citations belonging to technology fields which are different from the technology-class
codes where a focal patent has been granted; Trajtenberg (1990) referred to those types of prior-
art citations as representing value that has been “spilled-over to other areas,” and they are some-
times called out-of-the-box inventions because they integrate unexpected technological
knowledge. For their characterization of focal-patents’ antecedents, Trajtenberg, Henderson, and
Jaffe (1997) created a weighted-dispersion index to score the breadth of sources that had been
built upon by firms’ focal patents (called “originality”), but it was not tested for its relationship
to Tobin’s q. Using their measure, Serrano (2010) found that the most “original” of a firm’s focal
patents tended to be cited by the broadest range of subsequent users (a characteristic that Trajten-
berg, Henderson, and Jaffe, (1997) called “generality”), but Nemet and Johnson (2012) disa-
greed—finding that citations to external prior art were significantly less important to predicting
future prior-art citations than were backward citations that were made in the same technology
class as the focal-patents’ class—a finding which would indicate that investors value exploitation
of extant knowledge and local search more highly than exploration activity (March, 1991;
Rosenkopf, and Nerkar, 2001; Lavie, and Rosenkopf, 2006).
Many technological fields have been converging in the post-Internet era; the technologi-
cal evolution of providing online content has been affected by the novel recombinations that in-
ventors are exploring, as have other Internet-facilitated industries. Although Nemet and Johnson
(2012) found that the most-important inventions did not involve the transfer of new knowledge

10
from one technological domain to another, there is merit in examining whether the market has
valued patterns of knowledge cross-pollination.
2.0.TOBIN’S q AND EXPECTATIONS ABOUT PATENTS
The Tobin’s q ratio (the ratio of market value to replacement value) can reflect whether
investors expect higher future value creation―or have lower expectations of a firm’s future pro-
spects. The Tobin’s q ratio indicates whether a firm’s stock is currently overvalued (high ratio)
or undervalued (low ratio). Its salience as a performance measure is reflected in the frequent
charge to managers to maximize shareholder value through their discretionary decisions. As a
forward-looking measure (reflecting investor expectations), Tobin’s q considers future as well as
current returns. Market hype and speculation may increase the ratio’s numerator (an asset’s cur-
rent price), but the intellectual capital of corporations (their technology, organizational learning
capacity, patent stocks, goodwill or other salient intangible assets) is not typically reflected in
full in the ratio’s denominator.
2.1. Tobin’s q and Expectations about Patent-Content Patterns
Analysis of focal-patents’ prior-art content provides information that knowledgeable in-
vestors could factor into their valuations of firms as soon as a patent examiner’s report is issued
(instead of waiting for information contained in forward citations of the focal-patent to become
available). Because of the time-value of information, it is reasonable to expect that V-scores will
show the greatest impact on investor expectations in the first years after a patent’s award—be-

11
fore knowledge of a firm’s inventive prowess becomes widely disseminated. V-scores offer evi-
dence of firms’ current inventive capabilities and may suggest higher future returns from the in-
ventive learning processes underlying focal patents with higher scores.
The patents which have the strongest positive impact on investor expectations will be
those showing evidence that a firm’s inventors have successfully stretched beyond their core
technological knowledge to incorporate novel, non-core knowledge in creating their patented in-
ventions (instead of simply re-inventing within their traditional areas of core knowledge). Differ-
ences between the technology-class codes where a focal patent was granted and those which are
cited as its technological precedents offer potential evidence that such patented inventions may
be the types of innovations which could propel industry evolution and promote synergistic tech-
nological progress (Gambardella and Torrisi, 1998; Malerba, 2006; Mowery and Rosenberg,
1998; Nelson and Winter, 1982; Schumpeter, 1951) if their particular combination of technology
precedents is efficacious for the problem that must be solved and they can extract rents from the
products of their R&D outlays.
Patents which synthesize technological streams of knowledge in unexpected combina-
tions may create precedents that other inventors would feel obliged to follow―thereby moving
technological progress forward. In particular, inventions which are intended to respond to cus-
tomer-initiated problems may require highly-resourceful technological solutions which result in
the combining of ideas that must be gleaned from disparate knowledge streams where firms’ in-
ventors possessed low familiarity with dominant technologies and have had to stretch themselves
to master salient technological aspects by learning about them. Investors will value possession of
such patents more highly because they reflect organizational processes that recognize customer
problems and exploits new knowledge in ways which lesser firms cannot easily emulate, thereby

12
demonstrating competitive prowess. Incremental knowledge, such as the patent thickets which
block the licensing of patents that others need to effect evolutionary technological change (Gal-
asso and Schankerman, 2010), may not be valued as highly by investors because they are incre-
mental.
2.1.1. Radical innovations. When solving unusual technological problems and creating
products that deal with customers’ needs, firms may go beyond their routine processes of
knowledge exploitation—the local search process that facilitates incremental renewal of innova-
tive capabilities—in order to blend the exotic types of technological insights that will facilitate
creation of discontinuous inventions (Lin, Wu, Chang, Wang, and Lee, 2012; Makri, Hitt, and
Lane, 2010). Sometimes termed “radical innovation” (Dahlin, and Behrens, 2005; Green, Gavin,
and Aiman-Smith, 1995; Lettl, Herstatt, and Gemuenden, 2006; March, 1991; Schoenmakers,
and Duysters, 2010), this search ability is itself a form of absorptive capacity that allows inven-
tors to use external knowledge flows to improve innovative outcomes (Cohen and Levinthal,
1989; Escribano, Fosfuri, and Tribo, 2009; Volberda, Foss, and Lyles, 2010), accelerate response
times (Benner, 2009; Goktan, and Miles, 2011), and institutionalize the ability to make radical
innovations, when needed (Ahuja, and Katila, 2001; Cloodt, Hagedoorn, and Van Kranenburg,
2006; Nooteboom, Van Haverbeke, Duysters, Gilsing, and van den Oord, 2007; Tsai, 2009). Ev-
idence that such discontinuous organizational learning has occurred can be found in the back-
ward-citation patterns of focal firms’ patents (which detail the pattern of technological fields that
a patent has built upon as antecedents for its creation).
Out-of-the-box inventions are conceptually-similar to radical innovations because inven-
tors must widen their search range beyond their traditional comfort level to reach their scientific
solutions (Dahlin and Behrens, 2005; Garcia and Calantone, 2002; Green, Gavin, and Aiman-

13
Smith, 1995; Henderson, 1993; Lavie and Rosenkopf, 2006; Schoenmakers and Duysters, 2010).
Radical inventions are the output of extreme exploratory activity (March, 1991; Rosenkopf and
Nerkar, 2001) and can have a significant impact on firms’ future revenue streams (Ahuja and
Lampert, 2001). Transformative events, like the commercialization of the internet, often drive
firms to blend novel technological approaches with their more-familiar solutions to address cus-
tomers’ problems―with the result of creating products that differed greatly from their past de-
signs and functionality (Kelley, Ali, and Zahra, 2012); these inventions represented breaks with
path-dependent learning routines.
Success in creating out-of-the-box inventions affects competence formation in relevant
ways, such as the ability to synthesize inventions across seemingly-unrelated technology fields
(Afuah and Bahram, 1995; Tripsas and Gavetti, 2000). Such successes could improve an in-
ventive organization’s absorptive capacity―thereby improving its subsequent ability to synthe-
size unfamiliar scientific knowledge with conventional solutions (Cohen and Levinthal, 1989;
Kim, Song, and Nerkar, 2012). High V-scores indicate the award of focal patents having greater
proportions of prior-art citations from technology classes that are different from the core areas of
the focal-patent’s grant.
2.1.2. Indicators of radical innovation. The inventions of greatest interest to investors
are distinctive because their patent-content differ greatly from firms’ incremental patents—which
may have relied extensively on building within those technological areas which have constituted
firms’ areas of core expertise (or where firms have patented extensively in the past). V-scores are
high when a large proportion of the technology-class codes assigned to prior-art patents are dif-
ferent from those assigned to firms’ focal patents; the technology-class codes of the radical pa-
tents’ antecedents are substantially different from those in which the focal patents’ claims were

14
granted. In those cases, firms whose patents have higher V-scores will be valued more highly by
investors for the expectations that their pattern indicates if out-of-the-box innovation is re-
warded.
The radical nature of inventions with high V-scores is amplified when the probability is
low for particular combinations of technology class codes appearing together―especially when
compared with the overall likelihood of their occurrence for all patents granted in a particular
year. This anomaly is analogous to Fleming (2001)’s combination familiarity dimension which
demonstrated negative and significant effects on his tests of dispersion. Even in cases where
prior-art citations have originated with patent examiners instead of with the actual applicants
(Alcácer and Gittelman, 2006; Sampat, 2010; Thompson, 2006), persistent patterns showing that
unfamiliar, non-core knowledge has permeated focal patents’ precedents would indicate that
learning had occurred within inventive firms in ways that investors might value.
2.2. Using Acquisitions as a Benchmark Event
Tests of Tobin’s q ratios are typically analyzed relative to an event (like an acquisition) in
order to garner investors’ reactions thereafter (Fulgieri and Hodrick, 2006; McWilliams and
Siegel, 1997). The Tobin’s q ratio at the time of the event (an acquisition) is specified as a con-
trol variable in predicting the directionality of future Tobin’s q ratios and such longitudinal con-
trols facilitate isolation of effects from subsequent events (such as post-acquisition integration of
inventive organizations, learning from new colleagues and the subsequent development of addi-
tional capabilities which are reflected in patent content). All of the benchmark acquisitions we
examined were made in the media services industry and exposed acquiring firms to varying de-
grees of new technological learning as the acquisitions were integrated.

15
In our tests of investors’ reactions to potential changes in the patterns firms’ focal pa-
tents’ content, we expect that firms having prior experience with creating valuable inventions
will possess greater capacity to recognize and consequently to absorb the types of novel, high-
quality knowledge that is vital to creating subsequent valuable inventions in settings of techno-
logical tumult (Cohen and Levinthal, 1989). In particular, when two merged firms are technolog-
ically complementary, their post-integration research and development productivity can increase
(Cassiman, Colombo, Garrone, and Veugelers, 2005) and evidence of such enhanced R&D capa-
bilities may be positively recognized by the market (Dutta, Narasimhan, and Rajiv, 2005).
Inventions having exotic technological antecedents represent an important, unforeseen
source of post-acquisition, revenue-enhancing synergy (Fulghieri and Hodrick, 2006); successful
integration of acquisitions which generate combinatorial synergies of a type which would not
typically be realized by the acquiring firms and their targets individually—and often cannot be
anticipated (hence discounted by the market)—will be of interest to investors. By contrast, de-
lays in amassing such post-acquisition performance improvements will compound the value be-
ing destroyed with the passing of time (Sirower, 1997); investors have been quick to penalize
firms’ market values if acquisition premiums paid have appeared to be unwarranted and offset-
ting benefits did not materialize quickly enough thereafter. Post-acquisition inventive capabili-
ties that can be gained by mastering diverse and previously-unknown technological streams rep-
resent one of firms’ best hopes for repaying acquisition premiums in a timely fashion and posi-
tively influencing investors’ expectations regarding the resulting post-acquisition firm.
Hypothesis 1a: Patents having high backward-dispersion patent-citation scores
(V-scores) will be valued more highly (as reflected by Tobin’s q ratios) than pa-
tents with low V-scores.

16
Hypothesis 1b: Post-acquisition firms showing large increases in backward-dis-
persion patent-citation scores (V-scores) will be valued more highly (as reflected
by Tobin’s q ratios) than firms showing small (or negative) changes in their V-
scores.
METHODOLOGY
Longitudinal information about the content of firms’ focal patents and their Tobin’s q ra-
tios were obtained from Thomson Reuters’ Derwent Innovation Index (2013b) and Standard and
Poors’ COMPUSTAT (2013) for the media-services industry from 1992 through 2012; acquisi-
tions reported by Thomson Reuters (2013a) occurred within an eight-year window (from 1998
through 2005) that was chosen to capture the large-scale commercialization of the internet’s po-
tential. By 2005 the number of internet users had reached 1 billion and availability of media-
providing services was an important driver of internet use.
3.1. Data and Sample
Media-services is a mixture of venerable, old media firms and young internet-content
providers that represented 6 percent of U.S. gross economic output in 2013. Media-service pro-
viders held patents germane to how media is consumed by users; their inventions created the
wherewithal for providing media content. Activities of media-service firms included print me-
dia, radio broadcasting, entertainment and informational content, and internet publishing, among
others. Important technological innovations within the media services industry included solutions
for video-centric networking, media streaming and cloud content delivery as well as conversion
of firms’ media libraries to electronic content; many of these innovations were commercialized
after the internet bubble had burst. Thereafter the media services industry evolved to become the
multimedia industry due, in part, to the convergence of different technologies that was occurring
within the complementary telecommunications and electronics industries.

17
Thomson Reuters (2013a) reported acquisitions of 5,336 U.S. media firms; of those,
2,078 transactions were consummated during our research window (between 1998 and 2005). In-
complete financial data were available for 963 of the resulting firms; patents were granted to 329
firms. Because some firms made more than one media acquisition in a particular year under
study, all data per firm was combined for each available year to yield 434 usable, reduced-set ob-
servations; 149 of those resulting firms held patents. Sample size decreased in post-acquisition
years as acquiring firms were themselves acquired (or were no longer required to file financial
statements—either because they went bankrupt or were taken private).
Patent report information for constructing the V-Score was gathered from U.S.-granted
patents that were classified using the Derwent Innovation Index (Thomson Reuters, 2013b),
which is a parsimonious classification system of 291 technology class codes that categorized pa-
tent documents for all affected technologies. Focal-patent information was collected at the firm
level, not the laboratory level as Roach and Cohen (2013) did. Focal-patent genealogies (includ-
ing prior-art citation codes) were taken from Thomson Reuters’ Web of Science (2013c). We did
not correct for self-citations to a focal patent when compiling its backward provenance.
3.2. Variables
3.2.1. Dependent variables. Tobin’s q ratios were calculated for each year following the
definition of Gompers, Ishi, and Metrick (2003): the market value of total assets divided by the
book value of assets, where the market value of assets was computed as the book value of assets
plus the market value of common stock less the sum of the book value of common stock and bal-
ance sheet deferred taxes. Tobin’s q has been used to capture market expectations concerning in-
tangible assets in many studies of patent valuation (Hall, Jaffe, and Trajtenberg, 2005; Patel and

18
Ward, 2011; Sandner and Block, 2011). Stock market volatility was expected to be highest dur-
ing periods in the industry life-cycle when innovation was considered to be most “radical” (Maz-
zucato, 2002; 2003; Mazzucato and Tancioni, 2012). In our sample, average Tobin’s q ratio val-
ues ranged from a high of 2.126 in 1999 to a low of 1.129 in 2011 with the highest standard devi-
ations occurring when media-content firms like Martha Stewart, National Lampoon or Odyssey
Pictures entered the sample (causing a dramatic run up in stock prices based on investor exuber-
ance). Average Tobin’s q values fell after the market had adjusted denominators for excessive
acquisition premiums being paid (Graham, Lemmon, and Wolf, 2002). Our observation window
included notable highs and lows in market valuations because—during the ensuing stock market
run-up that was associated with the Internet bubble—firms booked accounting losses that re-
sulted in negative equity values on their balance sheets, even as their market valuations soared
(due to investor expectations concerning future returns).
3.2.2. V-scores as independent variables. Backward-dispersion patent-citation scores (V-
scores) were calculated for each firm’s focal patents in each year by comparing the variety of
technology-class codes used to describe the claims of its antecedent patents with those describing
the claims of the focal patent. Where Hall, Jaffe, and Trajtenberg (2001) used one United States
Patent and Trademark Office (USPTO) technology-class code per focal patent, we used all avail-
able Derwent technology-class codes for each focal patent. Patent score, V, was equal to the
weighted sum of the core score and non-core score―multiplied by a correction factor, [Σfo/Σfi],
which was the ratio of the count of outside-the-core technology-class codes divided by the ratio
of the count of inside-the-core technology-class codes:
V = Σ([ai,ao × ffk]k) × [Σfo/Σfi]

19
where ai and ao are dyad weightings and ffk is the frequency factor of each technology-class
codek. Calculations were made in a spreadsheet matrix. Using the convention that in represented
n- different inside-the-core technology-class codes that may appear in a patent and om repre-
sented m- different outside-the-core technology- class codes that may have been cited by that pa-
tent, we calculated the average dyad weighting, ai or ao, for each respective technology-class
code as:
ai = Σpj/in for inside the core (and ao = Σpj/om for outside the core)
where pj was the dyad weighting for a particular core (or non-core) technology-class code ap-
pearing with itself or with another backward-cited technology-class code and j equaled n times (n
+ m). The technology-class code frequency, ffk, was calculated as:
ffk = fk/F
where fk was the frequency with which a technology-class code occurred in a particular patent
and F was the sum of all technology-class codes appearing in that patent and k equals 1, 2, …, n,
n+1, …, n + m. The frequency factor was multiplied times the average dyad rating per technol-
ogy-class code and summed according to whether the precedent technology-class code was in-
side-the-core (cited code is the same as those awarded to the focal patent) or outside-the-core
(cited code is different from those award to the focal patent).
The V-score calculation uses two weighting factors; it compares the core technology-
class codes (in) of a focal patent’s grant with those technology-class codes (om) that were as-
signed to its prior-art patents to determine the frequency with which each respective technology-
class code appears in a patent examiner’s report (fk)—which is counted in order to derive its rela-
tive frequency weighting (ffk). The relative frequencies (pj) with which dyads of the granted tech-
nology-class codes occurred together (as a proportion of all U.S. patents that were granted in a

20
particular year) provided the other weighting factor (ai, ao). Web of Science (2013c) provided fre-
quency dyad information.
If all of the technology-class codes of backward-cited patents were the same as those de-
scribing the focal patent, the focal patent V-score was zero; yearly average V-scores were as high
as 144.0 where the technology-class codes of backward-cited patents differed greatly from those
of the focal patent. Our scoring approach is similar in spirit to co-occurrence measures that have
been used to indicate the relatedness of the lines of business within diversified firms, such as the
technology diversity index of Miller (2004) or other weighted estimates of distance (Bryce and
Winter, 2009; Lien and Klein, 2009). In our sample, Pixar had the greatest absolute V-score for
the observed years, but print-media companies—Reader’s Digest, Times Mirror, and Tribune
Company—had the highest V-score change scores.

21
3.2.3. Control variables. The Tobin’s q ratio in year0 (acquisition year) and logarithm of asset
size (for each respective time period) were specified as controls in all tests to detect changes in
investors’ subsequent expectations as post-acquisition V-scores changed. Other controls included
leverage, capital intensity, and binary variables reflecting possession of (a) media-content assets
or (b) communications assets (to capture the effect of potential vertical integration). Diversifica-
tion in the media sample was low (with a few notable outliers) as 41.5 percent of the acquirers
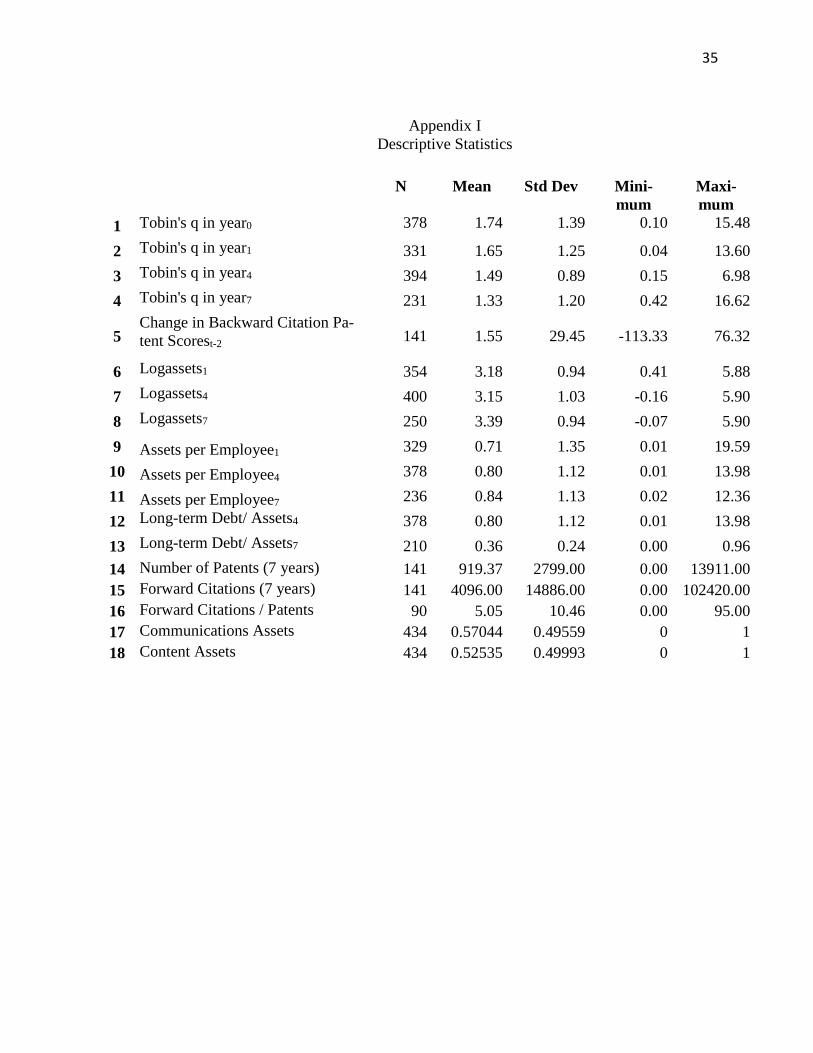
remained single-business firms—even after making their “event” acquisition. Appendices I and
II, which report the means and variance of variables used in our analysis, indicates the number of
potential observations that were available for each variable in each year that was used in our
specifications. The variance inflation factor was less than 2.0 for all variables tested in the speci-
fications reported.
------------------------------------------------ Appendix I and Appendix II at the end ------------------------------------------------
3.0. SPECIFICATIONS AND RESULTS
Construction of variables showing V-score changes required annual averaged, focal-pa-
tent scores for two years (to calculate score differences); some firms patented infrequently, so the
number of available observations was reduced. The lag which captured the greatest number of
available patent observations was a two-year interval. Table 1 reports a positive and
------------------- Table 1 here
-------------------
statistically-significant relationship between rising V-scores and the Tobin’s q ratio for the three
post-acquisition periods tested. The significance of the variable is stronger in the earlier-year
specifications, although the sign remains positive for all specifications. The V-score’s coefficient
decreases (showing lesser statistical significance in the seventh post-acquisition year) which we

22
interpreted as reflecting the diminishing impact of acquired knowledge that was reported by
Ahuja and Katila (2001); attrition in the seventh year sample size may also explain results which
suggest that V-score changes become a less-effective predictor of Tobin’s q as time after the
“event” acquisition passes. Media-content assets are weakly-negative immediately after firms are
combined, but its sign reverses to weakly-positive by the seventh post-acquisition year and may
suggest shifting investor emphasis on media-content assets by 2012. Communications assets are
positive and significant as the number of post-acquisition years increase. The control variables
were significant.
4.0. IMPLICATIONS OF RESULTS
V-score increases were associated with higher Tobin’s q ratios; their significance dimin-
ished after seven years. The hypothesized relationship between them does not persist as time
passes, but there is evidence to support Hypothesis 1b as results indicate that firms showing large
increases in V-scores will be valued more highly than firms showing small (or negative) changes
in their scores.
In the case of media services, there was great urgency for firms to monetize their print-
library assets (by digitizing them) and devise ways of making media assets more accessible to
consumers through a wide variety of distribution channels. The dominance of cable-broadband
distribution as a conduit to reach customers increased and then decreased over the years studied.
Given the great technological flux of the media-services industry, it is not surprising to find that
successful media-service firms incorporated technological knowledge that was far afield of their
core knowledge areas when monetizing their media assets between 1998 and 2012.
By 2007 many media-service firms were emphasizing software- and programming-con-
tent assets over distribution capabilities (thereby suggesting that content was king). Patents were

23
typically awarded to devices while copyrights were awarded to movies and source codes. During
the “credit freeze” era, investors may have weighted information about expenditures for copy-
rights more heavily than the inherently more-risky R&D outlays needed to patent inventions. The
media-services industry was influenced by the changing strategic emphases of Time Warner and
Comcast. Time Warner shed its cable operations and Comcast entered by acquiring the content-
programming assets of Universal Studios and NBC; their approaches to providing media services
varied greatly. The subsequent dominance of Netflix (who was not in our sample) suggests that
access to media-content assets was important by 2012—even as the inventions used to deliver
media content more effectively continued to be important to competitive success.
Stock prices fluctuate, in part, according to evidence of positive influences on firms’
earnings potential. We have argued that investors will positively-value evidence that post-acqui-
sition improvements in firms’ inventive capacity has occurred. Changes in V-scores provide
faster indications of post-acquisition, inventive activity than does the information contained in
forward-citation counts. Analysis of outliers in V-scores may even suggest where a particular
firm has patented inventions that could drive industry evolution in particular directions. Positive
changes in V-scores are important signals for investors because they can indicate improvements
in firms’ mastery of new technologies.
Managers must consider investor expectations (as characterized by the Tobin’s q ratio)
because they need access to financing for their strategic decisions. Timely information with pre-
dictive value has become increasingly difficult to obtain in environments characterized by rapid
technological change with potentially-disruptive technologies such as the media-services indus-
try represents. The V-score represents one potential indicator of future returns that could be eval-
uated by investors.

24
Traditional indicators of patent quality—number of patents granted per year and forward-
citation counts—were not significant predictors of post-acquisition Tobin’s q for media-service
firms. Forward-looking patent analyses appear to be of limited value in environments, such as
the media-services industry, where it is difficult to forecast the length and thickness of forward-
citation tails when patents are first granted. Positive returns have accrued to only 20 percent to
30 percent of research projects that have been undertaken in other industries (Silverberg and
Verspagen, 2007); media services is a relatively new industry with traits that are not directly
comparable to other types of research sites.
The approach of predicting returns based on content analysis of focal patents is a plausi-
ble alternative for investors to the real-options approach of betting on technological successes
that firms employ (Bloom and Van Reenen, 2002). V-scores could be used to identify and reward
firms for the possession of patents that have synthesized novel technologies into useful applica-
tions. All patents with high V-scores may not prove to be blockbusters, but persistent evidence of
their intellectual quest to patent breakthrough knowledge demonstrates that innovating firms de-
serve access to funding. It would appear that important inventions do benefit from the transfer of
knowledge from one technological domain to another and that investors value such organiza-
tional learning (as indicated by changes in the Tobin’s q ratio over time).

25
References Afuah, A.N., and N. Bahram, 1995, “The hypercube of innovation,” Research Policy, 24, 51–76. Aggarwal, V.A., and D.H. Hsu, 2014, “Entrepreneurial exits and innovation,” Management Sci-ence, 60, 867-887. Ahuja, G., and R. Katila, 2001, “Technological acquisitions and the innovation performance of acquiring firms: a longitudinal study,” Strategic Management Journal, 25(8): 197-220.
Ahuja, G., and C.M. Lampert, 2001, “Entrepreneurship in large corporations: a longitudinal study of how established firms create breakthrough inventions,” Strategic Management Journal, 22: 521–543. Alcácer, J., and M. Gittelman, 2006, “Patent citations as a measure of knowledge flows: The in-fluence of examiner citations,” Review of Economics and Statistics, 88, 774-779. Alcácer, J., M. Gittelman, and B. Sampat, 2009, “Applicant and examiner citations in U.S. pa-tents: An overview and analysis,” Research Policy, 38, 415-427. Anand, J., and H. Singh, 1997, “Asset redeployment, acquisitions and corporate strategy in de-clining industries,” Strategic Management Journal, 18, 99-118. Bessen, J. 2009, “Estimates of patent rents from firm market value,” Research Policy, 38, 1604-1616. Bloom N., and J. Van Reenen, 2002, “Patents, real options and firm performance,” The Eco-nomic Journal, 112, C97-C116. Benner, M.J., 2009, “Dynamic or static capabilities? Process management practices and response to technological change,” Journal of Product Innovation Management, 26, 473-486. Bosworth D., and M. Rogers M. 2001, “Market value, R&D and intellectual property: an empiri-cal analysis of large Australian firms,” Economic Record, 77, 323-337. Branstetter, L.G., R. Fisman, and C.F. Foley, 2006, “Do stronger intellectual property rights in-crease international technology transfer? Empirical evidence from U.S. firm-level panel data, Quarterly Journal of Economics,” 121, 321-349. Bryce, D.J., and S.G. Winter, 2009, “A general interindustry relatedness measure,” Management Science, 55, 1570-1585. Cassiman, B., M.G. Colombo, P. Garrone, and R. Veugelers, 2005, “The impact of M&A on the R&D process―An empirical analysis of the role of technological- and market-relatedness,” Re-search Policy, 34, 195-220.

26
Chen, Y.S. 2010, “Exploring the nonlinear effects of patent citations, patent share and relative patent position on market value in the US pharmaceutical industry,” Technology Analysis and Strategic Management. 22, 153-169.
Chen, Y.S., and C.Y. Shih, 2011, “Re-examine the relationship between patents and Tobin’s q,” Scientometric, 89, 781-789.
Cloodt, M., Hagedoorn, J., and H. Van Kranenburg, 2006, “Mergers and Acquisitions: their effect on the innovative performance of companies in high-tech industries,” Research Policy, 35, 642-668.
Cohen, W.M., and D.A. Levinthal, 1989, “Innovation and Learning: The Two Faces of R&D,” The Economic Journal, 99, 569-596.
Dahlin, K.B., and D.M. Behrens, 2005, “When is an invention really radical? Defining and meas-uring technological radicalness,” Research Policy, 34, 717-737.
Danguy, J., De Rassenfosse, G., and B. Van Pottelsberghe de la Potterie, 2013, “On the origins of the worldwide surge in patenting: an industry perspective on the R&D-patent relationship,” Industrial and Corporate Change, 23, 535-572.
Dutta, S., O. Narasimhan, and S. Rajiv, 2005, “Conceptualizing and measuring capabilities: meth-odology and empirical application,” Strategic Management Journal, 26, 277-285. Escribano, A., A. Fosfuri, and J.A. Tribo, 2009, “Managing external knowledge flows: the moderating role of absorptive capacity,” Research Policy, 38, 96-105.
Felin, T., and W.S. Hesterly, 2007, “The knowledge-based view, nested heterogeneity, and new value creation: Philosophical considerations on the locus of knowledge,” Academy of Manage-ment Review, 32, 195-218. Fleming, L., 2001, “Recombinant uncertainty in technological search,” Management Science, 47, 117-132. Fleming, L., and O. Sorenson, 2001, “Technology as a complex adaptive system: Evidence from patent data,” Research Policy, 30, 1019-1039. Fulgieri, P., and L.S. Hodrick, 2006, “Synergies and internal agency conflicts: The double-edged sword of mergers,” Journal of Economics and Management Strategy, 15, 549-576. Galasso, A., and M. Schankerman, 2010, “Patent thickets, courts, and the market for innovation,” RAND Journal of Economics, 41, 472-503. Gambardella, A., P. Giuri, and A. Luzzi, 2007, “The market for patents in Europe.” Research Policy, 36, 1163-1183.
27
Gambardella, A., and S. Torrisi, 1998, “Does technological convergence imply convergence in markets? Evidence from the electronics industry.” Research Policy, 27, 445-463. Garcia, R., and R. Calantone, 2002, “A critical look at technological innovation typology and in-novativeness terminology: a literature review.” Journal of Product Innovation Management, 19, 110-132. Goktan, A.B., and G. Miles, 2011, “Innovation speed and radicalness: are they inversely re-lated?” Management Decision, 49, 533-547. Gompers, P., J. Ishii, and A. Metrick, 2003, “Corporate governance and equity prices,” Quarterly Journal of Economics, 118, 107-155. Graham, J.R., M.L. Lemmon, and J.G. Wolf, 2002, “Does corporate diversification destroy value?” Journal of Finance, 57, 695-720.
Grant, R.M., 1996, “Toward a knowledge-based theory of the firm,” Strategic Management Journal, 17, 109-122.
Green, S.G., M.B. Gavin, and L. Aiman-Smith, 1995, “Assessing a multidimensional measure of radical technological innovation,” IEEE Transactions on Engineering Management, 42, 203-214.
Griliches, Z., 1981, “Market value, R&D, and patents,” Economic Letters, 7, 183-187. Hagadoorn, J., and M. Cloodt, 2003, “Measuring innovative performance: is there an advantage in using multiple indicators?” Research Policy, 32, 1365-1379. Hall, B.H., Z. Griliches, and J.A. Hausman, 1986, “Patents and R&D: is there a lag,” Interna-tional Economics Review, 27, 265-283. Hall, B.H., A.B. Jaffe, and M. Trajtenberg, 2001, “The NBER patent citations data file: lessons, insights and methodological tools,” NBER working paper no. 8498. Hall, B.H., A.B. Jaffe, and M. Trajtenberg, 2005, “Market value and patent citations,” RAND Journal of Economics, 36, 16-38. Harhoff, D., F. Narin, F.M. Scherer, and K. Vopel, 1999, “Citation frequency and the value of patented inventions,” Review of Economics and Statistics, 81, 511-515. Henderson, R., 1993, “Underinvestment and incompetence as responses to radical innovation: evidence from the photolithographic alignment equipment industry,” RAND Journal of Econom-ics, 24, 248-270. Hirschey, M., and V.J. Richardson, 2003, “Investor underreaction to goodwill write-offs,” Finan-cial Analysts Journal, 59, 75-84.

28
Hirschey, M., V.J. Richardson, and S. Scholz, 2001, “Value relevance of nonfinancial information: The case of patent data,” Review of Quantitative Finance and Accounting, 17, 223-235. Jaffe, A.B., 1986, “Technological opportunity and spillovers of research-and-development - evi-dence from firms patents, profits, and market value,” American Economic Review, 76, 984-1001. Jaffe, A.B., M. Trajtenberg, and R. Henderson, 1993, “Geographic localization or knowledge spillovers as evidenced by patent citations,” Quarterly Journal of Economics, 108, 577-598. Jaffe, A.B., M.S. Fogarty, and B.A. Banks, 1998, “Evidence from patents and patent citations on the impact of NASA and other federal labs on commercial innovation,” Journal of Industrial Economics, 46, 183-205. Kamien, M.I., and Y. Tauman, 1986, “Fees versus royalties and the private value of a patent,” Quarterly Journal of Economics, 101, 471-491. Kapoor, R., and K. Lim, 2007, “The impact of acquisitions on the productivity of inventors at semiconductor firms: A synthesis of knowledge-based and incentive-based perspectives,” Acad-emy of Management Journal, 50, 1133-1155. Kelley, D.J., A. Ali, and S.A. Zahra, 2013, “Where do breakthroughs come from? Characteristics of high-potential inventions,” Journal of Product Innovation Management, 20, 1212-1226. Kim, C.., J. Song, and A. Nerkar, 2012, “Learning and innovation: Exploitation and exploration trade-offs,” Journal of Business Research, 65, 1189-1194. Lang, L.H.P., and R.M. Stulz, 1994, “Tobin’s q, corporate diversification, and firm perfor-mance,” Journal of Political Economy, 102, 1248-1280. Lanjouw, J.O., A. Pakes, and J. Putnam, 1998, “How to count patents and value intellectual property: The uses of patent renewal and application data,” Journal of Industrial Economics, 46, 405-432. Lanjouw, J.O., and M. Schankerman, 2001, “Characteristics of patent litigation: a window on com-petition,” The RAND Journal of Economics, 32, 129-155. Lavie, D. and L. Rosenkopf, 2006, “Balancing exploration and exploitation in alliance for-mation,” Academy of Management Journal, 49, 797-818. Lee, Y.G., J.D. Lee, Y.I. Song, and S.J. Lee, 2007, “An in-depth empirical analysis of patent cita-tion counts using zero-inflated count data model: the case of KIST,” Scientometrics, 70, 27-39. Lettl, C., C. Herstatt, and H.G. Gemuenden, 2006, “Learning from users for radical innovation,” International Journal of Technology Management, 33, 25–45.
29
Lemley, M.A., and C. Shapiro, 2007, “Patent holdup and royalty stacking,” Texas Law Review, 85, 191-2049. Lien, L.B., and P.G. Klein, 2009, “Using competition to measure relatedness,” Journal of Man-agement, 35, 1078-1107.
Lin, C., Y.J. Wu, C. Chang, W. Wang, and C.Y. Lee, 2012, “The alliance innovation perfor-mance of R&D alliances―the absorptive capacity perspective,” Technovation, 32, 282-292.
Makri, M., M.A. Hitt, and P.J. Lane, 2010, “Complementary technologies, knowledge relatedness, and invention outcomes in high technology mergers and acquisitions,” Strategic Management Journal, 31, 602-628.
Malerba, F., 2006, “Innovation and the evolution of industries,” Journal of Evolutionary Eco-nomics, 16, 3-21. March, J.G., 1991, “Exploration and exploitation in organizational learning,” Organization Sci-ence, 2, 71-87. Mariani, M., 2004, “What determines technological hits? Geography versus firm competencies,” Research Policy, 33, 1565-1582. Mazzucato, M., 2002, “The PC industry: New economy or early life-cycle,” Review of Economic Dynamics, 5, 318-345. Mazzucato, M., 2003, “Risk, variety and volatility: Innovation, growth and stock returns in old and new industries,” Journal of Evolutionary Economics, 13, 491-512. Mazzucato, M., and M. Tancioni, 2012, “R&D, patents and stock return volatility,” Journal of Evolutionary Economics, 22, 811-832. McWilliams, A., and D. Siegel, 1997, “Event studies in management research: theoretical and empirical issues,” Academy of Management Journal, 40, 626-657. Miller, D.J., 2004, “Firms’ technological resources and the performance effects of diversifica-tion: a longitudinal study,” Strategic Management Journal, 25, 1097-1119. Montgomery, C.A., 1982, “The measurement of firm diversification: some new empirical evi-dence,” Academy of Management Journal, 25, 299-307. Montgomery, C.A., and B. Wernerfeldt, 1988, “Diversification, Ricardian rents and Tobin’s q,” The RAND Journal of Economics, 19, 623-632. Mowery, D.C., J.E. Oxley, and B.S. Silverman, 1996, “Strategic alliances and interfirm knowledge transfer,” Strategic Management Journal, 17, 77-91.

30
Mowery, D.C., and N. Rosenberg, 1998, Paths of Innovation: Technological Change in 20th-Century America, Cambridge: Cambridge University Press. Nair, S.S., M. Mathew, and D. Nag, 2011, “Dynamics between patent latent variables and patent price,” Technovation, 31, 648-654. Nelson, R.R., and S.G. Winter, 1982, An Evolutionary Theory of Economic Change, Cambridge: Belknap Harvard. Nemet, G.F., and E. Johnson, 2012, “Do important inventions benefit from knowledge originat-ing in other technological domains?” Research Policy, 41, 190-200. Nooteboom B., W. Van Haverbeke, G. Duysters, V. Gilsing, and A. van den Oord, 2007, “Optimal cognitive distance and absorptive capacity,” Research Policy, 36, 1016-1034.
Patel. D., and M.R. Ward, 2011, “Using patent citation patterns to infer innovation market com-petition,” Research Policy, 40, 886-894. Patel, P., and K. Pavitt, 1997, “The technological complexities of the world’s largest firms: com-plex and path-dependent, but not much variety,” Research Policy, 26, 147-156. Roach, M., and W.M. Cohen, 2013, “Lens or prism? Patent citations as a measure of knowledge flows from public research,” Management Science, 59, 504-525. Rosenkopf, L., and A. Nerkar, 2001, “Beyond local search: boundary-spanning, exploration, and impact in the optical disk industry,” Strategic Management Journal, 22, 287-306. Sampat, B.N., 2010, “When do applicants search for prior art?” Journal of Law and Economics, 53, 399-416. Sandner, P.G., and J. Block, 2011, “The market value of R&D, patents, and trademarks,” Re-search Policy, 40, 969-985. Scherer, F.M., and D. Harhoff, 2000, “Technology policy for a world of skew-distributed out-comes,” Research Policy, 29, 559-566. Sherry, E.F., and D.J. Teece, 2004, “Royalties, evolving patent rights, and the value of innova-tion,” Research Policy, 33, 179-191. Schoenmakers, W., and G. Duysters, 2010, “The technological origins of radical inventions,” Research Policy, 39, 1051-1059. Schumpeter, J.A., 1951, “The creative response in economic history,” Journal of Economic His-tory, 7, 149–159. Serrano, C.J., 2010, “The dynamics of the transfer and renewal of patents,” RAND Journal of Economics, 41, 686-708.

31
Silverberg G., and B. Verspagen, 2007, “The size distribution of innovation revisited: An appli-cation of extreme value statistics to citation and valuation measures of patent significance,” Jour-nal of Econometrics, 139, 318-339. Sirower, M.L., 1997, The Synergy Trap: How Companies Lose the Acquisition Game, New York: Free Press. Sørensen, J.R., and T.E. Stuart, 2000, “Aging, obsolescence, and organizational innovation,” Ad-ministrative Science Quarterly, 45, 81-112. Standard and Poor’s, 2013, COMPUSTAT Database. New York: McGraw-Hill Thompson, P., 2006, “Patent citations and the geography of knowledge spillovers: evidence from inventor- and examiner-added citations,” Review of Economics and Statistics, 88, 383-389. Thomson Reuters, 2013a, SDC Platinum Database, New York: Thomson Reuters. Thomson Reuters, 2013b, Derwent World Patents Index Classification Guide, Philadelphia: Web of Science. Thomson Reuters, 2013c, Web of Science, New York: Thomson Reuters. Trajtenberg, M., 1990, “A penny for your quotes: patent citations and the value of innovations,” RAND Journal of Economics, 21, 172-187. Trajtenberg, M., R. Henderson, and A.B. Jaffe, 1997, “University versus corporate patents: a window on the basicness of invention,” Economics of Innovation and New Technology, 5, 19-50. Tripsas, M., and G. Gavetti, 2000, “Capabilities, cognition, and inertia: evidence from digital im-aging,” Strategic Management Journal, 21, 1147–1161. Tsai, K.H., 2009, “Collaborative networks and product innovation performance: toward a contingency perspective,” Research Policy, 38, 765-778.
Utterback, J., 1996, Mastering the Dynamics of Innovation, Boston, MA: Harvard Business School Press. Vanhaverbeke, W., V. Gilsing, B. Beerkens, and G. Duysters, 2009, “The role of alliance net-work redundancy in the creation of core and non-core technologies.” Journal of Management Studies, 46, 215-244. Volberda, H.W., N.J. Foss, N.J., and M.A. Lyles, 2010, “Absorbing the concept of absorptive capacity: how to realize its potential in the organization field,” Organization Science, 21, 931-951.

32
Ziedonis, R.H., 2004, “Don’t fence me in: Fragmented markets for technology and the patent ac-quisition strategies of firms,” Management Science, 50, 804-820.

33
1 2 3 4 5 6 Tobin's q Tobin's q Tobin's q Tobin's q Tobin's q Tobin's q 1 year after 1 year after 4 years after 4 years after 7 years after 7 years after (yearly scores) (yearly scores) (yearly scores) (yearly scores) (yearly scores) (4-year scores)3 Intercept 4.1272 3.8326 2.2301 1.9918 0.6080 0.9011 (0.9569) (0.9923) (0.4309) (0.3930) (0.2102) (0.3950) *** ** *** *** ** * Change in Backward 0.0222 0.0238 0.0096 0.0105 0.0035 0.0085 Patent Scorest-2 (0.0075) (0.0078) (0.0042) (0.0039) (0.0023) (0.0039) ** ** * ** NS * Tobin's q in 0.9112 0.8733 0.1722 0.1898 0.4439 0.2964 acquisition yeart (0.1509) (0.1627) (0.0502) (0.0469) (0.0480) (0.0403) *** *** ** *** *** *** LogAssetst -0.5498 -0.6799 -0.2862 -0.2733 -0.0567 -0.0689 (0.1915) (0.2162) (0.0846) (0.0848) (0.0434) (0.0840) ** ** ** ** NS NS Leveraget -3.9487 -2.3660 -- -- -- -1.9886 (1.3273) (1.4054) (0.7786) ** * *
Table 1 Effect of Changes in Patent scores on Tobin’s q

34 (Table 1 continued) 1 2 3 4 5 6 Tobin's q Tobin's q Tobin's q Tobin's q Tobin's q Tobin's q 1 year after 1 year after 4 years after 4 years after 7 years after 7 years after (yearly scores) (yearly scores) (yearly scores) (yearly scores) (yearly scores) (4-year scores)1 Communication -- 0.1909 -- 0.4514 0.1791 0.3326 Assetst (0.4750) (0.1951) (0.1089) (0.1571) NS * NS * Content Assetst -0.8873 -- 0.2261 -- -- 0.3556 (0.4688) (0.2269) (0.2052) † NS † Adjusted R2 0.5242 0.4959 0.3398 0.3816 0.6231 0.5893 Observations 60 59 77 76 60 61 *** <0.0001 ** 0.01 * 0.05 † 0.10
1 Rolling, four-year averaged V-scores were subtracted from each other in order to increase the number of available observations to include those which were granted patents within a four-year time horizon.
35
Appendix I Descriptive Statistics
N Mean Std Dev Mini-
mum Maxi-mum
1 Tobin's q in year0 378 1.74 1.39 0.10 15.48
2 Tobin's q in year1 331 1.65 1.25 0.04 13.60 3 Tobin's q in year4 394 1.49 0.89 0.15 6.98 4 Tobin's q in year7 231 1.33 1.20 0.42 16.62
5 Change in Backward Citation Pa-tent Scorest-2 141 1.55 29.45 -113.33 76.32
6 Logassets1 354 3.18 0.94 0.41 5.88 7 Logassets4 400 3.15 1.03 -0.16 5.90 8 Logassets7 250 3.39 0.94 -0.07 5.90 9 Assets per Employee1 329 0.71 1.35 0.01 19.59 10 Assets per Employee4 378 0.80 1.12 0.01 13.98 11 Assets per Employee7 236 0.84 1.13 0.02 12.36 12 Long-term Debt/ Assets4 378 0.80 1.12 0.01 13.98 13 Long-term Debt/ Assets7 210 0.36 0.24 0.00 0.96 14 Number of Patents (7 years) 141 919.37 2799.00 0.00 13911.00 15 Forward Citations (7 years) 141 4096.00 14886.00 0.00 102420.00 16 Forward Citations / Patents 90 5.05 10.46 0.00 95.00 17 Communications Assets 434 0.57044 0.49559 0 1 18 Content Assets 434 0.52535 0.49993 0 1

36
Appendix II
Independent Variable Correlations, Significance and Number of Observations 1 Tobin's q in year0 1 2 3 4 5 6 7
2 Change in Backward Ci-tation Patent Scorest-2 0.06
0.48 128 3 Logassets1 -0.22 0.21
<.0001 0.02 343 118 4 Logassets4 -0.28 0.13 0.94
<.0001 0.13 <.0001 358 134 339 5 Logassets7 -0.12 0.14 0.92 0.93
0.06 0.18 <.0001 <.0001 227 93 230 241 6 Assets per Employee1 -0.06 -0.06 0.15 0.29 0.28
0.30 0.57 0.01 <.0001 <.0001 325 109 329 315 213 7 Assets per Employee4 -0.10 -0.18 0.25 0.35 0.22 0.69
0.07 0.05 <.0001 <.0001 0.0007 <.0001 341 128 324 378 229 309 8 Assets per Employee7 -0.10 -0.07 0.28 0.29 0.37 0.75 0.72
0.14 0.54 <.0001 <.0001 <.0001 <.0001 <.0001 216 88 219 230 236 206 223

37
1 2 3 4 5 6 7 9 Long-term Debt/ Assets4 -0.16 0.10 -0.09 -0.11 -0.11 0.19 -0.08 0.00 0.25 0.11 0.04 0.09 0.001 0.16 331 127 312 365 227 291 346 10 Long-term Debt/ Assets7 -0.14 0.12 -0.16 -0.12 -0.29 0.28 0.42 0.05 0.33 0.02 0.10 <.0001 0.0002 <.0001 193 71 195 205 210 181 196 11 Number of Patents -0.15 0.00 0.21 0.22 0.18 0.30 0.38 0.10 0.95 0.02 0.01 0.08 0.002 <.0001 128 141 118 134 93 109 128 12 Forward Citations -0.06 -0.01 0.22 0.22 0.19 0.30 0.38 0.54 0.90 0.02 0.01 0.07 0.00 <.0001 128 141 118 134 93 109 128
13 Forward Citations / Pa-tents
0.35 0.17 0.01 -0.05 0.02 0.36 0.08
0.001 0.11 0.94 0.68 0.87 0.002 0.51 83 90 75 83 64 70 78 14 Communications Assets -0.04 -0.08 -0.03 0.10 -0.06 0.18 0.17 0.46 0.15 0.61 0.12 0.49 0.001 0.001 377 330 393 231 140 353 399 15 Content Assets 0.04 -0.02 0.11 -0.01 0.28 0.20 0.18 0.42 0.69 0.03 0.86 0.001 0.0001 0.0004 378 331 394 231 141 354 400

38
8 9 10 11 12 13
9 Long-term Debt/ Assets4
0.23
0.001 217
10 Long-term Debt/ Assets7
-0.08 0.38
0.24 <.0001 200 203 11 Number of Patents 0.39 -0.23 -0.33 0.0002 0.01 0.00 88 127 71 12 Forward Citations 0.39 -0.15 -0.15 0.81 0.0002 0.09 0.21 <.0001 88 127 71 141 13 Citations / Patents 0.22 -0.02 0.19 -0.01 0.05 0.10 0.85 0.21 0.95 0.65 59 79 45 90 90
14 Media Distribution Pipes (binary)
0.13 0.16 0.07 0.16 0.02 0.02
0.03 0.00 0.16 0.01 0.72 0.66 250 328 377 236 367 433 15 Electronic Media 0.26 -0.04 0.03 0.00 -0.16 0.32 (binary) <.0001 0.45 0.59 0.96 0.002 <.0001 250 329 378 236 368 434
Coefficient Significance level
Observations