past and present trends in food packaging v2
TRANSCRIPT

Past and present trends in food packaging
Dr. E.U. Thoden van Velzen2 december 2009, Brussels

Back to the nineties
Flow�pack organic F&VBio�degradable packaging
Nano�clay is still promising
rest: Science�fiction
Nanotechnology
On crates & trolleysIntelligent packaging
Oxygen absorbers: too expensive and complicated
Active packaging
and what happenedPast trends

What did happen?
� Centralised pre�packing of meat, fish, cheese….� Rise of Modified atmosphere packaging
� Rise of the Convenience fresh food industry� Rise of E�MAP
� Weight reduction
� Growth of plastic packaging

Rise of MAP

History of meat packaging in NL
� 60’s� Supermarkets expand
� Meat is pre�packed• White styrofoam tray
• PVC stretch
� 1964 first tests MAP
� 1975 Begin MAP
� 2000 Break through MAP� Large retailers start
� 2009: 60 % MAP

Modified atmosphere packaging for meat
� Higher direct costs +0,07 €/pack� Packages
� Gasses, machines…
� Lower indirect costs <�0,10 €/pack� Longer shelf life
• Less shrinkage in shops (8 � 10 �> 4 � 5%)
• Less night shifts
• Lower delivery frequency ….

Balances
Financial: -37.8 M€ / Year Environment: -0.55 PJ / Year
0
50
100
150
200
250
300
350
1994 2008
Cos
ts, [
M€
/ Yea
r]
Meat shrinkage Packaging costs
-37,8 M€ / Jahre
0,0
0,5
1,0
1,5
2,0
2,5
3,0
3,5
4,0
1994 2008
Em
bodi
ed e
nerg
y, [P
J/ Y
ear]
Meat shrinkage Packaging use
-0,55 PJ / Jahre
Rise of fresh cut
Industry
(E�MAP)

Fresh cut food products – Dutch perspective
� Important� Largest source of income for
Dutch retail• Fresh turnover 10 B€
• Fresh cut greens turnover > 750 M€ in 2005, +14% /yr
� Traffic generator
� Trends: • Fresh = healthy, tasty, convenient
� Complex� Fresh produce lives
� Quality varies > 100%
� Sourcing issues
� Large portfolios• 100�250 fresh cut fruit and
vegetable products / shop

Pre�packed fresh cut products
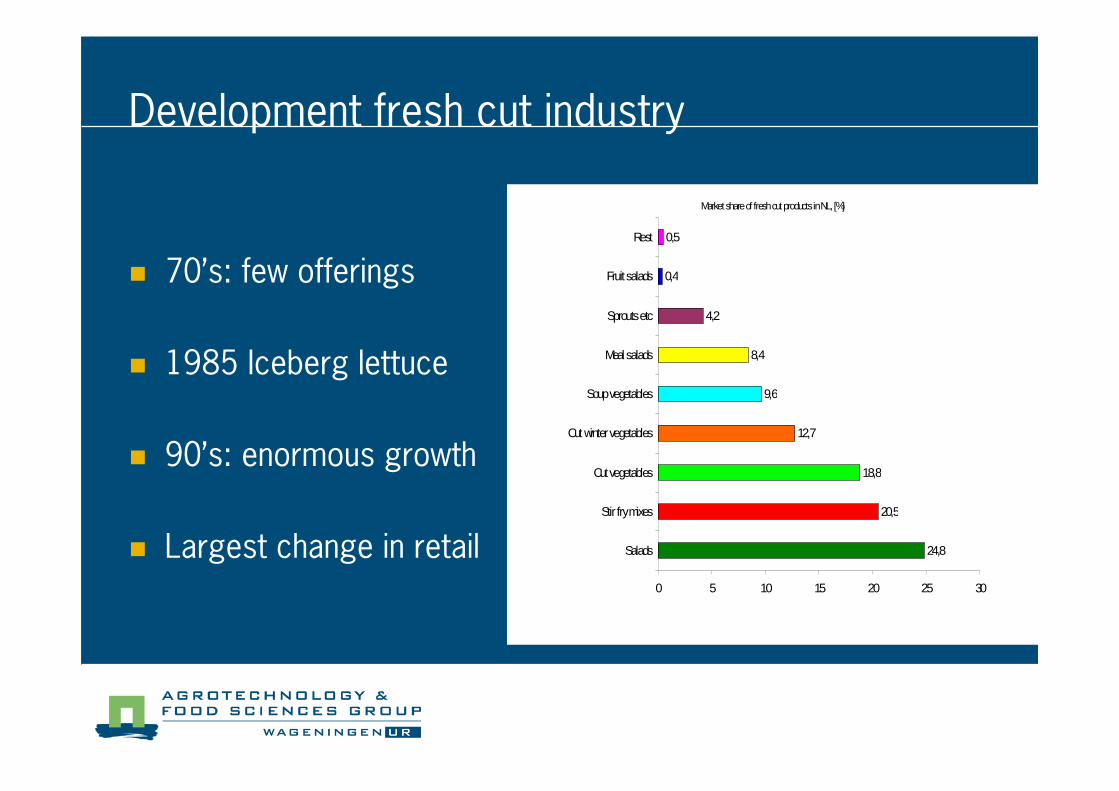
Development fresh cut industry
� 70’s: few offerings
� 1985 Iceberg lettuce
� 90’s: enormous growth
� Largest change in retail
Market share of fresh cut products in NL, [%]
24,8
20,5
18,8
12,7
9,6
8,4
4,2
0,4
0,5
0 5 10 15 20 25 30
Salads
Stir fry mixes
Cut vegetables
Cut winter vegetables
Soup vegetables
Meal salads
Sprouts etc
Fruit salads
Rest

Supply chain organisation
� Target = Profit for retail� 100% private label with contract suppliers
� Free trade, no contract farming
� Very competitive field for suppliers
� Packaging technology made it possible!� Every fresh cut producer via trail�and�error
Retail Fresh cut industry
Film suppliers
Machine builders
Produce trade

Respiration
� Complex
� From 1 to 300 ml O2/kg.hour
� Flow�packs (20 x 30 cm):
� �> 300 – 100.000 ml O2/m2.bar.day
� �> 500 – 300.000 ml CO2/m2.bar.day
� Mostly used solutions� BOPP/CPP/AF + micro�perforations
( ){ }tkKTR
EKR d
aC ⋅−⋅+
⋅−
⋅= exp1exp 21
+
+⋅=
)(
2
)(2
2
2
2
1fO
fCOOoxCO
Kmn
O
VmVRQV
x
KmnCO
COOKmO
OOvvO
+×+×=
)1()(max
2
222
222

Variation in quality
� Large difference between reality and theory (Literature)
� Variations of >100% in:� Microbiological load� Respiration activity
� Origin, harvest method, growing conditions, seed type….
� Simultaneously:� Control the initial quality and� Optimise packaging
Days shelf-life after transport
-2
-1
0
1
2
3
4
5
April June August October Average
Plane, standard box
Plane, new box
Boat, standard box
Boat, new box
0
2
4
6
8
10
12
14
16
18
0 1 2 3 4 5 6 7
Time, [days]C
arbo
n di
oxid
e, [%
]

Commercially applied flow�pack films
22oC & 35 µm
0
10000
20000
30000
40000
50000
60000
70000
0 10000 20000 30000 40000 50000 60000 70000
Oxygen
Car
bon
diox
ide
LLDPE
LDPE
PPPLA
PVdC-OPP
Microperforated BOPP films
[ml/m2.bar.day at 22oC]

Closer view
0
5000
10000
15000
20000
25000
30000
35000
40000
0 1000 2000 3000 4000 5000 6000 7000 8000
OTR
CT
R PS
PP
LDPE
LLDPE
[ml/m2.bar.day @ 22oC]

Temperature dependance
OTR, CTR and WVTR need to be specified at 7oC and 80�100%RH
Permeability of a BOPP/CPP/AF Film
0
1000
2000
3000
4000
5000
6000
7000
8000
0 5 10 15 20 25 30 35
Temperature, [ oC]
[ml/m
2 .bar
.day
]O2
CO2

Laser perforated films
Amcor 250
0
50
100
150
200
250
300
350
Dia
met
er, [µ
m]
ins ide width outs ide

Successful E�MAP applications
� Strawberries – soft fruit
� Broccoli
� Chicory
� Stir fry mixes
� Soup vegetables
� ….

Strawberries in MAP
Shelf life
18oC 5 �> 7 days
12oC 6 �> 8 daysFreshsafe 2
Clam shell
reference
Freshsafe 1

Stir fry mixes
� 5�10 Products in mix
� Optimal pre�treatments� Decontamination whole products
� Cutting method
� Washing method
� Edible coatings (Ca2+, vitamin C)
� Flow�packs with 2�6 Micro�perf.� Compromise atmosphere
� 5�7 days of shelf life
0
5
10
15
20
25
0 2 4 6 8 10 12 14
Time, [days]
Car
bon
diox
ide,
[%]
BOPP + 4p
BOPP + 4p
BOPS
BOPS

Anaerobic E�MAP
� Method to avoid discolorations / enzymatic browning
� Control the influx of O2
� Not too much → Discoloration
� Not too little → Fermentation
� Control the outflux of CO2
� Avoid suffocation in high CO2
atmospheres
� Raise α (CO2/O2)
10�20 ml O2/day >40 ml CO2/day

E�MAP for double fresh meals
� Steam and cook meals� 2005: 5�7 days SL �> 20%
shrinkage �> 5 €/meal
� Solution� Optimally fresh vegetables
• Quality focussed purchase
• Pre�treatments
• Decontamination
� Optimal E�MAP for freshly cutvegetables
� Protective marinade for meat/ fish component
� SL of 9�12 days feasible
Double Fresh
Double Fresh
EU funded projectFOOD-CT-2006-23182www.doublefresh.eu

3 Steps towards a high quality fresh cut product
� 1 Temperature ↓
� 2 Control initial product quality� Quality oriented purchase policy
� Decontaminate
� 3 Optimising packages
� Best Process
� Best Products
� Best Package

Top�seals for luxury salads
� Marketing � PET & Alu. > cla.�PP, PS > PP
� Product quality: � PS > PP > PET & Alu
� Costs� PET vs PP: ∆€ =+0,04 €/tray
� Environmental impact� PET vs PP: ∆EI = +0,45 MJ/tray
Embodied energy in packages from cradle to waste, [ MJ/pack]
0,00
0,20
0,40
0,60
0,80
1,00
1,20
1,40
PP-virgin APET-virgin
Tot
ale
ener
gige
brui
k va
n cr
adle
to w
aste
, [M
J]

Rise of the fresh cut industry in NL
+1700 BOPP film
+500 PET trays
~0Packaging use, [ton]
>300<1Profit, [M€]
750<1Turnover, [M€]
20051985

Weight reduction and the
growth of plastic packaging

Growth of plastic in Dutch MSW
Plastics packaging in MSW ~ 630 kton / year

Weight reductions
� From cans + glass jars to laminated board
� Thinner PET bottles...
� From thicker laminated films to thinner metallised / coated films
� GUA: plastic packaging most eco�efficient

Past trends in retrospect

Active packaging
� Oxygen scavengers work great with:
• Nuts, coffee, tea, cured meat, beer
• Post�pasteurised meals….
� Not applied� Costs > +0,01 € / pack
� Production logistics
� Difficult to integrate
� Limited capacity of integrated absorbers
� No quality benefits confirmed under real�life test conditions for:� Controlled release systems
� Ethylene scrubbers
� CO2 release systems
� ….

Controlled release ?
� Anti�oxidants, Anti�microbial agents, enzyminhibitors…
� Anti�microbial agents most widely studied� Only benzoic acid / sorbic acid are double allowed
� Ag+/zeolites does not work
� Essential oils work best as part of a marinade
� Musterd oil & cheese �> strong off taste in first weeks
� Chitosan film �> production, sealing issues and costs

Intelligent packaging?
� Packaging that reports information on the quality of the packed goods to outside world� Quality sensors, pH sensors
� Time�Temperature�Integrators
� RFID+temperature/RH sensor
� Forms� Most simple: label that discolours at a threshold
temperature
� Most elaborate: RFID+

Advanced stock management systems
� Product shrinkage NL: 1 billion € / jaar
Teler Handel Transport DC retailerRetailer +consument
Temperature Location Allocation Price
Input Output

Intelligent packaging
� Often used:� temporarily to optimise food chains and find and solve
bottle�necks� on crates/ trolleys to reduce lost cargo in supply chains
� No systematic use in supply chains on consumer packaging level� Investment costs in equipment and business culture
change are too large� Retailers do not want to infringe their fresh image

Nanotechnology
� Nanoclay barriers� In development and difficult
• Exfoliation in polymers
• Colour
• Temperature sensitivity
� Large potential for material reduction
� Migration test procedures for approval still unclear
• Although there is no prove for real danger
� Sensor & actuator technology in packages� Science fiction
Nanoclay coating

Bio�degradable and renewable packages
� Current applications� Beer cups
• PLA does not splinter
� Organic fresh produce• Avoid upsetting the heavy users of organic food
• Cheapest campaign to promote a sustainable image
� Other applications: difficult to get equal performance
� Generate free publicity

Environmental impact of packages
� Energy balance → CO2 formation → GWP
� Formation of final waste
� Depletion of non�renewable raw materials
� Additives� Not dangerous for the human, but for the planet?� ‚molecule of the month‘

Environmental impact of packages
� Bioplastics can be better, especially when there are few technical (permeability) constraints and the household waste is incinerated with energy recovery
Production Use Disposal
Often less embodied
energy in bioplastics
Often need more
bioplastics for
equal performance
Incineration with energy
recovery is better
than composting

Energy balance for yoghurt cups
Take care: different for every application, do not generalise!
0
0,1
0,2
0,3
0,4
0,5
0,6
0,7
0,8
PP INC+ER PLA Comp PLA INC+ER
Em
bodi
ed e
nerg
y, [M
J/pa
ck.]

Bio�barriers
� Various bio�barriers in development� PLA�SiOx�PLA
� PLA�PVOH+nanoclay
� Starch laminates
� Problems with� Machinability
� Permeability
� Applications of fresh foods with medium shelf life (4�6 wks) in barrier packages not successful yet
Bio Ref

Bio�degradable packages
� Price: always (a bit) more expensive
� Performance: equal or less
� Environment: sometimes better, sometimes not

Present trends � 2020
� Lighter & thinner packaging
� Fresher products:� Best product + best proces + best package (E�MAP)
� Renewable packaging
� Recyclable packaging

Packaging recycling:
what should happen

Growth of plastic packaging �> recycling
� Plastic packaging is a integral part of an efficient modern society� GUA: without, CO2�emissions would be much larger
� But the relative growth of plastic packaging is non�sustainable� Political need for efficient recycling programs
� Without a clear business need to do so

Political motivation for recycling
� Plastic packages contain energy� NL > 60 PJ (2% national energy use)
� Crude oil will become expensive in 10�50 years
� Long term strategy:� Recycled plastics for the most demanding applications
� Biobased plastics for less demanding applications

The ideal situation
� Efficient recycling system � Low costs and high yields
� Recycling system costs < costs for virgin polymers
� Impurities should be dealt with
� Sorting and reprocessing should be done within Europe
� Process should yield regranulate that ultimately can be used in the packaging industry� Is partially possible, but not implemented yet

Recycling: not a cycle but linked chainsSource separationDeposit refund Commingled collection
Products
• HQ PET regranulate
• MQ PET regranulate
• PO scrap etc.
Citizens
Retailer
DC
Counting centers
Reprocessing
Separate collection
Sorting centres
6 reprocessors
Citizens
Main products
• PO mix regranulate
• LQ PET regranulate
• PS regranulate
• …
MSW collection
Plastic recovery
Reprocessors
Citizens
Main products
• PO mix regranulate
• LQ PET regranulate
• PS regranulate
• ….
Sorting centres

Deposit refund systems
� Suitable for few types of packaging: 4�5%� Large PET soda bottles
� Large HDPE washing liquid bottles
� High (hidden) costs� Labor, floor space, RVM’s
� Costs are 2500�3000 €/ton
� But for 17% B2B recycling!

Source separation of plastic packaging
� Mostly used system in EU� High response rates are claimed, but:
• 5�30% is impurity• 10�30% overall material reuse• Rest for energy recovery
� Substantial costs are made for collection, sorting and reprocessing
� Materiel reuse at best: non food packaging, no recycling
� Need for more efficiency� New process technologies � Simplified business chains� Cost reduction

Commingled collection and centralised recovery
� Plastics can also be automatically be separated from MSW with MRF� Lower qualities
� High recovery rates possible
� Rigid and Flexible packaging recovered
� But:� Few existing waste companies
can add a MRF
� New recycling processes needed to deal with this new quality

System performance
� Too early for a full evaluation� Process chains are not
completely formed, yet
� Major uncertainty: � Possible higher processing
costs for plastics recovered from MSW
� More overlap expected
0
0,2
0,4
0,6
0,8
1
0 0,5 1 1,5 2 2,5 3
Costs recycling system / virgin polymer
Sys
tem
yie
ld /
tot
al a
mou
nt
Commingled
Collection &
Central sorting
Source separation
Deposit refund PET

Future outlook
� Long term strategy:� Recycled plastics for the most demanding applications
� Bio�based plastics for less demanding applications
� Plastic recycling needs to mature fast� Collection cost reductions (politics)
� New processing technologies (innovation)
� High level applications: packaging (reCYCLing)

Thank you!
© Wageningen UR