passive cooling and energy efficient strategies for the ... · 3 acknowledgments this thesis was...
TRANSCRIPT

Passive cooling and energy efficient strategies for the design of a hotel on the Southern coast of Pernambuco, Brazil
Thesis M.Sc. Architecture, energy and sustainability
LEARN, London Metropolitan University September 2003
Luiz Busato

2
To Cecy de Hollanda Busato

3
Acknowledgments This thesis was written during my academic time at the London Metropolitan University from 2001 to 2003 as part of the M.Sc. programme in Architecture, Energy and Sustainability. For this research I must thank my tutors Sue Wolff of London Metropolitan University and Dr Roberto Lamberts of Universidade Federal de Santa Catarina for their unfailing support and intellectual contributions. Thanks are also due to Jeanne Sillett of the University of Westminster, Dr Leonardo Bittencourt of the Universidade Federal de Alagoas, and to the staff of the Secretary of the Environment of Pernambuco for their support at the various stages in the development of this research.

4
Contents
PAGE
Introduction 8
Part One: background 10 1. Characteristics of the local climate 10
Temperature 11 Rainfall 11 Relative humidity 11 Sunshine and Radiation 12 Wind 12 Nebulosity 13
2. Thermal comfort 14 2.1 Fanger’s equation 14 Metabolic rate 15 Clo values 15 Comfort in tropical regions 16 2.2 Givoni’s psychrometric chart and strategies for Recife 18 2.3 Principles of natural ventilation 20 Effects in coastal areas 22 Effects of vegetation 23 Ventilation within buildings 24 Opening size and shape 24 Opening Location 26 Opening types 27 Vertical and horizontal projections 29 Calculation and prediction of airflow rates 32 Empirical Methods 33 Simplified Methods 33 Computational Fluid Dynamics Models (cfd) 35
3. Design strategies and hotel precedents 38 3.1 Climate and design strategies 38 3.2 Batu Jimbar Resort Pavilions, Bali 41 3.3 Teluk Datai Resort, Malaysia 44 3.4 Kingfisher Bay Resort and Village, Australia 47 3.5 Samaúma Park Hotel, Brazil 49
Part Two: Location 52
1. Historic background 52 2. Pernambuco today 56
The Atalantic coast 59 3. Location 62
Notional Site 63 Site Photos 64

5
Part Three: Brief overview 66 Orientation and Shading 67
CFD modelling 70 Conclusion 78
Bibliography 80

6
ILLUSTRATIOS Figure 1 - Map of Brazil .......................................................................................................10 Figure 2- Wind direction and frequency, whole year ...........................................................................12 Figure 3 - ASHRAE’s/Givoni’s Comfort Zones .................................................................................17 Figure 4 - Givoni's Psychrometric chart for Recife .............................................................................19 Figure 5 – Climatic zoning .....................................................................................................19 Figure 6 - Schematic distribution of wind pressure around a building..........................................................20 Figure 7 - Wind pressure, suction and wind flow around buildings.............................................................21 Figure 8 - Windflow and shadow effect between buildings .....................................................................22 Figure 9 - Daytime and Night-time breezes.....................................................................................22 Figure 10 – Effect of vegetation on wind pattern ...............................................................................23 Figure 11 - Palm trees, an effective shading device and little obstruction to wind flow.........................................23 Figure 12 - Average internal velocity, percentage of the outside as a function of the inlet/outlet ratio and wind direction......25 Figure 13 - Performance of different openings and wind direction .............................................................25 Figure 14- Effects of oppening location and size in adjacent walls .............................................................26 Figure 15 - Effects of clerestory on average internal airflow rates .............................................................27 Figure 16 - Adjustable louvres and projecting windows with fixed louvres .....................................................28 Figure 18 - Effects of wing-walls on cross ventilation .........................................................................29 Figure 19 - Effects of vertical projections to the air-stream direction ..........................................................29 Figure 20 - Horizontal projections and airflow patterns........................................................................30 Figure 21- Internal partitions and airflow patterns.............................................................................30 Figure 22 - Pressure distribution comparison between low-set building and one over pilotis..................................31 Figure 23 - BRE simplified method for cross-ventilaiton of single buildings....................................................34 Figure 24 - Difference between predicted and observed pressure coefficients for building of 46% porosity ....................35 Figure 25 – 3-Dimensional CFD model of naturally ventilated bedroom.......................................................37 Figure 26 - Weekend retreat on the margins of Rio Negro, Amazonas. ........................................................39 Figure 27 - Batu Jimbar pavilions site plan, G. Bawa .........................................................................41 Figure 28 - Batu Jimbar partial site plan and elevation, G. Bawa..............................................................41 Figure 29 - Batu Jimbar, House no. 2 plan, G. Bawa...........................................................................42 Figure 30 - Batu Jimbar, Living and dining pavilion, G. Bawa .................................................................42 Figure 31 - Batu Jimbar, Pavilion with reflecting pool .........................................................................43 Figure 32 - Teluk Datai, external view, Kerry Hill.............................................................................44 Figure 33- Teluk Datai, restaurant area, Kerry Hill............................................................................44 Figure 34 - Teluk Datai,, site plan, Kerry Hill..................................................................................44 Figure 35 - Teluk Datai, plan of typical villa, Kerry Hill .......................................................................45 Figure 36 - Teluk Datai, interior view of typical villa, Kerry Hill ..............................................................45 Figure 37 - Kingfisher resort,external view, Guymer Bailey....................................................................47 Figure 38 - Kingfisher resort, view of roof, Guymer Bailey.....................................................................47 Figure 39 - Kingfisher resor, cross section, Guymer Bailey ....................................................................47 Figure 40 - Kingfisher resort, partial long section, Guymer Bailey.............................................................47 Figure 41 - Samaúma Park, exterior view, Castro Filho .......................................................................49 Figure 42 - Samaúma Park, views of balcony and bedroom, Castro Filho......................................................49 Figure 43 - Samaúma Park, cross section, Castro Filho........................................................................50 Figure 44 - Samaúma Park, plan, Castro Filho ................................................................................50 Figure 45 - Map of Pernambuco ...............................................................................................56 Figure 46 - Map of Littoral zones ..............................................................................................59 Figure 47 - Location map ......................................................................................................62

7
Figure 48 - Site location and surrounding areas ...............................................................................63 Figure 49 - View from the sea ..................................................................................................64 Figure 50 – North view of adjacent coastline...................................................................................64 Figure 51 – South view of adjacent coastline and marshland...................................................................65 Figure 52 – South view of adjacent coastline...................................................................................65 Figure 53 - Stereographic projections, 1st January 6am, 5pm & 1st July, 6am & 5pm .........................................67 Figure 54 – Unit’s Plan, Section and perspective...............................................................................68 Figure 55 - Shade on openings, 1st January at 7am & 4:30pm..................................................................69 Figure 56 - Shading on openings, 1st July at 7:30am & 4:30pm ................................................................69 Figure 57 - Plan and section of the model......................................................................................71 Figure 58 – Models A & B, 0m and 1.5m.......................................................................................71 Figure 59 - Airflow pattern and pressure distribution for wind angle of 0° .....................................................72 Figure 60 - Airflow pattern and pressure distribution for wind angle of 22.5°..................................................72 Figure 61 - Airflow pattern and pressure distribution for wind angle of 45°....................................................72 Figure 62 – Airflow pattern and pressure distribution for wind angle of 0° ....................................................73 Figure 63 - Airflow pattern and pressure distribution for wind angle of 22.5°..................................................73 Figure 64 - Airflow pattern and pressure distribution for wind angle of 45°....................................................73 Figure 65 – Model C ...........................................................................................................75 Figure 66 - Shading on openings, 1st January at 8am and 1st July at 8:30am ...................................................76 Figure 67 - Airflow pattern and pressure distribution for wind angle of 22.5°..................................................76 Figure 68 - Models B & C – Perspective views, airflow pattern distribution for wind angle of 22.5° ...........................77 Figure 69 - Models B & C – Sectional airspeeds for wind angle of 22.5°.......................................................77

8
Introduction
Warm climates have a potential far beyond that found in more temperate and cooler climates. Unlike cool climates where the sense of enclosure requires a defensive strategy, warm climate buildings open and filter the climate in a multitude of ways. Thus the architecture responds to climate as one further vehicle for extending people’s experience of the building. These intangible aspects of architecture provide an additional palette of aesthetic and creative concepts.1
Non-domestic buildings in Brazil use a considerable amount of energy, up to 19% of the total national consumption of electric power.2 In this paper we consider possible design strategies that would enable a reduction in the use of artificial energy in hotels whilst maintaining acceptable levels of thermal comfort for the occupants. In Brazil, the source of power is largely from hydroelectric generators and although the country possesses a huge generative capacity and the total national consumption is relatively low when compared to most developed countries, there was recently a shortage of electricity to three main states in the country caused by a lack of adequate investment strategies, and the recent privatisation process undergone by some companies previously owned by the state.3 Currently there is a surplus of energy available in the country and the cost of electricity remains relatively low. New building codes are at present being developed for some parts of the country, but unfortunately, and as is the case in many developing countries, the existing building legislation does not reinforce any energy saving measures. There is little incentive to restrain energy consumption, particularly in the industrial and commercial sectors. Whilst hydroelectric power is a renewable source of energy, the formation of large-scale dams has in the past caused considerable disruption to the eco-systems around the areas where they were constructed. The incentives to save energy will not occur in the country until the new regulations become the rule and without a better awareness amongst the professionals in the building industry. This paper is divided into three parts. In the first we look at some of the necessary background information, local climatic conditions, the principles of thermal comfort in those conditions and some precedents of hotel building. In the second part we look briefly at the historic background of the area, the current socio-economic conditions and potential for the area, the location of a possible site and the brief possibilities. Part Three is concerned with the testing of some of the design strategies discussed here, solar shading and the environmental modelling of a hotel bedroom of a typical plan configuration through computer simulations. The assessment of some of the effects of wind flow and natural ventilation has been carried out using Flovent, fluid dynamics
1 Hyde R; [2000] Climate Responsive Design. London, E & FN Spon Press. 2 Geller, H; [1994] O Uso Eficiente da Eletricidade: uma estratégia elétrica de desenvolvimento para o Brasil. INEE, ACEEE, Rio de Janeiro, R.J. 3 Currently, the total national consumption is equivalent to that of the state of California, around 200 million MWh. Rosa Pinguelli,L; [2001] O Apagão, Por que veio? Como sair dele? Rio de Janeiro, Ed. Revan ltda.

9
software. It uses a CFD code, computational fluids dynamics to simulate airflow and heat transfer between the different design elements. The choice of the possible area for a hotel type of intervention was inspired by a long lasting curiosity for this beautiful and culturally diverse region of Brazil. As we will be describing in Part Two, the coastal area of Pernambuco has also been the locus of an intriguing and complex chain of historic and political events that have all contributed to its cultural wealth on the one hand and compelled some pernicious social conditions on the other. Whilst there have been some very slight improvements in the living conditions of the average Pernambucano in recent years, the current social indicators still show a grim state of affairs. At long last the government appears to be investing in the infrastructure of the state and so opportunities exist for schemes that are both environmental sensitive and socially inclusive. Our research into precedents of hotels in similar climatic conditions has shown that a great number of tropical hotels and resorts employ active systems in the form of air-conditioning. The terms active and hybrid cooling refer to systems that invariably make use of plant or equipment to modify the climate whereas passive cooling refers to a system in which no plant or equipment is used.4 In tropical climates, hotels often rely heavily on mechanical air-conditioning systems. This research is concerned with possible strategies that may reduce the need for such systems and invariably, the energy consumption within the tropical hotel typology. As we will be discussing here, thermal comfort in these climatic conditions is not only connected to air temperatures, but also to airflow and air speed, and sweat evaporation. The assumption here is that, in the case of Pernambuco, a system that is mostly reliant on passive cooling and the use of simple devices such as electrical fans is more desirable within a hotel environment than a fully loaded mechanical system. As we will be seeing here, particularly in the case of one of the precedents considered in similar climatic conditions, this assumption is not so far fetched. But the decision on whether a hotel should or should not make use of mechanical air-conditioning systems is often driven by the guests’ expectations of comfort, levels of acclimatisation and cultural habits. Unfortunately, no research of this type is currently available for this region of Brazil, and although such a task would clearly involve lengthy investigations into such complex issues, it could prove to be a critical step towards a ‘culture-change’ and the harnessing of energy resources. Given the local climatic characteristics, there are several design strategies available to the architect at an early stage of the design that can improve natural ventilation within the hotel typology. This research is concerned with the various issues concerning such strategies. As we will see in the following pages, amongst the suggested methods for passive ventilation in tropical climates are the optimisation of orientation, open narrow plans, high ceilings, ventilated roofs, raised floors, breezeways, verandas, shading devices, reflective external materials, planting and landscaping etc. Whereas these are only some of the well-tried, and architecturally tangible strategies for passive responsive solutions in those climates, the particular weather conditions of hot and humid climate, renders other known approaches such as thermal mass for cooling less advantageous.
4 Hyde R; [2000] Climate Responsive Design, pp. 57

10
Part One: background 1. Characteristics of the local climate Located between latitudes 2° North and 30° South, and longitudes 35° and 75° west. Brazil is the largest country in the inter-tropical band. With an area of about 8.5 million Km2 the country extends over nearly half of South America. Because of its vast territorial extension and diverse topography, the climatic conditions in the different parts of Brazil vary a great deal. The Brazilian climate is divided into six categories: equatorial, tropical, tropical of altitude, tropical Atlantic, semi-arid and subtropical.
Figure 1 - Map of Brazil
Pernambuco state is located on the North-east of Brazil. Its capital, Recife is on the coast, latitude: 8°01’S and longitude: 34°51’W.

11
Temperature The coastal climate is hot and humid and it falls within the tropical Atlantic category. There are only two seasons: summer and winter with an annual temperature range of 3°C. The hottest month is February with a mean temperature of 27°C and the coldest is August with 24°C (table 1). The lower temperatures occur at 5:00h and the higher at 13:00h5. Rainfall There are no clear monsoons but precipitation tends to be a dominant climatic element characterizing the two seasons. In the “winter” (May to August) the average monthly incidence of rainy days is 24, whereas in the summer (November to February) that number drops to 11 days on average. The highest incidence of precipitation occurs in May (260mm) and the lowest in November (28mm).
Table 1- Recife's climate6 J F M A M J J A S O N D YEAR Mean Temperature (°C)
27.1
27.1
27.0
26.6
25.9
25.0
24.3
24.4
25.3
26.2
26.6
26.9
26.0
Mean max temp (°C)
30.0
30.0
30.0
29.4
28.3
27.8
26.7
27.2
27.8
28.9
29.4
29.4
28.9
Mean Min temp (°C)
25.0
25.0
24.4
23.9
23.3
22.8
21.7
21.7
22.8
23.9
24.4
25.0
23.9
Mean Humidity (%)
73
76
76
78
79
80
79
78
74
71
71
72
76
Mean Precipitation (mm)
47
109
157
226
260
257
186
116
52
30
28
33
1501
Days with Precipitation
12
14
16
21
23
24
25
22
15
11
9
10
202
Mean Sunshine (h)
8.5
7.5
7
6.5
6.1
5.7
5.3
6.8
7.4
7.9
7.9
8.7
85.3
Mean wind Speed (m/s)
3.0
2.8
2.6
2.9
2.8
3.6
4.0
3.3
3.4
3.2
2.1
2.0
2.9
Wind direction
E.SE
SE
SE
SE
SE
SE
SE
SE
SE
E.NE
NE
E
Relative humidity The mean annual relative humidity is 76%. RH is at its highest in June at 80% and at its lowest in the summer months of October and November, at 71%.
5 Bittencourt, L.S., [1993] A.A. PhD thesis Ventilation as a Cooling Resource for Warm-humid Climates: An Investigation on Perforated Block Wall Geometry to Improve Ventilation Inside Low-rise Buildings. Pp. 49 6 Müller, M; [1983] Handbuch ausgewählter Clemastationen der Erde Universität Trier. Forschungsstelle.

12
Sunshine and Radiation The incidence of sunshine in the “summer” months is 8.1 hours per day and 5.9 hours in the “winter”. Daily radiation is high and it ranges from 23 MJ/m2 in the summer and 18 MJ/m2 in July. It suggests the need to reduce radiation inside buildings to the minimum necessary for daylight. Wind On average, the wind speeds vary from 2.0m/s to 4.0m/s. Most wind comes from the southeast and the direction of the prevailing winds is 108° S, Figure 2. The presence of east and north winds is attributed to the displacement of the inter-tropical convergence zone. There are variations in the wind speeds at different times of the day, lower speeds occurring in the mornings and higher in the afternoon. On average the strongest winds occur around 15:00h, fortunately at the time when ventilation is mostly desirable for cooling purposes.7
Figure 2- Wind direction and frequency, whole year
7 Ibid, pp. 54

13
Nebulosity Typically of hot and humid climates, the sky condition is usually partially clouded. The occurrence of clear skies is rare, around 4.5% on average per year and the incidence of overcast skies is about 15%. Cloud levels are higher around the winter solstice from April to August and lower from October to November.

14
2. Thermal comfort The term thermal comfort is defined as “the state of mind that expresses satisfaction with the thermal environment.”8 But whereas this is the most accepted definition, the concept presents several problems when translated into physical parameters. It not only involves physiologic but also psychological and subjective considerations, different people may feel thermally comfortable in totally different thermal environments. As we will see below, this difficulty in setting a ‘universal’ standard of acceptable levels of thermal comfort is further emphasised when we consider the basis upon which the current international standards have been formulated and other issues such as acclimatization and cultural expectations. The control system that regulates body temperature is complex and not yet fully understood.9 But the two most important sets of sensors are known: they are located in the skin and in the hypothalamus centre in the brain. The system ensures that the body’s core temperature is kept at approximately 37°C. The body’s cooling function starts when the body’s core temperature exceeds 37°C and its defence against the effect of cooling down starts when the skin temperature starts to fall below 34°C.10 This regulatory system is not only dependent on environmental parameters but also on two subjective factors, namely the level of human activity and the appropriateness of the clothing. Next we look at the physical parameters that influence thermal comfort. 2.1 Fanger’s equation Fanger’s thermal comfort or heat balance equation is: M – W = H + Ec + Cres + Eres where, M: metabolic rate (W/m2); estimated according to activities W: effective mechanical power (W/m2); it can in most cases be set to zero H: dry heat loss (W/m2); either measured directly using a transducer or calculated from heat loss equations11 Ec: evaporative heat exchange at the skin, when the person experiences a sensation of thermal neutrality (W/m2); Ec = 3.05*103*(5733-6.99*(M-W)-Pa)+0.42*(M-W-58.15) Cres: respiratory convective heat exchange; Cres = 0.0014*M*(34-ta) Eres: evaporative heat exchange (W/m2); Eres = 1.72*105*M*(5867-Pa) ta: air temperature (C°) Pa: humidity, partial water vapor pressure in the air. Central to the idea of thermal comfort and Fanger’s equation is the concept of thermal neutrality, which means that a person feels neither too hot nor too cold. To that end, a
8 ISO, ASHRAE Standard, 1995 pp3. 9 INOVA, Thermal Comfort, http://www.innova.dk/files/pdf/Thermal%20Booklet.pdf pp 6. 10 Ibid 11 Ibid, Appendix A

15
person must lose heat at the same rate as it is produced or gained. People lose heat through radiation, convection and evaporation of perspiration. Humidity levels and air movement influence the rate of evaporation; evaporation rate is reduced when humidity is high and when air movement is low and vice versa. As we will see, sweat evaporation through air movement is a critical element in strategies for passive cooling in warm and humid climates. Metabolic rate Metabolic rate is the heat generated by the body depending on the level of physical activity being performed. About 75% of the energy consumed by the body ends up in the form of heat which in turn heats up the body12. Metabolic rate is normally measured in Met (1 Met = 58.15 W /m2 of body surface). A normal adult has a surface area of 1.7 m2, and a person in thermal comfort with an activity level of 1 Met will thus have a heat loss of approximately 100W.13 Metabolic rate varies between individuals according to their age and sex. The following are some examples of estimated values of metabolic rate for different activities: Table 2 - Metabolic Rates 14
Activity Metabolic rate (met unit) Reclining 0.8 Seated, quietly 1.0 Sedentary activity (office, dwelling, lab, school) 1.2 Standing, relaxed 1.2 Light activity, standing (shopping, lab, light industry) 1.6 Medium activity, standing (shop assistant, domestic work, machine work) 2.0
High activity (heavy machine work, garage work) 3.0 Clo values Clothing reduces the body’s heat loss and it influences the H parameter in the thermal comfort equation. The unit used to measure clothing’s insulation is Clo and 1Clo = 0.155m2°C/W. The various combinations of temperature, air movement, humidity and radiation produce a range of comfortable conditions that can be used to define a comfort zone. This zone can be plotted on different types of charts, bioclimatic, psychrometric or on normograms of effective temperatures. Figure 3 below shows a pshychrometric chart, it presents the physical and thermal properties of moist air in a graphical form.
12 Ibid pp 10. 13 Ibid pp 10. 14 ASHRAE Standard, Feb 2001 pp 62

16
Table 3 - Clo Values 15
clo value Ensemble
0.0 nude
0.3-0.4 briefs; shorts, open-neck short-sleeved shirt, light socks and sandals
0.5 panties: broadcloth, short-sleeve shirt; A-line, knee-length skirt; pantyhose; thongs/sandals
0.6 briefs; broadcloth, long-sleeve shirt; long fitted trousers; belt; calf-length socks; hard-
soled shoes
0.7 panties; full slip; broadcloth, short-sleeve shirt; belted A-line dress; long-sleeve sweater;
pantyhose; hard soled shoes
0.7 panties; broadcloth, long-sleeve shirt; sleeveless round-neck sweater; shorts; thick knee
socks; hard-soled shoes
1.0 briefs; broadcloth, long-sleeved shirt; single-breasted suit jacket; tie; straight, long fitted
trousers; calf-length socks; hard-soled shoes
1.5
briefs; broadcloth, long-sleeved shirt; single-breasted suit jacket; tie; straight, long fitted
trousers; calf-length socks; hard-soled shoes; cotton topcoat (or heavy wool suit without
topcoat)
Comfort in tropical regions As suggested above, one of the problems with establishing the optimum thermal conditions for comfort within buildings in the tropical regions of developing countries is that currently, the international standards that define what those conditions should be were based primarily on studies carried out in mid-latitude climatic regions of developed countries.16 More often than not such studies were carried out in air-conditioned buildings. But the perceived need for and expectations of air conditioning of different individuals and cultures can vary a great deal. The applicability of such indices to warm regions is subject to controversy and complaints in this regard are not uncommon.17 Although ASHRAE’s scale of effective temperature is normally taken as the standard for thermal comfort in air-conditioned buildings in temperate climates, its
15 Chen, P. The Implications of Thermal Comfort in New Zealand House Design, http://meanradianttemperature.com/chen1.htm Sept 2002. 16 de Dear R, Brager G, Cooper D, Developing an Adaptive Model of Thermal Comfort and Preference, Final Report, ASHRAE RP – 884, Macquarie University, Sydney 1997, pp 1,2. 17 Bittencourt, L.S., [1993] A.A. PhD thesis Ventilation as a Cooling Resource for Warm-humid Climates: An Investigation on Perforated Block Wall Geometry to Improve Ventilation Inside Low-rise Buildings. Pp. 74.

17
applicability to non-air-conditioned buildings in warm regions is arguable. While the ‘comfort zone’ might be seen as a design goal for HVAC systems in tightly controlled indoor spaces, its relevance to naturally ventilated buildings where the conditions are far more varied is indeed questionable. In Singapore for instance where an index of equatorial comfort has been considered, the building legislation regarding energy conservation in naturally ventilated buildings stipulates a maximum dry bulb temperature of 27°C and maximum RH of 75%, a significantly wider comfort zone than the normally accepted 24°C and 50% RH.18 The bioclimatic chart and comfort zone adopted for Brazil are based on Givoni’s method.19 His study is specifically directed to comfort standards of unconditioned buildings in developing hot countries. Unlike ASHRAE’s method, Givoni’s method starts from the premise that there is a difference between acceptable indoor conditions for air-conditioned and for non-air-conditioned buildings, and that this difference must also be reflected in the thermal comfort charts through greater limits of air speed for higher temperatures and humidity. In his paper, Comfort, climate analysis and building design guidelines,20 Givoni discusses the role of higher air speeds in the enhancement of comfort for the acclimatized inhabitants of hot and humid climates. Figure 3 shows ASHRAE’s (55-1981) and Givoni’s comfort zone for naturally ventilated buildings in hot-developing countries.
Figure 3 - ASHRAE’s/Givoni’s Comfort Zones
(After Givoni 1992)
18 Bogo A, Pietron C, et al. Biolcimatologia Aplicada ao Projeto de Edificações Visando o Conforto Térmico. Relatório Interno. Universidade Federal de Santa Catarina, 1994, p. 15 19 Ibid. The Brazilian norms and regulations for thermal performance in social housing were written in 1998 and are currently being incorporated into the national building code. http://www.labeee.ufsc.br/conforto/textos/termica/t3-termica/texto3-0299.html 20 Givoni, B. Comfort Climate Analysis & Building Design Guidelines. Energy and Buildings, v. 18, no. 1, 1992.

18
From the chart above we can see that Giovoni’s method consists of a much wider comfort zone (from 20°C to 32°C, at a max. RH of 90% and to 30°C, for 70% RH ) than that suggested by ASHRAE (from 20°C to 27°C at a max 80% RH in the winter). This he attributes to the restrictive air speeds suggested by the ASHRAE method. In Figure 3 the comfort zone is for still air conditions, 0.15m/s in winter and 0.25m/s in summer. ASHRAE Fundamentals Handbook suggests a maximum acceptable indoor air speed of 0.8m/s which would elevate the DBT by 1°C to 28°C, in the ASHRAE Standard, the acceptable upper humidity limit is not affected at all by the higher air speed.21 So what then is the most adequate internal air speed for naturally ventilated buildings? Like Givoni, Richard Hyde also suggests wind speed of up to 2m/s as a desirable strategy for hot and humid climates.22 Givoni also explains that the internal climate of naturally ventilated buildings reacts more widely to the external climatic variations.23 He argues that people living in non-air-conditioned, naturally ventilated buildings usually accept greater variations in temperatures and air velocities. In his analysis of the Mexican city of Colima, he uses ASHRAE’s chart to demonstrate that according to ASHRAE’s index the months from June to October would be outside its comfort zone. But when asked, the local habitants answered that during those months they found the climate, both indoors and outdoors, comfortable at least in the early hours of the mornings and later in the evenings. Within a tropical hotel environment the cultural expectations of the different guests regarding thermal comfort is clearly an important strategic factor that may have considerable commercial implications and must be addressed at an early stage in the development. 2.2 Givoni’s psychrometric chart and strategies for Recife LabEEE of the Universidade de Santa Catarina in Brazil is a centre for the advancement of environmental issues in architecture. It has carried out a comprehensive research of the most adequate design strategies towards climate responsive solutions to buildings in Brazil.24 Much of the following is based on the findings of that research. Its analysis of the climatic conditions of 14 of the main cities in Brazil uses Givoni’s psychrometric chart to derive some interesting and useful conclusions. It is worth noting here that one of the most important differences between Givoni’s method and others such as that of Olgyay, is that his chart is based on internal temperatures. These were obtained through calculations projecting the expected internal temperatures for un-air-conditioned buildings that are adequately built for 21 Ibid, pp 12. 22 Hyde R; [2000] Climate Responsive Design, pp. 25. 23 Givoni, B. Comfort Climate Analysis & Building Design Guidelines. Energy and Buildings, v. 18, no. 1, 1992, p. 11-23. 24 Lamberts R, Dutra L, Pereira O; [1998] LabEEE multimedia cd Universidade Federal de Santa Catarina.

19
their environment, in other words, buildings that are thermally responsive, efficiently protected against solar radiation and with adequate natural ventilation.25 Ventilation is the most applicable strategy to most parts of Brazil followed by thermal mass in hot and dry and moderate climates. Thirdly, the system suggests passive solar heating for most cities during the cold periods. The use of mechanical air-conditioning only being regarded essential in a few cities in the North and North-east but even there its application can usually be substituted by or used in conjunction with more economic alternatives such as ventilation or thermal mass for cooling. In the following diagram Givoni’s psychrometric chart is used to relate the local temperatures and relative humidity for Recife.
Figure 4 - Givoni's Psychrometric chart for Recife
The intersections of the chart above show that during 31,6% of the year the external temperatures are within the thermal comfort zone and that the heat causes discomfort during 68,3% of the year.
Figure 5 – Climatic zoning
no.1: Comfort zone, 31,6 %, no.2: Strategies for climate modification,
Ventilation: 60,8 %, Ventilation with mass for cooling: 7,1 %, air-conditioning: 0,1 %
25 Bogo A, Pietron C, et al. Biolcimatologia Aplicada ao Projeto de Edificações Visando o Conforto Térmico. Relatório Interno. Universidade Federal de Santa Catarina, 1994, p. 38

20
As already indicated, the most appropriate strategy suggested by this method is ventilation, solving the problem of discomfort at 67,9% of the time, almost in its totality. Strategies to maximise airflow and reduce humidity are therefore the most advisable for Recife. Orientation, thin unobstructed open-plan, raised floor, high ceiling, ventilated roof, well distributed large openings with adequate solar protection and the provision of shaded verandas, etc are all strategies to be considered. Although the method suggests the use of some thermal mass to resist internal gains coupled with ventilation (bottom of Fig.5 no. 2), because of the permanent need to maximise ventilation both during the day and night, the use of heat capacity and resistance of external walls to reduce internal gains during the day is not feasible.26 The employment of mass in this way is more appropriate for hot and dry climates where the temperatures often drop considerably at night, and even under those climatic conditions such application requires careful consideration if it is to fit within a more holistic mode of intervention with the environment. As Richard Hyde rightly points out, the use of heavy mass in the external fabric, particularly in the context of hotels and resorts in tropical climates, has often been only one aspect within a more embracing tendency towards the provision of what he calls “the man-made universal climate:27” tightly controlled internal environments which also rely on other elements such as large expanses of solar glass and considerable mechanical plants for cooling and dehumidification. Often foreign to the local landscape, sadly those types of developments have also become commonplace to many of the Brazilian coastal areas. 2.3 Principles of natural ventilation The main driving force that causes natural ventilation through buildings is the pressure differential across the building envelope. This pressure difference can be generated by wind pressure, thermal buoyancy (stack or chimney effect) or by a combination of both. These effects operate in a building in varying proportions according to the strength of the prevailing wind and the temperature conditions. The effect of wind pressure is a highly complex subject and generalisations in this field often lead to erroneous architectural strategies. In principle, airflow occurs between areas of positive and negative pressure.
Figure 6 - Schematic distribution of wind pressure around a building
(From Givoni 1976).
26 Givoni B; [1969] Man, Climate and Architecture, Elsevier Publishing pp 355 27 Hyde R; [2000] Climate Responsive Design, pp. 8

21
Cross-ventilation occurs between these polarities of pressure. One empirical design rule is that openings should be widely distributed over individual surfaces and different façades of the building envelope. This ensures that the openings will be at different pressures, and that the subsequent airflows will be well distributed in the building.28 In the following pages we look at some of basic factors affecting natural airflow in and around buildings. The resistance to flow of air through the building affects the actual airflow rate. Natural ventilation and infiltration are driven by pressure and suction across the building envelope as indicated in the diagrams below.
Figure 7 - Wind pressure, suction and wind flow around buildings
(From Markus & Morris, 1980)
The shape and orientation of the building relative to the direction of the wind are both directly related to the way in which the airflow behaves around volumes. Other obvious factors affecting airflow patterns around the building are the topography, the physical relationship to surrounding volumes and obstacles: other buildings, fences, vegetation etc. The relationship between high and low rise buildings, for instance, can 28 Baker N., Steemers K., Energy and Environment in Architecture. E & FN Spoon 1999. pp. 56.

22
cause turbulence increasing the air velocity resulting in greater wind pressures (Fig. 8). The positioning of buildings within the ‘leeward shadow’ or suction zone of other structures can also have a considerable impact on the amount of air going through the air inlets of naturally ventilated buildings. In order to avoid this ‘shadow’ effect, the distance between the buildings has to be at least six times the height of the first obstructing volume.29 Alternatively, a staggered layout can be used as indicated in (Fig. 8).
Figure 8 - Windflow and shadow effect between buildings
(After Koenigsberger, Markus & Morris 1980)
Effects in coastal areas On coastal areas, the different heat capacities of the land and water masses cause what is known as the land and sea breezes. In the daytime the land heats up faster than the sea causing the warm, lighter air near the surface to rise generating a current of cooler air from the sea towards the land. At night the reverse effect occurs as the water retains the heat gained during the day for a longer period than the land, causing air current towards the sea.
Figure 9 - Daytime and Night-time breezes
(After Bittencourt, 1993) 29 Markus T A, Morris E N. Buildings, Climate and Energy. Pitman Publishing, London 1980, pp. 362 to 364.

23
Effects of vegetation The microclimate of the site can be greatly affected by the type of the surrounding vegetation. A large forest or a densely planted zone produces a relatively small wind wake area, the re-circulation region immediately after the obstruction containing low velocity eddies, in relation to its size, (Figure 11b). A short and high line of trees on the other hand can produce a relatively large wake size acting as a windbreak,(Figure 11a).
Figure 10 – Effect of vegetation on wind pattern
(After Bittencourt, 1987) The density of tree foliage and the presence of lawn or shrubs under a group of trees may also generate distinct flow patterns. For a line of trees with foliage starting at about 1.5m from the ground, the wind flow rates may be reduced by 30% to 50% depending on the distance between the individual trees. But for trees with high foliage that are planted well apart from each other and the wind can flow underneath and between the trees, the distance from the building is not significant for ventilation purposes. In tropical regions coconut and palm trees can produce shading with a minimum impediment to wind flow.30 As we will see in Part Two when we describe the area for the proposed hotel, coconut tree crops are characteristic features of the landscape considered here.
Figure 11 - Palm trees, an effective shading device and little obstruction to wind flow
(From: Bittencourt, 1985)
30 Bittencourt, L.S., [1993] A.A. PhD thesis Ventilation as a Cooling Resource for Warm-humid Climates: An Investigation on Perforated Block Wall Geometry to Improve Ventilation Inside Low-rise Buildings. pp. 138

24
Ventilation within buildings The design requirements of the individual spaces should determine whether an even distribution or concentrated jets of air are the most appropriate for ventilation purposes. In a hotel environment, an even distribution is likely to be more adequate for spaces such as halls or dining areas where flexibility in their functions may be a design consideration and where draughts or zones of still air are undesirable. Whereas concentrated jets with higher speeds might be more appropriate for spaces such as bedrooms where the occupants are induced to remain in a fixed location. The main factors affecting the pattern of airflow entering a building are the size and shape of the inlet apertures, the location of the openings, the type and configuration of the inlets and the configuration of other adjacent elements such as internal partitions, projections and vegetation. Opening size and shape Bittencourt31 has carried out a thorough investigation into natural ventilation of low-rise buildings (up to three storeys) in warm-humid climates, much of the following is based on that research. Average internal air speeds are represented as a percentage of the external wind speed. Opening sizes and shape are important factors that determine the airflow within buildings. For buildings with openings in opposite walls, improved ventilation rate can normally be achieved by an angular wind incidence to the inlet, Figure 12. In this situation, greater airflow rates are also usually achieved when the outlet is larger than the inlet opening. But whereas the reverse is also true, air speed is more evenly distributed around the space when the outlet is smaller than the inlet.32 This is because part of the kinetic energy is converted to static pressure around the leeward opening.33 When the inlet and outlet are of the same size, the internal air speed is related to the porosity of the building envelope irrespective of the angle of incidence of the wind. For instance, a building with 40% porosity causes an average indoor wind speed nearly twice that of a building with 15% porosity.34 The shape and configuration of the opening also have an effect on the internal wind speeds. For a given opening size, horizontally, square and vertically shaped inlet openings yield different internal air motions. Horizontally shaped inlets provide much
31 Ibid. 32 Givoni B; [1969] Man, Climate and Architecture, Elsevier Publishing pp 264. 33 Bittencourt, L.S., [1993] A.A. PhD thesis Ventilation as a Cooling Resource for Warm-humid Climates: An Investigation on Perforated Block Wall Geometry to Improve Ventilation Inside Low-rise Buildings, pp. 140. 34 Ibid.

25
Figure 12 - Average internal velocity, percentage of the outside as a function of
the inlet/outlet ratio and wind direction
(After Bittencourt 1993 and Givoni 1969)
higher internal air speeds than square or vertical inlets for all wind angles, the optimum performance for horizontal inlets is achieved when the wind incidence angles are directed at around 45° to either side of the perpendicular, Fig. 13a. Rectangular openings also provide a more evenly distributed internal airflow. The introduction of vertical louvres alters the performance of horizontally shaped inlets as a function of the wind and louvre angles, Fig. 13b.
Figure 13 - Performance of different openings and wind direction
(After Bittencourt 1993)

26
Opening Location Cross-ventilation is optimum in rooms with openings in three different façades but such configurations are not common.35 For rooms with openings in two adjacent walls, higher average air speeds are achieved when the angle of the wind is perpendicular to the inlet for most configurations, as opposed to inclined wind incidences, Fig. 14. In buildings with intermediate openings, the internal air-distribution is mostly determined by the total area of the openings in the walls with the smallest area of openings. This may be an important consideration in the planning of multi-zone spaces such as entrance lobbies of large hotel buildings.
Figure 14- Effects of oppening location and size in adjacent walls
(After Bittencourt 1993, Givoni 1976)
Ventilation openings can also be placed in the roof or above in the form of clerestory windows, ridge projections or wind-catchers. Wind velocities above the roof level are much greater than at wall level and those devices potentially act either as air inlets or as extractors, depending on the wind direction. This strategy is particularly advantageous in densely built areas, as such projections have significantly smaller volumes than the building below and so they are less likely to become obstructed by adjacent developments. The effectiveness of clerestory opening in roofs as a ventilation device has been tested in wind tunnels36 and has shown that the clerestory area needs to be at least 20% of the cross-sectional area of the building perpendicular to the window direction. When clerestory openings are properly designed, the improvement in average indoor air speeds for cross-ventilated rooms can be as high as 40% for openings acting as exhausts and 15% when functioning as inlets.37 Figs. 20a) and b) indicate the incorrect positioning of clerestory openings relative to the building’s central axis.
35 Ibid, pp 142. 36 Gandemer, J. et al; [1992]. Guide sur la Climatisation Naturelle de l’Habitat en Climat Tropical Humide. Tome 1: Methodologie de Prise en Compte des Parametres Climatiques dans l’Habitat et Conseils Pratiques. CSTB, Nantes. 37 Bittencourt, L.S., [1993] A.A. PhD thesis Ventilation as a Cooling Resource for Warm-humid Climates: An Investigation on Perforated Block Wall Geometry to Improve Ventilation Inside Low-rise Buildings, pp. 146.

27
The best position for clerestory openings acting as inlets is in the upwind section of the roof and in the downwind for exhausts.
Figure 15 - Effects of clerestory on average internal airflow rates
(After Gandemer et al, 1992)
Wind-catchers have been successfully employed in several regions in the Middle-East and Africa. But as Bittencourt rightly points out, unfortunately these devices are not yet common to buildings in the northeast of Brazil, attempts are yet to be made to combine wind-catchers with elements such as elevated water tank structures, a common building feature of the region. In a hotel, the introduction of roof ventilation could be a particularly useful strategy also for deep-plan spaces or as extractors to kitchens, where flow rates provided by wall openings alone may not suffice.
Opening types Apart from the environmental considerations, daylight, ventilation, protection from the rain, type of materials and embedded energy; the choice of the opening type is also determined by other equally important factors such as the function of the space, aesthetics, operability, views, cost, availability, security and privacy.

28
From the ventilation point of view, the most adequate types of openings for warm climates are those with a high degree of porosity, about 50%.38 Desirable typologies of windows include louvres, jalousies and horizontally pivoted sash windows, particularly if they also incorporate louvres that incline as a function of the sash position. Adjustable horizontal louvres are especially beneficial as they allow for greater control of the direction of airflow inside the room, Fig. 16.
Figure 16 - Adjustable louvres and projecting windows with fixed louvres
(After Boutet, 1987)
Louvred openings can also be used in conjunction with other elements such as high-level shading projections and perforated blocks to increase the airflow within the rooms. An element called the ‘peitoril ventilado’, ventilated sill, Fig. 17, has been
38 Aynsley, R, Melbourne, W. and Vickery, B. J. [1977]. Architectural Aerodynamics. Applied Science
Figure 17 –The ventilated sill
(After de Holanda 1976 and Bittencourt, 1993)

29
favorably employed in the northeast of Brazil for sometime now. It functions as an additional air inlet and its position below the window is especially useful in bedrooms, providing airflow at bed level whilst maintaining privacy and protection against the rain; a strategy well worth considering in an hotel environment. Vertical and horizontal projections The introduction of vertical projections such as external wing-walls or internal partitions causes alterations to the internal airflow rates as they increase or decrease the pressure difference between inlets and outlets. The efficiency of external projections depends on their sizes and positions relative to the prevailing wind. External projections can act as vertical wind-catchers and enhance the internal ventilation rates in both cases of skewed and perpendicular winds, but when incorrectly used can have the opposite effect, acting as windbreaks. Fig. 18 b) and c) show the undesirable effects of external projections.
Figure 18 - Effects of wing-walls on cross ventilation
(After Fleury, 1990) In altering the pressure build-up around the inlet, vertical projections can be employed to modify the internal flow pattern and force the air stream into different directions, Fig. 19. Vertical projections are especially useful for single-sided ventilation in rooms
Figure 19 - Effects of vertical projections to the air-stream direction
(After Fleury, 1990)
Publishers Ltd, London.

30
with more than two openings, particularly if the wind is from a skewed angle.39 In hotel typologies, vertical projections can also be used to enhance privacy in the external areas between sequentially arranged bedrooms or apartments. In addition to their shading properties, horizontal projections such as overhangs, canopies and verandas can also be used to modify air patterns internally as they can deflect the wind streams that would flow above the building to the inside, Fig. 20.
Figure 20 - Horizontal projections and airflow patterns
(After Olgyay, 1963 and Bittencourt, 1993)
When placed immediately above the opening, the horizontal projection eliminates the downward element of the wind at the inlet and pushes the air stream towards the ceiling. Air circulation above head height is of little use for the purpose of physical cooling of the occupants in living spaces, but this may be a relevant condition in spaces such as kitchens where air-extraction at high level is desirable. The introduction of a gap between the projection and the wall will tend to reinstate the original course of flow, as it recovers the downward component of the pressure at the top of the inlet opening.
Figure 21- Internal partitions and airflow patterns
From Givoni, 1976)
39 Bittencourt, L.S., [1993] A.A. PhD thesis Ventilation as a Cooling Resource for Warm-humid Climates: An Investigation on Perforated Block Wall Geometry to Improve Ventilation Inside Low-rise Buildings, pp. 150.

31
Figure 22 - Pressure distribution comparison between low-set building and one over pilotis
for different building porosities and wind incidence perpendicular to the long wall, From Aynsley, et al, 1977)
Alterations to internal airflow patterns also occur by the introduction of internal partitions and this interference is dependent upon the location of the partition’s opening. Internal partitions also cause a drop in the air velocity and they can create zones of still air, Fig. 21. The downwind rooms of multi-zoned buildings usually have very low ventilation rates and a high degree of porosity in the partition can be used to minimize this effect, some authors have suggested a minimum porosity of 50% whenever possible.40 Fig 22 shows the difference in the pressure coefficients for different porosities for a low-set building as compared to one on pilotis. Bittencourt suggests the use of perforated blocks in situations where the issues of privacy and noise are not relevant, in his paper he considers four types of blocks with varying degrees of porosities of up to 54%.41
40 Gandemer, J. et al; [1992]. Guide sur la Climatisation Naturelle de l’Habitat en Climat Tropical Humide. Tome 1: Methodologie de Prise en Compte des Parametres Climatiques dans l’Habitat et Conseils Pratiques. CSTB, Nantes. 41 Bittencourt, L.S., [1993] A.A. PhD thesis Ventilation as a Cooling Resource for Warm-humid Climates: An Investigation on Perforated Block Wall Geometry to Improve Ventilation Inside Low-rise Buildings.

32
Calculation and prediction of airflow rates The prediction and calculation of airflow rates within buildings is a complex subject and the methods available depend on different degrees of simplifications and assumptions. The choice of the most adequate method for a given situation depends on the level of accuracy required, the availability of data and resources. As Bittencourt points out,42 a very important simplification in this field relates to the use of pressure coefficients (Cp) obtained from wind tunnels that employ solid models. It is normally accepted that pressure coefficients obtained in this way are only reliable for buildings with porosities of up to 25%. At higher porosities, the flow through the building modifies the external pressures and airflow rates obtained from pressure coefficients of solid models in wind tunnels tend to be overestimated. This is a particularly relevant point to buildings in warm and humid climates where, as we saw in the preceding pages, higher porosities are desirable for ventilation purposes (some authors recommend a minimum of 50% porosity for multi-zoned buildings). Additionally, the use of mean speeds for determining the pressures on buildings is also inaccurate because of the turbulent fluctuations of the wind that likewise affect airflow rates. Nonetheless, methods based on pressure coefficients are often used in the absence of more accurate techniques. The cooling effect of ventilation is a function of air temperature, airflow rate and heat capacity.43 Heat losses due to ventilation can be expressed as: Qv = 1300 V (ti – to), where; Qv : heat loss (or gain) rate (W) 1300 : volumetric specific heat of air (J/m3 °C) V : ventilation rate (m3/s) ti : indoor temperature (°C) to : outdoor temperature (°C) Therefore, the heat losses due to airflow can be calculated once the difference between indoor and outdoor temperatures are known or estimated. The techniques for estimating the ventilation contribution to heat losses or heat gains within buildings can be divided into two main types, the empirical and theoretical methods. The empirical methods are based on observations and the results of experiments, within this category are the ‘air-change’ methods, ‘reduction’ of pressurization test data and the regression methods. Whereas the theoretical methods rely on the physical principles of air-movement, they include ‘simplified’ theoretical techniques and flow-network methods.44 Currently, computational fluids dynamics, 42 Bittencourt, L.S., [1993] A.A. PhD thesis Ventilation as a Cooling Resource for Warm-humid Climates: An Investigation on Perforated Block Wall Geometry to Improve Ventilation Inside Low-rise Buildings. 43 Koenigsberger, O. et al, [1974] Manual of Tropical Housing and Building. Part 1: Climatic Design. Longman, London. 44 Tuomaala, P., [2002] The Implementation and evaluation of aaiflow and heat transfer routines for building simulation tools. VTT publication 471, PhD thesis, Helsinki University of Technology.

33
cfd computer programmes are the only theoretical tools capable of assessing and graphically representing airflow patterns in and around buildings. Empirical Methods The ACH, air change per hour, method was originally devised to appraise the heating and cooling ventilation loads for air-conditioning and mechanical systems but later also used for naturally ventilation. The ACH method is defined as the volume of air that enters (and leaves) the space divided by the volume of space, it is expressed as,45 ACH = 3600 Q / Vo where, ACH : number of air changes per hour Q : infiltration rate (m3/s) Vo : volume of room (m3) In this method, tables of expected infiltration rates for buildings of typical construction are often used and adjustments are made for building heights (and consequent wind speed) and opening types. It is worth noting that ‘this does not necessarily mean that the air is completely renewed (or contaminants completely removed) after one hour’.46 Other empirical techniques such as the pressurization method, is ‘mostly applied to cold and temperate climates where window fittings and background leakage may be responsible for appreciable heat losses’.47 Simplified Methods Also called discharge coefficient methods, the simplified techniques normally use algorithms that assume the internal airflow to be a function of the pressure difference on the envelope of a sealed building. In naturally ventilated buildings in warm and humid climates these methods may be even further simplified by the elimination of the stack effect, as there is often little variation between the internal and external temperatures. The method proposed by BRE, Building Research Establishment, assumes that ‘the discharge coefficient for openings with diameter larger than 10mm and with geometric characteristics different from crack will present similar values.’48 A concept of equivalent area is also used and for openings such as large windows, the area can be taken as the actual open area of the windows. The application of the
45 Bittencourt, L.S., [1993] A.A. PhD thesis Ventilation as a Cooling Resource for Warm-humid Climates: An Investigation on Perforated Block Wall Geometry to Improve Ventilation Inside Low-rise Buildings. 46 Liddament, M [1986] Air Infiltration Calculation Techniques: An Applications Guide. Document AIC-AG-1-86, Air Infiltration and Ventilation Centre, Bracknell. 47 Bittencourt, L.S., [1993] A.A. PhD thesis Ventilation as a Cooling Resource for Warm-humid Climates: An Investigation on Perforated Block Wall Geometry to Improve Ventilation Inside Low-rise Buildings. 48 Ibid.

34
method also presents problems for openings composed of porous materials such as air-bricks, the equivalent area would have to be determined empirically. In this method, the equivalent area is taken as the addition of the inverse of the squares of the actual open areas of the windows, Fig 23.
Figure 23 - BRE simplified method for cross-ventilaiton of single buildings
(from: BRE 1978).
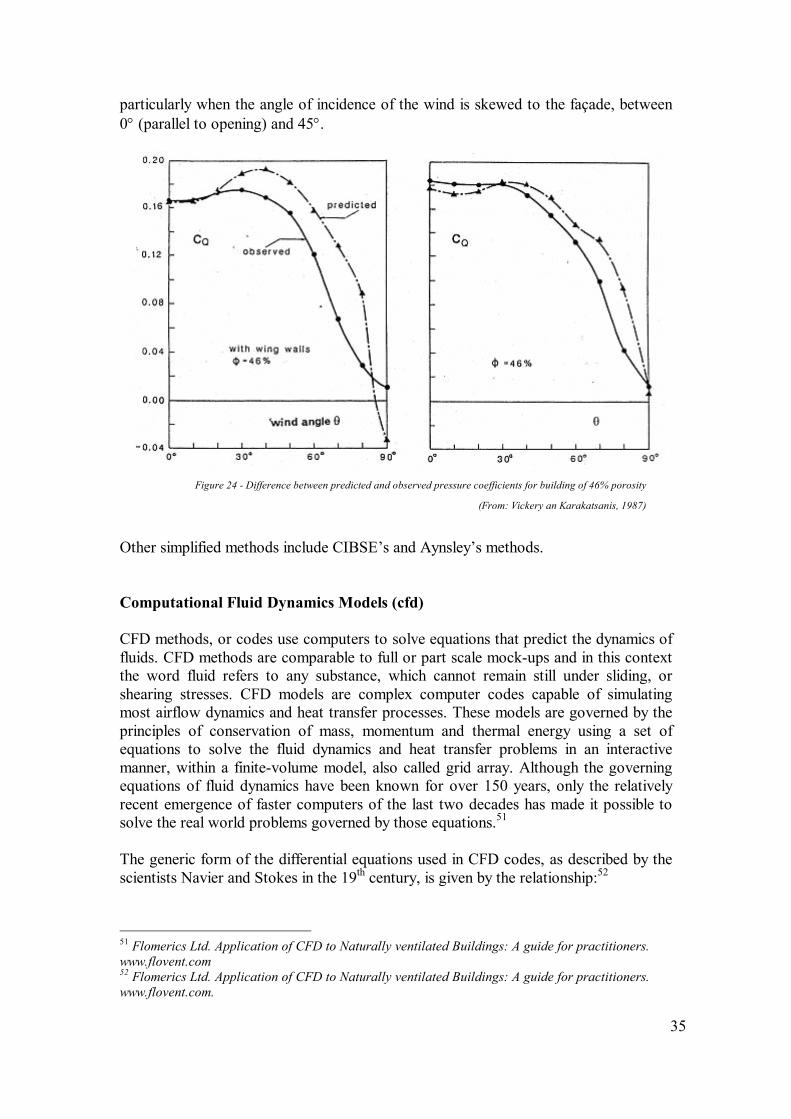
Qw : Airflow rate (m3/s) Cd: Discharge coefficient of openings (taken from tables, often assumed: 0.65) Aw: Area of equivalent openings, inlets and outlets (m2) Ur: Outdoor reference wind speed (m/s) ∆Cp: Wind pressure-drop coefficient as a function of the angle of incidence and distance from obstructions, typical values for building in open field: ∆Cp = 1,2 for 0°≤ θ ≤ 30°; 0° for angle of incidence perpendicular to opening ∆Cp = 0,1+0,0183.(90°- θ) for 30°≤ θ ≤ 90° For cases where there are intermediate doors between the inlet and the outlet a factor of 1/(∑ Adoor) 2 should be added to the equivalent openings equation. Adjustments can also be made for the reduction of airflow due to protective nets against mosquitoes:49 0,30.Qw for cotton nets 0.65.Qw for nylon nets BRE’s method is a useful tool as a rule of thumb for airflow rates within sealed buildings of porosities less than 20%. For buildings with higher porosities, further corrections are possible by an estimation of the error in the flow coefficients; Fig. 24 shows the difference between the predicted and observed flow coefficients for 46% porosity.50 As it can be noted, the predicted coefficients can lead to mistakes
49 Lamberts, R et al [2000], Desempenho térmico de edificações, Universidade Federal de Santa Catarina, Brasil. 50 Vickery, B J, Karakatsanis C, [1987]. External wind pressure distributions and induced internal ventilation flow in low-rise industrial and domestic structures, ASHRAE Transactions, vol. 93, part 2, pp. 2198-2213.
35
particularly when the angle of incidence of the wind is skewed to the façade, between 0° (parallel to opening) and 45°.
Figure 24 - Difference between predicted and observed pressure coefficients for building of 46% porosity
(From: Vickery an Karakatsanis, 1987)
Other simplified methods include CIBSE’s and Aynsley’s methods. Computational Fluid Dynamics Models (cfd) CFD methods, or codes use computers to solve equations that predict the dynamics of fluids. CFD methods are comparable to full or part scale mock-ups and in this context the word fluid refers to any substance, which cannot remain still under sliding, or shearing stresses. CFD models are complex computer codes capable of simulating most airflow dynamics and heat transfer processes. These models are governed by the principles of conservation of mass, momentum and thermal energy using a set of equations to solve the fluid dynamics and heat transfer problems in an interactive manner, within a finite-volume model, also called grid array. Although the governing equations of fluid dynamics have been known for over 150 years, only the relatively recent emergence of faster computers of the last two decades has made it possible to solve the real world problems governed by those equations.51 The generic form of the differential equations used in CFD codes, as described by the scientists Navier and Stokes in the 19th century, is given by the relationship:52
51 Flomerics Ltd. Application of CFD to Naturally ventilated Buildings: A guide for practitioners. www.flovent.com 52 Flomerics Ltd. Application of CFD to Naturally ventilated Buildings: A guide for practitioners. www.flovent.com.
36
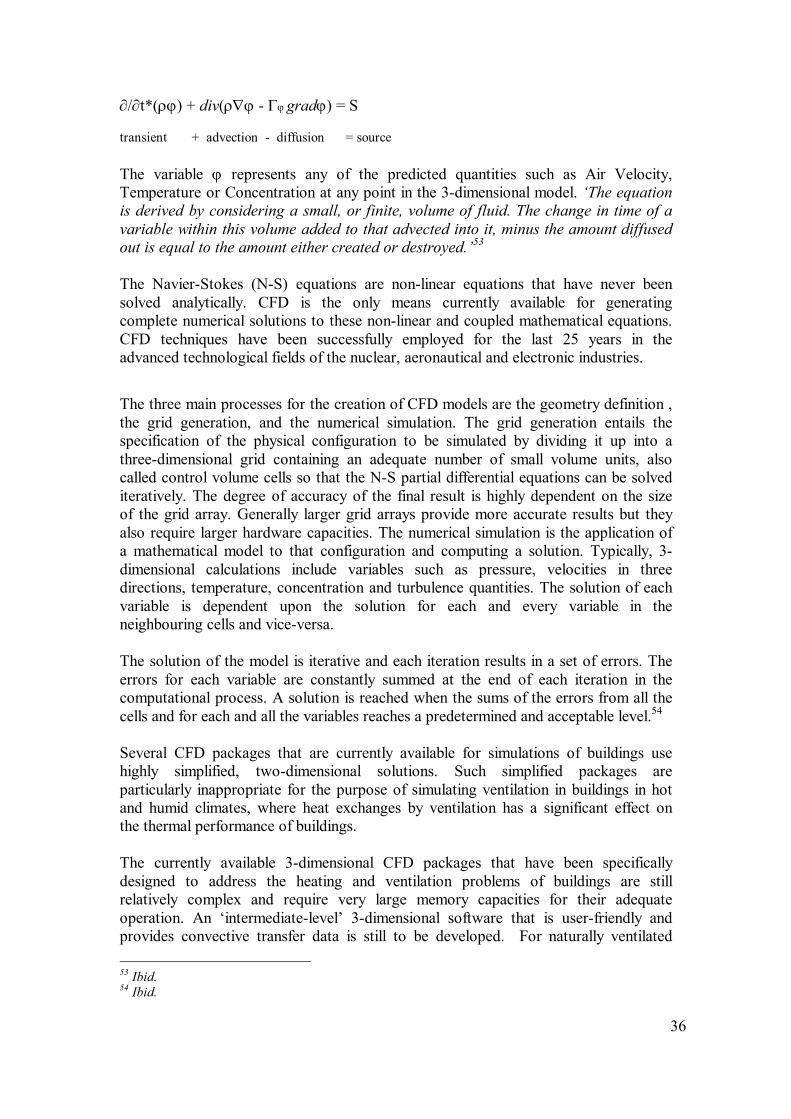
∂/∂t*(ρϕ) + div(ρ∇ϕ - Γϕ gradϕ) = S transient + advection - diffusion = source The variable ϕ represents any of the predicted quantities such as Air Velocity, Temperature or Concentration at any point in the 3-dimensional model. ‘The equation is derived by considering a small, or finite, volume of fluid. The change in time of a variable within this volume added to that advected into it, minus the amount diffused out is equal to the amount either created or destroyed.’53 The Navier-Stokes (N-S) equations are non-linear equations that have never been solved analytically. CFD is the only means currently available for generating complete numerical solutions to these non-linear and coupled mathematical equations. CFD techniques have been successfully employed for the last 25 years in the advanced technological fields of the nuclear, aeronautical and electronic industries.
The three main processes for the creation of CFD models are the geometry definition , the grid generation, and the numerical simulation. The grid generation entails the specification of the physical configuration to be simulated by dividing it up into a three-dimensional grid containing an adequate number of small volume units, also called control volume cells so that the N-S partial differential equations can be solved iteratively. The degree of accuracy of the final result is highly dependent on the size of the grid array. Generally larger grid arrays provide more accurate results but they also require larger hardware capacities. The numerical simulation is the application of a mathematical model to that configuration and computing a solution. Typically, 3-dimensional calculations include variables such as pressure, velocities in three directions, temperature, concentration and turbulence quantities. The solution of each variable is dependent upon the solution for each and every variable in the neighbouring cells and vice-versa. The solution of the model is iterative and each iteration results in a set of errors. The errors for each variable are constantly summed at the end of each iteration in the computational process. A solution is reached when the sums of the errors from all the cells and for each and all the variables reaches a predetermined and acceptable level.54 Several CFD packages that are currently available for simulations of buildings use highly simplified, two-dimensional solutions. Such simplified packages are particularly inappropriate for the purpose of simulating ventilation in buildings in hot and humid climates, where heat exchanges by ventilation has a significant effect on the thermal performance of buildings. The currently available 3-dimensional CFD packages that have been specifically designed to address the heating and ventilation problems of buildings are still relatively complex and require very large memory capacities for their adequate operation. An ‘intermediate-level’ 3-dimensional software that is user-friendly and provides convective transfer data is still to be developed. For naturally ventilated 53 Ibid. 54 Ibid.

37
buildings the process usually involves the modelling of the external conditions to determine the pressure on each side of the building. The pressure loading data is then applied to a separate internal model using the internal ambient conditions, Fig 25. We will be going through the process of CFD simulations in more detail in Part Three.
Figure 25 – 3-Dimensional CFD model of naturally ventilated bedroom
created using flovent software In the next section we look at some other environmental design strategies applicable to the hotel typology in warm and humid climates and examine some precedents of hotels in similar climatic conditions.

38
3. Design strategies and hotel precedents 3.1 Climate and design strategies From Recife’s climatic characteristics alone, table 1, some conclusions for possible design approaches for passive cooling can be drawn; the aim being to provide protection from the sun and rain, and to encourage ventilation to improve sweat evaporation and reduce the internal temperature and humidity. The natural provision of air being plentiful, with an average wind speed of 2.9m/s, mostly from the south-east of the Atlantic, as we will see in the following pages, there is more than sufficient air to be used for cooling the external fabric and internal environments. Strategies towards thin plans on raised floors with a NE-SW or east-west axial orientation with large aspect openings to either side and/or the introduction of breezeways are only some of the strategies that would maximise cross-ventilation. However, some kind of control of the air velocity internally has to be implemented to reduce the air speed. Particularly in the administrative areas of commercial buildings such as hotels, wind speeds higher than 1.5 m/s are impractical and could cause the inconvenience of flying papers.55 The three main possibilities for climate modification are passive, active and hybrid cooling. In the passive system there is no mechanical plant or equipment, it relies on natural energy and at best the internal temperatures match those of the external shaded areas. The known problem with this model is when there is incidence of high casual gains that increase the environmental loads.56 A totally passive system in a tropical hotel situation would therefore have to take into consideration the microclimate, building form and fabric as climate modifiers as well as guests’ expectancy of level of acceptable thermal comfort, which may have commercial implications. The active system on the other hand uses artificial energy. It provides an almost totally controlled internal environment and it requires the planning of service plants from the initial design stages, regular maintenance and often presents problems of localised heat gains from environmental loads. The third, hybrid system, as the name suggests, uses a combination of both passive and active systems. It requires equipment and/or plants to cool the heat from the environment and casual gains and it uses the natural microclimate and the building fabric as climate modifiers. Facilities management and/or a computerised system need to be employed to control diurnal and seasonal climatic variations to make this system energy efficient. When using this system the LT method is a useful tool during the initial planning stages to maximise the passive zones of the perimeter and minimise the deeper active zones of the plan, particularly in large buildings. As we have seen through Givoni’s chart for Recife, the indications are that ventilation alone may provide sufficient cooling during most of the year. The microclimate of the site will also play an important role in the implementation of a passive cooling system.
55 Hyde R; [2000] Climate Responsive Design, pp. 25 56 Ibid, pp. 56

39
Next, we look at some of the known passive strategies for hot and humid climates as suggested by Richard Hyde57 and Armando de Holanda58 followed by comments on their applicability to the hotel typology in Recife. Although much of the following is suggested for use in domestic buildings, most of these principles would seem to apply also to non-domestic schemes.
Climate: - Minimise heat gain, maximise ventilation and shading. Plan: - Thin and unobstructed plan for cross ventilation and avoidance of dark areas
internally (it may not be possible due to site constraints for a hotel building). - Large windows and doors facing the direction of the wind (mostly SE in the
case of Recife with some kind of control for the reason mentioned above). As a general rule, the sizes of the exhaust windows should be at least equal to those of the inlet windows.
- Screens to openings to protect against insects if applicable. - Smaller east-west aspect with no/or smaller windows to the east and west to
reduce direct solar gain due to proximity to the equator. - Courtyards for deep plan buildings with diffuse lighting to reduce glare.
Raised floors to encourage airflow below the building. Under-floor ventilation has been a common practice in vernacular buildings in Brazil for a long time now. In humid climates, this strategy is also used for guarding against decay of floor structures and it is particularly useful for maintaining a dry interior in coastal areas subject to floods.
Figure 26 - Weekend retreat on the margins of Rio Negro, Amazonas.
57 Hyde R; [2000] Climate Responsive Design, pp 29, 30, 33 58 de Holanda, A; [1976] Roteiro para Construir no Nordeste,Universidade Federal de Pernambuco. De Holanda’s guide on how to build in the northeast of Brazil was written as recognition of the inadequacy of the French and European constructional methods to the region.

40
- Breezeways to provide open circulation between spaces. Section: - Open section with high ceilings to maximise stack ventilation. - Large overhangs to protect walls against solar radiation (this has to be
carefully balanced against the amount of natural light required internally). Landscape: - Trees for shading in the summer and planting, creepers, etc on verandas and
balconies to disperse heat and glare. (The range of local species of planting available is plentiful and the scheme should involve the careful selection of appropriate trees and planting. Landscaping should be seen as an integral part of the project, vegetation used strategically as much as possible to provide shade and reduce the temperature of the ground and external fabric. The use of tree leaves as low emissivity shields to absorb short-wave solar radiation and reduce the temperature of the microclimate.)
Materials: - Lightweight materials for quick response and cooling at night. (the
employment of thermal mass for cooling is not applicable as it is only effective in climates of a high diurnal range)59.
- parasol type of roof to increase ventilation with light colour externally and on ceiling, with reflective foil laminate within the roof construction to reflect solar radiation, minimising the area on ceiling for artificial lighting. (Other types of roof construction such as double roof with a ventilated gap or attic are also applicable),
- insulated ceiling, - reflecting foil laminate within walls to reduce the infiltration of radiation, - lightweight elevated floors with light colour.
59 web page, http://www.squ1.com/site.html , Square One, University of Cardiff.

41
Precedents 3.2 Batu Jimbar Resort Pavilions, Bali Location: Bali, 8° south of equator Architect: Geoffrey Bawa Completed: 1973 Climate: tropical, hot and humid with temperatures between 23°C and 33°C, average humidity: 70%. Distinct rainy season between December to March. Cooling system: hybrid, with all internal living spaces being air-conditioned.60
Figure 27 - Batu Jimbar pavilions site plan, G. Bawa
(copy from original presentation catalogue, courtesy of Amila de Mel)
Figure 28 - Batu Jimbar partial site plan and elevation, G. Bawa
(copy from original presentation catalogue, courtesy of Amila de Mel)
60 Taylor B, Geoffrey Bawa. Thames & Huddson, London 1995.

42
Located near the village of Sanur on the east coast of Bali, the Batu Jimbar complex is formed by a series of pavilions set on plots of land that face a coral sand beach of the lagoon. The scheme comprises 12 houses/pavilions, an open-air theatre and a private museum. The main living accommodation is set back from the beach by about 200 metres and landscaping forms an integral part of the project.
Figure 29 - Batu Jimbar, House no. 2 plan, G. Bawa
(copy from original presentation catalogue, courtesy of Amila de Mel)
Figure 30 - Batu Jimbar, Living and dining pavilion, G. Bawa
(copy from original presentation catalogue, courtesy of Amila de Mel)

43
The living accommodation is split into three pavilions arranged around a reflecting pool and it consists of two single-storey units for the bedrooms and a third double-storey unit with enclosed kitchens and air-conditioned living spaces on the ground floor and an unwalled living area above.
Figure 31 - Batu Jimbar, Pavilion with reflecting pool
G. Bawa, (B. Taylor, 1995)
The pavilions are constructed in the vernacular Balinese style and Bawa’s design strategy included a thorough research into the local building traditions and constructional methods prior to the planning of the complex. The pavilions are built using the local materials, brick, coral, timber and thatch detailed using traditional craftsmanship. The strategies that could also be employed in the project in Pernambuco are:
- the division of functions into separate volumes, - setting back of the built volumes from the sea (should the site also be on the
coast), - unwalled raised living accommodation for ventilation, - use of local materials and craftsmanship, - landscaping

44
3.3 Teluk Datai Resort, Malaysia Location: Pulau Langkawi, Malaysia, 7° north of equator. Architect: Kerry Hill Architects Completed: 1993 Climate: tropical, hot and humid. Temperatures between 20°C and 30°C, the average humidity is 90%. Distinct monsoon rainy season from September to November Cooling system: hybrid, main public spaces rely on passive cooling but rooms are air-conditioned.61
Figure 34 - Teluk Datai,, site plan, Kerry Hill
(From G. London, 1994)
61 London, G; [1994] Jungle Rhythms, Architecture Australia, Sept/Oct 94.
Figure 32 - Teluk Datai, external view, Kerry Hill (From Aga Khan web page)
Figure 33- Teluk Datai, restaurant area, Kerry Hill (From Aga Khan web page)

45
Teluk Datai is a large five-star resort complex in the North-west of the Langkawi Island, West Coast of Peninsular Malaysia. Set within the coastal rainforest, it contains 84 rooms and 40 villas. The hotel is located 300 meters from the beach, an intentional architectural decision to minimise the visual impact “… a commercial risk but one which the architects believed provided maximum protection to the forest environment and minimal visual disturbance to the cove.” 62 Stone and timber are the main materials used in the pavilions. All the main public functions, lobbies, restaurants, bars, etc are within unwalled spaces with high ceilings while hotel rooms are cellular and more contained. The architect’s strategy to minimise the impact to the local environment included the strategic positioning of pavilions as to reduce tree felling, the planting of fast-growing trees in the clearings to reduce exposure of vulnerable species to ultraviolet rays and the employment of trained elephants as opposed to bulldozers to fell the trees, also to cause less damage to the forest. 63
Figure 35 - Teluk Datai, plan of typical villa, Kerry Hill
(From G. London, 1994)
Figure 36 - Teluk Datai, interior view of typical villa, Kerry Hill
(From G. London, 1994)
62 Ibid. 63 web page http://www.akdn.org/agency/akaa/eighthcycle/page_09txt.htm, The Aga Khan Award for Architecture web page

46
The individual villas are approached by irregular open bridges, a move by the architects to avoid long monotonous circulation spaces. The villas have generous floor area and headroom and airflow is also encouraged by means of simple ceiling fans but rooms are also provided with mechanical air-conditioning. Folding glass doors open completely to shaded verandas. The strategies that could also be employed in the project in Pernambuco are:
- set back from beach to minimise visual impact, - positioning of buildings so as to minimise impact to the local environment - public functions within unwalled spaces with high ceilings for maximum
airflow and to prevent casual gains to enclosed spaces, - planting of fast-growing trees in clearings to reduce exposure of vulnerable
species to ultraviolet rays - ceiling fans to encourage internal airflow.

47
3.4 Kingfisher Bay Resort and Village, Australia Location: Fraser Island, Queensland, Australia, 25° south of equator. Architect: Guymer Bailey Architects Completed: 1991 Climate: tropical, hot and humid with temperatures varying from 11°C and 29°C, average humidity: 70%. Most rainfall during summer between December and March when cyclones are prevalent. Cooling system: passive, no plants or mechanical air-conditioning, ceiling fans used to improve airflow.64
Kingfisher Bay is a large 4-star resort development in Fraser Island, a World Heritage nature reserve site. The resort comprises 152 hotel rooms within one main volume and 110 two and three bedroom self-contained villas, a day-visitor pavilion, the staff village, 3 restaurants and conference rooms for up to 300 people and 114 bed wilderness lodge accommodation. It is set within a swamp type of terrain.
The architects wanted visitors to Fraser Island to experience the location for what it is. The Centre Complex building was designed to aid the discovery of
64 [1994] Article in Architecture Australia, Awards. Nov/Dec 94.
Figure 37 - Kingfisher resort,external view, Guymer Bailey (From web page Timber building in Australia)
Figure 38 - Kingfisher resort, view of roof, Guymer Bailey (From web page Timber building in Australia)
Figure 39 - Kingfisher resor, cross section, Guymer Bailey (From web page Timber building in Australia)
Figure 40 - Kingfisher resort, partial long section, Guymer Bailey (From web page Timber building in Australia)

48
the beauty and fragility of this unique place. The building needed to connect with the spirit of the island. It needed to touch the site gently and have minimal impact on the surroundings. Rather than creating an internalised heavy built form the building was to be light and punctured, not unlike a rainforest canopy.65
Given the sheer scale and complexity of the scheme, the idea of touching the site gently or no air-conditioning in a tropical humid climate does, at first sight, appear almost anecdotal. The requirements of such a brief for a four-star resort could easily be seen as unfeasible, particularly in relation to the commercial expectations of developers and stakeholders as to likely occupancy levels. Although unusual, the scheme has been successful and “well received by the public and was in full occupancy during our visit”.66 This point reiterates our earlier suggestion that thermal comfort in tropical hotels may be achieved without necessarily having to make use of active cooling systems and still be commercially viable. So what are the strategies that make the scheme so successful? The quality and interest of the landscape itself is probably one of the main factors here but the architecture has also been responsible for adding value and attraction to the poetic settings of the place. The organic vocabulary is used throughout the scheme and is noted in the undulated roof of the central building that mimics the contours of the gently curved sand hills behind, in the layout of the individual units and in the connecting decks. Reference to marine architecture is also made through the detailing of the roof of the main building, which is composed of a series of shaded clerestory windows that serve to filter the natural light to the interior and maximises the internal passive zones. The sense that the architecture compliments its surrounding environment is further emphasised by the choice of timber as the main structural element and in the detailing - the edges of the buildings are softened by means of flowing decks, cantilevers and exposed structures. Cyclones being a regular local phenomenon, the lightweight structures are secured back to the foundations by means of tensile steel rods. The resort was built to strict environmental guidelines and the materials are from local renewable resources. So, there are clearly several exemplary and tangible strategies that make Kingfisher an energy efficient intervention well worth looking at during the design of our project in Pernambuco. The division of the functions into separate volumes to minimise the visual impact and facilitate airflow through the fabric, the choice of materials and constructional methods, articulation of openings in the roof of the largest volume and the external shaded timber decks.
65 web page http://www.architecture.com.au/ The Royal Australian Institute of Architects 66 Taylor J, [1994] Architecture Australia, Commercial Award. Nov/Dec 1994

49
3.5 Samaúma Park Hotel, Brazil Location: Praia do Caripy, Barcarena Pará, Brazil, 1° 3’ south of equator. Architect: João Castro Filho Completed: 1995 Climate: equatorial, hot and humid with the annual temperature varying from 18°C to 34°C. The average humidity is 85%. Average wind speed: 5m/s, from the west in the morning and north in the evening. Characteristically of the Amazon region, heavy rains occur throughout the year. Cooling system: passive in the four suites at the tree-house, active in the other accommodation at ground floor level.67
Samaúma Park Hotel comprises 24 chalets, 36 suites at ground level, a conference centre a bar/restaurant and four self-contained apartments at the tree-house. It is located in one the Amazon forest reserves across from the Marajó Bay at the Caripy river-beach on Amazon delta.68
67 [1996]. Uma casa nas árvores: ninho arquitetônico em madeiras amazônicas para o sonho humano de viver em pleno ar. Article in Projeto Design, vol. 203, Dec. 1996. São Paulo. 68 Ibid.
Figure 41 - Samaúma Park, exterior view, Castro Filho (From Projeto Design, 1996)
Figure 42 - Samaúma Park, views of balcony and bedroom, Castro Filho
(From Projeto Design, 1996)

50
The tree-house was built as an addition to 24 existing chalets on a portion of the site facing the river-beach and containing two large specimens of indigenous tress, a quaruba (Vochysia maxima, 35m high, 1m diameter) and a matamatá (Eschweilera odorata, 28m high, 1.7m diameter). Castro Filho’s original idea was to use the trees as structural support for the building, but this proved to be a difficult solution as one of the trees had not yet reached its maturity and also because of the deflection in the trunks caused by the wind. The tree-house is suspended nine meters above the ground level and has its own ‘tree-like’ independent structure arranged around two voids of 3m by 3m at the base of the trees. The building weighs about 180 tons and its foundations are composed of 80 cylindrical concrete piles irregularly distributed amidst the trees roots. Forest engineers and agronomists were not only initially involved in the feasibility studies, but also during the period of the structural calculations; they had to be adjusted as the excavations determined the exact positions of the roots, in a method akin to those used in archeological excavations. Two groups of four concrete cylinders form the base of the timber pods that branch out bellow the floor structures supporting the house above. The arboreal dialectic is taken throughout the scheme in the form of the structures, the detailing and in the choice of finishes. A variety of local timbers, twenty different species, were employed not only in the structural elements but also in the internal finishes. Floors and walls are clad in timber intercalating very dark and lighter shades creating an appealing chiaroscuro effect reminiscent of stately Amazon residences of a bygone era during the rubber extraction period. One specimen of each of the trees used was planted adjacent to the building in a symbolic gesture to the renewable aspect of the material. Due to the proximity to the equator, the solar inclination is to the north from April to September and to the south from October to March. The eaves project 2m around all four elevations protecting the walls against solar radiation and rain. The external walls
Figure 43 - Samaúma Park, cross section, Castro Filho (From Projeto Design, 1996)
Figure 44 - Samaúma Park, plan, Castro Filho (From Projeto Design, 1996)

51
to the balconies are set back from the perimeter at 45° to main volume providing external shaded areas for the different solar positions. The wind blowing below the building is encouraged through the central voids around the tree trunks to the double roofs above. Internally, the light-fittings were designed in the indigenous motifs of the Aruã tribe that populated the region from over two thousand years ago until the Portuguese invasion in the sixteenth century. In the bedrooms, these conceal a down-light fluorescent fitting in the centre of the room. Artificial lighting around the walls is also by means of fluorescent fittings concealed around the perimeter of the ceiling reflecting the soft natural yellow hue of the pau-amarelo, timber ceiling. The strategies that could also be applicable for a hotel in Pernambuco are:
- raising of the floor to encourage ventilation, - double ventilated roof, - wide over-hangs for shading, - the use of local timbers as climate responsive materials, - energy efficient artificial light-fittings.

52
Part Two: Location
1. Historic background The state of Pernambuco is in one of the first regions of the northeast of the country to be occupied by the Portuguese in 1535 who named the area the Captainship of Nova Lusitânia. Several indigenous groups lived in the region at the time of the occupation, the Caetés, Tabajaras, Xucurus, Garanhuns, Vouvês, Xocós, Fulniôs and the Pimenteiras. The name Pernambuco means entrance, mouth to the sea in the indigenous Tupi language and it alludes to the tropical-Atlantic reef formations found on the coast, collections of islands, river deltas, lakes and the combination of reef and sand ridge formations along the sea front. The name Recife originates from the European ‘arrecifes’, reefs. The type of soil in some areas of the interior of the state suited the cultivation of sugarcane and the high demand for sugar of the early colonial days. At one point Pernambuco was responsible for more than 50% of the total Brazilian exports. The news of the prospective profits and opportunities of the region eventually reached the ears of other European conquistadors and in 1630 the Dutch West India Company, composed of 70 ships, 7000 men and many cannons, disembarked in its shores. Faced with the might of the Dutch invaders, who were dedicated to various practices in the XVI and XVII centuries, such as commerce, piracy and invasions in general, the Portuguese were forced back into the countryside. The Portuguese resistance to the Dutch invasion was tenuous and in Pernambuco they held only one fortress in the interior for 5 years. Pernambuco was a Dutch colony from 1635 to 1654 when the Portuguese re-conquered Recife. In 1661, ‘in exchange for an indemnity of eight million guilders, the Dutch signed an agreement with Portugal, resigning to any further pretension on Brazilian lands.’69 The Dutchman Johann Mauritius van Nassau-Siegen, known in Brazil as Maurício de Nassau, was a Dutch general and politician responsible for the administration of Pernambuco from 1637 to 1644. During that period, the Dutch dominance in the northeast region of Brazil extended far beyond the state of Pernambuco. Much of the initial interest in the region was purely extractive and material, but legend says that ‘the Dutch were soon conquered by the landscape, the exuberance of its colors and by the richness of its fauna and flora’.70 Although relatively short lived, Nassau’s administration was marked by several relevant economic and infra-structural changes, the introduction of new techniques for the sugar mills, the reduction of taxes and freedom of religion; the first synagogue of the Americas was built here, Kahal Zur Israel.71 In that time the city of Recife was reorganized and it saw the construction of 69 The New Travel Age webpage, http://www.newtravelage.com/info/america/brazil/history/recife.htm 70 Mota Menezes, J L, [2002]. Interview for the Newspaper Diario de Pernambuco, 30 June 2002. Mota Menezes is an architect president of the ONG Maurício de Nassau. 71 BIT, Brazilian Incentive and Tourism web page http://www.bitourism.com/city.asp?city_id=5. The arrival of the Jews, the ‘new Christians’ as the Portuguese called them, in Brazil dates back to the mid-16th century when Cabral first landed in the Brazilian soil. The removal of the Dutch from the northeast also marks ‘the beginning of saga of the Jews of the new world’. Some 150 Jewish families of Sefardim and Ashknazim Jews of Polish and German origin lived and practiced Judaism in Recife.

53
palaces, several bridges and an astronomic observatory.72 During this occupation, Recife became the capital of the Dutch domination in the northeast. Previously, the city functioned mostly as a port to the main neighbouring city, Olinda, once the capital of Brazil. By the 17th century, the cities Recife, Olinda and Salvador in the state of Bahia, were the most prosperous cities in Brazil.73 Pernambuco continued to stage several important historic events in the eras that followed the expulsion of the Dutch from the region. The ‘Guerra dos Mascates’, Mascates war, was a long and bloody regional feud in 1710 between the ‘filhos da terra’, the sugar planters of Olinda and the ‘mascates’, the merchants of Recife, the natives and the more recent Portuguese immigrants. The war ended with the eventual intervention of the Portuguese crown in 1711; the mascates of Recife gaining substantial political power at the expense of Olinda, which began its long, slow economic decline.74 In 1817, the Revolução Pernambucana, was one of the first attempts towards an independent Brazilian government. Its main objective was to take control over the commerce of Brazilian products from the English and Portuguese. The customs-added taxes imposed in Brazil by the Portuguese favoured the imports of English and Portuguese goods, at 15% and 16% respectively, and restricted the imports from any other country, at 24%.75 The revolutionary movement was strongly repressed by the Portuguese king, Don João VI, who was then living in the capital, Rio de Janeiro. Don João’s troops were quickly sent from Rio to suppress the movement, for at the time, the enslaved regions of the northeast were the source of much of the wealth generated by the Portuguese crown. The revolutionary events of Europe had a profound impact on Brazilian history. Portugal’s refusal to follow his ‘Continental Blockage of 1806’ that stipulated that the Iberian countries should not trade with England, prompted Napoleon’s invasion of Portugal. The Portuguese court was forced to quickly flee to Brazil in 1808 under the protection of the English forces.76 Ironically, the arrival of Portuguese crown in Brazil marked the beginning of the decline of its Imperial dominance over the country. In Europe, Napoleon repeatedly invaded Portugal. His army was finally defeated by the English forces in 1810 after its third invasion of Portugal. For a long period, the English general William Karr Beresford administered Portugal until 1820 when he travelled to Brazil to try and convince the king to return to Portugal. The country was in serious financial crisis and the prolonged absence of the court facilitated the rise of liberal movements in the country particularly in the liberal centre of Porto. This situation in Portugal eventually forced the return of D. João on September 1821 after he had approved the constitution
Following the exit of the Dutch, they were dispersed first back to the Netherlands and then many made their way to New York. 72 Enciclopédia Digital [2003]. http://www.enciclopedia.com.br/MED2000/pedia98a/bioh8hdl.htm 73 Draffen, A et al. [1996]. Brazil – A Travel Survival Kit, Lonely Planet Publications. 74 Ibid. 75 Fichário histórico. http://www.ficharionline.com/historia/periodo-joanino.php 76 Fichário histórico. http://www.ficharionline.com/historia/revolucao-pernambucana.php

54
of imperial Brazil. He left his son, Don Pedro I in Brazil as prince regent.77 Despite his father’s insistence for his return to Portugal, D. Pedro, who had the support of the Portuguese/Brazilian nobility and of the Freemasons, decided to stay. In an act of defiance to his father’s orders, on 7th September 1822 on the margins of the Ipiranga river in São Paulo he declared independence from Portugal. D. Pedro’s first reign in Brazil was characterized by a long and arduous transitional period. Many regional conflicts ensued following his declaration of independence. The war of independence of Cispaltina (now Uruguay) resulted in the independence of that country from Brazil in 1828 with England’s support. That war had serious effects on the national economy and generally, the period was marked by severe economic, social and political upheavals. The effective consolidation of independence would only occur once D. Pedro left the throne in 1831. The recognition of the Brazilian state by Portugal only took place once Portugal had been financially compensated for its loss and once Brazil assumed Portugal’s foreign debts. Unexceptionally, the main immediate beneficiaries of the declaration of independence were the holders of large rural areas of Brazil. The Brazilian elite that supported independence also wanted an independent state, but one with only a few democratic features. The new system was to maintain the ‘status quo' of the colonial days, the slave labour, the latifundium, the monoculture and production for exports.78 From his throne in Rio, in 1824 D. Pedro passed a new constitution giving himself total and absolute authority over all the newly established powers, the executive, judicial, legislative and the moderator. The latter was above the others and was created to legitimate the actions of the emperor, D. Pedro, who reigned, governed and administered the country. This state of affairs was not exactly welcomed in the northeast regions that were particularly hit by the latest economic blight that loomed over the country following the independence. In Pernambuco, where the revolutionary climate still remained from the revolt of 1817, the new constitution would trigger yet again another violent rebellion, this time in the form of a new separatist republican movement, ‘A Confederação do Equador’. It adopted the constitution of Bolivia and it included six states of the northeast. The movement was short-lived and D. Pedro acted quickly to suppress the Northeastern rebels by contracting and sending mercenaries to the region. For this deed he borrowed one million pounds from England and one of the main instigators of the movement, the liberal leader Frei Caneca, was imprisoned and later sentenced to death.79 The consequences of this battle were again financially devastating to the country, it brought about the bankruptcy of the national bank, Banco do Brasil; it initiated the accumulation of the Brazilian foreign debts and it forced the renewal of the preferential custom taxes for English imports.80 By 1831 D. Pedro was clearly seen as an inept ruler. His personal conduct was also seen as unworthy, the string of illegitimate children he left behind was scandalous even by Brazilian standards. The ‘Partido Português’ was the only political party in Brazil that still supported him.
77 Portugal History. http://w3.tyenet.com/kozlich/portughist.htm 78 Brasil Imperial. http://members.tripod.com/~netopedia/historia/IReinado.htm 79 Ibid. 80 Fichario histórico. http://www.ficharionline.com/historia/primeiro-reinado.php

55
Following his father’s death, he abdicated to his son and returned to the Iberian Peninsula where he became D. Pedro IV, king of Portugal. D. Pedro’s son, D. Pedro II became the new emperor of Brazil at the age of 5. The absolutism of the imperial government only ended in 1840 and the Portuguese royal family was finally banned from the country by the end of the 19th century. In Brazil, the “Portuguese ways” of the imperial period proved very hard to die. The country’s colonial status stretched for 340 years, a far longer period when compared to the British colonies of North America for example, that lasted some 150 years from the beginning of the seventeenth century to the end of the eighteenth century.81 Brazil was also one of the last countries to abolish slavery towards the end of the 19th century.82 The last major conflict in the history of Pernambuco took place between 1848 and 1850. The ‘Revolta Praieira’, beach revolt as it became known, was a liberal and federalist movement connected to fights between political parties reminiscent of the first regency. It was a rebellion initiated by Pernambuco’s liberal party of Olinda against the newly imposed conservative government that still favored the landed aristocracy that continued to hold vast expanses of land and favor unfair trading. Its manifesto was forward-looking and defended democratic representation, freedom of the media, the end of the moderator power, federalism and the nationalization of commerce. The rebellion gained the support of the impoverished urban population but was repressed once it took to the streets of Recife in the beginning of 1850.83 The disparities in the distribution of wealth and land reminiscent of the colonial period, is unfortunately, still an enduring feature in some parts of the country. It particularly affects the poorest areas of the northeast where, as we will see in the following pages, much is required in terms of socio-economic and infra-structural improvements in the living conditions of the local people.
81 Crystal, D. [1993]. The Cambridge Fact Finder. Cambridge University Press UK. 82 Fichario histórico. http://www.ficharionline.com/historia/crises-imperiais.php 83 Enciclopédia Brasileira, História do Brasil. http://geocities.yahoo.com.br/vinicrashbr/historia/brasil/revoltapraieira.htm

56
2. Pernambuco today The state of Pernambuco is located in the centre of the northeast region of Brazil. It has an area of 98.525 km2 and a population of nearly 8 million people. The three main cities are Recife, Olinda to its north and Joboatão dos Guararapes to its south.84 Its terrain is characterized by the flat plains along the coast with valleys and lakes, plateaus in the centre and depressions to the east and west. There are several rivers along the state. The vegetation is composed of fens, marshes, coconut palm trees, tropical forest and a large area of drought-stricken wasteland, ‘caatinga’ in the interior where the climate, as opposed to the warm-humid one of the coast, is semi-arid and precipitation is scarce. Humidity levels in the interior are also very low. With the main exception of the river São Francisco, most rivers of the north-eastern hinterlands dry up during the regular and prolonged periods of droughts that often last up to eight months, rendering conditions of utter misery to the lives of some 20 million Brazilian peasants that live in the regions of the Northeast.85
Figure 45 - Map of Pernambuco
The northeast of Brazil is the second poorest area of the country with over half of the population living below the poverty level. Despite some slight recent improvements, the most current social indicators for Pernambuco are no exception to this dismal
84 IBGE, Instituto Brasileiro de Geografia e Estatística. http://www.ibge.gov.br/ 85 de Moraes, R. Lecture notes. Geografia, tema4-aula 8-S2- Mata costeira e Caatinga. http://geocities.yahoo.com.br/sousaraujo/paisagens_bras_s2_a10.html
57
scenario. In Pernambuco, 34% of the active population earns less than £25 a month. The medium life expectancy is 64 compared to 68 in the rest of the country. 25% of the population is illiterate, twice the national level. 75 infants die at birth for each 1000 born, twice that of the rest of the country.86 Such a squalid state of social affairs, a sordid sequel to a complex chain of historic, economic and political events is still prevalent in both the urban centres and the more remote rural areas. Paradoxically, these socioeconomic evils have been allowed to linger on until the present day in this unique place of astonishing natural sensitivities and outstanding beauty. Pernambuco is without doubt a place of an immeasurable cultural wealth and a huge economic potential that is still awaiting to be fully revealed. Furthermore, Pernambuco’s geographical location in the northeast of the country, its relatively short distances to the more developed centres of Europe and North America, could potentially mark its advantageous strategic position within the South American continent. The three main sources of the state’s economy are farming, 8%, industry, 25% and services, 67%. The services sector is basically composed of medicine, computing and tourism. The tourism industry is seeing a relatively rapid growth in the region as the area is seen as ‘an emergent tourist destination’.87 PRODETUR is a governmental program of investment in the infrastructure of public services to encourage national and international tourism in the northeast. This program has been instrumental in the late improvements in the area and for its second phase, PRODETUR II, it has committed itself to invest some £70 million in Pernambuco as from the beginning of 2004.88 ‘It aims at advancing the quality of life of 2,7 million inhabitants through infra-structural improvements that will generate income from tourism.’89 The global flux of tourists in the state has increased in the period 2001/2 at an annual rate of 12% as compared to 9.1% in the period from 1990 to 1997. The number of formal jobs related to the tourism industry has also increased in recent years. From 1994 to 2000 the annual rate of job creation in the food industry, restaurants, eateries, bars, etc has reached 12.2%, and 6.7% of new jobs at hotels and other types of accommodation.90 Pernambuco is currently seen as an attractive place for these type of investments because of the low cost of local labor and because it is a much safer place than the mainstream tourist centres of Rio and Bahia. The present situation of Pernambuco clearly calls for the development of sustainable strategies that will be both environmentally viable and socially inclusive. The opportunity exists for tourism schemes that are architecturally sensitive to the environment, the local resources, as well as for its potential in the creation of new jobs. 86 Ibid, Sensus 2000. 87 [2002].Documento del Banco Interamericano de Desarrollo, Programa de Desarrollo Turístico en La Región Nordeste del Brasil – Segunda Etapa, Podetur/NE-II. http://www.iadb.org/exr/doc98/apr/br1392s.pdf 88 [2003]. JC Economia. News article. Contrato do Prodetur sai em Junho, 21 June 2003. 89 [2002]. Diário de Pernambuco, newspaper. Arrecifes: uma grife do turismo. Economia, 29 November2002. 90 [2002]. Ministério do Trabalho e Emprego PE in Estratégia de Desenvolvimento da Região Metropolitana do Recife – 2003/15. http://www.citiesalliance.org/cdsdb.nsf/Attachments/Brazil+recife+1/$File/VERSAOFINALESTRATEGIAPARTE1929+.pdf

58

59
The Atalantic coast Many forms of occupation can be found amidst several areas of outstanding natural beauty of Pernambuco’s coast that extends over 187Km along the Atlantic Ocean. There are the metropolitan city of Recife, the Portuguese colonial settlements, the tourist resorts and beaches, the nature reserves and conservation areas and the extensive areas of sugar-cane plantations. There are fifteen rivers discharging their waters into the ocean. The population is composed mainly of a mix of the native Indians, Europeans and Africans.91 In recognition of the possibilities of the coast of Pernambuco, the planning department of the state has recently produced an extensive study of the area with the objective of promoting future interventions that will preserve and compliment the environmental and social resources of the littoral region.92 Much of the following is based on that study.
Figure 46 - Map of Littoral zones
1: North, 2:Centre, 3 South
91 [2000] Cavalcanti, et al. Litoral de Pernambuco, Um estudo propositivo. Secretaria de Planejamento e Desenvolvimento Social, FIDEM, Fundação de Desenvolvilmento Municipal. 92 Ibid.

60
The coast of Pernambuco is divided into three main areas, Littoral Centre around Recife, Littoral North that extends over some 60Km from Recife to the boundary of the state of Paraíba, and Littoral South of approximately 90Km, to the boundary with the state of Alagoas, Fig 45. There are seven municipalities to the north in Zone 1, two in Zone 2, and eight to the south in Zone 3. Generally, the socio-economic conditions found in most of the coastal communities to the north and south are no exception to the dismal situation of social exclusion described above. In 1999 around 62% of the population of Littoral North lived below poverty level, as compared to 82% of the population of Littoral South. The recent indicators regarding education and health are equally alarming. It particularly affects the southern coastal regions where illiteracy levels in some municipalities can be as high as 50%, and infant mortality can reach up to 114 of each 1000 newborn.93 With the exception of a couple of settlements, the administration of the local municipalities of these two zones are highly dependent on the transfer of reserves from the central government, the northern municipalities being 79% dependent and the southern 75%.94 The potentiality of Pernambuco’s littoral regions is marked by the quantity and diversity of its natural environment and by its historic-cultural attractions. Several ecosystems can be found in the area, the plains covered with coconut trees, the remnants of the Atlantic forest, the estuaries with large areas of marshes, sandstone and coral reefs, and the islands and shallow sandbanks. Littoral Centre is represented by the municipalities of Recife and Joboatão dos Guararapes. Recife is one of the main urban centres of the northeast of Brazil. It is considered the gateway to the state, the locus from which fluxes of people and capitals radiate to the various regional areas of the state. It is well connected to the rest of the region through its international airport and a large network of federal, state and municipal roads and highways. Littoral North is characterized by a coastline with less geographical variations than those found in Littoral South, and by large subterraneous water reserves. The existence of such reserves, Aquífero Beberibe (one of the largest water reservoirs of the country is located here), limits the occupation of the area. In Littoral North there is also a large concentration of historical monuments, settlements, churches and several old sugar mills.95 The city of Olinda, a UNESCO monument city, is also within this zone. Littoral South is the largest coastal zone and in spite of occupying some 50% of Pernambuco’s coastline, the area has remained largely rural and scarcely populated. It accounts for only 27% of the total coastal inhabitants with a population of 310.000. There is an industrial complex around the state’s second main port of Suape, south of Recife. The area contains the largest number of old sugar mills and farms with several
93 Ibid 94 [2000] Cavalcanti, et al. Litoral de Pernambuco, Um estudo propositivo. Secretaria de Planejamento e Desenvolvimento Social, FIDEM, Fundação de Desenvolvilmento Municipal. 95 Ibid

61
historic sites, conservation areas and natural reserves. The area also contains several small islands and four inactive volcanic necks. Currently, the state government’s policies encourage sustainable developments in Littoral South in the fields of rural, historical and beach eco-tourism.96 Next, we take a closer look at the area for the proposed hotel.
96 Ibid

62
3. Location The area chosen for the proposed hotel is in the municipality of Tamandare, adjacent to the delta of Rio Formoso. The municipalities of Sirinhaém, Rio Formoso and Tamandaré are predominantly rural settlements with urbanisation rates below 41%,97 they are amongst the poorest areas of the coast of Pernambuco.
Figure 47 - Location map
The possible site was selected during a recent field trip to the area. On that occasion consultations took place with the state’s Department of the Environment about this research project and with the representatives of the local planning authority that have kindly provided us with information about the areas intended for hotel type of developments.
97 [2000] Cavalcanti, et al. Litoral de Pernambuco, Um estudo propositivo. Secretaria de Planejamento e Desenvolvimento Social, FIDEM, Fundação de Desenvolvilmento Municipal.

63
Notional Site The notional site chosen for this project is in Praia dos Carneiros, the sheep’s beach. It next to the border of the largest oceanic conservation unit in the country, an area of coral reefs that extends some 140Km down to the neighboring state of Alagoas. Typical of this littoral terrain, coconut plantations predominate the landscape immediately adjacent the whitewashed sandy beaches. The site is within an area that
Figure 48 - Site location and surrounding areas
has remained relatively underdeveloped as large extents of land still belong to traditional families and landowners. At the time of our visit the road parallel to the waterfront that connects Rio Formoso to Tamandare was under construction and the area could only be accessed from the water or on foot along the sea. This situation has limited commercial developments in the area and there are only a few existing hotels to the north and south of the site.

64
Site Photos
Figure 49 - View from the sea
Figure 50 – North view of adjacent coastline

65
Figure 51 – South view of adjacent coastline and marshland
Figure 52 – South view of adjacent coastline

66
Part Three: Brief overview An ideal brief for a hotel type of intervention in this site should be sensitive to the surrounding environment and its limited resources. It should aim at improving the living conditions of the local people through the creation of jobs. The architecture should be responsive to the macro and microclimates and it should aim at complimenting the qualities of the landscape through its form, detail and the choice of materials. As mentioned previously, within these climatic conditions, the two most important considerations towards comfort are the provision of adequate airflow through the building and the protection of the external fabric against direct solar radiation. To that end, passive cooling can be maximised through well-tried and simple design strategies such as thin plans with adequately sized openings and orientation to the prevailing winds, the raising of the building on stilts, lightweight and highly reflective materials with light colours; and high levels of porosities in the building envelope. In the following pages we consider some of these critical issues such as the best orientation relative to solar geometries and the prevailing winds. The benchmarks used for the design of a ‘hotel bedroom’ in Praia dos Carneiros, are based on Givoni’s bioclimatic chart, as discussed in Part One and in the building code for thermal performance for Brazil.98 Temperature: from 20°C to 32°C Relative humidity: up to 90% Desirable internal air speed: up to 2 m/s 99 Clo values: up to 0.5 (as described in Part One) Metabolic rate: from 0.8 met (reclining) to 2 met (equivalent of a person moving at 3km/h) Minimum requirement of openings: 40% of total floor area, Maximum U-values: 3.6 walls and 2.3 roof 2. Design Data Geographic Location: Praia dos Carneiros Latitude: 8°S Longitude: 34.5°W Time Zone: -3:00 Direction of prevailing wind: 108°S (assumed the same as for Recife)100 Average wind speed: 2.9m/s, Table 1.
98 Labeee, Desempenho Térmico de Edificações Parte 3. Dec 1998. http://www.labeee.ufsc.br/conforto/textos/termica/t3-termica/texto3-0299.html 99 Givoni B; [1969] Man, Climate and Architecture, Elsevier Publishing pp 249. 100 The weather data files used here were obtained from ASHRAE’s CD, International Weather for Energy Calculations 1.1 RP-1015. 2002.
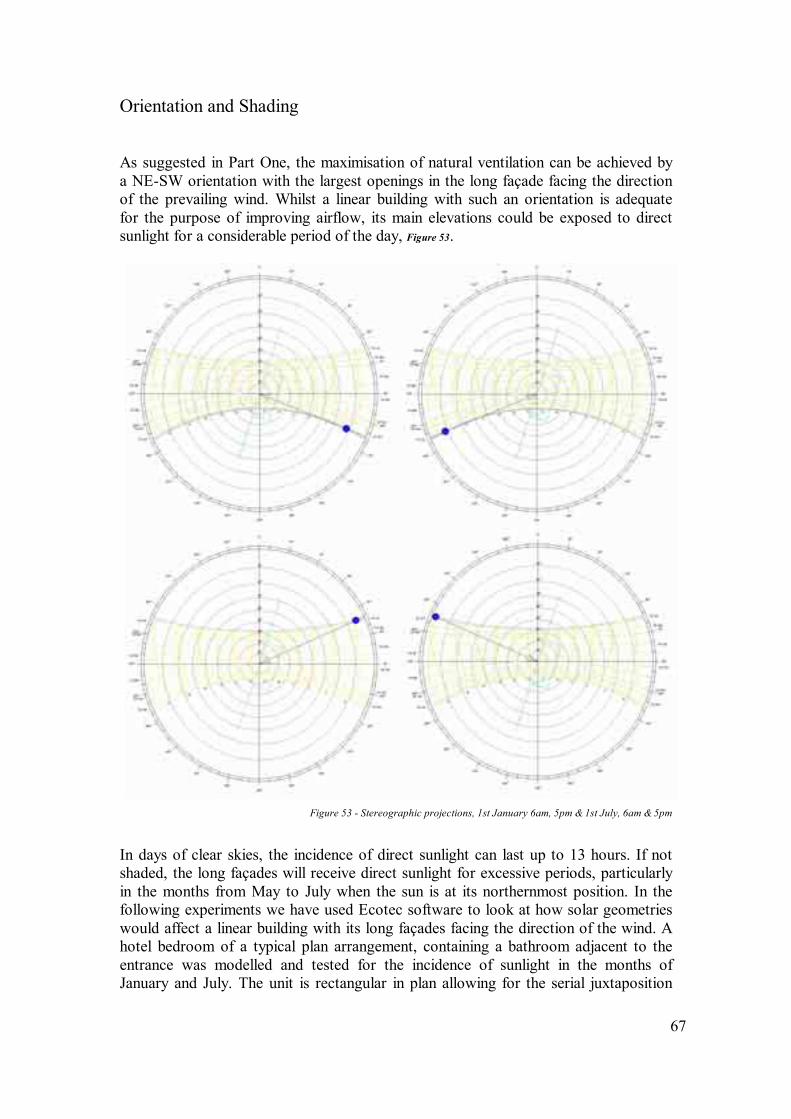
67
Orientation and Shading As suggested in Part One, the maximisation of natural ventilation can be achieved by a NE-SW orientation with the largest openings in the long façade facing the direction of the prevailing wind. Whilst a linear building with such an orientation is adequate for the purpose of improving airflow, its main elevations could be exposed to direct sunlight for a considerable period of the day, Figure 53.
Figure 53 - Stereographic projections, 1st January 6am, 5pm & 1st July, 6am & 5pm
In days of clear skies, the incidence of direct sunlight can last up to 13 hours. If not shaded, the long façades will receive direct sunlight for excessive periods, particularly in the months from May to July when the sun is at its northernmost position. In the following experiments we have used Ecotec software to look at how solar geometries would affect a linear building with its long façades facing the direction of the wind. A hotel bedroom of a typical plan arrangement, containing a bathroom adjacent to the entrance was modelled and tested for the incidence of sunlight in the months of January and July. The unit is rectangular in plan allowing for the serial juxtaposition

68
of similar units in a rectilinear composition. Its section is similar to the diagrams in Part One, Figure 15, including high-level ventilation through an opening at the roof in addition to the windows. The upper section of the partitions to the bathroom could be either open or made of highly porous panels such as timber trellises to allow airflow through the spaces. The roof is ventilated and composed of two planes that extend beyond the external walls providing two shaded external areas, an access route to the bedroom to one side and an external area for the unit to the other, in the direction of the wind. The windward wall contains two openings, one intended as a window, and the other as a full-height set of fully collapsible doors. The total area of openings is the equivalent of 110% of the total floor area: 27m2.
Figure 54 – Unit’s Plan, Section and perspective.
Orientation perpendicular to the direction of the prevailing wind
For this orientation, in January, when the sun rises at around 5am and sets at 6pm, the bedroom window is shaded from around 7:30am and the door from 8am, Figure 55. At the N-W elevation, the window to the bathroom receives some sun late in the day and the door is half-shaded from 4:30pm. Window louvres and low-e glass could be used here to reflect the afternoon sun. The access door is half-shaded from 4:30pm and so it should be adequately insulated and reflective with a low U-value. In the ‘winter month’ of July when the sun rises at around 6am and sets at around 5pm the openings to the S-E are totally shaded from around 8am and to the N-W, the bathroom window is shaded until around 4:30pm and the lower half of the door is exposed to the sun, Figure 56.
N

69
Figure 55 - Shade on openings, 1st January at 7am & 4:30pm
Figure 56 - Shading on openings, 1st July at 7:30am & 4:30pm
Whilst simple strategies such as the projection of the roofs and the employment of louvres can serve to shade the external walls and openings, the ultimate orientation for the purpose of natural ventilation depends on more complex factors such as wind pressures, relationships between inlet and outlet openings, internal arrangements and the thermal properties of materials, etc. In the following pages we consider some of these design parameters for this hotel unit through CFD experiments.
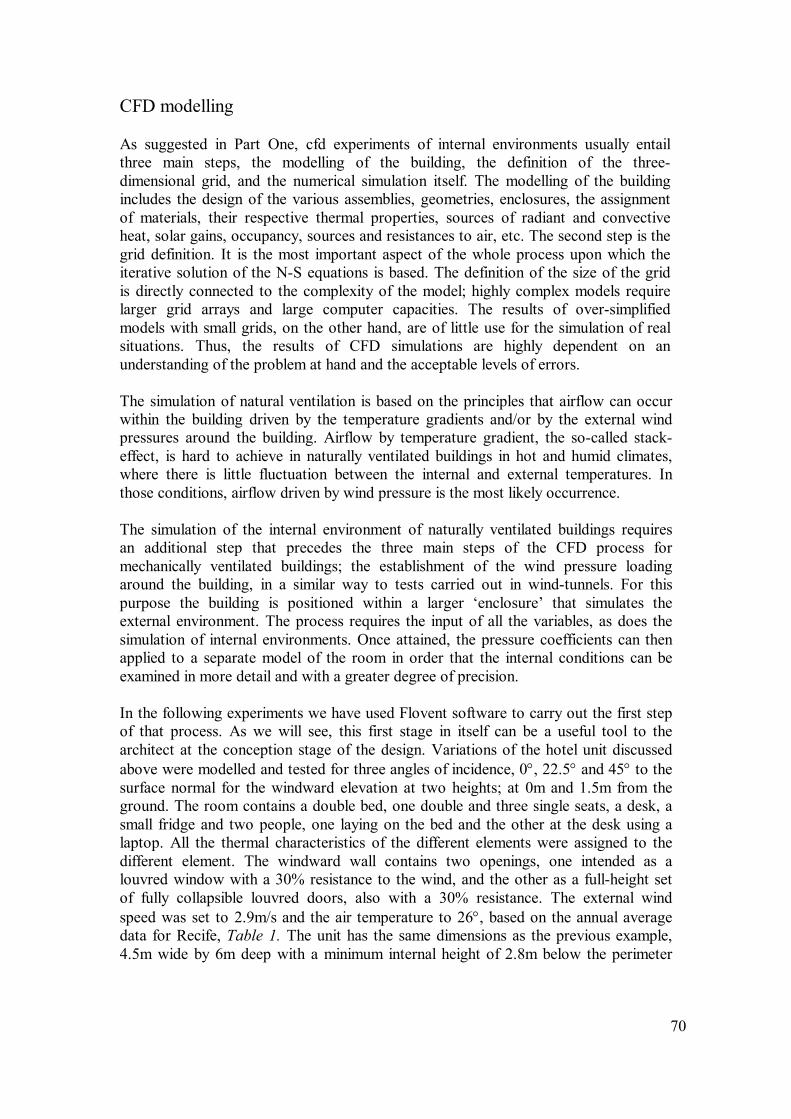
70
CFD modelling As suggested in Part One, cfd experiments of internal environments usually entail three main steps, the modelling of the building, the definition of the three-dimensional grid, and the numerical simulation itself. The modelling of the building includes the design of the various assemblies, geometries, enclosures, the assignment of materials, their respective thermal properties, sources of radiant and convective heat, solar gains, occupancy, sources and resistances to air, etc. The second step is the grid definition. It is the most important aspect of the whole process upon which the iterative solution of the N-S equations is based. The definition of the size of the grid is directly connected to the complexity of the model; highly complex models require larger grid arrays and large computer capacities. The results of over-simplified models with small grids, on the other hand, are of little use for the simulation of real situations. Thus, the results of CFD simulations are highly dependent on an understanding of the problem at hand and the acceptable levels of errors. The simulation of natural ventilation is based on the principles that airflow can occur within the building driven by the temperature gradients and/or by the external wind pressures around the building. Airflow by temperature gradient, the so-called stack-effect, is hard to achieve in naturally ventilated buildings in hot and humid climates, where there is little fluctuation between the internal and external temperatures. In those conditions, airflow driven by wind pressure is the most likely occurrence. The simulation of the internal environment of naturally ventilated buildings requires an additional step that precedes the three main steps of the CFD process for mechanically ventilated buildings; the establishment of the wind pressure loading around the building, in a similar way to tests carried out in wind-tunnels. For this purpose the building is positioned within a larger ‘enclosure’ that simulates the external environment. The process requires the input of all the variables, as does the simulation of internal environments. Once attained, the pressure coefficients can then applied to a separate model of the room in order that the internal conditions can be examined in more detail and with a greater degree of precision. In the following experiments we have used Flovent software to carry out the first step of that process. As we will see, this first stage in itself can be a useful tool to the architect at the conception stage of the design. Variations of the hotel unit discussed above were modelled and tested for three angles of incidence, 0°, 22.5° and 45° to the surface normal for the windward elevation at two heights; at 0m and 1.5m from the ground. The room contains a double bed, one double and three single seats, a desk, a small fridge and two people, one laying on the bed and the other at the desk using a laptop. All the thermal characteristics of the different elements were assigned to the different element. The windward wall contains two openings, one intended as a louvred window with a 30% resistance to the wind, and the other as a full-height set of fully collapsible louvred doors, also with a 30% resistance. The external wind speed was set to 2.9m/s and the air temperature to 26°, based on the annual average data for Recife, Table 1. The unit has the same dimensions as the previous example, 4.5m wide by 6m deep with a minimum internal height of 2.8m below the perimeter

71
Figure 57 - Plan and section of the model
structure. The walls were set to a 100mm thickness and the upper section of the internal partitions to the bathroom are composed of a highly porous surface with a 10% resistance to allow the air to flow through to the unit. The roof is composed of two layers of a highly reflective material and the ceilings would follow the inclinations of each pitch.
Figure 58 – Models A & B, 0m and 1.5m
Models A and B were positioned within an enclosure to simulate the external wind conditions in order to assess the wind pattern and the pressure loading around the building for these two conditions. Once the computational process was complete, the solution reached its converged state, the wind pattern can be visualised by placing a three-dimensional source at any given position within the domain of the model. In the following diagrams, the streamlines representing the airflow were obtained by placing one source at approximately 6m from the external wall facing the wind and one coinciding with that wall. The sectional pressure-planes were positioned across the centre of the plan. The speed and pressure bars represent the maximum and minimum values found within the domain of the solution.

72
Model A
Figure 59 - Airflow pattern and pressure distribution for wind angle of 0°
Figure 60 - Airflow pattern and pressure distribution for wind angle of 22.5°
Figure 61 - Airflow pattern and pressure distribution for wind angle of 45°

73
Model B
Figure 62 – Airflow pattern and pressure distribution for wind angle of 0°
Figure 63 - Airflow pattern and pressure distribution for wind angle of 22.5°
Figure 64 - Airflow pattern and pressure distribution for wind angle of 45°

74
Models A and B For an angle of incidence perpendicular to the façade, Figure 59, there is a build-up of positive pressure at the wall to the bathroom forcing the air to move over the level of the bed towards the top of the partition and the roof opening. For the angle of 22.5°, Figure 60, there is a greater contrast between the external and internal pressures and the pressure causing a slight improvement in the airspeed at the level of the bed whilst the speed at the desk has remained the same as for the 0° incidence, Table 4. The airspeed is also slightly higher within the room relative to the external speeds. At the 45° angle, although the flow is directed towards the position of the bed, the air speed reaching both occupants is equal and considerably lower than the two previous angles. The pressure build-up on the wall to the bathroom is also causing the air to lift towards the roof. Internal airspeeds in B are generally higher than A, Table 5. The average speed between the two positions is higher for the 0°. The streamlines seem to be remaining within the room for a longer period in the case of the 22.5° incidence and although the 0° causes a considerably higher speed at the desk position, the slightly skewed angle induces a higher speed at bed level and a more evenly distributed flow across the room. The lowest internal airspeeds were found with the 45° incidence for both models. Table 4 - Air speeds around the upper body of the occupants of model A, readings obtained from sectional plane across the bed and desk
angle of incidence
bed approx.60cm above FFL (m/s)
desk approx.1.20cm above FFL (m/s)
average (m/s)
average % of external air-speed, 2.9m/s
0° 0.33 1.1 0.72 25 22.5° 0.37 1.1 0.64 22 45° 0.22 0.22 0.22 8
Table 5 - Air speeds around the upper body of the occupants of model B
angle of incidence
bed approx.60cm above FFL (m/s)
desk approx.1.20cm above FFL (m/s)
average (m/s)
average % of external air-speed, 2.9m/s
0° 0.36 1.2 0.78 26 22.5° 0.6 0.6 0.6 22 45° 0.6 0.26 0.46 15

75
These experiments show that a slightly skewed angle of incidence is the most desirable for this design in both cases, at 0 and 1.5m heights. However, the average internal airspeeds are still too low relative to the external speed. In the next model we consider some possible alterations to the design that will improve the internal airspeeds. As we have seen in Part Two, the arrangement of the external projections and the degree of porosity of the building, the layout of inlet and outlet openings also play an important role in the effects of airflow and airspeed within the room. In the next example we test some of these elements through a model with an alternative sectional arrangement for the 22.5° angle of incidence. Model C
Figure 65 – Model C
In this model the section of the roof over the external area has been altered so as to open out towards the direction of the wind. The angle of the projecting plane has been set to 15°. The vertical dimension of the bedroom window has been increased by 300mm with the lowering of the sill, which is now at 600mm from the floor level. Internally, an additional outlet has been introduced at floor level, parallel to the bathroom partition. The effect of the new roof inclination as to incidence of direct sunlight at the windward elevation is that the window and the door are now exposed to approximately three hours of sun in the morning; until around 8:30am in January and 9am in July, Figure 66. The door and the window would need to be detailed so as to reflect the sunlight; window louvres and low-e glazed panels are possible options.

76
Figure 66 - Shading on openings, 1st January at 8am and 1st July at 8:30am
The CFD simulation of model C shows a different distribution of pressure to the downwind elevation from the previous models. There is a concentration of positive pressure below the new projection of the roof, Figure 67. The inclined projection seems to be acting as a wind-catcher, which is forcing the airflow down towards the level of the occupants. The occurrence is also encouraged by the lowered sill level and by the new outlet opening in the floor below which a pattern of negative pressure can be noticed. The internal airspeeds are considerably higher in this model for both positions of the occupants, at 43% of the external speed, Table 6. There is also a more even distribution of air between the two positions.
Figure 67 - Airflow pattern and pressure distribution for wind angle of 22.5°
Table 6 - Air speeds around the upper body of the occupants of model C
angle of incidence
bed approx.60cm above FFL (m/s)
desk approx.1.20cm above FFL (m/s)
average (m/s)
average % of external air-speed, 2.9m/s
22.5° 1.3 1.2 1.25 43

77
Figure 68 - Models B & C – Perspective views, airflow pattern distribution for wind angle of 22.5°
Figure 69 - Models B & C – Sectional airspeeds for wind angle of 22.5°
When compared to model B, the new arrangement seems a far more desirable option for the purposes of an improved airflow and speed within the unit, Figure 68 & Figure 69. The internal airspeed just above the level of the bed for B is 0.6m/s and 1.3 m/s for C; 21% and 44% of the external airspeed. Further improvements to the internal airspeed could be achieved by an increase in the total area of outlets. Although model C contains more openings, a larger inlet window opening and the outlet in the floor, the inlet-outlet ratio has remained approximately unaltered. Further simulations would be required to test the effects of an increase in the area of outlet openings. These could be introduced by a larger number of openings at the roof and floor surfaces.

78
Conclusion As previously suggested, these CFD simulations usually only represent the initial step of the process for natural ventilation. The diagrams exemplified here are usually used to obtain the external pressures to each side of the building. This is done by the assignment of regions coinciding with elements such as walls, windows, roofs and floors, should they be elevated from the ground such as in models B and C. Once the CFD solution has converged, the pressures can then be read directly from the regions and applied to a separate model for a more accurate simulation of the internal environment. However, this first step of the process may in itself be sufficient for the purpose of simulating highly porous buildings in hot and humid climates where, as we have seen in Part Two, higher porosities are desirable. Methods that employ pressure coefficients are considered less accurate for buildings with porosities greater than 25%. Although the models simulated here contain a large percentage of openings relative to their floor areas, they are less than 25% porous and therefore would require new simulations of the interior for more precise readings. Though these experiments simply exemplify the general tendency of the wind speeds and pressures for these particular arrangements, under a particular climatic condition, they are useful for the visualisation of the workings of such complex forces as those caused by external wind pressures. Although higher porosities are desirable in these climatic conditions, they may be impractical in the case of hotel buildings where the privacy of the occupant is an important design consideration. In the cases considered here, additional external openings could be introduced in the floor and roof areas, but would be hard to achieve between intermediary units. The juxtaposition of additional units in a linear arrangement would also influence the internal airflow patterns and speeds and would require new simulations, particularly for the more angular incidences. As we have seen, there are several design strategies that can be used to encourage the passive cooling of buildings in such climatic conditions. Whilst the reconciliation of increased levels of porosity and degrees of privacy required between hotel bedrooms may be a critical design consideration, there are several strategies that can be employed to optimise wind-flow and encourage the more passive means of cooling the internal spaces. One of the main problems that passive cooling systems usually present is due to fluctuations in the incidence of casual heat gains within the internal spaces. In a hotel environment, the likely causes of such gains are the variations in the levels of occupancy, lighting and equipment. Therefore, a careful consideration of other influential aspects, such as the shape and massing of the building, the planning of large public spaces, the properties of the external envelope, etc; is also required. What this research shows, is that there are several options available to the architect towards a more efficient design in such climatic conditions. Simple strategies that can assist in the modification of the internal conditions include the shaping of the roofs, adaptation of new openings and thin open-plans for the maximisation of cross-

79
ventilation. Site dimensions allowing, this can be achieved by dividing the different functions into smaller units. Large spaces such as lobbies and conference rooms should be shaded and, where possible, unwalled. Although such a strategy may prove impractical and affect aspects such as security and acoustics in certain areas, it may be a viable option for zones such as lobbies, reception, and eating areas. These features can already be noticed in some of the local hotels and other public buildings of the North-east of Brazil, i.e. Salvador airport. The external materials in the roofs and walls should be light-weight, insulated, reflective and of quick-response for cooling at night. The roofs should be ventilated and double roof systems are preferable. Projecting over-hangs or louvres can be used to shade the surrounding external walls, balconies or veranda spaces. The floors should be raised from the ground to encourage airflow under the building. High ceilings and large openings should also be used for ventilation. Circulation spaces can be provided in the form of sheltered breezeways to encourage airflow between the more secluded private rooms. Lastly but most importantly, as we have seen through the precedents, the landscape plays a crucial role in these types of schemes. The vegetation should be seen as an integral part of the project, leaves and greenery as low emissivity materials that reflect solar radiation and soften the impact on the landscape; particularly if the site is within reach of the sea such as the site considered here. The architectural vocabulary should be one that is sensitive to such an environment, complimenting and emphasising the characteristics of local environment. As we have seen through the precedents considered here, these design objectives can be achieved through ecological means without compromising the commercial potential of such developments.

80
Bibliography The Aga Khan Award for Architecture. :http://www.akdn.org/agency/akaa/eighthcycle/_09txt.htm ASHRAE, International Weather for Energy Calculations 1.1, CD RP-1015. 2002. ASHRAE Transactions, vol. 93, part 2 ASHRAE Standard, Feb 2001 Aynsley, R, Melbourne, W. and Vickery, B. J. 1977. Architectural Aerodynamics. Applied Science Publishers Ltd, London. Baker N., Steemers K., Energy and Environment in Architecture. E & FN Spoon 1999. Bawa, G, Batujimbar Bali, prints of original proposals for the Batujimbar project. J. de La Pena’s personal library BIT, Brazilian Incentive and Tourism http://www.bitourism.com/city.asp?city_id=5. Bittencourt, L.S., 1993 A.A. PhD thesis Ventilation as a Cooling Resource for Warm-humid Climates: An Investigation on Perforated Block Wall Geometry to Improve Ventilation Inside Low-rise Buildings Bogo A, Pietron C, et al. Biolcimatologia Aplicada ao Projeto de Edificações Visando o Conforto Térmico. Relatório Interno. Universidade Federal de Santa Catarina, 1994. Boutet, T. S., Controlling Air Movement: A Manual for Architects and Builders, MacGraw-Hill, NY 1987 Brasil Imperial. http://members.tripod.com/~netopedia/historia/IReinado.htm Cavalcanti, et al. 2000 Litoral de Pernambuco, Um estudo propositivo. Secretaria de Planejamento e Desenvolvimento Social, FIDEM, Fundação de Desenvolvilmento Municipal. Chen, P. The Implications of Thermal Comfort in New Zealand House Design, http://meanradianttemperature.com/chen1.htm Sept 2002. Crystal, D. 1993. The Cambridge Fact Finder. Cambridge University Press UK. de Dear R, Brager G, Cooper D, Developing an Adaptive Model of Thermal Comfort and Preference, Final Report, ASHRAE RP – 884, Macquarie University, Sydney 1997. de Holanda, A. 1976 Roteiro para Construir no Nordeste,Universidade Federal de Pernambuco. de Moraes, R. Lecture notes. Geografia, tema4-aula 8-S2- Mata costeira e Caatinga. http://geocities.yahoo.com.br/sousaraujo/paisagens_bras_s2_a10.html Diário de Pernambuco.Newspaper article: Arrecifes: uma grife do turismo. Economia, 29 November2002. Enciclopédia Brasileira. 2003. História do Brasil. http://geocities.yahoo.com.br/ Enciclopédia Digital http://www.enciclopedia.com.br/MED2000/pedia98a/bioh8hdl.htm Fichário histórico. http://www.ficharionline.com/historia/periodo-joanino.php Fleury, B. 1990. Ventilative Cooling. Paper presented at Workshop on Passive Cooling, 2-4 April 1990, Ispra. CEC, Joint Research Centre Flomerics Ltd. Application of CFD to Naturally ventilated Buildings: A guide for practitioners. www.flovent.com Gandemer, J. et al. 1992. Guide sur la Climatisation Naturelle de l’Habitat en Climat Tropical Humide. Tome 1: Methodologie de Prise en Compte des Parametres Climatiques dans l’Habitat et Conseils Pratiques. CSTB, Nantes.

81
Documento del Banco Interamericano de Desarrollo, Programa de Desarrollo Turístico en La Región Nordeste del Brasil – Segunda Etapa, Podetur/NE-II. 2002 http://www.iadb.org/exr/doc98/apr/br1392s.pdf Geller, H. 1994 O Uso Eficiente da Eletricidade: uma estratégia elétrica de desenvolvimento para o Brasil. Givoni B. Man, Climate and Architecture. Elsevier Publishing 1969 Givoni, B. Comfort Climate Analysis & Building Design Guidelines. Energy and Buildings, v. 18, no. 1, 1992. Hyde R. Climate Responsive Architecture. Spon Press, London 2000 IBGE, Instituto Brasileiro de Geografia e Estatística. http://www.ibge.gov.br/ INOVA, Thermal Comfort, http://www.innova.dk/files/pdf/Thermal%20Booklet.pdf JC Economia. News article. Contrato do Prodetur sai em Junho, 21 June 2003. Koenigsberger, O. et al. Manual of Tropical Housing and Building. Part 1: Climatic Design. Longman, London, 1974. Konya A, Design for Hot Climates. The Architectural Press, London 1980 Labeee, Desempenho Térmico de Edificações Parte 3. Dec 1998. http://www.labeee.ufsc.br/conforto/textos/termica/t3-termica/texto3-0299.html Lamberts R, Heat Transfer Through Roofs of Low Cost Brazilian Houses. Doctorate Thesis, University of Leeds 1988 Lamberts R, DutraL, Pereira O. 1998 LabEEE multimedia cd Universidade Federal de Santa Catarina. Lamberts R, Dutra L, Pereira O. 1998 LabEEE multimedia cd Universidade Federal de Santa Catarina. Lamberts, R et al 2000, Desempenho térmico de edificações, Universidade Federal de Santa Catarina, Brasil. Liddament M, A Guide to Energy Efficient Ventilation. AIVC, GB 1996 London, G. Jungle Rhythms. Architecture Australia, Sept/Oct 1994 Markus T A, Morris E N. Buildings, Climate and Energy. Pitman Publishing, London 1980. Ministério do Trabalho e Emprego PE in Estratégia de Desenvolvimento da Região Metropolitana do Recife – 2003/15. http://www.citiesalliance.org/cdsdb.nsf/Attachments/Brazil+recife+1/$File/VERSAOFINALESTRATEGIAPARTE1929+.pdf Mota Menezes, J L, 2002. Interview for the Newspaper Diario de Pernambuco, 30 June. Müller, M. Handbuch ausgewählter Clemastationen der Erde Universität Trier. Forschungsstelle 1983 The New Travel Age , http://www.newtravelage.com/info/america/brazil/history/recife.htm Nicol F, Humpreys M, Sykes O, Roaf S, Standards for Thermal Comfort. E & FN Spon, London 1995 Olgyay, V. 1963 Design with Climate. Princeton University Press. Portugal History. http://w3.tyenet.com/kozlich/portughist.htm Projeto Design, periodical, vol.203, December 1996. São Paulo Uma casa nas árvores: ninho arquitetônico em madeiras amazônicas para o sonho humano de viver em pleno ar. The Royal Australian Institute of Architects. : http://www.architecture.com.au/ Rosa Pinguelli,L. O Apagão, Por que veio? Como sair dele? Rio de Janeiro, Ed. Revan ltda. 2001.

82
The Royal Australian Institute of Architects, http://www.architecture.com.au/ Santamouris, M Asimakopolous D, Passive Cooling of Buildings. James & James, London 1996 Square One, http://www.squ1.com/site.html , Square One, University of Cardiff 2002 Taylor B, Geoffrey Bawa. Thames & Huddson, London 1995. Taylor J, Architecture Australia. Commercial Award, Nov/Dec 1994 Tuomaala, P., 2002 The Implementation and evaluation of airflow and heat transfer routines for building simulation tools. VTT publication 471, PhD thesis, Helsinki University of Technology. Tzonis A, Lefraivre L, Stagno B, Tropical Architecture, Critical Regionalism in the Age of Globalization. Wiley Academy, GB 2001 Vickery, B J, Karakatsanis C, 1987.