pasbo conference pittsburgh, pa march 2011 budgeting yesterday, today, and hopefully tomorrow...
TRANSCRIPT

PASBO ConferencePittsburgh, PAMarch 2011
Budgeting Yesterday, Today, and Hopefully Tomorrow
William Hartman, Penn State UniversityChristopher Berdnik, Centennial School District
Tim Shrom, Solanco School District

Budget Instructions / Forms / Timelines / Bid Recaps / Budget Summaries / Account
Codes• This link goes directly into a folder with all of the files: • http://moodle.solanco.org/mod/resource/view.php?id=39673
• This link takes you into the course where the files are:• http://moodle.solanco.org/course/view.php?id=846

Budgeting & School Finance the next three years
Budgeting for the
present..... ....and then to sustain...

What if.......this is not a storm...
What if....this is ‘Climate’ change...
There is no ’TRY’......either do...or do not do...
Master Yoda
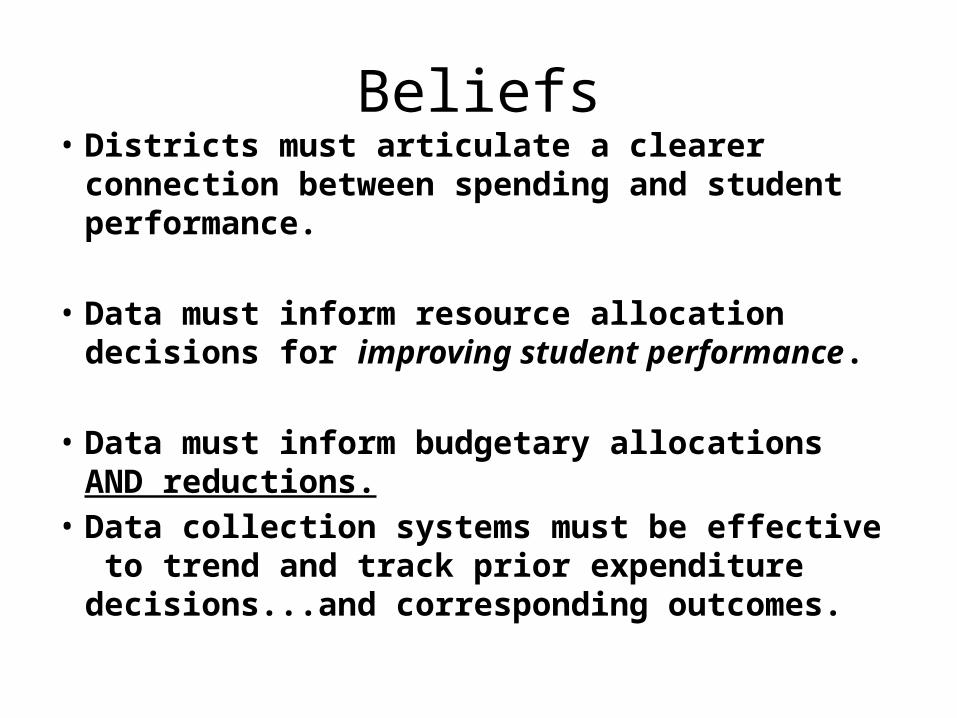
Beliefs• Districts must articulate a clearer connection
between spending and student performance.
• Data must inform resource allocation decisions for improving student performance.
• Data must inform budgetary allocations AND reductions.
• Data collection systems must be effective to trend and track prior expenditure decisions...and corresponding outcomes.

Budgeting For Tomorrow??It will become...
• More Transparent?.....on-line....Real time??• More data driven...informed decision making.
– Asking Why?... Why this and not that?– Asking What Results? Outcome based
• More aligned with pre-stated, well vetted objectives
• More flexible and quicker to reallocate existing resources to improve processes and outcomes
• ......Connected to data.....

Purpose of School District Budgeting
Balance the educational needs and requirements of students with fiscal capacity of the district
Develop a budget that: – Serves students appropriately– Meets state and federal mandates– At an affordable price
W Hartman PASBO Annual Conference - March 2011 7

It’s A New Fiscal Reality for Districts
• Rules have changed– Insufficient recognition of new situation
• Districts, board members, unions, teachers, parents
• Less Revenue growth, even significant reductions• Need to reduce or curb Expenditures• Serious structural imbalance between revenues and
expenditures• No letup in Student Achievement mandates• Difficult adjustments will be required• Budgets will have to reflect new fiscal conditions
W Hartman PASBO Annual Conference - March 2011 8

Balanced Budgets More Difficult• Expenditures increasing faster than revenues
– Expenditure increases can’t be sustained at higher levels (Salaries & benefits are biggest part)
– Many out of district control• PSERS, Health Care
• Imbalance between revenue and expenditure trends– Act 1 limits local tax increases, now and in future– State aid reductions
• Unsustainable and increasing deficitsW Hartman PASBO Annual Conference - March 2011 9

New View of School Budgeting
• No Longer a One Year Process• Must Take a Longer View of Fiscal
Decisions• Actions Taken This Year Will Impact
District Budgets for Years to Come
W Hartman PASBO Annual Conference - March 2011 10

Basic Budget MathUse of Fund Balance
Expenditures = Revenues + Fund Balance Remaining %
$10,000,000 = $10,000,000 + $0 $1,000,000 10.0%
4% 2%$10,400,000 = $10,200,000 + $200,000 $800,000 7.7%
4% 2%$10,816,000 = $10,404,000 + $412,000 $388,000 3.6%
4% 2%$11,248,640 = $10,612,080 + $636,560 -$248,560 -2.2%
W Hartman PASBO Annual Conference - March 2011 11

Reset the Budget
• To New Lower Expenditure Level • Bring Expenditures in Line with
Available Revenues• Changes Must Be Substantial to Have
Impact:–Salaries, Benefits, Transportation,
Energy, Debt Service3/10/2011 EDLDR 597G New Fiscal Reality- Session 2 12

Why Taxes Aren’t the Whole Answer Anymore
● “No New Taxes” Mantra– Local, State, Federal– Act 1 limits on district tax increases
● Disconnect between – What people want/expect in public services– What state and federal mandates require– What the public is willing to pay in taxes
● Tradeoffs between– Minimizing tax increases– Providing necessary educational programs
W Hartman PASBO Annual Conference - March 2011 13

PASBO Annual Conference - March 2011
14
Types of Budgeting Approaches
• Line-Item• Function/Object
– Required by PDE– Budget structure matches organizational structure
• Site-Based– Decision making authority for site– Resources under control of site
• Zero-Based – Alternative to annual incremental changes– To what extent
W Hartman

W Hartman PASBO Annual Conference - March 2011 15

PASBO Annual Conference - March 2011
16
Budgeting Challenges for Tomorrow
• Long term planning disrupted with seismic shifts in state funding and new revenue and expenditure rules
• Must be able to react quickly to large fiscal shifts– Major changes in revenues force changes in expenditure plans
• When will PA start to come out of the economic recession?– How fast will it recover?– Will it rebound to prior levels?
• Will education funding go back to prior levels?– Are cuts, new practices permanent?
• Are we establishing a new normal?W Hartman
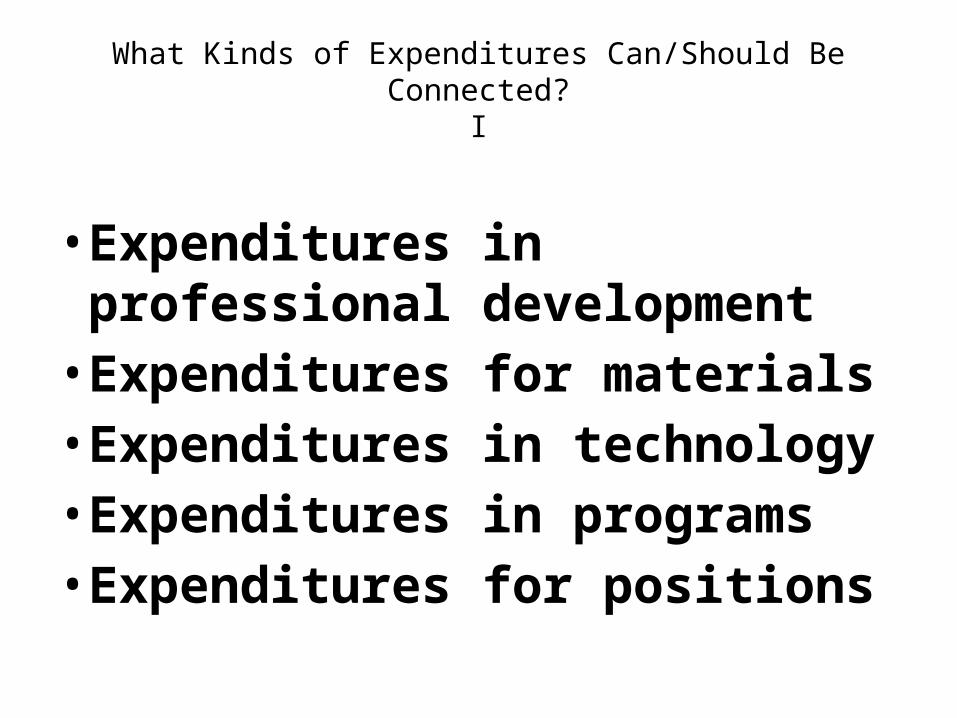
What Kinds of Expenditures Can/Should Be Connected?
I
• Expenditures in professional development
• Expenditures for materials• Expenditures in technology• Expenditures in programs• Expenditures for positions

What Kinds of Expenditures Can / Should Be Connected?
II
Reductions / Cuts / Reallocations:–in professional development–for materials and equipment–Infrastructure and technology–in programs and departments
–And Most importantly.....for positions

Student Performance Challenges
NCLB/AYP Graduation Requirements/Keystones
Financial Challenges: New Fiscal Reality
Act 1 PSERS State Funding

2010-2011 Students’ Required Proficiency in 11th Grade Year
Reading Math
K 100% 100%
Grade 1 100% 100%
Grade 2 100% 100%
Grade 3 100% 100%
Grade 4 100% 100%
Grade 5 100% 100%
Grade 6 100% 100%
Grade 7 100% 100%
Grade 8 100% 100%
Grade 9 91% 89%
Grade 10 81% 78%
Grade 11 72% 67%

Balancing the Budget...Actual
Stressed Local Revenue Stabilization
Strategic Expenditure Process / Reductions
Financial Challenges: New Fiscal Reality...is not yet known...exceptions?...recovery?...
Act 1 Déjà vu next FY
PSERS X 3 yrs?
State Funding Reductions

http://en.wikipedia.org/wiki/Zero-based_budgeting (March 2011)
Site BasedIncremental Based
Zero Based BudgetingCite:

Incremental Budgeting Disadvantages• Assumes activities and methods of working will continue in the
same way.• Little incentive for developing new ideas.• Little to no incentive to reduce costs.• Encourages spending the budget so the budget is maintained
next year.• The budget may become out-of-date and no longer relate to the
level of activity or type of work being carried out.• The priority for resources may have changed since the budgets
were originally set.• Budgetary slack often built into the budget, which is never
reviewed. • Overestimated requirements to obtain a budget which is easier
to work within and manipulate

Incremental Budgeting Advantages
• The budget is stable and change is gradual.• Managers can operate their departments on a
consistent basis.• The system is relatively simple to operate and
easy to understand.• Conflicts are avoided when departments
appear to be treated similarly.• Co-ordination between budgets is easier to
achieve.

2503/17/11
• Site-Based Budgeting• Christopher M. Berdnik, PRSBA• Business Administrator/Chief Financial Officer• Centennial School District

2603/17/11
Tools you can use
Budgeting strategies Focus on site-based budgeting
Monitoring your budget Year to date budgeting
Planning for the future Multiple year “budgeting”

2703/17/11
School budgeting strategies
Line-item - historical focus Performance – standard unit costs Program and planning – fundamental
objectives Zero-based – annual justification Site-based – decentralization Outcome-focused – mission driven

2803/17/11
Philosophy of site-based budgeting
Emphasizes the decentralization of budgetary decision-making
Greater control and reporting of school-level data
Grants increased authority to schools Places principals front and center
Responsible for both preparation and maintenance of their budget

2903/17/11
Elements of site-based budgeting
Resources are allocated to the site, typically on a per pupil basis
Grade level Demographics School size
Principal has the authority to allocate, including staffing decisions
Actual or average salaries and benefits

3003/17/11
Advantages of site-based budgeting
Grants power to those who best understand the needs of your customers
Principals love it Increases local accountability
Aligns well with principal pay for performance
Facilitates staff and community participation at the school level
3103/17/11
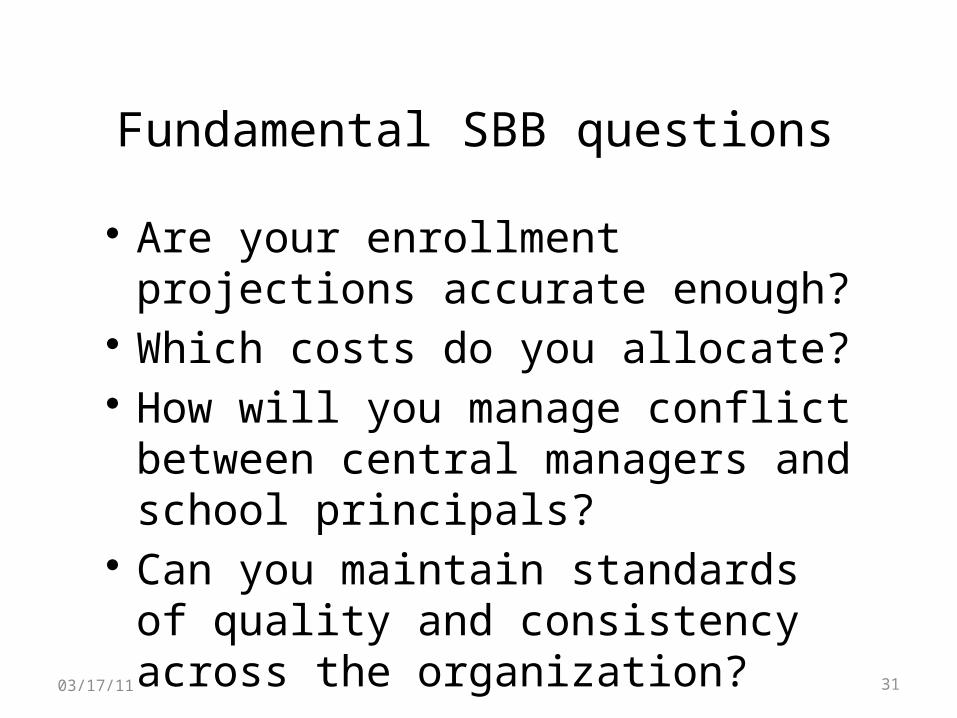
Fundamental SBB questions
Are your enrollment projections accurate enough?
Which costs do you allocate? How will you manage conflict between
central managers and school principals? Can you maintain standards of quality and
consistency across the organization?
3203/17/11
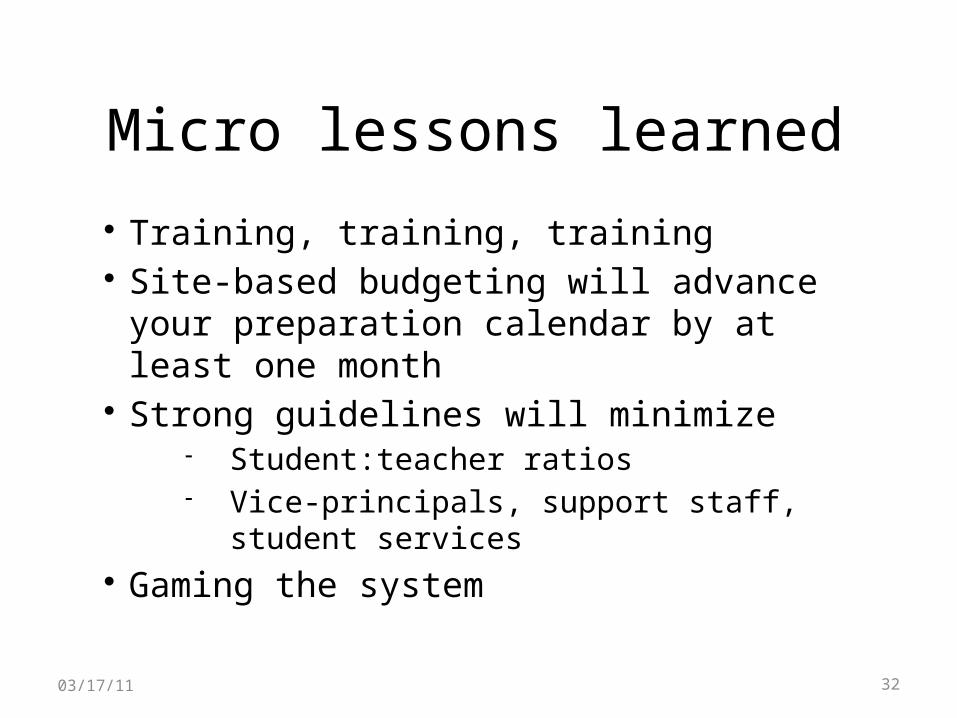
Micro lessons learned Training, training, training Site-based budgeting will advance your
preparation calendar by at least one month Strong guidelines will minimize
Student:teacher ratios Vice-principals, support staff, student
services Gaming the system

3303/17/11
Macro lessons learned No one budget system fits all The centralized vs. decentralized paradigm
swings over time Site-based systems require add significant
complexity Personnel costs
Differences between site-based budgeting and site-based management

3403/17/11
Want to learn more about site-based budgeting?
Sample site-based budgeting manual:http://www.pps.k12.pa.us/
14311019103352810/lib/14311019103352810/2009-10_Site-Based_Budget_Manual.pdf
3503/17/11
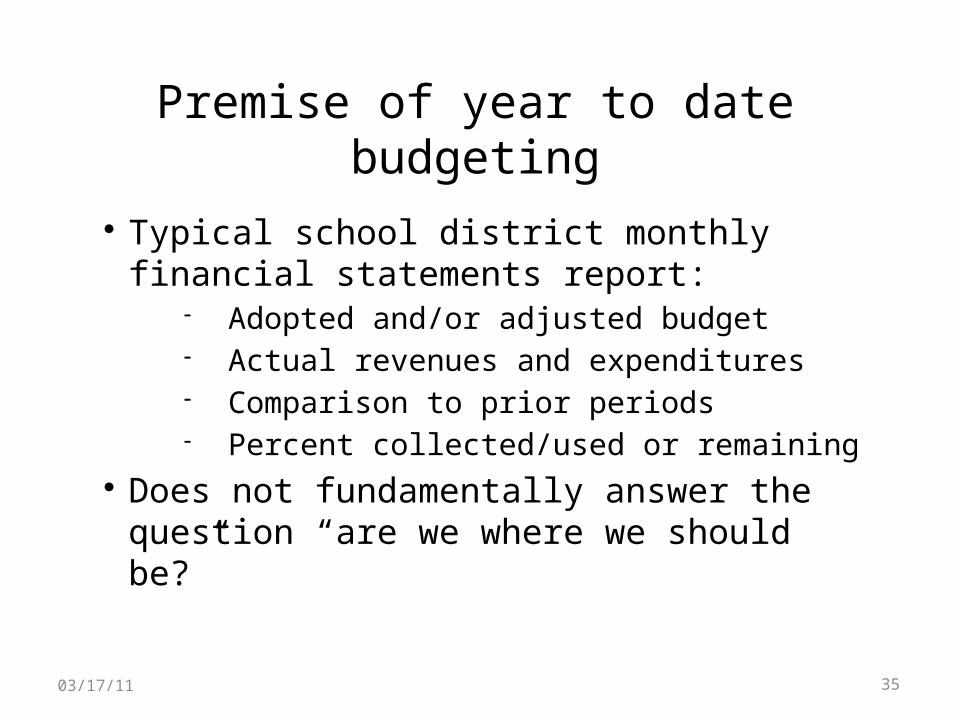
Premise of year to date budgeting
Typical school district monthly financial statements report:
Adopted and/or adjusted budget Actual revenues and expenditures Comparison to prior periods Percent collected/used or remaining
Does not fundamentally answer the question “are we where we should be?”

3603/17/11
Philosophy of year to date budgeting
School district revenues and expenditures are fundamentally cyclical
Tax calendars Unipays Pay dates Debt schedules
3703/17/11
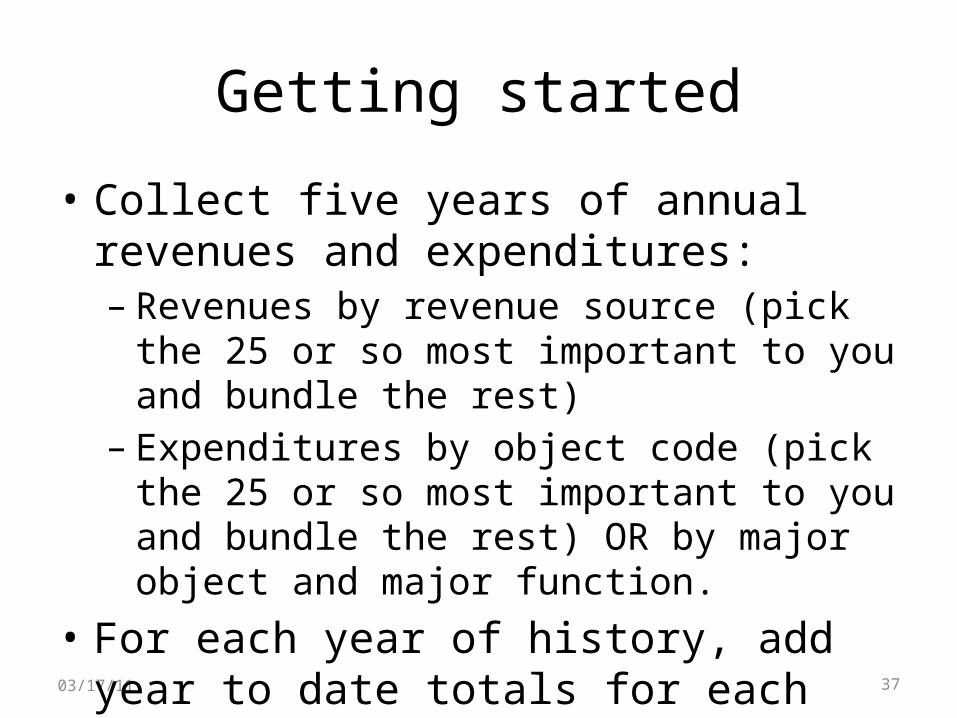
Getting started
• Collect five years of annual revenues and expenditures:– Revenues by revenue source (pick the 25 or so
most important to you and bundle the rest)– Expenditures by object code (pick the 25 or so
most important to you and bundle the rest) OR by major object and major function.
• For each year of history, add year to date totals for each month (separate tabs).
3803/17/11
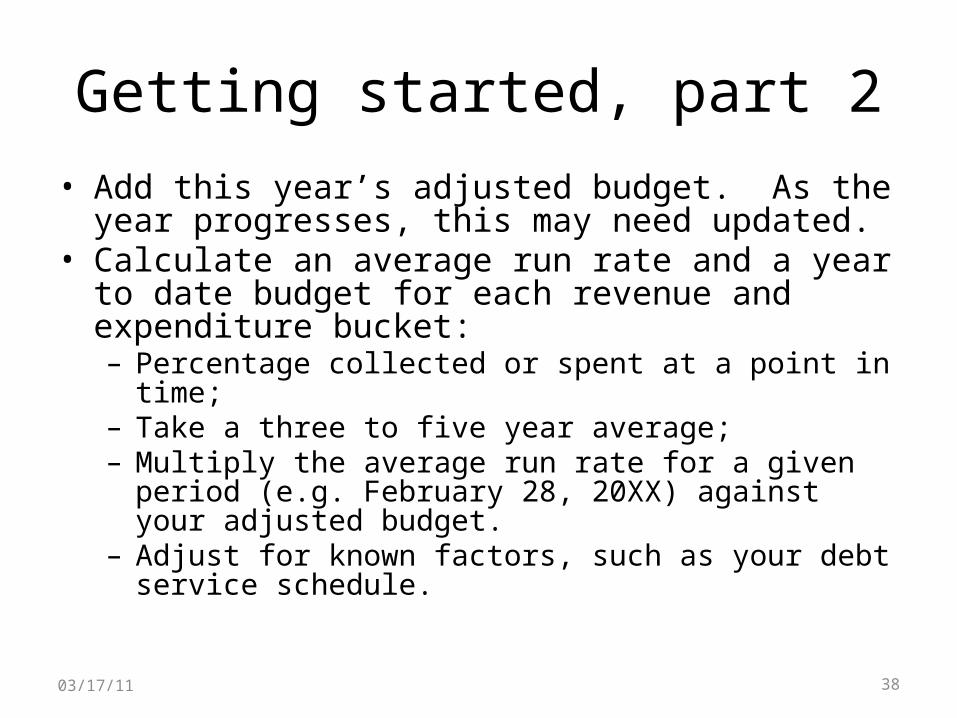
Getting started, part 2• Add this year’s adjusted budget. As the year progresses,
this may need updated.• Calculate an average run rate and a year to date budget for
each revenue and expenditure bucket:– Percentage collected or spent at a point in time;– Take a three to five year average;– Multiply the average run rate for a given period (e.g. February
28, 20XX) against your adjusted budget.– Adjust for known factors, such as your debt service schedule.

3903/17/11
Getting started, part 3
• Compare your year to date budget versus your year to date actual.
• This will tell you, your Board and your constituents not just what the year to date is against the adopted or adjusted budget, but what it is versus what it should be at a point in time.

4003/17/11
Suggested analytical reports
• All in addition to, not a replacement for, your traditional reports:– Year to date budget to actual detail;– Year to date budget to actual summary;– Key financial indicators/dashboard;– Financial statement highlights.

4103/17/11
Sample Board report – YTD detailCENTENNIAL SCHOOL DISTRICTYEAR TO DATE BUDGET TO ACTUAL ANALYSIS - DETAILAS OF FEBRUARY 28, 2011
2007/08 2008/09 2009/10 2010/11 2007/08 2008/09 2009/10 2010/11 2010/11 VarianceFinal Final Final Budget YTD Actual YTD Actual YTD Actual YTD Budget YTD Actual
Revenues and Other Sources
6000 Local Revenue 6111 Current Real Estate Taxes 47,024,298 47,688,123 51,319,269 54,086,228 47,228,197 47,777,384 51,422,871 54,234,543 54,297,373 62,830 6112 Interim Real Estate Taxes 259,443 82,008 172,698 158,500 7,403 692 19,687 7,976 5,543 (2,433) 6113 Public Utility Realty Tax 68,957 72,633 79,788 80,000 68,957 72,633 79,788 80,000 81,143 1,143 6114 Pymt In Lieu Of Taxes 1,829,434 2,196,721 2,257,057 3,034,738 878,377 1,081,349 1,049,330 1,453,946 1,299,468 (154,478) 6143 Occupation Privilege Tax 61,673 74,445 87,521 75,000 14,388 32,686 40,165 28,282 40,181 11,899 6151 Earned Income Tax 3,934,124 3,428,603 3,635,153 3,850,000 1,730,486 1,720,524 1,669,470 1,797,870 1,586,811 (211,059) 6153 Real Estate Transfer Tax 1,615,513 867,148 755,687 1,000,000 1,061,131 637,595 418,174 648,495 452,684 (195,811) 6155 Business Privilege Tax 925,719 922,433 982,381 1,000,000 858,306 869,113 916,217 934,008 723,350 (210,658) 6157 Mercantile Tax 573,523 550,578 520,218 625,000 534,993 549,936 524,207 612,358 403,076 (209,282) 6411 Delinquent Real Estate Taxes 1,264,493 1,554,363 1,224,927 1,500,000 526,038 15,040 113,499 259,171 122,000 (137,170) 6451 Delinquent Earned Income Tax 558,083 872,026 637,134 550,000 85,405 66,054 121,002 76,761 100,160 23,400 6465 Delinq Business Taxes 473,672 542,046 309,977 450,000 378,359 416,794 198,107 331,021 316,098 (14,923) 6510 Investment Earnings 1,300,001 882,034 236,901 900,000 614,173 506,007 131,531 480,401 111,680 (368,721) 6710 Gate Receipts 13,917 49,952 37,756 50,000 11,349 41,416 32,479 41,747 33,633 (8,114) 6832 Revenue Received As IDEA PassThru 1,164,562 1,142,743 1,097,670 1,439,474 - 559,681 535,425 469,054 327,951 (141,103) 6839 Federal Revenue Received From Other Intermediary Sou 7,635 8,490 - - - 9,197 - - - - 6910 Rent From Facilities 494,065 452,474 193,025 254,669 116,488 101,323 96,974 81,672 311,091 229,419 6920 Grant Proceeds-private - - - - 397 - - - 1,329 1,329 6941 Regular Day Sch Tuition 5,177 - 15,137 - 3,177 - 15,137 - 10,486 10,486 6944 Tuition From Other Lea's 631,398 659,576 661,768 400,000 631,398 709,874 590,823 395,874 91,883 (303,991) 6999 All Other Revenues Not Specified Above 18,011 16,310 14,481 16,000 15,176 13,367 10,615 12,774 9,489 (3,285) 6000 Function (R) Sub Total 62,223,698 62,062,706 64,238,548 69,469,609 54,764,199 55,180,666 57,985,501 61,945,953 60,325,429 (1,620,524)

4203/17/11
Sample Board report – YTD summaryCENTENNIAL SCHOOL DISTRICTYEAR TO DATE BUDGET TO ACTUAL ANALYSIS - SUMMARYAS OF FEBRUARY 28, 2011
2010/11 2010/11 2010/11 VarianceBudget YTD Budget YTD Actual
6000 Local Revenue 69,469,609 61,945,953 60,325,429 (1,620,524) 7000 State Subsidies 23,692,641 14,129,952 12,758,384 (1,371,568) 8000 Federal Programs 2,937,812 1,636,332 2,205,734 569,401 9000 Other Financing Sources 741,013 - - -
Total Revenues 96,841,075 77,712,238 75,289,547 (2,422,691)
100 Wages and Salaries 54,947,325 31,336,106 28,148,036 (3,188,070) 200 Employee Benefits 16,167,042 10,060,366 8,432,033 (1,628,333) 300 Purchased Profession & Tech Svcs 4,511,900 2,885,265 2,548,055 (337,211) 400 Purchased Services/Maintenance 2,517,204 1,561,859 1,246,565 (315,293) 500 Other Purchased Services 5,865,216 3,689,050 3,033,580 (655,470) 600 Supplies/Food 2,927,148 2,032,786 1,737,328 (295,458) 700 Equipment and Property 566,818 527,537 228,686 (298,851) 800 Dues/Fees/Interest on Debt 6,416,352 3,039,964 3,024,640 (15,325) 900 Debt Principal Pymts & Fund Transfs 2,971,226 2,706,952 2,706,952 -
Total Expenditures 96,890,231 57,839,885 51,105,876 (6,734,009)
Excess/(Deficiency) of Revenues over Expenditures (49,156) 19,872,353 24,183,671 4,311,318
Net reclassifications for Audited Statements -
Change in Fund Balance (49,156) 19,872,353 24,183,671 4,311,318
cmb3/7/2011

4303/17/11
Sample report - DashboardCENTENNIAL SCHOOL DISTRICTKEY FINANCIAL INDICATORSAS OF FEBRUARY 28, 2011
2009/10 2010/11YTD YTD Variance
General Fund Cash & Investments 27,539,059.90 32,037,554.20 4,498,494.30
GF Unreserved Fund Balance,Plus Net Budgetary Control Accounts 27,941,235.77 33,844,777.68 5,903,541.91
2010/11 2010/11YTD Budget YTD Actual Variance
General Fund Revenues 77,712,238 75,289,547 (2,422,691)
General Fund Expenditures 57,839,885 51,105,876 (6,734,009)
cmb3/7/2011

4403/17/11
Sample report - Highlights

4503/17/11
Multiple year “budgeting”
• Year to date budget to actual layout becomes the basis for high level analysis of future years.
• Run rates can be used to project year end totals.
• Requires a table of assumptions to roll forward.
• Consider reporting out to your Board and public monthly.

4603/17/11
Sample report – Rolling forecast

Zero Based Budgeting Defined (a)
• Zero-based budgeting is a technique of planning and decision-making which reverses the working process of traditional budgeting
• A budgeting technique that generally attempts to analyze budget requests without an implicit commitment to sustaining past levels of funding
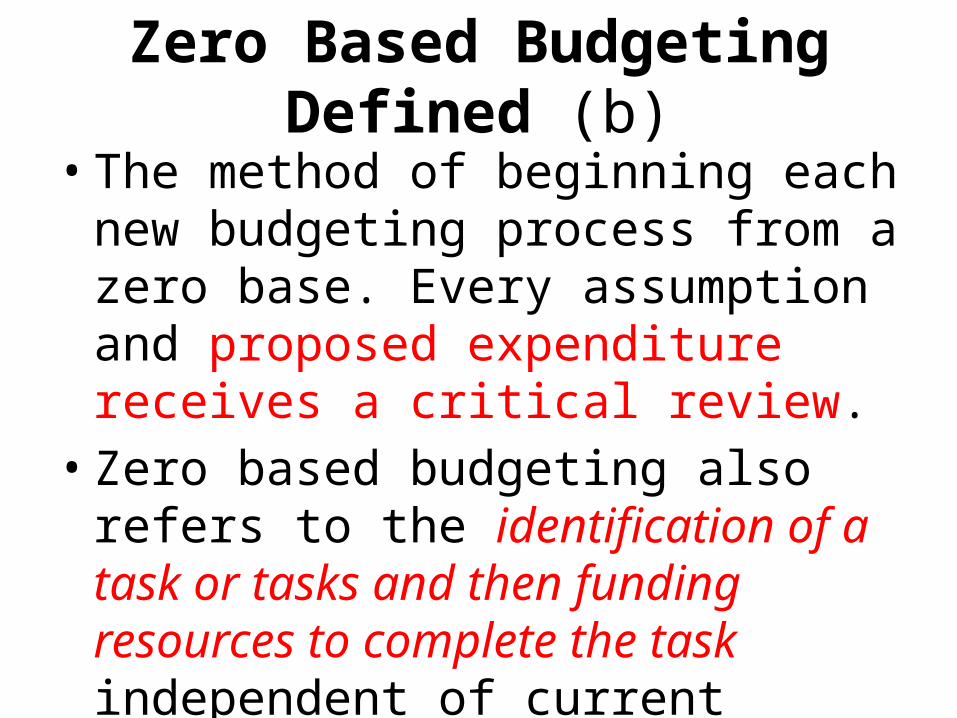
Zero Based Budgeting Defined (b)• The method of beginning each new
budgeting process from a zero base. Every assumption and proposed expenditure receives a critical review.
• Zero based budgeting also refers to the identification of a task or tasks and then funding resources to complete the task independent of current resourcing

Zero Based Advantages (1)
• Efficient allocation of resources, as allocation is based on Vetted needs and Measured benefits
• Drives managers to find cost effective ways to improve operations.
• Detects inflated budgets / prevents inflated budgets.
• Useful for service departments where the output is difficult to identify
• Increases staff motivation by providing greater initiative and responsibility in decision-making.

Zero based Advantages (2)
• Increases communication and coordination within the organization.
• Identifies and eliminates wasteful and obsolete operations.
• Identifies opportunities for outsourcing.• Identifies areas of opportunity • Identifies alternative courses of action• Forces cost centers to identify their mission and their
relationship to overall goals. Alignment.• Requires Trust

Disadvantages of Zero-based Budgeting (1)
• Difficult to change culture, implementation can be time-consuming and exhaustive.
• Takes time to justify detail related to expenditure(s).• Department ‘A’ may feel threatened whereas
Department ‘B” appears to benefit.• Necessary to train staff & managers. Zero-based
budgeting must be clearly understood by managers at various levels to be successfully implemented.
• Difficult to administer and communicate budgeting because more staff often involved in the process.

Disadvantages of Zero-based Budgeting (2)
• In large organizations, volume of forms may be significant. Compressing the information down to usable size might remove critically important details.
• Honesty of the managers must be reliable and uniform. Any manager that exaggerates skews the results.
• Requires Trust
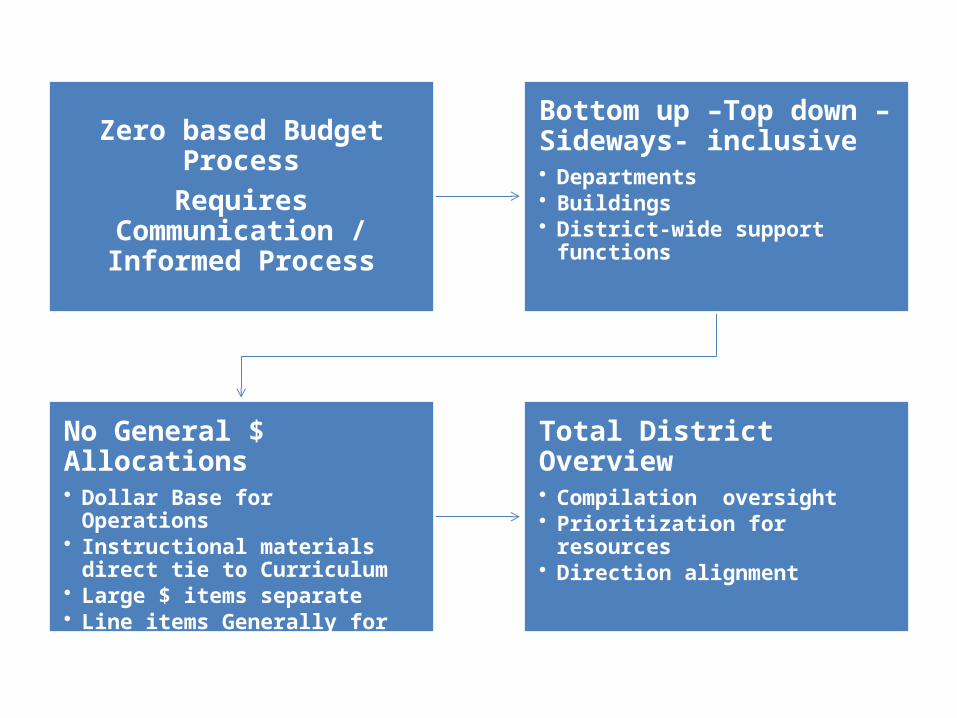
Zero based Budget ProcessRequires Communication /
Informed Process
Bottom up –Top down – Sideways- inclusive• Departments• Buildings• District-wide support functions
No General $ Allocations• Dollar Base for Operations• Instructional materials direct tie to
Curriculum• Large $ items separate• Line items Generally for ‘things’...not
$’s
Total District Overview• Compilation oversight• Prioritization for resources• Direction alignment

Departmental Budget
All Teachers / Staff
Dept Chairs
Principal(s)
Defense
Budget ProcessSuperintendent Assistant Superintendent High School Principal
Business Manager

All Teachers / Staff Dept Chairs
Principal(s) Board / Central office
Curricular Direction / Educational objectives

District
School
Department
Grade
Class
Student
Data Alignment– Must encompass all
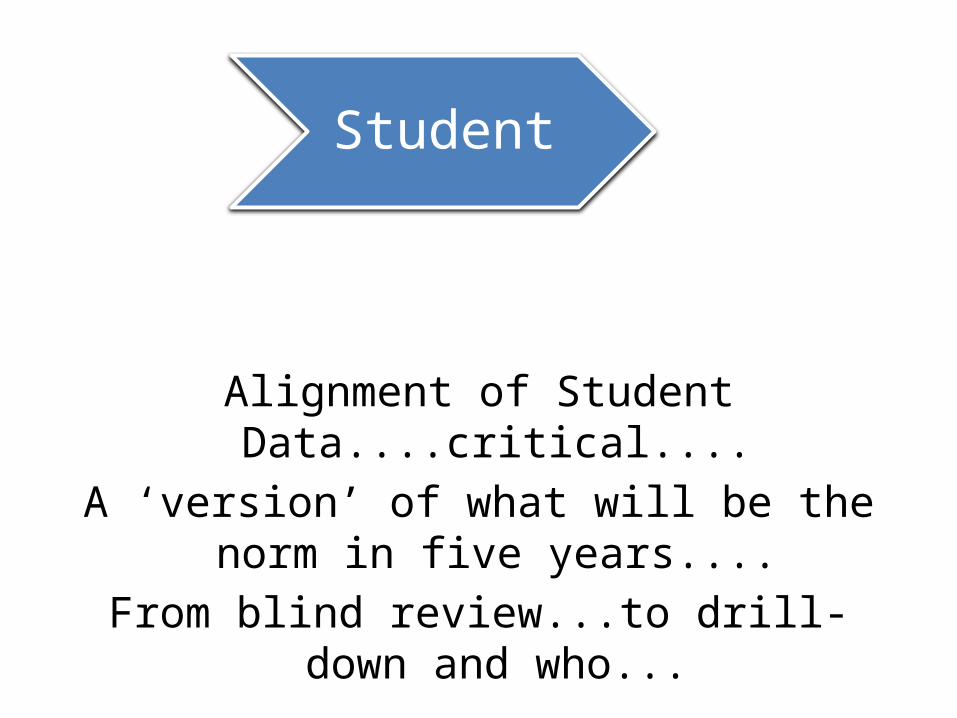
Alignment of Student Data....critical....A ‘version’ of what will be the norm in five
years....From blind review...to drill-down and who...
Student


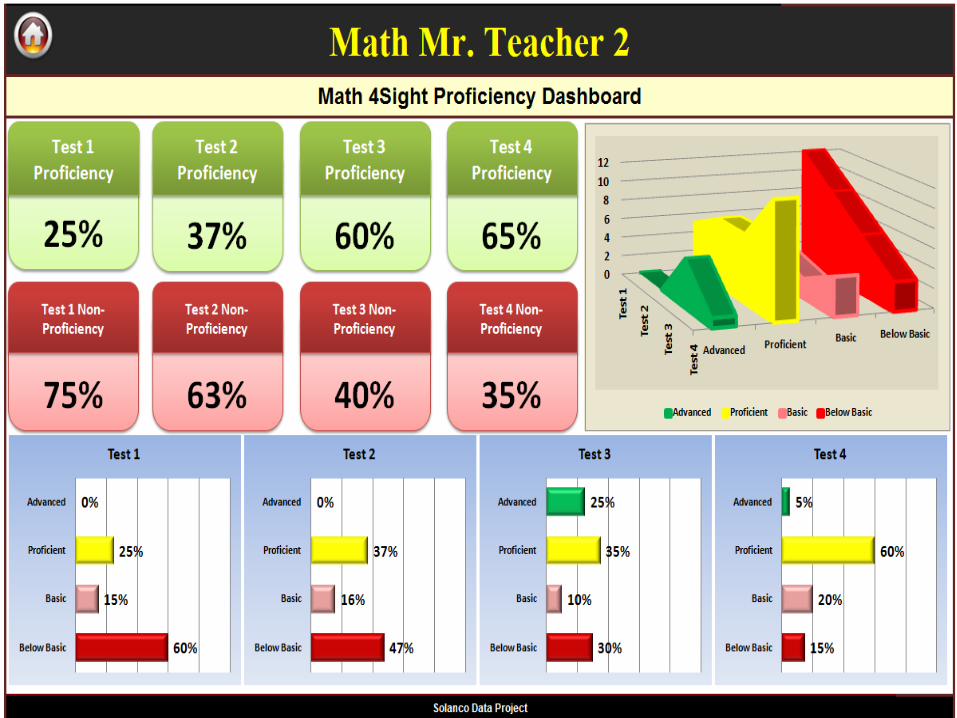

K-5 Math Revision
Objectives: Author timelines, content maps, assessments
Costs:• $50,000 for substitute costs over 3 years for
writing• $260,000 for texts/materials grades K-5• Time during in-service days for review and
evaluation

K-5 Math Revision
• Common curriculum, timeline, and assessments allow for principal monitoring of curriculum implementation ( e.g. Test results at the elem level grade 5 math)
• Fidelity of curriculum implementation allows for collection of “better” data...”merging grade levels at next school level”
• Sound data-collection tools allow for evaluation of the impact of these expenditures

Full-Day Kindergarten
• Program offered to 1/3 of incoming kindergarteners (90 out of 270)
• Program costs roughly $350,000 funded by ABG and district funds
• Significant materials investment
• Significant challenge finding open classrooms (feasibility study)

Full Day Kindergarten Half Day Kindergarten0
10
20
30
40
50
60
70
80
90
100
11
64
Beginning of Kindergaten

Beginning of Kindergaten End of Kindergarten0
10
20
30
40
50
60
70
80
90
100
Full Day vs Half Day Kindergarten
FDK HDK

Beginning of Kindergaten
End of Kindergarten End of 1st Grade0
10
20
30
40
50
60
70
80
90
100
Full Day vs Half Day Kindergarten
FDK HDK
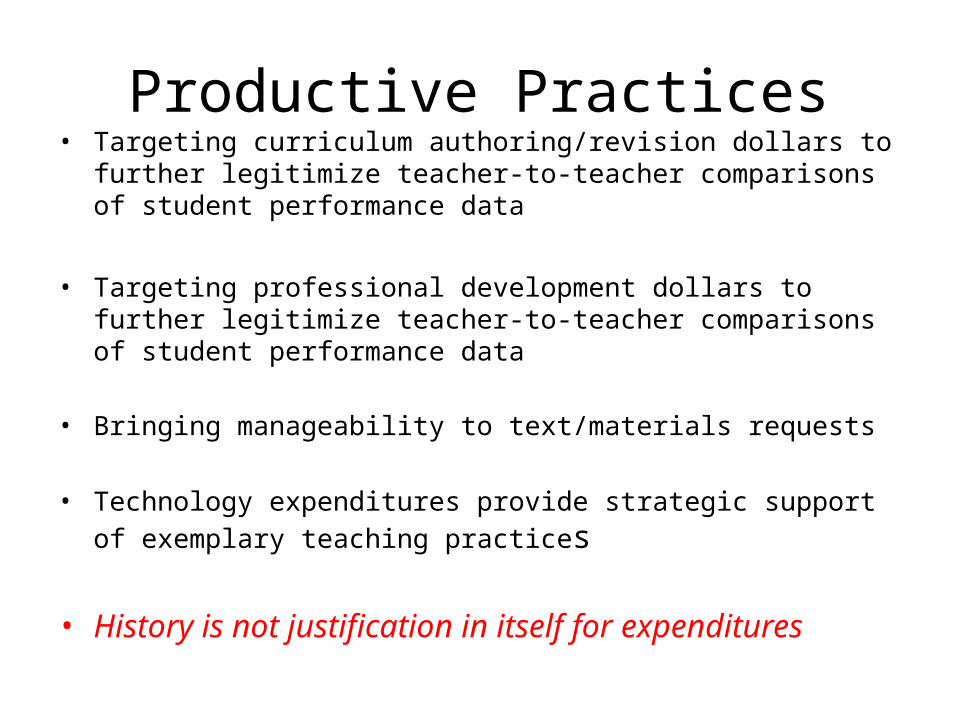
Productive Practices• Targeting curriculum authoring/revision dollars to further
legitimize teacher-to-teacher comparisons of student performance data
• Targeting professional development dollars to further legitimize teacher-to-teacher comparisons of student performance data
• Bringing manageability to text/materials requests
• Technology expenditures provide strategic support of exemplary teaching practices
• History is not justification in itself for expenditures

Non-Productive Practices• School boards are asked to approve new programs or positions without being
given sound data-based rationales for their need.
• School boards are asked to approve new programs or positions without being given sound data-based goals and a schedule for reporting back to them with results aligned to these benchmarks.
• Long-standing programs are not evaluated at all or are evaluated in a cursory fashion.
• Districts are investing in professional development without data-based frameworks for measuring impact.
• Large textbook purchases are authorized without having supporting student performance data as a rationale.
• Districts are buying a lot of technology without a specific tie-in to district initiatives (and those district initiatives should be informed by student performance data).
Appendix Data - Examples and Related
Information
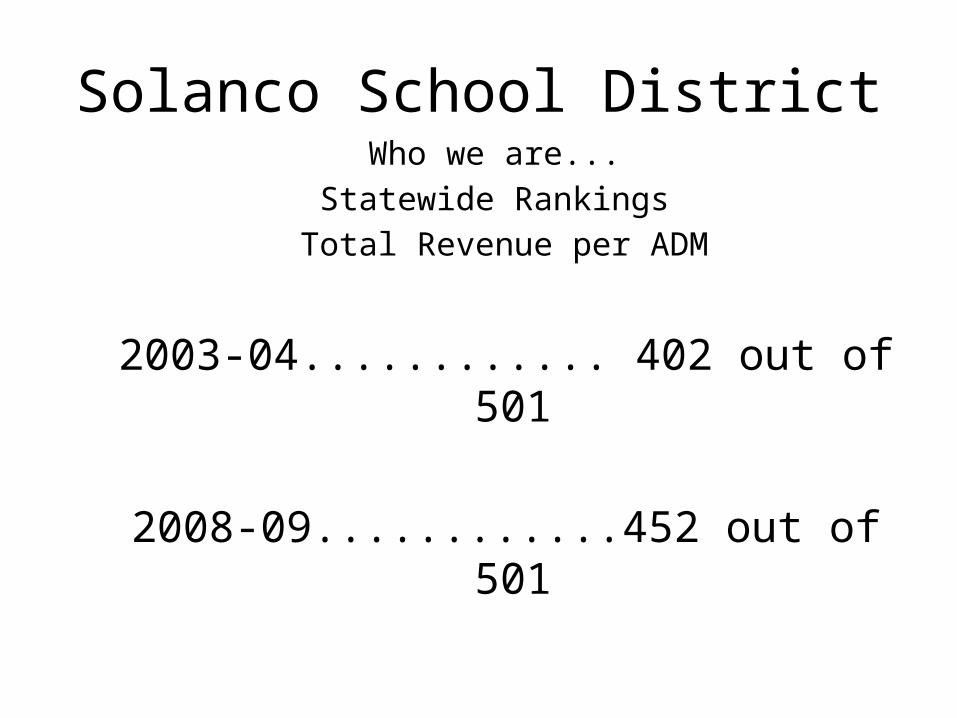
Solanco School DistrictWho we are...
Statewide Rankings Total Revenue per ADM
2003-04............ 402 out of 501
2008-09............452 out of 501

Solanco School DistrictWho we are...
Statewide Rankings EM
2003-04............ 488 out of 501
2008-09............452 out of 501

SOLANCO SCHOOL DISTRICT121 S. Hess St., Quarryville, PA 17566-1200
BID TABULATION2010-11 - IU JOINT PURCHASING INSTRUCTIONAL SUPPLIES
Bid Award: May 2010
RECAP RECAP - COPY PAPER ONLYSCHOOL
YEARALL INSTR. SUPPLIES
2010-11 108,163.50
2009-10 108,679.72
2008-09 107,611.91
2007-08 94,990.53
2006-07 60,929.98
2005-06 87,135.13
2004-05 74,666.71
2003-04 95,843.84
2002-03 101,310.20
2001-02 92,349.03
2000-01 90,838.45
1999-00 81,079.65
1998-99 91,947.44
1997-98 58,840.88
1996-97 78,313.23
1995-96 86,995.56
1994-95 53,802.43
RECAP
SCHOOL YEARCUSTODIAL SUPPLIES
2010-2011 $20,627.282009-2010 $36,785.522008-2009 $42,805.032007-2008 $42,796.712006-2007 $27,469.992005-2006 $26,659.852004-2005 $20,384.622003-2004 $21,899.772002-2003 $19,946.372001-2002 $16,585.782000-2001 $21,411.211999-2000 $25,892.361998-99 $24,937.991997-98 $27,522.131996-97 $28,693.651995-96 $26,338.031994-95 $25,810.361993-94 $18,655.151992-93 $18,499.251991-92 $14,973.101990-91 $22,287.791989-90 $30,568.84
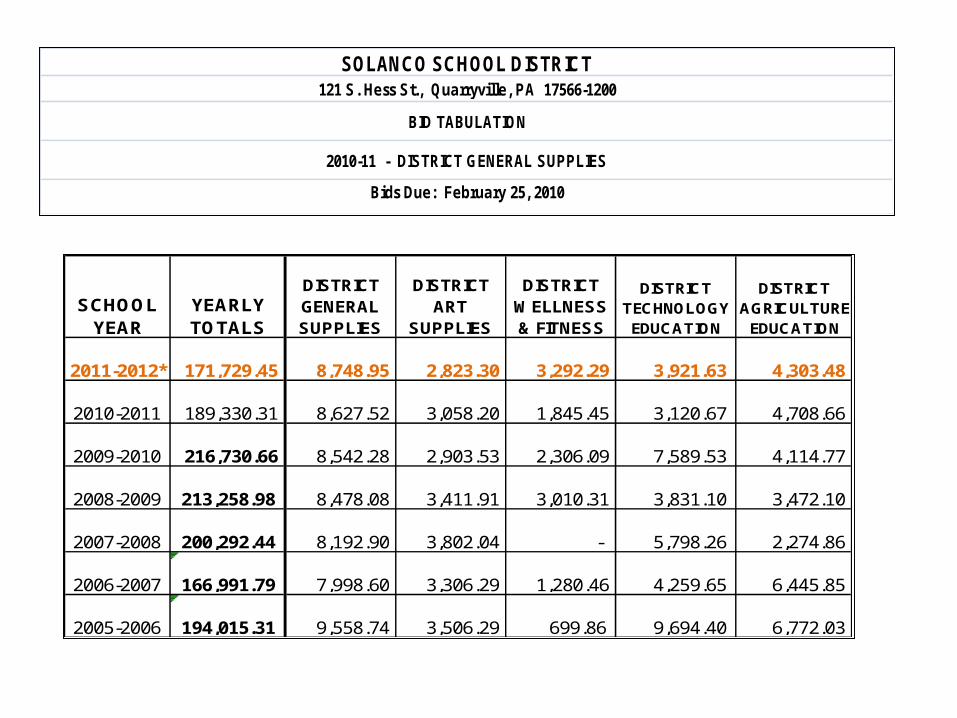
SCHOOL YEAR
YEARLY TOTALS
DISTRICT GENERAL SUPPLIES
DISTRICT ART
SUPPLIES
DISTRICT WELLNESS & FITNESS
DISTRICT TECHNOLOGY EDUCATION
DISTRICT AGRICULTURE
EDUCATION
2011-2012* 171,729.45 8,748.95 2,823.30 3,292.29 3,921.63 4,303.48
2010-2011 189,330.31 8,627.52 3,058.20 1,845.45 3,120.67 4,708.66
2009-2010 216,730.66 8,542.28 2,903.53 2,306.09 7,589.53 4,114.77
2008-2009 213,258.98 8,478.08 3,411.91 3,010.31 3,831.10 3,472.10
2007-2008 200,292.44 8,192.90 3,802.04 - 5,798.26 2,274.86
2006-2007 166,991.79 7,998.60 3,306.29 1,280.46 4,259.65 6,445.85
2005-2006 194,015.31 9,558.74 3,506.29 699.86 9,694.40 6,772.03
SOLANCO SCHOOL DISTRICT121 S. Hess St., Quarryville, PA 17566-1200
BID TABULATION
2010-11 - DISTRICT GENERAL SUPPLIES
Bids Due: February 25, 2010

GENERAL BUDGET INSTRUCTIONS 1. Budget requests must be based on actual needs to
support the educational program in existence or being planned for the next school year.
2. Since funds are always limited, priorities must be established within departments, subject areas, school buildings and on a district-wide basis.
3. Requests must be based on updated inventories and projected use.
4. A request that is unusual or particularly costly in nature must be submitted to the assistant superintendent in advance of budget submission. All requests for textbooks, computer/technology equipment and calculators must be presented to the assistant superintendent in the same manner.

BUSINESS OFFICE USE
P.O. # ________________Teacher I ma T. Chur Date
Building High School Principal Mr. Gallagher
Subject Mathematics Lead Teacher Heda D. Grupe
Description of need/purpose: Additional textbooks & supplies f or growth in class enrollment.
Acount Code: 10 - 1100 - 640 - 000 - 30 - 810 - 170 - 000 - 0000 Amount $ 573.35
Acount Code: 10 - 1100 - 618 - 000 - 30 - 810 - 170 - 000 - 0000 Amount $ 225.00
Acount Code: 10 - 1100 - 610 - 000 - 30 - 810 - 170 - 000 - 0000 Amount $ 292.00
Acount Code: 10 -__ __ __ __ - __ __ __ - __ __ __ - __ __ - __ __ __ - __ __ __ - __ __ __ - 0000 Amount $________
Acount Code: 10 -__ __ __ __ - __ __ __ - __ __ __ - __ __ - __ __ __ - __ __ __ - __ __ __ - 0000 Amount $________
Acount Code: 10 -__ __ __ __ - __ __ __ - __ __ __ - __ __ - __ __ __ - __ __ __ - __ __ __ - 0000 Amount $________
Recommended Vendor (Name & Address) Check One
Textbooks & More Company Business Office to generate purchase order
123 Printway Road upon approval.
Black I nk, WI 53100 X Teacher/Department will initiate purchase order.
Vendor Phone: ( 809 ) 555 -- 4567 For Budget Purposes Only - No action taken
Vendor FAX: ( 809 ) 555 -- 5678 ____________ unless otherwise indicated.
Quantity Item Description, Catalog Number, Etc.Catalog
Page No.Unit
Price% Off (if price is discounted)
Total Price
SOLANCO SCHOOL DISTRICT2011-2012 BUDGET SUBMISSIONS

BUSINESS OFFICE USE
P.O. # _______________Teacher Ed U. Kater Date
Building Swif t Middle Principal Mrs. Herr
Subject Mathematics Lead Teacher Heda D. Grupe
Description of need/purpose: Equipment and materials f or instruction.
Acount Code: 10 - 1100 - 768 - 000 - 20 - 520 - 170 - 000 - 0000 Amount $ 1,259.00
Acount Code: 10 - 1100 - 618 - 000 - 20 - 520 - 170 - 000 - 0000 Amount $ 170.00
Acount Code: 10 - 1100 - 438 - 000 - 20 - 520 - 170 - 000 - 0000 Amount $ 35.00
Acount Code: 10 -__ __ __ __ - __ __ __ - __ __ __ - __ __ - __ __ __ - __ __ __ - __ __ __ - 0000 Amount $________
Acount Code: 10 -__ __ __ __ - __ __ __ - __ __ __ - __ __ - __ __ __ - __ __ __ - __ __ __ - 0000 Amount $________
Acount Code: 10 -__ __ __ __ - __ __ __ - __ __ __ - __ __ - __ __ __ - __ __ __ - __ __ __ - 0000 Amount $________
Recommended Vendor (Name & Address) Check One
XYZ Computer Co. X Business Office to generate purchase order
111 Process Avenue upon approval.
Lancaster, PA 17604 Teacher/Department will initiate purchase order.
Vendor Phone: ( 717 ) 555 -- 1234 For Budget Purposes Only - No action taken
Vendor FAX: ( 717 ) 555 -- 0123 ____________ unless otherwise indicated.
Quantity Item Description, Catalog Number, Etc.Catalog
Page No.Unit
Price% Off (if price is discounted)
Total Price
SOLANCO SCHOOL DISTRICT2011-2012 BUDGET SUBMISSIONS

• INVESTMENT IN PROFESSIONAL DEVELOPMENT
• INVESTMENT IN NEW PROGRAMMING
• INVESTMENT IN TEXTBOOKS/MATERIALS
Three Alignment Protocols

ALIGNMENT PROTOCOL: INVESTMENT IN PROFESSIONAL DEVELOPMENT (1)
• What is the purpose of this professional development?
• What specific skills are teachers going to develop as a result of this professional development?
• Delineate the specific cost involved to engage in this professional development, from introduction to full implementation.
• How are the skills learned during this professional development going to be implemented?
• Are there products to be developed during this professional development? If so, what?

ALIGNMENT PROTOCOL: INVESTMENT IN PROFESSIONAL DEVELOPMENT (2)
• What monitoring protocols are in place to ensure the skills learned are being applied/implemented?
• What data based goals inform the need for this professional development?
• How are these skills going to improve student performance, specifically?
• What research supports the belief that this professional development will improve student performance data?

ALIGNMENT PROTOCOL: INVESTMENT IN NEW PROGRAMMING (1)
• What is the program being proposed?• What is the cost breakdown of this program?• What specific student performance data results
support the need for this program?• Describe how this need is not being met by current
programming.• What steps could be taken to improve current
programming to meet this need?• To what extent have these steps been taken, and why
were they unsuccessful?

ALIGNMENT PROTOCOL: INVESTMENT IN NEW PROGRAMMING (2)
• What are the student performance data outcomes intended to be achieved with this new program?
• How will this data be collected, analyzed, and presented?
• What are the intermediate data targets for the program?
• When will these intermediate data reports be presented to the board?
• What steps would be taken should the intermediate data targets not be met?

ALIGNMENT PROTOCOL: INVESTMENT IN NEW PROGRAMMING (3)
• At what point could a summative evaluation of the success of the program be made?
• What student performance data would result in a conclusion that the program is a success?
• If summative data targets are not met, what steps would be next?

ALIGNMENT PROTOCOL: INVESTMENT IN TEXTBOOKS/MATERIALS (1)
• The proposed materials purchases are:_____ Replenishment of current materials_____ New, different materials than those currently used

ALIGNMENT PROTOCOL: INVESTMENT IN TEXTBOOKS/MATERIALS (2)
• Replenishment• How are the current materials being used, specifically?• Are these materials currently being employed consistently by
all teachers using them?• How do you know?• To what student performance goals do these materials
contribute?• How do they contribute to these student performance goals?• What steps must be taken to better measure the impact of
this materials purchase on student performance?• If these materials were not purchased, how would student
performance be affected, specifically?

ALIGNMENT PROTOCOL: INVESTMENT IN TEXTBOOKS/MATERIALS (3)
New Materials • What materials are in place/these are replacing?• How are the current materials being used,
specifically?• What evidence do you have that the current
materials are ineffective OR that the new materials will be more effective?
• Delineate the specific student performance data that leads you to the above conclusion.
• What does exemplary use of these materials look like?

ALIGNMENT PROTOCOL: INVESTMENT IN TEXTBOOKS/MATERIALS (4)
New Materials • What student performance goals are expected to be
supported by these materials?• What is the baseline data upon which you will evaluate
the impact of these materials?• Delineate a schedule for data reporting that you will
adhere to in order to measure the impact of these materials—what data will you collect, at what intervals, and what results would be considered positive?
• If these materials were not purchased, how would student performance be affected, specifically?

Once upon a time....
In pasboland a long time ago......sage
ciphers of this master guild...balanced the
ledgers of great learning centers...

...And will do so again....
...believe in yourself...go do
great things for kids.

..and they all lived happily Ever After...
The End