partnership for hiv free survival health … assist project phfs health facility coaching guide:...
TRANSCRIPT

USAID ASSIST Project PHFS Health Facility Coaching Guide: First Visit Page 1 of 13
PARTNERSHIP FOR HIV FREE SURVIVAL HEALTH FACILITY COACHING GUIDE: FIRST VISIT (MAY 2013) BRIEFLY INTRODUCE ASSIST PROJECT AND TEAM
The Ministry of Health with financial support from the United States Agency for International Development (USAID) has been implementing Quality of Care Initiative in HIV/AIDS since November 2005 with support from the USAID Health Care Improvement (HCI) project. In 2012, a follow‐on project to HCI called USAID ASSIST (Applying Science to Strengthen and Improve Systems) was awarded to work with and support the Ministry of Health and USG partners to improve the quality of care in HIV/AIDS care and treatment, PMTCT (including the Partnership for HIV Free Survival), SMC, HTC, and HIV TB, OVC, integrating FP into HIV and MNCH.
INTRODUCTION TO THE PARTNERSHIP FOR HIV‐FREE SURVIVAL (PHFS)
To support the Ministry of Health goal of elimination of new HIV infections among children by 2015 and Keeping their Mothers Alive, PEPFAR and other technical partners are supporting national efforts to develop and scale up an effective campaign to provide optimal nutrition for infants and to protect those infants from HIV infection. Together, the effectiveness of antiretroviral drugs (ARV) to reduce HIV transmission and the benefit of breastfeeding to reduce deaths due to malnutrition, diarrhoea and pneumonia represent an exceptional opportunity to improve HIV‐free survival of infants born to HIV‐infected mothers.
Using quality improvement (QI) methods, the PHFS will support existing country‐specific protocols and the ongoing Nutrition Assessment Counseling and Support (NACS) activities to achieve 4 essential steps of postnatal mother‐infant care that results in excellent nutritional and HIV care for both the HIV‐exposed and non‐exposed infants over the first 24 months of life.
WHAT IS THE COACH EXPECTED TO ACHIEVE DURING AND AFTER THIS FIRST VISIT? Collect baseline data on retention of mother‐baby pairs in care and assess data quality (accuracy and completeness) Train teams on how to fill out and use data tools : Early Infant Diagnosis (EID) cards, EID registers, EID appointment book, etc. Teach and assess for core Quality Improvement activities at each visit (these will be discussed and agreed upon prior to each coaching visit) Guide the team to come up with improvement projects on retention of mother‐baby pairs in PMTCT care and data quality Review data completion and accuracy for all the relevant details and support the team to come up with ideas for improving this Review the previous action plans and report to determine what changes were (or were not) implemented; determine specific progress and results made with
regards to integrating nutrition into HIV/AIDS services; review site‐level data with the team, and develop a specific action plan to address how to improve results.
WHAT PREPARATION IS NEEDED PRIOR TO A COACHING VISIT? Prior to the coaching visit the coaches should:
1. Contact the site QI teams and agree on a date and time for the coaching visit (each coaching visit will take a maximum of 3 hours) 2. Review the site’s previously agreed action plan and focus on this for the visit 3. Before you meet with the site teams, pay a courtesy visit to the DHO and brief them about the purpose of the visit and share any progress 4. At the site, meet with Medical Superintendent or In‐Charge of the health facility, share purpose, schedule, duration and expected outcomes of visit.

USAID ASSIST Project PHFS Health Facility Coaching Guide: First Visit Page 2 of 13
SECTION 1. GENERAL INFORMATION Site Name, District and Region: _________________________________________________ Date: _____/______/_______
QI Coaches: No. Name Type of coach(Central, Regional, District) Telephone1. 2. 3. 4
Names of site personnel attending meeting with coaches:
Surname Other Names Job Title Responsibility at the facility
Telephone E: mail
NB: Responsibility at the facility e.g. in‐charge, counselor, triage nurse, clinician, dispenser, laboratory work, PMTCT nurse etc.

USAID ASSIST Project PHFS Health Facility Coaching Guide: First Visit Page 3 of 13
SECTION 2: BASELINE DATA ON AREAS OF FOCUS There are two areas of focus for improvement which we would like the QI teams to get started on first. Before the training and coaching session begins the coach should collect baseline data on the following areas: Focus Area 1: Retention of mother‐baby pairs in care for the month of April 2013 The numerator is: The number of mother‐baby pairs who kept their appointments for April. To get this numerator: Use the EID appointment book which gives you the number of exposed infants who kept their appointments in April Find the ART number of the exposed infant’s mother from the EID care card or EID register and trace her ART card to see if she received ART care at the same
visit). The denominator is: Mother –baby pairs expected to be accessing care in April 2013 (EID register is the data source) (To get this denominator you will need to establish the number of all the babies enrolled in the EID register 18 months before April; that is from 1st September 2011 to March 31st) Look at the EID number in the register from September 1st 2011 and look at the last EID number of infants enrolled on March 31st 2013, and then calculate
the number of infants who should be in care. For example if the last registered number of March 31st 2013 was 205 and the last registered number of September 1st 2011 was 029, subtract the 28 infants who were seen before September 1st, this will give you 177 infants expected to be accessing care.
Once you have this number you will have to subtract all deaths, transfers out and discharges (both positive and negatives) from the total number you get‐
this will give you the number of exposed infants (and their mothers) who should be coming in the month of April. Subsequently for the following months, you will need to keep adding the number of new enrollments in the EID register to give you the denominator for the
next month (i.e. the figure you get for March plus the new enrollments in April , (minus the deaths, transfers and discharges ) gives you the total number of infants and mothers expected in May.

USAID ASSIST Project PHFS Health Facility Coaching Guide: First Visit Page 4 of 13
Fill this information in the tables below EID number of last infant enrolled on March 31st, 2013
EID number of first infant enrolled on September 1st
Outcomes for the period of 1st Sept 2011 to Mar 31st, 2013 Tally Total Number CommentEID infants lost between 1st Sep 11 and 31st Mar 13 (A)EID infants enrolled who died between 1st Sep 11 and 31st Mar 13 (B) EID infants transferred out between 1st Sep 11 and 31st Mar 13 (C )
EID infants discharged negative between 1st Sep 11 and 31st Mar 13 (E)
EID infants discharged positive between 1st Sep 11 and 31st Mar 13 (F) EID infants active in care (kept at least 1 appointment between Jan‐March 2013) (G) The denominator Total number of infants who should be accessing care = Lost ( B)+Active (G) Total number of infants ever enrolled in EID care btn Sep 11 and March 13 ( D) D= (A+C+E+F+G)
Number of infants who kept their appointments for April 2013 (H) (EID appointment book)
Number of mothers of the infants in (H) who got ART in April (look for mother’s ART number and then check in the ART register or ART care card) (I)
The numerator is : I (mothers who received ART care and have babies in EID)
The proportion of mother‐baby pairs retained in care = I/G *100
To calculate the data for the May or subsequent months collect data on the following:
USAID ASSIST Project PHFS Health Facility Coaching Guide: First Visit Page 5 of 13
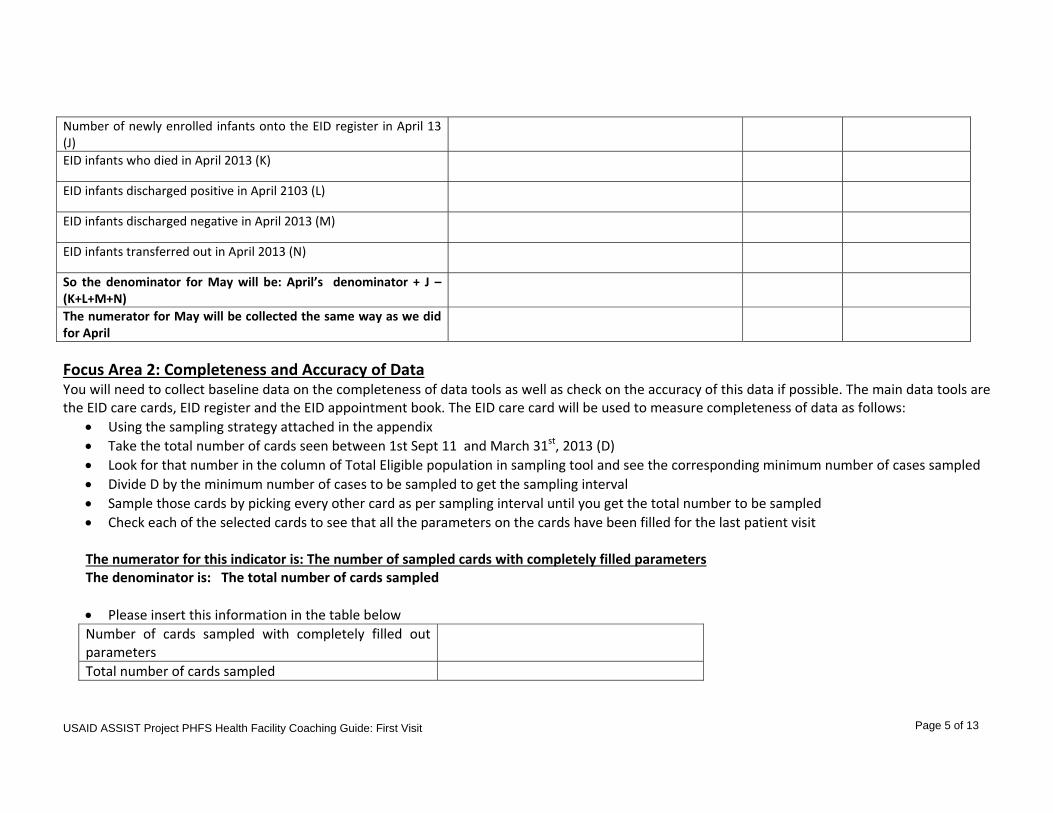
Number of newly enrolled infants onto the EID register in April 13 (J)
EID infants who died in April 2013 (K)
EID infants discharged positive in April 2103 (L)
EID infants discharged negative in April 2013 (M)
EID infants transferred out in April 2013 (N)
So the denominator for May will be: April’s denominator + J – (K+L+M+N)
The numerator for May will be collected the same way as we did for April
Focus Area 2: Completeness and Accuracy of Data You will need to collect baseline data on the completeness of data tools as well as check on the accuracy of this data if possible. The main data tools are the EID care cards, EID register and the EID appointment book. The EID care card will be used to measure completeness of data as follows:
Using the sampling strategy attached in the appendix Take the total number of cards seen between 1st Sept 11 and March 31st, 2013 (D) Look for that number in the column of Total Eligible population in sampling tool and see the corresponding minimum number of cases sampled Divide D by the minimum number of cases to be sampled to get the sampling interval Sample those cards by picking every other card as per sampling interval until you get the total number to be sampled Check each of the selected cards to see that all the parameters on the cards have been filled for the last patient visit The numerator for this indicator is: The number of sampled cards with completely filled parameters The denominator is: The total number of cards sampled Please insert this information in the table below Number of cards sampled with completely filled out parameters
Total number of cards sampled

USAID ASSIST Project PHFS Health Facility Coaching Guide: First Visit Page 6 of 13
Check the EID register and see whether the data is accurate and the register is completely and correctly filled. Make any observations below:
…………………………………………………………………………………………………………………………………………………………………………………………………...
…………………………………………………………………………………………………………………………………………………………………………………………………………………...
SECTION 3: TRAIN TEAMS HOW TO USE THE DATA TOOLS Train the team on the how to fill the EID registers, EID appointment book and EID care card. You could ask one of the team members who already knows how to use these tools to lead this exercise. Note any observations below.
……………………………………………………………………………………………………………………………………………………………………………………………………
……………………………………………………………………………………………………………………………………………………………………………………………………
……………………………………………………………………………………………………………………………………………………………………………………………………
……………………………………………………………………………………………………………………………………………………………………………………………………
SECTION 4: KEY QI COMPETENCIES Quality improvement (QI) team members need to have the knowledge, skills and attitudes to carry out particular improvement activities. There are 3 key QI activities that the coach must train the team in: I. Root cause analysis (problem identification) using the following QI tools the cause‐effect diagram, fishbone, process mapping, brainstorming II. Designing an improvement project III. Use of data for QI and the documentation journal
Refer to the slides in the appendix for each of these areas, you will need to repeat this exercise with the District Quality Improvement team

USAID ASSIST Project PHFS Health Facility Coaching Guide: First Visit Page 7 of 13
SECTION 5: COACH THE QI TEAM IN THE FOLLOWING AREAS: 5. 1. QI team functionality and composition
I. Review team functionality using the attached Team Maturity Index to score the level at which the team is ………………………………………………………………………………………………………………………………………………………………………………………………………… ……………………………………………………………………………………………………………………………………………………………………………………… ………………………………………………………………………………………………………………………………………………………………………………………
II. Team Composition Review the composition of the QI team, were any new members added, did any members leave? What are the roles and responsibilities on the QI team? Fill out the table below
Name of Team Members (New) or Team Member with change in Status
Role and responsibility on the QI team (team leader, secretary, member)
Position in the health facility (e.g. N.O, M.0, Lab, PMTCT FP)
New to Team? Y/N
Left Team? (Use one of these: Inactive; Formally Resigned; Other )

USAID ASSIST Project PHFS Health Facility Coaching Guide: First Visit Page 8 of 13
III. Has the QI team identified a quality gap for which changes are being implemented? [ ] Y [ ] N If, yes: a) mention the gaps that are currently being addressed.
a. Is data on the addressed gap regularly collected? [ ] Y [ ] N b. If No, what are the challenges with data collection and what has the team done to overcome them?
__________________________________________________________________________________________________________________ _________________________________________________________________________________________________________________ 5.2 Review of team’s previous work plan and implementation Review the team’s previous work plan if one was made and the progress made so far in implementing activities.
NO PLANNED ACTIVITY IMPLEMENTED (Y/N) COMMENTS1
2
3
4
5

USAID ASSIST Project PHFS Health Facility Coaching Guide: First Visit Page 9 of 13
5.3 Story Board (10 minutes) Review or discuss any stories about EMTCT service integration this month
Choose 2 people to tell the story of what they did. [Rotate who tells the story at coaching visits.] These could be normal or problematic. Ask them to talk about all the PMTCT service delivery steps and how they worked. Coaches should be listening for appropriate steps and to determine if there are any problems. Take a few notes below.
……………………………………………………………………………………………………………………………………………………………………………………………………
……………………………………………………………………………………………………………………………………………………………………………………………………
……………………………………………………………………………………………………………………………………………………………………………………………………
……………………………………………………………………………………………………………………………………………………………………………………………………
Briefly describe what happened and how this is different from what the clinic did before. [Ask them about the different service delivery steps, what is
new, how they know their actions helped the client.] Take a few notes including name, approximate date and place where this occurred.
……………………………………………………………………………………………………………………………………………………………………………………………………
……………………………………………………………………………………………………………………………………………………………………………………………………
……………………………………………………………………………………………………………………………………………………………………………………………………
……………………………………………………………………………………………………………………………………………………………………………………………………

USAID ASSIST Project PHFS Health Facility Coaching Guide: First Visit Page 10 of 13
6. USING THE DOCUMENTATION JOURNAL:
You will have to show the team how to fill documentation journals for the two improvement aims (Retention of mother‐ baby pairs in care and data completeness).
Each team must have two journals. Go through each component of the journal
……………………………………………………………………………………………………………………………………………………………………………………………………
……………………………………………………………………………………………………………………………………………………………………………………………………
……………………………………………………………………………………………………………………………………………………………………………………………………
……………………………………………………………………………………………………………………………………………………………………………………………………
7. SHARING CHANGES:
Share some of the following changes with the teams and agree on when and how they will be implemented. (Subsequently you will be provided with a change package for retention and improvement of data and you will guide the site teams to make a choice on what changes they would like to improve). Suggested changes are, but not limited to:
Use of the column in the EID appointment book to capture information on mothers who kept appointments ( divide the last column in the appointment book in 2; one column is ticked if the baby keeps their appointment and the other column is ticked if the mother picks her ART.
Keep mother and child’s care cards together Offer services at the MCH service point for both mother and baby instead of serving mother in ART and child in EID/MCH Give the same appointment dates for each mother –baby pair (each pair must be seen monthly)

USAID ASSIST Project PHFS Health Facility Coaching Guide: First Visit Page 11 of 13
8. ACTION PLAN
Develop an action plan for the current/ next month (Specify the month planned for)………………………………………………………………..
ACTION PLAN No
Quality Gap to addressed
Activity
Person Responsible
Time Frame
1
2
3
4
APPENDICES 1. QI team maturity index 2. Sampling strategy 3. QI training materials

USAID ASSIST Project PHFS Health Facility Coaching Guide: First Visit Page 12 of 13
QI Team Maturity Index Purpose: To monitor progress in team maturity as they work through the different stages of improvement and care steps for eMTCT Expectations:
At the end of each visit coaches will discuss and provide a score for the team. Coaches will review the team score as they are planning for the next visit The team will progress to a stage of maturity, working independently, at some point in their improvement work
Assessment/Description Definition 1.0
Forming Team Team has been formed and oriented on aims, target population Team has held discussions on a minimum of one of the PHFS areas
1.5 Planning for the improvement has begun, but no changes
Team is actively meeting and discussing Plans for testing changes have been made No tests of changes has begun Some baseline data may be collected
2.0 Changes tested, but no
improvement
Some changes are being tested to improve one or more areas of PHFS Data on key measures is being collected, analyzed and reported No improvement in measures seen yet
2.5 Changes tested, initial
improvement
Some changes are being tested in one or more of the PHFS areas Data on key measures is being collected, analyzed and reported Some evidence of initial improvement from sites based on simple indicators Able to describe what changes are being made and whether the change works
3.0
Modest Improvement
Change ideas tested, successful change ideas implemented for at least one of the PHFS areas Testing changes for at least two of the PHFS areas Data on key measures is being collected, analyzed and reported Evidence of moderate improvement in process measures supported by numeric data Able to describe what changes are being made and whether the change works
3.5
Improvement
Change ideas tested, successful changes implemented for at least three steps Testing changes and measuring numeric data for at least 2 areas Data on key measures is being collected, analyzed and reported Team shows ability to prioritize and analyze further details of the service delivery steps which are not showing improvement Evidence of significant improvement in at least three steps
4.0 Significant improvement
The indicators in the documentation journal shows that service delivery steps the team has worked on have improved The indicators in the documentation journal shows that the successful changes are now priority and they have started making
changes in the new steps Evidence of increased numbers of people being cured each month
4.5 Sustainable improvement
The indicators in the documentation journal shows that the steps that the team has previously worked on are showing sustained improvement at least 6 months after the team was focusing on the steps

USAID ASSIST Project PHFS Health Facility Coaching Guide: First Visit Page 13 of 13
Absolute number of mother‐baby pairs retained in treatment is significantly increased over baseline Teams are working on improvement projects beyond the PHFS areas
5.0 Outstanding sustainable
results
All steps are substantially better than at the beginning of the QI work Improvement work is continuing and no step has the worst indicator compared to 12 months previous All areas including HIV free survival is consistently over 95% Teams are working on improvement projects beyond the PHFS
Sampling Strategy Determining Sample Size (* based on sample size with 95% confidence interval); to be used to sample EID care cards to measure completeness of data
Total Eligible Population Minimum # of Cases SampledUp to 25 All
26‐30 2631‐40 3141‐50 3851‐60 4361‐70 4871‐80 5381‐90 5791‐100 61101‐119 67120‐139 73140‐159 78160‐179 82180‐199 86200‐249 94250‐299 101300‐349 106350‐399 110400‐449 113450‐499 116500‐749 127750‐999 1311000‐4999 1465000 or more 150
Steps in Quality Improvement for coaches’ reference
USAID ASSIST Project - Uganda
STEPS IN QUALITYSTEPS IN QUALITY IMPROVEMENT
1
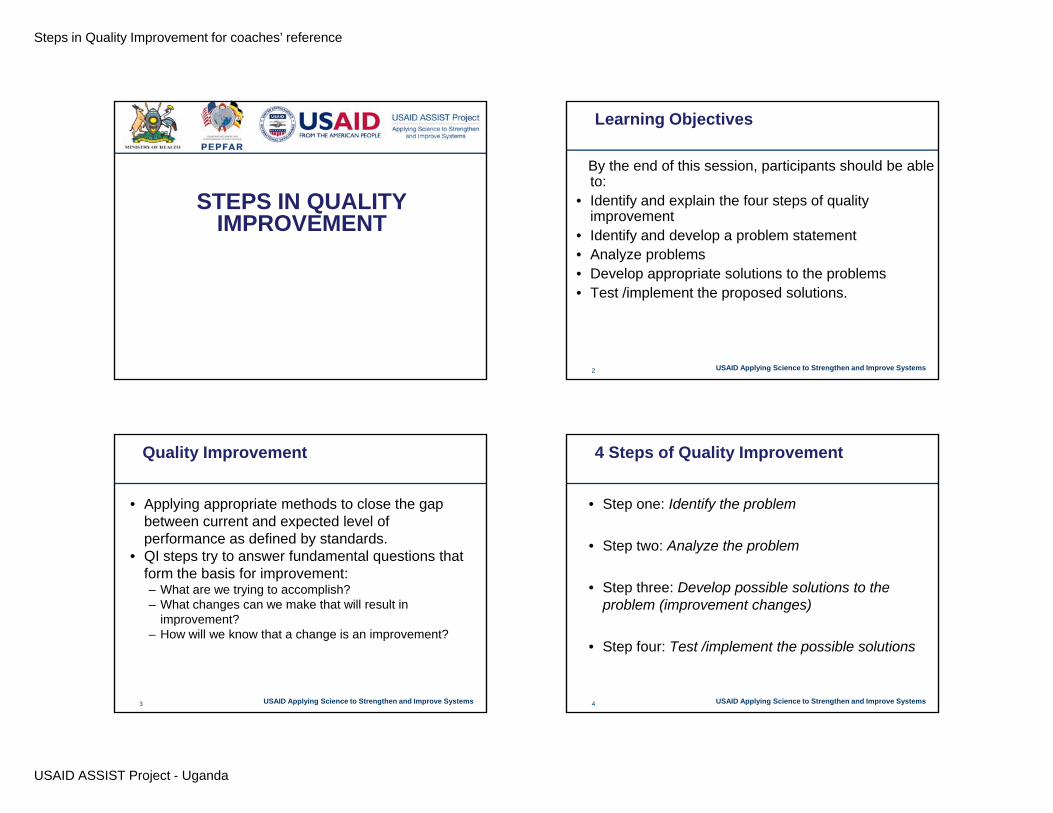
Learning Objectives
By the end of this session, participants should be able to:
• Identify and explain the four steps of quality improvement
• Identify and develop a problem statement• Analyze problems • Develop appropriate solutions to the problems
USAID Applying Science to Strengthen and Improve Systems
• Test /implement the proposed solutions.
2
Quality Improvement
• Applying appropriate methods to close the gap between current and expected level of pperformance as defined by standards.
• QI steps try to answer fundamental questions that form the basis for improvement: – What are we trying to accomplish?– What changes can we make that will result in
improvement?
USAID Applying Science to Strengthen and Improve Systems
improvement?– How will we know that a change is an improvement?
3
4 Steps of Quality Improvement
• Step one: Identify the problem
• Step two: Analyze the problem
• Step three: Develop possible solutions to the problem (improvement changes)
USAID Applying Science to Strengthen and Improve Systems
• Step four: Test /implement the possible solutions
4

Steps in Quality Improvement for coaches’ reference
USAID ASSIST Project - Uganda
Step 1: Identify the Problem
• QI starts by asking questions:– What is the problem?What is the problem? – How do you know that it is a problem? – How frequently does it occur, or how long has it existed? – What are the effects of this problem?
• Identify the gap- Difference between actual and desired performance
USAID Applying Science to Strengthen and Improve Systems
Difference between actual and desired performance • Ways of identifying the problem
- Use data from surveys, review records, observation, feedback from clients
5
Step 2: Analyze the Problem
• The purpose is to measure performance of the process or system that produces the effect.p y p
• Techniques include flow charts, cause-effect (fish bone) diagrams, review of existing data etc.
• Analysis involves answering the following questions; – Who is involved or affected?
USAID Applying Science to Strengthen and Improve Systems
– Why, when, where does the problem occur– What happens when the problem occurs?
6
Step 3: Develop the Change
• Changes are possible solutions to problems identified during process of quality improvement.
• Developed on basis of knowledge and beliefs about likely causes and solutions to the problem.
• QI teams should ask themselves the question: What changes can we make that will lead to
USAID Applying Science to Strengthen and Improve Systems
gimprovement?
• Possible solutions (proposed changes) are then developed based on the hypothesis.7
Step 4: Test and Implement
• Not every proposed solution (change) leads to improvement.p
• Test changes that are feasible, realistic and likely to lead to improvement.
• Test proposed solutions on a small scale to see if they lead to expected improvement.
• Changes tested need to be observed over some
USAID Applying Science to Strengthen and Improve Systems
Changes tested need to be observed over some time period to see if they are effective or not.
8

Steps in Quality Improvement for coaches’ reference
USAID ASSIST Project - Uganda
Testing Changes
• The process used to test proposed solutions (changes) is the PDSA Cycle.
• The Plan – Do – Study – Act cycle involves;– Plan: Includes what activity to be done, by
whom, when and resources required– Do: Execution of the plan
Study: Time has to be set aside to analyze the
USAID Applying Science to Strengthen and Improve Systems
– Study: Time has to be set aside to analyze the data and study the results
– Action: This has to be rationally based on what was learned
9
Step 4: Test = PDSA Cycle
Do:Test the solution;
Plan:Make a plan of Test the solution;
Document any changes;
Check that data is complete
Make a plan of action;
Collect baseline data;
Communicate change
USAID Applying Science to Strengthen and Improve Systems
Study:Review data,
compare result with baseline, standard
& target
Act:Discard solution, Modify solution,
Develop new solution;
Implement successful solution
10
Example PDSA Cycle 1Identified Problem: Poor Adherence (25%)
ExampleDo
Pl Conducted the CME
*** continued with Data collection
Plan• Conduct CME on
adherence• Who, when, where and
How CME ON ADHERENCE ASSESSMENT
USAID Applying Science to Strengthen and Improve Systems
StudyAdherence level went
from 25% to 65%)
ActEvery new staff monitoring patient adherence should have an orientation on adherence assessment
11
PDSA Cycle 2Change: Peer counseling by expert clients
Do• Hold the meetingsPlan Hold the meetings• Inform team• Collect data
• Meet expert clients• Introduce Idea• Identify who, when
and how• Inform ART team
about changes
expert clients to provide peer adherence counseling
USAID Applying Science to Strengthen and Improve Systems
StudyAdherence improves,
stagnating at 82%
Act• Kept the changes and
introduced more to reinforce these.
12

Steps in Quality Improvement for coaches’ reference
USAID ASSIST Project - Uganda
Repeated Use of the PDSA Cycle
• PDSA CycleP D
100%
Changes that result in improvement
P D
A S
P D
A S
P D
A S DATA
0%Cycle 3Wide scale tests
Cycle 4Implementation of change
USAID Applying Science to Strengthen and Improve Systems
P D
A S Cycle 2Follow up tests
of change
Cycle 1 very small scale change
Hunches Theories Ideas
13
Improving Adherence Monitoring
PDSA Cycle 82%
Changes that result in improvement
P D
P D
A S
P D
A S
P D
A SDATA
25%Cycle 3CME for all
Cycle 4Cont’d monthly CME & use of expert clients
65%
USAID Applying Science to Strengthen and Improve Systems
P D
A S Cycle 2expert clients to do peer adherence counseling
clinic staff on MOH HIV/AIDS tools
Cycle 1 CME on adherence assessment
Hunches Theories Ideas
14
Develop an improvement aim
• A good aim addresses an issue that is important to those involved; it is specific, measurable, and addresses these points:
I. How good?II. By when?III.For whom (or for what system)? Aim statements
contain:IV Specific numerical goals
USAID Applying Science to Strengthen and Improve Systems
IV.Specific numerical goalsV. A time frame for achieving themVI.Describe the population served and the system
to be improved, and give guidance on the approaches to improvement.
15
• Where will your change be implemented? (A)( A location such department, clinic, community)• What result are you trying to change? (B)
Exercise
• What result are you trying to change? (B)(Should be a tangible result, such as a decrease or
increase in some factor )• By what amount are you trying to change it? (C)Should be a percentage or some other numerical value
• When do you want to see this result happen? (D)
USAID Applying Science to Strengthen and Improve Systems
When do you want to see this result happen? (D)
(An amount of time or by a certain date)
• What will you do/use to achieve this result? (E)(What tool, method, or resource will you employ to make the change?)
•16
Steps in Quality Improvement for coaches’ reference
USAID ASSIST Project - Uganda
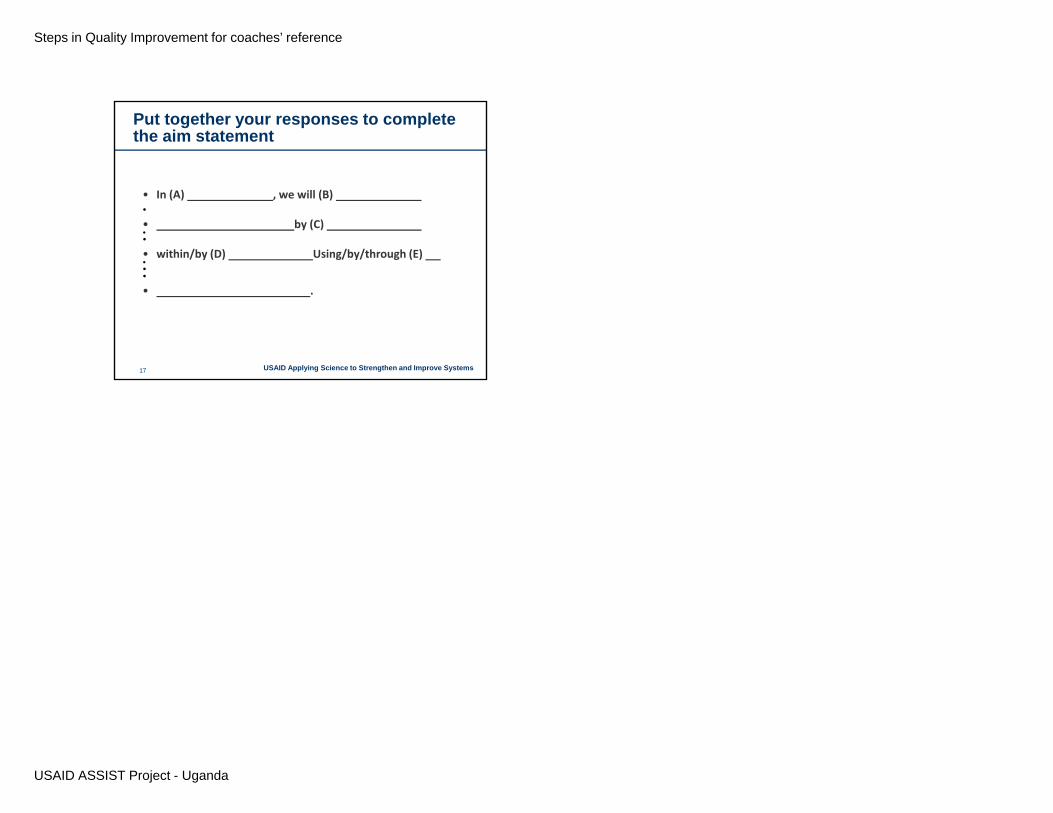
Put together your responses to complete the aim statement
• In (A) we will (B)• In (A) , we will (B) •
• by (C) ••
• within/by (D) Using/by/through (E) •••
USAID Applying Science to Strengthen and Improve Systems
• .
17

QI tools for coaches’ reference
USAID ASSIST Project - Uganda
QI tools
1
Learning objectives
• Know the important tools used in QI• Understand how and when the various toolsUnderstand how and when the various tools
can be used
USAID Applying Science to Strengthen and Improve Systems2
QI tools
• Brainstorming • Flow chart• Cause and effect diagram• Run chart • The Five-Whys technique
USAID Applying Science to Strengthen and Improve Systems3
Brain storming
• A way for a group to generate as many ideas as possible in a very short time by tapping into group knowledge, experience and individual creativity
• Ideas are produced by encouraging participation of all group members through structured and unstructured thought processes on a given subject
• It requires participants to be willing to express their ideas without evaluating them remain open to new ideas and
USAID Applying Science to Strengthen and Improve Systems
without evaluating them, remain open to new ideas, and refrain from criticizing suggestions
• It works best in an uninhibited environment where ideas are freely generated and built upon
4

QI tools for coaches’ reference
USAID ASSIST Project - Uganda
Why brainstorm?
• To generate ideas about problems• Areas for improvement• Possible causes• Possible solutions• Resistance to change
USAID Applying Science to Strengthen and Improve Systems5
Fish bone / Cause and Effect Diagram
• It is a tool used to collect and organize all th ibl f ti l blthe possible causes for a particular problem
• Used as a first step in problem solving by generating a comprehensive list of possible causes
• Leads to greater understanding of the
USAID Applying Science to Strengthen and Improve Systems
g gproblem
• Broadens thinking about the possible reasons for a problem
6
PersonnelResources
Lack of knowledge, skills and experience
High workloadNo money
Inadequate supplies
Lack of adequate infrastructure
Fish head = problem
Poor quality services
Poor supervision
Poor referral system
Lack of communication with HC level
Uninformed
USAID Applying Science to Strengthen and Improve Systems7 7Processes Clients
Lack of communication with HC level
Lack of community involvement and feedback
Limited access
Not empowered
The Five Whys
• Technique used to identify the root cause of a problem• Keep asking ‘why’ for each cause until a potential root• Keep asking why for each cause until a potential root
cause has been identified.• A root cause is one that-
i. can explain the effect either directly or through a series of events
ii if addressed would remove or reduce the problem
USAID Applying Science to Strengthen and Improve Systems
ii. if addressed, would remove or reduce the problem
8

QI tools for coaches’ reference
USAID ASSIST Project - Uganda
Using the Five Whys
1. Write down the specific problem. 2. Ask the team Why the problem happens and write the y p pp
answer down below the problem.3. If the answer provided doesn’t identify the root cause
of the problem that you wrote down in Step 1, ask Why again and write that answer down.
4. Repeat step 3 until the team is in agreement that the bl ’ t i id tifi d Thi t k f
USAID Applying Science to Strengthen and Improve Systems
problem’s root cause is identified. This may take fewer or more times than five Whys.
5. When the root cause is identified, determine possible solutions to this
9
Example of the Five Why approach
• Question 1: Why are mothers not counseled on infant and young child feeding on clinic days?
• Answer 1: Because the health worker has a long line of clients to attend to so she cannot counsel all the mothers
• Question 2: Why does the health worker have a long line of patients to attend to?• Answer 2: Because she is the only staff assigned to provide services to mothers on
clinic days• Question 3: Why is the health worker the only staff assigned to provide services to
mothers on clinic days• Answer 3: Because the rest of the staff do not know what services to provide to
mothers on clinic days• Question 4:Why don’t the rest of the staff know what services to provide to mothers?
USAID Applying Science to Strengthen and Improve Systems
• Question 4:Why don t the rest of the staff know what services to provide to mothers?• Answer 4: Because they were not trained in PMTCT/ Option B+• Question 5: Why weren’t all the staff not trained in PMTCT/ Option B+?• Answer 5: Because there were limited resources to do the training• Solution: Do on-job training for the rest of the health workers so that they are able to
provide services to mothers on clinic days
10
RUN CHARTS
1111
The Run Chart (QI Tool)
• Visual displays provide a particularly useful form of analysis
• A Run chart (time series chart) plots observation over time and helps detect special variations
• Make trends or other non-random variation in the process easier to see and understand
USAID Applying Science to Strengthen and Improve Systems12
process easier to see and understand• Run Charts graphically display shifts, trends,
cycles, or other non-random patterns over time

QI tools for coaches’ reference
USAID ASSIST Project - Uganda
Steps to Create a Run Chart
1. Collect data over time, recording when each measurement was taken, in chronological order
2. Determine the scale for vertical axis and the scale for the horizontal axis.
3. Draw the vertical axis and horizontal axis 4. Label the vertical axis with scales and unit of measure
(e.g. percentage)f
USAID Applying Science to Strengthen and Improve Systems13
5. Label the horizontal axis with scales and unit of measure (e.g. month)
6. Plot the points and connect them with a straight line between each point.
Elements of a simple Time-Series Chart
Increasing Triage of Children <5 upon Arrival at Kollo Hospital, Niger (2006-2007)
100
Clear and well‐defined title that includes what
and when
X and Y axes have clear
10
20
30
40
50
60
70
80
90
Perc
enta
ge o
f Chi
ldre
n <A
ge 5
Tria
ged
Upo
n A
rriv
al o
ut o
f All
Pres
entin
g C
hild
ren Triage
Training
Policy to treat emergencies before administrative paperwork
Staff roles defined and Triage Forms introduced
a e c eascale and include
indicator label
Numerator and
denominator values h f
Tested changes are annotated
USAID Applying Science to Strengthen and Improve Systems
0
% of children <5 triaged at arrival 50 69 61 36 67 91 88 79 74 95 85 77 93 85 94 83 88 94 76 97 96
# of children <5 coming to the hospital 80 75 112 119 150 164 130 159 184 170 177 131 105 84 108 120 112 160 623 256 114
# of children <5 triaged (U,P,NP) at arrival 40 52 68 43 100 150 114 125 136 161 150 101 98 71 101 100 99 150 471 248 110
J F M A M J J A S O N D J F M A M J J A S
2006 2007
Numerator Definition: number of children <5 years of age who were triaged monthly U=urgent, P=priority, NP=not priority [Source: Triage forms ]Denominator Definition: number of children <5 years of age that arrived for a consultation at the hospital [Source: Hospital Register ]Sampling Strategy --> data are not a sample.
Denominator defined, including data source and
sampling strategy
Numerator defined, including data source and
sampling strategy
shown for each month
14
FLOW CHARTS
15
The flow chart as a QI tool
• A flow chart is a pictorial representation describing a process. It explains the process of doing something from beginning to end– for example, preparing tea.beginning to end for example, preparing tea.
• Flow charting involves mapping out the steps of a process and illustrating them using a flow diagram.
• It relies on the use of symbols to illustrate what happens in each step of the process
• Used to identify bottlenecks, missing steps, and redundant or unnecessary work/ steps
USAID Applying Science to Strengthen and Improve Systems
or unnecessary work/ steps• Used to help identify who to involve in the QI process, who
to allocate tasks to• Flow charts can also be used to determine areas for
monitoring or data collection16

QI tools for coaches’ reference
USAID ASSIST Project - Uganda
Begin or End
Commonly used symbols in flow charting
Flow lineFlow line
Step
Decision
Cloud (unclear step)
USAID Applying Science to Strengthen and Improve Systems
Delay
17
How to create a process flowchart
1. Identify the beginning and end points of the process to be flowcharted
2. Identify the steps involved in this process
3 Link the steps with arrows showing direction
USAID Applying Science to Strengthen and Improve Systems
3. Link the steps with arrows showing direction
4. Review draft to confirm their logical order
18
OneOne flow line flow line
Use of Flow lines in flow charting
Step
YESDecision
out of a stepout of a step
TwoTwo flow lines out of a flow lines out of a decisiondecision
Step
USAID Applying Science to Strengthen and Improve Systems
NO
Must ask a yes / no Must ask a yes / no questionquestion
19
Flowchart of a Process
I tSequence of steps Output
Input( start )
(result, end)
USAID Applying Science to Strengthen and Improve Systems
Process visualization through a flowchart helps clarify the process and evaluate quality of interactions.
20