partnership for growth: el salvador cabrera melgar, ... bcr banco central de reserva (central bank...
TRANSCRIPT

Partnership For
Growth: El Salvador
Constraints Analysis
Joint USG-GOES technical team
7/19/2011

i
ACKNOWLEDGEMENTS
Special thanks are due to Pablo Amaya, Julieta Fuentes, Nicolás Martínez, Juan Osorio and
Carlos Sanabria, members of the Economic and Financial Research Department, Central Reserve
Bank of El Salvador, who compiled information, made statistical analysis and have contributed
and worked in particular topics of the document. Special thanks also to Carlos Arce of the
USAID Mission Economic Growth Office for invaluable coordination and support, Rhina Ferrer
of the U.S. Embassy Economic Section for research and contributions to specific topics, Ashley
Edwards of the MCC for superb support, and Mitchell Ferguson, U.S. Embassy Economic
Counselor, for key facilitation, and Leonardo Martinez-Diaz, Franck Wiebe and Jim Parks for
helpful technical review and conversations.
The technical team who jointly authored this report consisted of:
Carlos Acevedo, President of the Central Reserve Bank of El Salvador
Mario Roger Hernández, Vice Minister of Economy
Roberto Turcios, Advisor to the Technical Secretary of the Presidency
Willian Pleitez, Chief Economist of the Policy and Knowledge Management Unit, UNDP-El
Salvador
Francisco Lazo, Coordinator of the Economic and Social Research Area, Technical Secretariat of
the Presidency
Oscar Cabrera Melgar, Chief Economist of the Economic and Financial Research Department,
Central Reserve Bank of El Salvador
Takashoshi Yamagiwa, Manager of Economics and Trade Analysis, Ministry of Economy
Carmen Lazo, Program Officer, UNDP-El Salvador
René Pineda, Economist of the Policy and Knowledge Management Unit, UNDP-El Salvador
Antonio Cañas, Advisor to the Minister, Ministry of Environment and Natural Resources
Zaks Lubin, Economist, USAID
Jeffery Tanner, Economist, MCC
Michael Nicholson, Economist, USAID
Anastasia de Santos, Economist, USAID
Michelle Yerkin, Deputy Economic Counselor, U.S. Department of State

ii
Contents
1. Executive Summary .................................................................................................................. 1
A. Key Conclusions of the CA ................................................................................................ 2
a. Security/Crime .............................................................................................................. 2
b. Low Productivity in the Tradables Sector .................................................................... 3
B. Methodological Caveats...................................................................................................... 4
2. Partnership for Growth and El Salvador ................................................................................... 6
A. Partnership for Growth ....................................................................................................... 6
B. Growth Diagnostics Methodology ...................................................................................... 6
3. An Economic Overview for El Salvador ................................................................................ 10
A. Macroeconomic Situation ................................................................................................. 10
B. Production ......................................................................................................................... 14
C. Trade in Goods .................................................................................................................. 16
D. Trade in Services............................................................................................................... 19
E. Foreign Direct Investment in El Salvador ........................................................................ 23
4. Cost of Finance ....................................................................................................................... 26
A. Interest Rates ..................................................................................................................... 28
B. Small and Medium Enterprise (SME) Credit.................................................................... 32
C. International Financing ..................................................................................................... 46
D. Domestic Savings.............................................................................................................. 52
E. Financial Intermediation ................................................................................................... 60
a. Cost of Financing ........................................................................................................ 60
b. Competition................................................................................................................. 62
c. Risk ............................................................................................................................. 65
5. Returns to Economic Activity ................................................................................................. 66
A. Low Appropriability ......................................................................................................... 66
a. Is Crime a Binding Constraint to Economic Growth in El Salvador? ........................ 67
b. Political Uncertainty ................................................................................................... 82
c. Institutions................................................................................................................... 90
d. Informality ................................................................................................................ 105
e. Macroeconomic Instability ....................................................................................... 111
f. Analysis of Self Discovery ....................................................................................... 116
g. Low Productivity in the Tradable Sector .................................................................. 127
B. Low Social Returns ......................................................................................................... 145

iii
a. Infrastructure ............................................................................................................. 145
b. Human Capital .......................................................................................................... 164
c. Geography ................................................................................................................. 183
6. Conclusions ........................................................................................................................... 198
7. Technical Annex ................................................................................................................... 199
A. Cointegration Tests ......................................................................................................... 199
B. Residual Serial Correlation LM Tests............................................................................. 200
C. Impulse Response Functions........................................................................................... 200
D. An index of Undervaluation............................................................................................ 201
E. Population and Exports in LAC ...................................................................................... 202
8. Bibliography ......................................................................................................................... 203

iv
Acronym List
AIC Akaike Information Criteria
AIDS Aquired Immunodeficiency Syndrome
AIES El Salvador International Airport
AML Anti-Money Laundering
ANDA National Administrator of Aqueducts and Sewers
BCR Banco Central de Reserva (Central Bank of the Republic)
CA Constraints Analysis
CAFTA Central America Free Trade Agreement
CAFTA-DR Central America Free Trade Agreement-Dominican Republic
CEL Comision Ejecutiva Hidroelectrica del Rio Lempa
CEPA Comision Ejecutiva Portuaria Autonoma
CNE National Emergency Comission
CONAMYPE Comisión Nacional de la Micro y Pequeña Empresa
DfID Department for International Development
DIGESTYC Direccion General de Estadistica y Censos (National Census Agency of El
Salvador)
DR Dominican Republic
ECLAC Economic Comission for Latin America and the Caribbean
EHPM Multipurpose Household Surveys
EMBI Emerging Markets Bond Index
EMC Marginal Efficiency of Capital
ETESAL Empresa Transmisora de El Salvador
EXPY Export-weighted average of the PRODY for that country
FAO UN Food and Agriculture Organization
FDI Foreign Direct Investment
FESAL Encuesta Nacional de Salud Familiar
FH Feldstein Horioku
FMLN Frente Farabundo Martí para la Liberación Nacional
FTA Free-Trade Agreement
FUSADES Fundación Salvadoreña para El Desarrollo Económico y Social
GCR Global Competitiveness Report
GDP Gross Domestic Product
GOES Government of El Salvador

v
HHI Herfindahl-Hirshman Index
HKW Hausman, Klinger, Wagner 2008: ―Doing Growth Diagnostics in Practice: A
Mindbook‖
HRV Hausman, Rodrik, Velasco (2007) paper
i interest rate
IADB, IDB Interamerican Development Bank
IDD Index of Deficit from Disasters
IMF International Monetary Fund
IPIAI Infrastructure Private Investment Attractiveness Index
KEI Knowledge Economy Index
LAC Latin America and the Caribbean
LAPOP Latin American Public Opinion Project
LGDP Log of Gross Domestic Product
LMIC Lower-Middle Income Countries
MAG Ministry of Agriculture
MENA Middle East and North Africa
MG Megawatts
MINEC Ministry of the Economy
MOPTVDU Ministry of Public Works, Transport, Housing, and Urban Development
MPK Marginal Product of Capital
MPL Marginal Product of Labor
MWh Megawatt hours
NAFTA North America Free Trade Agreement
OCAVI Observatorio Centroamericano sobre Violencia (Central American Violence
Observatory)
PAN Panama
PAHO Pan-American Health Organization
PATH Export production linkage index
PD Power Dispersion
PNUMA Programa de las Naciones Unidas para el Medio Ambiente (UN Programme for
Environment)
PfG, PFG Partnership for Growth
PPP Purchasing Power Parity (also Public-Private Partnerships)

vi
PRODY Productivity index of exports
PROESA El Salvador Export and Investment Promotion Agency
PVI Prevalent Vulnerability Index
RER Real Exchange Rate
RMI Risk Management Index
ROA Return on Assets
SAIDI System Average Interruption Duration Index
SAIFI System Average Interruption Frequency Index
SC Schwarz
SD Sensitivity Indices of Dispersion
SIEPAC Sistema de Interconexión Eléctrica de los Países de América Central
SIGET General Superintendence of Electricity and Telecommunications
SME Small and Medium Enterprises
SNET National Territorial Studies Service
SVC Salvadoran Colon
TEU Twenty-foot Equivalent Unit
TFP Total Factor Productivity
TIMSS Trends in International Mathematics and Science Study
UNESCO United Nationas Education, Scientific, and Cultural Organization
USAID United States Agency for International Development
USD United States Dollar
USG United States Government
VAR Vector Autoregressive model(s)
VAT Value-Added Tax
WB World Bank
WDI World Development Index
WEF World Economic Forum
WGI Worldwide Governance Indicators
WHO World Health Organization
XRAT Exchange Rate

vii
Figures and Tables
Figure 2.1: Constraints Analysis Framework ..................................................................................7
Table 3.1: Macroeconomic Indicators of the Salvadoran Economy ..............................................10
Figure 3.2: Current Account and Real GDP Growth Rate .............................................................12
Table 3.3: Gross Domestic Product by Sector (as percent of real GDP) .......................................14
Table 3.4: Participation of Sub-sectors within the Service Sector, 2000-2010 (percent of
total service real GDP) ...........................................................................................................15
Table 3.5: Participation of Sub-sectors within the Manufacturing Sector, 2000-2010
(percent of total manufacturing GDP) ....................................................................................15
Figure 3.6: Export and Import Shares of Constant GDP (percent of GDP) ..................................16
Figure 3.7: El Salvador‘s Trade in Goods, 2000-2010 (million USD) ..........................................17
Figure 3.8: Trade Dependency of El Salvador (percent of total GDP) ..........................................17
Figure 3.9: El Salvador‘s Exports by Sector according to the Central American Tariff
Schedule, 2010 (percent of total) ............................................................................................18
Figure 3.10: El Salvador‘s Imports by Sector according to the Central American Tariff
Schedule, 2010 (percent of total) ............................................................................................19
Figure 3.11: El Salvador‘s Trade in Service (million USD) ..........................................................20
Figure 3.12: El Salvador‘s Export in Services (percent of total) ...................................................21
Figure 3.13: El Salvador‘s Import in Services (percent of total) ...................................................22
Figure 3.14: El Salvador‘s Trade in Service in 2010 (million USD) ............................................23
Figure 3.15: El Salvador‘s Inward FDI Stock (million USD) .......................................................24
Table 3.16: El Salvador‘s Net FDI by Receiving Economic Sector,
Stock at end-2010 (million USD) ..........................................................................................24
Figure 3.17. El Salvador‘s Net Inward FDI by Country, 2010 Stock (million USD) ...................25
Figure 4.1: Real lending and deposit interest rates, capital productivity and profit margins
of goods ..................................................................................................................................27
Figure 4.2: Constraints in Costly Financing ..................................................................................28
Figure 4.3: Real Rate of Interest and GDP per capita, 2009 ..........................................................29
Table 4.4: Standard deviation of the real interest rate ...................................................................29
Figure 4.5: Real and Nominal Rates of Interest on Loans, and Inflation ......................................30
Figure 4.6: Real Rates of Interest on Loans (Latin American Countries) .....................................30
Figure 4.7: Real Average Rates of Interest on Loans and Investment (Percentage of GDP)
for Latin American Countries .................................................................................................31
Figure 4.8: Investment vs Real Interest Rates ...............................................................................32
Figure 4.9: Banks‘ Granting of New Credit during 2009 ..............................................................33
Figure 4.10: Changes to Credit Granting Conditions by Type of Company .................................34
Figure 4.11: Value of Collateral Necessary for Obtaining a Loan (as percent of Loan
Amount ) .................................................................................................................................36
Figure 4.12: Value of Collateral Necessary for Obtaining a Loan (as percent of Loan
Amount) ..................................................................................................................................36

viii
Figure 4.13: Loans Granted by the Salvadoran Banking System by Share of Total .....................37
Table 4.14: Credit extended to firms, by company size (USD millions) .......................................37
Figure 4.15: SME Credit and Bank Financing...............................................................................38
Figure 4.16: Changes in Requirements for Approving Business Loan Requests during
2008 – 2009 in the Salvadoran Commercial Banking System ...............................................39
Figure 4.17: Factors Contributing to the Credit Reduction ...........................................................39
Figure 4.18: Bank Factors Contributing to the Credit Reduction ..................................................40
Figure 4.19: MPK & MPL, reproduced from Age of Productivity ................................................41
Table 4.20: Sensitivity indices of dispersion (SD) and power dispersion (PD) weighted by
final demand, 1990 and 2006 .................................................................................................42
Table 4.21: Value Added and Employment by 2005 Economic Census .......................................43
Table 4.22: Did Firm apply for credit in the past fiscal year? (2006) ...........................................44
Table 4.23: Main Reasons for not applying for Loans or Lines of Credit (2006) .........................44
Table 4.24: Sales volume by credit decisions ................................................................................44
Table 4.25: Gross Domestic Products by Sectors (as percent of real GDP) .................................45
Figure 4.26: Sectoral Distribution of the Credit ............................................................................46
Table 4.27: Moody´s Sovereign Ratings for Comparative Countries 2010 - 2011 .......................47
Table 4.28: El Salvador‘s External Debt (Sovereign Issues) .........................................................48
Figure 4.29: EMBI Differential 2007-2011 ...................................................................................49
Figure 4.30: Gross Public Debt ( percent of GDP) ........................................................................50
Table 4.31: Comparison Statistics of Gross Public Debt (percent of GDP) ..................................50
Figure 4.32: Gross Financing Needs vs. Debt/GDP ......................................................................50
Figure 4.33: Current Account ( percent of GDP) .........................................................................51
Table 4.34: Comparison of Current Account of El Salvador with other countries ........................51
Figure 4.35: Rate of Growth of the GDP, Formation of Capital and Current Account of
El Salvador .............................................................................................................................52
Figure 4.36: National Savings and logarithm of GDP in El Salvador (1981-2009) ......................53
Figure 4.37: Granger Causality Tests ............................................................................................53
Figure 4.38: Savings and Investment as a percent of the GDP in El Salvador and in a
sample of other countries, averages for 1990´s and 2000´s ...................................................54
Figure 4.39: Rate of Deposits and Gross Savings in El Salvado and Maximum and
Minimum Rate of Deposits in El Salvador vs. Central American Mean ...............................55
Figure 4.40: Average Gross Domestic Savings as a percent of the GDP .....................................56
Table 4.41: Domestic, External Savings and Investments .............................................................57
Figure 4.42: External Savings, National Savings and Gross Formation of Capital as a
percent of GDP in El Salvador ...............................................................................................57
Figure 4.43: El Salvador, Disposable Income, Consumption and Savings ...................................58
Figure 4.44: El Salvador, savings rate and accumulated savings ratio quintiles ...........................59
Figure 4.45: Intermediation Spread: El Salvador, Central America (CA), Dominican
Republic (DR) and Panama (PAN) ........................................................................................61

ix
Figure 4.46: Percentage of Companies that Identify Access to Financing as a Serious or
Very Serious Obstacle ............................................................................................................62
Figure 4.47: Concentration Indexes by Types of Assets ...............................................................63
Table 4.48: Concentration -Indexes According to Size (February 2007) ......................................63
Figure 4.49: Share of Credit Market by Type of Bank ..................................................................64
Table 4.50: Returns in the Financial System .................................................................................64
Figure 4.51: Credit to the Private Sector as percent of GDP ........................................................65
Figure 5.1: The Low Appropriability Branch of the Growth Diagnostics Decision Tree .............67
Figure 5.2: Robberies per 100,000 in 2008....................................................................................68
Figure 5.3: Comparison of Homicides per 100,000 .......................................................................69
Figure 5.4: Business Perceptions of Crime—2006 World Enterprise Survey Resuts and
the 2010-2011 Global Competitiveness Report Organized Crime Index Scores ...................70
Figure 5.5: Costs of Violence (Percentage of GDP) ......................................................................71
Figure 5.6: Costs of Violence (Percentage of GDP) ......................................................................72
Figure 5.7: Costs of Violence, Without Health Costs (Percentage of GDP) .................................73
Figure 5.8: Costs of Violence, Without Health Costs, El Salvador, Costa Rica and a
Central America Average Only (Percentage of GDP) ...........................................................74
Figure 5.9: Crime in El Salvador vs. Comparators ........................................................................75
Figure 5.10: Crime Costs per Size of Business..............................................................................76
Figure 5.11: Support for the Respect of the Rule of Law, Various Countries ...............................77
Figure 5.12: Homicide Rates per 100,000 inhabitants and GDP per Capita over time .................79
Figure 5.13: Robberies per 100,000 vs. Municipal Competitiveness Index Score ........................80
Figure 5.14: State Fragility Index, Various Countries ...................................................................85
Figure 5.15: Average Support for Democracy in the Americas, 2008 vs. 2010 ............................86
Figure 5.16: Average Support for the Political System in the Americas, 2008 vs. 2010 ..............87
Figure 5.17: Perceptions of Government Economic Performance in the Americas, 2008
vs. 2010...................................................................................................................................88
Figure 5.18: Principal Factors that Influence the Unfavorable Investment Climate, By
Order of Importance (1st Quarter, 2008 through 2
nd Quarter, 2010) ......................................89
Figure 5.19: Competitiveness Rankings of Central American countries, 2005-2010 ...................90
Figure 5.20: El Salvador‘s rankings on the Global Competitiveness Report‘s Basic
Requirements Sub-Index, 2007 and 2010 ..............................................................................91
Figure 5.21: El Salvador‘s World Governance Index scores by category, compared to a
Latin America average in 2010 (represented by the lower bar) .............................................93
Figure 5.22: El Salvador‘s World Governance Index scores by category, compared to a
Latin America average since 1996 .........................................................................................94
Figure 5.23: Percent of Citizens Who Voted in the Last Presidential Election, Regional
Results ....................................................................................................................................96
Figure 5.24: 2010 Corruption Perception Index Scores for El Salvador and other Latin
American and Caribbean Countries........................................................................................98

x
Figure 5.25: 2010 Corruption Perception Index Scores for Central American Countries .............99
Figure 5.26: Civil Service Indices, Central American Countries (without Costa Rica) and
Regional Averages................................................................................................................100
Figure 5.27: Merit Index ..............................................................................................................101
Figure 5.28: Quality of Public Administration ............................................................................101
Figure 5.29: Country Averages on select Institutions ―Pillar‖ indicators of the Global
Competitiveness Index .........................................................................................................103
Figure 5.30: Top 10 Business Environment Constraints .............................................................106
Figure 5.31: Degree of Informality by Type and Size of Business .............................................108
Figure 5.32: Principal Providers of Inputs, by Type and Size of Business .................................109
Figure 5.33: Principal Client by Size of Business .......................................................................110
Figure 5.34: The most problematic factors for doing business in El Salvador ............................112
Figure 5.35: Evolution of public debt as a percentage of GDP ...................................................113
Table 5.36: Macroeconomic Framework Projections from the IMF Standby Agreement
(percent of GDP, unless otherwise noted) ............................................................................114
Table 5.37: Operations of the Nonfinancial Public Sector, Projections from the IMF
Standby Agreement (in percent of GDP) .............................................................................114
Figure 5.38: El Salvador Tax Revenues as a Percentage of GDP ...............................................115
Figure 5.39: International ranking on protection of intellectual property rights .........................117
Figure 5.40: World Bank Doing Business Indicators, Starting a business ranking .....................118
Figure 5.41: Country level PRODY values .................................................................................119
Figure 5.42: New products exported by PPP per capita GDP level.............................................120
Figure 5.43: Change in sector composition of exports (1994-2009) ...........................................121
Figure 5.44: Sector weighted PRODY values for El Salvador (US$ ´000; 1994 and 2009) .......122
Table 5.45: PRODY by new and old exports since 1998 ............................................................122
Figure 5.46: Number of New Products by Number of Years of Continuous Export ...................123
Figure 5.47: Country level weighted PATH values .....................................................................124
Figure 5.48: Sector weighted PATH values for El Salvador (1994 and 2009) ............................125
Table 5.49: Correlation between change in export value and GDP .............................................126
Table 5.50: Correlation between change in export value and GDP for El Salvador in
different periods....................................................................................................................126
Figure 5.51: Exports as Percentage of GDP in El Salvador ........................................................130
Figure 5.52: Exports with and without Maquila ..........................................................................131
Figure 5.53: Exports as a percentage of GDP (2009) ..................................................................131
Figure 5.54: Exports as a Percentage of GDP..............................................................................132
Figure 5.55: Exports as a Percentage of GDP (Central America and Countries with
population between 4 and 8 million) ....................................................................................133
Figure 5.56: Exports as Percentage of GDP, Top Exporters (CA or Pop. 4-8 million) ...............134
Figure 5.57: Index of Labor Productivity in the Manufacturing Industry of the U.S. and
El Salvador ...........................................................................................................................135

xi
Figure 5.58: Difference with weighted average of CAFTA ........................................................136
Figure 5.59: Exports as a Percentage of GDP and GDP per capita .............................................138
Figure 5.60: Total Factor Productivity (Hicks-Moorsteen index) in El Salvador and GDP
per capita growth in 2005 purchasing power parity terms ...................................................138
Figure 5.61: FDI Inflows as Percentage of GDP .........................................................................139
Figure 5.62: Latin America and El Salvador: Net foreign direct investment inflows by
destination sector, 2005-2010 ...............................................................................................140
Figure 5.63: Average annual growth rate by sector, 1990-2009 ..................................................142
Table 5.64: Number of Cell Phones per 100 inhabitants .............................................................145
Table 5.65: Fixed broadband internet subscribers per 100 inhabitants .......................................146
Figure 5.66: Available Capacity by Type of Resources for 2000 and 2010 (Mw) ......................147
Figure 5.67: Electricity Demand, 2000-2010 ..............................................................................147
Figure 5.68: Total Output, Net Output and Effective Available Capacity (May 16 2010) .........148
Figure 5.69: Effective Rates For Industry—June 30 2010 (in US dollar cents/KWH) ...............149
Figure 5.70: Average Energy Prices For Industrial Sector, 2000-2010 (ctvs of $/kwh) .............149
Figure 5.71: Electricirty Losses in the Central American Region ...............................................150
Figure 5.72: Annual SAIDI, SAIFI, FMIK And TTIK Indicators...............................................151
Table 5.73: Indicator FEB noper ................................................................................................151
Figure 5.74: Total output, Available Effective Capacity and Transmission Losses ....................152
Figure 5.75: Wholesale Market Spot Prices (USD/MWh) in Central America, 1999-2007 .......153
Table 5.76: Water Availability ....................................................................................................155
Figure 5.77: Map of secondary dirt roads and their service areas (2 km on each side) ...............158
Figure 5.78: Map of paved roads and their service area (2 km on each side) .............................159
Figure 5.79: Comparison of costs at ports ...................................................................................159
Table 5.80: Distances from San Salvador to Ports ......................................................................161
Table 5.81: Landing Fees .............................................................................................................161
Table 5.82: Index of Investment Opportunities in Infrastructure ................................................163
Figure 5.83: Education Stock by GDP per capita, 2010 ..............................................................165
Table 5.84: Highest Level of Schooling Attained .......................................................................165
Figure 5.85: Retention Rates for Basic Education (2000-2008) ..................................................166
Figure 5.86: Comparative School Life Expectancy .....................................................................166
Figure 5.87: 2010 Illiteracy by 2009 GPD Per Capita (USD) .....................................................167
Table 5.88: Illiteracy Rate by Subpopulation for ages 10+ .........................................................168
Table 5.89: LAC Student Teacher Ratio, 2008............................................................................168
Figure 5.90: TIMSS Achievemenet Scores against Regional Averages, 2007............................169
Figure 5.91: Constraints in El Salvador .......................................................................................171
Figure 5.92: Percentage of Firms Constrained by Inadequately Trained Workforce ..................172
Figure 5.93: Percentage of Firms Identifying Labor Skill Level as a Major Constraint .............172
Table 5.94: Exports in 2009 .........................................................................................................173
Figure 5.95: Percentage of Firms Identifying Labor Skill Level as a Major Constraint .............173

xii
Table 5.96: Mincer Returns to Education ....................................................................................175
Table 5.97: Returns to Level of Education ..................................................................................176
Figure 5.98: Returns to Tertiary Education by Income ...............................................................176
Figure 5.99: Share of Migrants by Education Level, 2000 ..........................................................177
Table 5.100: Knowledge Economy Index ...................................................................................180
Figure 5.101: Size and quantity of land holdings, 2007 ..............................................................185
Figure 5.102: Trend of Intensities of 5, 10 minutes, Ilopango ....................................................187
Figure 5.103: Trend of Intensities of 15, 20 minutes, Ilopango ..................................................188
Figure 5.104: Decadal rainfall: Annual average precipitation for 25 main weather
stations, 1971-2010...............................................................................................................188
Table 5.105: Comparison of the impact of Recent Disasters in El Salvador (in current
million dollars) .....................................................................................................................190
Figure 5.106: Economic Impact of Natural Disasters, Gross Internal Product,
Remittances, and Foreign Direct Investment (Millions of U.S. Dollars) .............................191
Figure 5.107: Index of Deficit from Disasters (2008) .................................................................192
Figure 5.108: Local Disasters Index (2001-2005) .......................................................................193
Figure 5.109: Prevalent Vulnerability Index (2007) ....................................................................193
Figure 5.110: Risk Management Index (2008) ............................................................................194
Table 5.111: Cost of Coverage for Natural Disasters or Catastrophic Events .............................195
Table 5.112: Cost of Coverage for Natural Disasters or Catastrophic Events (percent over
amount insured) ....................................................................................................................195
Figure 5.113: Disaster Costs, Investment, GDP and Remittances in El Salvado ........................196
Figure 5.114: Private Telecoms Investment as a Percent of Total Investment ............................197

1
1. Executive Summary
This constraints to growth analysis (CA) was prepared by a joint technical team composed of
economists from the Government of El Salvador and the Government of the United States. Its
purpose is to provide an analytical and empirical foundation for joint efforts to promote broad-
based economic growth in El Salvador. These efforts will be undertaken as part of Partnerships
for Growth (PfG), an effort by the Obama Administration to foster growth in a select number of
countries and seed the next generation of emerging markets. The exercise of analyzing growth
restrictions under the Partnerships for Growth has been enriching for both governments, as it has
helped to deepen the shared understanding of the problems of economic growth in El Salvador.
All four of the countries selected for the Partnerships for Growth undertake a Constraints
Analysis following the growth diagnostics methodology developed by Hausmann, Rodrik, and
Velasco (HRV). The results of these studies are intended to facilitate planning of a consensus set
of near-term public policies agreed to by the partner country and United States governments
aimed to improve investment and economic growth.
This analysis drew on information from a wide variety of sources, including data provided by
various entities of the Government of El Salvador, analysis from international organizations
(including the International Monetary Fund, the World Bank, and the Inter-American
Development Bank), and the work of independent experts. It also benefited from various
consultations and seven total focus groups over a period of three months with a variety of
stakeholders in El Salvador, including government officials, entrepreneurs, and academics.
Using this data and internationally comparable indicators, surveys, cross-sectional and panel
data, graphical, statistical, and regression analysis and other tools, it systematically analyzes
potential factors that may be hindering private investment in the economy. It identifies two
binding constraints to growth—factors that, based on the available evidence, can be said to be
the most critical obstacles to private investment and to economic growth. These constraints
impose a very significant cost—or ―shadow price‖—on the economy.
The study focused on the economy of El Salvador; these are some of its most salient
characteristics:
With a mostly-urban population of 6.2 million people, El Salvador had a Gross Domestic
Product (GDP) of US$21.2 billion in 2010.
Since the Peace Agreements in 1992, El Salvador has demonstrated mixed economic
growth. According to World Bank statistics, the country experienced a post-war boom
between 1992 to 1995, when it averaged annual economic growth of 6.8 percent. From 1996
to 2000, annual economic growth averaged a much lower 3.0 percent. For the past decade
from 2000-2009, El Salvador averaged just 2.1 percent annual economic growth, with GDP

2
receding by 3.1 percent in 2009 due to the financial crisis. The rates of growth over the last
decade are below the Latin American average.
A historically open economy, El Salvador is part of CAFTA-DR, a regional free trade
agreement with the United States, and has six Free Trade Agreements with Chile, Mexico,
Panama, Dominican Republic, Colombia and Taiwan. El Salvador is also part of the Tratado
General de Integración Centroamericana (Central America General Treaty).
Today, this is a service-dominated economy: the services sector accounts for 60 percent of
GDP, manufacturing for about a quarter, and agriculture and related sectors for 12 percent.
The economy has been officially dollarized since January 2001; annual remittances, mostly
from workers in the United States, amount to 17 percent of GDP.
El Salvador‘s most important export category remains maquila products (manufactured
products assembled for re-export), which have traditionally encompassed low value- added
and are not technologically intensive; maquila products account for almost half of all exports.
The stock of foreign direct investment (FDI) increased from US$1.97 billion in 2000 to
US$7.76 billion in 2010, mainly directed to the financial and manufacturing industries. The
United States remains the largest source of FDI to El Salvador.
A. Key Conclusions of the CA
The study identified two binding constraints to growth in El Salvador:
a. Security/Crime
The ―shadow price‖ (the effect on GDP if the constraint were removed) of crime is between 4.8
percent and 10.8 percent of GDP spent or foregone due to crime (depending on whether health
costs are included). Either of these figures is higher than the Central American average and
more than double the figure for Costa Rica, the only country in Central America not classified as
having an ―epidemic‖ level of crime. Moreover, just under half of businesses surveyed by the
World Bank Enterprise Survey report that crime is an obstacle to their operations—at least 15
percentage points more than the Latin American and lower-middle-income average. In the
Global Competitiveness Report, El Salvador ranks last out of 139 countries under the Organized
Crime indicator, and next-to-last in Business Costs of Crime and Violence.
Economic growth does show some movement with crime rates for the period from 1994 to
2000. Also, higher numbers of robberies per 100,000 in a municipality correlates with lower
scores on a Municipal Competitiveness Index for that municipality.
According to surveys in El Salvador, businesses spend 7.7 percent of their budget on
security. A related study estimates that businesses and families spent a combined 4.7 percent
of GDP on private security in 2007. Private security guards outnumber police by a ratio of 3
to 2 in El Salvador.

3
Larger businesses have been shown to be more capable of absorbing the security costs and
are less affected by crime (measured as percent of sales lost) as a result. In addition, there is
strong anecdotal evidence that certain industries which are more affected—such as delivery
and bus companies—also suffer more. Public transportation has been particularly hard-hit,
with the burning of a bus last summer with 17 people on board and a bus strike as a result of
the Congress passing an anti-gang law. The strike closed 80 percent of public
transportation. The bus companies seemingly were protesting due to fear of reprisal by the
gangs.
Understanding causes and effects of particular types of crime in El Salvador is an important
next step. We also note that possible remedies for this constraint extend well beyond the
traditional responses of increasing security, and should also include a comprehensive and
integral strategy. Initiatives including (but not limited to) improving school attendance and
quality to facilitate viable economic opportunities for vulnerable youth should be combined
with prevention strategies.
b. Low Productivity in the Tradables Sector
The share of output of tradables has been declining in El Salvador since 1990, perhaps as a
consequence of low productivity of Salvadoran firms operating in the tradables sector. El
Salvador‘s share of tradables as a percent of GDP has declined from 45 to 40 percent over
this period and has consistently been 5-10 percentage points below the average for Middle-
Income Countries, and 10-15 percentage points below the Lower-Income Country average.
El Salvador may be missing 8 percentage points of GDP compared to CAFTA colleagues due
to the productivity constraint in tradables.
In this context, ―tradables‖ refers to products that are or can be traded internationally. Their
prices are set on international markets, whereas the prices for non-tradables are set
domestically.
Because their prices are set in international markets, the price of tradables facing Salvadoran
firms is conditioned by factors largely exogenous to production. Therefore, the Salvadoran
tradables sector is the world tradables sector, and El Salvador‘s competition in tradables is
global competition. With prices set at or very near world prices, Salvadoran firms must have
a high level of productivity in order to enter the tradables sector. The observation that share
of output in tradables is falling, even while it is rising in neighboring countries such as
Panama and Nicaragua, implies that firms are not able to realize such high levels of
productivity.
Low productivity and accompanying relative lack of competitiveness in international markets
dampens the possibility for a structural transformation and accompanying growth
acceleration in El Salvador, where the growth potential of the non-tradables sector is limited
by the small size of the country.
Agents may attempt to bypass this constraint in the form of maquilas, which receive tax and
tariff exemptions to reduce their costs.

4
Because we did not find that transportation, finance to large firms, or innovation issues are
binding constraints in this analysis, low productivity in the tradables sector seems less likely
to be due to these issues.
Economic theory implies that because El Salvador‘s tradables sector needs to be competitive
with world markets, the factors of production of tradables must also be competitive with
world markets. The canonical total factors of productivity include human capital, physical
capital, financial capital, and often logistics/transportation. Institutional environment also
affects productivity. While we cannot conclude that human capital is a binding constraint in
itself, it is clear that the quality of El Salvador‘s education is far below what would be
competitive in the world market. The data point to particular short comings in the poor
attainment scores in math and science education in upper primary and secondary education,
and a relatively higher demand for labor with tertiary education. Anecdotal evidence from the
private sector suggests a lack of vocational education aimed at developing skills needed in
the labor market, particularly English language skills.
We also point out that crime and security issues effectively act as an additional tax on the
Salvadoran economy. These additional costs make it more difficult for the tradables sector to
compete globally.
Other issues that merit investigation for the low productivity in the tradables sector include
physical capital use and logistic efficiency.
In addition to the binding constraints identified above, the study also included a detailed inquiry
into a broad range of potential constraints including the following topics:
Cost of Finance, including interest rates, international finance, domestic savings, financial
intermediation (costs, competition, and risks), and costs of finance by firm size of enterprise;
Appropriability, including political uncertainty, institutions, informality, macroeconomic
stability, and innovation;
Social Returns, including human capital in education and health; transportation, water, and
electricity infrastructure; and geography.
B. Methodological Caveats
To identify the binding constraints, the methodology suggests the application of four tests that
each candidate constraint must pass. This step imposes analytical rigor in the identification of
binding constraints in order to establish the crucial discipline in decision-making needed to direct
public resources toward the resolution of a constraint to growth.
While the HRV approach is the methodology chosen for the Partnerships For Growth Constraints
Analyses in the four selected PFG countries, other approaches may yield different results. The
identification of binding constraints is something of a ―disciplined art,‖ but ultimately the
analyses for PFG need to be driven by hard data to arrive at credible conclusions.

5
Because the CA process requires strong evidence to reject the hypothesis that a restriction is not
binding, in working through this constraints analysis we encountered topics that we could not
accept as a binding constraint because of a lack of solid data (as opposed to concluding that the
topic was not a constraint because of contrary data).
The areas where we ultimately lacked data to make a conclusion include credit to small and
medium enterprises, climate change and vulnerability, and institutions of government
effectiveness in commerce and some particular areas of the justice system. We suggest that more
data collection on these issues, as well as on labor market issues such as education and the
drivers of emigration, would significantly aid an understanding of current constraints to growth
in El Salvador.
We stress that not identifying other issues as binding constraints should not imply that El
Salvador does not need continued improvement in those other areas in order to enjoy continued
economic growth. Indeed, if those other areas were to be completely neglected, they can quickly
become binding constraints themselves. The country must give constant attention to the many
factors that affect economic growth.
Finally, we recognize that public policy and national development have many important goals
and functions beyond economic growth through private sector investment. Even if a particular
issue is not identified as a current binding constraint to economic growth in this analysis, it does
not rule out the possibility that the same issue could be a constraint to other public policy
objectives. Other objectives of public policy beyond economic growth are indisputably
important, but are beyond the scope of this particular analysis.

6
2. Partnership for Growth and El Salvador
A. Partnership for Growth
Partnership for Growth (PFG) is based on the principles set forth by President Obama‘s
Presidential Policy Directive on Global Development in an effort to transform the character of
the United States‘ bilateral relationships with a select set of top-performing low-income
countries. The goal of this effort is to accelerate and sustain broad-based economic growth to
create the next generation of emerging markets. El Salvador is one of four nations currently
participating in this effort.
Partnership for Growth (PFG) aims to change the donor-recipient dynamic to a more
collaborative relationship that encompasses far more than foreign assistance. Building on these
foundational conditions, PFG will embrace the following six principles:
Focus on Broad-Based Economic Growth
Focus on Select Countries with Demonstrated Commitment and Performance
Joint Decision-Making and Prioritization Through Rigorous Analysis
Focus on Catalytic Policy Change and Institutional Reform
Leveraged United States Government (USG) Engagement for Maximum Impact
Emphasized Partnership and Country Ownership
As a first step towards implementing the PFG strategy, the United States and El Salvador
established a joint USG-PFG analytical team to identify binding constraints to growth in El
Salvador. This report captures the results of that joint USG-PFG growth diagnostic study and is
intended to inform a joint plan of action to address identified growth constraints.
As USG-PFG partners in the United States and El Salvador move forward in designing and
executing an action plan based on this document, analytical teams will continue to collaborate in
establishing evidence-based monitoring and evaluation frameworks to track PFG progress on
macro-level economic, business, and other indicators.
B. Growth Diagnostics Methodology
The purpose of the Constraints Analysis (CA) is to identify the root causes that deter households
and firms from making investments of their financial resources, time, and effort that would
significantly increase their incomes. The CA is not intended to dictate specific projects to be
funded, but rather to provide a framework that will help focus the consultative process on
appropriate programs that will ease those constraints and stimulate economic growth. A
successful CA will constitute a solid foundation for the formation of a partnership and

7
development strategy between El Salvador and the United States that addresses country priorities
and is consistent with economic growth.
Successfully undertaking a CA involves posing and answering a sequence of diagnostic
questions that highlight the ―root causes‖ that constrain investment. Figure 2.1 presents a
hierarchical framework to organize and motivate the questions driving the CA based on the
organizing framework presented by Hausmann, Rodrik, and Velasco (2004). Answering those
questions involves: (1) selecting and formulating the diagnostic questions in a sensible way for
the country at hand; (2) researching and marshalling key evidence and data that shed light on the
questions; and (3) answering the questions given the balance of such evidence ( Millenium
Challenge Corporation 2009).
Figure 2.1: Constraints Analysis Framework
In El Salvador and elsewhere, the question of identifying and overcoming constraints to
economic growth has been posed implicitly in the course of development planning for many
years, and explicitly at least since Hausmann, Rodrik, and Velasco‘s 2005 manuscript, ―Growth
Diagnostics.‖ The joint USG-GPH analytical team (―CA team‖) approached the task of
identifying the most binding constraints to growth in this context, and aimed to build on, update,
and where possible refine relevant prior work.
What Constrains Private
Investments?
Low Returns to Economic Activities
Low Appropriability
Macro Risks
Micro Risks
Market Failures
Low Social Returns
Natural Capital
Human Capital
Infrastructure
High Cost of Finance
Costly Local Finance
Low Savings
Costly intermediation
Costly Foreign Finance

8
This Growth Diagnostics exercise took place from late February through early May in El
Salvador and in Washington DC was performed by a joint technical team comprised of
Salvadoran and American economists. It was strongly evidence-based and all conclusions were
built upon consensus among the members of the bilateral team. The Growth Diagnostics
corpus, including the 2005 manuscript, the Mindbook, and the Pritchett DfID papers impose an
evidentiary basis for conclusions grounded in the following four tests:
The shadow price of a constraint to growth needs to be very high;
Movements in the constraint should produce movements in the objective function;
Agents in the economy should be actively trying to bypass the constraint;
Agents that are less limited by a constraint should be thriving in the economy.
These tests were applied to each node of the HRV tree to determine whether (and to what
degree) a node was binding private sector investment and growth in El Salvador.
The United States‘ Partnership for Growth (PFG) effort elected to utilize a methodology known
as Growth Diagnostics. Doing this study with a joint team comprised of representatives of two
countries and linking it directly with subsequent public policy is powerful and innovative: It
assures consensus among both parties not only regarding the programs in which the two
governments will work together, but also regarding the underlying reasons for working in them.
As a result, the probability for the success of these programs increases significantly.
Because the two governments have come to consensus regarding the methodology employed to
evaluate the constraints to growth and because this is a very specific type of study, it is useful
and necessary to preset a brief summary to clarify some characteristics of this methodology.
The Growth Diagnostics methodology was created so that the executor of the methodology
could, with the help of an evidence-based structure, prioritize the few most crucial factors,
called ―binding constraints‖, from a multitude of factors that restrict economic growth in the
country being studied. This is a significant advantage of this methodology for the PFG
because it helps two countries focus their efforts on public policies on these crucial factors,
using a strong base of evidence, to try to significantly and rapidly increase economic growth
in the country.
This tool is designed to identify the binding constraints of the economy as it exists today.
Executing the methodology highlights the immediate obstacles which, if removed, could
produce significant increases in economic growth now. Perspectives and analyses that look
beyond the immediate future have to supplement a growth diagnostic to connect necessary,
immediate objectives in the short term with medium- and long-term goals. It is important to
think farther into the future with public policy plans even while public policies are being
focused and directed towards removing today‘s binding constraints.
For the PFG initiative, the principal goal is to achieve broad-based economic growth; the
principal goal of this study was to identify the binding constraints that prevent economic

9
growth by way of private investment. The methodology and this study holds that sustainable
economic growth is engendered by private investment. However, this focus does not imply
that this is or should be the only important concern of public policy. There are many
important goals for a developing country, broad-based economic growth being one.
The purpose of this exercise was to identify binding constraints, not the reforms or actions
necessary to remove them. There are probably many ways to fix a binding constraint, each
with its own implications for the conduct of public policy. Our technical team wanted to
leave, as much as possible, the decisions regarding what two governments working jointly
together should do to remove those constraints to the appropriate decision makers.
There are many studies exploring the potential benefits and weaknesses of employing a growth
diagnostic, including these:
Aghion, Philippe and Steven Durlauf (2007b). ―Growth Regressions and Policy Evaluation‖.
Manuscript, Commission on Growth and Development.
Felipe, Jesus and Norio Usui (2008): ―Rethinking the Growth Diagnostics Approach: Questions
from the Practitioners‖. Asian Development Bank. Version of February, 2008.
Hausmann, Ricardo, Bailey Klinger and Rodrigo Wagner (2008). ―Doing Growth Diagnostics in
Practice: A ‗Mindbook‘‖. CID Working Paper No. 177.
Hausmann, Ricardo, Dani Rodrik and Andrés Velasco (2004) ‖Growth Diagnostics.‖ Harvard
University.
Leipziger, Danny and Roberto Zagha (2006): ―Getting Out of the Rut‖. Finance and
Development (IMF). Vol. 43, No. 1.
Rodriguez, Francisco (2005): ―Comment on Hausmann and Rodrik‖ Journal of the Latin
American and Caribbean Economic Association, Vol. 6, No. 1, pp. 101-110.
Rodrik, Dani (2009). ―Diagnostics Before Prescription‖. Paper prepared for a Journal of
Economic Perspectives Symposium on Development Economics.

10
3. An Economic Overview for El Salvador
A. Macroeconomic Situation
In its recent history, El Salvador has enjoyed macroeconomic stability and made progress in
structural reforms introduced in the 1990‘s. In fact, since 1989, successive Salvadoran
governments have implemented a number of economic, monetary and fiscal reforms designed to
create stability and growth in the economy. The benefits of these reforms have been evidenced
by average, annual real GDP growth of 4.7 percent from 1992 to 2000.
Table 3.1: Macroeconomic Indicators of the Salvadoran Economy
Year
Per Capita
GDP (1)
(USD)
Real GDP
growth rate
(percent)
Inflation
(percent)
Current
Account
(Million USD)
International
Reserves
(Million USD)
Net Barter
Terms of
Trade
Index(2)
2000 2,211.8 2.2 4.3 -430.5 1,890.9 96.59
2001 2,315.0 1.7 1.4 -150.3 1,709.5 98.34
2002 2,388.8 2.3 2.8 -405.1 1,588.8 96.99
2003 2,504.3 2.3 2.5 -702.2 1,905.8 91.18
2004 2,621.1 1.9 5.4 -641.9 1,888.3 87.32
2005 2,825.7 3.6 4.3 -621.6 1,829.4 87.05
2006 3,054.2 3.9 4.9 -765.6 1,907.2 83.86
2007 3,296.6 3.8 4.9 -1216.6 2,197.5 76.68
2008 3,499.1 1.3 5.5 -1532.2 2,540.9 79.26
2009 3,358.1 -3.1 -0.2 -304.2 2,984.8 80.30
2010 3,431.1 1.4 2.1 -488.3 2,882.1 74.84
(1) Current USD
(2) The Net Barter ToT Index is an annual coincident Laspeyres chained index, i.e. with a mobile base year.
Source : Reserve Central Bank of El Salvador
From 2001 to 2004, real GDP grew by just 2.1 percent and was affected by two earthquakes,
flooding and drought and increasing oil prices. From 2005 to 2007, the growth rate increased to
3.8 percent, which was accompanied by an acceleration of inflation, although inflation rates
remained below 5 percent. The current account deficit also deepened from 2005 to 2007, since
growth recovery incentivizes imports. Financing of the current account deficit was sufficient and
also allowed the country to accumulate net international reserves, amounting to USD1,907

11
million in 2006 and increasing nearly one billion dollars to USD2,882.1 million at the end of
2010.
With the global economic crisis, El Salvador‘s economy slowed and contracted in 2008 and
2009. Real GDP growth in 2008 was 1.3 percent as consumption slowed with a reduction in
remittances and weaker activity in the local economy. Fixed capital formation decreased by 5.4
percent due to a 7.4 percent drop in private sector investment that was partially offset by an
increase in public sector investment of 10.5 percent. Real exports of goods and services
increased by 6.9 percent, and real imports of goods and services increased by 3.3 percent.
Real GDP contracted by 3.1 percent in 2009. Almost all sectors contracted in 2009, particularly
the mining sector, which registered a 15.4 percent decline, and finance and insurance, which
registered a 5.4 percent decline. Since imports declined that year, the current account deficit
decreased to USD304.2 million, and capital flows financing this deficit allowed net international
reserves to increase by USD444 million.
After shrinking by 3.1percent in 2009, the Salvadoran economy recovered by 1.4 percent in real
terms in 2010. Despite weak domestic demand, inflation reached 2.1 percent due to the impact of
storms in October on some agricultural prices, which occurred concurrently with reductions in
energy subsidy rates in the same month. As for the external sector, the current account registered
a deficit of 2.3 percent. The current account deficit growth of almost 1 percent in terms of GDP,
compared with that reported in 2009 (1.5 percent of GDP) was the result of rising oil prices,
relative improvement in import demand and a slowdown in remittance flows.
The improvement in economic performance, coupled with the effect of the tax reform of 2009
and advances in the targeting of subsidies, has resulted in a reduction of the public sector deficit
from 5.7 percent of GDP in 2009 to 4.3 percent of GDP in 2010.

12
Figure 3.2: Current Account and Real GDP Growth Rate
Source : Reserve Central Bank of El Salvador
Some recent government reforms include:
Dollarization of the economy, which went into effect on January 1, 2001, fixing the colón
(SVC) to the U.S. dollar (USD) at SVC8.75 to USD1.00, allowing free circulation of the U.S.
dollar in the Salvadoran economy, and making the U.S. dollar the unit of account for El
Salvador‘s financial sector. These reforms were intended to permanently stabilize the value
of the colón against the U.S. dollar, reduce interest rates, increase the local savings rate,
control inflation, encourage foreign investment, and simplify the management of the
economy. For all practical purposes, the colón no longer circulates as currency in the
country.
Encouraging the establishment of free trade zones by eliminating certain tariffs and adopting
laws allowing unrestricted repatriation of earnings by foreign companies, while providing
rebates for duties on certain exports.
Implementing new free trade agreements (FTAs) with Mexico, Chile, the Dominican
Republic, Panama, Taiwan, Colombia and the United States. El Salvador also entered into
the U.S.-Dominican Republic-Central America Free Trade Agreement (CAFTA-DR) with
the United States, and entered an association agreement with European Union in 2010.
Modernizing the banking sector in El Salvador through the privatization of commercial banks
and savings and loan associations in order to promote competition and the development of a
stronger financial system. Currently there are 12 banking institutions, 10 of which are
foreign-owned banks and 2 of which are state-owned banks. There are no private domestic
banks in El Salvador.
-430.5
-150.3
-405.1
-702.2-641.9 -621.6
-765.6
-1216.6
-1532.2
-304.2
-488.3
-1800
-1600
-1400
-1200
-1000
-800
-600
-400
-200
0
-4.5
-3.5
-2.5
-1.5
-0.5
0.5
1.5
2.5
3.5
4.5
2000 2001 2002 2003 2004 2005 2006 2007 2008 2009 2010
Current Account (Mill. US$)
Real GDP growth rate (%)

13
Reforming the pension system with the creation of a new system, when a substantial portion
of the public ―pay-as-you-go‖ pension system was replaced by a private system based on
individual contributions.
Implementing a series of tax reforms, including the introduction of the value added tax
(VAT) in 1992 and an increase in the VAT rate from 10 percent to 13 percent in 1995.
Subsequent tax reforms were implemented in 2004 and 2009 aimed at closing loopholes,
strengthening tax and customs administration, widening the tax base, increasing the penalties
under the tax code for violations of the value added tax and income tax provisions as well as
the applicable penalties under the Penal Code and Civil Code, and introducing penalties for
customs violations.
Continuing to modernize public sector institutions, reducing the size of the central
government by decreasing the public sector workforce and combining ministries.
Promoting tourism by enacting laws and regulations to foster the development of the tourism
sector, and using revenue from taxes on lodging and airport departures to develop the
tourism sector. These revenues go to the Ministry of Tourism in order to fund the
promotional activities of the sector, among other activities.
Investing in infrastructure projects, including the construction of a major port facility at La
Unión, completed in 2008; the construction and expansion of the thermal power plant in
Atéos to generate an additional 50megawatts (MW), completed in 2008; the construction of a
66MW hydroelectric plant known as ―El Chaparral‖, expected to be completed in 2014; and
a highway in the northern region of the country that will connect the eastern region with the
western region of the Republic, expected to be completed in 2012.
Implementing the Plan Nacional de Educación 2021 (the ―2021 National Education Plan‖), a
comprehensive education plan which will improve school facilities, provide greater access to
computers and the Internet, and establish technological institutes. In addition, the Programa
Red Solidaria (currently known as Comunidades Solidarias Rurales, ―Mutual Aid
Communities‖) provides monetary assistance to rural families that enroll their children in
school, among other things. In 2009, the Mutual Aid Communities expanded its coverage to
urban areas in poverty.

14
B. Production
Table 3.3: Gross Domestic Product by Sector (as percent of real GDP)
Year
Agriculture,
Livestock,
Forestry &
Fishing
Mining Manufacturing
Electricity,
Gas &
Water
Construction Services
(percent) (percent) (percent) (percent) (percent) (percent)
1990 17.1 0.4 21.7 1.2 3.5 56.2
2000 12.3 0.4 23.0 0.6 3.6 60.1
2001 11.8 0.4 23.6 0.6 3.9 59.8
2002 11.5 0.4 23.7 0.7 4.0 59.7
2003 11.4 0.5 23.7 0.7 4.1 59.8
2004 11.5 0.4 23.5 0.7 3.6 60.4
2005 11.7 0.4 23.0 0.7 3.6 60.6
2006 11.9 0.4 22.7 0.7 3.7 60.7
2007 12.4 0.4 22.4 0.7 3.3 60.9
2008 12.6 0.3 22.6 0.7 3.0 60.8
2009 12.6 0.3 22.6 0.7 3.0 60.7
2010 12.9 0.2 22.8 0.7 2.8 60.6
Source : Reserve Central Bank of El Salvador
After centuries of dependence on agricultural products, the Salvadoran economy has come to
rely on the service sector and manufacturing activity, which accounted for 60.6 percent and 22.8
percent of constant GDP in 2010, respectively. From 1990 to 2010, the agricultural sector
reduced its share of GDP from 17.1 percent to 12.9 percent and the services sector increased its
share from 56.2 percent of GDP to 60.6 percent. Manufacturing has maintained its share around
23 percent in the same period.
The main components of the services sector are: (a) Commerce, restaurants and hotels (32.8
percent of total services in 2010); (b) Transportation, storage and communication (15.6 percent)
and; (c) Residential leasing (13.2 percent).
From 2000 to 2010, government services maintained a moderate share of GDP, in line with
budgetary discipline pursued with fiscal reform and expenditure constraints, from 9.1 percent of
GDP in 2000 to 8.3 percent in 2010. The finance and insurance sector maintained its share at
around 6 percent of GDP, growing at the same rate as the overall economy, while the
transportation, storage and communications sector increased its share from 14.1 percent of GDP
in 2000 to 15.6 percent of GDP in 2010.

15
Table 3.4: Participation of Sub-sectors within the Service Sector, 2000-2010
(percent of total service real GDP)
Sector 2000 2001 2002 2003 2004 2005 2006 2007 2008 2009 2010
Commerce, restaurants
and hotels 33.1 33.4 33.2 33.2 33.0 33.4 33.6 33.7 33.6 32.9 32.8
Transportation, storage
and communications 14.1 14.6 15.0 15.1 15.5 15.9 16.3 16.4 16.1 15.7 15.6
Finance and Insurance 6.4 6.4 6.3 6.3 6.4 6.3 6.3 6.2 6.1 5.9 6.1
Real estate and
business service
activities
5.3 5.4 5.4 5.3 5.3 5.3 5.3 5.3 5.4 5.6 5.7
Residential leasing 13.9 13.4 13.6 13.7 13.5 13.3 13.0 12.8 12.8 13.3 13.2
Community, social,
personal and domestic
services
8.5 8.3 8.3 8.1 8.1 7.7 7.7 7.7 7.8 8.1 8.2
Government services 9.1 9.0 8.6 8.4 8.2 8.0 7.8 7.7 7.8 8.2 8.3
Other service activities 9.5 9.6 9.7 9.8 10.0 10.0 10.0 10.1 10.3 10.3 10.2
Source : Reserve Central Bank of El Salvador
Table 3.5: Participation of Sub-sectors within the Manufacturing Sector, 2000-2010
(percent of total manufacturing GDP)
Sector 2000 2001 2002 2003 2004 2005 2006 2007 2008 2009 2010
Maquila (assembly for re-
export)
13.0 13.3 13.3 13.5 13.0 11.9 11.0 9.8 9.9 9.4 9.9
Chemicals 8.4 8.4 8.4 8.5 8.5 8.6 8.6 8.8 9.0 9.7 9.6
Baked goods 8.4 8.6 8.4 8.6 8.8 9.0 9.3 9.6 9.6 9.5 9.6
Beverages 8.7 8.8 8.6 8.2 8.3 8.3 8.2 8.3 8.4 8.6 8.5
Sugar 7.1 7.0 6.7 7.0 7.3 7.5 7.3 7.4 7.3 7.6 7.6
Other processed foods 6.4 6.5 6.8 6.8 6.9 6.9 7.1 7.1 7.0 7.4 7.6
Printing and related industries 4.7 4.9 5.2 5.3 5.5 5.6 5.5 5.8 5.8 5.9 5.6
Metallic mineral products 4.5 4.5 4.5 4.5 4.7 4.8 4.7 4.7 4.8 4.8 4.9
Refined oil products 5.0 5.1 5.0 4.9 4.6 4.7 4.8 5.0 4.9 3.9 3.4
Textiles 5.8 5.2 5.0 4.8 4.8 5.1 5.1 5.2 5.2 5.4 5.4
Non-metallic mineral products 4.3 4.5 4.8 4.7 4.2 4.2 4.4 4.3 4.4 4.2 4.0
Leather and related products 3.9 3.8 3.6 3.6 3.7 3.7 3.7 3.9 3.9 3.9 3.8
Transport supplies and diverse
manufacturing products
3.6 3.5 3.6 3.6 3.6 3.5 3.6 3.5 3.5 3.6 3.6
Paper and cardboard 2.5 2.6 2.8 2.9 2.9 2.9 3.0 3.1 3.0 3.2 3.4
Milk products 3.0 3.0 3.0 3.0 3.1 3.1 3.1 3.2 3.1 3.1 3.1
Machinery and equipment 3.2 3.1 3.1 3.1 3.1 3.1 3.2 2.8 2.8 2.7 2.7
Plastic products 2.4 2.4 2.4 2.4 2.4 2.5 2.5 2.6 2.5 2.5 2.5
Meat packaging and related
products
1.9 1.9 1.8 1.7 1.7 1.7 1.7 1.8 1.7 1.7 1.7
Apparel 2.0 1.8 1.8 1.8 1.9 1.9 1.9 1.8 1.8 1.8 1.8
Lumber and related products 1.2 1.2 1.2 1.2 1.2 1.2 1.2 1.2 1.2 1.2 1.2
Other 0.0 0.0 0.0 0.0 0.0 0.0 0.0 0.0 0.0 0.0 0.0 Source : Reserve Central Bank of El Salvador

16
Within the manufacturing sector, maquila activity (assembly for re-export) is the most important,
accounting for 9.9 percent of sectoral value added in 2010. Chemical manufacturing is the next-
largest subsector, reaching a 9.6 percent share in 2010. Baked goods, beverages, sugar, and
other processed foods are also significant contributors to the manufacturing sector.
C. Trade in Goods
El Salvador has traditionally had an open economy, and this characteristic has deepened in the
last decade. For instance, imports as a share of GDP steadily increased from 58.7 percent in
2000 to 69.4 percent in 2008, while exports‘ share of GDP increased from 37.9 percent to 43.3
percent in the same period. After deterioration of international trade following the global crisis,
in 2009 exports represented 37.6 percent of GDP, and imports 53.9 percent of GDP, since
exports and imports declined amid the international crisis. In 2010, El Salvador´s main trade
partners‘ recovery helped boost the trade sector, allowing exports to reach 41.6 percent of GDP,
and imports 59.1 percent of GDP.
Figure 3.6: Export and Import Shares of Constant GDP (percent of GDP)
Source : Reserve Central Bank of El Salvador
37.9 37.2 38.5 39.4 40.1 39.1 39.8 41.043.3
37.6
41.6
58.760.1 59.6
61.1 61.5 62.065.0
68.1 69.4
53.9
59.1
0.0
10.0
20.0
30.0
40.0
50.0
60.0
70.0
80.0
2000 2001 2002 2003 2004 2005 2006 2007 2008 2009 2010
Exports of Goods and Services (%)
Imports of Goods and Services (%)

17
Figure 3.7: El Salvador’s Trade in Goods, 2000-2010 (million USD)
Source : Reserve Central Bank of El Salvador
The trade dependency ratio increased from 60.1 percent of GDP in 2000 to 67.5 percent in 2008.
As a consequence of the international financial crisis of 2009, that share reduced to 54.2 percent
in 2009 and reached 61.3 percent in 2010. It is expected to recover to previous levels, since the
country‘s major trade partners have shown higher growth in the past year.
Figure 3.8: Trade Dependency of El Salvador (percent of total GDP)
2,941 2,864 2,995 3,128 3,305 3,4373,730
4,0154,641
3,8664,499
4,948 5,027 5,1845,754
6,3296,809
7,763
8,821
9,818
7,325
8,498
-2,007 -2,163 -2,190-2,626 -3,024 -3,373
-4,033-4,806 -5,177
-3,459
-3,999
-6,000
-4,000
-2,000
0
2,000
4,000
6,000
8,000
10,000
12,000
2000 2001 2002 2003 2004 2005 2006 2007 2008 2009 2010
Exports of Goods
Imports of Goods
Trade Balance
60.1
57.1 57.2
59.0
61.059.9
62.0
63.8
67.5
54.2
61.3
40.0
45.0
50.0
55.0
60.0
65.0
70.0
2000 2001 2002 2003 2004 2005 2006 2007 2008 2009 2010

18
Source : Reserve Central Bank of El Salvador
El Salvador‘s trade balance is in deficit because export growth has been less dynamic than
import growth. From 2000 to 2008, the export of goods increased from USD2941 million to
USD4641 million, while imports increased from USD4948 million to USD9818 million. This
performance resulted in an increasing trade deficit, from USD2007 million to USD5177 million.
The main reason for the trade deficit is the inflow of worker remittances from the United States,
which has allowed the country to access more foreign goods. In 2009, exports, imports and the
trade deficit shrank as a result of the recessionary effects of the global economic crisis. In 2010,
the deficit increased as imports regained growth, ahead of domestic growth recovery at 1.4
percent.
Figure 3.9: El Salvador’s Exports by Sector according to the Central American Tariff
Schedule, 2010 (percent of total)
Source: Central Reserve Bank of El Salvador
Maquila
Textile and Textile Articles
Prepared Foodstuffs,Beverages, Spirits and Vinegar
Vegetal Products
Plastics, Rubber and ArticlesThereof
Pulp of Wood, Paper,Paperboard and its waste
Base Metals and Articles ofBase Metals
Products of the ChemicalIndustries
Minerals Products
Other

19
Figure 3.10: El Salvador’s Imports by Sector according to the Central American Tariff
Schedule, 2010 (percent of total)
Source: Central Reserve Bank of El Salvador
D. Trade in Services
El Salvador has a deficit in service trade, since imports have been larger than exports. From 2000
to 2008, service exports increased from USD698 million to USD1.06 billion, while imports grew
from USD933 million to USD1.27 billion. The deficit reduced slightly from USD235 million to
USD213 million in the same period. In 2009 and 2010, service exports, service imports and the
deficit all shrank to less than USD 100 million as a consequence of the recessionary effects of
the crisis.
Minerals Products
Machinery and MechanicalAppliances; Electrical Equipment
Productos de las IndustriasQuímicas y Conexas
Textile and Textile Articles
Maquila
Live Animals, Animal andVegetable Products
Prepared Foodstuffs, Beverages,Spirits and Vinegar
Plastics, Rubber and ArticlesThereof
Base Metals and Articles of BaseMetals
Pulp of Wood, Paper,Paperboard and its waste
Other

20
Figure 3.11: El Salvador’s Trade in Service (million USD)
Source : Reserve Central Bank of El Salvador
The primary services that El Salvador exports are transportation and travel services, which,
combined, account for almost 73 percent of total export services. Travel services represented
about 40 percent of the sector in 2010, transportation was roughly 31 percent, and
communications was about 18 percent.
698 704
783
949 951 946
1,015
1,134
1,058
863
976
933954
1,0231,055
1,030
1,075
1,179
1,275 1,271
953
1,070
0
200
400
600
800
1000
1200
1400
2000 2001 2002 2003 2004 2005 2006 2007 2008 2009 2010
Services, credit Services, debit

21
Figure 3.12: El Salvador’s Export in Services (percent of total)
Source: Reserve Central Bank of El Salvador
0%
10%
20%
30%
40%
50%
60%
70%
80%
90%
100%
2000 2001 2002 2003 2004 2005 2006 2007 2008 2009 2010Others Insurances Communications Travels Transport

22
Figure 3.13: El Salvador’s Import in Services (percent of total)
Source: Reserve Central Bank of El Salvador
The top three imported services are transportation, travel and insurance, accounting for 75
percent of total imported services. In 2010, the transportation import share was 43 percent, and
the travel import share was 20.5 percent. Insurance services have been increasing and reached
nearly 11.7 percent of imports in 2010.
In 2010, the service trade deficit amounted to USD94 million. This deficit is mainly explained
by the USD160 million deficit in the transportation sector, and the USD96 million deficit in the
insurance sector. The travel services surplus amounted to USD171 million, and the
communication sector surplus was USD132 million. The total surplus was less than the deficit,
creating a net trade deficit in the service sector.
0%
10%
20%
30%
40%
50%
60%
70%
80%
90%
100%
2000 2001 2002 2003 2004 2005 2006 2007 2008 2009 2010
Others Other Enterprises Services Government Services
Insurances Communications Travels
Transport

23
Figure 3.14: El Salvador’s Trade in Service in 2010 (million USD)
Source : Reserve Central Bank of El Salvador
E. Foreign Direct Investment in El Salvador
The stock of foreign direct investment increased from USD1973 million in 2000 to USD7760
million in 2010, mainly directed to the financial and manufacturing industries, whose shares of
total investment reached 36.0 and 21.6 percent for 2010, respectively. The industry receiving the
third highest FDI was energy supply, with a share of 13.7 percent, and the fourth was wholesale
and retail commerce, with 8.5 percent.
301
461
390
219
172
40 29
126
84
225
0
50
100
150
200
250
300
350
400
450
500
Credit Debit Credit Debit Credit Debit Credit Debit Credit Debit
Transportation Travel Communications Insurance Other business

24
Figure 3.15: El Salvador’s Inward FDI Stock (million USD)
Since 2009 includes information from "fellows enterprises", and reserves in the form of direct investment and investment data
are presented on a net basis, the assets are deducted from the liabilities.
Table 3.16: El Salvador’s Net FDI by Receiving Economic Sector,
Stock at end-2010 (million USD)
Sector
Invested Amount
(USD millions)
Share of total
investment
(percent)
Agricultural 2.7 0.03
Minery 44.3 0.6
Manufacturing Industries 1676.2 21.6
Energy Supply 1064.5 13.7
Construction 21.1 0.3
Wholesale and Retail Commerce 662.7 8.5
Transport and Storage 17.1 0.2
Communications and Information 1248.6 16.1
Financial and Insurance Activities 2796.2 36.0
Other Sectors 226.6 2.9
Investment data are presented on a net basis, i.e. direct investment assets are deducted from liabilities.
Source : Reserve Central Bank of El Salvador
0
1000
2000
3000
4000
5000
6000
7000
8000
9000
2000 2001 2002 2003 2004 2005 2006 2007 2008 2009 2010

25
Figure 3.17. El Salvador’s Net Inward FDI by Country, 2010 Stock (million USD)
Source: Central Reserve Bank of El Salvador
From a country of origin perspective, the largest amount of FDI came from the United States
(USD2.53 billion), Panama (USD2.11 billion), and Mexico (USD775 million).
0
500
1000
1500
2000
2500
3000

26
4. Cost of Finance
A necessary condition for investment is that the returns on investment should be higher than the
interest rate. If investment as a percentage of the GDP is low (and it was an average of 15.3
percent from 1980-2009 in El Salvador)1, then it is expected that either private returns on
investment are low, or interest rates are high (or there is rationing of credit).
In particular, long-term productive investment decisions are conditional to the marginal
efficiency of the capital (Emc) being higher than the interest rate (i). That is to say, that the price
of capital assets (pf) depends on the expected flow of profits (U) with regard to the marginal
efficiency of the capital (U/Emc). If marginal efficiency of capital is higher than the price of
financial assets (i), the price of capital goods (pf, or profit) would be normal, and capital
production would continue. Minsky (2008) argues that the price of capital goods has a close
relationship with the price of current production, because productive investment forms part of
production.2
In the opinion of Hausmann (2004), capital yields in El Salvador are low, a situation that results
in low investment with regard to GDP, and explains a low historical economic growth rate.
Figure 4.1 confirms how capital productivity has been below the real deposit interest rate,
discouraging investment. The margin of production of goods has fluctuated around real interest
rates, therefore it is not profitable to engage in production.
1 The Latin American average is 24.1 percent
2 ―The price of current output and all capital assets depend upon different variables and are determined in different
markets. The prices however are linked, for investment output is part of current output‖ (Minsky 2008, 195-196). It
then means that the price of the offer (P0) is equal to ( . AC is the average productivity of labor. W is the
wage rate in money and M is the mark up on per unit labor cost. The price of capital assets (PK), is re-written as=
K(πi), i=1,…,n. In which K is the function of capitalization. PK and P0 are linked as investment goods, once
produced, become capital assets.

27
Figure 4.1: Real lending and deposit interest rates, capital productivity and profit margins
of goods
Fig. 4.2 illustrates how we will look at the node of finance: we will first examine whether it is
the cost of finance or returns to economic activity that is more responsible for low investment,
and then we will look at access to external finance and domestic savings; finally, we will look at
financial intermediation and possible reasons for it being a constraint: low competition, high
cost, or high risk. Financial intermediation is the work that banks and financial institutions do in
collecting savings and deposits and lending them out to businesses and individuals in the
economy.
-10
-5
0
5
10
15
201
99
1
19
92
19
93
19
94
19
95
19
96
19
97
19
98
19
99
20
00
20
01
20
02
20
03
20
04
20
05
20
06
20
07
20
08
20
09
Lending rate (short-term) Deposit rate (180 day)
Capital Productivity Profit margins on goods

28
Figure 4.2: Constraints in Costly Financing
A. Interest Rates
We begin with the first decision node on investment by considering the price of private
investment: the real interest rate. The growth diagnostic approach suggests that if we find that
the real interest rate is not abnormally high relative to historical values or comparator countries,
we can infer that investment demand, and not investment supply (financing) may be the problem.
Figure 4.3 is a scatterplot of GDP per capita versus the real interest rate for El Salvador relative
to comparator countries in Latin America (red squares) and the World Bank middle-income
group (blue diamonds). Based on its income, El Salvador‘s real interest rate is squarely in the
middle of the sample. As Table shows, El Salvador‘s real interest rate is not statistically
different from that of its comparator countries, lying well within a standard deviation relative
both to Latin America/Dominican Republic and middle-income countries.
Costly Financing
Deficient International Financing
Deficient Domestic Financing
Low Domestic Savings Deficient Financial
Intermediation
Low competition
High risk High cost
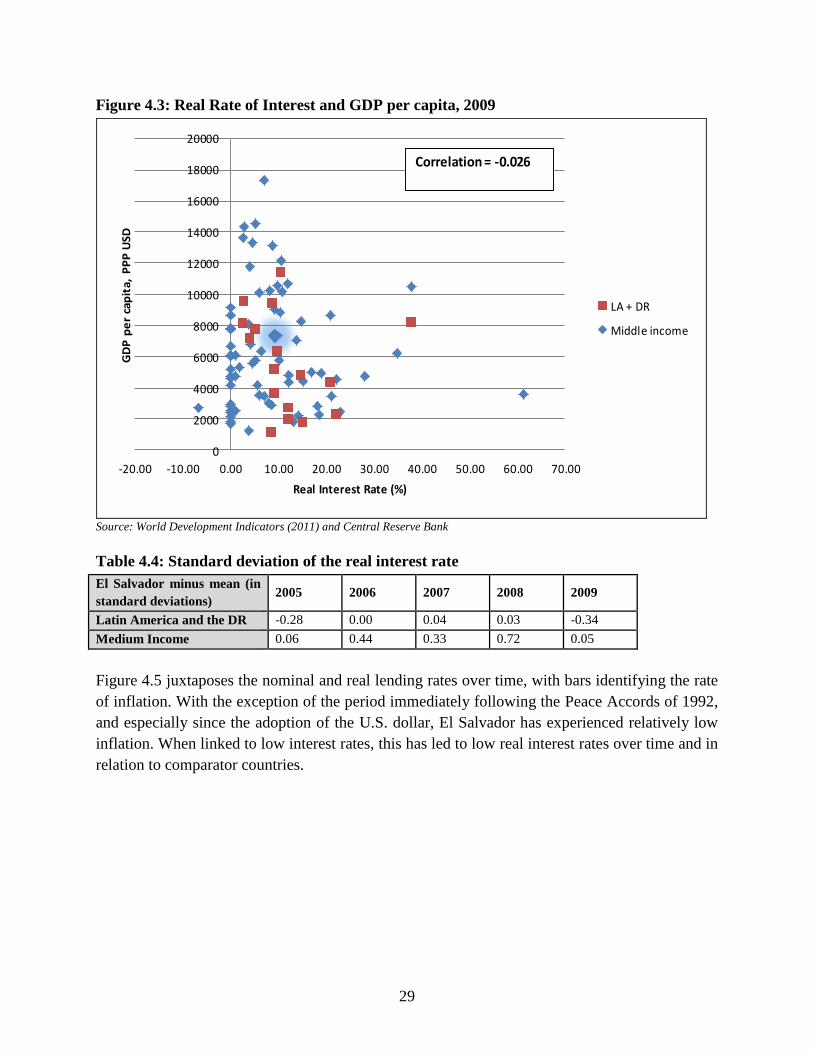
29
Figure 4.3: Real Rate of Interest and GDP per capita, 2009
Source: World Development Indicators (2011) and Central Reserve Bank
Table 4.4: Standard deviation of the real interest rate
El Salvador minus mean (in
standard deviations) 2005 2006 2007 2008 2009
Latin America and the DR -0.28 0.00 0.04 0.03 -0.34
Medium Income 0.06 0.44 0.33 0.72 0.05
Figure 4.5 juxtaposes the nominal and real lending rates over time, with bars identifying the rate
of inflation. With the exception of the period immediately following the Peace Accords of 1992,
and especially since the adoption of the U.S. dollar, El Salvador has experienced relatively low
inflation. When linked to low interest rates, this has led to low real interest rates over time and in
relation to comparator countries.
0
2000
4000
6000
8000
10000
12000
14000
16000
18000
20000
-20.00 -10.00 0.00 10.00 20.00 30.00 40.00 50.00 60.00 70.00
GD
P p
er
cap
ita,
PP
P U
SD
Real Interest Rate (%)
LA + DR
Middle income
Correlation = -0.026

30
Figure 4.5: Real and Nominal Rates of Interest on Loans, and Inflation
Source: World Development Indicators (2011) and Central Reserve Bank
Figure 4.6 compares the real interest rate with that in other Latin American countries for 2007,
2008, and 2009.
Figure 4.6: Real Rates of Interest on Loans (Latin American Countries)
Source: World Development Indicators (2011) and Central Reserve Bank
The relationship between interest rates and investment rates also can tell us about the level of
investment demand in a country. Figure 4.7 juxtaposes average real interest rates and investment
in a scatterplot of data from 2007 to 2009. Although El Salvador had an average real interest
rate similar to those of Colombia and the Republic of Congo in 2007-2009, the investment share
of GDP was significantly lower. This suggests that El Salvador has a lower investment demand
curve, i.e. a fewer number of projects that can produce a certain rate of return.
-2
0
2
4
6
8
10
12
0
5
10
15
20
25
1983 1985 1987 1989 1991 1993 1995 1997 1999 2001 2003 2005 2007 2009
Inflation Nominal lending rate Real lending rate
-10.00-5.000.005.00
10.0015.0020.0025.0030.0035.0040.0045.00
2007 2008 2009

31
Figure 4.7: Real Average Rates of Interest on Loans and Investment (Percentage of GDP)
for Latin American Countries
Source: World Development Indicators (2011) and Central Reserve Bank
Figure 4.8 displays graphically the relationship between investment and real interest rates.
According to Hausmann et al (2008), access to finance is a binding constraint if a reduction in
interest rates leads to an increase in the investment rates. As shown in Figure 4.8, the
relationship between investment and real interest rates has formed a downward-sloping curve
since 2006, suggesting that changes in the quantity of investment were affected primarily by
supply shocks during that time. Note the rather small percentage change: a 1.5-percentage-point
increase in the real interest rate from 2006 to 2009 led to only a 2.8-percentage-point drop in
gross capital formation as a percentage of GDP. This evidence supports the conclusion that
access to finance may be a binding constraint, but if so it affects only a small part of the
economy. In addition, our analysis focuses on the posted interest rates, which may in fact only be
available to a few prime borrowers, especially in developing countries.
-10.00
-5.00
0.00
5.00
10.00
15.00
20.00
25.00
30.00
35.00
40.00
0 10 20 30 40 50 60 70 80
Ave
rage
re
al in
tere
st r
ate
(%
)
Average GCF as % of GDP
LA + DR
Middle income

32
Figure 4.8: Investment vs Real Interest Rates
Source: World Development Indicators
B. Small and Medium Enterprise (SME) Credit
Access to credit for SMEs is an area commonly lacking reliable statistics such as interest rates or
share of SME credit in most countries (IDB 2005, 187). According to the Inter-American
Development Bank, ―In general, there are four main causes of credit problems for small firms:
fixed lending costs [for smaller loans], imperfect enforcement of credit contracts, bankruptcy
costs, and asymmetric information‖ (IDB 2005, 191).
Fixed costs of lending to SMEs include assessing, monitoring and recovery. The cost per loan is
higher than for larger loans if lenders use the same rating system and credit evaluation process.
However, lending technology to SMEs of late has increased in specialization, which has
produced greater efficiencies in granting loans to SMEs, and lower fixed costs.
The imperfect enforcement of credit contracts increases bank losses in case of default. Hence,
banks are unwilling to lend to SMEs without collateral that exceeds the loan amount. Regarding
bankruptcy costs, according to the IDB, ―Even without bankruptcy costs, it is reasonable to
expect banks to charge a higher interest rate to firms with more leverage because, other things
equal, banks will recover a smaller share of loans to such firms in the event of bankruptcy‖ (IDB
2005, 193).
Finally, there is the risk of asymmetric information, moral hazard and adverse selection. These
raise information costs for the bank to understand the repayment capacity of SMEs and
strengthen their system of risk measurement. One way banks get around this is using more
collateral for the value of credit.
2000
2001
2002
20032004
2005
200620072008
2009
slope = -0.18(since 2006 = -0.56)
6.0
6.5
7.0
7.5
8.0
8.5
9.0
9.5
10.0
10.5
11.0
12 13 14 15 16 17 18
Re
al I
nte
rest
Rat
e (
%)
Gross capital formation (% of GDP)

33
In the next section, we then focus our examination on the hypothesis that small and medium
enterprises (SMEs) find credit to be a binding constraint to their investment and growth. This is
important because micro firms and SMEs contribute roughly 43 percent of GDP and 65 percent
of employment (MINEC 2005). The BCR‘s survey on credit market conditions shows that
during 2009, SMES tended to be the ones suffering from the credit crunch (see Figures 4.9 and
4.10.)
The Financial Sector Assessment (International Monetary Fund and The World Bank 2010, 20)
maintains that some regulatory standards requirements also limit access to credit for the SMEs.
These include requirements from the commercial code, tax code, and anti-money laundering
regulations, which require the presentation of financial statements and proof of tax payments.
There are standards that favor granting consumption credits over entrepreneurial credits, such as
NCB-022 issued by the Superintendence of the Financial System.
Figure 4.9: Banks’ Granting of New Credit during 2009
Source: Reserve Central Bank, 2010

34
Figure 4.10: Changes to Credit Granting Conditions by Type of Company
Source: Reserve Central Bank, 2010
The main changes that occurred during the crisis were shorter tenors, higher interest rates, and
greater amounts of collateral, particularly for small and medium enterprises (SMEs) and
microenterprises.
In the following section we apply the four tests of the HRV methodology for binding constraints,
and conclude that in El Salvador, deficient intermediation in credit does not constitute a binding
constraint for SMEs‘ investment.3
3 The SSF defines micro firms as those with up to SVC 600,000 (USD68,580) in annual sales and up to 10
employees. Small firms have SVC 600,000-6m (USD68,580-685,500) in annual sales and 10-49 employees.
Medium firms have SVC6m-40m (USD685,500-4.6m) in annual sales and 50-200 employees.
0
1
2
3
4
5
Large firms Medium Small & micro
Nu
mb
er
of
ba
nks w
ith
re
sp
on
se
More collateral
Shorter tenor
Smaller amounts
Higher rates

35
The Shadow Price of the Constraint should be High
Table 1.11: Loan terms and amounts of commercial banks, cooperative banks and savings
and loans associations
Loan terms March 2011
6 months
Up to $1000
$1000-$5000
More than $5000
20.03%
11.53%
6.35%
6-12 months
Up to $1000
$1000-$5000
More than $5000
29.88%
12.63%
6.39%
Longer than 12 months
Up to $1000
$1000-$5000
More than $5000
22.47%
14.04%
7.97% Source: Reserve Central Bank, 2011
As we can see from the current snapshot shown in Table 1.11 above, SMEs in El Salvador pay
significantly higher interest rates for the same term than do larger borrowers (who presumably
take out larger loans). However, comparator information on the interest premium that SMEs pay
is not available for Latin America or other countries, especially since the definition of SMEs
differs by country. Nonetheless, the implicit cost to access credit includes active rates and
commissions and also includes the required collateral, which in the case of the small enterprise
can go as high as 174 percent of the value of the credit. This is far above the requirement for
medium and large enterprises and far exceeds the mean for the Latin American region (117
percent) (Figures 4.11 and 4.12).

36
Figure 4.11: Value of Collateral Necessary for Obtaining a Loan (as percent of Loan
Amount )
Source: (World Bank, Enterprise Survey 2006)
Figure 4.12: Value of Collateral Necessary for Obtaining a Loan (as percent of Loan
Amount)
Source:World Bank Enterprise Survey 2006
The credit survey carried out by the BCR confirms that collateral requirements increased for
micro, small and medium enterprises (MSMEs) during 2009. It would appear that lenders
observe the higher credit risk of small firms and charge them accordingly. This is corroborated
by anecdotal reports of commercial banks exiting the lending market for smaller firms (WB and
IMF 2010). The general problems of delays in executing collateral through the legal system and
lack of credit history are worse constraints for small firms compared to others (International
Monetary Fund and The World Bank 2010), and yet they tend to have fewer assets to pledge than
150.8%
125.1%
0 50 100 150 200 250
Uruguay
Paraguay
Argentina
Ecuador
El Salvador
Mexico
Rep Dom
Nicaragua
Guatemala
Mediana
Venezuela
Colombia
Costa Rica
Peru
Chile
Panama
Honduras
174.2%
114.2%
130.2% 117.3%
116.2% 130.2%
146.6% 137.5%
144.5%
Small Medium Large
El Salvador LA Median Lower Middle Income

37
do larger firms. Net interest margins are also slightly higher for cooperative banks, who lend to
consumers and SMEs, than for commercial banks (6 percent in 2009) (SSF data).
In short, borrowing costs are higher for small firms than for large firms, but it is not clear that
this is worse than the situation faced in comparator countries.
Movements in the constraint should produce significant movements in the objective function
On average, only 22 percent of bank financing went to SMEs during the period 2004 to 2009, in
comparison to 70 percent for large firms (See Figure 4.13). Information for SME borrowing
costs over the same time period is not available, although we know that credit granted to SMEs
hovered around 21-23 percent in 2004-2010 and that overall credit, as well as credit to SMEs,
fell sharply in 2009 in response to the financial crisis and a doubling of overall real lending rates
to 10 percent (Table 4.15 below). This reflects sharper contraction in credit relative to overall
GDP, rather than something specific to SME credit, as shown by SME credit as share of total
credit.
Figure 4.13: Loans Granted by the Salvadoran Banking System by Share of Total
Source: Superintendence of the Financial System 2010
Table 4.14: Credit extended to firms, by company size (USD millions)
Firm size 2006 2007 2008 2009 2010
Large 3,339.2 3,333.6 2,992.7 2,509.1 2,685.7
Medium 591.0 658.7 701.3 563.5 625.3
Small 312.9 327.8 220.9 162.9 228.7
Micro 124.7 115.3 226.0 110.5 134.4
Total 4,367.8 4,435.3 4,140.9 3,346.1 3,674.1 Source: Superintendence of the Financial System 2010
72% 72% 76% 75% 72% 75% 73% 75%
16% 16% 14% 15% 17% 17% 17% 15% 6% 6% 3% 3% 5% 3% 4%
3% 6% 6% 7% 7% 5% 5% 6% 7%
28% 28% 24% 25% 28% 25% 27% 25%
0%
10%
20%
30%
40%
50%
60%
70%
80%
90%
2004 2005 2006 2007 2008 2009 2010 2011(Jan-Feb)
Large firms Medium firms Micro firms Small firms Micro and SMEs

38
As shown in Figure 4.15 below, the 2006 World Bank Enterprise Survey data shows that SME
access to bank credit is roughly in line with regional standards, in terms of both percentage of
SMEs with credit and bank financing of SME working capital.4
Figure 4.15: SME Credit and Bank Financing
Unfortunately, we do not have data for comparator countries. According to a BCR survey, the
banks made it slightly more difficult for SMEs to obtain loans from 2008-2009 (See Figures 4.16
and 18.) This challenge has been driven in part by economic uncertainty.
4 The World Bank enterprise surveys define small firms as those with 5-20 employees, medium firms as those with
20-99 employees, and large firms as those with 100+ employees.

39
Figure 4.16: Changes in Requirements for Approving Business Loan Requests during 2008
– 2009 in the Salvadoran Commercial Banking System
Source: Central Reserve Bank based on Superintendence of the Financial System, 2010
Figure 4.17: Factors Contributing to the Credit Reduction
Source: Central Reserve Bank based on Superintendence of the Financial System 2010

40
Figure 4.18: Bank Factors Contributing to the Credit Reduction
Source: Central Reserve Bank on Superintendence of the Financial System, 2010
These survey responses could highlight a ―fan belt effect‖ of the 2008 credit crisis. Pritchett
(2008) references a fan belt effect in which ―an initial binding constraint may have affected the
rest of the economy causing now other constraints to be binding.‖ The frozen credit markets in
2008 lead to concentrated, risk-averse banks that have consequently shifted their credit
allocations away from SMEs in the face of economic uncertainty. Although global credit
markets may have recovered, the long-term effects of the crises linger with SME development in
El Salvador.
Looking then at the relationship between SME investment and output, this test should show that
overall investment or growth increases as access to credit for SMEs improves. The IDB has
found that El Salvador lacks medium and high-productivity firms compared to their regional
peers (Pages 2010, 77), and that marginal productivity (relative to micro firms) is especially high
among medium-sized manufacturing firms.

41
Figure 4.19: MPK & MPL, reproduced from Age of Productivity
We can also look at sectors in the Salvadoran economy that have stronger backward and forward
linkages than the average, weighted by final demand from the 2006 Input-Output tables. These
sectors are compared to the value added of SMEs in total. The sectors that have longer
production chains are basic chemical and metal products, and transport, storage and
communications. These include new industries key to the Salvadoran economy, such as
machinery, equipment and supplies for the maquila industry.

42
Table 4.20: Sensitivity indices of dispersion (SD) and power dispersion (PD) weighted by
final demand, 1990 and 2006
Sector 1990 2006
SD PD Class SD PD Class VBP/OT
10. Mining products 1.04 0.30 Strategic 0.60 0.20 Enclave 0.21
14. Milling and baked products 0.92 0.99 Enclave 0.93 0.93 Enclave 0.75
16. Other processed food
products
1.29 0.85 Strategic 1.51 0.99 Strategic 0.55
19. Textiles and apparel 1.07 0.81 Strategic 1.11 0.85 Strategic 0.38
24. Printing and related
industries
0.72 0.43 Enclave 1.08 0.56 Strategic 0.47
25. Basic and processed
chemicals
3.41 1.25 Key 3.52 1.46 Key 0.32
26. Petroleum refining 4.54 0.77 Strategic 2.83 0.51 Strategic 0.43
27. Rubber and plastic products 0.69 0.53 Enclave 0.98 0.67 Enclave 0.27
29. Basic metal and processed
products
1.05 1.19 Key 1.40 1.36 Key 0.36
30. Machinery and equipment 0.71 0.62 Enclave 1.85 1.19 Key 0.11
31. Transport equipment and
miscellaneous products
1.16 0.60 Strategic 1.67 0.84 Strategic 0.15
34. Construction 0.81 0.99 Enclave 0.85 1.04 Driving 0.99
35. Trade 0.01 20.02 Driving 0.02 17.81 Driving 0.54
36. Restaurants and hotels 0.60 0.72 Enclave 0.68 0.76 Enclage 0.84
37. Transport and storage 11.63 1.11 Key 11.63 1.27 Key 0.83
38. Communications 0.51 0.32 Enclave 1.22 0.82 Strategic 0.94
40. Real estate and business
services
3.36 0.50 Strategic 2.17 0.49 Strategic 0.91
41. Housing rental 0.99 1.02 Driving 0.66 0.73 Enclave 1.00
42. Community, social and
personal services
2.01 0.76 Strategic 1.64 0.70 Strategic 0.88
44. Government services 0.85 1.03 Driving 0.61 0.95 Enclave 1.00
45. Maquila industrial services 0.03 0.11 Enclave 1.13 1.17 Key 0.23 Source: Oscar Cabrera and Morales de Hada (2005 and 2006). MIP 2006 updated by Cabrera (2010)
*If PD<1 and SD>1, the sector is defined as strategic: strong forward linkages
If PD>1 and SD<1, the sector is defined as driving: strong backward linkages
If PD>1 and SD>1, the sector is defined as key: strong linkages in both directions
Tables 1990 and 2006, final
According to the 2005 Economic Census, SMEs represented 59 percent of value added in
chemical industries, 88 percent of value added in machinery and equipment, and 36 percent of
value added in manufacturing of basic and other metals. SMEs contributed 46 percent of value
added in wholesale and retail trade.

43
Table 4.21: Value Added and Employment by 2005 Economic Census
Branches of economic activity
Classification by
size of enterprise Value Added, USD
Employment
(Number)
Manufacturing of Chemicals and
Chemical Products
SMEs $2,247,533 82
total $3,836,251 221
Manufacturing of basic and other
metals
SMEs $15,877,786 1,814
total $46,538,516 4,441
Manufacturing of machinery and
equipment
SMEs $854,694 84
total $969,217 122
Transport
SMEs $396,821,667 14,248
total $1,094,667,322 30,819
Wholesale and retail trade; repair of
motor vehicles and motorcycles
SMEs $1,138,045,120 78,623
total $2,453,392,602 258,137
Simulations with the Input-Output table show that an increase of 5 percent in investment in one
of the key sectors produces multiplier effects in other economic sectors on the order of 0.4
percent to 1.4 percent of GDP. For example, a 5 percent increase in investment in the trade sector
produces a 0.7 percent increase in GDP over the next year. 5 percent increase in investment in
the maquila industry produces a 1.4 percent increase in GDP. The same increase in investment in
chemical industries and machinery and equipment would increase GDP produced in other
industries by 0.5 percent.
Agents in the Economy should be attempting to overcome or bypass the constraint
Firms could get around credit constraints by relying on retained earnings, or remittance income.
Recent studies on remittances show that the vast majority goes towards funding consumption
rather than investment. Firms could also simply apply for bank credit. Salvadoran firms apply for
credit at about the same rate as all of Central America, although they had slightly lower
probability of having loan applications accepted (83 percent vs. 87 percent) (World Bank
Enterprise Survey 2006, Table 4.22). Nevertheless, most of those not applying did not need

44
credit and there was actually a lower percentage, compared to the rest of Central America, who
did not apply because of high interest (Table 4.23).
Table 4.22: Did Firm apply for credit in the past fiscal year? (2006)
Response El Salvador Central America
Yes 43.29% 42.88%
No 56.13% 56.51%
Table 4.23: Main Reasons for not applying for Loans or Lines of Credit (2006)
Reason El Salvador
Percentage
Central America
Percentage
There was no need for a loan 70.69 71.60
Difficulties with processing 5.40 4.93
High interest rates 6.43 11.01
Strict collateral requirements 4.37 3.48
Inadequate amounts and ending dates of
loans
0.26 0.44
Believed that credit was not going to
approved
1.03 1.08
Other reasons 11.83 7.40
Total 100 100
Table 4.24 shows that 71 percent of entrepreneurs who did not apply for credit said they ‖there
was no need‖ for one.
Table 4.24: Sales volume by credit decisions
Survey responses Number of
firms
Mean
Total Sales in
Previous Year
Std. Dev. Of
Total Sales
Applied for credit 329 3,593,617 1.05e+07
Did not apply for credit 253 3,007,201 1.19e+07
Did not apply for credit because there was
no need
126 3,205,216 1.18e+07
Also, there appears to be no clear difference between the sales revenue of firms who sought bank
credit and firms who did not. Of course, this data is from successfully established firms, not the
ones who are just starting up and trying to grow to a viable size, typically small firms. The only
information available on start-up and informal firms is anecdotal. Current commerce, tax and
AML regulations require financial statements and proof of tax compliance for loans of all sizes,

45
which constrain access more heavily for informal and smaller firms (assuming some fixed costs
for registration, bookkeeping and tax compliance regardless of firm size) (International Monetary
Fund and The World Bank 2010). Industry experts widely report that these informal firms and
SMEs then turn to consumer credit to fund their business activities, as documentation
requirements are lower and the large international banks have focused on consumer and
mortgage credit as a business strategy in recent years.
Agents less intensive in that constraint should be more likely to survive and thrive, and vice
versa
In order to conclude that SME credit is a binding constraint, this test should show that capital-
intensive SMEs are faring worse than their relatively labor-intensive counterparts in the
economy. We do not have specific data on capital-intensive SMEs, but taking construction and
mining sectors as a loose proxy for capital-intensive firms overall, we see that their share of real
GDP fell slightly in 2000-2009, but stayed relatively stable during the credit crunch of 2008-
2009.
Table 4.25: Gross Domestic Products by Sectors (as percent of real GDP)
Year
Agriculture,
Livestock,
Forestry &
Fishing
Mining Manufacturing
Electricity,
Gas &
Water
Construction Services
(%) (%) (%) (%) (%) (%)
2000 12.3 0.4 23.0 0.6 3.6 60.1
2001 11.8 0.4 23.6 0.6 3.9 59.8
2002 11.5 0.4 23.7 0.7 4.0 59.7
2003 11.4 0.5 23.7 0.7 4.1 59.8
2004 11.5 0.4 23.5 0.7 3.6 60.4
2005 11.7 0.4 23.1 0.7 3.6 60.6
2006 11.8 0.4 22.8 0.7 3.7 60.6
2007 12.3 0.4 22.6 0.7 3.4 60.6
2008 12.9 0.3 22.7 0.7 3.2 60.3
2009 13.1 0.3 22.7 0.7 3.3 60.0 Source : Reserve Central Bank of El Salvador
Test 1 is inconclusive without interest rate information, Test 2 gives evidence that SME credit
could be a binding constraint to overall growth, and Tests 3 and 4 do not support the binding
constraint hypothesis. In sum, the evidence we have fails to reject the null hypothesis that SME
credit is not a binding constraint. Nonetheless, it is clear that there are significant access to credit
issues that pose significant limitations on the SMEs themselves, as well as their employees.
What is the ultimate reason that lending to small businesses is limited? This could be credit risk
remaining from the financial crisis as explained earlier, and diseconomies of scale, including

46
regulatory requirements for documentation and possibly transaction costs. A second possible
reason is low competition: the highest reported return on assets (ROA) among micro and SME
lenders in 2009 was 10.2 percent. We do not have comparator ROAs for this credit segment.
Anecdotally, we know that increased commercial banking concentration has spurred consumer
lending and introduced foreign banks who have different risk appetites for SME lending than
their Salvadoran predecessors. As a result of the banking consolidation and acquisition that
occurred from 2005 until September 2008, all commercial banks in El Salvador became foreign-
owned. The business strategies of these new banks (e.g. HSBC and Citibank) involved global
credit risk policies or financial institutions that specialize in credits to households. For example,
HSBC and Citibank‘s offerings of mortgage and consumer credit have shifted credit towards
these uses, rather than for productive investment. Credit afforded to households has grown from
43 percent of the total portfolio in 2005 to 54 percent in 2010 (See Figure 4.26). For the reasons
discussed above, consumer loans are sometimes used by micro and SMEs for production,
although these can only fund short-term working capital-type needs.
Figure 4.26: Sectoral Distribution of the Credit
Source: SSF 2010
For the sake of completeness, we will examine below the rest of the finance node for the whole
Salvadoran economy, i.e. firms of all sizes.
C. International Financing
Finance can be accessed domestically or internationally. The first step is to identify whether
access to foreign borrowing is restricted. El Salvador‘s sovereign risk rating has recently been
downgraded by three major credit agencies. In January 2009, Moody‘s downgraded El
Salvador‘s government bond rating to ―Ba1‖ from ―Baa2‖ with a stable outlook, but by March
43% 44% 47% 50% 52% 54%
51% 50% 47% 46% 44% 44%
6% 5% 6% 4% 4% 2%
0%
10%
20%
30%
40%
50%
60%
70%
80%
90%
100%
2005 2006 2007 2008 2009 2010
Mortgages Production Non-residents

47
2011 it was downgraded again, to ―Ba2‖, or ―questionable credit quality.‖ Moody‘s judges ―Ba‖
issues ―to have speculative elements and subject to substantial credit risk.‖ In January 2011,
Standard and Poor‘s and Fitch had both downgraded El Salvador‘s government bonds to ―BB-‖
or ―speculative grade,‖ such that the issues are ―less vulnerable in the near term but face major
ongoing uncertainties to adverse business, financial and economic conditions.‖ Based on the
following table of comparators, El Salvador‘s rating ranked roughly in the middle of Latin
American countries in 2010, with a decline in 2011 due to the recent downgrade.
Table 4.27: Moody´s Sovereign Ratings for Comparative Countries 2010 - 2011
Country January 2010
Rating
Present (May
2011)
Chile A1 Aa3
México Baa1 Baa1
Brazil Baa3 Baa3
Costa Rica Ba1 Baa3
Panamá Ba1 Baa3
Peru Baa3 Baa3
Colombia Ba1 Ba1
Guatemala Ba2 Ba1
Uruguay Ba3 Ba1
El Salvador Ba1 Ba2
Dominican
Republic
B1 B1
Paraguay B3 B1
Honduras B2 B2
Venezuela B2 B2
Argentina B3 B3
Nicaragua Caa1 B3
Ecuador Caa3 Caa2
Figure 4.28Error! Reference source not found. shows that there has been some volatility in El
alvador‘s spread with U.S. Treasuries for international borrowing, but its relationship to gross
investment is not statistically significant. Also, the recent Eurobond rollover was
oversubscribed, indicating that the authorities could have borrowed more internationally had they
chose to do so.

48
Table 4.28: El Salvador’s External Debt (Sovereign Issues)
Issue
25-
Jan-
11
20-
Nov-
09
13-
Jul-
06
19-
Apr-
06
1-
Jun-
05
14-
Sep-
04
25-
Feb-
03
17-
Oct-
02
23-
Jul-
02
3-
April-
02
18-
Jul-
01
24-
Jan-
00
4-
Aug-
99
Amount
(U.S. $
million)
653.5 800.0 225.0 400.0 375.0 286.4 348.5 451.5 300.0 500.0 353.5 50.0 150.0
Maturity
01-
Feb-
41
1-
Dece
mber-
19
15-
Jun-
35
15-
Jun-
35
15-
Jun-
35
21-
Sep-
34
24 -
Jan-
23
24-
Jan-
23
25-
Jul-
11
10-
Apr-
32
25-
Jul-
11
15-
Jan-
07
15-
Aug-
06
Term 30
Years
10
Years
30
Years
30
Years
30
Years
30
Years
20
Years
20
Years
10
Years
30
Years
10
Years
7
Years
7
Years
Demand
(Million U.S.
$)
1,700.
0
3,500
.0
1,000
.0
1,071
.2 800 2,649 1,160 1.625 1,200 2,500 1,000 - -
Grades
Ba1/B
B/BB
-
Ba1/
BB/B
B
Baa3/
BB +
Baa3/
BB +
+
Baa3/
BB
Baa3/
BB +
Baa3/
BB +
+
Baa3/
BB
Baa3/
BB +
Baa3/
BB +
+
Baa3/
BB
Baa3/
BB +
Baa3/
BB +
Spread (bp) 313.1 403 275 240 345 349 355.5 361 300 265 350 355 500
Gross Capital
Formation as
% of GDP
13.12 16.13 16.13 15.72 16.20 16.98 16.39 16.39 16.67 16.93 16.43
GDP per
capita (PPP) 7355 6862 6862 6420 6013 5802 5591 5591 5591 5413 5240 5056
Correlation
between
gross capital
formation
and spread
-0.179220877
Cov: - 12.4382
Correlation
between
GDP and the
spread
-0.295501197
* Reopening
** Option to
put a 10 Years
*** Option to
put a 15 Years
Source: Central Reserve Bank
Figure 4.29 below illustrates the daily spread between the Emerging Markets Bond Index
(EMBI) for Latin America and U.S. Treasuries, and El Salvador‘s spread, from January 2007
through March 2011. The spreads are strongly correlated at 0.978, although correlation has
dropped recently. Since the first drop in November 2009, the correlation has been only 0.743.
Volatility in the Latin America and El Salvador spreads have decreased substantially, with
standard deviation for both dropping from about 200 basis points in 2007-2009 to about 30 basis
points in 2009-2011 (2011 year to date).

49
Figure 4.29: EMBI Differential 2007-2011
The rating of the country has deteriorated due to several factors, with the growing level of public
debt playing an important role. The drop in ratings from investment grade to speculative grade is
relevant in terms of the conditions and access to international financing markets in the short
term. In fact, the loss of private leverage that occurred at the end of 2008 and beginning of 2009
reflects, in part, the hardening of the financial markets, which moved their resources to markets
considered safer. This restricted access to certain type of investors, which shows the volatility of
these resources.
Part of the reason for El Salvador‘s relative ability to borrow in international capital markets is
its fiscal balance. Figure 4.30 compares gross public debt as a percent of GDP for El Salvador
relative to the average ratios for Latin American and middle-income countries. El Salvador has
historically been below the average for both, with the IMF projecting movement above 50
percent only after 2010 (IMF 2010). Based on the optimal debt literature, the IMF (2010)
suggests a target debt-to-GDP ratio of 35 percent in El Salvador, including sufficient space to
absorb contingent liabilities. Nonetheless, as shown in Figure 4.30, El Salvador‘s level of gross
public debt has not been statistically different from comparable countries since 2005 it is
slightly lower, but within the range of a single standard deviation.
0
100
200
300
400
500
600
700
800
900
10002
-Jan
-20
07
20
-fe
b-0
79
-Ap
r-2
00
7
24
-may
-07
12
-ju
l-0
72
8-A
ug-
20
07
16
-oct
-07
4-D
ec-2
00
72
3-J
an-2
00
81
1-m
ar-0
8
28
-Ap
r-2
00
81
3-j
un
-08
30
-ju
l-0
81
6-s
ep-0
83
1-o
ct-0
81
9-D
ec-
20
08
06
-fe
b-0
92
6-m
ar-0
91
3-m
ay-0
93
0-j
un
-09
17
-Au
g-2
00
90
2-o
ct-0
92
0-n
ov-
09
11
-Jan
-20
10
01
-mar
-10
16
-Ap
r-2
01
00
3-j
un
-10
21
-ju
l-1
00
7-s
ep-1
02
5-o
ct-1
01
4-D
ec-
20
10
01
-fe
b-1
1
Latino El Salvador
Correlation = 0.978 Correlation = 0.743

50
Figure 4.30: Gross Public Debt ( percent of GDP)
Source: World Development Indicators (2011)
Table 4.31: Comparison Statistics of Gross Public Debt (percent of GDP)
El Salvador compared with
mean, in terms of standard
deviations:
2005 2006 2007 2008 2009
Latin America and the DR -0.70 -0.56 -0.44 -0.38 -0.23
Middle-income Countries -0.53 -0.46 -0.40 -0.29 -0.12
Source: IMF World Economic Outlook
Figure 4.32: Gross Financing Needs vs. Debt/GDP
Sources: World Development Indicators (2011) and IMF Article IV Report (2010)
Although both the IMF and private ratings agencies have noted the potential for El Salvador‘s
fiscal environment to further weaken in the near to medium term, the general prognosis seems to
0
10
20
30
40
50
60
70
80
90
1001
99
2
19
93
19
94
19
95
19
96
19
97
19
98
19
99
20
00
20
01
20
02
20
03
20
04
20
05
20
06
20
07
20
08
20
09
El Salvador LAC mean Middle income mean
0.0
10.0
20.0
30.0
40.0
50.0
60.0
70.0
2007 2008 2009 2010(predicted)
2011(predicted)
Gross financial needs/GDP External Debt/GDP
Gen. Gov. Debt/GDP

51
be that this is not very likely. Although the country‘s fiscal balance could be stronger, there is no
indication that this might be a binding constraint to private investment.
Similarly, the current account balance does not suggest that El Salvador may have trouble
accessing foreign credit. Economies with substantial access to international financing can carry
current account deficits. Figure 4.33 shows the current account balance as a percent of GDP in
El Salvador and in relation to Latin American countries (LAC) and lower-middle income
countries (LMIC) from 1980 through 2009. Since 2003, El Salvador has been relatively
correlated with movements across LAC. Table 4.34 provides a statistical comparison that shows
El Salvador is well within a single standard deviation.
Figure 4.33: Current Account ( percent of GDP)
Source: World Development Indicators (2011)
Table 4.34: Comparison of Current Account of El Salvador with other countries
El Salvador in comparison means
of (in terms of standard
deviations):
2005 2006 2007 2008 2009
Latin America and the DR 0.19 0.06 0.10 0.13 0.48
Middle-income countries -0.10 -0.22 -0.18 -0.17 -0.01
Figure 4.35 shows some relationship between growth and investment, but no clear relationship
between these two variables and the current account balance (as a percentage of GDP).
-15
-10
-5
0
5
10
19
80
19
82
19
84
19
86
19
88
19
90
19
92
19
94
19
96
19
98
20
00
20
02
20
04
20
06
20
08
El Salvador
LAC
LMIC

52
Figure 4.35: Rate of Growth of the GDP, Formation of Capital and Current Account of
El Salvador
Source: World Development Indicators (2011)
D. Domestic Savings
In traditional economic thought, an implied causality runs from domestic savings to growth of
GDP due to reduction in the relative cost of investing, which increases the level of production.
Mohan (2006) suggests that in some economies the causality is reversed: GDP growth generates
a higher disposable income, which then leads to increased savings.
Following Mohan‘s methodology, a Granger causality test was conducted to determine the
endogeneity of National Savings and GDP in El Salvador. ―Granger causality‖ represents a
statistical relationship between two correlated variables, such as savings and wealth (Granger
1969).5 If data suggests that one data trend ―precedes‖ another – say, people save more and so
they get richer – then we would say that savings ―Granger causes‖ wealth. If people happen to
get wealthy and therefore save more, we would say that wealth ―Granger causes‖ savings. It is
possible for two variables to ―Granger cause‖ each other, just as it is possible for two correlated
variables to have no statistical relationship of causality.
The series used to perform the exercise from the World Database of the World Bank
Development Indicators (WDI, 2011):
Saving is calculated as current savings published by the WDI6 using the GDP deflator for
constant 1990 prices over the period 1981-2009, in log form (LSN) (Figure 4.36).
5 The test is named after its originator, Clive Granger.
6 Gross National Income Available less Final Consumption Expenditure
-10
-5
0
5
10
15
20
251
98
0
19
82
19
84
19
86
19
88
19
90
19
92
19
94
19
96
19
98
20
00
20
02
20
04
20
06
20
08
Gross capitalformation (% GDP)
CA balance (% GDP)
Real GDP growth (%)

53
Gross Domestic Product (GDP) from WDI at constant 1990 prices , also in log form (LGDP)
(Figure 4.36).
Figure 4.36: National Savings and logarithm of GDP in El Salvador (1981-2009)
A. Log of National Savings B. Log of GDP
Source: Authors' calculations based on WDI 2011 online database
The test of causation:
We performed Granger causality test provided by Eviews ("Pairwise Granger Causality Tests")
for the variables in level and difference with two lags.7 The first case tests the null hypothesis
that national savings (LSN) ―causes‖ national income (LGDP), and the second whether GDP
―causes‖ savings. Figure 4.37 shows the conclusions. The results give weak evidence that
National Savings does not Granger-cause GDP (in levels and differences) and strong evidence
that GDP does not Granger-cause National Savings. In econometrics terms, National Savings
precedes GDP.
Figure 4.37: Granger Causality Tests
7 Two lags were chosen, considering that two years is a prudent time for the use of savings in investment decisions
that ultimately generate growth in GDP.
5.6
5.8
6.0
6.2
6.4
6.6
6.8
7.0
7.2
1985 1990 1995 2000 2005
LSN
8.3
8.4
8.5
8.6
8.7
8.8
8.9
9.0
9.1
9.2
1985 1990 1995 2000 2005
LPIB
Pairwise Granger Causality Tests
Date: 04/26/11 Time: 10:11
Sample: 1981 2009
Lags: 2
Null Hypothesis: Obs F-Statistic Prob.
LSN does not Granger Cause LPIB 27 4.407 0.0246
LPIB does not Granger Cause LSN 0.81351 0.4562
Pairwise Granger Causality Tests
Date: 04/11/11 Time: 11:25
Sample: 1981 2009
Lags: 2
Null Hypothesis: Obs F-Statistic Prob.
DLSN does not Granger Cause DLPIB 26 3.2986 0.0568
DLPIB does not Granger Cause DLSN 0.01036 0.9897

54
Note that evidence of Granger causality may arise from existence of a third ―unobserved‖
variable that influences both the behavior of savings and GDP completely independently of each
other, and therefore the implementation of policies aimed at changing the savings may have no
impact on output growth. For example, a dramatic improvement of a financial system could
improve overall productivity – and thus GDP – while also increasing the incentives for citizens
to save.
The high correlation between savings and investment, which was identified during the 1980‘s by
the Feldstein-Horioka (FH) paradox, continues to be a robust finding for developed and
developing economies. The comparison of the average domestic savings rates and investment
during the 1990‘s and 2000‘s for a sample of countries shows that investment follows the
movements of domestic savings and is an indication of either imperfect mobility of capital or
financial restrictions8 (Figure 4.38).
Figure 4.38: Savings and Investment as a percent of the GDP in El Salvador and in a
sample of other countries, averages for 1990´s and 2000´s
Source: Online Database 2011 of World Development Indicators
Latin American and Caribbean countries have shown, since the 1990‘s, the lowest rates of
savings and investment in relation to the rest of the regions of the world, with the exception of
Sub-Saharan Africa. Within the Latin American region, El Salvador is one of the countries which
has shown the lowest ratios of domestic savings to the GDP, a situation which has been
deteriorating since the mid-1990‘s. Assuming the Feldstein-Horioka paradox is valid, the low
rate of domestic savings implies a restriction to investment and growth of the Salvadoran
economy.
8There are other elements which could explain this result, such as the existence of common factors behind the
movement of savings and investment, follow-up of certain policy objectives and the differentiated short and long-
term effects.
a) Savings
b) Investment

55
Below we try to follow up on the principles of differential diagnosis established by HKW (2008),
to identify if savings is a relevant restriction for El Salvador.
The price of savings
A binding constraint must have a very high shadow price, while the return on other assets must
be depressed (Hausman 2004).
Interest rates on deposits have been decreasing since the middle of the 1990‘s. The reduction
recorded between 1995 and 2008 was 9.4 percentage points. Salvadoran interest rates have
remained at low levels in comparison to other Central American countries, staying below the
regional mean since 1997. Since 2005, a slight increase can be observed, with their rates coming
closer to the medium level of the region (Figure 4.39).
Figure 4.39: Rate of Deposits and Gross Savings in El Salvado and Maximum and
Minimum Rate of Deposits in El Salvador vs. Central American Mean
Source: World Development Indicators (2011) and Central Reserve Bank
The behavior of deposit rates would indicate that the economy does not consider savings a scarce
resource and therefore is not willing to pay a higher price for it. It is important to note that
savings rates have been decreasing at a rate similar to that of interest rates, experiencing a drop
of 11.8 percentage points between 1995 and 2008, indicating a certain degree of reaction to its
movements.
Movements in restriction should produce significant movements in the objective
Gross domestic savings as a five-year average has deteriorated over time and with regard to the
rest of Latin American countries. During the first five years of the 1990‘s, El Salvador showed a
ratio close to the regional mean, with Nicaragua being the country with the lowest ratio;
however, while Nicaragua has been reducing its gap, El Salvador has moved in the opposite
direction, becoming at the end of 2009 the country with the lowest ratio of savings to GDP (see
Figure 4.40).
0
5
10
15
20
25
19
83
19
85
19
87
19
89
19
91
19
93
19
95
19
97
19
99
20
01
20
03
20
05
20
07
20
09
Deposit interest rate (%) Gross savings (% of GDP)
0
5
10
15
20
25
301986
1987
1988
1989
1990
1991
1992
1993
1994
1995
1996
1997
1998
1999
2000
2001
2002
2003
2004
2005
2006
2007
2008
El Salvador Max Min CA Median

56
Figure 4.40: Average Gross Domestic Savings as a percent of the GDP
Source: World Development Indicators (2011) and Central Reserve Bank
The reduction experienced in gross domestic savings has been partially covered by external
savings, which went from 1.7 percent of GDP during the 1990‘s to 3.8 percent in the 2000‘s;
despite this, domestic savings has continued to be the principal source of financing for
investment9. On the other side, investments have been declining since the middle of 1990‘s and
dependence on more volatile external savings (compared to domestic savings) has been
increasing (see Table 4.41).
Assuming the FH paradox, the behavior observed in variables provides descriptive evidence of
the significant effect of the movements in the restriction (savings) over the objective
(investment). Savings impacts growth indirectly through movements in investments.
9The principal source of financing of the Salvadoran private sector is local banking credit, which in turn is funded
mostly through local deposits.
-4
-3
-2
-1
0
1
2
3
4%
of
GD
P
1990-1994 1995-1999 2000-2004 2005-2009

57
Table 4.41: Domestic, External Savings and Investments
Period Statistics Gross
savings
Foreign
savings
Gross capital
formation
1990-
1994
Median
Coefficient of
variation
15.41
19.48
1.91
66.76
17.21
14.30
1995-
1999
Median
Coefficient of
variation
15.28
11.09
1.59
51.40
16.87
12.10
2000-
2004
Median
Coefficient of
variation
13.47
10.09
3.17
42.78
16.63
2.03
2005-
2009
Median
Coefficient of
variation
10.45
18.59
4.34
49.65
15.16
8.13 Source: Online Database World Development Indicators 2011
The agents try to solve the constraint
Nonetheless, as mentioned in the previous section, external savings have partially compensated
for the reduction in internal savings. External savings in terms of gross formation of fixed capital
went from approximately 11 percent during the 1990‘s to around 24 percent in the 2000‘s (see
Figure 4.42).
Figure 4.42: External Savings, National Savings and Gross Formation of Capital as a
percent of GDP in El Salvador
Source: Online Database of World Development Indicators 2011
The balance of gross external debt grew during the 2000‘s; as of 2010, the ratio of debt to GDP
was 54 percent. Private external debt has shown signs of deceleration since the end of 2008, after
growing at significant rates during the two previous years in which the economy expanded and
agents tried to resolve their financial restrictions (under savings and deficient intermediation of
0
5
10
15
20
25
30
197
6
197
8
198
0
198
2
198
4
198
6
198
8
199
0
199
2
199
4
199
6
199
8
200
0
200
2
200
4
200
6
200
8
Foreing Sanvings/PIB National Savings/PIB GKF/PIB

58
resources) through direct external acquisition of debt. Access to this type of financing is,
however, limited to a certain type of agents in the economy, therefore internal financial
restrictions are the most relevant to certain segment of companies.
The balance of private external debt represented 22 percent of GDP for 2010, while public
external debt, which has steadily grown, constituted 32 percent of GDP.
Contrasting the life cycle hypothesis
In order to establish the importance of some variables in the behavior of national savings, we
attempted to verify empirically the validity of the life cycle hypothesis for the case of El
Salvador. We perform the exercise using two alternative approaches, the first to follow the
patterns of income, consumption and savings of individuals throughout their lives, through
disaggregated data from Multipurpose Household Surveys (EHPM). The second methodology
involves the construction of an econometric model based on the series aggregate savings rate,
change in disposable income and other variables proxy the same, the rate of economic
dependence (non-working population as a proportion of working population), among others to
determine their impact on the saving rate.
Evidence from the information in the Household Surveys for Multiple Purposes
A fundamental element of domestic savings is family-level savings. The EHPM can construct a
curve of income, consumption and household savings in terms of age of household head, which
can be considered as an individual representative of the population. The information derived
from surveys in 2005 and 2009, indicates that individuals have little capacity to save or even
dissave in the early years of the life cycle and increase their savings gradually until reaching an
average age of 53 years (peak income), from which point their savings fall off.10
Figure 4.43: El Salvador, Disposable Income, Consumption and Savings
Source: Authors calculations based on Household Surveys for Multiple Purposes (EHPM) 2005 and 2009.
10
The figures were deflated by the Consumer Price Index (CPI, base 2009).
-100
0
100
200
300
400
500
15 20 25 30 35 40 45 50 55 60 65 70 75 80 85
Ahorro_05 Consumo_05
Ahorro_09 Consumo_090
100
200
300
400
500
600
15 20 25 30 35 40 45 50 55 60 65 70 75 80 85
Ingreso Disponible_05 Ingreso Disponible_09

59
Behavior patterns derived from household surveys show that individuals do not smooth their
consumption inter-temporally, i.e. there is no stable consumption curve over time and the life
cycle. Rather, it moves in line with disposable income11
, indicating liquidity constraints.
The constant comparison in terms of income levels, consumption and savings from 2005 and
2009 indicates that on average there have been significant improvements in income levels, and
patterns of consumption and saving have remained virtually unchanged in the five years studied.
Regarding the savings rate by income decile, the EHPM information indicates that it is only
possible to obtain a positive savings ratio to the fourth income decile, and from decile six it is
possible to generate a positive cumulative savings. The saving rate increases with income levels,
as one would expect, and savings rates exceed 30.0 percent in the last two deciles of the
distribution.
Figure 4.44: El Salvador, savings rate and accumulated savings ratio quintiles
Source: Author’s calculations based on Household Survey 2005 and 2009 Multi-Purpose
Evidence from aggregate data
The simplest way to represent dynamic relationships among multiple time series is through the
construction of vector autoregressive models (VAR). In order to examine the impact of variables
such as changes in income, the economic dependency ratio and wealth in the national savings
rate, we built a multivariate VAR model, which considers the stationarity of the series.
11
The volatility of the series is similar.
-80%
-60%
-40%
-20%
0%
20%
40%
60%
1 2 3 4 5
Saving Rate
2005 2009
-20%
0%
20%
40%
60%
80%
100%
1 2 3 4 5
Cumulative share of Savings
CsS_05 CsS_09

60
The series used to estimate the model is from the World Bank Development Indicators (WDI,
2011). The savings rate is gross national income less total consumption plus net transfers,
calculated as a percentage of GDP. The economic dependency ratio12
is the ratio of dependents
(persons under 15 or over 64) with respect to the working-age population (people between 15
and 64). Wealth is proxied by the ratio of M2 to GDP ,and the annual change in disposable
income was calculated from the number of Gross National Income Available.The model was
estimated with two lags, according to the Akaike criteria (AIC) and Schwarz (SC) and exceeded
the contrasts of normality, autocorrelation and heteroskedasticity (see Technical Annex 2).
The results indicate that changes in disposable income help to explain the variance in savings.
The reaction of saving to a shock of one standard deviation of the change in disposable income is
positive and vanishes over a horizon of 3 years. The main impact is in the first year (see
Tehcnical Annex 3). Impulse response functions for the income proxy variables: terms of trade,
remittances and variation in per capita also generated a positive impact on savings, to be
consistent with the expected results. The reaction of saving to changes in the economic
dependency ratio were contrary to what theory suggests, and while the dependency ratio has
been declining, the saving rate also fell. This result is evidence against the life-cycle hypothesis
in the case of El Salvador.
The results from this model should be taken with caution as the available sample size is
relatively small for these estimates.
Low savings rates are not a binding constraint to economic growth since prices (interest rate of
deposits) are one of the lowest in Latin America, and the economy has had access to external
financing, as shown in the previous section.
E. Financial Intermediation
a. Cost of Financing
In El Salvador, despite the fact that interest rates for bank loans have been under the Latin
American mean, there is strong evidence that the costs of financing (interest rates plus
commissions) have increased because bank commissions have risen above the Central American
mean, as have levels of collateral requirement, especially for smaller firms.
The prices for the different financial products have two components: the rate of interest and fees.
The relative importance of both components varies according to the type of user and credit
ranking. A more precise way to get closer to the cost of financing in any economy is by
estimating the implicit rates of active and passive intermediation operations of the financial
12
To preserve the order of integration within the model includes the change in the dependency ratio, because the
ADF test did not reject the presence of a unit root in the ratio, which according to this test is a Series I (1).
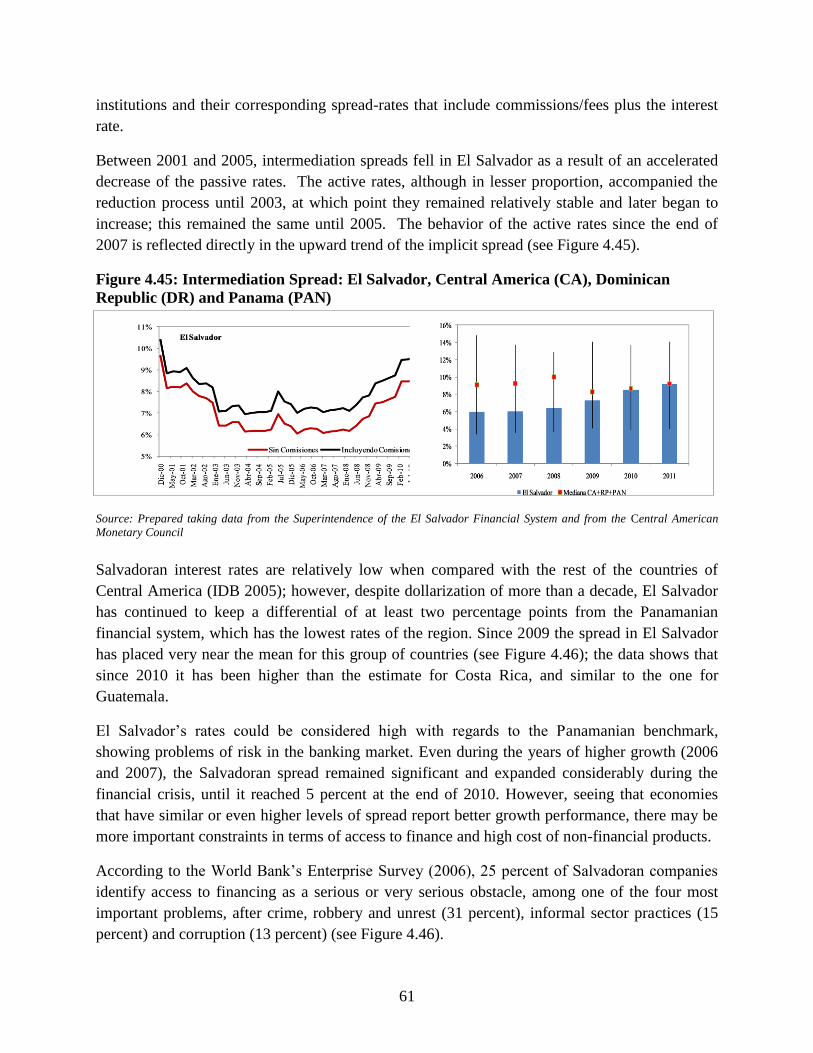
61
institutions and their corresponding spread-rates that include commissions/fees plus the interest
rate.
Between 2001 and 2005, intermediation spreads fell in El Salvador as a result of an accelerated
decrease of the passive rates. The active rates, although in lesser proportion, accompanied the
reduction process until 2003, at which point they remained relatively stable and later began to
increase; this remained the same until 2005. The behavior of the active rates since the end of
2007 is reflected directly in the upward trend of the implicit spread (see Figure 4.45).
Figure 4.45: Intermediation Spread: El Salvador, Central America (CA), Dominican
Republic (DR) and Panama (PAN)
Source: Prepared taking data from the Superintendence of the El Salvador Financial System and from the Central American
Monetary Council
Salvadoran interest rates are relatively low when compared with the rest of the countries of
Central America (IDB 2005); however, despite dollarization of more than a decade, El Salvador
has continued to keep a differential of at least two percentage points from the Panamanian
financial system, which has the lowest rates of the region. Since 2009 the spread in El Salvador
has placed very near the mean for this group of countries (see Figure 4.46); the data shows that
since 2010 it has been higher than the estimate for Costa Rica, and similar to the one for
Guatemala.
El Salvador‘s rates could be considered high with regards to the Panamanian benchmark,
showing problems of risk in the banking market. Even during the years of higher growth (2006
and 2007), the Salvadoran spread remained significant and expanded considerably during the
financial crisis, until it reached 5 percent at the end of 2010. However, seeing that economies
that have similar or even higher levels of spread report better growth performance, there may be
more important constraints in terms of access to finance and high cost of non-financial products.
According to the World Bank‘s Enterprise Survey (2006), 25 percent of Salvadoran companies
identify access to financing as a serious or very serious obstacle, among one of the four most
important problems, after crime, robbery and unrest (31 percent), informal sector practices (15
percent) and corruption (13 percent) (see Figure 4.46).

62
Figure 4.46: Percentage of Companies that Identify Access to Financing as a Serious or
Very Serious Obstacle
Source: World Bank, Enterprise Survey 2006
Compared to the rest of the Latin American region, if we consider the identification of access to
finance as a proxy for problematic intermediation, El Salvador would occupy a position closer to
the mean (23 percent), weakening its importance; however, other related indicators such as the
value of collateral necessary for a loan (as a percentage of the amount of the loan) indicate that
the country is one of the five countries that requires a greater amount of collateral (151 percent),
exceeding by 25 percentage points the mean for the region (see discussion on SME credit).
b. Competition
The purpose of analyzing competition in one sector of the economy is to examine the existence
of economic efficiency and to ensure the returns of the efficiency on costs can be translated into
consumer wellbeing as the prices of goods and services drop and the quality and technological
innovation increases.
The lack competition in the banking industry has transformed the financial sector into a few
conglomerates that concentrate the majority of assets and deposits of the financial system. This
characteristic results in market inefficiency and affects consumers.
The Herfindahl-Hirshman and Dominance concentration indices increased in 2000 and remained
relatively stable between 2000 to 2010, staying within the highly concentrated market
classification interval (see Figure 4.47)13
. The probability that competition could be affected
increases whenever any industry operates under these conditions, since it facilitates collusion or
non-competitive practices. The implications of a non-competitive market structure are, in
13
US Federal Trade Commission (FTC), Comisión Federal de Competencia de México (CFC) and Tribunal de
Defensa de la Competencia de España.
24.8%
0%
10%
20%
30%
40%
50%
60%B
razi
l
Co
sta
Ric
a
Arg
en
tin
a
Do
min
ican
…
Uru
guay
Ecu
ado
r
Ho
nd
ura
s
El S
alva
do
r
Ve
ne
zue
la, R
.B.
Me
dia
na
Nic
arag
ua
Co
lom
bia
Gu
ate
mal
a
Ch
ile
Bo
livi
a
Me
xico
Pe
ru

63
general, that the resulting price will be higher than that in a competitive industry, and quality of
the good or service will be lower.
Figure 4.47: Concentration Indexes by Types of Assets
Source: SSF, 2010
The Herfindahl-Hirshman Index (HHI) for credit by size of company are over 2,000 points on
the micro, medium and large enterprises, and exceed 4,000 points on the small enterprises. On
the other hand, the dominance indexes exceed the 2,500 point level stated by the Federal
Competitiveness Commission from Mexico as having a high probability of affecting competition
(Superintendencia de Competencia 2007, 32).14
Table 4.48: Concentration -Indexes According to Size (February 2007)
Credit Classification HHI DI
Microenterprise 2,298.4 3,882.4
Small 4,624.9 8,994.8
Medium 2,255.9 4,251.6
Large 2,798.2 3,654.7 Source: Prepared internally on data from Competitiveness Superintendence, 2007, Page 52)
Additionally, the private banking system represented approximately 96 percent of the Salvadoran
credit market for the period between 2000 and 2009, of which 87 percent corresponded to the
four largest banks of the system. In comparison, public banks represented an average of only 4
percent of the credit market, having a very limited contribution to financial intermediation.
Consequently, the small group of private banks and the public banks do not have sufficient
competition to move the interest rates to levels more in tune with the prevailing excess liquidity
conditions (See Figure 4.49).
14
Updated concentration statistics by size of company are unavailable
0
1000
2000
3000
4000
1992 1994 1996 1998 2000 2002 2004 2006 2008 2010Ind
ice
s
HH ID

64
Figure 4.49: Share of Credit Market by Type of Bank
Source: (Fuentes 2010).
When looking at the relatively small number of banks in the Salvadoran banking system,
however, it is also important to remember the size of the economy and banks‘ need for
economies of scale.15
(See Table 4.50).
Table 4.50: Returns in the Financial System
2004 2005 2006 2007 2008 2009
El Salvador Return on Assets (ROA, %) 1.0 1.2 1.5 1.2 1.0 0.3
Other Central America ROA (%) 2.1 2.1 2.2 2.3 2.3 1.7
El Salvador Return on Equity (ROE, %) 10.9 11.8 14.6 11.3 8.7 2.8
Other Central America ROE (%) 23.4 22.8 23.5 23.8 23.1 16.3
Source: BCR, SSF and Central American Monetary Council
Between 1990 and 2008, El Salvador had a greater financial deepening than the mean for Latin
America, as shown in Figure 1.52. During that period, the private credit sector reached a ratio of
40 percent as a proportion of GDP, whilst the mean was 26 percent16
. However, ever since the
banking crisis at the end of the nineties, El Salvador has been losing ground in access to credit,
as shown in Figure. Since 2001, credit as a proportion of the GDP has been well below the mean
of the region and has been unable to recover the levels reached between 1997 to 2000. As a
15
In spite of its high operational efficiency, the banking sector in El Salvador appears to be among the least
profitable in the region. 16
However, if we compare El Salvador with countries in East Asia, credit as a percentage of GDP reached in the last
forty years 77 percent and 74 percent, respectively. (Pages, La era de la productividad. Cómo transformar las
economías desde sus cimientos 2010, 143)
0.0%
10.0%
20.0%
30.0%
40.0%
50.0%
60.0%
70.0%
80.0%
90.0%
100.0%
Dec
-00
Sep
-01
Jun
-02
Mar
-03
Dec
-03
Sep
-04
Jun
-05
Mar
-06
Dec
-06
Sep
-07
Jun
-08
Mar
-09
Dec
-09
Small private banks
Large private banks
Public banks
Private banks

65
comparison, Panama‘s economy is also dollarized but has the deepest financial access in the
region.
Figure 4.51: Credit to the Private Sector as percent of GDP
Source: (World Bank, World Development Indicator Online Database 2010)
c. Risk
Despite the elimination of exchange risk because of dollarization, financial contract terms have
been stretched out, generating a modification of term structures; it seems that the business sector
did not benefit from longer loan tenors, since the maturity structure for this segment has
remained practically constant (Fuentes 2010). In other words, businesses have not been able to
get longer-term loans.
Some of the reasons for the change in loan structures were: (i) the banking concentration process
between 2005 and 2008; (ii) change in the business strategies of new competitors: global credit
risk policies or financial institutions that specialize in credit to households, such as HSBC and
Citibank, who offer mortgage and consumption credit17
; (iii) foreign bank holdings being located
in Panama, which is where they manage lending policy; (iv) the financial crisis‘ effects on
financial conglomerates, which augmented retraction of credit in El Salvador without prior
assessment of whether the Salvadoran banking system had positions in toxic assets; and (v) a
negative understanding of the role of public banks within the banking industry, which resulted in
these banks having marginal operations and not being efficiently competitive, as is the case in
the Costa Rican and Guatemalan banking systems.
17
Between 2004 and 2009, both banks represented 37 percent of the banking system‘s assets.
0
20
40
60
80
100
120
1997 1998 1999 2000 2001 2002 2003 2004 2005 2006 2007 2008
El Salvador Maximum Minimum Mean (Central America)
1990
-2008

66
5. Returns to Economic Activity
If the problem with growth in El Salvador is not one of costly finance (as is the case for all but
small and medium enterprises), then it must be because of low expected private returns to
economic activities. This may be because the overall social returns to projects are low or because
the share of the returns the firm can retain is low.
A. Low Appropriability
Low appropriability in the economy is the ―lack of the firm‘s ability to reliably capture for itself
the benefits in the future of its own investments and initiatives today‖ (Pritchett 2008). In order
to test this hypothesis, this study employs the 4 tests outlined by Hausmann, Klinger and Wagner
in their ―Mindbook‖ on growth diagnostics (Ricardo Hausmann 2008):
a) The (shadow) price of the constraint should be high
b) Movements in the constraint should produce significant movements in the objective
function
c) Agents in the economy should be attempting to overcome or bypass the constraint
d) Agents less intensive in the constraint should be more likely to survive and thrive, and
vice versa: we should observe few thriving firms that are intensive in the constraint.
In certain nodes of the low appropriability branch these four tests are harder to employ since the
branch deals with less measurable areas of interest and therefore shadow prices and measurable
movements in a constraint are harder to calculate. As a result, the branch is at risk of receiving
superficial treatment despite its importance. In order to avoid that trap, this study employs the
four tests where possible and supplements that focus with other relevant evidence, such as cross-
country comparisons and perception surveys in order to draw conclusions.

67
Figure 5.1: The Low Appropriability Branch of the Growth Diagnostics Decision Tree
Market Failures versus Government Failures
The low appropriability branch is divided between market failures and government failures. The
former explores the possibility that there are coordination and information failures within the
market that are constraining growth. The latter explores the possibility that ineffective or
insufficient government efforts in various areas are constraining growth.
a. Is Crime a Binding Constraint to Economic Growth in El Salvador?
In the predominant literature on growth diagnostics, a variety of potential constraints are grouped
together as ―micro risks‖ (Ricardo Hausmann 2008). This is because the subjects studied in this
area largely affect growth at the firm level, as opposed to having effects at the economy-wide
level. Crime is not normally discussed at length within descriptions of the growth diagnostic
methodology, but it must be considered as a potential constraint in the Salvadoran context due to
the size and impact of the problem, and is rightly considered a ―micro risk‖ because of its
relationship with property rights and therefore investment decisions, and function similar to taxes
of corruption as an additional cost to businesses. The prevalence of crime represents a
weakening of property rights because it demonstrates government failures to protect property
from unlawful seizure and reduces the ability of economic actors to reliably recover the returns
of their investments. This study therefore considers crime as a potential constraint in this
context.
Based on the evidence compiled, crime and violence is a binding constraint to economic growth
in El Salvador. However, first it is necessary to establish that there is a crime problem in El
Salvador. Ideally, we would do this by comparing statistics across countries in crime areas most
directly related to economic growth. Presumably, these areas are theft, robbery and extortion,
because they directly target property and the great prevalence of such activity would indicate
weak protection for those property rights. Unfortunately, the lack of availability and reliability

68
of these statistics make them unhelpful in calculating the problem of crime in El Salvador
relative to comparator countries. Based on analyses of U.S. data, there is cause to believe that
crime is underreported systematically for many different reasons (Mosher, Miethe and Hart
2011, 93-94). Furthermore, OCAVI, the Central American observatory on crime and violence,
attempts to collect crime data for all of its member countries and the effort falls short of being
complete.18
As a result, cross-national data on robbery is limited and probably
misrepresentative, as the below graph shows:
Figure 5.2: Robberies per 100,000 in 2008
Source: OCAVI
The above data is likely misrepresentative for various reasions: it does not contain data on half of
the Central American countries and, as will be shown directly below, Nicaragua‘s crime situation
is less than or at most equal to the problem in El Salvador and Honduras, so it is very difficult to
believe that the robbery problem in Nicaragua is more than 5 times that of Honduras or El
Salvador. The rate of homicides per 100,000 is a much more common comparative metric used
in the crime literature, and statistics are available for many more countries. While some of the
same underreporting issues probably exist, the grim fact that homicides produce unavoidable
physical evidence—dead bodies—make them more trustworthy statistics for cross-national
comparisons. Performing such a cross-national analysis shows that El Salvador was ranked as
18
Further measurement issues are discussed in a technical annex. This is not to suggest that PFG efforts should not
investigate further the types of crime that most restrict economic growth in El Salvador.
0
100
200
300
400
500
600
Ro
bb
eri
es
pe
r 1
00
,00
0
Countries
Honduras
El Salvador
Nicaragua

69
the most violent country in Latin America in 2007, and the second most violent county in Latin
America in 2008 by the UN Office on Drugs and Crime.19
Figure 5.3: Comparison of Homicides per 100,000
Source: UN Office on Drugs and Crime (UNODC), most recent statistics
Latin America‘s crime statistics are high compared to other world regions, meaning that El
Salvador is often considered one of the most violent countries in the world, at least based on
intentional homicide rates per 100,000. While these statistics are alarming, they do not
necessarily mean that crime is a binding constraint to growth, it is necessary to analyze the
effects of crime on the economy. Responses to the 2006 World Enterprise Survey show that over
30 percent of businesses thought of crime as a factor that constrains their operations in El
Salvador, making crime and security issues by far the most frequently mentioned constraint by
businesses. Rankings from the most recent World Economic Forum Global Competitiveness
Report confirm the severity and persistence of the crime problem, as it is perceived by
businesses. In addition to the results from the 2006 World Bank Enterprise Survey, Figure 5.3
19
It should be noted that UNODC statistics on homicide were used for their comparability across many countries.
UNODC data only goes up to 2008 at this time. Furthermore, imprecisions in crime measurements were discussed
in this report, but most measures of El Salvador‘s crime situation put the homicides per 100,000 at between 50 and
70 per 100,000—still among the highest worldwide.
0.0
10.0
20.0
30.0
40.0
50.0
60.0
70.0
2002 2003 2004 2005 2006 2007 2008 2009
Ho
mic
ide r
ate
Year
Switzerland
Netherlands
Costa Rica
El Salvador
Guatemala
Honduras
Mexico
Nicaragua
Panama
Argentina
Bolivia
Brazil
Chile
Colombia
Ecuador
Uruguay
Venezuela

70
shows the index scores for the Organized Crime indicator for El Salvador alongside comparator
countries from the region as well as a few reference countries from the developed world with
similar geographic and population sizes.
Figure 5.4: Business Perceptions of Crime—2006 World Enterprise Survey Resuts and the
2010-2011 Global Competitiveness Report Organized Crime Index Scores
Source: World Economic Forum, the Global Competitiveness Report 2010-2011

71
Based on how the Global Competitiveness Report is calculated, lower index scores represent
poorer performance on an indicator. In the case of the Organized Crime Indicator, El Salvador
was the lowest ranked country of the 139 countries in the report.
Rankings in the Global Competitiveness Report provide further evidence suggesting that crime is
a binding constraint to growth in El Salvador, but this ranking is still insufficient to make a
determination because it is based solely on perceptions and surveys rather than cost estimates for
crime that might serve to approximate a shadow price. Carlos Acevedo, using a variety of cost
estimation techniques adapted from previous studies on cost estimation from the health field,
calculated the costs of crime and violence in Central American countries divided between health
costs, institutional costs, private security costs and the costs of lost materials. His results, as
shown below, demonstrate that the annual total costs of violence in El Salvador, at 10.8 percent
of GDP, exceeds the costs in all other Central American countries.
Figure 5.5: Costs of Violence (Percentage of GDP)
Source: (Acevedo 2008)
The above graph may not seem to indicate that El Salvador‘s costs are particularly exceptional
relative to other countries in Central America, but it is important to remember that the crime
statistics in Central America are exceptionally high when compared to the rest of the world. All
0.0%
2.0%
4.0%
6.0%
8.0%
10.0%
12.0%
% o
f G
DP
Guatemala
El Salvador
Honduras
Nicaragua
Costa Rica
Central America (averages)

72
of the countries of Central America except for Costa Rica have homicide levels that are defined
as ―epidemic‖ by the Pan-American Health Organization (PAHO). 20
Comparing El Salvador
specifically with Costa Rica, the only country in Central America without an ―epidemic‖ level of
violence, demonstrates the extent of El Salvador‘s costs. The total costs of crime and violence in
El Salvador, as calculated by Acevedo, are three times the costs in Costa Rica. These cost
estimates represent the best approximation of a shadow price for crime and violence in El
Salvador and provide strong evidence that crime is a binding constraint to growth in El Salvador.
Figure 5.6: Costs of Violence (Percentage of GDP)
Source: (Acevedo 2008)
The above evidence is strong, but to a certain degree health costs capture some investment as
well as some lost productivity, so it is worth repeating the exercise without health costs in order
to remove any doubt about the validity of the results.
20
According PAHO definitions quoted in Acevedo 2008, any country with a rate of 10 homicides per 100,000
people or higher has an ―epidemic‖ level of crime.
0%
2%
4%
6%
8%
10%
12%
% o
f G
DP
El Salvador
Costa Rica
Central America(averages)

73
Figure 5.7: Costs of Violence, Without Health Costs (Percentage of GDP)
Source: Acevedo, 2008
Removing the health costs does show El Salvador spending less as a total than Honduras, which
spends significantly more on the institutions to fight crime, and Nicaragua, which has
significantly higher costs for private security. Nonetheless, El Salvador still appears to spend
more than twice as much as Costa Rica and more than 1 percent of GDP more than the Central
American average. Removing the health costs from this calculation in no way refutes the idea
that El Salvador pays an extremely high shadow price for crime and violence issues.
0.0%
1.0%
2.0%
3.0%
4.0%
5.0%
6.0%
Institutional Costs Private Costs of Security Materials Lost total-health costs
% o
f G
DP
Guatemala
El Salvador
Honduras
Nicaragua
Costa Rica
Central America

74
Figure 5.8: Costs of Violence, Without Health Costs, El Salvador, Costa Rica and a Central
America Average Only (Percentage of GDP)
Source: Acevedo, 2008
Evidence of the business perceptions of crime and violence in El Salvador further support these
cost estimates. A 2006 World Bank Enterprise Survey asked businesses of varying sizes
throughout Latin America, as well as other lower-middle income countries, if they felt that crime
was an obstacle to the operations of their business. According to the results shown, 47.8 percent
of businesses in El Salvador identified crime as an obstacle to their operations, exceeding
average affirmative responses from other Latin American and lower-middle income countries by
more than 15 percent.
0.0%
0.5%
1.0%
1.5%
2.0%
2.5%
3.0%
3.5%
4.0%
4.5%
5.0%
Institutional Costs Private Costs of Security Materials Lost total-health costs
% o
f G
DP
El Salvador
Costa Rica
Central America

75
Figure 5.9: Crime in El Salvador vs. Comparators
Source: (World Bank, 2006)
The 2006 World Bank Enterprise Survey also provides greater specificity regarding how these
costs differently affect businesses of varying sizes. Small businesses spend less on security as a
percent of sales than medium-sized businesses, likely because higher costs for alarms and guards
price them out of that market. However, the losses due to crime of small businesses as a percent
of sales greatly exceed losses of medium businesses and large businesses. This is probably
largely due to the fact that small businesses simply have lower sales, meaning that any losses
will appear as a higher percentage of sales, but a non-negligible component of this figure is
likely due to the higher susceptibility of small businesses to crime. This evidence indicates that
the crime situation is likely a bigger constraint for smaller businesses, which means that
releasing that constraint could do more for economic growth, job creation and reducing
inequality if, as some evidence suggests, the small business sector contributes disproportionately
to those goals.
0%
10%
20%
30%
40%
50%
60%
% of firmsidentifyingcrime as an
obstacle
Costs of Security(% of Sales)
Losses due toCrime (% of
Sales)
El Salvador
LAC
Lower Middle Income

76
Figure 5.10: Crime Costs per Size of Business
Source: (World Bank, 2006)
Recent surveys on democracy in Latin America underscore the severity of the crime problem in
El Salvador. A recent America‘s Barometer survey asked respondents in most countries in the
Western Hemisphere about their level of support for the respect of the Rule of Law in their
country. Respondents in El Salvador were the second least supportive of respecting the Rule of
Law in their country, second only to Ecuador. Based on an analysis of determining factors for
that response, only age, perceptions of insecurity in the country, and the level of confidence in
the justice system were factors that are statistically related.
0.0%
1.0%
2.0%
3.0%
4.0%
5.0%
6.0%
7.0%
8.0%
Costs of Security (% of Sales) Losses due to Crime (% ofSales)
Small business
Medium business
Large Business

77
Figure 5.11: Support for the Respect of the Rule of Law, Various Countries
Source: (Macias, Cruz and Seligson 2010)
This evidence shows that, at the very least, the crime situation in El Salvador is significantly
correlated with low levels of respect for the Rule of Law in El Salvador. This is a troubling and
dangerous trend, largely because it is difficult to predict what may happen if it does not reverse
course.
Applying the four tests to the crime situation in El Salvador seems relatively straightforward, but
we will delve deeper to solidify the case.
1. The shadow price of the constraint should be high
Based on the calculations above taken from the analysis done by Carlos Acevedo, a shadow price
for crime could be 10.8 percent of GDP which are high even by comparison with other Central
American countries with severe crime problems. One rebuttal to this estimation might be that

78
this 10.8 percent of GDP figure does not represent an appropriate shadow price because it does
not represent GDP lost due to crime as much of that 10.8 percent figure is still captured on
expenditures on healthcare to address wounds from crime and job creation through private
security firms. Removing the healthcare component still showed that roughly 4.8 percent of
GDP was lost due to crime in El Salvador, well higher than the Central America average and
more than twice as much as Costa Rica, the only country in the region without an epidemic level
of crime. Also, while it may be true that some of the healthcare expenses represent invvestment,
it is indisputable that much of the money spent on security would be spent more productively on
other activities.
A recent American Chamber of Commerce in El Salvador survey reports respondents spend an
average of 7.7 percent of their expenditures on security. When respondents were asked what they
would dedicate their security expenditures to if crime was decreased, 33.8 percent responded that
they would use those expenditures on human capital development, 20.3 percent responded that
they would spend on new areas of work, 16.2 percent said they would spend on research and
development and 13.5 percent said they would expand into new markets (Salvador-AmCham
2011). All of these uses add significantly more value and economic growth to the economy than
expenditures to address wounds resulting from crime and jobs in the private security industry.
Lastly, a study conducted at the Universidad Centroamericana in El Salvador cited an analysis
saying that crime in Latin America has resulted in investors foregoing 16 percent of gross fixed
capital formation. This study repeats this methodology just for El Salvador and shows that the
country annually lost 0.47 percent of GDP worth of foregone gross fixed capital investment from
2005-2008 due to crime (Gallegos, et al. 2009). This figure can be added to the above costs,
resulting in the very high shadow price for crime in El Salvador. The evidence clearly directs us
to conclude that the shadow price of crime on economic growth in El Salvador is extremely high
and indicative of a binding constraint to economic growth.
2. Movements in the constraint should produce significant movements in the growth
rate
This test ultimately proves the most difficult to apply in the El Salvador context. Ideally, this
test is applied over time, and a determination of a binding constraint would show that during
some period in which the constraint was relaxed, the economy grew more rapidly. We can
perform such research for El Salvador, but more than anything it shows that over the past 20
years there was no period in which the constraint of crime was truly relaxed. Homicides per
100,000 inhabitants have exceeded 45 homicides per 100,000 for all but the first year of the
entire period. This rate exceeds the epidemic level of crime as defined by PAHO by a factor of
4.

79
Figure 5.12: Homicide Rates per 100,000 inhabitants and GDP per Capita over time
Source: Author’s calculation based on UNODC data and World Bank data
Given the inability to apply this test based on movements over time, we can attempt to apply this
test based on movements across space. That is, we can find out if areas of El Salvador that seem
less affected by the constraint of crime are growing faster or are determined to be better
environments for investment. In order to do this, we take statistics of robberies—which are
available in disaggregated fashion for El Salvador—and correlate them with scores on a recently
completed Municipal Competitiveness Index, which rates how competitive a municipality is for
economic activity based on perception surveys and some objective factors. This indicates a
result that provides some evidence that more competitive municipalities are also municipalities
with lower rates of robberies per 100,000.
0
500
1000
1500
2000
2500
3000
3500
4000
0
10
20
30
40
50
60
70
80
90
100
1990 1992 1994 1996 1998 2000 2002 2004 2006 2008
Co
nst
ant
20
00
US$
Ho
mic
ide
s p
er
10
0,0
00
inh
abit
ants
Year
Homicides per 100,000 inhabitants GDP per capita

80
Figure 5.13: Robberies per 100,000 vs. Municipal Competitiveness Index Score
Source: Author’s calculation based on Government of El Salvador data and data from the Municipal Competitiveness Index
(USAID, 2009)
In other words, this provides some support that movements in the crime constraint, represented
by robberies per 100,000, produce the predicted movements in the objective function,
represented by the Municipal Competitiveness Index score, although in this case this is over
space and not time. Based on this information, the second test seems satisfied, if not
overwhelmingly so.
3. Agents in the economy should be attempting to overcome or bypass the constraint
In addressing the first test we went fairly far in addressing this test as well. Many of the costs
cited are costs incurred by businesses in order to overcome the problems of crime. It is worth
mentioning again, however, the American Chamber of Commerce of El Salvador survey saying
that businesses spend 7.7 percent of their expenditures on security costs. A further measure of
how agents are overcoming or bypassing the constraint of crime in the economy would be to
consider overall expenditures on private security in El Salvador. A study conducted at the
Universidad Centroamericana, citing an Acevedo (2007) paper, estimates that businesses and
private families combined spent 4.7 percent of GDP on private security in 2007 (Gallegos, et al.
2009). Startlingly, the same report mentions that while there were 16,000 policemen in the
Policia Nacional Civil in 2007, 400 private security firms employed over 25,000 private security
guards. This indicates that private security guards, which represent one of the ways agents are
trying to bypass the constraint of crime in El Salvador, outnumbered official police in 2007 by a
y = -60.28x + 667.03R² = 0.0212
0
200
400
600
800
1000
1200
0 1 2 3 4 5 6 7

81
ratio of greater than 3 to 2. Clearly, agents are working very hard to bypass the binding
constraint of crime in El Salvador.
4. Agents less intensive in that constraint should be more likely to survive and thrive,
and vice versa.
Lastly, larger businesses that are more capable of absorbing costs of private security see far
lower losses as a percent of sales than smaller businesses that are less able to pay for private
security measures. This was examined earlier in this chapter, citing evidence drawn from the
World Enterprise Survey from 2006. Furthermore, anecdotal—and sometimes gruesome—
evidence from interviews and news stories of businesses that are in particularly susceptible
industries to crime accentuates how agents who are more intensive are particularly suffering. In
a focus group conducted for this study, some delivery companies mentioned how they now
refuse to deliver to certain areas of the country they consider particularly dangerous. Busses and
bus drivers have been particularly and repeatedly affected by violent extorsions. This fact was
crystalized by events last summer when a bus was set fire, killing 17 individuals trapped inside
and by later bus strikes in response to retaliation threats from gangs that they would specifically
target busses. During the strike, 80 percent of public transportation was shut down resulting in
economic losses estimated in the millions of dollars as businesses had to close due to the
inability of employees to show up for work (BBC 2010). Moreover, we heard from call centers
and enterprises in the special economic zones that they have to do extensive background checks
on job applicants extending back to applicants‘ relatives‘ US contacts to avoid hiring persons
with relations to organized crime. We also heard from international couriers that they will not
deliver to some zones in El Salvador. While this is largely anecdotal information, it is strong and
paints a complimentary picture to the hard data that crime inhibits economic activity. Based on
this analysis, the fourth test confirms that crime is a binding constraint to growth in El Salvador.
Conclusion
The application of these four tests clearly indicates that the crime situation in El Salvador is a
binding constraint holding back the country‘s economic growth prospects. Furthermore, it is
almost certainly the single most binding constraint. It may also be a danger that threatens the
significant progress El Salvador has made since the end of its civil war in the early 1990s. The
clarity with which this constraint is demonstrated underscores the severity of the situation.
It is important to note here that the crime problem in El Salvador is far more than an economic
problem. Due to the methodology this study employs, it must deal exclusively in facts and
figures and stress their relationship with economic growth. However, the crime and security
problem in El Salvador has several consequences that are largely unquantifiable in terms of
economic costs but are nonetheless central to the overall effects of crime: the emotional and
psychological toll resulting from the murder of loved ones, the almost pervasive fear of being a
victim of crime, the erosion of social capital, and the effect on opportunities and decisionmaking

82
for the citizens of El Salvador. None of these issues is mentioned at length in this study, but the
impact of these issues in their own sphere exceeds the level of economic losswe observe here.
The existence of these issues only serves to reinforce the importance of addressing this binding
constraint to growth in a serious and focused manner—El Salvador‘s crime problem goes far
beyond being an economic problem; it also has a tremendously damaging social effect that must
be addressed. In this sense, it is important to note that recognizing crime as a binding constraint
and addressing public efforts to mitigate it, would likely bring forth large benefits to the
Salvadoran society as a whole. As such, tackling crime is very likely to provide overarching
benefits to the society that would spill over directly to the livelihood of the majority of
Salvadorans, thus promoting economic growth and greater social and economic equality. These
social effects, that go beyond the potential economic impact of removing this constraint,
underscore the great importance and opportunity that would come from addressing the crime
situation in El Salvador.
The purpose of this study is to identify what the binding constraints are, not what to do with
them. However, it is worth noting that the crime problem in El Salvador is extremely complex
and its causes and effects are multiple. Homicide statistics were used here as the basis for an
examination of the crime problem in El Salvador because of their greater consistency and more
reliable comparability across countries, which is exteremely helpful in applying the growth
diagnostic methodology. That does not imply, however, that homicides are the principal driver
of the effect of crime on economic growth in El Salvador. Several types of crime, such as
frobbery and extortion, may have stronger direct impacts on reducing economic growth but the
lack of good comparative statistics about these crimes led to their omission from the study.21
Furthermore, this section did not go into further detail about the potential causes of the crime
levels in El Salvador. However, at the risk of suggesting a policy direction for this initiative
after this study, crime‘s interaction with rule of law weaknesses in El Salvador is worth noting.
As was shown earlier in this section, perceptions of insecurity in El Salvador and a lack of
respect for rule of law are correlated at a statistically significant level. It may be difficult to
determine causality between rule of law problems and crime problems in El Salvador, but it
seems undeniable that there are interrelated problems in these two areas. Any serious effort by
this initiative to solve this problem should examine in depth these various causes and effects.
b. Political Uncertainty
Political uncertainty in this context refers to the concern that economic and social policy in El
Salvador does not follow a consistent course, but rather changes erratically from one set of goals
to another. Political uncertainty is not commonly considered as a potential binding constraint
within growth diagnostics, but the level of concern expressed recently in El Salvador regarding
21
Illustrative of the problem of statistical availability on these crimes is the fact that the UNODC, which is
commonly pointed to as the best available source for crime statistics, only had statistics on robberies in Central
America for any country for the 2005 and 2006 years during the period from 2003-2008. To examine this dearth of
statistics, feel free to access this data here: http://www.unodc.org/unodc/en/data-and-analysis/crimedata.html

83
this issue merited its inclusion in this study. Several news stories have reported on concerns
from the private sector regarding the level of political and policy uncertainty recently, and
Standard & Poors downgraded El Salvador‘s credit rating in January, citing ―a growing divide
between President Mauricio Funes and the nation‘s Congress that threatens to derail economic
reforms‖ (Reuters 2011) (La Prensa Grafica 2010) (Alle 2011). While these concerns and
stylized facts merit further investigation, they do not necessarily constitute evidence of a binding
constraint. Based on the information available, this does not appear to be a binding constraint to
growth, although there are issues with political uncertainty in the country that may be worth
addressing.
Measuring political uncertainty, especially as it relates to economic outcomes, is a difficult task,
which makes coming to a conclusion about this area more difficult. Many studies draw
conclusions about the relationship between political uncertainty and economic growth, finding
that increased political uncertainty does in fact reduce economic growth. Ari Aisen and
Francisco Jose Veiga of the IMF measured political uncertainty or instability by counting the
number of times in a year a new leader was named or, at minimum, 50 percent of cabinet posts
changed hands. Unsurprisingly, they found that political uncertainty of this type and magnitude
has a significant negative effect on economic growth. They do attempt to further disaggregate
the effects of political uncertainty on economic growth by creating four additional indices, which
include measurements of constitutional changes, coups, executive changes, government crises,
number of legislative elections, a fragmentation index, and a measure of revolutions (Aisen and
Veiga 2011). These results show that political uncertainty negatively affects economic growth,
but replicating this analytical method in the current Salvadoran context would not capture the
type of political uncertainty currently being discussed.
Richard Jong-a-Pin delves further into potential measurements of political uncertainty and
develops one area of political uncertainty which measures uncertainty within a political regime.
This area of political uncertainty includes measurements of changes in the executive, veto
players who drop from office, fractionalization, years of ruling party in office, polarization,
number of elections and government crises. This measure of political uncertainty to some extent
approximates the perceived uncertainty currently taking place in El Salvador, but Jong-a-Pin
finds that such uncertainty positively affects economic growth, although his results are not
statistically significant (Jong-a-Pin 2009). Finally, Dani Rodrik developed a theoretical model
where political uncertainty, interpreted as the probability that the government will reverse a
policy that is already in place, is considered as a tax on the business sector when there is a risk.
He does not develop a model himself, saying that it would not meet econometric standards, but
does quote other studies which indicate that the harmful effects of political uncertainty may
outweigh the beneficial effects of even good economic policy (Rodrik 1989). Rodrik‘s concept
of political uncertainty could help measure the level of political uncertainty in El Salvador and
its effects on economic growth, but there is no way of making his concept actionable and
defensible. Despite a number of good ideas and research papers on the effects of political

84
uncertainty on economic growth, the specific concerns regarding political uncertainty in El
Salvador are not captured by these methodologies.
As a result of this dearth of approaches to studying the particular circumstances of political
uncertainty in El Salvador, this study relies on available evidence from a variety of sources. One
source that is used by all of the studies described above is the Polity IV indicator set. Polity IV
produces an annual State Fragility Index that serves as a measure of the stability of a political
system in a given country. The State Fragility Index is a composite of a variety of measurements
of a country‘s effectiveness and legitimacy in security, political, economic and social aspects. It
is based on hard data regarding events that are occurring in a particular country—such as small-
scale wars or violence to help determine security effectiveness—or current conditions of the
country—such as the GDP per capita to help determine economic fragility. Each of these areas
is scored on a 0 to 3 scale—except for the economic effectiveness indicator which is scored from
0 to 4—and then the scores are compiled to create a country‘s score on the State Fragility Index.
The scores on that index go from the best score of 0, or ―no fragility‖ to 25, or ―extreme
fragility‖. El Salvador compares well with other Latin American countries, as well as reference
countries of similar geographic and population composition. Furthermore, the trend in El
Salvador is consistently downwards, towards less fragility.

85
Figure 5.14: State Fragility Index, Various Countries
Source: Polity IV State Fragility Index Scores, 1995-200922
The above figure suggests that, at least at a macro level, El Salvador is not significantly more
politically uncertain or unstable than any relevant comparison country and, in most cases, it is in
fact less politically uncertain.
One criticism of this is that it fails to account for the most recent two years, since the latest
measurement of the State Fragility Index is from January of 2009, before the FMLN party took
control of the government for the first time in El Salvador‘s history. Since this was a significant
change, the State Fragility Index may be missing a very critical data point showing a significant
increase in uncertainty. There is no perfect way to respond to these criticisms, but evidence from
a recent survey of democratic and government sentiment conducted by America‘s Barometer
does help provide a more in depth story. In conjunction with related surveys conducted around
Latin America in 2010, Ricardo Córdova Macías, José Miguel Cruz and Dr. Mitchell A Seligson
conducted a survey in El Salvador about various issues and topics related to democratic
22
For the sake of clarity and readability, we did not asign a color to every line of this graph or include every country
in the legend. The countries included in this graph were Latin American countries and the following reference
countries: Israel, Malayasia, Singapore
0
5
10
15
20
25
19
95
19
96
19
97
19
98
19
99
20
00
20
01
20
02
20
03
20
04
20
05
20
06
20
07
20
08
20
09
Stat
e F
ragi
lity
Ind
ex
Sco
re
Year
costa rica colombia argentina bolivia
brazil Chile El Salvador

86
governance. Since the previous survey was conducted in 2008, this survey data provides a good
perspective on changes of perceptions of democracy and political certainty since the change in
government. Perceptions of political uncertainty are somewhat different than the reality, but
when it comes to investment and economic growth, negative perceptions of democracy and
increasing perceptions of political uncertainty should have similar effects as the reality of
decreasing democracy and increasing political uncertainty.
Generally, the survey data showed that the level of support for democracy in El Salvador
dropped slightly between 2008 and 2010, but not significantly and El Salvador remained within
normal ranges for Latin America, albeit on the lower end of the scale.
Figure 5.15: Average Support for Democracy in the Americas, 2008 vs. 2010
Source: LAPOP America’s Barometer Survey
While support for democracy decreased, support for the political system increased from 2008 to
2010. El Salvador now ranks sixth among 25 countries in the Americas, ahead of Canada,

87
Mexico, the United States and Brazil. This seems like a paradoxical result, since support for
democracy decreased while support for the political system increased, despite the fact that
democracy is the political system. This could be a result of a misunderstanding that democracy
is the political system, or a different interpretation of what the political system is in El Salvador.
Regardless of the explanation, neither of these responses demonstrates unequivocally that
political uncertainty is a binding constraint to economic growth in El Salvador.
Figure 5.16: Average Support for the Political System in the Americas, 2008 vs. 2010
Source: LAPOP America’s Barometer Survey
Specifically related to the economic management of the country, which is a more relevant
element of political uncertainty, the LAPOP America‘s Barometer survey demonstrates a sharp
increase in public perception. Contrary to what one would expect if political uncertainty related
to economic management was on the rise, public perception of economic management by the
government improved by nearly 47 percent.

88
Figure 5.17: Perceptions of Government Economic Performance in the Americas, 2008 vs.
2010
Source: LAPOP America’s Barometer Survey
This increase may be due to the fact that the FMLN ushered in a more populist strategy of
economic management and this survey polls the public and not the private sector more
specifically. Thus, this survey result may reflect that the general population is satisfied with the
FMLN‘s economic management, while some in the private sector are less satisfied. In fact, a
recent study conducted around the same time by FUSADES, a respected Salvadorian think tank,
does demonstrate that the private sector feels differently. Their survey shows that in the past
year political uncertainty in the country has moved from the seventh most influential factor
contributing to an unfavorable business climate for investors in El Salvador, to the second most
influential.

89
Figure 5.18: Principal Factors that Influence the Unfavorable Investment Climate, By
Order of Importance (1st Quarter, 2008 through 2
nd Quarter, 2010)
Source: FUSADES, Dynamic Investment Survey
This survey does not show how important the level of uncertainty is relative to the most
important factor, or what is causing this uncertainty, but it does provide evidence that seems to
contradict the more optimistic picture demonstrated by the LAPOP results.
In conclusion, the evidence regarding the level of political uncertainty in El Salvador and
whether or not it could be considered a constraint to economic growth in the country is both
imperfect and mixed. Applying the four tests using the current evidence demonstrates the
problems with this evidence and suggests that this is not a binding constraint to growth. There is
no concrete evidence of any costs of the current political uncertainty, such as investment lost due
to uncertainty, so a shadow price cannot be appropriately estimated. Based on information from
Polity IV, political uncertainty has consistently fallen over the last 15 years but economic growth
has not consistently risen over that time period. Agents in the economy often mention political
uncertainty as an important concern, but it is difficult to quantify any measures being taken to
overcome uncertainty. Lastly, it is not clear which agents would be less or more intensive in
political uncertainty, making it very difficult to consider how that is affecting their growth. As a
result, it is not possible to conclude that this is a binding constraint to growth due to lack of
evidence; and what evidence does exist does not suggest that this would be a binding constraint.
However, there is enough evidence to suggest that at least some important actors within
Salvadoran society are deeply concerned about the level of political uncertainty and the potential
direction of the Government‘s management of the economy. Furthermore, most public
Crime/Insecurity
Low Level of Activity
Uncertainty

90
pronouncements by the government seem to suggest that the Government wants to work closely
and cooperatively with the private sector and does not intend to have a combative relationship.
Presumably, private sector actors are mainly concerned with increasing profits and the economic
growth that would result from that and will work with a Government that can help them
accomplish that goal. If both of the previous statements are true, then it should not cost much in
time, effort or resources to diminish the level of political uncertainty in the country. Despite the
fact that the level of political uncertainty cannot be determined to be a binding constraint to
growth, it may be worthwhile for the U.S. Government, Salvadoran Government and the private
sector to work together through a variety of means to address this problem in advance of
upcoming elections in 2012 and 2014.
c. Institutions
The World Economic Forum annually rates the competitiveness of over 100 countries in the
world. Over the past five years, El Salvador‘s position has deteriorated approximately 20
positions to a ranking of 74th
out of 113 countries (a higher ranking reflects lower
competitiveness). The below chart reflects that this deterioration is even somewhat unique in
Central America—while El Salvador clearly demonstrates a trend of worsening competitiveness,
the rest of Central America has remained relatively steady or has improved over the last five
years. As a result of this, El Salvador ranks as the country with the third worst ranking in the
region, when it was the best ranked in 2005.
Figure 5.19: Competitiveness Rankings of Central American countries, 2005-2010
Source: World Economic Forum
After the previous five year period, El Salvador now stands as the third least competitive country
in the region, ahead of Honduras and Nicaragua. The circumstances of El Salvador‘s
competitiveness may be negatively impacted by the state of institutions in El Salvador. The
20
30
40
50
60
70
80
90
100
110
2005 2006 2007 2008 2009 2010
Costa Rica
El Salvador
Guatemala
Honduras
Nicaragua
Panamá

91
competitiveness ranking is based on measures in three categories: basic requirements
(institutions, infrastructure, macroeconomic stability, health and primary education), efficiency
and sophistication and innovation. Within the basic requirements category, the component on
institutions ranks the lowest, and the measure of institutions has deteriorated since 2007:
Figure 5.20: El Salvador’s rankings on the Global Competitiveness Report’s Basic
Requirements Sub-Index, 2007 and 2010
Source: World Economic Forum
This information suggests quite clearly that El Salvador may have an issue with its institutions,
and so we endeavor to study El Salvador‘s institutions more thoroughly.
Institutions are sometimes defined as the rules of the game which ―structure incentives in human
exchange, whether political, social or economic‖ (North 1990). An institutional structure, when
it is lacking, can be a constraint to growth because it fails to provide a clear set of rules that
allow transactions to take place. Without a clear set of rules, the costs of conducting a business
transaction can become insurmountably high (North 1987). Furthermore, if this framework or
set of rules does not exist or does not function properly, then a policy that otherwise would be
good, such as privatization, could have negative consequences. Lastly, Daniel Kaufmann, Aart
Kraay and Massimo Mastruzzi, the developers of the Worldwide Governance Indicators (WGI)
that will provide the organizational structure for this section, define governance, essentially
synonymous in this context with institutions, as ―the traditions and institutions by which
authority in a country is exercised. This includes a) the process by which governments are
selected, monitored and replaced; b) the capacity of the government to effectively formulate and
implement sound policies; and c) the respect of citizens and the state for the institutions that
govern economic and social interactions among them‖ (Kaufmann, Kraay and Mastruzzi 2010).
Regardless of how the concept is defined, providing well-functioning institutions is inherently a
0
1
2
3
4
5
6
institutions infrastructure macroeconomicenvironment
Health andPrimary
Education
2007
2010

92
government function, so a study of institutions as a potential constraint to growth falls under the
government failures side of low appropriability.
The idea of institutions, even after understanding where it exists within the growth diagnostic
methodology, remains a somewhat vague concept. Efforts to measure it have improved recently,
but it is still not perfectly clear which are the most important components of institutions or what
their impact is on economic growth in the short or long runs (The Economist 2008). In order to
truly study it within the methodology, it is necessary to break up the idea into more tangible
ideas that can be analyzed using data. Economists have tended to emphasize property rights and
the legal institutions that protect those rights as the institutions which need to be focused on, but
while those are important they are clearly not the only institutions which merit further
investigation.
The WGI provide a good organizing tool to help decide what requires further investigation in the
Salvadoran context, although it should be noted that no organizing tool yet exists in the literature
that sufficiently disaggregates institutions into truly discrete and complete component parts. As
a result, we use the WGI as our introduction to the subject matter, but it does not provide us with
a tool upon which to base strong conclusions. In fact, none of the information we can collect in
this area provides us with enough detail to conclude whether or not areas in institutions are
binding constraints, but the information available does give us a sense of where El Salvador has
a weaker institutional structure, and where it is relatively strong. Given the relationship between
institutions and a number of other important areas of economic activity, this chapter should
prove to be an important contributor to later policymaking within the Partnership for Growth,
even if it does not contain conclusions about the constraining effect of El Salvador‘s institutions.
The WGI rate the quality of institutions in six different areas. These indicators are based on
several hundred individual variables measuring perceptions of governance, drawn from 31
separate data sources constructed by 25 different organizations. These individual measures of
governance are assigned to categories capturing key dimensions of governance. An unobserved
component model is used to construct six aggregate governance indicators. The governance
estimates are normally distributed with a mean of zero and a standard deviation of one each year
of measurement. This implies that virtually all scores lie between 2.5 and -2.5, with higher scores
corresponding to better outcomes. The graphs below show the results for El Salvador, compared
to the trends for the whole Latin American Region in two forms. One is the most recent data
showing the percentile rank for El Salvador, along with a 90 percent confidence interval,
compared with the average percentile rank for the region. The colors reflect potential problem
areas and their severity, based on a country or region‘s percentile rank relative to the rest of the
world: a red bar indicates a potentially severe problem (percentile rank below 25 percent), an
orange bar indicates a less severe problem but still an issue (percentile rank between 25 and 50
percent), and the yellow bar indicates an area of concern (percentile rank between 50 and 75
percent). The other is time series information showing the change in the indicator scores for El

93
Salvador and Latin America from 1996 to 2008; note that the normalization of the WGI means
that cross-year comparisons measure relative not absolute changes. These graphs are presented
below:
Figure 5.21: El Salvador’s World Governance Index scores by category, compared to a
Latin America average in 2010 (represented by the lower bar)
Source: (Kaufmann, Kraay and Mastruzzi 2010), World Governance Indicators

94
Figure 5.22: El Salvador’s World Governance Index scores by category, compared to a
Latin America average since 1996
Source: (Kaufmann, Kraay and Mastruzzi 2010), World Governance Indicators
With a world average of 50 percent in the first graph above, it is clearly visible from the charts
that El Salvador is definitively better than the region, at a 90-percent confidence level, and above
the world average in the regulatory quality indicator. El Salvador is better than the region,
though not at a 90-percent confidence level, and better than the world average in voice and
accountability, government effectiveness and control of corruption. El Salvador is better than
the region, though not at a 90-percent confidence level, but below the world average in political
uncertainty. Lastly, El Salvador is worse than the region, though not at a 90-percent confidence
level, and significantly worse than the world average, in the rule of law area. This evidence is
not conclusive, but it does give a strong starting point and solid hypothesis that while rule of law,
for example, may be a potential problem, regulatory quality seems unlikely to be indicative of a
problem. In order to determine this more conclusively, we will disaggregate the information that
-0.9
-0.8
-0.7
-0.6
-0.5
-0.4
-0.3
-0.2
-0.1
0
1996 1998 2000 2002 2003 2004 2005 2006 2007 2008
Control of Corruption
LA
SLV
-0.6
-0.5
-0.4
-0.3
-0.2
-0.1
0
0.1
1996 1998 2000 2002 2003 2004 2005 2006 2007 2008
Government Efectiveness
LA
SLV
-0.5
-0.4
-0.3
-0.2
-0.1
0
0.1
0.2
0.3
1996 1998 2000 2002 2003 2004 2005 2006 2007 2008
Political Stability
LA
SLV
-1
-0.9
-0.8
-0.7
-0.6
-0.5
-0.4
-0.3
-0.2
-0.1
0
1996 1998 2000 2002 2003 2004 2005 2006 2007 2008
Rule of Law
LA
SLV
-0.15
-0.1
-0.05
0
0.05
0.1
0.15
0.2
0.25
0.3
0.35
0.4
1996 1998 2000 2002 2003 2004 2005 2006 2007 2008
Voice and Accountability
LA
SLV
-0.3
-0.2
-0.1
0
0.1
0.2
0.3
0.4
0.5
0.6
1996 1998 2000 2002 2003 2004 2005 2006 2007 2008
Regulatory Quality
LA
SLV

95
contributes to the WGI and other relevant information in each area. We will start first with the
area least likely to produce a constraint based on the WGI and end with the most likely.
Regulatory Quality
Regulatory quality, as defined by the World Bank‘s methodology, refers to the ―ability of the
government to formulate and implement sound policies and regulations that permit and promote
private sector development‖ (Kaufmann, Kraay and Mastruzzi 2010). ―Regulatory Quality‖
includes measures of the incidence of market-unfriendly policies such as price controls or
inadequate bank supervision, as well as perceptions of the burdens imposed by excessive
regulation in areas such as foreign trade and business development. According to the World
Bank indicator, the regulatory quality has improved significantly since 2003, comparing
favorably with the rest of Latin America.
Another measure of regulatory quality is the Fraser Institute – Economic Freedom of the World
indicators. This measure has an index that assesses the quality of regulations for credit markets,
labor markets and business. The index ranges from 0-10 and measures different indicators such
as percentage of deposits held in privately owned banks, foreign bank license denial rate, private
sector‘s share of credit, determination of deposit and lending rates by market forces or the
government, impact of minimum wage, use of price controls throughout various sectors of the
economy, and ease of starting a new business. El Salvador obtains a score of (6.09), larger than
the average in Latin America (5.57) and close to that of advanced countries (6.69). Based on this
information, it seems that El Salvador has a good regulatory environment in the areas of finance,
trade, and business.
Taking into account the fact that El Salvador performs significantly better than the region in the
area of regulatory quality on the WGI, and that the Fraser Institute information does not indicate
a problem with the regulatory environment in El Salvador, it seems that regulatory quality, at
least in the way it is measured by this indicator, does not present a binding constraint to growth
in El Salvador.
It is important to note that these indicators have some limitations, because they are more a
measure of non-interference from the government in markets and less a measure of the quality of
the government regulatory bodies. In addition, there are other important sectors that contribute to
the competitiveness of a country, and institutions in those markets do not perform very well. In
particular, regulators in water, electricity and public transport sectors may be performing poorly.
Many of these sectors were privatized fairly recently, and in many cases there were fewer
efficiency gains than should have been expected. This is likely due, in part, to failures of
regulation. These sectors provide great examples of how the issue of regulatory quality needs to
be considered not only in terms of how much of it has been removed, but also in terms of the
quality and appropriateness of the regulation that exists.

96
Voice and Accountability
The WGI defines this area as the ―extent to which a country's citizens are able to participate in
selecting their government, as well as freedom of expression, freedom of association, and a free
media.‖ While the WGI shows that El Salvador is at or slightly below the regional average in
this category, it also shows that it is above the 50th
percentile worldwide. The LAPOP
America‘s barometer survey, which was referred to repeatedly in the political uncertainty section
of this constraints analysis, shows that people do not feel too constrained when it comes to their
―voice‖. As can be seen from the graph below, 79.3 percent of citizens said they voted in the last
Presidential election, showing a relatively high level of electoral participation for the region.
Figure 5.23: Percent of Citizens Who Voted in the Last Presidential Election, Regional
Results
Source: LAPOP America’s Barometer survey (Macias, Cruz and Seligson 2010)
This evidence suggests that Salvadorans feel free to select government in a fair way.
Furthermore, potential arguments by which a lack of ―voice‖ would be a constraint to private
investment leading to economic growth seem somewhat convoluted. As a result, we accept the
initial suggestion by the WGI that this is not a constraint, but further research to verify that may

97
be merited. Accountability, however, really is a different concept than ―voice‖, and that issue
will be analyzed to some extent in the corruption section presented below.
Political Stability
The WGI measures ―Political Stability‖ by combining several indicators which measure
perceptions of the likelihood that the government in power will be destabilized or overthrown by
possibly unconstitutional and/or violent means, including domestic violence and terrorism.
Political instability presents a major risk of losing investments, so a sound political environment
is regarded as beneficial for growth.
According to most international comparisons and indicators, and as discussed in the political
uncertainty section of this paper, El Salvador is considered fairly stable in terms of this definition
of political stability. As the section on political uncertainty concluded, there is evidence of
political instability and concern regarding instability which makes it an important issue to be
dealt with, but there is not significant concern of a violent overthrow of government, or of some
faction unconstitutionally seizing power. Thus, the particular concern of radical changes in
power cannot be considered a constraint to growth in the economy.
Corruption
The WGI ―Control of Corruption‖ indicator measures perceptions of corruption, conventionally
defined as the exercise of public power for private gain. This phenomenon effectively constitutes
a tax and uncertainty around returns, and can deter growth if investors perceive that their returns
or risk-aversion-adjusted expected returns are not securely protected. Since institutional
accountability essentially refers to the ability to be held responsible for actions done using the
public trust, measuring the existence of corruption to a certain degree also measures the absence
of accountability.
The evidence of corruption in El Salvador is not clear. The results of World Bank indicators
reflect a significant improvement in the control of corruption since 1996. El Salvador had a
better outcome on this indicator than the rest of Latin America in 2008, and is currently at a level
similar to the rest of the world. However, this contrasts with other surveys and indicators that
indicate a high perception of corruption, or at least the presence of a worrying level of
corruption. According to Latinobarómetro, in 2008 36 percent of people thought there was more
corruption among politicians than before, and only 17 percent thought there was less corruption.
To a certain degree, this contradiction can be explained by the fact that the World Bank
indicators normalize the results taking into account the average of the world, and therefore a
country can improve its position if the world average indicator deteriorates. However, that does
not completely explain away this discrepancy.
One of the most cited indicators on corruption is provided by Transparency International. Their
Corruption Perception Index compiles survey data and ranks countries in terms of the ―degree to

98
which corruption is perceived to exist among public officials and politicans.‖23
The following
table shows the results for Latin America and the Caribbean. El Salvador is below the regional
average of approximately 3.7 but above the regional median of 3.3. However, this score is not
terribly good at the world level—the index is out of 10, so a score of 3.6 is very low. El
Salvador ranks 73rd
out of 178 countries, which is hardly a stellar performance (though better
than the median).
Figure 5.24: 2010 Corruption Perception Index Scores for El Salvador and other Latin
American and Caribbean Countries
Source: Transparency International, 2010 Corruption Perception Index
Compared to the Central American region, El Salvador ranks third among the six countries and
performs almost as well as Panama.
23
For more information, see the methodological note for the Corruption Perception Index from Transparency
International.
0 2 4 6 8 10
Venezuela
Paraguay
Honduras
Nicaragua
Ecuador
Guyana
Bolivia
Argentina
Dominican Republic
Mexico
Guatemala
Jamaica
Colombia
Peru
El Salvador
Panama
Trinidad and Tobago
Average
Brazil
Costa Rica
Uruguay
Chile
barbados

99
Figure 5.25: 2010 Corruption Perception Index Scores for Central American Countries
Source: Transparency International, 2010 Corruption Perception Index
The evidence from Transparency International does not clearly indicate whether or not
corruption in El Salvador is a binding constraint to economic growth. It is apparent that the
perception of corruption is still high in El Salvador, but not much worse than in other countries
in the region. A more robust conclusion must be based on strong evidence about the extent to
which the reality and perception of corruption may be limiting investment in El Salvador.
Government Effectiveness
The indicator related to government effectiveness refers to the ―quality of the civil service and
the degree of its independence from political pressures, the quality of policy formulation and
implementation, and the credibility of the government‘s commitment to such policies‖
(Kaufmann, Kraay and Mastruzzi 2010). This is pertinent to growth as long as those inputs are
crucial for the establishment and well-functioning of markets and the provision of public goods
and services. The WGI data shows that El Salvador has shown significant improvement in this
area and is currently better rated than the region in this category, almost at a 90 percent
confidence level. In addition, percentile rankings indicate that it is probably better than the
world average. Nonetheless, anecdotal information from private sector interviews has indicated
significant issues in this area which merit further investigation.
Digging deeper into the data reveals that El Salvador‘s civil service and public administration are
actually very weak, despite the improvements suggested by the WGI. As part of an IDB book
entitled ―El Estado de las Reformas del Estado en América Latina‖, Koldo Echebarría and Juan
Carlos Cortázar analyzed civil service quality and effectiveness throughout Latin America. They
find that El Salvador‘s civil service can be categorized as a clientelistic bureaucracy,
characterized by low levels of bureaucratic autonomy and capacity, where politics and not merit
0
1
2
3
4
5
6
Honduras Nicaragua Guatemala El Salvador Panama Costa Rica

100
drive personnel decisions (Echebarria and Cortazar 2007). All Central American countries, with
the exception of Costa Rica, are rated low in terms of the meritocratic nature, strategic
consistency and functional capacity of their bureaucracies.
Figure 5.26: Civil Service Indices, Central American Countries (without Costa Rica) and
Regional Averages
Source: (Echebarria and Cortazar 2007)
It is clear from the evidence presented above that Central American bureaucracies are worse than
their counterparts from the broader Latin America region. There is further evidence that
suggests that El Salvador might be a particularly poor performer among this group, at least in
certain areas. In the merit index measured by Echebarría and Cortázar, which measures the
effectiveness of employment protections within the civil service and the effectiveness of
protection from arbitrary, politicized rent-seeking decision making within the civil service, El
Salvador ranks second to last in Latin America, ahead of only Panama.

101
Figure 5.27: Merit Index
Source: (Echebarria and Cortazar 2007)
The same study ranks El Salvador as the country with the lowest quality of civil service, based
on a composite score of El Salvador‘s measures of efficiency, merit, structural consistency,
functional capacity and integrated capacity within the civil service.
Figure 5.28: Quality of Public Administration
Source: (Echebarria and Cortazar 2007)
Perhaps in part as a result of these public administration challenges, El Salvador has been unable
to fully spend its budget in recent years. The level of budget execution, which is the amount of

102
allocated budget that gets used in a given year, was only 63.7 percent and 68 percent in 2009 and
2010, respectively. This suggests that El Salvador is structurally weak in its ability to carry out
its plans.
The information provided by the IADB and the statistics regarding budget execution and
informality suggest the need for further investigation. The IADB also contributes their
information to a database called DataGov which tracks a broad set of indicators on a number of
governance-related issues. In the area of public management, El Salvador rates significantly
below regional averages—greater than 50 percent below the averages—in the meritocratic
practices of the civil service, capacities of external oversight institutions, efficiency in the civil
service, leadership consistency in the civil service, quality of information and statistics in
general, and structural consistency in the civil service. Furthermore, El Salvador rates greater
than 40 percent below regional averages in the competence of civil servants, the efficacy of
incentives in the civil service and the functional capacity in the civil service.24
While bureaucratic inefficiency is a problem for the government wherever it is found, for the
purposes of this investigation into the constraints to economic growth and private sector
investment, we are most interested in problems which arise as the public administration interacts
with commerce. In a 2009 survey by PROESA, the government‘s export promotion agency,
concluded that the government, in terms of inefficiency of bureaucracy and inconsistency of
judicial decisions, constituted one of three major obstacles to doing business in El Salvador
(PROESA 2009). Moreover, the informality section of this report also indicates problems with
institutions and shows that businesses in El Salvador choose informality at a higher rate than the
Latin American average, which is already high when compared to the world. This suggests that
the services provided by El Salvador‘s bureaucracy are poor, even relative to other Latin
American countries, resulting in businesses risking the uncertainties of operating informally at a
higher rate than in other locations in Latin America. Though these two examples of the PROESA
survey and the high level of informality are not exhaustive they are perhaps indicative that El
Salvador‘s challenges with public administration may touch on economic growth in significant
ways.
The evidence strongly suggests that there is a serious problem with the civil service bureaucracy
in El Salvador. We cannot truly conclude that this is a binding constraint because the
measurements of a shadow price and efforts by the private sector to operate around the constraint
would be too inaccurate to defend, so we do not make an attempt to conclude whether El
Salvador‘s government effectiveness presents a binding constraint or not. However, the
evidence does point to a serious problem that likely contributes to other important issues in this
report. It is likely that El Salvador needs to substantially improve the performance of its civil
service bureaucracy to achieve sustained higher levels of economic growth. One indication of
this is the difference in basic measurements of bureaucratic quality between El Salvador and
24
Calculations made based on the information here: http://www.iadb.org/datagob/index.html

103
some of the other successful, small open economies that El Salvador most likely must emulate.
Subtracting the crime-related indices from the institutions ―pillar‖ of the Global Competitiveness
Index25
and then taking an average of the remaining indices which measure such things as the
favoritism in decisions of government officials and the wastefulness of government spending,
gives a relatively good, quick metric of bureaucratic quality. As can be seen below, El Salvador
does not compare well with a set of countries with similar populations and land restrictions:
Figure 5.29: Country Averages on select Institutions ―Pillar‖ indicators of the Global
Competitiveness Index
Source: World Economic Forum Global Competitiveness Index 2010
With the Global Competitiveness Index, higher scores represent poorer performance. Among
this group of countries with similar population profiles, El Salvador only performs better than the
Slovak Republic. Again, while this information cannot be relied on to draw a conclusion
regarding the binding nature of this aspect of institutions, it is indicative of a problem. For
purposes of economic growth, if the country wishes to resolve some of the issues of bureaucratic
quality highlighted here, it is advisable to begin by examining those institutions that have direct
interaction with businesses and investment.
Rule of Law
The WGI measures what they consider ―Rule of Law‖ by measuring ―which agents confide in
and abide by the rules of society, and in particular the quality of contract enforcement, property
rights, the police, and the courts, as well as the likelihood of crime and violence.‖ The
component parts of rule of law measures perceptions of the incidence of crime, the effectiveness
and predictability of the judiciary, and the enforceability of contracts. Together, these indicators
25
Given El Salvador‘s crime situation, including the crime indicators would drastically skew the data and
misrepresent the situation. Removing the crime indicators gives us some sense of how bureaucratic problems are
affecting economic competitiveness absent the crime situation.
0102030405060708090
100

104
measure the success of a society in developing an environment in which fair and predictable
rules form the basis for economic and social interactions and the extent to which property rights
are protected.
The indicator for rule of law is especially relevant for economic growth. As Haussman and
Rodrik argue (Hausman 2004), a poor definition and protection of property rights can limit
productive investments if investors think that they cannot appropriate the returns on their
investments because their claims are not well-defined or are poorly protected as could result
from corruption, judicial manipulation or crime. As discussed in the previous section on
Government Effectiveness, the 2009 PROESA survey indicated that inconsistency of judicial
decisions is one of the major obstacles to doing business as identified by Salvadoran firms
(PROESA 2009).
Evidence suggests that inadequate protection of property rights could be limiting growth in El
Salvador. For example, the Economic Freedom index of the Fraser Institute rates the legal
structure and protection of property rights, which takes into consideration judicial independence,
impartial courts, intellectual property protection, military interference in the rule of law and legal
system integrity, as being at the average of Latin America, but considerably below the level of
developed countries.
El Salvador receives an overall rank of 101 of the 139 countries evaluated in the Global
Competitiveness Indicators‘ pillar of Institutions.
Institutions Sub IndicatorSub-Indicator World LAC CA El Salvador
1.01 Property Rights 4.4 3.9 4.0 4.1
1.02 Intellectual Property Protection 3.7 3.1 3.1 2.9
1.05 Irregular Payments and Bribes 4.3 3.9 3.7 3.9
1.06 Judicial Independence 4.0 3.4 3.1 3.0
1.07 Favoritism in Decisions of Government Officials 3.3 2.7 2.7 2.6
1.08 Wastefulness of Government Spending 3.4 2.8 2.9 3.3
1.09 Burden of Government Regulation 3.3 3.1 3.4 3.4
1.10 Efficiency of Legal Framework in Settling Disputes 3.8 3.3 3.2 3.1
1.11 Efficiency of Legal Framework in Challenging Regulations 3.7 3.2 3.2 3.0
1.12 Transparency of Government Policymaking 4.4 4.2 4.3 4.2
1.14 Business Costs of Crime and Violence 4.8 3.3 2.9 1.8
1.15 Organized Crime 5.2 4.0 3.4 2.2
1.19 Efficacy of Coprorate Boards 4.6 4.5 4.6 5.0
1.20 Protection of Minority Shareholders' Interests 4.3 4.1 4.0 3.8
1.21 Strength of Investor Protection n/a 5.1 4.3 4.3
Overall Rank Institutions Pillar 101 / 139 3.4
Source: Global Competitiveness Index 2010

105
Ultimately, the rule of law measurements certainly suggest a problem and a potential binding
constraint, but it is necessary to disaggregate this from the problem of crime. There are definite
interaction effects where the level of crime contributes significantly to the problems of rule of
law, both in reality and in the metrics used to measure the rule of law. Conversely, there seem to
be some problems with the justice system that contribute to the crime issue. In the end, the rule
of law is not determined to be a binding constraint on its own, but only because the aspects of
this area that appear potentially binding are so intertwined with the crime and security situation
in El Salvador that it should be considered as a critical component part of it. More research on
the quality of the justice system—both as it relates to economic functions and as it relates to the
circumstances of crime and violence—is certainly merited and necessary.
d. Informality
The informal economy, which can be defined broadly as ―those economic activities and the
income derived from them that circumvent or otherwise avoid government regulation, taxation or
observation‖ (Del'Anno 2003), (Del'Anno and Schneider 2005), (Feige 1989), is located within
the growth diagnostic tree under the government failures side of the low appropriability branch.
The informal sector could be an obstacle to growth if companies that are escaping government
regulation or taxation are outcompeting formal sector businesses, and causing future businesses
to not invest or to operate informally. If this is an obstacle, it would be an indication that
government is failing to enforce its business regulations and eroding the competitive structure for
businesses that do operate formally. It should be noted here that this section investigates
specifically if the existence of an informal sector is a binding constraint to growth for the formal
sector, not if there are binding constraints to growth for those in the informal sector. It is quite
likely, as will be discussed here, that the existence of a large informal sector in El Salvador is
symptomatic of other problems in the economy and that significant gains in productivity and
economic growth could be achieved if a proper avenue were established that would allow
informal actors to pursue their businesses through formal economic means.
Due to the fact that informal businesses are, by definition, attempting to escape detection, we
have very little concrete evidence on the effect of informality on economic growth in El
Salvador. The reason this merits treatment within this study is the concern some private sector
businesses have expressed about the impact of informality on the Salvadoran economy. For
example, the practices of the informal sector emerged as the second issue most mentioned as a
primary constraint in El Salvador in the 2006 World Bank Enterprise Survey, as shown below.

106
Figure 5.30: Top 10 Business Environment Constraints
Source: World Bank Enterprise Survey, 2006
The percentage of firms mentioning the informal sector as a constraint in El Salvador was below
the Latin American average, but above the average for Lower Middle Income countries. Due to
the complexity of this topic, the difficulty of studying it, and the limited time and resources
available, there is not sufficient evidence to conclude that this is an obstacle to economic growth,
but it is a topic worthy of deeper investigation.
There are two sides of informality worth studying. One side is the effects on growth of the
informal economy on the formal economy, which will be discussed here from a more theoretical
perspective. The other side is the underlying reason for the size of the informal economy, which
we will attempt to examine briefly as well.
On how the informal economy affects the formal economy, there are three main perspectives
regarding. The first is that the informal economy is comprised of businesses that would be
formal businesses and would add a significant amount of investment capital to the formal
economy if onerous regulations and payments required for them to become formal businesses
were removed (De Soto 1989), (De Soto 2000). The second perspective is that the informal
sector unfairly competes with the formal economy because they do not pay taxes and are not
subject to regulations. Furthermore, they free-ride and receive public infrastructure and basic
public services without paying for them, therefore eroding the quality for paying recipients
(Dell'Anno 2007), (Enste 2003). The third perspective is that the informal and formal economies
are ―dual economies‖ which do not directly compete in significant ways due to very different
levels of productivity (La Porta and Shleifer 2008). In this case, the informal economy and
formal economy do not affect each other significantly and, if anything, the informal economy
bolsters the formal economy by spending their earnings on goods produced by the formal

107
economy, and employing labor during formal economy downturns (Schneider and Enste,
Shadow Economies: Size, Causes, and Consequences 2000).
Many of the recent economic models on informality conclude that the ―dual economy‖ model is
the best perspective for interpreting the effect of the informal economy on the formal economy.
La Porta and Shleifer (2008) conclude that there is a ―dual economy‖ relationship between the
informal economy and the formal economy, due to the differences in productivity levels.
Furthermore, they find that there is not much interaction between the two: few formal firms
operated at any time informally, and few informal firms convert to becoming formal. Dell‘Anno
(2008) studies informal economies in Latin America and concludes that there is an interaction,
but it is positive and complementary, meaning that the informal economy supports and
strengthens the formal economy and vice versa. Russo (2008) concludes, similarly to La Porta
and Shleifer (2008), that the informal and formal sectors do show important differences in
productivity and so they do not experience a great deal of interaction, but he goes further in
saying that the reason for these differences in productivity might stem from the differences in
services available to legal formal economy actors versus informal economy actors (Russo 2008).
Schneider (2008) does not conclude anything about the relationship between the informal and
formal economies. However, he does show that the informal economy and corruption are
complements in developing countries because informal actors in developing countries rely on
illegal payments for services to continue operating informally, which in turn reinforces corrupt
behavior by government officials who are rewarded for providing services illegally and not
enforcing laws that apply to informal businesses. Based on these models, one conclusion
regarding the relationship between the informal and formal economies would be that they do not
interact significantly, and therefore it would be difficult for the informal economy to be a binding
constraint to growth in the formal economy of El Salvador.
Before concluding that the informal economy is not a binding constraint to growth in El
Salvador, it is important to see if the available information regarding El Salvador‘s informal
sector supports the more theoretical conclusion expressed above. As was mentioned earlier,
studying the informal economy is difficult due to the fact that it consists of actors that do not
want to be found and what information is available is limited. The clearest conclusion from the
available information is that this subject requires further study, but we can make some inferences
from the evidence. CONAMYPE wrote about the informal sector in their 2004 annual report. In
that, they find evidence that shows a relationship between the size of a small business—
measured by the number of workers—and the degree of informality of that business. They show
a similar relationship between the type of business—graded as ―subsistence firms‖ up to ―small

108
businesses‖—and the degree of informality of that business.26
The graphs showing these
relationships are shown below:
Figure 5.31: Degree of Informality by Type and Size of Business
Source: (CONAMYPE 2005)
This would provide evidence that El Salvador fits the pattern of conclusions mentioned above,
namely that informal businesses are less productive and may not compete with the formal
26
The categories of businesses from Subsistence I to Broader Revenue Generating all refer to classifications of
microenterprises. Using CONAMYPE defintions, Subsistence firms generate monthly sales equivalent to 11.9
minimum-wage salaries, Basic Revenue Generating firms generate monthly sales equivalent to 23.8 minimum-wage
salaries, and Broader Revenue Generating firms generate monthly sales equivalent to 39.7 minimum-wage salaries.

109
economy, if these businesses are in fact less productive. There is suggestive—although not
conclusive—information showing that these small and less complex types of businesses are also
less productive. First of all, these businesses get more of their supplies from retail providers,
meaning that they have less sophisticated supply chains:
Figure 5.32: Principal Providers of Inputs, by Type and Size of Business
Source: (CONAMYPE 2005)
The level of supply-chain sophistication can be a proxy for the productivity of a business,
indicating that these businesses are less productive. Further evidence that these businesses are
less sophisticated is the reach of their business, or the distance of their clients from the point of
production or sale. As Rodrik (2008) argues, it takes a more sophisticated and potentially
productive business to export (Rodrik 2008). Extrapolating that argument to a natural
conclusion, it likely takes a more productive or sophisticated firm to operate in the next closest
region, city or town. The least sophisticated and productive firms would likely depend largely

110
on markets very near to their immediate surroundings. Indeed, the majority of small and less
complex businesses rely on their immediate surroundings for their revenue, as CONAMYPE
shows:
Figure 5.33: Principal Client by Size of Business
Source: (CONAMYPE 2005)
Although this evidence is not conclusive, it does strongly suggest that the smaller and less
complex businesses in El Salvador, which were also shown to be the more informal, are
significantly less productive than their larger, more formal counterparts. Based on the scant
available evidence, El Salvador therefore fits the theoretical argument, in which the informal
economy is less productive and not competing with the formal economy.
Attempting to apply the four tests to this issue proves extremely difficult. Formal economy
actors do not appear to pay any discernable shadow price for the existence of the informal
economy. One possibility would be to estimate the losses in economic growth caused by the lost
fiscal resources that the government does not obtain due to the number of informal companies. It
is impossible to calculate if movements in the number of informal businesses affected growth in
the formal economy, because measurements of the number of informal businesses are imprecise
and scarce. It is also extremely difficult to determine what effort anyone is taking to overcome
the constraint the informal economy might present. Lastly, determining who is more or less
intensive in a potential informal sector constraint would require a large amount of time and
effort, and no such evidence exists to date. Anecdotally, it is possible to find examples where the
magnitude of the informal sector was such that it replaced the formal sector, such as with the
video rental industry in El Salvador.

111
In conclusion, the evidence that does exist suggests, albeit inconclusively, that the informal
economy does not present a constraint to formal economic growth in El Salvador, but instead
operates in a separate or ―dual‖ economy. However, this conclusion is based on a limited
amount of evidence in a subject area that is extremely difficult to study, making it impossible to
support this conclusion with any strength. It is quite possible that the informal sector competes
with the formal sector in some very important ways, but in the aggregate that competition does
not constrain economic growth in the formal sector. It is also quite possible, if not likely, that
informal economy actors‘ not participating in the formal economy results in lost productivity and
lost economic growth for a country. In fact, that is central to Hernando De Soto‘s argument and
supported by a recent study by the IDB on productivity (De Soto 2000) (Pagés 2010). Given the
interest in this subject and the size of El Salvador‘s informal economy—48.3 percent in 2003, 5
percent higher than the average for Latin America—this merits significant attention in the future
to truly decipher the effects of the informal economy on the formal economy and potential
economic growth through various channels (Schneider, Buehn and Montenegro 2007).
A final point to emphasize is that the existence of a sizeable informal economy is an indirect
indicator of problems with government institutions. As mentioned earlier, El Salvador‘s
estimated informal sector was 48.3 percent in 2003, which was 5 percent higher than the average
for Latin America. The average for Latin America was 13 percent higher than the average for
Asia and 27 percent higher than that for OECD countries (Buehn and Schneider 2007). This
means that El Salvador‘s informal economy is larger than average for a region with a large
informal economy. Russo (2008) finds that while the informal economy and formal economy do
not compete, the main reason behind this is that informal firms cannot overcome the high
barriers to entry presented by inefficient or expensive bureaucracies that must be confronted in
order to formalize. Based on this evidence, one could infer that the presence of a large informal
sector like El Salvador‘s is indicative of problems in the institutional structure of the country,
and there might be a great deal to gain in economic growth and productivity by removing these
institutional barriers.
e. Macroeconomic Instability
An unstable or uncertain macroeconomic environment can restrict growth for several reasons,
including, but not limited to:
- Excessive price volatility, making earning potential less predictable and discouraging
investment; or,
- A fragile fiscal situation limiting the government‘s capacity to carry out counter-cyclical
policies, and making it difficult for the government to provide efficient resources.
Based on the evidence on hand, macroeconomic instability is not a binding constraint to growth.
This conclusion does not mean, however, that El Salvador will not face this constraint in the
future, particularly if it becomes difficult to meet fiscal goals.

112
Among Latin American countries, El Salvador has traditionally enjoyed relative price stability.
Out of 139 countries assessed by the World Economic Forum in its Global Competitiveness
Index 2010/2011, El Salvador was ranked 27th
on the rate of inflation and 45th
on interest rates.
These indicators show that El Salvador‘s price stability is a prominent competitive advantage.27
As figure 5.33 below shows, inflation is not considered a problematic factor for doing business
in El Salvador.
Figure 5.34: The most problematic factors for doing business in El Salvador28
Source: Global Competitiveness Report 2010/2011
El Salvador is not in as favorable a fiscal position. El Salvador ranks 75th
out of 139 countries in
government debt, and levels of public debt are currently at levels comparable to the high levels
of 1993.
27
Under the World Economic Forum‘s indicators, for indicator purposes the countries are placed in a descending
order in terms of competitiveness 28
Interviewees were asked to select 5 out of a list of 15 factors, which they considered more problematic and order
them between 1 (more problematic) and 5. The bars on the chart show the weighted responses according to their
ranking.
0.1
0.9
1
1.4
3
3.4
3.5
3.9
4.8
9.3
9.4
13.4
17.3
25.7
Real Exchange Rate Regulation
Lack of Work Ethic in the Workforce
Poor Public Health
Resrtictive Labor Regulations
Government Instability
Poorly Educated Labor Force
Tax Rates
Inflation
Tax Regulations
Corruption
Inefficient Government Bureaucracy
Access to Finance
Policy Instability
Crime and Robbery

113
Figure 5.35: Evolution of public debt as a percentage of GDP
Source: Salvadoran Central Bank (BCR)
Nevertheless, the increase in government debt has not yet resulted in greater cost of financing for
the country, as evident during the last placement of sovereign bonds in the international market
(see the analysis of costly financing in this document).
It is therefore possible to reason that although the fiscal situation is not currently a constraint,
and has not contributed to a greater degree of difficulty to access government financing, should
there be greater fiscal impairment, this could constrain the economy, in case the country has
problems financing its deficit.
The following tables show the projections contained in the Stand-By Agreement with the IMF.
According to these projections, in order for the national debt to decrease to 47.7 percent of GDP
by 2015, the country needs to generate a budget surplus29
starting in 2012. This implies that
fiscal revenues must increase by nearly two percentage points of GDP between 2010 and 2012.
Reaching these goals could become complicated if the country does not reach a fiscal pact that,
for example, might include raising taxes.
29
The primary surplus is calculated as total income minus non-interest expenses
20.0%
25.0%
30.0%
35.0%
40.0%
45.0%
50.0%
55.0%
60.0%
65.0%1
99
1
19
92
19
93
19
94
19
95
19
96
19
97
19
98
19
99
20
00
20
01
20
02
20
03
20
04
20
05
20
06
20
07
20
08
(p)
20
09
20
10
Evolution of public debt as a percentage of GDP

114
Table 5.36: Macroeconomic Framework Projections from the IMF Standby Agreement
(percent of GDP, unless otherwise noted)
Source: Central Reserve Bank of El Salvador; Ministry of Finance; and IMF staff estimates
Table 5.37: Operations of the Nonfinancial Public Sector, Projections from the IMF
Standby Agreement (in percent of GDP)
Source: Central Reserve Bank of El Salvador; Ministry of Finance; and IMF staff estimates

115
Since the beginning of the 1990s, the tax burden, defined as tax revenue as a percent of GDP, has
increased significantly in relatively short periods as compared to GDP growth, although it
remains significantly below regional and global averages. For example, according to data from
the Ministry of Economy, between 1989 and 1995 the tax burden increased from 5.0 percent to
12 percent and the tax burden rose steadily throughout the 2000s. It is worth noting that these
major increases in tax burden occurred during periods of relative prosperity;the tax burden
lessened significantly after the global economic crisis.
Figure 5.38: El Salvador Tax Revenues as a Percentage of GDP
Source: Graph produced using data from the Ministry of Economy of El Salvador30
According to expert estimates and despite efforts in the last few years to improve tax
administration, levels of evasion continue to be too high, posing a significant obstacle to
achieving GOES goals for tax revenue by the end of 2014 (16 percent of GDP).
Applying the four tests, we conclude that macroeconomic risk is not a constraint for growth
under the current conditions of the country. The shadow price of public debt is low, as interest
rates are lower than the regional average, and the most recent debt issuance was oversubscribed.
In addition, inflation is very low compared to other countries in the region. Agents in the
economy do not seem to be attempting to overcome or bypass the constraint by hedging against
inflation risk, and inflation is not perceived as an important obstacle for investing in the country.
Lastly, there is no evidence that agents who are less intensive in macroeconomic risks, such as
international companies with foreign holdings, are thriving more than others in this country.
Nevertheless, it could eventually turn into one of the most important constraints if the country‘s
30
There is an approximately 1 percent discrepancy between the IMF estimates and the estimates from the Ministry
of Economy. This is most likely due to recent revisons to GDP measurements. Despite the difference between these
graphs, the point remains the same—despite recent increases, El Salvador‘s tax burden is low relative to the region
and the globe.
11.0% 11.1% 11.8% 12.0%
12.2% 13.1%
13.8%
14.1% 14.0%
13.2%
0%
2%
4%
6%
8%
10%
12%
14%
16%
2000 2001 2002 2003 2004 2005 2006 2007 2008 2009

116
deficit worsens. The evidence above suggests that this could occur. In spite of the fact that El
Salvador has identified a plan to correct its fiscal imbalance, there is a risk that these objectives
will not be met. As a result, while this was not identified as a binding constraint, it merits
continued montioring and action to ensure that it does not become a binding constraint.
f. Analysis of Self Discovery
Hausmann and Rodrik (Hausmann and Rodrik, Economic Development as Self-Discovery 2003)
define self-discovery as learning what one is good at producing. Self-discovery is about making
the right decision, which determines the pattern of specialization. For the entrepreneur, making
the right decision is not a trivial matter, since knowledge of the production functions of existing
goods is not common to economic agents. This is a crucial recognition made by the self-
discovery model and which is supported by much literature, as opposed to the basic neoclassical
model that implicitly assumes production functions are known and common across existing firms
and potential entrants.
The problem related to self-discovery is that the initial entrepreneur who discovers the right
decision can only capture part of the social value that the knowledge generates. Therefore, this
type of entrepreneurship could be undersupplied, especially in developing countries where
intellectual property rights are poorly protected by instruments such as patents, so that there
would be a shortage of supply of this knowledge, which would in turn hamper economic growth.
Innovation comes in two types, posit Hausmann and Rodrik (2003): discovering new goods and
discovering that producing existing goods in new ways or in a new context (in a developing
country, for example) can be profitable. Consequently , incentives in developing countries may
be against the innovators not only due to deficient intellectual property rights protection, but also
because of low barriers to entry in countries overperforming in economic reform, since imitators
are able to easily enter the market and imitate, and thus free ride on the social returns created by
the discoveries. Knowledge acquired by discovering that producing a product can be profitable
spills over to other entrepreneurs. As protections for entrepreneurs of new products or new
production decrease, the risk that a country falls prey to such a self-discovery trap increases.
Existence of conditions that discourage self-discovery
Before assessing directly with indices that evaluate the possibility that El Salvador is in such a
trap, an attempt was made to evaluate the conditions that allow such a scenario, namely that
intellectual property rights protection is limited and that there are low barriers to firm entry and
imitation. Intellectual property appears to be only weakly protected in El Salvador, as
international rankings on that subject from the recent Global Competitiveness Report (GCR) and
International Property Rights Index Report show that although El Salvador ranks better than two
countries in Central America, its performance (2.9) is worse than the averages in Central
America (3.1), Latin America (3.1), and the world (3.7), and is worse, for example, than a
country at an earlier stage in its development process (Honduras), even more poorly than

117
countries with better overall economic performance in Central and Latin America, and much
worse than reference small countries in the world. Furthermore, the general ranking for El
Salvador in the GCR is 82, while the intellectual property rights protection rank is 96. This
indicates that relative to its overall performance, El Salvador lags behind in this particular
component.
Figure 5.39: International ranking on protection of intellectual property rights
Source: Global Competitiveness Report 2010-2011 and International Property Right Index Report 2011
For El Salvador to have the possibility of being trapped in a vicious self-discovery circle, market
entry barriers to imitation firms would have to be low and discoveries must be readily copied. On
the first front, despite the fact that El Salvador was considered to be a Latin American star
reformer for some time after it launched its economic recovery following the civil war, barriers
to market entry are rather high according to the World Bank Doing Business cross-country
rankings ( (Hausman 2004); (Monge-Naranjo and Rodriguez-Clare 2008)). On this account,
although El Salvador performs better than two countries in Central America, it is far from being
an exemplary reforming country, and it does not follow directly that the state of market entry
conditions in El Salvador would imply that the country could be stuck in a self-discovery trap.
We note, however, that even if the standard conditions for this Rodrik/Hausmann-style self-
discovery trap do not exist, that does not mean that self-discovery will happen. The absence of
the trap parameters is arguably a necessary but not sufficient condition for self-discovery.
Furthermore, while the barriers to entry may be helpful in a theoretical model of self-discovery
by helping to internalize spillovers from demonstration effects, they are less helpful in imposing
discipline to weed out low-productivity firms and encouraging factors to flow to their most
productive use.
0 20 40 60 80 100 120 140
El Salvador
Costa Rica
Guatemala
Honduras
Nicaragua
Panama
Chile
Singapore
Irlanda
Hong Kong
Rank
GCR Rank IPRI Rank

118
Figure 5.40: World Bank Doing Business Indicators, Starting a business ranking
Source: Doing Business 2011
Evidence of self-discovery
We begin the inquiry into the degree to which El Salvador is actually able to innovate and self-
discover through a metric formulated by Hausmann, Hwan and Rodrik (2005), which is a
measure of income/productivity level that corresponds to a country‘s export basket. This
measure, called PRODY, may be taken to represent the sophistication of a country‘s export
goods, so that the higher this value, the more sophisticated are the export products represented.31
Though the indicator is not without its detractors, in some sense the PRODY is a measure of how
closely a country‘s export basket represents the export baskets of developed countries, and thus
is a measure of the country‘s export and growth potential. The Figure below presents the
PRODY corresponding to the export goods of the countries that are presented.
31
PRODY is a variable calculated at the product level as the ―weighted average of the per-capita GDPs of the
countries exporting a product, where the weights reflect the revealed comparative advantage of each country in that
product‖. Hausmann and Rodrik (2005) also create a variable called EXPY, which is an export-weighted average of
the PRODY for that country. In this analysis, this EXPY is calculated, although it is reported as country-level
PRODY, using product level PRODY values during 1998-2000 as computed by Hidalgo, Klinger, Barabasi and
Hausmann (2007) and applying the relevant annual export data during the available period.
0 20 40 60 80 100 120 140 160 180
El Salvador
Costa Rica
Guatemala
Honduras
Nicaragua
Panama
Chile
Singapore
Ireland
Hong Kong

119
Figure 5.41: Country level PRODY values
Source: Author’s calculation based on Hidalgo, Klinger, Barabasi and Hausmann (2007) and COMTRADE data.
According to the calculations, El Salvador‘s PRODY value is comparable to the levels attained
by many countries, including relatively well-performing countries in Latin America such as
Costa Rica and Peru.32
In fact, El Salvador‘s levels are above some other countries with high
economic growth rates, such as Panama and Chile, in most of the years shown and especially in
recent years. Even Hong Kong‘s levels are within reach, with El Salvador‘s values in some years
being higher than Hong Kong‘s. Furthermore, calculations of PRODY average weighted with
export value shows that they have a value of US$16,704, which is even higher than the average
PRODY graphed above. All of this evidence demonstrates that the sophistication of El
Salvador‘s export products may not be considered so low as to consider that those products could
be readily imitated.33
The previous evidence tends to indicate that the country is not suffering
from self-discovery problems, but the next section attempts to measure this more directly.
32
A caveat to using the COMTRADE data for this analysis is admitted, namely that El Salvador‘s data up to 2004
does not include maquila exports. Since maquila exports represent an important part of total exports for the country,
omission bias to a different degree is existent on the analysis in this section. Where this omission may be
considerable is noted. 33
In another paper that calculates average PRODY for export products at country level, Felipe, Kumar and Abdon
(2010) estimate that this measure for El Salvador locates the country in the low tercile of the PRODY scale. Despite
the fact that this may lead to consider that El Salvador‘s export products have low sophistication, that may not be the
case as many other countries with high economic growth, such as Panama, Chile, Peru, China, India, Viet Nam, and
even some industrialized countries (Australia and Hong Kong), are also in the same tercile.
5.0
7.0
9.0
11.0
13.0
15.0
17.0
19.0
1990 1992 1994 1996 1998 2000 2002 2004 2006 2008
PR
OD
Y V
alu
e i
n T
ho
usan
ds
Year
El Salvador Panama Nicaragua Peru Ireland

120
To assess the degree of self-discovery efforts, the number of export discoveries made by El
Salvador is compared to that of reference countries, as is illustrated below. As Klinger and
Lederman (2010) indicate, it is important to recognize empirical evidence that shows that the
number of export discoveries first rises as economic development takes place, but a purchasing
power parity (PPP) per capita GDP of around US$4,000 represents an inflection point after
which that number starts to fall. Therefore, the figure below shows the new exports as a function
of GDP.
Figure 5.42: New products exported by PPP per capita GDP level
Source: Author’s calculation based on COMTRADE and IMF data.
According to the figures shown, the level of El Salvador‘s export discoveries seems to be above
the level shown by Honduras at the same per capita GDP level and also above Ecuador‘s level
for some years. For given per capita GDP values, Costa Rica and Chile‘s levels are above El
Salvador‘s, but that situates it between two performance groups. As such, the evidence seems to
point that El Salvador‘s export discovery process is well within the norm.
Notwithstanding the evidence above, a decent number of export discoveries does not exempt a
country from being in a self-discovery trap, as the quality of its discoveries has to be considered.
In this sense, evolution over time of PRODY values is evaluated first, with which a clear rising
tendency of the values is observed until 2002, after which PRODY tends to stabilize. Further
analysis of the PRODY value by sector composition reveals the main reason why this value has
0
100
200
300
400
500
600
700
800
0 2,000 4,000 6,000 8,000 10,000 12,000 14,000 16,000
Num
ber
of
Pro
ducts
GDP Per Capita (PPP current US$)
El Salvador Honduras Costa Rica Ecuador Chile

121
risen over the period. For this purpose, the change in sector composition of exports is shown first
below, which presents that the main export sector shifted from food and live and animals, which
represents the agriculture sector, to the miscellaneous manufactured articles, of which 84 percent
consists of the apparel sector.34
Figure 5.43: Change in sector composition of exports (1994-2009)
Source: Author’s calculation based on COMTRADE.
With this in mind, it is noted that in 1994, food and live animals had a sector PRODY value of
US$3,526. On the other hand, in 2009, the largest sector, miscellaneous manufactured articles,
had a PRODY value of US$9,319. It is clear from this that the source of the increase in PRODY
34
Due to the lack of data on maquila exports up to 2004, apparel exports may be underrepresented in the 1994 chart.
0 - Food and live animals",
0.491026004
1 - Beverages and tobacco",
0.010770328
2 - Crude materials, inedible,
except fuels, 0.016728182
3 - Mineral fuels, lubricants and
related materials, 0.000130126
4 - Animal and vegetable oils, fats
and waxes, 0.004024221
5 - Chemicals and related products,
n.e.s., 0.124589999
6 - Manufactured goods classified
chiefly by material, 0.213075323
7 - Machinery and transport
equipment, 0.031387121
8 - Miscellaneous manufactured
articles, 0.108268696
9 - Commodities and transactions
not classified elsewhere in the
SITC, 0
SITC Participation of Exports (1994)
0 - Food and live animals", 0.200086467
1 - Beverages and tobacco", 0.023826793
2 - Crude materials, inedible, except fuels,
0.012164573
3 - Mineral fuels, lubricants and related materials, 0.02700247
4 - Animal and vegetable oils, fats and waxes, 0.002565921
5 - Chemicals and related products, n.e.s.,
0.087727511 6 - Manufactured goods classified chiefly
by material, 0.150023023
7 - Machinery and transport equipment,
0.055140688
8 - Miscellaneous manufactured articles,
0.425781141
9 - Commodities and transactions not
classified elsewhere in the SITC, 0.015681413
SITC Participation of Exports (2009)

122
value for El Salvador is basically the change in the prevailing sector from agriculture, which has
a lower PRODY value, to apparel manufacture, with a higher value. The figure below shows the
PRODY value at the sector level in 1994 and 2009.
Figure 5.44: Sector weighted PRODY values for El Salvador (US$ ´000; 1994 and 2009)
Source: Author’s calculation based on Hidalgo, Klinger, Barabasi and Hausmann (2007) and COMTRADE data.
Note: The values have been weighted by the export values at the product level (SITC 4 digits).
As the table below indicates, new products have not contributed significantly to the rise of
Salvadoran PRODY value over time. However, this is not due to a low PRODY of the new
products, as its value is much higher than that of old products. Rather, the low incidence of new
products is due to the low share of the value of new product exports, which only represents
around 2 percent of the export value in 2009.
Table 5.45: PRODY by new and old exports since 1998
Export value in 2009 (US$ ´000) PRODY (US$)
New Exports 90,794 16,704
Existing Exports 3,705,736 9,576 Source: Author’s calculation based on Hidalgo, Klinger, Barabasi and Hausmann (2007) and COMTRADE data.
Note: The values have been weighted by the export values at the product level (SITC 4 digits).
Part of the reason that new products do not represent an important part of total exports is that
many of the emerging products do not last for too long. The figure below shows that most of the
new products, or almost 60 percent, for El Salvador remains as export goods for a year, while
less than 10 percent remain for more than ten years. These results contrast somewhat to those for
Costa Rica, Ecuador and Chile, though the differences are not particularly large. On the other
0
2
4
6
8
10
12
14
16
0 -
Fo
od
an
d liv
e a
nim
als
"
1 -
Be
ve
rag
es a
nd
to
ba
cco
"
2 -
Cru
de
ma
teri
als
, in
ed
ible
,
exce
pt fu
els
3 -
Min
era
l fu
els
, lu
bri
ca
nts
an
d
rela
ted
ma
teri
als
4 -
An
ima
l a
nd
ve
ge
tab
le o
ils, fa
ts
an
d w
axe
s
5 -
Ch
em
ica
ls a
nd
re
late
d
pro
du
cts
, n
.e.s
.
6 -
Ma
nu
factu
red
go
od
s c
lassifie
d
ch
iefly b
y m
ate
ria
l
7 -
Ma
ch
ine
ry a
nd
tra
nsp
ort
eq
uip
me
nt
8 -
Mis
ce
lla
ne
ou
s m
an
ufa
ctu
red
art
icle
s
9 -
Co
mm
od
itie
s a
nd
tra
nsa
ctio
ns
no
t cla
ssifie
d e
lse
wh
ere
in
th
e
SIT
C
PRODY (US$ ´000) 1994 PRODY (US$ ´000) 2009

123
hand, Honduras‘ results diverge more clearly from those countries, and El Salvador‘s better
performance as compared to Honduras is also clear. Therefore, despite the fact that this evidence
points to poor results, El Salvador‘s performance may be considered within the norm.
Figure 5.46: Number of New Products by Number of Years of Continuous Export
Source: COMTRADE data.
Another measure of the quality of new products, called PATH, is an index that attempts to
project the speed of structural transformation, which occurs near the area of a country‘s space
around the products for which that country has developed its comparative advantage (Hausmann
and Klinger 2007). Countries are able to transform their productive structure and upgrade their
exports more rapidly as they are able to have a path to nearby products that are increasingly of
higher value. In this context, to derive PATH, first a measure of the distance between each pair
of products based on the probability that countries in the world export both, called proximity, is
calculated. PATH is then computed as the sum of the proximities that characterizes a good with
the rest. This index represents how close in production possibilities a good is to all of the rest of
goods. The average of PATH for a country‘s export goods reflects the closeness of that country‘s
products to prospective products, of which the higher the value, the more upgrade the country
can make of its export products. Country level PATH values over time are shown in Figure 5.47
below.
1473 1830
1317 1737 867
702
788
722 1079 513
417
474
381 580 241
166
165
153 236 137
67
101
121 155 82
52
48
67 108 53
153
98
145 170 133
188 74
292 346 218
0%
10%
20%
30%
40%
50%
60%
70%
80%
90%
100%
El Salvador Honduras Costa Rica Ecuador Chile
Nu
mb
er
of
Pro
du
cts
1 year 2-5 years 2 years 3 years

124
Figure 5.47: Country level weighted PATH values
Source: Author’s calculation based on Hidalgo, Klinger, Barabasi and Hausmann (2007) and COMTRADE data.
The Figure shows similar results to those for PRODY in that El Salvador‘s values increase until
2002, which are among the highest PATH values in the reference countries. These values are
higher than most countries in many years, especially since 2001, and higher than all but one
country in one year. This indicates that new product possibilities for the Salvadoran economy are
getting more ample over time, since these products offer more new products that can be
developed based on them. When the source of growth for the overall PATH value is considered
by analyzing the sector PATH value, the same conclusion as that for PRODY is drawn, since the
shift from agriculture to the apparel industry basically explains the growth.35
35
Another finding from the sector PRODY and PATH Figures is that for most sectors, their PRODY and PATH
values have increased during the period analyzed. In the case of PRODY, seven sectors experienced the increase,
while for PATH, five sectors did. Amid these positive results, sector PRODY and PATH values for miscellaneous
manufactured articles have decreased, with the case for PRODY having a particularly pronounced decrease of 23%.
Since this is the most representative export sector that includes mainly apparel products, it is concerning that this
sector‘s performance has diminished over time. However, the decrease in these values for apparel may be related to
the maquila industry‘s production of less sophisticated products than the non maquila industry. If this is the case,
this would strengthen the argument made later in this analysis about the maquila industry‘s low contribution to El
Salvador‘s economic growth and development.
10
20
30
40
50
60
70
80
90
100
110
1990 1991 1992 1993 1994 1995 1996 1997 1998 1999 2000 2001 2002 2003 2004 2005 2006 2007 2008 2009
Path
Valu
e
Year
El Salvador Panama Nicaragua Peru Ireland

125
Figure 5.48: Sector weighted PATH values for El Salvador (1994 and 2009)
Source: Author’s calculation based on Hidalgo, Klinger, Barabasi and Hausmann (2007) and COMTRADE data.
Note: The values have been weighted by the export values at the product level (SITC 4 digits).
The previous evidence suggests that, along with the finding that Salvadoran export product
sophistication is not particularly low and that it is improving in time, aided to some extent by
new product discoveries, the Salvadoran product basket is allowing structural transformation of
the production structure.
At least that seems to be the story up to 2002, after which PRODY and PATH values stabilize,
which may be indicative of stagnation in successful self-discovery efforts since then. This
stagnation is evident also when observing the growth in export value in the period between 1994
and2001 and then 2002 and 2009, where it can be seen that the growth in the first period is 6
percent while in the second it is only 4 percent.36
Therefore, this evidence also tends to indicate
that self-discovery efforts were more fruitful in the first period than in the second period.
Even the self-discoveries in export products that were made during 1994-2001 may be
considered as not particularly successful when viewed with respect to their contribution to
growth in gross domestic product (GDP). To test this, first the correlation coefficient between
growth in export value and GDP was calculated during the whole period of 1994-2009, and El
Salvador‘s value is compared to other reference countries‘. The results are tabulated in Table
5.49 below.
36
Since maquila exports are included only in data beginning in 2005 and a large increase in export value is observed
in that year, the increase in that year has been imputed as the average of the rest of the years in the period.
0
20
40
60
80
100
120
140
160
0 -
Fo
od
an
d liv
e a
nim
als
"
1 -
Be
ve
rag
es a
nd
to
ba
cco
"
2 -
Cru
de
ma
teri
als
, in
ed
ible
,
exce
pt fu
els
3 -
Min
era
l fu
els
, lu
bri
ca
nts
an
d
rela
ted
ma
teri
als
4 -
An
ima
l a
nd
ve
ge
tab
le o
ils, fa
ts
an
d w
axe
s
5 -
Ch
em
ica
ls a
nd
re
late
d
pro
du
cts
, n
.e.s
.
6 -
Ma
nu
factu
red
go
od
s c
lassifie
d
ch
iefly b
y m
ate
ria
l
7 -
Ma
ch
ine
ry a
nd
tra
nsp
ort
eq
uip
me
nt
8 -
Mis
ce
lla
ne
ou
s m
an
ufa
ctu
red
art
icle
s
9 -
Co
mm
od
itie
s a
nd
tra
nsa
ctio
ns
no
t cla
ssifie
d e
lse
wh
ere
in
th
e
SIT
C
PATH 1994 PATH 2009

126
Table 5.49: Correlation between change in export value and GDP
Country Correlation
Coefficient
Nicaragua 0.24
El Salvador 0.27
Panama 0.32
Guatemala 0.33
Chile 0.59
Ireland 0.61
Costa Rica 0.67
Peru 0.70
Singapore 0.73
Source: Author’s calculation based on COMTRADE data.
Table 5.49 shows that El Salvador has the second lowest correlation coefficient among the
countries, meaning that its export growth explains its GDP growth less than most of the other
countries. In other words, the contribution of export growth to GDP growth is very low, so that
export discoveries have helped little in making the economy grow. Furthermore, the correlation
coefficient is calculated for the two periods reviewed earlier, as shown in Table 5.50.
Table 5.50: Correlation between change in export value and GDP for El Salvador in
different periods
El
Salvador
Correlation
Coefficient
1995-2001 0.50
2002-2009 0.34
Source: Author’s calculation based on COMTRADE data.
The correlation is higher in the first period as compared to the second one, from which it can be
concluded that export growth contributed more to GDP growth in the first period. These results
may be perplexing when contrasted with the high degree of self-discovery efforts that El
Salvador shows, but when the industry to which the country shifted its production is considered,
they seem coherent, since the apparel maquila industry has little productive linkage to the rest of
the local economy. The incentive provided to this sector has been mainly tax exemption for
maquila processing of imported inputs for exporting the finished good, under a duty-free zone. A
problem with this type of industry is that although it allows El Salvador to take advantage of its
skillful but relatively cheap labor, the value in forward and backward linkages that the country
enjoys from this activity is limited by the inability for other local activities to link to it.
Therefore, the industries in the free zone activities provide somewhat disappointing benefit to the

127
country‘s economy. Moreover, the profitability of the maquila sector has eroded in recent years
with increased competition from Southeast Asia.
Finally, although El Salvador has experienced a decent self-discovery process especially during
1995-2001, the self-discovery process appears to have stagnated over the last decade. It is also
important to recognize that GOES has heavily promoted this sector for nearly two decades now,
starting around the years during which the country was transitioning from the civil war era to
more peaceful times. That self-discovery export efforts have been more successful in the context
of a preferential public program, hints at the benefit of the Government of El Salvador providing
some arrangements that could help the industry to perform better. The fact that few of of the
higher PRODY and PATH industries come from outside the special economic zones suggests
that there may be basic productivity issues hampering the growth of exports which requires
direct price offsets from these zones.It is important to recognize that the free zone program
applies to any sector that may import inputs for its processing and subsequent export. In view of
this, concentration of the apparel sector under this scheme for some time now may be indicative
of some underlying problems in productivity and structural transformation, which may be
reflected by the stagnant PRODY and PATH values since 2001. When this is associated with the
fact that only industries supported by governmental promotion policies have flourished under the
macroeconomic environment that characterizes El Salvador, the need for the Government of El
Salvador to design an industrial policy that aims to further structural change seems evident.
In conclusion, this analysis found that while El Salvador‘s weak protection of intellectual
property rights provides some evidence into one of the two necessary conditions of the
Hausmann/Rodrik self-discovery trap, the evidence for the other necessary condition of ease of
entry by imitators does not clearly hold. In more direct measurement of the potential existence of
a self-discovery problem we observe that Salvadoran export products, including new one
productsemerging at a decent pace, tend to be increasingly more sophisticated and situated closer
to other new and more sophisticated products, at least until 2002. This situation does not
represent that of a country with a self-discovery constraint, at least until 2002. The decreased
pace of self-discovery afterwards is thought to be a result of problems related to factors of
productivity in tradables analyzed in the next section.
g. Low Productivity in the Tradable Sector
The term ―tradables‖ refers to goods and services that are traded or can be traded internationally,
and thus refers to exports and imports, or, from the point of view of a particular country‘s
production, ―tradables‖ refers to exports and import substitution (goods and services both
produced and consumed domestically but which are also available on the world market). The
prices of tradables are set by international markets, whereas the prices for non-tradables are set
domestically.

128
Evidence suggests that El Salvador is plagued by low productivity in the tradables sector. We
examine that evidence and judge whether that low productivity in the tradables sector is a
binding constraint to growth in El Salvador.
Before examining the evidence, it is necessary to understand the intrinsic potential importance of
the tradables sector in the El Salvador case. Several studies point out the benefits of export-led
growth. In the ―Report on the Strategies for Sustained Growth and Inclusive Development‖, the
Growth and Development Commission concluded that exports play a very important role in the
growth process. Rodrik (2008) shows that developing economies with strong exporting sectors
can reach high levels of growth, and Wacziarg (2007) shows that the structural change and
economic growth processes are characterized by diversifying the export sector, increasing its
competitiveness and improving the earning potential of the tradable goods sector. However, for
small developing economies, export-led growth is more than beneficial, it is almost necessary.
In a globalized world, small open states do not have the luxury of remaining closed to trade for a
variety of reasons (Katzenstein 1985). The market size of small countries does not allow
countries to depend exclusively on domestic demand for growth, so firms must turn to export
markets to be able to reach the economies of scale in production technology to compete. Import
substitution strategies are unlikely to achieve rapid growth in small countries in part because of
the same issue of market size.
Some very small countries can achieve rapid growth by specializing in a few commodities or
exports, but that strategy fails for somewhat larger—although still small—countries because a
few industries cannot drive or sustain the entirety of the economy. Evidence for Latin America
and the Caribbean (LAC) illustrates a U-shaped relationship between growth and population
size. For LAC countries with fewer than 1 million inhabitants, per capita GDP grew at an
average annual rate of 2.7 percent from 1981-2000; per capita GDPs in LAC countries with 1 to
10 million inhabitants shrunk at an average annual rate of -0.1 percent; and per capita GDP in
Latin American countries with more than 1 million inhabitants grew at an average annual rate of
0.5 percent. El Salvador, with a population of 6.2 million people, fits squarely into this middle
category (Ocampo 2002). The LAC data also show a positive relationship between exports as a
share of GDP and the log of population size for the very small Carribean nations of less than 1
million people, and a negative relationship with log population for those countries larger than 1
million people. This indicates that over the part of the inverted-U relevant (populations larger
than 1 million) small countries are more export intensive than larger ones (seeTechnical Annex
E). El Salvador, however, has a significantly lower export share than would be indicated by its
population. Because of its size, El Salvador must be productive in its tradables sector in order to
achieve the levels of economic growth that will propel it to a new stage of development.
For several reasons we use exports as a proxy for tradables in this section. First, exports are far
easier to measure, as they must be declared in customs. Import substitution is a far more difficult
construct to measure, and these measurement difficulties are compounded when making
international comparisons. Second, as described above, exports are a particularly apt proxy in the

129
case of El Salvador as they are far more likely to lead to sustained strong economic growth than
import substitution for reasons related to economies of scale and market size. Consequently
exports are perhaps a more proximate measure for the particular mechanism of growth needed
for El Salvador. Lastly, using exports as a proxy for tradables is not uncommon in the economic
literature37
.
We use broadly three interrelated sets of comparator countries here. As with other sections of
this Constraints Analysis, we use other countries in Central America. We also use states
signatory to the CAFT-DR agreement as these countries have comparable trade and protection
laws. Finally, we compare El Salvador with other countries in the world with a population
between 1million and 10 million (noting that all of the countries in Central America are in this
range except Guatemala with 14M). Countries of this size all have a need to engage in world
markets through exports. None of these countries has an overwhelming commodity export that
would skew data and misrepresent the relationship. Because of all of these factors, using
comparisons based on exports as a percentage of GDP should accurately reflect any problematic
differences with productivity in the tradables sector in El Salvador.
On those grounds, we analyze whether low productivity in tradables might be a problem in El
Salvador, using available information on exports and other economic data. Over time, exports
from El Salvador as a percent of GDP have fluctuated between 13 percent and 38 percent of
GDP, but for much of that time the fluctuation occurred within a narrower range, between 20 and
27 percent. At present, El Salvador‘s exports as a percent of GDP is around 23 percent, nearly
identical to where it was 50 years ago in 1960. El Salvador‘s exports as a percent of GDP went
through a period of expansion in the 1960s and 1970s, followed by contraction during the civil
war in the 1980s and the beginnings of a recovery in the 1990s. Most troubling, however, is the
stagnation during the 2000s with a downward trend at the end of the period, showing that El
Salvador has not expanded its export sector particularly well.
37
See, for example, Calvo, Izquierdo & Talvi (2003) and Beine and Coulombe (2007).

130
Figure 5.51: Exports as Percentage of GDP in El Salvador
Excluding the maquila sector, which has been a significant contributor to El Salvador‘s exports
over the last twenty years, shows an even less impressive performance. Looking at export
performance with and without this important sector is relevant because the maquila sector has
been a strong beneficiary of El Salvador‘s free trade zones and benficial treatment through
subsidies and tax incentives. As a result, and as will be explained later, their performance is
atypical for El Salvador‘s tradables sector. According to the Central Reserve Bank of El
Salvador, maquila constituted 55 percent of all exports in El Salvador in 2000. Applied to the
WDI total export statistics, exports as a share of GDP would be a mere 12.4 percent if maquila
exports were excluded. The difference between exports as a percentage of GDP with or without
the Maquila sector has lessened significantly in the past ten years, as maquilas have stalled in the
face of higher competition from Southeast Asia and non-maquila exports have managed to grow,
but there is still a difference of at least 3.5 percent (See Figure 5.51).
0
5
10
15
20
25
30
35
40
45
19
60
19
62
19
64
19
66
19
68
19
70
19
72
19
74
19
76
19
78
19
80
19
82
19
84
19
86
19
88
19
90
19
92
19
94
19
96
19
98
20
00
20
02
20
04
20
06
20
08
Pe
rce
nt

131
Figure 5.52: Exports with and without Maquila
Source: Shares of maquila to GDP from Banco Central de la Republica de El Salvador applied to export shares of GDP from
World Bank World Development Indicators
Comparing El Salvador‘s export performance to other countries in the region begins to
demonstrate the severity of this problem. Based on the most current figures and in comparison
to other Central American countries, El Salvador has the lowest exports as a percent of GDP, as
in Figure 5.52.
Figure 5.53: Exports as a percentage of GDP (2009)
While Guatemala may be somewhat less beholden to export-led growth due to its larger
population of 14M and Panama‘s figure is inflated due to re-exports through the canal, El
Salvador still remains at least ten percentage points below Nicaragua, Honduras and Costa Rica.
0.0%
5.0%
10.0%
15.0%
20.0%
25.0%
30.0%1
99
2
19
94
19
96
19
98
20
00
20
02
20
04
20
06
20
08
Total Exports withMaquila (Gross)Total with Maquila(Net)Excluding Maquila
0
10
20
30
40
50
60
70
80
90
El Salvador Guatemala Nicaragua Honduras Costa Rica Panama
Pe
rce
nt

132
Figure 5.54: Exports as a Percentage of GDP
If economic theory holds and countries with populations of El Salvador‘s size are in particular
need to develop a diversified export sector, it is elucidating to compare El Salvador further to
include other countries with populations between 4 and 8 million people, as well as Central
American countries. Based on this comparison, we see that El Salvador‘s performance is
decidedly worse at present than the vast majority of its relevant comparator countries as it is well
out on the lower tails of the distribution (See Figure 5.54).
0
20
40
60
80
100
120
1992 1994 1996 1998 2000 2002 2004 2006 2008
Pe
rce
nt
Guatemala
Nicaragua
El Salvador
Honduras
Costa Rica
Panama

133
Figure 5.55: Exports as a Percentage of GDP (Central America and Countries with
population between 4 and 8 million)
El Salvador‘s exports as a percentage of GDP are less than half of the average for this set of
countries, and its exports/GDP exceed only that of Sierra Leone, the Central African Republic
and Eritrea, among countries from its region or of a similar population size. It seems clear from
all of this information that El Salvador underperforms in exports. This apparent
underperformance is probably partially explained due to the low linkage of the export sector to
the rest of the economy, as shown in the self-discovery section.
It is illuminating to compare the trajectory of exports as a share of GDP of the top performers38
in the previous graph to El Salvador when they had similar levels of wealth. In figure 5.55 below
we see that all of these countries were more intensive in exports when their economies were the
size of contemporary El Salvador (taking the base year, T0, as El Salvador‘s GDP per capita in
38
We report those in the top ten performers of exports as a share of GDP from countries in Central America or with
a population between 4 and 8 million (2 million within El Salvador‘s roughly 6 million). In the Penn World Tables
data we do not have data for Slovakia, Papua New Guinea, Switzerland, or the Krgyz Republic at income levels
comparable to El Salvador in 2006.
0
50
100
150
200
250
Erit
rea
Ce
ntr
al A
fric
an R
ep
ub
lic
Sie
rra
Leo
ne
El S
alva
do
r
Leb
ano
n
Gu
ate
mal
a
Serb
ia
New
Zea
lan
d
Geo
rgia
Isra
el
Nic
arag
ua
Cro
atia
Fin
lan
d
No
rway
Ho
nd
ura
s
Co
sta
Ric
a
Jord
an
Par
agu
ay
De
nm
ark
Bu
lgar
ia
Kyr
gyz
Rep
ub
lic
Swit
zerl
and
Pap
ua
Ne
w G
uin
ea
Be
lize
Turk
men
ista
n
Pan
ama
Ire
lan
d
Slo
vak
Rep
ub
lic
Ho
ng
Ko
ng
SAR
, Ch
ina
Sin
gap
ore
Pe
rce
nt

134
2006). These countries went on to become the top performers for their size category, and we see
that when their economies were the size of El Salvador‘s they had significantly more exports
than El Salvador does now.
Figure 5.56: Exports as Percentage of GDP, Top Exporters (CA or Pop. 4-8 million)
Source: Alan Heston, Robert Summers and Bettina Aten, Penn World Table Version 7.0, Center for International Comparisons of
Production, Income and Prices at the University of Pennsylvania, May 2011.
Thus, controlling explicitly for size of the economy and population, we see that El Salvador is
well behind what it would want or need to be to grow to become like these countries.
Despite this, El Salvador shows some signs of potential export growth. As is shown in the
following section on self-discovery, El Salvador exhibits PRODY and EXPY scores in a variety
of industries that are in line with or better than comparator countries. In some important cases,
this appears to potentially be a product of subsidies or tax breaks for certain sectors, but that is
not universally true for all sectors. Based on this information, El Salvador should be growing in
some sectors at higher rates, but it is not. This further insinuates that there may be a problem
with productivity in the tradables sector.
All of this information points to the possibility that low productivity in the tradables sector is a
potentially binding constraint in El Salvador. As we apply the four tests to this potential
constraint, it is important to emphasize that while this problem applies somewhat to the firms
that already exist, it is a much more concerning problem when considering firms that are not
forming in El Salvador. If productivity of the tradables sector is indeed a binding constraint to El
Salvador, then firms that failed to start, failed to export or chose to locate somewhere else due to
this problem represent an opportunity cost or ―missing GDP‖ for El Salvador that cannot be
captured until this problem is resolved. Since these firms do not exist we cannot measure them
directly, but if the constraints to exports in El Salvador were removed, we would likely see more
0
20
40
60
80
100
120
140
160
180
200
T-5 T-4 T-3 T-2 T-1 T0 T1 T2 T3 T4 T5 T6 T7 T8 T9 T10Year
Represented period varies; in Year T0, GDP per capita equals El Salvador's 2006 GDP per capita
Bulgaria, 1995-2009
Hong Kong, 1961-76
El Salvador, 2001-09
Turkmenistan, 2002-09
Singapore, 1964-79
Ireland, 1952-1967
Panama, 1991-2006
Belize, 1986-2001

135
of these firms in existence. The following applications of the tests, particularly of test 1, aim to
understand the amount of GDP not created due to potential productivity challenges of tradables.
1. The shadow price of the constraint should be high
The perfect measure of the shadow price would be to measure the productivity of tradables in El
Salvador versus comparator countries to determine El Salvador‘s relative performance. For a
variety of reasons, some of which have already been discussed here, this is not feasible. As a
result, it is necessary to rely on proxies, both for productivity and for tradables. One potential
measure of productivity is the average real value added per person employed. We apply this
metric to the manufacturing industry because resulting goods are typically oriented towards
tradables and compare El Salvador‘s productivity with its largest trading partner, the United
States. Comparing the U.S. and El Salvador reveals that this measure of labor productivity has
grown much faster in the US than in El Salvador over the last 20 years, with a more pronounced
differentiation since roughly 2001.
Figure 5.57: Index of Labor Productivity in the Manufacturing Industry of the U.S. and El
Salvador
Note: Base: 1990=100
Another approach to the shadow price of competitiveness of tradables more generally is an
estimate of the ―missing tradables‖ that would have been produced if the country were not
constrained in this area. Accordingly, we would like to measure the size of the tradables sector as
a percent of GDP in El Salvador relative to similar figures for comparator countries. The
magnitude of the difference in this metric between El Salvador and its comparators should
indicate whether the shadow price is high or not. As explained previously, a reasonable proxy
0
50
100
150
200
250
300
19901991199219931994199519961997199819992000200120022003200420052006200720082009
usa SLV

136
for tradables in the Salvadoran case is exports. Here we examine El Salvador‘s exports as a share
of GDP in comparison with a set of relevant countries.39
As none of the countries in Central America is a major commodity exporter, which would skew
the data, it is reasonable to suppose that exports as a percentage of GDP accurately reflects any
problems existing due to the level of productivity in the tradables sector. Such comparisons
show that El Salvador does not compare well with relevant comparator countries. Over time, as
Figure 5.57 shows, El Salvador‘s exports as a percentage of GDP have lagged behind those of its
neighbors.
El Salvador‘s exports as a percentage of GDP is the lowest in Central America and is at least 10
percentage points below that of all Central American countries, except for Guatemala.
Weighting the exports as a percentage of GDP by GDP in each Latin American signatory to the
CAFTA-DR trade agreement yields a good approximation of the shadow price of El Salvador‘s
low productivity:
Figure 5.58: Difference with weighted average of CAFTA
In this case, CAFTA-DR is a relevant set of comparators because all of the signatories face
roughly the same set of trade policies. Over 20 years, El Salvador‘s exports as a percentage of
GDP have been an average of 8.13 percentage points below the CAFTA-DR average export
share. As a crude shadow price, this gap gives us a sense that if El Salvador‘s tradable sector
39
While the absolute numbers would likely be different, the relative differences between El Salvador and its
comparators would probably be roughly the same. Perhaps most importantly, data reflecting exports is widely
available and considered accurate, making the relevant and necessary comparisons straightforward.
8.9 11.2 11.5
9.1 8.2 7.8 8.2
4.9 7.0
8.3 7.3 7.9 6.9
9.9 9.7 7.5 7.0
8.3 6.5 6.6
0.00
5.00
10.00
15.00
20.00
25.00
30.00
35.00
40.00
19
90
19
91
19
92
19
93
19
94
19
95
19
96
19
97
19
98
19
99
20
00
20
01
20
02
20
03
20
04
20
05
20
06
20
07
20
08
20
09
Difference (avg=8.13) SLV CAFTA

137
were more like the CAFTA-DR average, GDP in the country could increase—perhaps by as
much as 8 percent.40
2. Movements in the Constraint Should Produce Significant Movements in the
Objective Function
In this case, movements in trade or the productivity of the tradables sector in El Salvador
corresponding appropriately to movements in growth would support the argument that the low
productivity in the tradables sector is a binding constraint to growth. In general, the notion that
trade leads to growth is well-supported in economic literature. Anne Kreuger asserts that it is
―now widely accepted that growth prospects for developing countries are greatly enhanced
through an outer-oriented trade regime‖ (Krueger 1997). A range of econometric models points
to the link between trade and growth41
. Bems (2008), writing for the IMF, says that ―one of the
most consistent related empirical findings in the macroeconomic literature is that the relative
price of nontradable goods in terms of tradable goods exhibits a strong positive correlation with
income in cross-section as well as time-series data.‖ (Bems 2008) While general econometric
evidence supports the theory, we aim to understand how the Salvadoran case performs.
In El Salvador we find that they are strongly correlated. Since 1960, the beginning of this data
set, the correlation has been an already strong 0.488. Since 1990, or roughly since the signing of
the peace accords, the two have tracked more closely together at 0.795.
40
We note that the CAFTA-DR figures here include El Salvador‘s exports. Excluding El Salvador from the
calculation would, of course, widen the calculated gap between El Salvador and CAFTA-DR. 41
While there has been some skepticism regarding these models, Srinivasan and Bhagwati firmly refute this as a
critique of the methodologies used to prove this point, rather than the point itself, and conclude that the argument is
still strong that there is a link between trade openness and growth (Srinivasan and Bhagwati 1999). Both sides
acknowledge that trade openness alone is insufficient and that proper policies and institutional frameworks need to
be in place. Rodrik, Hausmann, and Pritchett later demonstrate that growth accelerations, defined as increases in
per-capita growth of 2 percentage points or more, ―tend to be correlated with increases in investment and trade‖
(Hausmann, Pritchett and Rodrik 2005).

138
Figure 5.59: Exports as a Percentage of GDP and GDP per capita
While this relationship does not make any definitive statement about causality, it does show that
when El Salvador‘s GDP moves positively and strongly with its exports.
Though the two concepts are almost tautologically related, it is useful to compare movements in
Total Factor Productivity (TFP) growth with economic growth. Ideally we would compare TFP
for only the tradables (or exports), but lacking that data we inspect the TFP for all of El
Salvador‘s production, as shown in Figure 5.59.
Figure 5.60: Total Factor Productivity (Hicks-Moorsteen index) in El Salvador and GDP
per capita growth in 2005 purchasing power parity terms
Source: Author’s Calculation based on (Cabrera Melgar 2005).
Not unexpectedly, GDP growth and TFP growth track together very closely. This graphical
analysis does not determine causality but it does confirm that movements in productivity growth
0.0%
10.0%
20.0%
30.0%
40.0%
50.0%
$-
$500.00
$1,000.00
$1,500.00
$2,000.00
$2,500.00
$3,000.001
96
0
19
63
19
66
19
69
19
72
19
75
19
78
19
81
19
84
19
87
19
90
19
93
19
96
19
99
20
02
20
05
20
08
correlation: 0.488 correlation since 1990: 0.795
GDP per capita Exports (% of GDP)

139
in El Salvador correlate very closely with movements in per capita GDP growth. If exports move
with growth and overall productivity of the economy moves with growth, the implication is that
productivity in exports moves with growth. Taken together, the information provides suggestive
evidence that movements in the constraint, low productivity in the tradables sector, results in
movements in GDP growth in El Salvador.
3. Agents in the Economy Should be Attempting to Overcome or Bypass the
Constraint
One way of examining if agents are overcoming or bypassing this constraint is to look at the
behavior of foreign direct investment. These investors likely have the maximum flexibility in
both deciding whether to invest in El Salvador and what to invest in when they do choose to
invest in El Salvador. Information regarding the decision of whether or not to invest in El
Salvador in the first place weakly suggests that low profitability of tradables as seen in Figure
5.60.
Figure 5.61: FDI Inflows as Percentage of GDP
El Salvador consistently receives less foreign direct investment as a percentage of GDP than its
regional comparators with the exception of Guatemala. To a certain extent, the fact that
investors are choosing neighboring countries which face many of the same price competitiveness
-2
0
2
4
6
8
10
12
Guatemala
El Salvador
Honduras
Costa Rica
Nicaragua
Dominican Republic

140
pressures is weakly suggestive that El Salvador suffers from some internal problems, such as low
productivity of the tradables sector.
Better evidence of the third test of a binding constraint due to low productivity of the tradables
sector is found by examining where foreign direct investment that does occur in El Salvador is
directed. In Figure 5.61 we see that investment flows are directed much more intensively
towards non-tradables in El Salvador, a national trend which runs against the regional trend of
foreign investment going towards tradables.
Figure 5.62: Latin America and El Salvador: Net foreign direct investment inflows by
destination sector, 2005-2010
As the above graph shows, foreign direct investment in El Salvador is directed far more towards
the less-tradable services sectors than the more-tradable manufacturing sectors, which is in stark
contrast with the rest of Latin America, where foreign direct investment is directed towards
manufacturing and services in a far more balanced fashion. While the distinction between
services and manufacturing is not a perfect distinction between tradables and non-tradables, as
has been mentioned before in this chapter, it is still informative in this case due to the magnitude
of the differences. Over the last 5 years, foreign direct investment in El Salvador has been
directed towards the services sectors an average of 91 percent of the time, compared to just 41
percent of the time for Latin America as a whole. In manufacturing sectors, the relationship is
reversed: foreign direct investment has been directed towards manufacturing sectors only 6
percent of the time on average in El Salvador and 33 percent of the time on average in Latin
America as a whole. This clear pattern of behavior on the part of investors in El Salvador to
-100%
-50%
0%
50%
100%
150%
200%
2005 2006 2007 2008 2009 2010
Manufactures - LA Manufactures - ES Services - LA Services -ES

141
avoid the tradables sectors, is fairly strongly suggestive that actors (here investors) are trying to
get around a constraint of low productivity in the tradables sector, again suggesting that this issue
is a binding constraint to growth in El Salvador.
4. Agents Less Intensive in that Constraint Should be More Likely to Survive and
Thrive, and Vice Versa
In order to determine if agents that are less intensive in the constraint do better than their more
intensive peers, we examine which agents ( in this case sectors of the economy) are thriving.
The following graph (Figure 5.62) shows sectors of the economy and their average annual
growth rates since 1990. In this case, the agents which are not thriving are probably sectors
which simply do not exist in the economy—they are ―missing goods‖ or ―missing exports‖—
nonetheless, we perform this analysis on the information available from existing industries.
Industries with annual growth exceeding the national annual GDP growth 3.4 percent could be
said to be thriving. Of those 19 industries, 6 are basic agricultural products which are tradables,
but they do not require a high level of productivity because El Salvador‘s advantage is largely
determined by natural resource endowments. Many of the other sectors are either non-tradables
(transportation and storage, for example) or tradables of basic goods (basic metal and processed
products). One significant exception to this is the growth in the maquila industrial services.
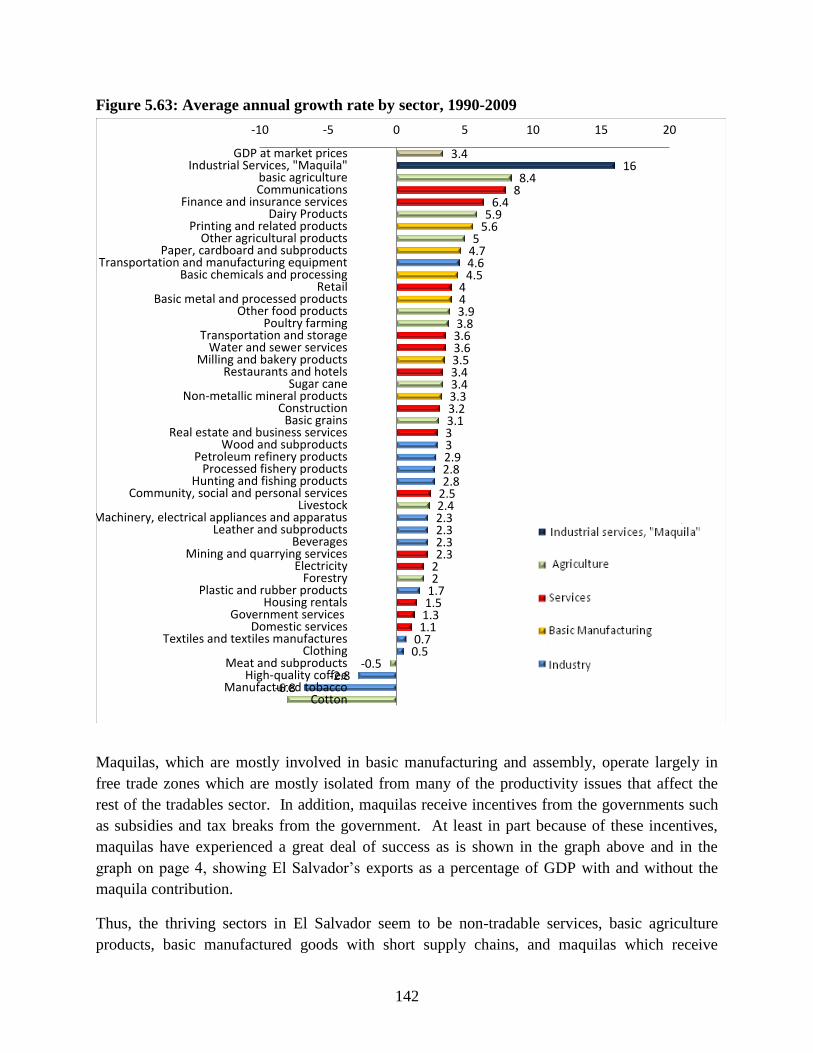
142
Figure 5.63: Average annual growth rate by sector, 1990-2009
Maquilas, which are mostly involved in basic manufacturing and assembly, operate largely in
free trade zones which are mostly isolated from many of the productivity issues that affect the
rest of the tradables sector. In addition, maquilas receive incentives from the governments such
as subsidies and tax breaks from the government. At least in part because of these incentives,
maquilas have experienced a great deal of success as is shown in the graph above and in the
graph on page 4, showing El Salvador‘s exports as a percentage of GDP with and without the
maquila contribution.
Thus, the thriving sectors in El Salvador seem to be non-tradable services, basic agriculture
products, basic manufactured goods with short supply chains, and maquilas which receive
3.4 16
8.4 8
6.4 5.9
5.6 5
4.7 4.6 4.5
4 4 3.9 3.8 3.6 3.6 3.5 3.4 3.4 3.3 3.2 3.1 3 3 2.9 2.8 2.8
2.5 2.4 2.3 2.3 2.3 2.3
2 2
1.7 1.5 1.3 1.1
0.7 0.5
-0.5 -2.8
-6.8
-10 -5 0 5 10 15 20
GDP at market pricesIndustrial Services, "Maquila"
basic agricultureCommunications
Finance and insurance servicesDairy Products
Printing and related productsOther agricultural products
Paper, cardboard and subproductsTransportation and manufacturing equipment
Basic chemicals and processingRetail
Basic metal and processed productsOther food products
Poultry farmingTransportation and storage
Water and sewer servicesMilling and bakery products
Restaurants and hotelsSugar cane
Non-metallic mineral productsConstruction
Basic grainsReal estate and business services
Wood and subproductsPetroleum refinery products
Processed fishery productsHunting and fishing products
Community, social and personal servicesLivestock
Machinery, electrical appliances and apparatusLeather and subproducts
BeveragesMining and quarrying services
ElectricityForestry
Plastic and rubber productsHousing rentals
Government servicesDomestic services
Textiles and textiles manufacturesClothing
Meat and subproductsHigh-quality coffee
Manufactured tobaccoCotton

143
incentives. All of these are either less affected by low productivity in tradables because they are
non-tradables, have short supply chains that do not require high levels of productivity, or, in the
case of maquilas, receive specific incentives and subsidies that allow them to circumvent the
productivity problems of the tradables sector. These thriving sectors are clearly less intensive in
the low productivity of the tradables sector constraint, which supports the idea that this is a
binding constraint to growth in El Salvador.
Conclusion
The tests employed by the growth diagnostics methodology indicate that the low productivity of
the tradables sector is a binding constraint to growth in El Salvador. The shadow price is high,
measured by productivity differences and the level of exports as a percent of GDP versus
comparator countries. This shadow price reflects ―missing exports‖ of 8.13 percent of GDP.
Movements of the constraint, in this case represented by movements in exports as a percent of
GDP and total factor productivity, correlate strongly with movements in GDP per capita. The
fact that FDI flows in El Salvador are significantly concentrated in non-tradable areas, far more
so than average for Latin America, shows that investors are trying to bypass the constraint.
Lastly, the economic sectors that are thriving are either less intensive in the constraint because
they are non-tradable or have shorter supply chains, or they are aided in circumventing the
constraint through free-trade zones, subsidies and tax breaks. Based on this information, we
conclude that low productivity of the tradables sector is a binding constraint to growth in El
Salvador.
Further Study
Because this is a binding constraint to growth, it merits a brief discussion of potential underlying
factors. We have seen evidence that tradables, particularly exports, are lagging in El Salvador.
From macroeconomic theory, the lack of being able to sell goods on the competitive global
market can be generally understood by price factors and productivity factors.
Price factors are those issues which create a distortion between the marginal cost of producing
goods and services and their price on the world market. Generally these factors include issues
related to the capital account, monetary policy, and tariff and trade barriers; together these
factors indicate the degree of effective protection a country‘s tradable firms may enjoy. For El
Salvador, price factors are largely exogenous—that is they are effectively neither changeable nor
part of the feasible choice set of the government of El Salvador, as seen by closer examination.
The capital account increases with the tremendous amount of remittances coming into the
country. These remittances, as well as emigration, lead eventually to higher costs of labor, land,
etc., resulting in an outflow of resources from the tradables into the non-tradables sector. On
monetary policy, the fixed exchange rate regime removes potential devaluation levers which

144
might temporarily make Salvadoran exports relatively more competitive.42
Finally, El Salvador‘s
protection by way of tariffs and trade barriers is also quite low, as El Salvador and virtually all of
its major trade partners are cosignatories to regional trade agreements (CAFTA-DR, NAFTA). In
short, El Salvador‘s tradables sector faces very little favorable price distortion: The Salvadoran
tradables sector is fully exposed to world prices. El Salvador‘s effective level of protection is low
and is effectively not changeable. Moreover, even if they could be changed, artificially reducing
the price of Salvadoran exports so as to compete on world markets would only a second best
(and short-lived) option (Rodrik, 2008). Far better, then, to focus on first-best solutions:
improving competitiveness through non-price factors (productivity).
Improving the productivity of the tradables sector in El Salvador is the first-best and realistically
only solution to achieve the competitiveness in exports needed for El Salvador to enjoy broad-
based economic growth. The main factors contributing to productivity are logistics &
transportation, financial capital, human capital, and physical capital. As an initial diagnostic of
these factors, later in this chapter we see that the transportation system in El Salvador is shown to
be by-and-large in good shape, while more study is required to understand the logistical stance of
El Salvador vis-à-vis competitor nations. Chapter 4 described financial capital as being
sufficient, at least for large firms. For small and medium firms, there is some indication of a
problem although more information is needed. In the section on human capital (Chapter 5.B.b),
we see that while schooling is not likely a constraint for the domestic market, El Salvador‘s
education is clearly not competitive with the rest of the world. Importantly, compared to global
averages in math and science capability this problem begins as early as the fourth grade and
shows no relative improvement by eighth grade. These data, combined with anecdotal data that
English language skills are in high demand but short supply, indicate that El Salvador lacks
training aimed at the labor market, and needs to improve learning (as opposed to merely
enrollment, attendance, or literacy) beginning in the lower grades as preparation for learning the
required skills in post-secondary training. We do not have much information to date on physical
capital productivity, though we point out that those exporters who are able to survive in El
Salvador, namely the maquilas, are more intensive in physical than human capital, perhaps
indicating that physical capital use is (currently) less constraining.
The determination of exactly what is constraining productivity of the tradables sector requires
more study and discussion. As mentioned in the introduction of this section, we are interested in
the missing firms in exports; consequently we want to identify the productivity-related barriers to
entry for export firms. A subsequent diagnostic could and should further explore the above listed
factors contributing to productivity, especially human and physical capital. Further study would
do well to closely examine the non-maquila, non-traditional export firms with a relatively high
PRODY in El Salvador to understand how they have been able to survive, what inhibits them
from realizing their growth potential, and how the country can encourage more such firms.
42
It is worth underscoring, though, that the fixed exchange rate regime also provides inherent stability by removing
inflation fears.

145
Policy formulation would also benefit from understanding why maquilas outside of apparel did
not survive. Finally, a study of successful export-led growth countries which face similar levels
of exposure to world prices as El Salvador could help in understanding how exports and
productivity can be increased even in such austere conditions.
B. Low Social Returns
If potential returns are high but firms do not invest, it may be because social returns are low,
meaning the country lacks key publicly provided complements. These complements—human
capital and infrastructure—are usually publicly provided because they produce positive
externalities, or resolve coordination failures. Geography is also sometimes included in this
branch of the HRV tree.
a. Infrastructure
This report looks at infrastructure with respect to telecommunications, electricity, transportation,
and water.
Telecommunications
El Salvador has a telecommunications infrastructure with the following services: land lines,
mobile phones and broad band internet. Communications with foreign countries are considered
adequate in terms of price and quality. The waiting time for a telephone connection have become
shorter, and currently a land line is installed in less than 72 hours. Mobile phone connections are
issued on the spot.
Table 5.64: Number of Cell Phones per 100 inhabitants
Country/Region 2007 2008
East Asia and the Pacific 42.03 52.87
Euro Zone 116.15 121.87
European Union 115.67 122.20
High Income 101.29 106.34
Latin America and the Carribean 67.47 80.33
Low and Middle Income 41.03 51.74
Low Income 15.10 22.01
Lower-Middle Income 36.31 47.22
OECD 95.53 99.95
World 51.12 60.84
Chile 83.88 88.05
Dominican Republic 56.18 72.45
El Salvador 100.50 113.32
Guatemala 89.10 109.22
Honduras 58.33 84.86
Nicaragua 44.72 54.84
United States 87.21 88.87
Uruguay 90.39 105.21
Costa Rica 33.83 41.75

146
Source: World Bank Database
Table 5.65: Fixed broadband internet subscribers per 100 inhabitants
Country/Region 2007 2008
East Asia and the Pacific 3.68 4.63
Eurozone 21.34 23.96
European Union 20.25 22.94
High Income 21.82 23.61
Latin America and the Carribean 3.54 4.88
Low and Middle Income 2.04 2.71
Low Income 0.02 0.03
Lower-Middle Income 2.02 2.59
OECD 19.91 21.76
World 5.36 6.21
Chile 7.83 8.49
Costa Rica 2.41 2.38
Dominican Republic 1.57 2.27
El Salvador 1.47 2.01
Guatemala 0.43 0.58
Honduras - -
Nicaragua 0.49 0.64
United States 23.28 24.02
Uruguay 7.33 7.33
País / Región 2007 2008
Asia oriental y el Pacífico 42.03 52.87
Zona del Euro 116.15 121.87
Unión Europea 115.67 122.20
Ingreso alto 101.29 106.34
América Latina y el Caribe 67.47 80.33
Ingreso mediano y bajo 41.03 51.74
Países de ingreso bajo 15.10 22.01
Países de ingreso mediano bajo 36.31 47.22
Miembros OCDE 95.53 99.95
Mundo 51.12 60.84
Chile 83.88 88.05
República Dominicana 56.18 72.45
El Salvador 100.50 113.32
Guatemala 89.10 109.22
Honduras 58.33 84.86
Nicaragua 44.72 54.84
Estados Unidos 87.21 88.87
Uruguay 90.39 105.21
Costa Rica 33.83 41.75
Número de celulares por cada 100 habitantes
FUENTE: Base de datos del Banco Mundia l
Source: World Bank Database
Approximately 10 percent of the Salvadoran population has access to internet. The wireless
telecommunication network covers more than 95 percent of Salvadoran territory. Prices for
national, international and internet services are competitive. Telecommunications infrastructure
is not considered a constraint on private investment.
Electricity
Power in the country is produced through hydraulic, geothermal and thermal resources. The
energy generation system, which forms part of the wholesale market,consists of is made up by
the Comisión Ejecutiva Hidroeléctrica del Río Lempa (CEL), which operates four hydroelectric
power stations; LaGeo, operates two geothermal power stations; DukeEnergy International,
NejapaPowerCompany, Cemento de El Salvador, Inversiones Energéticas, Textufil, GECSA,
Energía Borealis, and HILCASA Energy, who are in charge of thermal energy and 3 Sugar Mills
which generate energy using bagasse.
El Salvador‘s available generation capacity in 2000 was 936 MW and in 2010 the generation
capacity was 1,373 MW, of which 52 percent corresponds to thermal capacity, 13 percent to
geothermal and 34 percent to hydraulic capacity (See Figure 5.66).

147
Figure 5.66: Available Capacity by Type of Resources for 2000 and 2010 (Mw)
472 MW 34.4%
183.8 MW 13.4%
716.6 MW 52.2%
CAPACITY AVAILABLE BY TYPE OF RESOURCE, YEAR 2010 (MW)
Hydraulic
Geothermal
Thermal
Source: SIGET
Electricity demand increased by 43.4 percent during 2010, reaching 5,636,884 MW (Figure
5.67).
Figure 5.67: Electricity Demand, 2000-2010
Source: SIGET
Demand for year 2010 peaked on March 16, 2010 approaching available capacity; the difference
between total output and net output also provides some notion of the distribution loss factor (see
Figure 5.68).
-
1,000,000
2,000,000
3,000,000
4,000,000
5,000,000
6,000,000
2000 2001 2002 2003 2004 2005 2006 2007 2008 2009 2010
Dem
and
MW
Years
342 MW 36.5%
115 MW12.3%
479 MW51.2%
CAPACITY AVAILABLE BY TYPE OF RESOURCE, YEAR 2000 (MW)
Hydraulic
Geothermal
Thermal

148
Figure 5.68: Total Output, Net Output and Effective Available Capacity (May 16 2010)
0
200
400
600
800
1000
1200
0 2 4 6 8 10 12 14 16 18 20 22Hour of day
Net Output(MWh)
Total injection(MWh)
Effectiveavailable
capacity
Source: Unidad de Transacciones de Electricidad (UTE)
Transmission
The responsibility of the expansion and maintenance of the energy transmission system in El
Salvador lies with the Empresa Transmisora de El Salvador, S.A. de C.V. (ETESAL). These
responsibilities include the connection lines with Guatemala and Honduras. In December 2009,
the transmission system was comprisedof 37 lines of 115 KV, with a length of 1023.59 Km., 24
power substations and two 230KV lines that interconnect with the transmission system of El
Salvador, Guatemala and Honduras.
It is important to note that the transmission system in the northern zone of the country does not
have the same capacity as the central and southern zones of the country and therefore energy
supply is deficient there.
Distribution
There are five power distribution companies: Grupo AES El Salvador; Del Sur, S.A de C.V.,
EDESAL, B&D Servicios Técnicos and ABRUZZO. The AES El Salvador group is composed
of the following companies: CAESS, AES-CLESA, EEO and DEUSEM.
Total electricity sales for 2010 were 4,466,030 MWH, distributed among 1,485,140 clients. 74
percent of the sales and 78 percent of the users were served by the AES El Salvador group.
Energy Prices
In order to compare rates across countries in the region, this study uses the average rates for the
industrial sector which correspond to the relevant effective rates from the main distributors
responsible for the service to the capital cities, not including taxes. The rates for the industrial
sector are fairly similar in El Salvador, Costa Rica and Panama; Guatemala has the most
expensive rates in the region (see Fig. 5.68).

149
Figure 5.69: Effective Rates For Industry—June 30 2010 (in US dollar cents/KWH)
Costa Rica El Salvador Guatemala Honduras Nicaragua Panamá
ICE CAESS EEGSA ENEE DN y DS ELEKTRA
INDUSTRIAL
15,000 KWh, 41 KW 16.40 16.17 27.41 20.86 20.79 21.24
50,000 KWh, 137 KW 16.41 16.66 21.48 20.85 20.80 16.98
100,000 KWh, 274 KW 16.41 16.65 21.39 14.82 20.85 16.98
930,000 KWh, 2500 KW 12.85 16.62 21.27 14.43 18.60 15.67
1,488,000 KWh, 4000 KW 12.85 16.62 21.27 14.43 18.60 15.67 Source: ECLAC
Electricity rates for the industrial sector have trended upwards for the period between 2000 and
2010. The below graph shows this trend using effective rates for December of each year.
Figure 5.70: Average Energy Prices For Industrial Sector, 2000-2010 (ctvs of $/kwh)
5.00
15.00
25.00
35.00
45.00
55.00
65.00
75.00
2000
2001
2002
2003
2004
2005
2006
2007
2008
2009
2010
Rate
Year
1488 000 kWh,4000kW
930 000 kWh,2500kW
100 000 kWh, 274 kW
50 000 kWh, 137 kW
15 000 kWh, 41 kW
Source: Instituto Costarricense de Electricidad
The losses at the transmission and distribution levels are important rough measurements of
efficiency of the energy sector. During 2009, El Salvador lost 11.5 percent of its energy supply
due to transmission and distribution losses. This was the second lowest rate of transmission and
distribution loss in the Central American region. Costa Rica had the lowest rate of loss at 10.8
percent (see Fig. 5.70).
It is worth noting that El Salvador‘s transmission and distribution losses were 11 percent in 2000,
and that rate was maintained throughout the decade, dropping only slightly to 11.5 percent in
2009. It is also worth noting that the region as a hole has higher rates of transmission and
distribution loss than other regions.

150
Figure 5.71: Electricirty Losses in the Central American Region
0.00 5.00 10.00 15.00 20.00 25.00 30.00
Costa Rica
El Salvador
Guatemala
Honduras
Nicaragua
Panama
Losses (%)
Coun
trie
s
Source: ECLAC
Quality of Service
Measuring the quality of service of the distribution system can be done using a series of
indicators that measure the basic quality of the service, quality of the supplied product and the
quality of the commercial service. Measurementes are taken for each category and for each one
of the energy distribution companies, which are then compiled into a weighted average based on
the number of clients served in the country for the whole country.
The following indicators measure the quality of the supply or technical service provided. This
mainly relates to service disruptions, or, in other words, power outages:
SAIDI: This measures the average duration of a service disruption in terms of hours per
user of the system per year.
SAIFI: This measures the average number of service disruptions in terms of the number
of disruptions per user of the system per year.
FMIK: This measures the mean service disruption frequency in terms of kilovolts
amperes (kVA).
TTIK: This measures the total service disruption time in terms of kilovolts amperes
(kVA).
According to the General Superintendent of Electricity and Telecommunications (SIGET based
on its initials in Spanish), which regulates the electricity system in El Salvador, these service
quality indicators show that the electricity distribution system does not meet the minimum
requirements they set out. The indicators should be below the limits specified in the below
graph, but all of the weighted averages exceed their indicated limits.

151
Figure 5.72: Annual SAIDI, SAIFI, FMIK And TTIK Indicators
Urban/Rural Indicator 2005 2006 2007 2008 2009 2010
URBAN Average Measure SAIDI 19.87 20.96 20.28 17.44 17.95 15.80
Limit Indicator SAIDI 18.00 18.00 18.00 14.00 14.00 14.00
Average Measure SAIFI 14.84 13.17 12.16 10.31 1O.17 9.47
Limit Indicator SAIFI 9.00 9.00 9.00 7.00 7.00 7.00
Average Measure FMIK 13.84 12.39 11.20 9.28 9.15 8.02
Limit Indicator FMIK 8.00 8.00 8.00 5.00 5.00 5.00
Average Measure TTIK 18.42 18.07 17.77 14.91 14.99 12.05
Limit Indicator TTIK 14.00 14.00 14.00 10.00 10.00 10.00
Source: SIGET
While the previous indicators measured the quality of the supply from a service perspective,
other indicators measure quality of the product more directly. These indicators measure the
levels of tension in the system and disturbances of the voltage wave. Another indicator is
FEBnoper, which measures the amount of electricity delivered at frequencies outside of the
levels established by SIGET. This indicator, expressed as a percentage of total energy delivered,
provides a measurement of the energy quality energy in terms of voltage. The limit established
by SIGET between 2005 and 2007 was five percent, for 2008-2009, three percent and for 2010,
five percent. Until 2008, the standard was not met, but during 2009 and 2010 the electricity
quality met requirements, at least as established by SIGET and measured by FEBnoper (see
Table 5.73).
Table 5.73: Indicator FEB noper
Zone Concept 2005 2006 2007 2008 2009 2010
Global* Med. Average 8.00% 6.49% 5.61% 3.29% 2.49% 2.89%
*Includes Urban and Rural
Source: SIGET.

152
Figure 5.74: Total output, Available Effective Capacity and Transmission Losses
Based on the current installed capacity and the current demand for electricity in El Salvador, it
does not appear that access to electric energy infrastructure is a major constraint on investment.
However, a group of sector representatives43
did express that if no investment is made in the
energy generation sector in four years, then demand will exceed installed available capacity in
the next four years This is even the case if we assume that the El Chaparral dam will be
operating by that time, as is expected. In the event that installed capacity does not keep pace
with demand, there could be interruptions of the energy supply. This has not occurred for
roughly 20 years, when energy blackouts used to last up to 8 hours per day, affecting
productivity throughout the economy.
In addition to the circumstances described above, it is important to keep in mind that 50 percent
of the generation capacity in El Salvador comes from carbon-based energy production, which
have coal and oil as key inputs. Given the price fluctuations that these energy sources have
experienced over the past several years, and the impact that has on the price of energy, it will
probably be important to investigate other sources of energy generation in the future. Looking at
the spot prices for energy in El Salvador shows that these prices have risen significantly over the
past eight years, and they are already high relative to other countries in the region, thus further
accentuating El Salvador‘s energy vulnerability due to its use of carbon-based energy
production.
43
Meeting held with the representatives of the energy sector at the Central Reserve Bank on April 15th, 2011
0
200
400
600
800
1000
1200
1 2 3 4 5 6 7 8 9 10 11 12 13 14 15 16 17 18 19 20 21 22 23 24
Total Output (MWh) Transmission Losses (MWh)
Available Effective Capacity (MW)

153
Figure 5.75: Wholesale Market Spot Prices (USD/MWh) in Central America, 1999-2007
Source: (USAID 2010)
The energy sector‘s representatives also expressed some reservations about the SIEPAC project,
an effort throughout the region to integrate energy generation and distribution, saying that it may
be limited in its ability to serve as an energy supply alternative, since the SIEPAC all of the
member countries are seen as having limited capacity to offer energy to the grid.
Energy supply could become a binding constraint for the development of investments in the
medium term if the generation capacity is not addressed in a timely manner and if the possibility
of hydrologic stress is not taken into account, which could affect the adequacy of the energy
supply given how critical hydroelectric generation is in the energy production process of El
Salvador.
Water
Water, besides being indispensable for life, performs two crucial functions for the development
of the country. It constitutes a strategic input for the residential, commercial, industrial,
hydroelectric, tourism, and agricultural sectors, among others; and more specifically, access to
potable water and sewerage as it contributes to improve the productivity of companies and
people and in turn, improves competitiveness. It represents a critical renewable resource
(FUSADES 2007).

154
According to FAO (2007), between 1961 and 2003, irrigated agricultural lands in El Salvador
increased from 15,000 to 45,000 hectares (World Bank, 2006). The potable water supply
directed towards important sectors of the country and economy, such as industry, commerce,
households, central and autonomous government entities as well as municipalities increased from
184.2 million cubic meters in 1990, to 343.6 million cubic meters in 2005. The annual average
growth rate was 4 percent for the period.
Water is also important for energy generation in El Salvador. Between 1985 and 2006,
hydroelectric energy generation comprised 23 percent of the total electricity generation in El
Salvador. However, the annual rate of growth for energy generation was greater for fossil fuels
than for renewable sources including hydroelectric generation.
Adequate access to potable water and sewerage services has strong links to the improvement of
the productivity labor and businesses as well. Adequate access to water reduces costs and
expands market opportunities for companies, therefore increasing productivity and
entrepreneurial competitiveness (Komives 2005).
Access to Water
Access to potable water and adequate sewerage also contributes to poverty reduction through
direct effects on health and education improvements. The lack of good quality water is one of
the major causes of disease in developing countries and generates costs related to death,
malnutrition, rickets and the low productivity caused by these diseases. Lack of or inadequate
access to these services also affects educational quality and access, as students may have to
dedicate time to the collection of water or cause them to miss classes due to illness, preventing
students from attending school, especially girls..
El Salvador, due to its geographic location and climate conditions, possesses a natural supply of
water that is adequate to satisfy demand from different sectors. According to the National
Territorial Studies Services (SNET in Spanish) the average annual rainfall is approximately 1,784
mm of rain. This represents 56,052 million m3 of water that falls on Salvadoran territory each
year. Of this annual rainfall, nearly 59 percent goes back into the atmosphere due to water
evaporation and water transpiration. The remaining 41 percent becomes mostly surface water,
with a smaller percentage of it becoming ground water.
Nonetheless, the origin of the water supply is somewhat concentrated. the Lempa River basin,
the largest collection and distribution point of natural water in El Salvador. This is where the
main hydroelectric plants are located: (Guajoyo, Cerrón Grande, 5 de Noviembre and 15 de
Septiembre, with a joint installed capacity for 2006 of 460.3 MW, 37 percent of the total) and
projected plants. There are also main irrigation points coming out of the Lempa River basin
(Atiocoyo, Zapotitán and Lempa-Acahuapa), as well as the three sources of water for the
Metropolitan area of San Salvador.

155
Another problem that impacts the availability of water resources in El Salvador is the lack of
rainwater absorptive capacity in the soil. This is critical because aside from maintaining
necessary humidity in the ground, the soil feeds water into the aquifer during the rainy season
and the rivers and lakes during the dry season through the flow of underground water. The low
absorptive capacity of the soil causes rain water to spread along the surface (runoff waters),
causing a series of problems during the rainy season including an excess of water, floods, soil
erosion processes, and increasing sedimentation of the dams, among others. During the dry
season, the recharge of rivers and lakes may be insufficient as a result of soil problems, affecting
the physical availability of surface water bodies.
The water availability problem is not due to scarcity, but to the interruption of the water cycle
and deterioration of the quality of the resource due mainly to inadequate institutionalization and
management.
Quality of the Water
One factor that affects water quality as well as economic competitiveness and citizen well-being
is river contamination. The main sources of contamination of the surface and underground water
bodies of the country is waste from the residential, industrial, agro-industrial, and agricultural
sectors; particularly the release of sewage waters into rivers adjacent to the main urban centers of
the country, without prior treatment. USAID, PAHO and CARE in 1993; WHO in 2000, ECLAC
and PNUMA in 2002 and ANDA in 2005 all pointed out severe deficiencies regarding the
treatment of sewage waters and that approximately only 2 percent - 3 percent of the generated
sewage water received some type of treatment before disposal into rivers (Dimas 2006).
According to SNET, only 20 percent of the surface water can be used to make water potable
using conventional methods. Despite the adequate supply of water and a dense network of
surface water bodies, the results of the SNET diagnosis shows the delicate state of the water
supply in El Salvador. Of the 114 sites that were assessed, 24 percent of the water is
recommendable for irrigation. The country does not have water than can be classified as
―excellent‖. 65 percent of the sites present ―regular‖ quality water (there is a limitation for the
development of aquatic life); 17 percent of surface water is ―good‖ and 33 percent cannot be
used to develop any type of aquatic life. Only 14 percent of the rivers of the country can develop
recreational activities without risk to human health.
Table 5.76: Water Availability
Availability of water per inhabitant 1,732 mt3 per
inhabitant
Water not good for irrigation, Lempa River 88%
Water not good for turning potable, through
conventional methods from Lempa River
90%
Availability of water considered excellent for 0%

156
human consumption
Availability of water considered good for human
consumption
2%
Availability of water considered regular 65%
Availability of water considered poor 33%
The main sources of contamination of the surface and underground water bodies of the country
are waste from residential, industrial and agricultural areas, particularly the release of sewage
waters into the adjacent rivers of the main urban centers of the country, as they do not have any
prior treatment.
Use and Administration of Water
Although the nature and severity of the problems differ from country to country, the main cause
for the ―scarcity‖ of water (whether physical or decrease of quality) is due to deficient use and
management of the resource, and not to a physical scarcity (Saleth and Dinar 2004).
The institutional structure dedicated to water management in El Salvador is fragmented, creating
perverse incentives which impede the efficient use of the resource, as well as its conservation
and protection. One of the main reasons for institutional failures associated with use,
development and management of water, is that the current institutional structure has not been
able to provide universal access to potable water and sewage services to the population,
particularly in the rural areas. One important reason for this is the weak financial management of
most of the potable water services provided, due in part to weak tariff rate policies and direct
subsidies. Furthermore, the World Bank pointed out in 2004 that only 22 percent of the total
amount of the water subsidy reached the poorest households of the country, showing that the
subsidy may be misallocated, if its intention is to reduce costs for the poorest households.
This financial weakness becomes evident when looking at an analysis of the annual invoicing
revenues versus the annual expenditures of ANDA, the National Administrator of Aquaducts and
Sewers. Between 1990 and 2005, invoicing revenues were unable to exceed the expenditures.
Covering this shortfall has, on average, represented 69 percent of the annual expenditures of the
institution during the referred period. In view of this situation, ANDA may need to transfer from
the public sector in order to meet its obligations.
Another institutional fault may be reflected in the pricing structure of ANDA. Fees for potable
water per cubic meter are fixed for certain quantities of consumption; namely, between 1 and 10
cubic meters and 11 to 20 cubic meters per month. Someone consuming between 1 and 10 cubic
meters per month pays a flat fee of $2.29, so a residential ANDA customer who consumes 1
cubic meter of water per month pays $2.29 for that cubic meter, while someone who consumes
10 cubic meters of water per month will pay $0.23 per cubic meter, not including the sewage
system. For users consuming between 11 and 20 cubic meters of water per month, prices

157
decrease further from $0.21 per cubic meter to $0.11 per cubic meter. Prices per cubic meter do
begin to increase after 20 cubic meters of consumption, but the pricing structure for water
consumption under 20 cubic meters per month may create a perverse incentive where ―those who
consume less pay more and those who consume more, pay less‖. Since nearly 60 percent of
ANDA users consume 20 cubic meters per month or less, this incentive structure may be
seriously skewed.
The institutional environment and management of water resources are worse in El Salvador
because the institution does not have a modern law to regulate it. Similarly, there is no law that
regulates the potable water and sewerage sub-sector with clear rules of the game to protect and
make use of the resource, as well as the rights and obligations of all of the parties involved. A
transparent and autonomous regulating entity would help to resolve this problem. This would
allow the enforcement of the law, promote the culture of paying for water usage when sectors
and households are capable of paying, help better focus the water subsidy, aid in the
implementation of a national program to decontaminate water through economic incentives and
help establish public-private partnerships, among benefits.
Despite the strategic importance that water resources have for economic growth as a strategic
input for entrepreneurial competitiveness and for human development, during the past thirty
years El Salvador has faced a severe crisis associated with the availability of this resource. The
crisis has several dimensions: physical scarcity of the resource due to the decreasing capacity to
absorb water in the territory in part due to changes in the hydrological cycle (quantitative
dimension); decrease in the quality of water due to weak or nonexistent urban and rural
processes to decontaminate surface and underground water (qualitative dimension) and
inefficient use, development and administration of the resource (institutional dimension).
Although it is true that currently water availability and access does not present a constraint for
the development of investment activities, the situation in the future could devolve if the urgent
attention is not paid to the treatment, care and quality of the water. If El Salvador‘s water
resources come under stress, access to water and the population‘s health will become very
complicated. The hydroelectric dams use rain water and if this is reduced, there will be
difficulties in getting adequate energy supply.

158
Transportation Infrastructure
El Salvador‘s transportation infrastructure includes a road network, the Port of Acajutla, which is
fully operational, and the Port of La Unión, which was built two years ago and it is not yet in
operation, the El Salvador International Airport (AIES), and the Ilopango Airport. The Ilopango
Airport hosts national civil and military aviation operations, and an inoperative and deteriorated
railroad system.
Institutionally, the Ministry of Public Works, Transport, Housing and Urban Development
(MOPTVDU in Spanish) is responsible for policies and planning for the sector, as well as for
construction of the national road infrastructure. The Road Maintenance Fund maintains the
national road network, and the Comisión Ejecutiva Portuaria Autónoma (CEPA) is responsible
for development of port infrastructure not subject to special regimes, which is the framework for
the Ports of Acajutla and La Unión, and AIES. CEPA administers the national railroad
infrastructure by State mandate and financial backing, but is not state-owned. CEPA is an
autonomous institution affiliated with MOPTVDU.
The national road network has 10,886 km of roads, of which 26 percent are paved. The density
in square kilometers is 0.52; by international standards, this is an acceptable level. In Central
America, only Costa Rica has a density higher than 0.62. The road network is in good condition,
resulting from good maintenance; however, there are stretches of roads with deficient design,
probably due to nearby urban growth, which generates added transport costs and hampers
competitiveness.
Figure 5.77: Map of secondary dirt roads and their service areas (2 km on each side)

159
Figure 5.78: Map of paved roads and their service area (2 km on each side)
The density of the road network indicates that the level of connectivity is adequate, particularly
considering the size of the territory - 21,000 km2 – with a maximum length of 315 km and
maximum width of 90 km. Distances and traveling times represent a comparative advantage for
production.
Foreign trade follows the following routes: towards Central America, by land; by sea, trade uses
the ports located both on the Pacific and Atlantic Oceans. On the Pacific side, the ports of
Acajutla are used for El Salvador and Port Quetzal for Guatemala; the Port of La Unión is to
enter operations in the near term. The other route is through the Atlantic using Port Barrios in
Guatemala, and to a lesser degree Port Cortés in Honduras. By air, trade uses the El Salvador
International Airport (AIES). The railroad is not in use.
Of the two ports that the country has for international maritime trade, only the Port of Acajutla
is operating. Acajutla is a multi-purpose maritime terminal, specialized in handling bulk
products. It is built on open waters, based on jetties, which decreases efficiency of the port‘s
operations and increases maintenance costs. The port has increased the total amount of cargo it
moves from 2.5 million metric tons in 2000 to 3.2 million metric tons in 2005, and 3.7 million
metric tons in 2010. The volume of cargo containers has stayed the same at 1.1 million
containers per year. During the past decade, the port has improved operating efficiency
significantly, going from 69 hours average per vessel in 2000 to an average 30 hours/vessel/year
during 2008 to 2010 (CEPA). A new report by the IFC indicates that the Acajutla port has a
lower cost of container services per container, and comparable total charges per container and
per TEU, as seen below.
Figure 5.79: Comparison of costs at ports
Indicator / Port Acajutla Quetzal Cortes
Container Services Per Box $145.71 $172.01 $146.80
Total Charges per Box $182.20 $196.83 $180.48
Total Charges per TEU $109.32 $118.10 $108.29

160
It is important to highlight how import and export operations are carried out. According to
shipping agents, shipping companies and exporters in El Salvador, the economic agent in charge
of the transaction hires a shipping company, which in turn determines the cost of transportation
services from the point of production to the point of final destination. The shipping company
includes the following in these fees: payment of land transportation from the port of shipment,
tariffs for use of port facilities, ocean transportation, tariffs for the use of port facilities during
unloading, and land transportation to final destination.
Consequently, the shipping company decides the port of shipping or loading and the port of
unloading. The payment is independent from the ports that are to be used. In other words, the
shipping companies charge a similar amount if the final destination port is Acajutla or Quetzal in
the case of the Pacific, and it works similarly for ports operating on the Atlantic side.
The costs of transportation from and to the Port of Acajutla towards other destinations have
historically been considered high when compared to ocean transportation costs for similar
distances for other regions. This is attributed to the fact that the country itself does not produce a
sufficient volume of cargo to make the unitary costs competitive. Under this framework, the
records at the Port of Acajutla establish that the costs /TEU imported from Rotterdam, Miami,
Shanghai, and Los Angeles, on average are USD 4,150, 3,538, 2,905, and 3,476 respectively.
The TEU exported to those destinations has an average cost of USD 3,462, 3,245, 2,270, and
2,719, respectively.
The Port of Acajutla is a natural competitor with Port Quetzal, located in the Republic of
Guatemala on the Pacific Ocean some 50km away. In 2010, Port Quetzal handled some 6.7
million MT, 78 percent higher for the same year for Port of Acajutla. This explains in part why
the number of vessels that arrived at Port Quetzal during that year (1,319) exceeded by 131
percent the number of vessels that used Acajutla during the same year.
The basic construction for the Port of La Uniónwas finalized in April 2008. It is a multi-purpose
ocean terminal specializing in container traffic. The terminal has not yet entered into operation,
and will require additional investment in infrastructure and port equipment to do so. According
to the loan agreement signed with the Japanese government for its construction, operations of the
port were to be granted as a concession to a private entity specialized in managing and handling
ports. This entity must invest in equipment, warehousing facilities, etc. The Port is a third-
generation terminal which has 3 docking stations, 240, 220 and 360m in length, 9.5, 14 and 15m
in depth, respectively, and able to handle specialized vessels of up to 4,800 TEU.

161
Table 5.80: Distances from San Salvador to Ports
The distances from San Salvador, the main center of origin and destination for ocean trade, to
ports on the Pacific are not significant enough to make an impact on the freight price. A similar
situation is true for ports located on the Atlantic. The shipping companies establish single tariffs
for ports on the Pacific, and other tariffs for any port on the Atlantic.
Regarding air transportation infrastructure and the competitiveness of international trade by air,
the main problem of AIES is saturation of the cargo terminal‘s capacity. Since it began
operations in 1980, it has established a constructed area of approximately 11,000 square meters,
with limited facilities to handle approximately 30,000 metric tons per year of import and export
merchandise. The terminal has space to park three cargo planes. With development of AIES
over time, the cargo terminal currently handles some 20 metric tons per year, amounts that have
decreased since 2005. Approximately 30 metric tons per year were handled between 2000 and
2004. The construction of a new cargo terminal for the El Salvador International Airport requires
that the construction, administration and operations be handled by a private, world-class operator.
However, this requires it to be a project with plans for turning it into a regional consolidation and
distribution center for air cargo, and requires installation and operation of an efficient single
window for customer services.
Table 5.81: Landing Fees
EL SALVADOR GUATEMALA HONDURAS NICARAGUA COSTA RICA PANAMA BELIZE
EQUIVALENT LANDING
FEES/MT 4.00$ 4.96$ 4.89$ 6.44$ 4.93$ 5.05$ 4.30$
SERVICES
2010 Data in USD
Average payment at regional level : USD 4.94/MT
Of the main airports located in the Central American region, AIES has the lowest landing fees.
On the other hand, Ilopango Airport is not considered a feasible facility for developing an
international cargo terminal, due to the fact that the runway can only accommodate aircraft no
heavier than 12,500 lbs (5,675 kg). The railroad is not used for cargo operations.
Ocean Country Port Km
Puerto Barrios 623
Santo Tomás 623
HONDURAS Puerto Cortés 417
GUATEMALA Quetzal 269
Acajutla 84
La Unión 200
ATLANTICGUATEMALA
EL SALVADORPACIFIC
Distances from San Salvador to ports that use El Salvador
for their ocean trade
162
El Salvador‘s current infrastructure for trade is adequate, and does not constrain moving of the
current volumes of cargo. It is important to highlight that the Port of La Unión needs to begin
operations and that the El Salvador International Airport needs to have an adequate cargo area.
In Table 5.70, El Salvador holds the seventh position within the IPIAI ranking of 12 Latin
American countries that were compared for this purpose. This position is attributed to results
that do not compare well in the indices: legal framework, government attitude towards private
participation, political risk, access to information, private investment record in infrastructure, and
macroeconomic environment. The country holds second place in two of the indicators:
regulatory efficiency and financial Markets, just one position below Chile, which occupies first
place in Latin America.
The position related to financial markets is attributed to the low interest rate on loans (7.5
percent) – the third lowest in the region, as well as the new long-term credit conditions and the
growth of pension funds, which in 2007 were 17 percent of GDP, a figure higher than for any
other country of the region. On the legal framework index, El Salvador is also placed in third
position, below Chile and Paraguay; and fifth for efficiency of the judicial system for conflict
resolution. Another one of the strengths of the country is its low political risk.
The indicators selected and compared in 2007 by WEF in 12 Latin American countries, allow for
interpretation of the environment for private investment in Latin America, and it confirms that in
general, the countries have experienced important advances. Chile has experienced great
advances. In the case of El Salvador, there are factors not measured by the IPIAI which deter
investment, such as the need to increase the level of technical and engineering education of
Salvadorans, and the need for more effective prevention and control of factors that promote
organized crime in general. Salvadoran infrastructure, especially for air transport, is among the
best in Latin America. El Salvador needs to work on transparency and adopt strategies that will
allow the infrastructure projects to generate adequate social benefits.

163
Table 5.82: Index of Investment Opportunities in Infrastructure
(Indicators that guide choosing policies that will improve the attraction of private
investment in infrastructure, and prioritize sectors and measures)
Indexes
Costa R
ica
Brazil
Chile
El S
alvad
or
Guatem
ala
Honduras
Nicarag
ua
Pan
amá
Peru
Dom
Rep
Uru
guay
Total quality index for
infrastructure
NA 4.4 1.4 2.5 4.2 NA NA NA 5.5 3.8 5.5
Specific factors for investing
in infrastructure
4.3 5.3 3.6 3.5 4.3 2.7 4.3
Macroeconomic conditions 4.0 5.6 5.0 4.0 4.7 3.5 4.7
Legal framework 2.9 4.5 3.8 3.5 3.3 3.1 3.3
Regulatory efficiency 3.6 5.0 4.0 4.0 3.7 3.6 3.6
Public ethics 2.6 4.6 3.9 3.1 3.1 2.4 4.3
Effectiveness of dispute
resolution procedures
2.6 3.9 3.5 3.5 3.2 3.2 5.0
Political risk 5.4 6.8 5.3 4.0 4.8 5.0 5.3
Financial market instruments 3.8 4.9 3.8 2.4 3.6 1.5 2.3
Access to information 5.4 5.6 4.1 3.9 4.0 4.3 4.0
Private investment record for
infrastructure
4.6
0
5.3
0
3.6
0
4.40 4.8
0
2.0
0
3.0
0
Ability to Pay 4.5 5.3 2.4 3 2.9 3.1 4.8
Government attitude towards
private investment
4.5 5.5 4.6 4.0 5.8 4.2 4.8
Roads 5.1 3.2 3.3 3.5 4.7 3.0 4.1
Ports 3.8 0.1 1.1 2.3 2.9 2.2 1.1
Air transportation 2.9 1.9 1.4 4.0 4.4 3.6 3.9
Electricity 2.8 2.9 4.3 4.1 4.2 4.4 3.7
Source: Prepared at the Technical Secretariat of El Salvador from data from WEF 2007
NA : Not available

164
b. Human Capital
In addition to reasons of lack of required complimentary infrastructure, firms may find returns to
investment low because of a lack of human resources with the required skill set, either because
they are too expensive (the result of low supply coupled with high demand resulting in a high
price or wage) or they are simply not available. In exploring the outlook for human capital in El
Salvador, we examine separately the issues of education, (the formation and demand for human
capital) and health (as a potential obstacle for the use and accumulation of human capital).
Education
As illustrated in the following section, El Salvador‘s current human capital situation can be
characterized as an equilibrium of relatively low supply and low demand for human capital,
resulting in the observed relatively low quantity (stock) and price (wage) of education in the
country. At the same time, because the Salvadoran and US labor markets seem to be relatively
highly integrated, allowing human capital to move to its most productive use, Salvadorans with
higher human capital often move to the US (itself evidence of both low domestic demand for
human capital as well as potential personal safety concerns). These symptoms of low supply and
low domestic demand curves coupled with the higher rate of migration among the educated
compared to the less educated, may constitute something of a low equilibrium trap in the
domestic accumulation of human capital. So long as domestic demand for human capital is low,
it cannot be considered a binding constraint in the current economic landscape. Because the
Salvadoran and US labor markets are sufficiently well-linked that effectively all migrants who
arrive in the US are able to find work of some form (though not necessarily in fully using their El
Salvador-credentialed training), with an average wage higher than what they were earning at
home44
and the higher returns in that market, attempts to increase human capital supply without
increasing domestic demand are unlikely to be particularly successful in the face of the higher
demand for Salvadoran labor from the US labor market.
Education Supply—Quantity
The supply of education to meet market demand can be examined in both the country‘s quantity
and quality of education.
In El Salvador the quantity of education supply is middling to low compared to other countries in
the region. Figure 5.82 below shows that the 7.7 years of average education in El Salvador falls
between the higher income, better educated countries of Chile, Panama, and Costa Rica and the
lower income, less-well educated countries of Honduras, Nicaragua, and Guatemala—though it
is clearly closer to the latter. And while El Salvador does not have the impressive level of
education for income level that Peru enjoys, it does fall just above the regional trendline,
indicating that its education level is typical for a Latin American country of its income.
44
See Clemens, Montenegro, and Pritchett (2008)

165
Figure 5.83: Education Stock by GDP per capita, 2010
Source: UNESCO, WDI
More alarming is both the high number of people that have never attended school and the
relatively low number with post-secondary education. As UNESCO 2007/2008 data in Table 1
show, one quarter of Salvadorans over age 24 have never attended school. This is the second-
highest rate of being unschooled among comparator countries, and woefully worse than the 4
leaders by nearly 15 percentage points. At the other end of the education spectrum, only 6
percent of El Salvador‘s population has had any post-secondary schooling, placing them just
above Guatemala and Honduras and nearly 10 percentage points behind Chile.
Table 5.84: Highest Level of Schooling Attained
Highest Level of
Schooling
No
schooling
(%)
Primary
(%)
Upper
secondary
(%)
Tertiary
(%)
El Salvador 2007 24.9 15.0 15.4 6.2
Chile 2007 4.1 25.1 35.3 15.0
Costa Rica 2008 5.1 30.1 15.7 18.6
Dominican Republic
2007 9.0 12.7 12.2 18.7
Guatemala 2006 38.9 15.0 7.2 3.4
Honduras 2007 21.1 25.6 8.7 4.2
Peru 2008 9.3 19.4 28.6 18.2 Source: UNESCO
Moreover, El Salvador‘s education system loses its students at a fairly high rate from year to
year. Looking at 2008 data from the Ministry of Education, for every 100 students who enrolled
in first grade, only 88 reached third grade, 76 reached second grade and 61 reached ninth grade.
However, El Salvador has had considerable success over the last 3 years (2006-2008) in
CHPACR
PE
ES
HONI
GU
0
2
4
6
8
10
12
0 2,000 4,000 6,000 8,000 10,000 12,000 14,000 16,000
No
. o
f ye
ars
of
stu
dy
2008 GDP per capita, PPP USD (Human Development Report 2010)

166
increasing retention rates, particularly for ninth grade where the retention rate has increased
nearly 10 percentage points.
Figure 5.85: Retention Rates for Basic Education (2000-2008)
Source: El Salvador Ministry of Education. Statistics calculated using inter-annual enrollment rates from census data from
2000-2008.
El Salvador‘s recent efforts in improving education seem to be paying off, at least as far as
increasing supply of educated workers. As seen in Figure 3, the UN now predicts that the
average Salvadoran child can expect just over 12 years of education in their school career—
higher than Costa Rica and the Dominican Republic (though still notably lower than Peru, Chile,
and Panama). Though these are only predictions, there are encouraging.
Figure 5.86: Comparative School Life Expectancy
Source: http://unstats.un.org/unsd/demographic/products/socind/education.htm
Similarly, El Salvador has made advances in universal primary education, improving primary
enrollment (first to sixth grades) from 76 percent in 1991 to 95 percent in 2008. For basic
79.0 77.8 81.6 81.2
78.4 81.2
84.0 87.4 88.2
66.1 64.9 71.1 71.1
65.2 67.1 68.8
75.4 76.4
52.1 51.6 58.5 59.1
51.6 50.9 52.1 56.5 61.4
0.0
10.0
20.0
30.0
40.0
50.0
60.0
70.0
80.0
90.0
100.0
2000 2001 2002 2003 2004 2005 2006 2007 2008
Pe
rce
nt
Re
tain
ed
fro
m F
irst
Gra
de
Third Grade Sixth Grade Ninth Grade
0 5 10 15 20
Chile (2008)
Costa Rica (2005)
Dominican Republic…
El Salvador (2008)
Guatemala (2007)
Nicaragua (2003)
Panama (2008)
Peru (2006)
School life expectancy (in years) Primary to tertiary

167
education (first to ninth grades), enrollment has increased from 84 percent in 2000 to 93 percent
in 2008, with a gender equity index of 1.01. Yet once enrolled, student attendance is somewhat
low. School attendance for those age 4 to 12 years is 83.4 percent, while the rate drops to 71.7
percent for those age 13 to 18 (El Salvador Ministry of Education). In spite of recent and
projected progress in attainment and enrollment, attendance is still lagging, suggesting possible
problems with education quality, other disincentives or ―pull‖ factors.
Education Supply—Quality
We have seen that the quantity of education supply is near the expected levels given Salvadoran
income, but medium to low compared to the region as a whole. The quality of education is also a
critical consideration in the labor supply.
Using illiteracy as a composite indicator of basic quantity and quality of education, we see that
El Salvador‘s illiteracy rates, through high at 15 percent, are at the level that would be expected
given its income level (see Figure 5.86 below, which shows the trend line of expected illiteracy
rates and income; El Salvador is right on the fitted trend line).
Figure 5.87: 2010 Illiteracy by 2009 GPD Per Capita (USD)
Source: CEPALSTAT and WDI
Despite this performance, it is important to note that El Salvador has made impressive progress
in reducing illiteracy over the last 20 years. Most illiteracy is currently confined to older
populations whose access to education suffered during the civil war (1980-1992). According to
the 2007 census, among 15 to 24 year olds, illiteracy fell from 24 percent in 1992—the last year
of the Civil War—to just 6 percent in 2007. Currently, one in four of those older than 34 years is
illiterate, 43 percent of the population older than 60 years is illiterate, and half of those age 70 or
older are illiterate. At the same time, among 10 to 18 year olds, only three of every 100 is
illiiterate. It is also worth noting that there are significant differences in literacy rates by locality
CH CR EC PA PE
RD
El Salvador
HO
GU
NI
-5
0
5
10
15
20
25
30
35
0 2,000 4,000 6,000 8,000 10,000 12,000
20
10
Illi
tera
cy R
ate
s (C
EPA
LSTA
T)
2009 GDP/Capita, USD (WDI)

168
and gender, though the former seems to be slightly more salient, as shown in Table 5.87.
Interestingly, gender trends in illiteracy are reversed by about the same share (4-5 percentage
points) depending on locality—females are more likely to be illiterate in urban areas but males
are more likely to be illiterate in rural areas. Males are four times more likely to be illiterate in
rural areas, and a female in a rural area is twice as likely to be illiterate as her urban counterpart.
Table 5.88: Illiteracy Rate by Subpopulation for ages 10+
Sub Population Male Female
Overall (14%) 11.3% 16.1%
Urban 6% 10%
Rural 25% 20% Source: Authors’ own calculations from data from the Ministry of Education and the Technical Secretaritat of El Salvador
The student-teacher ratio in El Salvador is quite high, in both the primary and secondary grades,
above the regional average in both instances. As seen in Table 5.88, El Salvador is tied for worst
and is second worst, respectively, in these categories—and by a fair margin—despite being
―only‖ fourth worst in the region in GDP per capita. To the degree that quality is correlated with
the student-teacher ratio, this metric would seem to indicate a low level of educational quality for
El Salvador.
Table 5.89: LAC Student Teacher Ratio, 2008
Country/Region Primary Secondary
2009
GDP/capita
Latin America and
the Carribbean 23 25 ...
Nicaragua 29 21 1069
Honduras 33 17 1727
Guatemala 29 17 2320
El Salvador 33 26 3337
Ecuador 23 15 4202
Perú 21 29 4477
Dominican Republic 20 15 4637
Costa Rica 19 16 6564
Panamá 24 ... 7155
Uruguay 15 16 9420
Chile 25 23 9877
Source: CEPALSTAT
Finally, the quality of education as benchmarked by an internationally administered achievement
test shows El Salvador as among the lowest of those tested in the Trends in International

169
Mathematics and Science Study (TIMSS), though it should be noted that the test is given mostly
to more developed countries. The test is scaled such that the world average is 500.
With a score of 330 in mathematics and 390 in sciences for fourth grade, El Salvador occupies
33rd
place of 37 participating countries. This score places the country very close to Colombia (the
only Latin American country which participated in the 2007 testing), Morocco, and Tunisia, and
higher than Qatar and Yemen. Nineteen countries, all Asian and European, obtained a national
average above the TIMSS international average.
El Salvador‘s eighth-grade scores, 340 for mathematics and 387 for sciences, ranked it 45 of 48
countries. Consistent with fourth grade trends, the top spots were occupied by Asian countries:
China (Taiwan), South Korea, and Singapore, followed by Hong Kong SAR and Japan.
As seen in Figure 5.89 below, and as suggested above, Salvadoran fourth grade students are
competitive or surpass those from the MENA region, but are surpassed by them in both math and
sciences by the eighth grade. Moreover, El Salvador falls far below the United States, the
destination of many of its migrants, as well as the East Asian economies, the current world
leaders in education attainment.
Figure 5.90: TIMSS Achievemenet Scores against Regional Averages, 2007
The TIMSS test establishes four international benchmarks for performance levels, ranging from
basic tasks (Low International Benchmark, score of 400) to very complicated tasks (Advanced
0
100
200
300
400
500
600
700
4th Grade Math 8th Grade Math 4th Grade Science 8th Grade Science
TIMSS Acheivement Scores (2007)
Colombia
El Salvador
United States
Middle East and North Africa*
East Asia**
Source: TIMSS 2007 International Mathematics and Science Reports
* Weighted by 2007 population. Includes: Algeria, Bahrain, Egypt, Jordan, Kuwait, Lebanon, Morocco, Oman, Palestine, Qatar, Saudi Arabia, Tunisia, Yemen, Armenia, Cyprus, Malta, and Turkey (coverage varies across subjects and grades )
** Weighted by 2007 population. Includes: Hong Kong, Japan, The Republic of Korea, and Chinese Taipei (coverage varies across subjects and grades
-- TIMSS Global Avg

170
International Benchmark). El Salvador‘s national average is below the Low benchmark; virtually
zero Salvadoran students reach the Advanced benchmark, only 1 percent reach the High mark, 6
percent reach the Intermediate mark, and 22 percent exceed the Low Benchmark, with the
remainder falling below the Low mark. The fourth grade math average for El Salvador was well
below the 10th
percentile score globally; eight grade was just over that mark. On the other
extreme, Singapore and Hong Kong SAR see 41 and 40 percent of their students reach or exceed
the Advanced level. El Salvador‘s learning is far from globally competitive.
In a more regional-specific study conducted by the United Nations Educational, Scientific and
Cultural Organization (UNESCO), elementary students from throughout 16 different Latin
American countries were tested on their mathematics, science, and reading skills (UNESCO‘s
Second Regional Comparative and Explanatory Study) (2005). El Salvador‘s sixth graders
scored below the regional mean in all three categories, and while the country‘s score gap
between the top and bottom deciles was one of the lowest in the region, the gap between rural
and urban schools was one of the largest. We also note that, consistent with regional trends, boys
tended to do somewhat better on math and science tests while girls did better on reading skills.
This implies that as a whole, Salvadoran schools have roughly the same (poor) quality, and that
most of the variation that does exist reflects an urban-rural divide.
Thus, the evidence suggests that the quantity of El Salvador‘s human capital stock is middle to
low, while the quality of education in El Salvador is low by regional standards and very low by
global standards. Taken together, we conclude that El Salvador‘s human capital supply is low but
that it reflects levels that are expected for its per capita GDP45
.
Firms’ Perceptions of Education in Productivity
The 2006 World Bank Enterprise Surveys indicated that firms do not flag human capital as a
major constraint to their operations46
. In Figure 5.90, for example, of the 10 categories of
potential constraints in El Salvador, only 3.74 percent of Salvadoran firms indicated that a lack
of human capital is the most binding obstacle, ranking it a distant seventh—roughly the same
ordinal ranking workforce education receives for the region. Obviously, El Salvador‘s firms‘
relative rankings of these constraints will change as higher level constraints, notably crime, are
relaxed.
45
We are unable to how El Salvador relates to the rest of LAC because of the limited number of LAC countries in
TIMSS 46
Of course, these statistics are only valid for existing firms and thus, as with many firm-based analyses, there is a
survivors‘ bias when evaluating constraints to investment. With data currently available, we are not able to
determine reasons for choosing not to invest among firms that never started or chose to locate elsewhere.

171
Figure 5.91: Constraints in El Salvador
Next, we see in Figure 5.92 that regionally the share of firms constrained by an inadequately
trained workforce in El Salvador is also very low—ranking 11th
of 16, between Panama and
Guatemala.
It is worth noting that other reports indicate that a significant share (20-30 percent) of firms have
―trouble finding sufficiently well-qualified employees.‖47
In our consulations with business
groups, when we asked what issues most inhibited their growth and investment, none mentioned
having a qualified workforce as being among their top issues. Only when prompted by the
specific question of whether they had trouble filling positions or whether they thought education
was up to their requirements did we receive comments indicating difficulty in this regard.
Roughly a quarter to a third of attending firms affirmed that finding the right people could be
difficult. These firms almost uniformly mentioned English language abilities as the principle
skill required most difficult to find. Some also mentioned a lack of technological training.
47
See for example ―Informe de Desarrollo Economico y Social 2003; Competitividad para el Desarrollo, Capitulo
6‖ by Salvadoran think tank Fusades, and recent USAID report ―El Salvador Employability Survey Executive
Summary,‖ 26 May 2010. Sampling methodology of these reports is unclear, while the statistics from the Enterprise
Surveys are nationally representative.

172
Figure 5.92: Percentage of Firms Constrained by Inadequately Trained Workforce
Source: WB Enterprise Surveys (2006)
The Enterprise Surveys also reports that of the major industries in El Salvador, the two industries
most likely to mention labor skill level as a binding constraint are Food Products and Beverages
(26.2 percent) and Retail (21.8 percent)—neither of which seem terribly human capital intensive
at face value, though the demand in the retail sector may be alluding to English language
proficiency, a theme which we did hear relatively often in focus groups with Salvadoran firms
and business associations.
Figure 5.93: Percentage of Firms Identifying Labor Skill Level as a Major Constraint
3.741.93 2.04 2.38 3.14 3.34 3.75 3.81
5.03 5.83 6 6.23
9.33 9.7911.78
29.25
0
5
10
15
20
25
30

173
Figure 5.92 illustrates that a firm which identifies low labor skill level as a constraint is much
more likely to be a non-exporting than an exporting firm, in sharp contrast to regional and
income peers. As a share of firms constrained by human capital, far fewer are exporters as
compared to LAC and Lower Middle Income countries, and vice versa for non-exporters.
Obviously before undertaking an investment, firms will research the availability of key inputs.
The fact that exporters are less constrained by education considerations is indicative that El
Salvador‘s exports are labor-intensive but not human capital-intensive, a fact underscored by
looking at the palette of the country‘s exports (see Table 5.93).
Table 5.94: Exports in 2009
• Maquila - $1,487 million, 40 percent of total exports
• Coffee – $230 million, 10 percent of total exports
• Prepared drugs - $98 million, 4 percent of total exports
• Toilet paper - $97 million, 4% of total.
• Sugar - $88 million, 3.8 percent of total exports
• Boxes, bottles and other plastic packing- $85 million
• Steel, iron and other manufactures - $121 million
• Water, mineral, w/gas, sweetened - $79 million
• Ethanol - $74 million
• Underwear and clothing complements - $67 million
• Other food products - $63 million Source: US Embassy San Salvador Calculations
Moreover, as shown in Figure 5.94, when human capital is an issue, it is domestic firms, far
more than their foreign-owned counterparts, which complain about a low labor skill level as a
major constraint to investment.
Figure 5.95: Percentage of Firms Identifying Labor Skill Level as a Major Constraint

174
Of course, this data has a self-selection problem in that the Enterprise Surveys only interview
firms which made the decision to invest and which survive. Ideally we would like to address this
bias with information on firms which decided not to invest and ask them why they decided
against it. Anecdotally, the current top four categories of questions that potential investors asked
the US Commerce Department in the US Embassy in El Salvador are crime and security,
energy/electricity, political stability, and human capital—particularly if the firm requires a large
or skilled labor force. Companies that require nonskilled labor (like maquilas) are happy with the
human capital here. Call centers, or companies requiring more skilled labor, encounter a shortage
of English speakers and a relatively small skilled labor force. A more rigorous evaluation of the
investment decision would likely return interesting results.
Returns to Education and Market Demand
If firms‘ investment or expansion is constrained by the lack of sufficiently well-trained human
capital, then firms should be competing for that human capital, driving up wage rates and
making education more valuable.
Evidence from Mincer regressions from 2009 data (DIGESTYC calculations) indicate that
overall returns to education for the population age 16-65 are positive with an 8.5-percent
increase in wages for each year of schooling. But this general result has been declining in the last
few years: Estimates from 2000 indicate returns of 9.2 percent and 2005 data indiates returns of
8.6 percent. However, these results are significantly lower than the regional average of 12
percent (Psacharopoulos and Patrinos 2002). All else equal, this suggests that while education is
valued, the level of demand in El Salvador is less than that of its neighbors and competitors.
We further explore schooling returns by examining returns of an additional year of education
within specific levels of education48
, by gender, and by age for the entire population for the
youngest who could have completed some tertiary. The results from the 54 individual Mincer
regressions in Table 5.95 indicate that as with the overall results, returns to education seem to be
falling in general over the last decade. Also, among those with a tertiary education, an additional
year of tertiary education saw a higher percent increase in wage than an additional year of
primary (or secondary) education did among those for whom primary (or secondary) education
was their highest level of education reached. Consequently we see that the market is not willing
to pay much more to a primary or secondary-school educated person with an additional year of
that level of education, but it is willing to pay more for a tertiary educated person with an
additional year of tertiary education. Whether this is a schooling effect or a signalling effect is
unknown, but it seems to follow that an additional year of primary or secondary schooling had
less imapct on wages at the primary and secondary levels. Finally, we note that returns seem to
be decreasing over time in primary and secondary education, while returns to tertiary education
48
Meaning, we assess the percent increase in wage returns to an additional year of education of a particular level,
using as the sample only those who completed no more than that level‘s maximum years of education. Primary is
grades 1-8, secondary is grades 9-11, and tertiary is over 11.

175
over this time dips between 2000 and 2005 and recovers somewhat by 2009. Somewhat
surprisingly, returns for the younger cohort does not seem to differ markedly from returns for the
entire population.
Table 5.96: Mincer Returns to Education
Returns to an Additional Year of Schooling,
By Age, Gender and Level All coefficients
significant at the
5% level except
those in gray.
Primary Secondary Tertiary
2000 2005 2009 2000 2005 2009 2000 2005 2009
Ages
16-6
5 T 8.1% 4.8% 4.4% 6.4% 5.7% 4.4% 16.3% 13.9% 15.5%
F 7.7% 3.6% 3.6% 11.9% 7.4% 7.6% 17.8% 15.1% 17.1%
M 7.9% 5.5% 4.9% 4.5% 6.9% 4.0% 15.2% 13.2% 14.6%
Ages
20-3
4 T 7.5% 4.8% 4.7% 9.6% 4.8% 3.4% 17.2% 14.6% 15.8%
F 7.0% 4.3% 2.7% 13.7% 4.8% 5.7% 19.3% 15.1% 16.3%
M 8.3% 5.1% 6.3% 8.7% 7.3% 3.6% 16.2% 14.7% 16.0% Source: Authors' calculations from data from Banco Central de Reserva, El Salvador
We also examine returns to levels of education in Table 5.96. Here we see that, compared to
those with no education, individuals with some primary education would had a wage nearly 50
percent higher in 2000 while those with university education had a 230 percent higher wage.
Overall, we see that there is very little difference between men and women‘s education returns,
though the returns for men seem to be somewhat higher for primary and secondary, while returns
for women seem higher from tertiary education. More importantly, we see a pronounced
downward trend in education returns by level over the last ten years, especially between 2000
and 2009. These trends seem to indicate that the equilibrium price for educated Salvadorans is
decreasing, though whether this is due to increased supply or weakening demand or some
combination of the two we cannot tell.

176
Table 5.97: Returns to Level of Education
2000 2005 2009
Total Primary 0.48 0.29 0.26
Secondary 1.21 0.72 0.66
Tert-Tech 1.67 1.23 1.27
Tert-Univ 2.29 1.36 1.38
Male Primary 0.49 0.31 0.24
Secondary 1.17 0.73 0.63
Tert-Tech 1.57 1.19 1.09
Tert-Univ 2.24 1.32 1.29
Female Primary 0.37 0.22 0.26
Secondary 1.18 0.70 0.69
Tert-Tech 1.78 1.30 1.47
Tert-Univ 2.25 1.39 1.48 All Coefficients Significant at the 1% level
Source: Authors' calculations from data from Banco Central de Reserva, El Salvador
In the preceding examination of returns to education we have seen that tertiary returns are higher
in El Salvador. Looking across countries for tertiary returns requires a careful construction of the
analysis consistent across countries. In Figure 5.97 below, we plot tertiary returns from other
countries in the region from the Contreras and Gallegos (2011) comparative paper against GDP
per capita. We see that for Latin America, just as Psacharopolis and Patrinos (2002) point out
with global comparisons, in general a nation‘s tertiary returns tends to decrease with per capita
GDP. For tertiary returns, El Salvador seems to once again fall directly on the regional trend line,
indicating that for its level of development, the tertiary returns in El Salvador seem to be about
what would be expected.
Figure 5.98: Returns to Tertiary Education by Income
Source: Contreras and Gallegos (2011) and World Bank national accounts data
*Contreras and Gallegos coefficients significant at 1%
If scarcity of education were a constraint to overall economic growth, we would see firms
competing to employ the more educated, thus driving up returns to education. The fact that we
El Salvador
ARG
BLV
BRA CHL
COL
CRI GUA HON
MEX NIC PAN
0.1
0.12
0.14
0.16
0.18
0.2
0.22
0.24
0.26
500 1500 2500 3500 4500 5500 6500 7500 8500
Co
effi
cien
ts o
n R
etu
rns
to
Edu
cati
on
*
GDP per capita (2000 US$)

177
do not see this in El Salvador, even while education attainment is low, indicates that demand for
Salvadoran workers with a higher quantity of Salvadoran education is not high.
Finally, the high rate of migration from El Salvador among the more educated is consistent with
the somewhat low returns to education in the country as migration is typically thought to be a
function of concerns for personal security and/or economic opportunity. In El Salvador there
seems to be evidence for both: Homicide rates are epidemically high, and we see a large wage
wedge between El Salvador and the most popular migraiton destination of the United States.
Overall, some 20 percent of the country‘s residents migrate. As illustrated in Figure 5.98, the rate
of migration from among those with a Medium or High level of education is far higher (perhaps
3-5 times higher) than the rate of migration among those with a low level of education. The share
of migration is staggering: more than half of those with medium levels of education migrate, as
do nearly a third of those with high levels of education.
Figure 5.99: Share of Migrants by Education Level, 2000
Source: (Docquier and Marfouk 2005)
While this high level of out migration, particularly among the more educated, may certainly have
some negative impacts on economic growth on its own, it is ultimately a symptom of other
challenges in the economy. This higher propensity to migrate among those with better education
levels again indicates that education premiums are not high in El Salvador, especially when
compared to other places—principally the United States. As with other types of capital, when
unfettered, human capital will flow to its most productive use. The wage gap between the
Salvadoran and U.S. labor market is inducing Salvadoran labor to flow out of of El Salvador and
into the US. In this case it seems that the more educated are finding more productive use, and so
find a higher wage, in the US.
0.0%
10.0%
20.0%
30.0%
40.0%
50.0%
60.0%
Low Medium High Total

178
This seems to be an example of what Hausmann and Klinger (2007) and Pritchett (2008) call the
―fanbelt effect,‖ wherein one problem leads to another perhaps larger problem. Here, challenges
of productivity in El Salvador along with wage differentials for workers in the US and El
Salvador and possibly safety and security concerns have induced Salvadoran labor to leave,
creating additional challenges for the economy. Cabrera (2011) concludes that even just looking
at the accounting costs of education, the country spends more educating migrants (a public
expense) than it receives from that migrants‘ remittances (a private benefit).
This brain drain may also inhibit human capital accumulation, thus slowing any structural
transformation of the economy to one which places a higher premium on knowledge. El Salvador
thus may be in something of an education trap where migration creates a ―leak‖ between trying
to attract higher value-added industries by improving education levels and attainment, which
industries in turn create higher demand for education. Still, addressing problems caused by
migration without first (or at least simultaneously) attending the challenges which precipitate
migraiton seems unlikely to be effective. Furthermore, it is noteworthy that those with high
levels of education are nearly half as likely to migrate as those with medium education, even as
returns to tertiary education is far higher. This may indicate some window of hope for extricating
the country from this dilemma: If training is high enough and of good enough quality, the returns
to that superior level of human capital may be sufficient to keep a large share of Salvadorans in
the country who might otherwise migrate.49
Education and the HRV Tests
Applying the four HRV criteria to education or human capital, we first look at the shadow price.
As seen above, the shadow price is middling to low, seen explicitly in the Mincer returns to
education which are positive but definitely lower than the regional average. Returns to Tertiary
education are high (15-16 percent) relative to primary and secondary education (returns of 3-6
percent) indicating that internally tertiary is education is relatively more constraining than the
lower grades. However, these returns for tertiary are similar or slightly lower than the average
tertiary returns for the region, indicating that El Salvador is no more constrained than its
neighbors in this regard. This evidence suggests that Human Capital on its own is not a binding
constraint in the Salvadoran economy as presently constituted.
Next we would like to explore how movements in education are associated with movements in
economic growth. However for an investment with a long gestation period like education, this
test is less useful as it becomes increasingly difficult to identify an effect with a very long lag.
49
This assertion, of course, has a host of identification problems and would be a profitable area of further inquiry,
but in the absence of readily-available data this link seems plausible. Costs and benefits of the provision of higher
levels of education should be assessed to indicate profitability of any policy aimed at using public money to provide
a good such as advanced training (technical or university) which is generally beilieved to have largely private
returns.

179
Levels of education and levels of income have seen contemporaneous increase, but we are
unable to determine the direction of causality.
Thirdly, according to Hausmann, Rodrik and Velasco, we should see private sector actors trying
to get around the constraint. Indeed there is some evidence of this as 1/6th
of schools in the
country and serve 1/5th
of the country‘s students. However we do not have data on levels of
private education in neighboring countries, nor do we have household survey data to understand
the choice factors involved in sending a child to private versus public school in El Salvador.
Similarly, according to the World Bank 2006 Enterprise Surveys, 49.6 percent of Salvadoran
manufacturing firms offered formal training to their employees, markedly higher than the
regional average (43.3 percent) and the world average (34.9 percent). As manufacturing is
export-oriented, this may be an indication that education quality is a constraint for firms in the
tradables sector as they are actively trying to get around the low levels of Salvadoran education.
Foruth and finally, industries which thrive should be less intensive in the constraint while
industries which are more intensive should be comparatively few. This certainly holds for El
Salvador as while many of its top 11 exports in 2009 is are labor intensive, none is particularly
intensive in human capital.
This lack of demand for human capital particularly among exporters and the lack of human
capital-intensive exports may indicate that El Salvador currently cannot compete well in such
goods on the world market. The ―camels‖ or survivors in El Salvador‘s tradables sector are those
industries which are not intensive in well-educated labor, suggesting that education may be
constraining exports.
Education Conclusion
So long as the current supply-demand equilibrium holds the shadow price will be low and human
capital formation cannot be considered a binding constraint. Furthermore, attempts to marginally
increase supply without simultaneously increasing domestic demand are unlikely to meet with
success as the additional supply will simply be siphoned off by foreign demand. Though further
investigation would be required to substantiate the hypothesis, this may constitute a type of low
equilibrium human capital trap from which it may be difficult for El Salvador to escape. What
data we do have, however, indicates a possible way out through higher-skilled training, though
the costs and benefits of such a measure should be considered prior to public expenditure.
Some have suggested that the interaction between innovation and education is an important
aspect of the economy and that the lack of either of these could constitute a constraint to private
investment in El Salvador50
. While it is difficult to conceive that the interaction effect of two
branches of the HRV Growth Diagnostics Tree may have a larger effect than the direct effect of
either branch (or in other words, that the cross-partial derivative in the constrained optimization
50
See, for example, Monje-Naranjo and Rodriguez-Claire (2006), who make this theoretical argument.

180
function theoretically underpinning the HRV approach is higher than the sum of each of the two
direct partial derivatives), the innovation and education branches of the HRV tree in El Salvador
may be an area where this holds. As potential descriptive evidence, Table 5 illustrates that El
Salvador is decidedly in the bottom half of the region on the Knowledge Economy Index, which
is constructed as an average of 4 components. On two of these, Economic Incentive Regime and
Information and Communication Technology, El Salvador does reasonably well. But on the
Innovation and Education scores, the country does poorly.
Table 5.100: Knowledge Economy Index
Rank Country KEI
Economic
Incentive
Regime
Innovation Education ICT
42 Chile 7.09 8.76 6.85 6.48 6.27
46 Uruguay 6.49 6.35 5.37 7.79 6.45
50 Costa Rica 6.03 6.60 6.25 5.19 6.07
75 Colombia 4.84 4.27 4.48 5.09 5.50
77 Peru 4.79 4.49 3.87 5.61 5.16
91 El Salvador 4.06 5.02 3.29 3.37 4.56
94 Ecuador 3.90 1.94 4.00 4.52 5.12
96
Dominican
Republic 3.85 4.09 2.91 4.39 4.03
101 Bolivia 3.46 3.01 2.95 4.81 3.08
107 Honduras 3.21 3.59 3.16 2.97 3.13
110 Guatemala 2.89 3.50 2.01 2.75 3.31
111 Nicaragua 2.81 3.46 2.09 3.09 2.61
Latin American
Average 5.21 4.71 5.80 5.05 5.27
Source: World Bank, Knowledge for Development Program (2009)
http://info.worldbank.org/etools/kam2/KAM_page5.asp
Innovation on the KEI somewhat proxies the demand for human capital. The fact Innovation and
Education (demand and supply of human capital) are simultaneously low indicates that firms do
not make use of higher skilled labor, but also that such labor is scarce.
Still, the current low level of human capital and its potential interaction with innovation would
seem to preclude some potential future paths of economic growth. Whether these paths,
including following Costa Rica‘s transformation into a knowledge economy by attracting large,
sustained investment from a high-tech firm like Intel, are optimal for El Salvador compared to
alternatives is a separate question. Questions of future growth paths such as these are less well
suited to the HRV methodology.

181
From the available evidence we cannot conclude that education or training on its own is a
binding constraint to the current Salvadoran economy. However, this is not to say that El
Salvador should invest less in education. Improved levels of education are still likely to help the
economy even though they are not the most critical constraint for today‘s economy. Moreover,
there are intrinsic reasons to invest in education apart from the instrumental reason of education
being an input into economic growth. These include education being important for citizens to
lead healthy and happy lives and to participate in and strengthen civil society.
Even still, there are at least two reasons why education may be a strategic investment undertaken
now to encourage private sector investment and economic growth: First, human capital may be
an emerging impediment on El Salvador‘s future growth path. That is, human capital may
become a binding constraint in the near future as the future economic path of the country takes
shape and as other constraints are relaxed. Currently, as one of the factors of production for El
Salvador‘s tradables sector, improving human capital may improve competitiveness: Because El
Salvador needs to compete in global market, its factors of production must be competitive, and
El Salvador does not compare well in human capital quality. As human capital investments
require a long lead time to reach maturity, it may be appropriate to make such investments now
in preparation for the future. Second, some evidence indicates that increasing education levels
can reduce crime rates
In sum, the shadow price on human capital appears low: Supply quantity is low compared to the
region (though appropriate for El Salvador‘s level of development); the quality of education is
also low. At the same time, demand is also low, particularly for primary and secondary
education, though less so for tertiary. Consequently human capital cannot be concluded to be a
binding constraint in the current economy for existing firms and industries. Other reasons to
invest in education as both an intrinsic public policy goal and as an instrumental tool in relaxing
other current constraints in El Salvador‘s economy may exist.
Health
The other important aspect of human capital for growth is health. Health, though of intrinsic
value in promoting happy livelihoods, acts instrumentally on economic growth and private sector
investment decisions in very particular ways. For health issues to be considered binding on
private sector investment and economic growth, they must have an effect on labor productivity.
In this context, then, we are looking for evidence of poor health which may act as an obstacle of
the use or accumulation of human capital. Usually when health rises to the level of a binding
constraint it does so on an epidemic level (similar to the loss of productivity due to AIDS and
malaria in Sub-Saharan Africa).
In El Salvador, though we see that there are certainly areas where health in general could be
improved, the evidence does not refute our null hypothesis that health is not a binding constraint
to growth. We note two important pieces of evidence.

182
First, El Salvador has made important progress on the eradication, elimination, and control of
sickness preventable by vaccination. The country has been free of poliomyelitis since 1987, the
last case of measles in the country was confirmed in 1996 (OPS-OMS 2007), and diphtheria and
neonatal tetanus have been eliminated.
Second, 74.2 percent of all deaths reported in 2007 were not linked to transmissible disease:
external causes of injury (assault) was the leading cause of death (homicide 58 percent, traffic
accidents 10.2 percent), followed by cardiovascular diseases, cancer, renal failure (perhaps as
cardiovascular complications) and diabetes. In general, during the 1997-2005 period, mortality
from chronic diseases has been increasing (El Salvador Ministry of Health).
This evidence indicates that El Salvador does not suffer from plagues or widespread
communicable disease which diminishes productivity. Furthermore, other causes beyond
sickness of any sort are by far the leading cause of death—violence and traffic accidents being
the most important health obstacles to applying one‘s accumulated human capital to productive
use. Accordingly, we cannot conclude that health is a binding constraint to growth in El
Salvador.
Still, if there is a health-related theme which is most likely to restrict economic growth in the
country, it appears that it may be early childhood development and nutrition.
Early Child Development is important for future economic productivity of children. (See World
Development Report 2006 for a brief fairly thorough treatment and Carneiro and Heckman
(2004) among others for a discussion of rates of return for human capital investments in early
childhood development versus at other points of intervention).
Diarrhea continues to be one of the leading causes of morbidity, greatly contributing to
nutritional deterioration of children under 5 years and a depressed of growth rate, which if not
corrected, can lead to malnutrition (FESAL 2008). According to FESAL 2008, the prevalence of
diarrhea has been stable since 2003 with 13.8 percent of all children under 5 years of age had
diarrhea in the two weeks prior to the interview. The prevalence of diarrhea is higher in rural
areas where it reached 15.9 percent compared to 11.5 percent in urban areas, and is more
common among children over one year (21.7 percent).
The high prevalence of stunting (height for age) is 19.2 percent in children under 5 years,
indicating that the main problem is likely not acute food shortages, as far as food safety
concerns, but rather reflects a process of long-term chronic diet deficit (likely from pregnancy)
as a result of the living conditions of the population, especially for those in rural areas.
In 2008 only 31 percent of children younger than 6 months are exclusively breastfed.
Complementary foods are introduced to age considerably lower than those recommended by
WHO and this is an important cause malnutrition in the first year of life.

183
The Ministry of Health of El Salvador identifies anemia as an area of particular concern for the
country. Anemia is mainly caused by iron deficiency and is the result of low quality and
diversity in the diet. Anemia increases the risk of maternal mortality, delayed psychomotor
development of children, reduced learning ability and school performance, and reduces
endurance and labor productivity adult. Anemia affects both rural and urban areas and there are
no major differences across socioeconomic status (Ministry of Health, 2008).
Preschoolers, particularly those under two years, represent a population highly vulnerable to
developing iron deficiency anemia. According to the latest family health survey (FESAL 2008),
iron deficiency has increased dramatically, with a 23-percent rise nationally in the last 10 years.
Differences are maintained by area of residence, with 20.4 percent in children aged 1-5 years in
urban areas and 25 percent in rural areas. The prevalence of anemia in pregnant women is
especially high during the third trimester of pregnancy, which increases the risk of death from
hemorrhaging during childbirth.
We cannot apply the HRV tests to childhood nutrition because there is little data available to
explore the shadow price of cognition on economic growth in the Salvadoran context51
, but these
descriptive statistics are suggestive that childhood nutrition may be important to the long-term
future growth of the country even while overall health is currently not constraining.
c. Geography
Geography, or ―natural capital,‖ is also sometimes attached to the Low Social Returns branch,
though the HRV paper spends little time developing it. The key conceptual problem in framing
geography within the HRV methodology seems to be the quite narrow and at times null set of
public policies (beyond infrastructure efforts already mentioned) which can alter those
geographic features (or their effects) which may inhibit private sector investment. We give an
accordingly brief treatment of geography here.
Based on the evidence compiled, geography is not a binding constraint in El Salvador. While El
Salvador has geographical constraints, including limited land mass, low levels of arable land,
environmental problems, and susceptibility to natural disasters, these constraints, when tested
against the four tests outlined in the ―Mindbook,‖ are not among the binding constraints to
economic growth in El Salvador.
El Salvador is the smallest country in Central America, with a total area of 20,742km2, and an
estimated population density of roughly 289 inhabitants/km2 (CIA World Fact Book, 2011).
Not only is El Salvador small in geographic area, but only 32.9 percent of its land is arable
(World Bank Development Indicators, 2007), and what little land is arable has been plagued by
mismanagement.
51
Notwithstanding the lack of evidence for El Salvador in particular, evidence from (Carneiro and Heckman 2004)
for the United States suggests that over the very long term, early childhood development has superior benefit-cost
ratios to any other known education investment.

184
El Salvador has 321 km of coast along the Pacific and is centrally located between North and
South America. El Salvador‘s geography offers potential for maritime transportation, which in
general is cheaper than overland transportation and, therefore, increases access to markets.
Access to a coast in general is an indicator of greater economic development.
El Salvador‘s year-round growing season allows farmers to grow products for export during cold
seasons in the temperate climates of North America and South America. The United States
Agency for International Development (USAID), the Department of Agriculture of the United
States (USDA) and the Ministry of Agriculture (MAG) have had some success in capitalizing on
the ability of El Salvador to grow its products for export to the United States during the winter
months.
El Salvador has an abundant supply of water, although a large part of the water‘s surface has
been contaminated by human and industrial waste. Thirty eight percent of the generation of
electricity in El Salvador comes from hydroelectricity due to the abundant rain during the six
month rainy season (SIGET 2007). Likewise, El Salvador is the leader in the Central American
region in the production of geothermal energy as a percentage of the total generation of
electricity. Geothermal energy production represents 14 percent of El Salvador‘s total energy
production (SIGET 2010).
Property Rights and Land Use Issues
In 1980, El Salvador instituted agrarian reform, expropriating the landholdings of all persons
owning more than 500 hectares. Under this reform, nearly 15 percent of all Salvadoran farmland
was appropriated and distributed in small plots to subsistence farmers, or used to form farming
cooperatives. Much of the best land was formed into cooperatives, which subsequently failed to
thrive. The limit on landholdings was increased from 100 hectares in 1930 to 245 hectares in
1983. However, to date, the majority of landholdings remain in small plots – with 85 percent of
the landholdings in plots of less than 1.71 hectares.

185
Figure 5.101: Size and quantity of land holdings, 2007
Size of Plot
(Hectares)
Number of Land
Owners Percentage
Hasta 0.49
141,823 36.3 percent
0.5 - 0.99
126,232 32.3 percent
1 - 1.71
66,964 17.1 percent
2 - 2.99
19,663 5.0 percent
3 - 3.99
6,759 1.7 percent
4 - 4.99
5,499 1.4 percent
5 - 9.99
10,110 2.6 percent
10.06 - 19.99
6,295 1.6 percent
20 -49.99
4,954 1.3 percent
50 - 99.99
1,435 0.4 percent
99.94 o mas
741 0.2 percent
Total:
390,475 100.0 percent
Source: Ministry of the Economy, DIGESTYC, VI Agricultural Census, 2007-2008
This concentration of landholdings in small plots, despite the legality of owning large plots up to
245 hectares, would seem to indicate that land owners are not constrained by the limit of 245
hectares per land owner. If it were a constraint, one would expect to see many land owners at
the 245 hectare limit and trying to acquire more land. In fact, the trend is quite the opposite, with
most land concentrated in small, subsistence plots.
Management of Natural Resources
El Salvador suffers from deforestation, poor management of land and water, overfishing and
other environmental problems. For example, El Salvador is the second most deforested country
in the Western Hemisphere, only after Haiti, and 95 percent of the Salvadoran territory has been
degraded by bad agricultural practices and misuse (UN Food and Agricultural Organization,

186
(FAO) 2010). The problems of mismanagement of natural resources are problems of property
rights and externalities and therefore must be considered under the branch of ―Low
Appropriability‖ in the HRV diagnostic tree.
In some cases, resources have been over-exploited, such as in the case of soil degradation from
overuse and deforestation. El Salvador has suffered massive deforestation, resulting in forest
cover of only 5.8 percent of El Salvador‘s total area (FAO, 2002).Anecdotal evidence indicates
that artisans specializing in wood handicrafts and furniture now have to import wood for the
production of handicrafts. However, from an economic viewpoint, they are now paying market
price for an input that they would otherwise have likely obtained for free from forests.
To be able to conclude that mismanagement of natural resources is a binding constraint,
mismanagement must have a shadow price so high that the relief of the constraint would result in
general increases of GDP, which would be higher than the increases in the GDP from relief of
other constraints.
Economists have attempted to place a shadow price on environmental degradation. In 1996, the
Business Council for Sustainable Development with the partner organization, FUSADES,
published a study called ―The Salvadoran Challenge: From Peace to Sustainable Development‖
known as the Green Book, in which they placed the economic value of environmental
degradation at 3-4 percent of GDP per annum. They calculated this shadow price using the total
cost of the effects of diseases such as diarrhea and respiratory infections; productivity losses in
land used for basic grains; dam sedimentation and associated increased costs of electricity
generation; and depreciation of dam equipment due to sediments and other chemicals. Another
study estimated the health impact of environmental degradation to be 2.5 percent of GDP (
(Panayotou 1998) (Strukova 2005), of which inadequate water and sanitation services, poor
hygiene, and air pollution constituted the highest costs.
According to a report to the Inter-American Development Bank 2005, "economic growth in El
Salvador is being affected by the unsustainable use of the factors and their level of
environmental performance. A 1996 study showed then that although the economy had
experienced an average annual growth of 5 percent during the first half of the nineties, the
country was losing between 3 percent and 4 percent of GDP as a result of the severe degradation
environment, based on conservative estimates of the loss of value and productivity of some
resources ... Moreover, if economic sectors (industry, tourism, agriculture) in the country depend
critically on natural resources, degradation of these resources necessarily have a severe impact
on growth of the same " (Pratt 2005, 5).
However, these are social costs and not necessarily binding on private investment. There are
other constraints that more directly affect private investment in the near term, and later sections
will cover recent evidence of links between natural disasters and economic growth.

187
Climate Change
El Salvador has a tropical climate, characterized by a dry season (from November to April) and a
rainy season (from May to October). Historically, there has been flooding during the rainy
season.
Figure 5.102: Trend of Intensities of 5, 10 minutes, Ilopango
0.00
1.00
2.00
3.00
4.00
5.00
6.00
Inte
nsi
tyin
mm
5
10
Linear (5)
Linear (10)
Source: Environmental Monitoring of the Ministry of Environment (SNET)

188
Figure 5.103: Trend of Intensities of 15, 20 minutes, Ilopango
Source: Environmental Monitoring of the Ministry of Environment (SNET)
Figure 5.104: Decadal rainfall: Annual average precipitation for 25 main weather stations,
1971-2010
Source: Environmental Monitoring of the Ministry of Environment (SNET)
Based on the average rainfall of 25 weather stations in 1971-2010, it appears that precipitation
has increased by 48mm each decade. This increase, according to the linear trend, is marked in
the last decade 2001-2010 to 1932 mm of rain, where the years 2005 and 2010 (January to
0.00
0.50
1.00
1.50
2.00
2.50
3.00
3.50
Inte
nsi
tyin
mm
15
20
Linear (15)
Linear (20)

189
September) have been the wettest period of 40 years. Such increase in rainfall is linked to natural
disasters. An example of this was the low pressure associated with Hurricane Ida E96 in
November 2009 which produced localized intensities up to 81 mm per hour and 355 mm in 24
hours, resulting in landslides and floods.
Principal Threats: Cost and Persistence of Disasters
Close to 88.7 percent of the territory of El Salvador is susceptible to natural disasters and
approximately 95.4 percent of the population of El Salvador is at risk for natural disasters.
Urban and rural land use has increased exposure and vulnerability to natural disasters. In urban
centers, slums are located in areas of risk (in ravines, landfills, railroads, etc.) and a sharp
increase in construction of residential and commercial complexes in mountainous areas has
increased surface run-off and generated flooding downstream. In rural areas, agricultural
practices have tended to be inappropriate and have constituted a source of risk.
Historically, earthquakes and floods have caused the most damage and loss of life. El Salvador is
located near fault lines that are sources of strong seismic activity. In particular, this is true for the
metropolitan area of San Salvador, where both human population and economic activity
concentrate. In addition, El Salvador is located between two great oceans in an area of intense
hurricane activity, so it is also strongly affected by La Nina, exacerbating the intensity or rains
and droughts.
From the total natural disasters experienced by the country during recent years, weather events
have generated the largest number of deaths, more than 62 percent and almost the total between
87 percent and 95 percent of total impacts. From 1982 to 2009 the economic impact of losses
and damages in El Salvador exceeded USD6,711 million, equivalent to USD248.5 million
annually. The population affected surpasses 538 thousand persons per year (almost 9 percent of
the total population) (Urzúa Venegas and Zapata Martí 2010). The Economic Commission for
Latin America (ECLAC) estimates that in 1982-2005, the impact of natural disasters in El
Salvador has been equivalent of 4.2 percent of the previous year‘s GDP. Again, this is the
economic cost of these disasters to society, which may be a loss to consumption as well as
investment—it is not clear which.

190
Table 5.105: Comparison of the impact of Recent Disasters in El Salvador (in current
million dollars)
Value of Damages and Losses to Public and Private Property
Hurrica
ne
Mitch
Two
Earthquakes
in El
Salvador
Tropical
Storm
Stan &
Eruption
of
Ilamatepec
Volcano
Tropical
Storm
Ida
Tropical
Storm
Agatha Total:
Total 290.1 1,302.60 318.5 309.8 112.1
2,333.1
Agriculture 118.3 75.6 43.6 41.8 11.4 290.7
Education 9.3 171 15.2* 10.9 12.1 203.3
Electricity 0.3 13.3 -1.2 -5 0.5 7.9
Environment 5.2 83.2 19.5 59.1 12.1 179.1
Health 8.7 58.8 17.3 10 11.5 106.3
Housing 10.2 271.1 101.3 18.1 20.3 421
Industry, Business
& Tourism 82.9 200 10.3 29.9 9.2 332.3
Transportation &
Communications 52.6 351.5 92.3 116.3 32.8 645.5
Water & Sanitation 1.8 18.8 10.6 19.3 2.2 52.7
Other: 0 73 9.5 9.4 0 91.9 Source: CEPAL.

191
Figure 5.106: Economic Impact of Natural Disasters, Gross Internal Product, Remittances,
and Foreign Direct Investment (Millions of U.S. Dollars)
Risk of Disaster Indicators
Inter-American Development Bank (IDB) (2010) created four indicators that measure the risks of
disasters in each country:
a) The Index of Deficit from Disasters (IDD) shows the economic loss that a country could
suffer due to a disaster and its implications in terms of resources that are required to
mitigate the disaster. A DDI above 1.0 indicates economic losses that exceed the
financial capacity of the state even when it increases its debt to the maximum. For 2008,
the DDI of El Salvador was 2.8 for a natural disaster that could occur once every 100
years, indicating that the economic losses in case of a disaster would exceed the financial
capacity of the state. That index is greater than one for all Central American countries,
except Cost Rica, where the index is 0.67.
0
5
10
15
20
25
0
1000
2000
3000
4000
5000
6000
7000
8000
19
80
19
81
19
82
19
83
19
84
19
85
19
86
19
87
19
88
19
89
19
90
19
91
19
92
19
93
19
94
19
95
19
96
19
97
19
98
19
99
20
00
20
01
20
02
20
03
20
04
20
05
20
06
20
07
20
08
20
09 G
ross
cap
ital
fo
ram
tio
n a
nd
re
mit
tan
ces
rece
ive
d (
% o
f G
DP
)
GD
P (
pe
r ca
pit
a P
PP
) an
d D
isas
ter
imp
act
(mill
ion
s), U
SD
GDP per capita (PPP, $US) Disasters Impact (millions USD)
Gross capital formation (% of GDP) Remittances received (% of GDP)
Hurricane Mitch
Earthquakes/ drought
Tropical storm Ida
Floods Earthquake Hurricane Stan/ Ilamatepec

192
b) In the case of Costa Rica, it is classified as the second most country in the world when it
comes to vulnerability of territory, with 36.8 percent of its territory exposed to three or
more adverse natural events (United Nations-Economic Commission for Latin America
and the Caribbean (ECLAC) 1999). However, Costa Rica has successfully mitigated the
risks of natural disasters. Since 1969, the Government has had a National Emergency
Commission (CNE), with a National Emergency Fund to handle natural disasters. This is
significant in that the funds for disaster mitigation are in place when a disaster hits and do
not come directly from the budget. The Government of Costa Rica also banned unsafe
adobe construction, which is still common practice in the rest of Central America, after
an earthquake in 1910. The Government of Costa Rica also requires disaster planning and
preparation at all public institutions at all levels. All of these measures have made
possible a considerable improvement of Costa Rica‘s capacity and effectiveness in
response to disasters (United Nations-Economic Commission for Latin America and the
Caribbean (ECLAC) 1999).
Figure 5.107: Index of Deficit from Disasters (2008)
Source: IDB, September 2010
c) The Local Disasters Index (IDL) assesses the social and environmental risks derived from
recurrent, small-scale natural disasters, starting with number of human lives lost, the
number of persons affected, and the damages produced. It measures the propensity of
countries to suffer this type of disaster and the cumulative impact of disasters on their
development. An index below 20 indicates a high concentration of small disasters in a
few local areas. An index of between 20 and 50 indicates a normal tendency and one
above 50 indicates that a large portion of the territory of a country suffers from recurrent,
small-disasters. In El Salvador, the index was 58 for the period 2001-2005, indicating
that the vulnerability and the threats are generalized throughout the territory. All of the
Central American countries, except Panama and Costa Rica, have indices of over 50.
7.00
3.14 2.80 2.42 2.28 1.94 1.53 0.67
0.07 0.001.002.003.004.005.006.007.008.00

193
Figure 5.108: Local Disasters Index (2001-2005)
Source: IDB, September 2010
d) The Prevalent Vulnerability Index (PVI) measures the fragility and the exposure of
human and economic activity in the zones exposed to disasters and the social and human
capacity to absorb the impacts of disasters. The three indicators compounded which form
this index consider factors such as demographic growth, population density, poverty and
unemployment, degradation of the soil, gender balance, social expenditure and insurance
of infrastructure and housing. An index of 20 or less indicates a low level of
vulnerability, an index between 20 and 40 indicates a medium level of vulnerability, and
an index between 40 and 80 shows a high vulnerability. In El Salvador, that index was
47 for 2007, showing high vulnerability. For all Central American countries, that index
is above 40, with the exception of Costa Rica and Panama. The latter countries, despite
their fragility, better absorb (with less negative consequences) the impacts of natural
disasters.
Figure 5.109: Prevalent Vulnerability Index (2007)
Source: IDB, September 2010
71 63
58
48 43
37 32
27
2
0
10
20
30
40
50
60
70
80
Panama CostaRica
ElSalvador
Peru Mexico Ecuador Argentina Colombia Bolivia
52 52 49 47 46 40 38
34
22
-5
5
15
25
35
45
55
65

194
e) The Risk Management Index (RMI) measures the performance of risk management of a
country, assessing the capacity to identify and reduce risks and to respond and recover
from catastrophes. An index below 50 is considered unsatisfactory; between 50 and 75
satisfactory and above 75 exceptional. In 2008, El Salvador had an index of 23, or
unsatisfactory. In this case, the majority of countries analyzed, including El Salvador‘s
Central American neighbors, practice better risk management than El Salvador.
Figure 5.110: Risk Management Index (2008)
Source: IDB, September 2010
We now subject natural disasters to the four HRV tests, with the premise that natural disasters
could both destroy fixed asset investments, as well as discourage future investments.
1. Shadow Price of Insurance Against Natural Disasters
Natural disasters are a risk and the market response to risk is insurance. The actors in general
insure themselves whether explicitly or implicitly through self-insurance, private insurance or
public insurance.
Assuming that there is a competitive market for insurance, the cost of that insurance can serve us
as an indicator or shadow price for the value the market places on the impact of natural disasters.
If natural disasters were a constraint to growth in El Salvador, one would expect the cost of
insurance to be high. In the following chart we can see the cost of insurance against natural
disasters or catastrophic events from Chartis, one of the largest providers in El Salvador.
Another source is Citibank, which charges an annual estimate of between 0.3 percent and 0.8
percent for the total amount insured. Insurance costs in El Salvador are relatively low compared
to other countries. In the United States, insurance costs are considerably higher, varying
41 41
37 34 33
29 27
23
-4
1
6
11
16
21
26
31
36
41
46
Nicaragua Panama Costa Rica Chile DominicanRep.
Guatemala Peru El Salvador

195
between 1 percent and 5 percent of the total amount insured. El Salvador‘s insurance costs are
not higher than the rest of the region‘s.
Table 5.111: Cost of Coverage for Natural Disasters or Catastrophic Events
Type of Activity
Range of Risk Rate
(percent on amount insured)
Offices and financial
services From 0.10 to 0.125 percent
Businesses From 1.37 to 1.75 percent
Industries From 1.50 to 1.87 percent
Residential Buildings From 0.10 to 0.125 percent
Agribusiness From 1.62 to 2.00 percent
Rural house and beach From 3.15 to 3.25 per thousand
House in Urban Zone 3.00 per thousand
Vehicles From 4.00 to 6.00 Source: Chartis Insurance, El Salvador
Table 5.112: Cost of Coverage for Natural Disasters or Catastrophic Events (percent over
amount insured)
Type of Activity
El
Salvador
Guatema
la
Hondur
as
Nicarag
ua
Costa
Rica1
Offices & financial
services 0.11 0.10 0.11 n.a. 0.22
Businesses 0.16 0.13 0.14 1.04 0.22
Industries 0.17 0.15 0.16 0.17 0.22
Residential Buildings 0.11 0.09 0.10 0.18 0.22
Agribusiness 0.18 0.21 0.18 n.a. 0.22
1 Data for Costa Rica are an average between 0.2104 percent and 0.2343 percent.
Source: Chartis Insurance, El Salvador
2. Movements in natural disasters should produce movements in growth
As Figure 5.112 below shows, natural disasters in El Salvador have not produced perceptible
changes in investment or GDP growth trends, nor is there is a clear relationship with remittances
received. For example, investment as a percentage of GDP moved less than 1 percentage point
the years following the costly earthquakes of 1986 and 2001 (as well as drought in 2001).

196
Figure 5.113: Disaster Costs, Investment, GDP and Remittances in El Salvado
Source: WDI and ECLAC, 2010
3. Economic agents are bypassing the constraint
The ―Mindbook‖ (Hausmann, Klinger, and Wagner) prescribes another test of whether a
constraint is binding on the economy – where a constraint is binding, one should see agents in
the economy attempting to overcome or bypass the constraint. In the case of natural disasters,
this can be measured by the market for insurance. In El Salvador, anecdotally, we hear that few
companies purchase insurance against natural disasters. This would seem to indicate that natural
disasters are not binding on private investment.
Based on ECLAC‘s analysis shown in Table 5.104, the transport and communciations industry is
most negatively impacted by natural disasters. Investment data for the transport industry is not
available, but using investment in telecommunications as a proxy for industries most vulnerable
to natural disasters, we see that in 1999, 2002, 2006, the years immediately following a major
natural disaster, telecoms investment fell or remained stable. This shows that natural disasters
could be a binding constraint for a specific industry such as telecommunications, but the link to
overall economic growth is less clear.
0
5
10
15
20
25
0
1000
2000
3000
4000
5000
6000
7000
8000
19
80
19
81
19
82
19
83
19
84
19
85
19
86
19
87
19
88
19
89
19
90
19
91
19
92
19
93
19
94
19
95
19
96
19
97
19
98
19
99
20
00
20
01
20
02
20
03
20
04
20
05
20
06
20
07
20
08
20
09
Gro
ss c
apit
al f
ora
mti
on
an
d r
em
itta
nce
s re
ceiv
ed
( p
erc
en
t o
f G
DP
)
GD
P (
pe
r ca
pit
a P
PP
) an
d D
isas
ter
imp
act
(mill
ion
s), U
SD
GDP per capita (PPP, $US)Disasters Impact (millions USD)Gross capital formation (% of GDP)
Hurricane Earthquakes/ drought
Tropical Floods Earthquak Hurricane Stan/ Ilamatepec Eruption

197
Figure 5.114: Private Telecoms Investment as a Percent of Total Investment
Source: WDI, 2011
Conclusions
Our analysis of the four HRV tests indicates that risk of natural disasters is not a binding
constraint to growth in El Salvador. Although El Salvador has some geographic limitations,
including small geographic territory, low levels of arable land, environmental problems, and
susceptibility to natural disasters, there are other limitations which are more important. The cost
of insurance against natural disasters is relatively low and it serves as an indicator or shadow
price for the mitigation of disasters.
In El Salvador, the government usually assumes the cost of damages to infrastructure and
damage to poor, uninsured Salvadorans. The state, when it does not have a fund budgeted or a
specific allotment to confront disasters, tends to obtain financing either from redirecting the
public budget, acquiring international loans, or from foreign donated aid. An example is the
earthquakes of January and February 2001, which apart from the loss of life, incurred economic
losses of USD1.6 million. This amount is equivalent to 13.5 percent of GDP. According to
reports from insurance companies, it is estimated that compensation payments exceeded USD320
million, i.e. 19.9 percent of total estimated losses. The rest had to be financed from other sources,
either from savings, borrowing or simply disappeared. Among the alternative measures the
government was forced to redirect and suspend a number of programs and projects, and appealed
to the international financial institutions to get a higher level of debt in the absence of country-
specific financing alternatives.
In sum, natural disaster losses, though significant, are absorbed by the private sector, by the
government through fiscal adjustments and international borrowing, or by donors. They have not
yet impacted overall economic growth.
0
2
4
6
8
10
12
14
16
18
20
19
96
19
97
19
98
19
99
20
00
20
01
20
02
20
03
20
04
20
05
20
06
20
07
20
08
20
09
pe
rce
nt

198
6. Conclusions
Over the last few months, representatives from the governments of El Salvador and the United
States have come together to form a joint technical team to conduct a rigorous, data-driven
analysis on the Salvadoran economy and what may be constraining it through private sector
investment. The Team has arrived at consensus that El Salvador‘s growth seems to face at least
two binding constraints: crime and security, and low productivity of the tradables sector. No
other issues were determined to be binding constraints, in some cases due to insufficient
evidence to reach a conclusion, and in other cases because the issues were determined not to be
binding constraints.
The purpose of this exercise was not to determine policies and programming to address these
constraints. Such decisions will be made through intra- and inter-agency discussions in the
coming weeks. We believe that this Constraints Analysis will be a critical tool in accurately
targeting areas where joint action between two countries will be most effective in increasing
economic growth and reducing poverty in El Salvador.

199
7. Technical Annex
A. Cointegration Tests
Methodological adaptation was verified based on the work of Mohan (2006) that was to use data
from the national savings and constant 1990 prices GDP at constant prices of the same year, in
order to formulate a VEC to conduct the causality test Granger on the hypothesis in question,
however, after checking that the series were of the same order of integration52
, have found an
appropriate VAR specification that met its assumptions, the results of the trace test and
maximum eigenvalue assuming deterministic trend in the data (the best approximation found)
indicate that the variables may not cointegrate, so that the VEC was not made. In order to apply
the spirit of argument Sims et al. (1980), in favor of non-differentiation of the variables in the
calculation of a VAR, even if they are I(1), because this wastes information concerning the
comovements in the data, we performed the Granger causality test using both the level and
differences.
52
The unit root tests were performed with the Dickey-Fuller with trend and intercept for LSN and intercept for
LGDP, use the automatic selection of lags under the Schwarz information criterion with 6 lags maximum results
indicates that differentiate the two series once the null hypothesis of the existence of unit root with probability
0.0052 and 0.0058.Indicating that the s series are integrated of order 1.
Date: 04/25/11 Time: 14:53
Sample (adjusted): 1983 2009
Included observations: 27 after adjustments
Trend assumption: Linear deterministic trend
Series: LPIB LSN
Exogenous series: D1992
Warning: Critical values assume no exogenous series
Lags interval (in first differences): 1 to 1
Unrestricted Cointegration Rank Test (Trace)
Hypothesized Trace 0.05
No. of CE(s) Eigenvalue Statistic Critical ValueProb.**
None 0.248054 8.258599 15.495 0.4382
At most 1 0.020569 0.561157 3.8415 0.4538
Trace test indicates no cointegration at the 0.05 level
* denotes rejection of the hypothesis at the 0.05 level
**MacKinnon-Haug-Michelis (1999) p-values
Unrestricted Cointegration Rank Test (Maximum Eigenvalue)
Hypothesized Max-Eigen 0.05
No. of CE(s) Eigenvalue Statistic Critical ValueProb.**
None 0.248054 7.697442 14.265 0.4103
At most 1 0.020569 0.561157 3.8415 0.4538
Max-eigenvalue test indicates no cointegration at the 0.05 level
* denotes rejection of the hypothesis at the 0.05 level
**MacKinnon-Haug-Michelis (1999) p-values

200
B. Residual Serial Correlation LM Tests
C. Impulse Response Functions
VAR Residual Serial Correlation LM Tests Null Hypothesis: no serial correlation at lag order h Date: 04/27/11 Time: 10:24 Sample: 1977 2009 Included observations: 30
Lags LM-Stat Prob 1 19.73238 0.2325
2 16.55960 0.4146 Probs from chi-square with 16 df.
-.004
-.002
.000
.002
.004
1 2 3 4 5 6 7 8 9 10
Response of DLADR to DLADR
-.004
-.002
.000
.002
.004
1 2 3 4 5 6 7 8 9 10
Response of DLADR to GYA
-.004
-.002
.000
.002
.004
1 2 3 4 5 6 7 8 9 10
Response of DLADR to WL
-.004
-.002
.000
.002
.004
1 2 3 4 5 6 7 8 9 10
Response of DLADR to SHR
-4
-2
0
2
4
6
1 2 3 4 5 6 7 8 9 10
Response of GYA to DLADR
-4
-2
0
2
4
6
1 2 3 4 5 6 7 8 9 10
Response of GYA to GYA
-4
-2
0
2
4
6
1 2 3 4 5 6 7 8 9 10
Response of GYA to WL
-4
-2
0
2
4
6
1 2 3 4 5 6 7 8 9 10
Response of GYA to SHR
-6
-4
-2
0
2
4
6
1 2 3 4 5 6 7 8 9 10
Response of WL to DLADR
-6
-4
-2
0
2
4
6
1 2 3 4 5 6 7 8 9 10
Response of WL to GYA
-6
-4
-2
0
2
4
6
1 2 3 4 5 6 7 8 9 10
Response of WL to WL
-6
-4
-2
0
2
4
6
1 2 3 4 5 6 7 8 9 10
Response of WL to SHR
-3
-2
-1
0
1
2
3
1 2 3 4 5 6 7 8 9 10
Response of SHR to DLADR
-3
-2
-1
0
1
2
3
1 2 3 4 5 6 7 8 9 10
Response of SHR to GYA
-3
-2
-1
0
1
2
3
1 2 3 4 5 6 7 8 9 10
Response of SHR to WL
-3
-2
-1
0
1
2
3
1 2 3 4 5 6 7 8 9 10
Response of SHR to SHR
Response to Cholesky One S.D. Innovations ± 2 S.E.

201
D. An index of Undervaluation
An index of undervaluation and its effect on economic growth
An index of undervaluation can be calculated in three stages, following the methodology of
Rodrik (2008). First, calculate the real exchange rate (RER) using data from the exchange rate
(XRAT) and conversion factors for purchasing power parity (PPP), as follows:
To adjust the exchange rate for the Balassa-Samuelson effect, in which non-tradable goods are
cheaper in lower income countries regress the RER by GDP per capita (RGDPCH)
,
in which ui are the residuals. Finally, to get the index of undervaluation, take the difference
between the real exchange rate and the exchange rate adjusted for the Balassa-Samuelson effect:
(2)
Where is the estimated value in equation (1). The currency is undervalued if UNDERVAL
is greater than one and overvalued if UNDERVAL is less than one.

202
E. Population and Exports in LAC
Exports as a share of GDP illustrates a quadratic relationship with the log of population. El
Salvador falls well below the trend; that is, the country has fewer exports than would be
expected for its population level.
El Slavador
y = -5.0798x2 + 57.389x - 118.85 R² = 0.3422
0
10
20
30
40
50
60
70
80
90
0 2 4 6 8 10
Exp
ort
s /
GD
P
Log Population
Log of population with Exports/GDP for LAC Source: Penn World Table, 2009

203
8. Bibliography
Millenium Challenge Corporation. «Guidelines for Conducting a Constraints Analysis.» 2009.
Acevedo, Carlos. Los costos economicos de la violencia en Centroamerica. San Salvador: Consejo
Nacional de Seguridad Publica, 2008.
Aisen, Ari, y Francisco Jose Veiga. How Does Political Instability Affect Economic Growth? IMF
Working Paper, Washington, DC : International Monetary Fund, 2011.
Alle, Alejandro. «Reacciones a S&P: faciles y equivocadas.» www.elsalvador.com. 17 de January
de 2011.
http://www.elsalvador.com/mwedh/nota/nota_opinion.asp?idCat=6342&idArt=549287
0 (último acceso: 29 de March de 2011).
Alvarado, C. «Análisis de la Productividad y Costos Laborales Unitarios Reales en El Salvador
1990-2009. Aspectos Teóricos e Implicaciones en la Competitividad.» Documento
Ocasional. No. 2010-03, San Salvador, 2010, 1-48.
BBC. «Gang Strike Paralyses El Salvador.» BBC News Latin America and the Caribbean. 9 de
September de 2010. http://www.bbc.co.uk/news/world-latin-america-11253408 (último
acceso: 20 de May de 2011).
Bems, Rudolfs. Aggregate Investment Expenditures on Tradable and Nontradable Goods. IMF
Working Paper, Washington, DC: IMF, 2008.
Buehn, Andreas, y Friedrich Schneider. «Shadow Economies and Corruption All Over the World:
Revised Estimates for 120 Countries.» (Economics: The Open-Access, Open-Assessment
E-Journal) 1 (2007).
Cabrera M., Oscar O. «Un Análisis de la Competencia en el Sub-Mercado de Tarjetas de Pago
desde la Perspectiva de la Organziación Industrial.» Documento Ocasional. No. 2010-02,
2010: 1-34.
Cabrera Melgar, Oscar Ovidio. «Eficiencia y productividad en la industria bancaria Salvadoreña
en el período 2001-2005.» Documentos Ocasionales. Banco Central de Reserva de El
Salvador, nº 02-2007 (2007): 1-56.
Cabrera Melgar, Oscar Ovidio. «El Papel de la Eficiencia economica y el cambio tecnico en el
desenvolvimiento economico centroamericano.» Cuadernos de Finanzas Publicas
(Escola de Administracao Fazendaria) 6 (2005).

204
Cabrera, Oscar Ovidio. «La dinámica de las migraciones y la fuga de cerebros: Una perspectiva
desde Centroamérica (unpublished manuscript).» 2011.
Carneiro, P., y J. Heckman. «Empirical Estimates of the Returns to Schooling.» Working paper,
2004.
Carneiro, Pedro, y James Heckman. Human Capital Policy. Working Paper, Cambridge, MA:
National Bureau of Economic Research, 2003.
Coelli, T. Prasada, R. y Battesse, G. An introducction to efficiency and productivity analysis. Vol.
Octava Edición. New York: Kluwer Academic Publisher., 1998.
CONAMYPE. Estudio del Sector de las MYPES en El Salvador 2004. Informe Final, San Salvador:
CONAMYPE, 2005.
Contreras, Dante, y Sebastián Gallegos. «Desigualdad salarial en América Latina: una década de
cambios.» Revista Cepal, 2011: 27-45.
De Soto, Hernando. The Mystery of Capital: Why Capitalism Triumphs in the West and Fails
Everywhere Else. Basic Books, 2000.
—. The Other Path: The Invisible Revolution in the Third World. Harpercollins, 1989.
Del'Anno, Roberto. Estimating the Shadow Economy in Italy: A Structural Equation Approach.
Discussion Paper, Salerno: Department of Economics and Statistics, University of
Salerno, 2003.
Del'Anno, Roberto, y Friedrich Schneider. «The shadow economy of Italy and other OECD
economies: what do we know? .» Journal of Public Finance and Public Choice, 2005.
Dell'Anno, Roberto. «The Shadow Economy in Portugal: an analysis with the MIMIC approach.»
Journal of Applied Economics, 2007: 253-277.
Docquier, Frederic, y Abdeslam Marfouk. International Migration by Education Attainment,
1990-2000 data set.
Echebarria, Koldo, y Juan Carlos Cortazar. «Las reformas de la adminstracion y el empleo
publicos en America Latina.» En El Estado de las Reformas del Estado en America Latina,
de Eduardo Lora, 139-172. Washington, DC: Interamerican Development Bank, 2007.
Enste, D.H. «Shadow Economy and Institutional Change in Transition Countries.» En The
informal economy in the EU accession countries: size, scope, trends and challenges to the

205
process of EU enlargement, de B. Belev (Eds), 81-113. Sofia: Centre for the Study of
Democracy, 2003.
Feige, Edgar L. The Underground Economies. Tax Evasion and Information Distortion.
Cambridge, New York, Melbourne : Cambridge University Press, 1989.
FESAL. «Encuesta Nacional de Salud Familiar.» 2008.
http://www.fesal.org.sv/2008/informe/final/espanol/descargas/InformeFinal/InformeFi
nal-FESAL2008.zip.
FMI. Indicadores de solidez financiera: guía de compilación. Washington: International
Monetary Fund, Publication Services, 2006.
Fuentes, J., et al. «Caracterización del Crédito Bancario en El Salvador: Opciones para su
reactivación en Época de Crisis.» Investigación Económica y Financiera, Banco Central de
Reserva de El Salvador, San Salvador, 2010, 1-64.
FUSADES. Economic and Social Development Report (2007): Resources and infrastructure for
competitiveness. San Salvador: FUSADES, 2007.
Gallegos, Diaz, y otros. Territorializacion de las expresiones de violencia y del Gasto Publico
Destinado a Seguridad Ciudadana: Policia Nacional Civil 2006-2008. Graduate Thesis,
San Salvador: Universidad Centroamericana, Jose Simeon Canas, 2009.
Granger, Clive. «Investigating causal relations between econometric models and cross-spectral
methods.» Econometrica 37 (3), 1969: 424–438.
Hauner, D. «Explaining Efficiency Among Large German and Austrian Banks.» The IMF Working
Paper, 2004: 1-13.
Hausman, R., Rodrik, D. and Velasco, A. «Growth Diagnostics.» Harvard University, 2004: 1-38.
Hausmann, R., y B. Klinger. The Structure of the Product Space and the Evolution of Comparative
Advantage. Working Paper #146, Harvard University Center for International
Development, 2007.
Hausmann, Ricardo, Lant Pritchett, y Dani Rodrik. «Growth Accelerations.» Journal of Economic
Growth (N), 2005: 303-329.
Hausmann, Ricardo, y Dani Rodrik. «Economic Development as Self-Discovery.» Journal of
Development Economics (National Nureau of Economic Research), 2003: 603-633.

206
IDB. Risk Indicators of Disaster and Management of Risks, Program for Latin America and the
Caribbean, Summarized Report. Technical Notes # IDB-TN-169, IDB, 2010.
—. Unlocking Credit: The Quest for Deep and Stable Bank Lending. Washington DC: Inter-
American Development Bank, 2005.
IMF. El Salvador: 2010 Article IV Consultation and First Review Under the Stand-By
Arrangement. Staff Report, Washington DC: IMF, 2010.
International Monetary Found y The World Bank. «Financial Sector Assesment Program
Update.» 2010, 1-87.
International Monetary Fund and The World Bank. «Financial Sector Assesment: El Salvador.»
Washington DC, 2010, 1-87.
Jong-a-Pin, Richard. «On the measurement of political instability and its impact on economic
growth.» European Journal of Political Economy, 2009: 15-29.
Katzenstein, Peter. Small States in World Markets. Ithaca: Cornell University Press, 1985.
Kaufmann, Daniel, Aart Kraay, y Massimo Mastruzzi. The Worldwide Governance Indicators:
Methodology and Analytical Issues. Washington, DC: World Bank, 2010.
Komives, Kristin. Water, electricity, and the poor: who benefits from utility subsidies?
Washington DC: World Bank Publications, 2005.
Krueger, Anne O. Trade policy and economic development: How we learn. Presidential Address
of the American Economic Association, The American Economic Review, 1997.
La Porta, Rafael, y Andrei Shleifer. The Unofficial Economy and Economic Development.
Conference Paper, Washington, DC: The Brookings Institution, 2008.
La Prensa Grafica. «Incertidumbre viene del FMLN, no de Funes: CCIES.» La Prensa Grafica, 23
de November de 2010: 1.
Macias, Ricardo Cordova, Jose Miguel Cruz, y Mitchell A Seligson. Political Culture of Democracy
in El Salvador, 2010: Democratic Consolidation in the Americas in Hard Times. Nashville:
USAID, 2010.
Minsky, Hyman P. Stabilizing An Unstable Economy. The McGraw Hill Companies, 2008.
Mohan, Rakesh. «Financial Sector Reforms and Monetary Policy.» RBI Bulletin, 2006.

207
Monge-Naranjo, Alexander, y Andres Rodriguez-Clare. Crecimiento Economico en El Salvador.
College Park: Pennsylvania State University, 2008.
Mosher, Clayton J, Terance D Miethe, y Timothy C Hart. The Mismeasure of Crime, 2nd edition.
Thousand Oaks: Sage Publications, Inc, 2011.
North, Douglass C. Institutions, institutional change and economic performance. Cambridge:
Cambridge University Press, 1990.
North, Douglass C. «Institutions, Transaction Costs and Economic Growth.» Economic Inquiry,
1987: 419-428.
Ocampo, Jose Antonio. Small Economies in the Face of Globalization. Lecture, Caribbean
Development Bank, 2002.
OPS-OMS. «Salud en las Américas 2007.» El Salvador, 2007.
«Impuestos y productividad: el juego del escondite.» En La era de la productividad: como
transformar las economia desde sus cimientos, de Carmen Pagés, 177-213. Washington
DC: Portico Bookstore, 2010.
Pages, Carmen. La era de la productividad. Cómo transformar las economías desde sus
cimientos. Washington, DC.: Banco Interamericano de Desarrollo, 2010.
—. The Age of Productivity: Transforming Economies from the Bottom Up. New York: Palgrave
Macmillan, 2010.
Panayotou, T. «El Salvador Challenge: From Peace to Sustainable Development.» 1998.
http://www.fas.harvard.edu/~drclas/publications/revista/environment/panayotou.htm.
Pratt, L et al. El Salvador: Análisis de competitividad y medio ambiente. BID, 2005.
Pritchett, Lant. Implementing Growth Analytics: Motivation, Background, and Implementation.
London: DFID, 2008.
PROESA. Encuesta Clima de Negocios El Salvador. Survey, San Salvador: PROESA, 2009.
PROESA. Encuesta Clima de Negocios El Salvador. Survey, San Salvador: PROESA, 2009.
Psacharopoulos, G, y H Patrinos. Returns to investment in education: A further update. World
Bank Policy Research Working Paper Series 2881., Washington DC: World Bank
Publications, 2002.

208
Reuters. «Update 1-S&P downgrades El Salvador on political uncertainty.» Reuters, 14 de
January de 2011: 1.
Ricardo Hausmann, Bailey Klinger, Rodrigo Wagner. Doing Growth Diagnostics in Practice: A
'Mindbook'. Cambridge: Harvard College Center for International Development, 2008.
Rodriguez-Claire, Monje-Naranjo and. «(Unpublished working paper).» 2006.
Rodrik, Dani. Policy Uncertainty and Private Investment in Developing Countries. NBER Working
Paper #2999, Cambridge: National Bureau of Economic Research, 1989.
Rodrik, Dani. The Real Exchange Rate and Economic Growth. Conference Draft, Washington DC:
The Brookings Institution, 2008.
Russo, Francesco Flaviano. The Cost of the Legal System and the Hidden Economy. Job Market
Paper, Boston: Department of Economics Boston University, 2008.
Saleth, R. Maria, y Ariel Dinar. The institutional economics of water: a cross-country analysis of
institutions and performance. Washington DC: World Bank Publications, 2004.
Salvador-AmCham, Unimer El. Clima de Negocios en ELS: Percepcion de empresas de capital
extranjero socias de AMCHAM. Survey, San Salvador: American Chamber of Commerce,
El Salvador, 2011.
Schneider, Friedrich, Andreas Buehn, y Claudio E Montenegro. Shadow Economies All over the
World: New Estimates for 162 Countries from 1999 to 2007. Policy Research Working
Paper , Washington, DC: World Bank Development Research Group, 2007.
Schneider, Friedrich, y Dominik H Enste. «Shadow Economies: Size, Causes, and
Consequences.» Journal of Economic Literature, March 2000: 77-114.
Srinivasan, T.N., y Jagdish Bhagwati. Outward-Orientation and Development: Are Revisionists
Right? Center Discussion Paper, New Haven: Economic Growth Center, Yale University,
1999.
Strukova. «The Cost of Environmental Degradation in El Salvador.» Paper commissioned by
World Bank., 2005.
Superintendencia de Competencia. «Resolución de concentración de Citibank Overseas
Investment Corporation (COIC) e Inversiones Financieras Cuscatlán.» SC-012-S/C/R-
2007, 2007, 1-97.

209
The Economist. «Economics and the rule of law: Order in the jungle.» The Economist, 13 de May
de 2008.
«Trends in International Mathematics and Science Study (TIMSS).» s.f.
UNESCO. Segundo Estudio Regional Comparativo Explicativo 2004-2007: Análisis Curricular.
Santiago, Chile: Oficina Regional de Educación de la UNESCO para América Latina y el
Caribe (OREALC/UNESCO), 2005.
United Nations-Economic Commission for Latin America and the Caribbean (ECLAC). «Costa
Rica: Assessment of the Damage Caused by Hurricane Mitch, 1998, Implications for
Economic and Social Development and for the Environment.» LC/MEX/L.373, 1999.
Urzúa Venegas, Myriam, y Ricardo Zapata Martí. Evaluation of Damages and Losses in El
Salvador caused by Tropical Storm Agatha. Mexico, D.F.: Economic Commission for Latin
America and the Caribbean (CEPAL) – Subregional Headquarters in Mexico, 2010.
USAID. Promoting Sustainable Energy Integration in Central America: Assessment for USAID/El
Salvador and USAID Central America and Mexico Regional Program. Assessment, San
Salvador: USAID, 2010.
WB and IMF. «FSAP Update: Financial Inclusion Technical Note.» Washington DC, 2010.
Wezel, T. «Bank Efficiency amid Foreign Entry: Evidence from the Central America region.»
Editado por International Monetary Found. IMF Working Paper WP/10/95 (2010): 1-33.
World Bank. «Enterprise Survey.» 2006.
—. World Development Indicator Online Database. Marzo de 2010.
http://databank.worldbank.org/ddp/home.do?Step=12&id=4&CNO=2 (último acceso:
Marzo de 2010).
World Bank. World Development Report. Report, Washington: The World Bank, 2005.