partnership brokers program baseline social return on...
TRANSCRIPT

Partnership Brokers Program
Summary report
prepared by: Social VentureS auStralia (SVa) conSultingThis publication is funded by the Australian Government Department of Education, Employment and Workplace Relations through the School Business Community Partnership Brokers Program.
February 2013
SVA Consulting is proudly supported by the Macquarie Group Foundation
Baseline Social Return on Investment Analysis
www.socialventures.com.au 1Partnership Brokers program – SROI Summary Report
Table of Contents
Executive Summary 2
1 Overview 5
2 Project Scope 6
3 Project Findings 9
4 Insights 13
Appendix A: Region Findings 14
Appendix B: Program Logic 28
about Social Ventures australia
Social Ventures Australia (SVA) works with innovative partners to invest in social change. We help to create better education and employment outcomes for disadvantaged Australians by bringing the best of business to the ‘for purpose’ sector, and by working with partners to strategically invest capital and expertise. SVA Social Finance introduces new capital and innovative financial models to help solve entrenched problems.
SVA Consulting shares evidence and knowledge to build social sector capacity. We work with non-profits, major funders and governments to strengthen their capacity to access and manage capital, talent and evidence, measure impact, and deploy new approaches to delivering services, to achieve profound social change.
www.socialventures.com.au 2Partnership Brokers program – SROI Summary Report
about the project
The School Business Community Partnership Brokers program (Partnership Brokers program) builds partnerships to improve education and transition outcomes for all young people. The program supports a network of Partnership Brokers operating in 107 regions across Australia. 1
The Partnership Brokers National Network (PBNN), funded by the Department of Education, Employment and Workplace Relations (DEEWR), commissioned Social Ventures Australia (SVA) Consulting to evaluate the Partnership Brokers program. The Social Return on Investment (SROI) methodology was used to complete this analysis.
SROI is an internationally recognised methodology used to understand, measure and value the impact of a program or organisation. It is a form of cost-benefit analysis that examines the social, economic and environmental outcomes created and the costs of creating them.
This project evaluated outcomes generated through the Partnership Brokers program that are attributable to the DEEWR cash investment. This involved completing five standalone SROI analyses for Partnership Broker organisations working across seven regions in New South Wales and Queensland from 2010-2013. The findings indicated that in all regions analysed, the value of social returns exceeded DEEWR’s cash investment by between 1.1 times and 3.7 times.
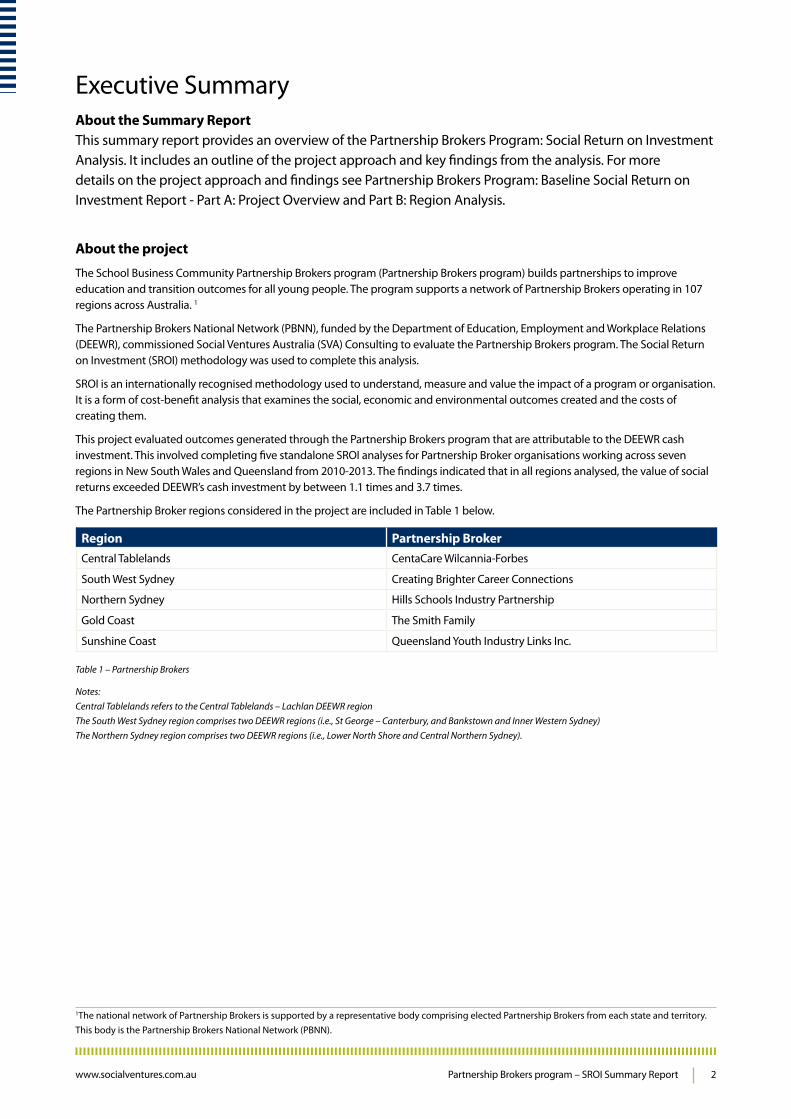
The Partnership Broker regions considered in the project are included in Table 1 below.
region partnership BrokerCentral Tablelands CentaCare Wilcannia-Forbes
South West Sydney Creating Brighter Career Connections
Northern Sydney Hills Schools Industry Partnership
Gold Coast The Smith Family
Sunshine Coast Queensland Youth Industry Links Inc.
Table 1 – Partnership Brokers
Notes: Central Tablelands refers to the Central Tablelands – Lachlan DEEWR region The South West Sydney region comprises two DEEWR regions (i.e., St George – Canterbury, and Bankstown and Inner Western Sydney) The Northern Sydney region comprises two DEEWR regions (i.e., Lower North Shore and Central Northern Sydney).
Executive Summaryabout the Summary reportThis summary report provides an overview of the Partnership Brokers Program: Social Return on Investment Analysis. It includes an outline of the project approach and key findings from the analysis. For more details on the project approach and findings see Partnership Brokers Program: Baseline Social Return on Investment Report - Part A: Project Overview and Part B: Region Analysis.
1The national network of Partnership Brokers is supported by a representative body comprising elected Partnership Brokers from each state and territory. This body is the Partnership Brokers National Network (PBNN).

www.socialventures.com.au 3Partnership Brokers program – SROI Summary Report
executive Summary
Key findings
The SROI analyses found that the Partnership Brokers program is creating value for stakeholders participating in partnerships. Part of this value is attributed to the DEEWR cash investment. The remaining value is attributed to partner organisations and other stakeholders based on the value of their own investments in partnerships and partnership activities. However, these investments would not have been made without the initial DEEWR investment, highlighting the role of the DEEWR investment as a catalyst for the total change created through the program.
The value created through partnerships is included in Table 2 below.
regionDeeWr cash investment 2010–2013
Stakeholder outcomes
Total value created from partnerships
Attributed to DEEWR cash investment
Attributed to stakeholder investments
Central Tablelands $1.8m $11.1m - $16.1m $3.9m - $5.5m $7.2m - $10.6m
South West Sydney $4.6m $11.0m - $15.8m $4.9 - $7.3m $6.1m - $8.5m
Northern Sydney $3.7m $11.9m - $17.1m $4.5 - $6.5m $7.4m - $10.6m
Gold Coast $3.1m $12.8m - $17.2m $6.1 - $8.2m $6.7m - $9.0m
Sunshine Coast $2.1m $12.3m - $16.7m $5.8 - $7.9m $6.5m - $8.8m
Table 2 – Overview of the value of stakeholder outcomes
Notes: Based on the realised and projected costs and benefits for the Partnership Brokers program from 2010 to 2015, the net present value of the program at its commencement in 2010 has been calculated using a real discount rate of 3%. As a result, the DEEWR cash investment has been discounted for the purpose of the analysis. The consideration of costs and benefits to 2015 is because some benefits were identified as lasting beyond the program’s current end date of December 2013. Some calculations may include rounding errors.
The SROI analyses also calculated the SROI ratios for each region. The SROI ratio compares benefits to costs. A ratio of 2:1 indicates that for every $1 invested in a program or activity, $2 of social value was created.
The SROI ratios show that the program is creating a positive return on the DEEWR cash investment in each region.
Any comparison of the SROI ratios needs to consider the factors impacting on stakeholder outcomes. These include the varying nature of infrastructure, culture and capacity within a region; geographic location; priorities for partnership development based on the needs of the region; and different approaches to program implementation.
The SROI ratio for each region is included in Table 3 below.
region DeeWr cash investment 2010–2013 Sroi ratioCentral Tablelands $1.8m 2.0:1 to 2.9:1
South West Sydney $4.6m 1.1:1 to 1.6:1
Northern Sydney $3.7m 1.2:1 to 1.8:1
Gold Coast $3.1m 1.9:1 to 2.6:1
Sunshine Coast $2.1m 2.7:1 to 3.7:1
Table 3 – Overview of SROI ratios
Notes: DEEWR cash investment is discounted value as per Table 2 above.

www.socialventures.com.au 4Partnership Brokers program – SROI Summary Report
insights
Based on the analysis, and consulting with stakeholders and Partnership Brokers, a number of insights can be drawn from the SROI analysis:
● The Partnership Brokers program is creating value for stakeholders participating in partnerships in each region. This is underpinned by a high level of partnership activity, comprising a high number of partnerships and partners.
● Stakeholders participating in partnerships share resources and expertise to build partners’ capacity and capabilities. This delivers outcomes for stakeholders in how they operate and how they support young people. These outcomes, in turn, lead to benefits for young people.
● Outcomes related to increased capacity to partner and development of quality partnerships were fundamental to increasing stakeholders’ ability to work effectively with young people. This change in ability was highly valued by stakeholders.
● The experience of stakeholders across the five regional analyses illustrates a high level of consistency in why organisations participate in partnerships and what changes for them as a result of participating in partnerships. It is therefore likely that a number of findings would hold at the national level.
● The voluntary nature of partnerships mitigates against negative outcomes for stakeholders participating in partnerships. This is because partnerships are based on the principle of mutual benefit. If a potential partner does not see the benefit of participating in a partnership, they will not engage. Similarly, if a partner does not experience a benefit through partnering, they will withdraw their involvement.
executive Summary

www.socialventures.com.au 5Partnership Brokers program – SROI Summary Report
1 OverviewThis section provides an overview of the Partnership Brokers baseline SROI analysis.
partnership Brokers program
The School Business Community Partnership Brokers program (Partnership Brokers program) builds partnerships to improve education and transition outcomes for all young people. The program supports a network of Partnership Brokers operating in 107 regions across Australia.2
Partnership Brokers create, develop and sustain partnerships. This involves working with stakeholders to define priority issues; facilitating the development of a shared vision for partnerships; and supporting working relationships between partner organisations.
Partnerships established and maintained through the program include a broad range of organisations and participants from six stakeholder groups:
● Schools
● Other education and training providers (education institutions)
● Business and industry (businesses)
● Community groups
● Government organisations
● Parents and families.
program funding
The Partnership Brokers program operates under the National Partnership on Youth Attainment and Transitions (the National Partnership). Through the National Partnership, the Department of Education, Employment and Workplace Relations (DEEWR) has committed $183 million in funding for the program from January 2010 to December 2013.
the issue
Partnerships between education and training providers, business and industry, community groups, government organisations and parents and families are an efficient and effective way to deliver targeted support to young people. However, there are factors that limit effective partnership development. These factors include the resource and time constraints faced by organisations; a lack of understanding about how to build effective partnerships; and a lack of cross sector relationships.
As a result, some young people do not have access to appropriate in and out of school learning opportunities leading to disengagement from learning; poor education outcomes; and poor transition outcomes.
about the project
The PBNN, funded by DEEWR, commissioned Social Ventures Australia (SVA) Consulting to evaluate the Partnership Brokers program for 2010-2013. The Social Return on Investment (SROI) methodology was used to complete this activity.
SROI is an internationally recognised methodology used to understand, measure and value the impact of a program or organisation. It is a form of cost-benefit analysis that examines the social, economic and environmental outcomes created and the costs of creating them.
SROI is underpinned by seven principles:
● Involve stakeholders
● Understand what changes
● Value the things that matter
● Only include what is material
● Do not overclaim
● Be transparent
● Value the results.
2 The national network of Partnership Brokers is supported by a representative body comprising elected Partnership Brokers from each state and territory. This body is the Partnership Brokers National Network (PBNN).

www.socialventures.com.au 6Partnership Brokers program – SROI Summary Report
2 Project ScopeThis section outlines the project scope and approach.
Focus of analysis
The project looked at the costs and the benefits generated through the Partnership Brokers program that are attributable to the DEEWR cash investment. This involved completing five standalone SROI analyses for Partnership Broker organisations working across seven regions in New South Wales and Queensland from 2010-2013.
An outline of regions, Partnership Brokers and funding considered in the project is included in Table 1 below.
region partnership Broker DeeWr cash investment 2010-2013
Central Tablelands CentaCare Wilcannia-Forbes $2.04m
South West Sydney Creating Brighter Career Connections $4.99m
Northern Sydney Hills Schools Industry Partnership $3.95m
Gold Coast The Smith Family $3.37m
Sunshine Coast Queensland Youth Industry Links Inc. $2.31m
Table 1 – Partnership Brokers
Notes: Central Tablelands refers to the Central Tablelands – Lachlan DEEWR region The South West Sydney region comprises two DEEWR regions (i.e., St George – Canterbury and Bankstown & Inner Western Sydney) The Northern Sydney region comprises two DEEWR regions (i.e., Lower North Shore and Central Northern Sydney). DEEWR cash investment is inclusive of GST.
Stakeholder engagement
SROI involves engaging closely with stakeholders to identify and understand the changes created through a program or activity. Based on the initial scoping of this project and consultations, stakeholders were included in the analyses if they experienced a unique and material change (e.g., increased organisational capacity to work with young people) as a result of direct engagement with the Partnership Brokers program.
Stakeholders included in this SROI analysis are listed in Table 2 below.
Stakeholder rationale for inclusion in the Sroi analysis ● Schools (primary schools and secondary schools)
● Education institutions (TAFE/VET providers, universities and other education institutions)
● Businesses (individual businesses and industry associations)
● Community organisations (community organisations, service delivery organisations and parent associations/bodies)
● Government organisations (federal and state government organisations and local councils)
● Key participants in partnerships and partnership related activities
● Key organisations supporting young people in education and transitions
● Parents and families (including carers) participating in partnerships
● Participants in some partnerships delivered under the Partnership Brokers program
Table 2 –Stakeholder groups included for the SROI analysis

www.socialventures.com.au 7Partnership Brokers program – SROI Summary Report
2 project Scope
consideration of young people
Improving the education and transition outcomes for young people is the primary objective of the Partnership Brokers program. This objective is facilitated through Partnership Brokers building partnerships that improve how stakeholders work with young people.
In this context, young people are the end beneficiaries or primary stakeholders of partnership activities. However, they do not generally work directly with Partnership Brokers or participate in partnerships. For these reasons, the outcomes for young people were not considered as part of the analysis.
program design
Under the Partnership Brokers program, partnerships are established to support young people to realise their educational and social potential. This requires partner organisations to work collaboratively towards shared goals that address young people’s needs.
To this end, stakeholders participating in partnerships share resources and expertise to build partners’ capacity and capabilities. This delivers outcomes for stakeholders in how they operate and how they support young people. Outcomes include increased effectiveness in delivering targeted support or services and enhanced understandings about issues affecting young people. These outcomes for stakeholders, in turn, lead to benefits for young people.
The outcomes for the program are illustrated in Figure 1 and discussed in Table 3 below. The full program logic developed for the Partnership Brokers program is included in Appendix B.
changes for young people
changes for stakeholders
increased capacity to partner
Development of quality partnerships
outcomeS
Figure 1 – Outcomes of the Partnership Brokers program
outcome DescriptionIncreased capacity to partner ● Increased ability of stakeholder to work with other organisations. This includes
an increase in stakeholders’ understanding about the benefits and operation of partnerships as well as an increase in links between stakeholders
Development of quality partnerships ● Establishment of quality partnerships where partners commit to shared goals and objectives. Partnerships may facilitate a region or sector based dialogue between partners, identification of effective models to support young people and commitment of time and resources
Changes for stakeholders ● Increased stakeholder capacity and capabilities. This may include improvements in the way stakeholders participating in partnerships deliver services and work directly with young people4
Table 3 – Stakeholder outcomes
The consequences considered in the project represent positive outcomes. While stakeholders were also asked whether any negative outcomes had been experienced, none were identified. This is because a key feature of partnerships is the voluntary nature of participation. If partners experience negative outcomes, or if they expect negative outcomes to emerge, they are likely to withdraw from the partnership.
The application of a partnership model within the Partnership Brokers program therefore mitigates against negative outcomes. Any partnerships established through the program that generate negative outcomes are likely to be ended quite quickly. Consequently, successful partnerships allow Partnership Brokers to build on what works.
4Due to the focus of South West Sydney on parent engagement, the analysis completed for the region measured the outcomes generated for parents participating in partnerships. This outcome included the increased capacity and capabilities of parents to support young people. The outcome was not considered for any of the other regions.

www.socialventures.com.au 8Partnership Brokers program – SROI Summary Report
measuring and valuing stakeholder outcomes
The SROI analyses involved measuring and valuing stakeholder outcomes.
Measure Stakeholder outcomes generated through the program were identified and measured through stakeholder consultations and interviews with Partnership Brokers themselves. The analysis identified different outcomes for each stakeholder participating in partnerships.
Only outcomes experienced by participants of partnerships were measured as part of the analysis. Examples of the different partnerships and changes experienced by stakeholders in each region are included in Appendix A.
Value The analysis valued the different stakeholder outcomes generated through the Partnership Brokers program operating from 2010 – 2013.5 This involved adopting financial proxies to estimate the value of the outcomes experienced by each stakeholder.
technical considerations
The following issues need to be considered when interpreting this analysis:
● The analysis presented has three components: understand, measure and value. While there is a high level of confidence in the outline of stakeholder outcomes (understand), there is less confidence in the measurement and valuation components. This is because this was the first time these outcomes were measured and valued. As a result, the valuation of outcomes provides only an indication of the value generated through the Partnership Brokers program
● Any comparison of SROI ratios needs to consider the factors impacting on stakeholder outcomes. These include the varying nature of infrastructure, culture and capacity within a region; geographic location; priorities for partnership development based on the needs of the region; and different approaches to program implementation.
2 project Scope
5 Some stakeholder outcomes were identified (and valued) as extending beyond 2013 and up to 2015

www.socialventures.com.au 9Partnership Brokers program – SROI Summary Report
3 Project FindingsThis section outlines the key findings for the project overall. An overview of the key findings for each of the five analyses is included in Appendix A.
overview of the five Sroi analyses
The SROI analyses found that the Partnership Brokers DWEER cash investment 2010–2013 program is creating value for stakeholders participating in partnerships. Part of this value is attributed to the DEEWR cash investment. The remaining value is attributed to partner organisations and other stakeholders based on the value of their own investments in partnerships and partnership activities. However, these investments would not have been made without the initial DEEWR investment, highlighting the role of the DEEWR investment as a catalyst for the total change created through the program.
The total value of stakeholder outcomes generated through the Partnership Brokers program in each region is similar. This is despite the differences in the DEEWR cash investments for 2010-2013. The similarity in value may be the result of Partnership Brokers being part of a common implementation phase from January 2010. The implementation phase included building stakeholder networks and raising awareness of the program, the role of a Partnership Broker and the benefits of partnering. This may have constrained the relative value created for some regions.
The value created through partnerships is included in Table 4 below.
regionDeeWr cash investment 2010–2013
Stakeholder outcomes
Total value created from partnerships
Attributed to DEEWR cash investment
Attributed to stakeholder investments
Central Tablelands $1.8m $11.1m - $16.1m $3.9m - $5.5m $7.2m - $10.6m
South West Sydney $4.6m $11.0m - $15.8m $4.9m - $7.3m $6.1m - $8.5m
Northern Sydney $3.7m $11.9m - $17.1m $4.5m - $6.5m $7.4m - $10.6m
Gold Coast $3.1m $12.8m - $17.2m $6.1m - $8.2m $6.7m - $9.0m
Sunshine Coast $2.1m $12.3m - $16.7m $5.8m - $7.9m $6.5m - $8.8m
Table 4 – Overview of the value of stakeholder outcomes
Notes: Based on the realised and projected costs and benefits for the Partnership Brokers program from 2010 to 2015, the net present value of the program at its commencement in 2010 has been calculated using a real discount rate of 3%. As a result, the DEEWR cash investment has been discounted for the purpose of the analysis. The consideration of costs and benefits to 2015 is because some benefits were identified as lasting beyond the program’s current end date of December 2013. Some calculations may include rounding errors.
The SROI ratio compares benefits to costs. A ratio of 2:1 indicates that for every $1 invested in a program or activity, $2 of social value was created. For this analysis, the benefits and costs consider the value of the stakeholder outcomes attributable to the DEEWR cash investment and the value of the DEEWR cash investment itself.
The SROI ratios show that the program is creating a positive return on the DEEWR cash investment in each region. Regional differences in the value of stakeholder outcomes attributable to the DEEWR cash investment and the DEEWR cash investment have resulted in the difference in ratios.

www.socialventures.com.au 10Partnership Brokers program – SROI Summary Report
3 project Findings
The SROI ratio for each region is included in Table 5 below.
region DeeWr cash investment 2010–2013 Sroi ratioCentral Tablelands $1.8m 2.0:1 to 2.9:1
South West Sydney $4.6m 1.1:1 to 1.6:1
Northern Sydney $3.7m 1.2:1 to 1.8:1
Gold Coast $3.1m 1.9:1 to 2.6:1
Sunshine Coast $2.1m 2.7:1 to 3.7:1
Table 5 – Overview of SROI ratios
Notes: DEEWR cash investment is discounted value as per Table 4 above.
partnership activity
The SROI analyses considered partnerships operating in November 2012 as a benchmark for the measurement and valuation components of the project.
The number of partnerships and partners in each region show a high level of partnership activity supported through the Partnership Brokers program. They also show wide variation in the relationship between the number of partnerships and partners (i.e., number of partners to partnerships). This variation is largely due to the focus and function of partnerships. For example, although South West Sydney had a relatively lower number of partnerships, it had the highest number of partners. This was largely due to the establishment of a number of sector specific networks that attracted a high number of organisations.
Partnership activity for each region is included in Table 6 below.
region partnerships partnersCentral Tablelands 28 partnerships 84 organisations
South West Sydney 25 partnerships 147 organisations 61 parents
Northern Sydney 33 partnerships 156 organisations
Gold Coast 42 partnerships 147 organisations
Sunshine Coast 22 partnerships 107 organisations
Table 6 – Partnership activity
“School Within a School has reengaged students who are in danger of dropping out of school. We are seeing really positive outcomes – about 80% of the cohort have either reengaged in mainstream school in Year 11, got an apprenticeship or found full time work. If it hadn’t been for the partnership, it would have been 0%.”
School Representative, Bathurst High School, Central Tablelands-Lachlan
“When I spoke to the broker, I told her if she could bring all these groups together it would be the first time in history. What they’ve done has been remarkable up to this point. It has exceeded expectation.”
University Representative, Charles Sturt University, Central Tablelands-Lachlan

www.socialventures.com.au 11Partnership Brokers program – SROI Summary Report
Value of stakeholder outcomes for the five Sroi analyses
The SROI analyses considered the same five stakeholder groups for each region, while the analysis completed for South West Sydney considered an additional sixth group (parents as participants in partnerships). The proportion of value that is assigned to these stakeholders as a result of involvement with the Partnership Brokers program varied considerably between the regions.
The difference in proportions is largely due to the different contexts of Partnership Brokers engaging organisations from each stakeholder group. For example, the high level of value generated for schools in the Sunshine Coast region was supported by the regional office of the state education department promoting the program to school leaders. Based on consultation with Partnership Brokers and partners in this region, the impact of the department’s role is likely to increase in the next few years.
The proportion of value created in outcomes for each stakeholder group in the five SROI analyses is included in Table 7 below.
organisation Schools education
institutionsBusiness
community orgs
government orgs
parents
Central Tablelands
14% 13% 12% 45% 17% -
South West Sydney
30% 9% 20% 17% 11% 14%
Northern Sydney
21% 3% 11% 38% 27% -
Gold Coast 27% 17% 20% 26% 9% -
Sunshine Coast 44% 9% 14% 26% 7% -
Table 7 – Value of stakeholder outcomes
Notes: Proportion of value is based on the lower value estimates for each stakeholder. Calculations may include rounding errors.
“Participating in partnerships has increased job satisfaction for existing employees as a result of placing them alongside young people to support during work experience activities.”
Business representative, Outrigger Little Hastings Street Resort and Spa, October 2012
Stakeholder outcomes for the five Sroi analyses
The SROI analyses considered the same three outcomes for each region, while the analysis completed for South West Sydney also considered the outcomes for parents.
The proportion of stakeholders experiencing different outcomes varied considerably between regions. While the Central Tablelands, Gold Coast and Sunshine Coast regions supported a high proportion of organisations to experience increased organisational capacity and capabilities, the Northern Sydney and South West Sydney regions supported a comparable level of organisations to experience increased capacity to partner.
The variation in proportions is largely due to the focus of Partnership Brokers when engaging organisations. For instance, the sector specific networks in South West Sydney, referred to earlier in this report, focussed on supporting organisations to increase their capacity to partner. As these networks attracted a high number of organisations, they resulted in the majority of stakeholders experiencing increased capacity to partner for the region.
3 project Findings

www.socialventures.com.au 12Partnership Brokers program – SROI Summary Report
The number and proportion of outcomes experienced by stakeholders in each of the five SROI analyses is included in Table 8 below.
organisationincreased capacity
to partnerDevelopment of
quality partnerships
increased org. capacity and capabilities
total
Central Tablelands24
orgs16%
42 orgs
28%82
orgs55%
148 orgs
100%
South West Sydney217 orgs
60%39
orgs11%
107 orgs/
parents29%
363 orgs
100%
Northern Sydney 114 orgs
48%62
orgs26%
62 orgs
26%238 orgs
100%
Gold Coast 7
orgs3%
77 orgs
33%149 orgs
64%233 orgs
100%
Sunshine Coast1
orgs1%
90 orgs
40%133 orgs
59%224 orgs
100%
Table 8 – Stakeholder outcomes
Notes: The outcomes experienced by parents as participants in partnerships have been grouped under the heading of increased organisational capacity and capabilities. Calculations may include rounding errors.
“The outcomes supported by participating in partnerships have been significant for our school. We have accessed outside resources as well as industry expertise to build teachers’ and students’ understandings about career opportunities in the health sector.”
School representative
3 project Findings

www.socialventures.com.au 13Partnership Brokers program – SROI Summary Report
4 InsightsThis section outlines the insights gained through the five analyses.
insights from the analysis
Based on the analysis, and consulting with stakeholders and Partnership Brokers, a number of insights can be drawn from the SROI analysis:
● The Partnership Brokers program is creating value for stakeholders participating in partnerships in each region. This is underpinned by a high level of partnership activity, comprising a high number of partnerships and partners
● Stakeholders participating in partnerships share resources and expertise to build partners’ capacity and capabilities. This delivers outcomes for stakeholders in how they operate and how they support young people. These changes, in turn lead to benefits for young people
● Outcomes related to increased capacity to partner and development of quality partnerships were fundamental to increasing stakeholders’ ability to work effectively with young people. This change in ability was highly valued by stakeholders
● The experience of stakeholders across the five analyses illustrates a high level of consistency in why organisations participate in partnerships and what changes for them as a result of participating in partnerships. It is therefore likely that a number of findings would hold at the national level
● The voluntary nature of partnerships mitigates against negative outcomes for stakeholders participating in partnerships. This is because partnerships are based on the principle of mutual benefit. If a potential partner does not see the benefit of participating in a partnership, they will not engage. Similarly, if a partner does not experience a benefit through partnering, they will withdraw their involvement
● The total value of stakeholder outcomes generated through the Partnership Brokers program in each region is similar. This is despite the differences in the DEEWR cash investment for each region for 2010-2013
● Since the commencement of the program in 2010, individual brokers developed links with individuals and organisations in a range of sectors (e.g., further education, industry and health). These relationships created an area of specialisation for the broker that provided a platform for the development of partnerships in these areas.

www.socialventures.com.au 14Partnership Brokers program – SROI Summary Report
central tablelands – lachlan region
CentaCare Wilcannia-Forbes is the Partnership Broker for the Central Tablelands-Lachlan region. CentaCare is the official welfare agency of the Roman Catholic Church of the Diocese of Wilcannia-Forbes (covering the western 52% of NSW). Through CentaCare Wilcannia-Forbes, the Partnership Brokers program has created $11.1m - $16.1m in value for stakeholders participating in partnerships, of which $3.9m - $5.5m is directly attributable to the DEEWR cash investment.
An overview of the Partnership Brokers program in the Central Tablelands - Lachlan region and the key findings from the SROI analysis is included in Table 1 below.
generalPartnership Broker CentaCare Wilcannia-Forbes
DEEWR Region NSW Region 19: Central Tablelands – Lachlan, NSW
DEEWR Cash Investment (2010-2013) $2.04m
partnership activityPartnerships operating as at Nov 2012 28 partnerships
Stakeholders participating in partnerships 84 organisations
Key findings from SroiPresent value of outcomes created through partnerships (2010-2015)
$11.1m – $16.1m
Present value of outcomes created through partnerships attributed to DEEWR (2010-2015)
$3.9m - $5.5m
SROI Ratio 2.0:1 to 2.9:1
Table 1 – Overview of Partnership Brokers program, Central Tablelands – Lachlan region
Notes: Based on the realised and projected value of outcomes for the Partnership Brokers program from 2010 to 2015, the present value of the program at its commencement in 2010 has been calculated using a real discount rate of 3%. As a result, the shown values of outcomes created through the program are discounted values while the SROI ratio is also calculated using discounted values.
Appendix A: Region FindingsThis appendix outlines the key findings for each region analysis.

www.socialventures.com.au 15Partnership Brokers program – SROI Summary Report
partnership examples
Organisations across the region commit to shared goals that address young people’s needs in the local area. A sample of different types of partnerships operating in the Central Tablelands – Lachlan region is included in Table 2 below.
region partnerships partnersBathurst Keep Them Safe ● 1 education institution
● 10 community organisations
● 4 government organisations
● Cross sector partnership designed to improve coordination amongst service providers to implement the NSW Government’s Keep Them Safe: A shared approach to child wellbeing action plan
● Assists community services in effective collaborative case management to maximise outcomes for vulnerable families
Central West Education Skills and Industry Community
● 5 community organisations
● 3 education institutions
● 4 businesses
● 6 government organisations
● Regional cross sector governing committee providing a forum to improve collaboration and coordination of work on education, employment and training issues (particularly skills needs) affecting young people in the region, minimising duplication of consultations and skills events
● Restarted by the Central West Education Skills and Industry Roundtable in February 2012, the group meets every 2 months and directs sub-groups to implement actions and develop new partnerships
School Within A School ● 2 schools
● 3 community organisations
● 1 education provider
● 1 government organisation
● Cross sector partnership to deal with issues of attendance, retention and engagement of certain students in Bathurst in Year 10, after NSW raised the school leaving age to 17 years
● Alternative education strategy, with NSW Department of Education providing schools with funds for students to attend TAFE and community organisations providing case management support.
Table 2 – Partnership examples, Central Tablelands – Lachlan region
Value of stakeholder outcomes
The highest level of value generated through the program in the Central Tablelands - Lachlan region by any one stakeholder was for community organisations.
The proportion of value of stakeholder outcomes for each group is included in Table 3 below.
Stakeholdertotal value attributed to DeeWr cash investment
total value
Schools $0.6m - $0.8m 14%
Education institutions $0.6m - $0.8m 13%
Businesses $0.5m - $0.7m 12%
Community organisations $1.9m - $2.8m 45%
Government organisations $0.7m - $1.0m 17%
Total $4.3 - $6.2m 100%
Table 3 – Stakeholder value generated through partnerships, Central Tablelands – Lachlan region
Notes: Proportion of value is based on the lower value estimates for each stakeholder. Value of outcomes has not been discounted. Calculations may include rounding errors.
appendix a: region Findings

www.socialventures.com.au 16Partnership Brokers program – SROI Summary Report
Stakeholder outcomes
The highest proportion of stakeholder outcomes generated through partnerships in the Central Tablelands – Lachlan region was the increase in stakeholders’ capacity and capabilities outcome.
The outcomes experienced by stakeholders are included in Table 4 below.
Stakeholder total outcomesincreased
capacity to partner
Development of quality
partnerships
increased capacity and capabilities
total
Schools 18 22% 17% 61% 100%
Education Institutions 17 6% 29% 65% 100%
Businesses 18 22% 28% 50% 100%
Community organisations
70 17% 24% 59% 100%
Government organisations
25 12% 48% 40% 100%
All stakeholders 148 16% 28% 55% 100%
Table 4 – Outcomes experienced through partnerships, Central Tablelands – Lachlan region
Notes: Calculations may include rounding errors.
case study of change
NSW Family Services participated in the Bathurst Local Focus Group partnership and, coming out of this, the Bathurst Keep Them Safe partnership. The Focus Group allowed NSW Family Services and other community organisations to participate in an open dialogue and discuss new approaches to service provision. The Bathurst Keep Them Safe partnership also supported change through improving referral rates for “at risk” families from schools and health services to community organisations.
appendix a: region Findings

www.socialventures.com.au 17Partnership Brokers program – SROI Summary Report
South West Sydney region
Creating Brighter Career Connections (CBCC) is the Partnership Broker for South West Sydney region. CBCC is a not for profit organisation that has been working in the region for over 10 years. Through CBCC, the Partnership Brokers program has created $11.0m - $15.8m in value for stakeholders participating in partnerships, of which $4.9m – $7.3M is directly attributable to the DEEWR cash investment
An overview of the Partnership Brokers program in the South West Sydney region and the key findings from the SROI analysis is included in Table 5 below.
generalPartnership Broker Creating Brighter Career Connections
DEEWR Region NSW Region 02: St George-Canterbury, NSW
NSW Region 10: Bankstown & Inner West, NSW
DEEWR Cash Investment (2010-2013) $4.99m
partnership activityPartnerships operating as at Nov 2012 25 partnerships
Stakeholders participating in partnerships 147 organisations
61 parents
Key findings from SroiPresent value of outcomes created through partnerships (2010-2015)
$11.0m - $15.8m
Present value of outcomes created through partnerships attributed to DEEWR (2010-2015)
$4.9m - $7.3m
SROI Ratio 1.1:1 to 1.6:1
Table 5 – Overview of Partnership Brokers program, South West Sydney region
Notes: The South West Sydney region comprises two DEEWR regions (i.e., St George Canterbury and Bankstown & Inner Western Sydney). Based on the realised and projected value of outcomes for the Partnership Brokers program from 2010 to 2015, the present value of the program at its commencement in 2010 has been calculated using a real discount rate of 3%. As a result, the shown values of outcomes created through the program are discounted values while the SROI ratio is also calculated using discounted values.
appendix a: region Findings

www.socialventures.com.au 18Partnership Brokers program – SROI Summary Report
partnership examples
Organisations across the region commit to shared goals that address young people’s needs in the local area. A sample of different types of partnerships operating in the South West Sydney region included in Table 6 below.
region partnerships partnersParental Engagement Strategy
● 1 school
● 2 education institutions
● 4 government organisations
● 1 community organisation
● 50 parents
● Partnership increases parents’ engagement in their child’s education by improving their understanding of the Australian education system and their capacity and confidence to support and engage their children
● Parents participate in capacity building courses held within the school, they meet other parents and other members of the school community
Rugby League – Refugee Partnership
● 1 community organisation
● 1 business
● 2 government
● Partnership increases the cultural integration and social inclusion of humanitarian refugees and their families into schools and the community
● Cultural tensions between community cultural groups are addressed through sport facilitated by
Yamaha Partnership ● 3 schools
● 1 education institution
● 1 business
● Partnership creates opportunities for experiential learning for young people at risk of disengagement from education, and increases understanding of the relevance of school to future work opportunities
● Young people participate in activities focused on auto and marine mechanics industries
Table 6 – Partnership examples, South West Sydney region
Value of stakeholder outcomes
The highest level of value generated through the program in the South West Sydney region by any one stakeholder was for schools.
Due to the focus of Partnership Brokers in the South West Sydney region on parent engagement, the analysis completed for the region measured the outcomes generated for parents participating in partnerships.
The proportion of value of stakeholder outcomes for each group is included in Table 7 below.
Stakeholdertotal value attributed to DeeWr cash investment
total value
Schools $1.6m - $2.3m 30%
Education institutions $0.5m - $0.7m 9%
Businesses $1.1m - $1.6m 20%
Community organisations $0.9m - $1.3m 17%
Government organisations $0.6m - $0.8m 11%
Parents and families $0.7m - $1.5m 14%
Total $5.5m - $8.2m 100%
Table 7 – Stakeholder value generated through partnerships, South West Sydney region
Notes: Proportion of value is based on the lower value estimates for each stakeholder. Value of outcomes has not been discounted. Calculations may include rounding errors.
appendix a: region Findings

www.socialventures.com.au 19Partnership Brokers program – SROI Summary Report
Stakeholder outcomes
The highest proportion of stakeholder outcomes generated through partnerships in the South West Sydney region was the increase in stakeholders’ capacity to partner outcome. This was due to the high number of organisations participating in sector specific networks that focused on supporting organisations to establish sector based links and build the capacity to partner.
An overview of the outcomes experienced by stakeholders is included in Table 8 below.
Stakeholder total outcomesincreased
capacity to partner
Development of quality
partnerships
increased capacity and capabilities
total
Schools 70 59% 16% 26% 100%
Education Institutions 15 13% 47% 40% 100%
Businesses 107 91% 4% 6% 100%
Community organisations 79 77% 10% 13% 100%
Government organisations 31 52% 29% 19% 100%
Parents 61 0% 0% 100% 100%
All stakeholders 363 60% 11% 29% 100%
Table 8 – Outcomes experienced through partnerships, South West Sydney region
Notes: Calculations may include rounding errors.
case study of change
Through the Parental Engagement strategy partnership, parents have developed an improved understanding of the demands and needs of young people and are less intimidated by the school environment. These outcomes resulted in a greater propensity for parents to become involved in the school community and engaged in their children’s learning as well as becoming better role models for their children.
appendix a: region Findings

www.socialventures.com.au 20Partnership Brokers program – SROI Summary Report
northern Sydney region
Hills Schools Industry Partnership (HillsSIP) is the Partnership Broker for the Northern Sydney region. HillsSIP was originally established in 1999 by the Hills Chamber of Commerce to facilitate workplace learning for Year 11 and 12 students studying VET courses. Through HillsSIP, the Partnership Brokers program has created $11.9m - $17.1m in value for stakeholders participating in partnerships, of which $4.5m - $6.5m is directly attributable to the DEEWR cash investment.
An overview of the Partnership Brokers program in the Northern Sydney region and the key findings from the SROI analysis is included in Table 9 below.
generalPartnership Broker Hills Schools Industry Partnership
DEEWR Region NSW Region 04: Lower North Shore, NSW
NSW Region 06: Central Northern Sydney, NSW
DEEWR Cash Investment (2010-2013) $3.95m
partnership activityPartnerships operating as at Nov 2012 33 partnerships
Stakeholders participating in partnerships 156 organisations
Key findings from SroiPresent value of outcomes created through partnerships (2010-2015)
$11.9m - $17.1m
Present value of outcomes created through partnerships attributed to DEEWR (2010-2015)
$4.5m - $6.5m
SROI Ratio 1.2:1 to 1.8:1
Table 9 – Overview of Partnership Brokers program, Northern Sydney region
Notes: Based on the realised and projected value of outcomes for the Partnership Brokers program from 2010 to 2015, the present value of the program at its commencement in 2010 has been calculated using a real discount rate of 3%. As a result, the shown values of outcomes created through the program are discounted values while the SROI ratio is also calculated using discounted values.
appendix a: region Findings

www.socialventures.com.au 21Partnership Brokers program – SROI Summary Report
partnership examples
Organisations across the region commit to shared goals that address young people’s needs in the local area. A sample of different types of partnerships operating in the Northern Sydney region included in Table 10 below.
partnership partners DescriptionIndustry Bite Size Program ● 3 businesses ● Partnership between businesses to connect industry
expectations with student and teacher perceptions of the workplace, while also promoting/highlighting current employment trends
Northern Sydney Youth Mental Health Working Group
● 5 community organisations
● 8 government organisations
● Community and government organisation based partnership with a regional and state-wide focus
● The partners worked in collaboration to map the gaps in mental health services and to develop joint strategies to address these gaps
Region 4 - Bringing Parents Up to Speed!- Thriving not just Surviving being a Parent - Community Youth Mental Health Forum
● 1 school
● 2 businesses
● 6 community organisations (including one parent organisation)
● Cross sector partnership, initiated by the NSW Parents’ Council, to address the growing concern about youth mental health by providing parents and the wider community with information about services and supports
RSA for Schools - Ryde Eastwood LAC
● 10 schools
● 1 business
● 1 education institution
● 2 government organisations
● Cross sector partnership to reduce the levels of alcohol-related offences by young people through education programs, skill development and information distribution
Table 10 – Partnership examples, Northern Sydney region
Value of stakeholder outcomes
The highest level of value generated through the program in the Northern Sydney region by any one stakeholder was for community organisations outcome.
The proportion of value of stakeholder outcomes for each group is included in Table 11 below.
Stakeholdertotal value attributed to DeeWr cash investment
total value
Schools $1.0m - $1.5m 21%
Education institutions $0.2m - $0.2m 3%
Businesses $0.6m - $0.8m 11%
Community organisations $1.9m - $2.7m 38%
Government organisations $1.3m - $2.0m 27%
Total $5.0m - $7.2m 100%
Table 11 – Stakeholder value generated through partnerships, Northern Sydney region
Notes: Proportion of value is based on the lower value estimates for each stakeholder. Value of outcomes has not been discounted. Calculations may include rounding errors.
appendix a: region Findings

www.socialventures.com.au 22Partnership Brokers program – SROI Summary Report
Stakeholder outcomes
The highest proportion of stakeholder outcomes generated through partnerships in the Northern Sydney region was the increase in stakeholders’ capacity to partner.
The outcomes experienced by stakeholders are included in Table 12 below.
Stakeholder total outcomesincreased
capacity to partner
Development of quality
partnerships
increased capacity and capabilities
total
Schools 88 60% 39% 1% 100%
Education Institutions 9 56% 11% 33% 100%
Businesses 39 67% 13% 21% 100%
Community organisations
65 31% 22% 48% 100%
Government organisations
37 27% 22% 51% 100%
All stakeholders 238 48% 26% 26% 100%
Table 12 – Outcomes experienced through partnerships, Northern Sydney region
Notes: Calculations may include rounding errors.
case study of change
Through the Region 4 – Bringing Parents Up to Speed! Partnership, community organisations experienced increased organisational capacity and capabilities. These organisations were able to provide more relevant information to clients and increase the number of young people supported through their programs and activities. The partnership also attracted an increased number of influential champions that increased the credibility of organisations’ messages and approaches relating to Youth Mental Health.
appendix a: region Findings

www.socialventures.com.au 23Partnership Brokers program – SROI Summary Report
gold coast region
The Smith Family is the partnership broker for the Gold Coast Region. The Smith Family is a children’s charity that supports disadvantaged children across Australia. Through The Smith Family: Gold Coast Partnership Brokers team, the Partnership Brokers program has created $12.8m - $17.2m value for stakeholders participating in partnerships, of which $6.1m - $8.2m is directly attributable to the DEEWR cash investment.
An overview of the Partnership Brokers program in the Gold Coast region and the key findings from the SROI analysis is included in Table 13 below.
generalPartnership Broker The Smith Family
DEEWR Region QLD Region 05: Gold Coast, Queensland
DEEWR Cash Investment (2010-2013) $3.37 million
partnership activityPartnerships operating as at Nov 2012 42 partnerships
Stakeholders participating in partnerships 147 organisations
Key findings from SroiPresent value of outcomes created through partnerships (2010-2015)
$12.8m - $17.2m
Present value of outcomes created through partnerships attributed to DEEWR (2010-2015)
$6.1m - $8.2m
SROI Ratio 1.9:1 to 2.6:1
Table 13 – Overview of Partnership Brokers program, Gold Coast region
Notes: Based on the realised and projected value of outcomes for the Partnership Brokers program from 2010 to 2015, the present value of the program at its commencement in 2010 has been calculated using a real discount rate of 3%. As a result, the shown values of outcomes created through the program are discounted values while the SROI ratio is also calculated using discounted values.
partnership examples
Organisations across the region commit to shared goals that address young people’s needs in the local area. A sample of different types of partnerships operating in the Gold Coast is included in Table 14 below.
partnership partners DescriptionGold Coast Careers Network ● 4 education institutions
● 2 community organisations
● 1 government organisation
● Cross sector partnership designed to address the gap in career education and transitions and facilitate an informed, strategic collaboration through a community of practice
● Key partnership activities include delivering career qualifications to school staff and developing a knowledge sharing network of professionals
Gold Coast Hospitality Teachers
● 4 schools ● Hospitality and Home Economics teachers network designed to establish best practice in curriculum, knowledge transfer and provide opportunities for professional development for teaching staff
Gold Coast Primary Health Care Workforce Plan
● 1 school
● 2 community organisations
● 1 education institution
● Cross sector partnership focused on developing a health workforce plan that identifies workforce needs for the health sector in the Gold Coast region; and enhances the way schools and education institutions support career pathways
Table 14 – Partnership examples, Gold Coast region
appendix a: region Findings

www.socialventures.com.au 24Partnership Brokers program – SROI Summary Report
Value of stakeholder outcomes
The highest level of value generated through the program in the Gold Coast region by any one stakeholder was for schools.
The proportion of value of stakeholder outcomes for each group is included in Table 15 below.
Stakeholdertotal value attributed to DeeWr cash investment
total value
Schools $1.9m - $2.5m 27%
Education Institutions $1.1m - $1.5m 17%
Businesses $1.4m - $1.8m 20%
Community organisations $1.8m - $2.3m 26%
Government organisations $0.6m - $0.9m 9%
Total $6.7m - $9.0m 100%
Table 15 – Stakeholder value generated through partnerships, Gold Coast region
Notes: Proportion of value is based on the lower value estimates for each stakeholder. Value of outcomes has not been discounted. Calculations may include rounding errors.
Stakeholder outcomes
The highest proportion of stakeholder outcomes generated through partnerships in the Northern Sydney region was the increase in stakeholders’ capacity to partner.
The outcomes experienced by stakeholders are included in Table 12 below.
Stakeholder total outcomesincreased
capacity to partner
Development of quality
partnerships
increased capacity and capabilities
total
Schools 60 5% 25% 70% 100%
Education Institutions 38 0% 34% 66% 100%
Businesses 47 2% 38% 60% 100%
Community organisations 68 4% 29% 66% 100%
Government organisations 20 0% 55% 45% 100%
All stakeholders 233 3% 33% 64% 100%
Table 16 – Outcomes experienced through partnerships, Gold Coast region
Notes: Calculations may include rounding errors.
case study of change
Coombabah High School has experienced a number of changes through the Gold Coast Primary Health Care Workforce Plan partnership. This partnership brings education institutions, community organisations (including Medicare Local) and local high schools together to support career pathways in health. As a result, the school has been able to access industry expertise to build teachers’ and students’ understandings about career pathways in the health sector as well as create direct links for students to discuss career opportunities with professionals working in the sector.
Coombabah High School also participates in the Boys and Books partnership, which involves the school partnering with Coombabah State School (a local primary school) and a range of other local organisations to support Year 12 male students to read to primary students. The partnership has not only provided access to external resources such as transportation for the visiting Year 12 students and new books for the program, but has also provided leadership opportunities for the high school students and literacy support for the primary school students.
appendix a: region Findings

www.socialventures.com.au 25Partnership Brokers program – SROI Summary Report
Sunshine coast region
Queensland Youth Industry Links Inc. (QYIL) is the Partnership Broker for the Sunshine Coast Region. QYIL is a not for profit organisation that is focused on young people and their transitions. Through QYIL, the Partnership Brokers program has created $12.3m - $16.7m in value for stakeholders participating in partnerships, of which $5.8m - $7.9m is directly attributable to the DEEWR cash investment.
An overview of the Partnership Brokers program in the Sunshine Coast region and the key findings from the SROI analysis is included in Table 17 below.
generalPartnership Broker Queensland Youth Industry Links Inc.
DEEWR Region QLD Region 06: Sunshine Coast, Queensland
DEEWR Cash Investment (2010-2013) $3.37 million
partnership activityPartnerships operating as at Nov 2012 22 partnerships
Stakeholders participating in partnerships 107 organisations
Key findings from SroiPresent value of outcomes created through partnerships (2010-2015)
$12.3m - $16.7m
Present value of outcomes created through partnerships attributed to DEEWR (2010-2015)
$5.8m - $7.9m
SROI Ratio 2.7:1 to 3.7:1
Table 17 – Overview of Partnership Brokers program, Sunshine Coast region
Notes: Based on the realised and projected value of outcomes for the Partnership Brokers program from 2010 to 2015, the present value of the program at its commencement in 2010 has been calculated using a real discount rate of 3%. As a result, the shown values of outcomes created through the program are discounted while the SROI ratio is also calculated using discounted values.
appendix a: region Findings

www.socialventures.com.au 26Partnership Brokers program – SROI Summary Report
partnership examples
Organisations across the region commit to shared goals that address young people’s needs in the local area. A sample of different types of partnerships operating in the Sunshine Coast is included in Table 18 below.
partnership partners DescriptionCatapult ● 1 school
● 1 education institution
● 6 community organisations
● School based partnership designed to identify and provide an appropriate individual pathway for students with a disability
North Coast Region Collaboration Approach
● 6 schools
● 1 business
● 4 community organisations
● 2 government organisations
● Region based partnership designed to support schools to enhance processes and links with the community with a focus on young people at risk of disengaging from formalised learning
Youth Sector Change Drivers Group
● 54 organisations ● Region based partnership designed to serve as the main point of leverage for achieving change in the region.
● Representatives from organisations across the region participate in the partnership and use their knowledge of their organisations and the local area to support a dialogue about key directions, policies and initiatives to support young people
Table 18 – Partnership examples, Sunshine Coast region
Value of stakeholder outcomes
The highest level of value generated through the program in the Sunshine Coast region by any one stakeholder was for schools.
The proportion of value of stakeholder outcomes for each group is included in Table 19 below.
Stakeholdertotal value attributed to DeeWr cash investment
total value
Schools $2.8m - $3.8m 44%
Education Institutions $0.6m - $0.8m 9%
Businesses $0.9m - $1.2m 14%
Community organisations $1.6m - $2.2m 26%
Government organisations $0.5m - $0.6m 7%
Total $6.4m - $8.7m 100%
Table 19 – Stakeholder value generated through partnerships, Sunshine Coast region
Notes: Proportion of value is based on the lower value estimates for each stakeholder. Value of outcomes has not been discounted. Calculations may include rounding errors.
appendix a: region Findings

www.socialventures.com.au 27Partnership Brokers program – SROI Summary Report
Stakeholder outcomes
The highest proportion of stakeholder outcomes generated through partnerships in the Sunshine Coast region was the increase in stakeholders’ capacity and capabilities.
The outcomes experienced by stakeholders are included in Table 20 below.
Stakeholder total outcomesincreased
capacity to partner
Development of quality
partnerships
increased capacity and capabilities
total
Schools 109 1% 56% 43% 100%
Education Institutions 18 0% 22% 78% 100%
Businesses 26 0% 8% 92% 100%
Community organisations 57 0% 28% 72% 100%
Government organisations 14 0% 50% 50% 100%
All stakeholders 224 1% 40% 59% 100%
Table 20 – Outcomes experienced through partnerships, Sunshine Coast region
Notes: Calculations may include rounding errors.
case study of change
Outrigger Little Hastings Street Resort and Spa participates in the Hotel and Resort Hospitality of Excellence partnership (an industry/school based partnership supporting work experience and industry placements). This partnership has provided direct engagement with schools and young people which has enabled the organisation to fulfil its community engagement commitments and increase its profile in the community. The partnership has also supported an increase in job satisfaction for existing staff through broadening the focus and activities of employees’ roles.
As another example, in early 2012 the Queensland Department of Education, Training and Employment (DETE) regional office directed schools to increase their participation in cross sector partnerships to support identified issues. Based on feedback from QYIL, this direction has already made a significant difference to the engagement of schools in partnerships and is expected to have a further impact moving forward.
appendix a: region Findings

www.socialventures.com.au 28Partnership Brokers program – SROI Summary Report
about the program logic
The program logic tells the story of change that takes place as a result of the program. It was developed and tested through the stakeholder consultations as well as ongoing discussions with Partnership Brokers, representatives of the PBNN and representatives of DEEWR.
The program logic includes information on the following components of the Partnership Brokers program:
● The issue the Partnership Brokers program is seeking to address
● The key participants in the Partnership Brokers program
● The activities of Partnership Brokers and the investment for the program
● The outcomes of activities and partnerships facilitated through the Partnership Brokers program.
The program logic is included in Figure 1 and Figure 2 on the following pages.
In addition to the program logic, stakeholder logics have been developed for each of the stakeholders experiencing change through the Partnership Brokers program. For detailed individual stakeholder logics, see Partnership Brokers Program: Baseline Social Return on Investment Report - Part A: Project Overview.
Appendix B: Program LogicThis section outlines the program logic developed for the Partnership Brokers program.

•Pa
rtner
ship
s be
twee
n ed
ucat
ion
and
train
ing
prov
ider
s,
busi
ness
and
indu
stry
, par
ents
and
fam
ilies
and
com
mun
ity g
roup
s re
pres
ent a
n ef
ficie
nt a
nd e
ffect
ive
way
to d
eliv
er ta
rget
ed s
uppo
rt to
you
ng p
eopl
e
•H
owev
er, t
here
are
fact
ors
that
lim
it ef
fect
ive
partn
ersh
ip d
evel
opm
ent i
nclu
ding
:-
a la
ck o
f und
erst
andi
ng a
s to
how
to b
uild
effe
ctiv
e pa
rtner
ship
s an
d lim
ited
acce
ss to
exp
ertis
e to
de
velo
p pa
rtner
ship
s;-
a la
ck o
f cro
ss s
ecto
r/reg
ion
rela
tions
hips
requ
ired
to e
stab
lish
partn
ersh
ips;
and
-tim
e an
d fin
anci
al c
onst
rain
ts fa
ced
by m
any
orga
nisa
tions
mea
ning
that
par
tner
ship
s ar
e no
t be
ing
esta
blis
hed
or m
aint
aine
d
•Th
is c
ontri
bute
s to
you
ng p
eopl
e no
t con
sist
ently
re
ceiv
ing
the
supp
ort t
hey
need
and
lead
s to
:-
dise
ngag
emen
t fro
m le
arni
ng;
-po
or e
duca
tion
outc
omes
; and
-
poor
tran
sitio
n ou
tcom
es.
•Br
oker
s fa
cilit
ate
the
crea
tion
of n
ew p
artn
ersh
ips
or
the
enha
ncem
ent o
f exi
stin
g pa
rtner
ship
s be
twee
n pa
rtici
pant
s
•Br
oker
faci
litat
ed p
artn
ersh
ips
are
esta
blis
hed
to
addr
ess
iden
tifie
d ne
eds
of y
oung
peo
ple
in th
e re
gion
•Br
oker
act
iviti
es fo
cus
on c
reat
ing,
dev
elop
ing
and
sust
aini
ng p
artn
ersh
ips.
Thi
s in
clud
es:
-co
nnec
ting
orga
nisa
tions
with
opp
ortu
nitie
s to
cr
eate
mut
ual b
enef
it;
-pr
ovid
ing
data
and
evi
denc
e to
def
ine
prio
rity
issu
es;
-fa
cilit
atin
gth
e de
velo
pmen
t of a
sha
red
visi
on
and
goal
s fo
r par
tner
ship
s;
-su
ppor
ting
wor
king
rela
tions
hips
, the
alig
nmen
t of
col
lect
ive
reso
urce
s an
d ad
here
nce
to
partn
ersh
ip p
rinci
ples
; and
-sh
arin
g ex
perti
se to
influ
ence
the
cont
inuo
us
impr
ovem
ent o
f lon
g-te
rm p
artn
ersh
ips.
Activ
ities
Part
icip
ants
Key
parti
cipa
nts
in p
artn
ersh
ips
and
partn
ersh
ip re
late
d ac
tiviti
es:
1.Sc
hool
s (p
rimar
y an
d se
cond
ary)
2.TA
FE /
VET
prov
ider
s an
d ot
her
educ
atio
n or
trai
ning
inst
itutio
ns3.
Indi
vidu
al b
usin
esse
s an
d in
dust
ry
bodi
es4.
Com
mun
ity o
rgan
isat
ions
and
se
rvic
e de
liver
y ag
enci
es5.
Pare
nts
(rep
rese
nted
thro
ugh
Pare
nt A
ssoc
iatio
ns, P
aren
t &
Citi
zens
Gro
ups,
Com
mun
ity
Org
anis
atio
ns)
6.Lo
cal c
ounc
ils, s
tate
and
fede
ral
gove
rnm
ent d
epar
tmen
ts (e
.g.
educ
atio
n, h
ealth
and
co
mm
uniti
es).
Inpu
ts•
Fund
ing
from
DEE
WR
(Dep
artm
ent o
f Edu
catio
n,
Empl
oym
ent a
nd W
orkp
lace
Rel
atio
ns) t
oor
gani
satio
ns w
ith d
edic
ated
par
tner
ship
bro
kers
•$1
83m
ove
r 4 y
ears
(201
0-13
) in
107
regi
ons,
83
cont
ract
ed o
rgan
isat
ions
.
Issu
e
29
Figu
re 1
– P
rogr
am Lo
gic:
Issu
e, p
artic
ipan
ts, a
ctiv
ities
& in
puts

30
Con
sequ
ence
sIm
pact
Cha
nges
for s
take
hold
ers
Sch
ools
del
iver
a w
ider
rang
e of
le
arni
ng o
ppor
tuni
ties,
and
impr
oved
w
elfa
re a
nd c
aree
r dev
elop
men
t su
ppor
t for
stu
dent
s, b
y w
orki
ng in
pa
rtner
ship
with
bus
ines
ses,
co
mm
unity
org
anis
atio
ns a
nd p
aren
ts
Bus
ines
ses
attra
ct a
nd re
tain
an
effe
ctiv
e w
orkf
orce
by
wor
king
in
partn
ersh
ip w
ith o
ther
org
anis
atio
ns
Edu
catio
n in
stitu
tions
attr
act n
ew
stud
ents
by
wor
king
in p
artn
ersh
ip w
ith
othe
r org
anis
atio
ns
Com
mun
ity o
rgan
isat
ions
pro
vide
im
prov
ed s
ervi
ces
for y
oung
peo
ple
by
wor
king
in p
artn
ersh
ip w
ith o
ther
or
gani
satio
ns to
targ
et a
nd ta
ilor
supp
ort
Par
ents
hav
e an
incr
ease
d ca
paci
ty to
su
ppor
t the
ir ch
ildre
n’s
lear
ning
and
de
velo
pmen
tal n
eeds
You
ng p
eopl
e ar
e eq
uipp
ed
with
the
skill
s an
d ca
pabi
litie
s to
com
plet
e th
eir
scho
olin
g an
d su
cces
sful
ly
trans
ition
to fu
rther
ed
ucat
ion
or e
mpl
oym
ent
You
ng p
eopl
e ha
ve a
sen
se
of p
urpo
se, a
re m
ore
resi
lient
, fee
l sup
porte
d by
th
eir c
omm
uniti
es a
nd a
re
mor
e co
nfid
ent i
n th
eir a
bilit
y to
ach
ieve
thei
r asp
iratio
ns
You
ng
peop
le
real
ise
thei
r ed
ucat
iona
l an
d so
cial
po
tent
ial
Incr
ease
d ca
paci
ty to
par
tner
Bui
ldin
g of
trus
t and
un
ders
tand
ing
betw
een
orga
nisa
tions
with
in a
nd
acro
ss s
ecto
rs
Incr
ease
d w
illin
gnes
s to
pa
rtner
Impr
oved
und
erst
andi
ng o
f ho
w to
par
tner
Incr
ease
d aw
aren
ess
of th
e va
lue
of p
artn
ersh
ips
Est
ablis
hmen
t of c
onne
ctio
ns
with
oth
er o
rgan
isat
ions
Dev
elop
men
t of q
ualit
y pa
rtne
rshi
ps
Iden
tific
atio
n of
opp
ortu
nitie
s fo
r org
anis
atio
ns to
form
m
utua
lly b
enef
icia
l wor
king
re
latio
nshi
ps
Loca
l and
Sta
te G
over
nmen
t alig
n fu
ndin
g an
d re
sour
ces
to s
uppo
rt cr
oss
sect
or/re
gion
col
labo
ratio
n
Cha
nges
for y
oung
peo
ple
Part
ners
hip
focu
s
Dia
logu
e ab
out y
oung
peo
ple
and
orga
nisa
tions
’ cap
acity
and
ex
perti
se
Effe
ctiv
e m
odel
s fo
r sup
porti
ng
youn
g pe
ople
are
iden
tifie
d
Part
ners
hip
activ
ities
Org
anis
atio
ns c
omm
it tim
e an
d re
sour
ces
tow
ards
iden
tifie
d go
als
and
obje
ctiv
es
Dev
elop
men
t of s
yste
m /
regi
onal
/ se
ctor
bas
ed g
oals
and
obj
ectiv
es
for p
artn
ersh
ip
Dev
elop
men
t of l
ocal
ised
goa
ls
and
obje
ctiv
es fo
r par
tner
ship
Leve
l of b
roke
r fac
ilita
tion
and
supp
ort
Hig
hM
ediu
mLo
w
Figu
re 2
– P
rogr
am lo
gic:
Con
sequ
ence
s and
Impa
ct