partitioning the contributions of alternative malaria vector species
TRANSCRIPT

Deredec et al. Malar J (2016) 15:60 DOI 10.1186/s12936-016-1107-y
RESEARCH
Partitioning the contributions of alternative malaria vector speciesAnne Deredec1,2, Samantha M. O’Loughlin1*, Tin‑Yu J. Hui1 and Austin Burt1
Abstract
Background: In many locations malaria is transmitted by more than one vector species. Some vector control inter‑ventions, in particular those using genetic approaches, are likely to be targeted against a single species or species complex, at least initially, and it would therefore be useful to be able to predict the epidemiological impact of control‑ling a single species when multiple vector species are present.
Methods: To address this issue, the classical Ross‑McDonald model of malaria epidemiology is expanded to account for multiple vector species, giving expressions for the equilibrium prevalence, sporozoite rates and reproductive num‑ber. These allow one to predict when control of just one vector species will lead to elimination of the disease. Applica‑tion of the model is illustrated using published data from a particularly extensive entomological and epidemiological survey before the rollout of bed nets in eastern Kenya, where Anopheles gambiae s.l. and An. funestus were vectors.
Results: Meta‑analysis indicates that sporozoite rates were 38 % higher in An. gambiae s.l. than in An. funestus, and, according to the model, this difference could be due to An. gambiae s.l. having a higher frequency of feeding on humans, a higher human‑to‑mosquito transmission rate, a lower adult mortality rate, and/or a shorter incubation period. Further calculations suggest that An. gambiae s.l. would have been sufficient to maintain transmission by itself throughout the region, whereas An. funestus would not have been able to support transmission by itself in Malindi District.
Conclusions: Partitioning the contributions of different vector species may allow us to predict whether malaria will persist after targeted vector control.
Keywords: Malaria transmission, Ross‑McDonald, Vector control
© 2016 Deredec et al. This article is distributed under the terms of the Creative Commons Attribution 4.0 International License (http://creativecommons.org/licenses/by/4.0/), which permits unrestricted use, distribution, and reproduction in any medium, provided you give appropriate credit to the original author(s) and the source, provide a link to the Creative Commons license, and indicate if changes were made. The Creative Commons Public Domain Dedication waiver (http://creativecommons.org/publicdomain/zero/1.0/) applies to the data made available in this article, unless otherwise stated.
BackgroundMany indirectly-transmitted or vector-borne diseases are transmitted by more than one vector species, even within a single locale [1]. This is true of malaria, which in many places is transmitted by several species of anophe-line mosquito [2–4]. Much of malaria control is directed against the mosquito vectors, as this has proven success in reducing malaria transmission and the burden of dis-ease [5]. However, it is often the case that the interven-tion is more successful against some mosquito species than others. For example, bed nets and indoor residual spraying are more effective against species that bite and
rest indoors than those that bite and rest outdoors, and as a consequence of their widespread adoption the relative importance of different vector species has shifted over time [6–11]. Some types of intervention currently under development, such as genetic approaches to vector con-trol, are particularly likely to target just a single species or species complex, at least in the first instance [12, 13]. In thinking about potential species-specific interventions, it would be useful to be able to predict the epidemiologi-cal impact of controlling a single species when multiple vector species are present. How much will malaria trans-mission and prevalence be reduced by controlling a sin-gle species? When would it be possible to eliminate the disease if only a single species is targeted?
There has been a rich history of modelling the epidemi-ology of malaria, but the vast majority of it only considers
Open Access
Malaria Journal
*Correspondence: [email protected] 1 Department of Life Sciences, Imperial College, Silwood Park, Ascot, London SL5 7 PY, UKFull list of author information is available at the end of the article
Page 2 of 7Deredec et al. Malar J (2016) 15:60
a single vector species [14]. In this paper the classic Ross-McDonald model of malaria epidemiology [15, 16], modified to allow for super-infection and heterogeneity in propensity to be bitten [17, 18], is extended to allow for multiple vector species, leading to expressions for the equilibrium prevalence in humans, sporozoite rate in mosquitoes, and reproductive number. Application of the model is then illustrated using a particularly extensive survey of malaria and vectors in eastern Kenya [19].
MethodsParasite prevalence in humansSuppose there are n vector species, and for each species i let the number of adult female mosquitoes per human be Ai, the average rate at which a female bites a person be ai, and the proportion of females that are infectious be Yi. Population sizes of the different vector species are assumed to be independently regulated such that changes in the density of one do not affect the others. The aver-age rate at which a person is bitten by an infectious mos-quito (i.e., the entomological inoculation rate) of species i is then ɛi = aiAiYi. Each such bite is assumed to have a constant probability bi of transmitting the infection to the person, which may differ among mosquito species. The average rate at which people acquire a new infection (i.e., the force of infection) is then the sum of the successfully infectious bites across vector species: f =
∑ni=1 biεi. Sup-
pose further that people differ in their propensity to be bitten, with person j having a relative propensity si(j) by a mosquito of species i, such that the biting rate of infec-tious females of species i on this individual is ɛisi(j). A per-son’s relative propensity to be bitten by mosquito species i is assumed to be gamma-distributed with mean 1 and var-iance αi. Individuals of propensity class s = {s1,···sn} then acquire new infections at a rate fs =
∑ni=1 sibiεi. If mul-
tiple infections in an individual are cleared independently at a rate r, then the number of infections in an individual at any particular time is a Poisson variable with mean fs/r, and the overall clearance rate (i.e., rate at which an infected person becomes uninfected) is fs/(Exp[fs/r] − 1) (see [17] for the equivalent single species model). If Xs is the parasite prevalence in people with propensity s to be bitten, the change in Xs over time will then be:
At equilibrium, this expression equals 0, and
The equilibrium average prevalence in the population as a whole is then:
dXs
dt= (1− Xs)fs −
Xsfs
Exp[fs/r]− 1
X∗s = 1− Exp[−fs/r] = 1− Exp
[
−
n∑
i=1
sibiεi/r
]
where G(s) is the probability density function of the random vector s = {s1,···sn}. Evaluating this expression requires information or assumptions about how the pro-pensity to be bitten by different vector species are cor-related. Although there are several ways of constructing different families of multivariate gamma-distributions (i.e. distributions for which every marginal density is gamma-distributed), there is no general formulation for a multivar-iate gamma-distribution. Therefore, this paper focusses on two simple opposing cases: (I) an individual’s propensity to be bitten is equal for all vector species (si
(
j)
= s(
j)
for all i), with variance α; or (II) the propensities to be bitten by different species are independent of each other. In these two cases the equilibrium average prevalence is
respectively. Thus in both cases prevalence is an increas-ing function of bi and ɛi, and a decreasing function of r and αi.
Sporozoite rate in mosquitoesSuppose adult female mosquitoes of species i, in addi-tion to having a constant probability of biting someone, ai, also have a constant probability of dying, μi, both of which are independent of age and infection status. Let the probability a female mosquito becomes infected from biting an infected person be ci (assumed to be independ-ent of the number of infections the person carries). If it then takes Ti days for sporozoites to develop and the female to become infectious (the incubation period), the probability of her surviving this period is θi = e−µiTi. The change in sporozoite rate in species i over time is then:
X̄∗ =
∫
Rn+
G(s)X∗s ds =
∞∫
0
· · ·
∞∫
0
G(s1, · · · , sn)
(
1− e−
∑ni=1
sibiεir
)
ds1 · · · dsn
(1-I)X̄∗ = 1−
(
r
r + α∑n
i=1 biεi
)1/α
(1-II)X̄∗ = 1−
n∏
i=1
(
r
r + αibiεi
)1/αi
dYi
dt= aiciXmi(θi − Yi)− µiYi
where Xmi= ∫
Rn+
siG(s)X∗s ds =
∞
∫0
· · ·∞
∫0
siG(s1, · · · , sn)
is the parasite prevalence as seen from the mosquito’s point of view, or the probability of a mosquito biting an infected person (i.e., the weighted average prevalence,
(
1− e−∑n
j=1sjbjεj
r
)
ds1 · · · dsn
Page 3 of 7Deredec et al. Malar J (2016) 15:60
where the weights are the propensities to be bitten—see [20]). In the two specific cases studied, this index is:
In the latter case, differences in the vector’s biting rate and/or in the entomological inoculation rate make the prevalence, as seen from a mosquito point of view, diverge among mosquito species even when all αi are identical.
Setting dYi/dt equal to 0, the equilibrium sporozoite rate is:
Thus sporozoite rate is an increasing function of ai, ci and Xmi and a decreasing function of μi and Ti.
Basic reproductive number (R0)The basic reproductive number (R0) for a disease is the expected number of secondary human infections derived from a single primary infection in an otherwise unin-fected population. This must be greater than 1 for the disease to persist indefinitely. If there are multiple vector species, it can be seen intuitively that the total number of secondary infections will be equal to the sum of the num-ber transmitted by each individual vector species. That is,
where R0,i represents the contribution of the ith species to the total R0 (see also [21]).
Two different expressions can be given for the individ-ual R0,i values. First, in terms of the fundamental underly-ing parameters [20],
Note that if all the parameters ai, bi, ci, Ti, μi and αiare equal between species, then a species’ proportionate con-tribution to R0 is equal to its proportionate contribution to the total number of mosquitoes, A =
∑ni=1 Ai. Alter-
natively, if lab data suggested, for example, that bi for one species was half that for another, then, all else being equal, the ratio of their R0′s will be half the ratio of their abundances.
An alternative expression can be derived using the entomological inoculation rate, which, as noted above, is ɛi = aiAiYi. Using Eq. (3) to substitute for Yi gives:
(2-I)Xmi = Xm = 1−(
1− X̄∗)1+α
(2-II)Xmi = 1−(
1− X̄∗)
·r
r + αibiεi
(3)Y ∗i =
aiciXmiθi
aiciXmi + µi
R0 =
n∑
i=1
R0,i
(4)R0,i =a2i biciθiAi
rµi(1+ αi)
which can be rearranged to give:
The terms in Eq. (4) corresponding to the right hand side of Eq. (5) can therefore be replaced by those on the left of (5), giving an expression for R0,i in terms of ɛi:
This expression assumes that the population is at equi-librium, and the underlying process is well described by the classical model. In the two cases studied, the species-specific basic reproductive number is thus:
If the propensity to be bitten is equal for all species (case I), and if a, b, c, and µ are the same among vector species, then a species’ proportionate contribution to total R0 is equal to its proportionate contribution to total entomological inoculation rate. In this case eliminating a species that contributes a proportion p of the total num-ber of infectious bites will reduce R0 to R0′ = R0(1−p). If that value is below 1, then the disease should be eliminated.
Further insight can be obtained by calculating for a particular vector species the ratio of entomological inoc-ulation rate to reproductive number:
[22], where Xm is as defined in Eqs. (2-I, 2-II). This ratio is increased by increases in X, r, and µ, and decreased by increases in a, c, b, and α. These parameters will vary from population to population according to the local ecology and malaria control interventions, but for illus-trative purposes if ‘exemplar’ values of X = 0.4, r = 0.01, a = 0.3, b = 0.5, c = 0.05, µ = 0.1, α = 4, (e.g., [5, 19, 23–26]) are used, and the result multiplied by 365 to convert to annual entomological inoculation rate, then a
εi =a2i ciθiAiXmi
aiciXmi + µi
(5)εi(
aiciXmi + µi
)
Xmi
= a2i ciθiAi
R0,i =εi
(
1+ aiµiciXmi
)
bi(1+ αi)
rXmi
(6-I)R0,i = εibi
r
(
aici
µi+
1
Xm
)
(1+ α)
(6-II)
R0, i = εibi
r
(
aici
µi
+1
Xmi
)
(1+ αi)
= εibi
r
(
aici
µi
+1+ αi
biεir
X̄∗ + αibiεir
)
(1+ αi)
(7-I)εi
R0,i=
rXm(
1+ aiµiciXm
)
bi(1+ α)

Page 4 of 7Deredec et al. Malar J (2016) 15:60
value of 1.2 is obtained. That is, in an area with multiple vector species and these parameter values, if one of the vectors has an annual entomological inoculation rate less than 1.2, then R0,i for that species will be less than 1 and it would not be able to maintain transmission by itself.
This simple relationship between R0,i and ɛi does not hold in case II, even if the distributions of the propensity to be bitten by the different vector species have identical variance. However it is still possible using Eq. (6-II) to derive the condition under which a species would be able to maintain transmission by itself. For the set of param-eters value given above, the entomological inoculation rate should exceed 0.78 for malaria to persist if all other mosquito species are eliminated.
ResultsTo illustrate the application of the multi-species model, a reanalysis was performed of the data presented in [19], a particularly extensive entomological and epidemiological survey of malaria in 30 villages in three Districts along the Indian Ocean coast of Kenya. In brief, malaria prevalence was estimated by a cross-sectional survey carried out at 30 primary schools, one per site, in May 1998. Blood smears were prepared from approximately 100 school children (aged 6–12 years) at each school. Mosquitoes were collected by pyrethrum spray catches (PSC) from inside 10 houses less than 2 km from each school. With few exceptions, the same houses were sampled once every two months from June 1997 to May 1998; collections occurred in the afternoons (noon to 3:00 p.m.). All mos-quitoes were identified based on morphological charac-ters, and mosquitoes in the Anopheles gambiae s.l. species complex were present at all 30 sites, while An. funestus was recovered from all but three sites. PCR identifications on a subsample of mosquitoes indicated that An. gambiae s.s. was the predominant member of the An. gambiae spe-cies complex in all villages except one, where An. arabi-ensis predominated. An. arabiensis was present in most villages, and An. merus in less than half. The heads and thoraces of all collected anophelines were tested for Plas-modium falciparum sporozoites using an enzyme-linked immunosorbent assay (ELISA). The entomological inocu-lation rate (ɛi) was calculated by multiplying the propor-tion of sporozoite-positive mosquitoes (Yi) by the human biting rate, which in turn was calculated as the number of blood-fed and half-gravid mosquitoes collected by PSC divided by the number of persons sleeping in the house the night preceding the collections. Further details are given in [19].
AnalysisFor simplicity only the model of equal propensities to be bitten (case I) will be considered here. Also, because
sporozoite rates were reported for the An. gambiae s.l. species complex as a whole rather than for the constitu-ent species, the analysis is restricted to a comparison of An. gambiae s.l. and An. funestus. As these are the only two vectors, the total R0 will be the sum of the R0′s through each of them. If the reported values for ɛi and X are used, and otherwise the ‘exemplar’ parameter values above, then the expected total R0 can be estimated from Eq. (6-I). According to this calculation, the average R0 across villages was 14, 15, and 25 in Malindi, Kilifi, and Kwale Districts, respectively (n = 10 villages in each). In terms of partitioning the total R0 between An. gambiae s.l. and An. funestus, all else being equal the ratio of R0′s will be equal to the ratio of entomological inoculation rates (Eq. 6-I). The ratio of average entomological inocu-lation rates across the villages was ε̄g/ε̄f = 48, 4.3, and 1.8 in the three districts (Table 1).
To investigate whether indeed ‘all else is equal’ between the two vector taxa, the simplest analysis is to test for dif-ferences in sporozoite rate. To do so while allowing for the variable sample sizes, the techniques of meta-analysis are used [27]. Fourteen villages were excluded from the analysis on account of no sporozoite-positive mosquitoes being found for one or both of the species (typically due to small sample sizes), and a random-effects model was used to analyse the log of relative risks from the remain-ing 16 villages. The analysis shows that the sporozoite rate of An. gambiae was e0.32 = 38 % higher than that of An. funestus (95 % CI 3–82 %), with no evidence of signif-icant heterogeneity among villages around this estimate (Q = 14, df = 15, p = 0.52; Fig. 1).
This difference in sporozoite rate between species sug-gests that at least one of the underlying parameters of Eq. (3) differs between the species: An. gambiae s.l. has a higher frequency of feeding on humans (a), a higher human-to-mosquito transmission rate (c), a lower adult mortality rate (µ), and/or a shorter incubation period in these populations (T). Alternatively, the structure of the model could be wrong, and, for example, An. gambiae s.l. feeds on people that have a higher prevalence than does An. funestus, or predominates at times of the year
Table 1 Summary statistics from [19]
Summary statistics for malaria prevalence and entomological inoculation rate from [19] plus estimated reproductive numbers calculated from Eq. (6-I), assuming r = 0.01, a = 0.3, b = 0.5, c = 0.05, µ = 0.1, and a = 4
District Prevalence (X) Entomological inoculation rate
Reproductive number
ɛg (da−1) ɛf (da−1) R0g R0f
Malindi 60.4 0.048 0.001 13.9 0.3
Kilifi 62.2 0.043 0.010 12.5 2.9
Kwale 64.3 0.056 0.032 16.2 9.3

Page 5 of 7Deredec et al. Malar J (2016) 15:60
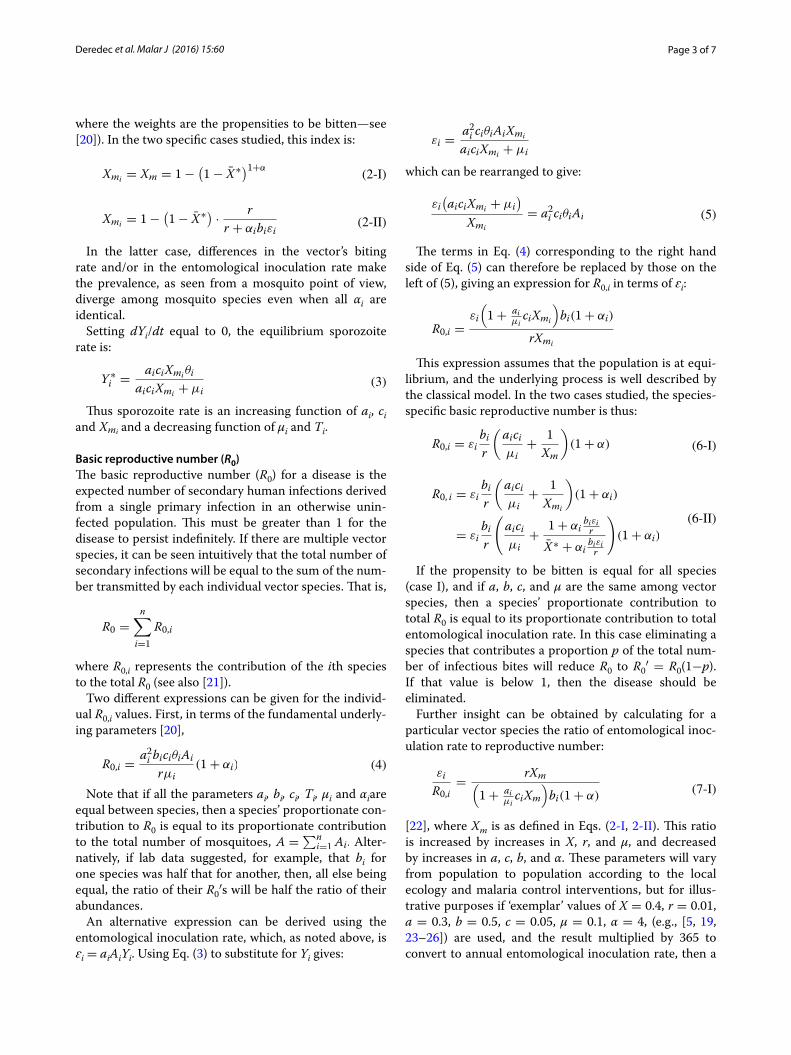
when prevalence is higher, but these alternatives will not be pursued here. To give an idea of what sorts of differ-ences could account for a 38 % difference in sporozoite rate, Eq. (3) is used, noting that the average prevalence was X̄∗ = 62.3 % , giving Xm = 0.99 (Eq. (2-I), assum-ing α = 4). For example, if An. gambiae s.l. has values of acg = 0.018da−1, µg = 0.1da−1 and Tg of 10da, giving an expected sporozoite rate of 5.6 %, equal to the observed average rate for this species, then the necessary decre-ment for An. funestus could be gotten by any one of the following changes: acf = 0.012da−1, µf = 0.118da−1 or Tf = 13da (for combinations of parameter values giving the requisite difference, see Fig. 2). The average preva-lence in the population as a whole is probably lower than that for school children [18], but virtually identical results are obtained if X̄∗ = 40 % . Differences between the species in c or T could be investigated in the labora-tory (for comparisons within the An. gambiae species complex, see [28–32], but for a or µ one would need to work in the field.
This difference in sporozoite rates suggests that bites by An. gambiae s.l. may contribute more to malaria
prevalence than bites by An. funestus. In principle, this effect could be detected in an analysis of the relationship between malaria prevalence and human biting rate by the two species. However, in this particular dataset there is no significant relationship between prevalence and bit-ing rate by either species, or total biting rate, presumably because the villages are past the point of saturation for malaria transmission.
What effect do the differences in ac, µ or T suggested by the sporozoite rate comparison have on the estimate of the ratio of R0′s? Using Eq. (6-I), if the above example values for acg and acf are used, then R0g/R0f = 1.05ɛg/ɛf. If the above values for µg and µf are used, then R0g/R0f = 1.02ɛg/ɛf. Finally, the incubation period T does not appear explicitly in Eq. (6-I) (its effect is wholly through ɛ and Xm), and, therefore, if the difference in sporozoite rates is due solely to differences in T, then R0g/R0f = ɛg/ɛf. In any of these cases the adjustment is small compared to other uncertainties in the estimation and analysis, and ɛg/ɛf is a reasonable estimate of R0g/R0f.
Finally, the average estimated R0 through An. gambiae s.l. was greater than 12 in each of the three districts,
Fig. 1 Forest plot of relative risk of Anopheles gambiae s.l. and Anopheles funestus being sporozoite positive across 16 villages in Eastern Kenya. Analysis performed using metafor [38]. Area of black squares represents the study’s weight in the meta‑analysis
Page 6 of 7Deredec et al. Malar J (2016) 15:60
indicating it should be able to maintain malaria trans-mission by itself (Table 1). R0 through An. funestus was smaller than through An. gambiae s.l., but still greater than 1 in Kilifi and Kwale, but only 0.3 in Malindi, sug-gesting that in this district it would be incapable of sup-porting transmission by itself, and elimination of An. gambiae s.l. would be sufficient to eliminate the disease. It is worth noting that these data were collected before the large-scale deployment of bed nets in the area. Mos-quito abundances and entomological inoculation rates are now very much lower [9] and, therefore, estimates of R0 would also be much lower.
ConclusionsIn many places malaria is transmitted by more than one vector species, and vector control interventions are likely to have different effects on the different species. To better understand the overall impact of an intervention in these circumstances, the classic Ross-McDonald model has been expanded to include multiple vector species. This model was then used to guide a re-analysis of a particu-larly extensive study in eastern Kenya. This re-analysis indicates that An. gambiae s.l. had a 38 % higher sporozo-ite rate than An. funestus in this area, and the model sug-gests this difference could be due to higher human biting rate or efficiency of parasite acquisition, or reduced death
rate or incubation period for the parasite. Differences between the taxa in transmission efficiencies or incuba-tion periods could be investigated in the laboratory, but for the other parameters one would need to work in the field.
The total reproductive number (R0) for malaria in a region will be the sum of the R0′s through the individual vector species. All else being equal, the relative contri-butions of the different vectors to total R0 will be equal to their relative contributions to the total entomologi-cal inoculation rate. Even in the Kenyan study where the differences in sporozoite rate indicated not all else was equal, this seems a good approximation. Further calcula-tions with this pre-bed net dataset suggest that An. gam-biae s.l. by itself would have been sufficient to maintain transmission throughout the region studied, but that in Malindi, An. funestus could not have maintained trans-mission by itself: elimination of An. gambiae s.l. would have led to elimination of the disease.
As the modelling is a straight-forward extension of the classic Ross-McDonald model, it shares the same advan-tages and disadvantages [33], and it would be interesting to address these questions in more fine-grained mod-els [34, 35]. In terms of the propensities to be bitten, two simple and opposing cases have been considered, where they are either equal or uncorrelated across spe-cies. A more general approach would allow unequal but correlated values, and several ways of constructing such multivariate gamma distributions have been developed in the past [36, 37]. The modelling has also assumed that there are no significant ecological interactions between the vector species (other than transmitting the same parasite), and the model could be extended to allow for competitive release, predator switching, or other such interaction. The real test, of course, will come with the deployment of genetic or other species-specific vector interventions, accompanied by careful field observations.
Authors’ contributionsAB and AD conceived and designed the study, and developed the model; SO compiled the literature and advised on anopheles biology; TH assisted with statistical analysis. All authors read and approved the final manuscript.
Author details1 Department of Life Sciences, Imperial College, Silwood Park, Ascot, London SL5 7 PY, UK. 2 Present Address: UMR BIOGER, INRA, AgroParisTech, Université Paris‑Saclay, 78850 Thiverval‑Grignon, France.
AcknowledgementsThis study was funded by a grant from the Foundation for the National Insti‑tutes of Health through the Vector‑Based Control of Transmission: Discovery Research (VCTR) programme of the Grand Challenges in Global Health initia‑tive of the Bill and Melinda Gates Foundation.
Competing interestsThe authors declare that they have no competing interests.
Fig. 2 Three dimensional contour plot showing combinations of acf, µf, and Tf for An. funestus that would give an expected log sporozoite rate 0.32 less than that for An. gambiae s.l., assuming the latter has values indicated by the red point (acg = 0.018da−1, µg = 0.1da−1 and Tg of 10da, which together give an expected sporozoite rate of 5.6 %, equal to the observed average rate for this species)

Page 7 of 7Deredec et al. Malar J (2016) 15:60
Received: 29 October 2015 Accepted: 18 January 2016
References 1. Anderson RM, May RM. Infectious diseases of humans. Oxford: Oxford
University Press; 1992. 2. Sinka ME, Bangs MJ, Manguin S, Coetzee M, Mbogo CM, Hemingway J,
et al. The dominant Anopheles vectors of human malaria in Africa, Europe and the Middle East: occurrence data, distribution maps and bionomic precis. Parasit Vectors. 2010;3:117. doi:10.1186/1756‑3305‑3‑117.
3. Sinka ME, Rubio‑Palis Y, Manguin S, Patil AP, Temperley WH, Gething PW, et al. The dominant Anopheles vectors of human malaria in the Americas: occurrence data, distribution maps and bionomic precis. Parasit Vectors. 2010;3:72. doi:10.1186/1756‑3305‑3‑72.
4. Sinka ME, Bangs MJ, Manguin S, Chareonviriyaphap T, Patil AP, Temper‑ley WH, et al. The dominant Anopheles vectors of human malaria in the Asia‑Pacific region: occurrence data, distributio899n maps and bionomic precis. Parasit Vectors. 2011;4:89. doi:10.1186/1756‑3305‑4‑89.
5. WHO. World malaria report 2014. Geneva: World Health Organization; 2014.
6. Gimnig JE, Kolczak MS, Hightower AW, Vulule JM, Schoute E, Kamau L, et al. Effect of permethrin‑treated bed nets on the spatial distribution of malaria vectors in western Kenya. Am J Trop Med Hyg. 2003;68:115–20.
7. Bayoh MN, Mathias DK, Odiere MR, Mutuku FM, Kamau L, Gimnig JE, et al. Anopheles gambiae: historical population decline associated with regional distribution of insecticide‑treated bed nets in western Nyanza Province, Kenya. Malar J. 2010;9:62. doi:10.1186/1475‑2875‑9‑62.
8. Russell TL, Lwetoijera DW, Maliti D, Chipwaza B, Kihonda J, Charlwood JD, et al. Impact of promoting longer‑lasting insecticide treatment of bed nets upon malaria transmission in a rural Tanzanian setting with pre‑existing high coverage of untreated nets. Malar J. 2010;9:187. doi:10.1186/1475‑2875‑9‑187.
9. Mutuku FM, King CH, Mungai P, Mbogo C, Mwangangi J, Muchiri EM, et al. Impact of insecticide‑treated bed nets on malaria trans‑mission indices on the south coast of Kenya. Malar J. 2011;10:356. doi:10.1186/1475‑2875‑10‑356.
10. Labbo R, Czeher C, Djibrila A, Arzika I, Jeanne I, Duchemin JB. Longi‑tudinal follow‑up of malaria transmission dynamics in two villages in a Sahelian area of Niger during a nationwide insecticide‑treated bednet distribution programme. Med Vet Entomol. 2012;26:386–95. doi:10.1111/j.1365‑2915.2012.01011.x.
11. Mwangangi JM, Mbogo CM, Orindi BO, Muturi EJ, Midega JT, Nzovu J, et al. Shifts in malaria vector species composition and transmis‑sion dynamics along the Kenyan coast over the past 20 years. Malar J. 2013;12:13. doi:10.1186/1475‑2875‑12‑13.
12. Deredec A, Godfray HCJ, Burt A. Requirements for effective malaria control with homing endonuclease genes. Proc Natl Acad Sci USA. 2011;108:E874–80. doi:10.1073/pnas.1110717108.
13. Burt A. Heritable strategies for controlling insect vectors of disease. Philos Trans R Soc B Biol Sci. 2014;369(1645):20130432. doi:10.1098/Rstb.2013.0432.
14. Reiner RC, Perkins TA, Barker CM, Niu TC, Chaves LF, Ellis AM, et al. A systematic review of mathematical models of mosquito‑borne pathogen transmission: 1970–2010. J R Soc Interface. 2013;10:20120921.
15. Smith DL, McKenzie FE. Statics and dynamics of malaria infection in Anopheles mosquitoes. Malar J. 2004;3:13. doi:10.1186/1475‑2875‑3‑13.
16. Smith DL, Battle KE, Hay SI, Barker CM, Scott TW, McKenzie FE. Ross, Macdonald, and a theory for the dynamics and control of mosquito‑transmitted pathogens. PLoS Pathog. 2012;8:e1002588. doi:10.1371/journal.ppat.1002588.
17. Smith DL, Dushoff J, Snow RW, Hay SI. The entomological inoculation rate and Plasmodium falciparum infection in African children. Nature. 2005;438:492–5. doi:10.1038/nature04024.
18. Smith DL, Guerra CA, Snow RW, Hay SI. Standardizing estimates of the Plasmodium falciparum parasite rate. Malar J. 2007;6:131. doi:10.1186/1475‑2875‑6‑131.
19. Mbogo CM, Mwangangi JM, Nzovu J, Gu W, Yan G, Gunter JT, et al. Spatial and temporal heterogeneity of Anopheles mosquitoes and Plasmodium falciparum transmission along the Kenyan coast. Am J Trop Med Hyg. 2003;68:734–42.
20. Smith DL, McKenzie FE, Snow RW, Hay SI. Revisiting the basic reproduc‑tive number for malaria and its implications for malaria control. PLoS Biol. 2007;5:e42. doi:10.1371/journal.pbio.0050042.
21. Lopez LF, Coutinho FAB, Burattini MN, Massad E. Threshold conditions for infection persistence in complex host‑vectors interactions. C R Biol. 2002;325:1073–84. doi:10.1016/S1631‑0691(02)01534‑2.
22. Smith DL, Drakeley CJ, Chiyaka C, Hay SI. A quantitative analysis of trans‑mission efficiency versus intensity for malaria. Nat Commun. 2010;1:108. doi:10.1038/Ncomms1107.
23. Kiszewski A, Mellinger A, Spielman A, Malaney P, Sachs SE, Sachs J. A global index representing the stability of malaria transmission. Am J Trop Med Hyg. 2004;70:486–98.
24. Killeen GF, Kihonda J, Lyimo E, Oketch FR, Kotas ME, Mathenge E, et al. Quantifying behavioural interactions between humans and mosqui‑toes: evaluating the protective efficacy of insecticidal nets against malaria transmission in rural Tanzania. BMC Infect Dis. 2006;6:161. doi:10.1186/1471‑2334‑6‑161.
25. Sama W, Owusu‑Agyei S, Felger I, Dietz K, Smith T. Age and seasonal vari‑ation in the transition rates and detectability of Plasmodium falciparum malaria. Parasitology. 2006;132:13–21. doi:10.1017/S0031182005008607.
26. Bousema T, Griffin JT, Sauerwein RW, Smith DL, Churcher TS, Takken W, et al. Hitting hotspots: spatial targeting of malaria for control and elimina‑tion. PLoS Med. 2012;9:e1001165.
27. Borenstein M. Introduction to meta‑analysis. Chichester: John Wiley and Sons; 2009.
28. Ndiath MO, Cohuet A, Gaye A, Konate L, Mazenot C, Faye O, et al. Comparative susceptibility to Plasmodium falciparum of the molecular forms M and S of Anopheles gambiae and Anopheles arabiensis. Malar J. 2011;10:269. doi:10.1186/1475‑2875‑10‑269.
29. Ndiath MO, Cailleau A, Diedhiou SM, Gaye A, Boudin C, Richard V, et al. Effects of the kdr resistance mutation on the susceptibility of wild Anopheles gambiae populations to Plasmodium falciparum: a hindrance for vector control. Malar J. 2014;13:340. doi:10.1186/1475‑2875‑13‑340.
30. Fryxell RTT, Nieman CC, Fofana A, Lee Y, Traore SF, Cornel AJ, et al. Differential Plasmodium falciparum infection of Anopheles gambiae s.s. molecular and chromosomal forms in Mali. Malar J. 2012;11:133. doi:10.1186/1475‑2875‑11‑133.
31. Boissiere A, Gimonneau G, Tchioffo MT, Abate L, Bayibeki A, Awono‑Ambene PH, et al. Application of a qPCR assay in the investigation of susceptibility to malaria infection of the M and S molecular forms of An. gambiae s.s. in Cameroon. PLoS One. 2013;8:e54820. doi:10.1371/journal.pone.0054820.
32. Gneme A, Guelbeogo WM, Riehle MM, Sanou A, Traore A, Zongo S, et al. Equivalent susceptibility of Anopheles gambiae M and S molecular forms and Anopheles arabiensis to Plasmodium falciparum infection in Burkina Faso. Malar J. 2013;12:204. doi:10.1186/1475‑2875‑12‑204.
33. Smith DL, Perkins TA, Reiner RC, Barker CM, Niu TC, Chaves LF, et al. Recasting the theory of mosquito‑borne pathogen transmission dynam‑ics and control. Trans R Soc Trop Med Hyg. 2014;108:185–97. doi:10.1093/trstmh/tru026.
34. Eckhoff PA. A malaria transmission‑directed model of mosquito life cycle and ecology. Malar J. 2011;10:303. doi:10.1186/1475‑2875‑10‑303.
35. North A, Burt A, Godfray HCJ. Modelling the spatial spread of a homing endonuclease gene in a mosquito population. J Appl Ecol. 2013;50:1216–25. doi:10.1111/1365‑2664.12133.
36. Mathai AM, Moschopoulos PG. On a multivariate gamma. J Multivar Anal. 1991;39:135–53.
37. Chatelain, F. Lois Gamma multivariées pour le traitement d’images radar. (Multivariate Gamma based distributions for RADAR imaging) Ph.D. Thesis. 2007, Institut National Polytechnique de Toulouse.
38. Viechtbauer W. Conducting meta‑analyses in R with the metafor package. J Stat Softw. 2010;36:1–48.