particulate organic matter: molecular composition and
TRANSCRIPT
Particulate Organic Matter: Molecular Composition and Processing Studies
with a Novel Impaction-Chemical Ionization Mass Spectrometry Method
Laxminarasimha Reddy Yatavelli
A thesis
submitted in partial fulfillment of the
requirements for the degree of
Master of Science
University of Washington
2008
Program Authorized to Offer Degree:
Department of Atmospheric Sciences


University of Washington
Graduate School
This is to certify that I have examined this copy of a master’s thesis by
Laxminarasimha Reddy Yatavelli
and have found that it is complete and satisfactory in all respects,
and that any and all revisions required by the final
examining committee have been made.
Committee members:
_____________________________________
Dean A. Hegg
_____________________________________
Lyatt Jaeglé
_____________________________________
Becky Alexander
_____________________________________
Joel A. Thornton
Date: __________________


In presenting this thesis in partial fulfillment of the requirements for a master’s degree at
the University of Washington, I agree that the Library shall make its copies freely
available for inspection. I further agree that extensive copying of this thesis is allowable
only for scholarly purposes, consistent with “fair use” as prescribed in the U.S. Copyright
Law. Any other reproduction for any purposes or by any means shall not be allowed
without my written permission.
Signature: __________________________
Date: ______________________________

University of Washington
Abstract
Particulate Organic Matter: Molecular Composition and Processing Studies with a Novel Impaction-Chemical Ionization Mass Spectrometry Method
Laxminarasimha Reddy Yatavelli
Chair of the Supervisory Committee: Assistant Professor Joel A. Thornton Department of Atmospheric Sciences
Organic matter is an important constituent of fine particles and can affect the
chemical and physical properties of aerosols. Understanding its composition and
processing in the atmosphere at the molecular-level is required for constraining its
sources and sinks. This thesis describes a combination of laboratory-based, fundamental
process studies, and analytical technique development aimed at improving our molecular-
level understanding of particulate organic material.
The heterogeneous loss of pure palmitic acid (PA) aerosol particles by OH
radicals is investigated using a continuous-flow heated inlet chemical ionization mass
spectrometer (CIMS). The experiments were performed as a function of OH exposure
and particle size. This heterogeneous reactive system is well represented by a model
consisting three main processes: a) surface-only reactions between PA and OH, b)
secondary chemistry between unreacted PA and oxidation products (or hydroperoxide
chemistry at the surface), and c) a surface renewal process. The model calculates aerosol
size changes online as a function of OH exposure to quantify mass loss by volatilization.
The uptake of OH radicals on palmitic acid particles was found to be very efficient with OHγ between 0.8 and 1. This result along with the data on particle size change and
observation of volatile oxidation products supports the idea that the heterogeneous
oxidation of aliphatic material can be a source of oxidized volatile organic compounds
(OVOCs) to the atmosphere but this source is likely much smaller than previous

estimates and volatilization cannot compete with wet-deposition as a major loss process
for particulate organic matter.
The development and testing of a new technique, that couples a micro-orifice
volatilization impactor (MOVI) to a CIMS is also described herein. The goal for this
technique is to characterize both the gas and condensed-phase molecular composition of
an organic aerosol mixture. Both, a large pressure drop impactor (LPI) and a small
pressure drop impactor (SPI) are described. Results from collection efficiency tests have
revealed that SPI behaves as predicted by inertial impaction theory with an experimental
cut-point of 0.130 μm. Preliminary tests along with results from an application to
ozonolysis of oleic acid particles are presented. The reaction probability, 3Oγ , was
inferred to be (8.0±3)x10-4 and (8.0±3) x10-4, for LPI and SPI respectively, by fitting the
experimental data to the heterogeneous surface-chemistry model, similar to that reported
by various studies. These results suggest this technique will provide reliable kinetic and
product information as well as gas-particle partitioning data in future laboratory and
chamber experiments.

TABLE OF CONTENTS
Page
List of Figures .................................................................................................................... iii
1: Introduction......................................................................................................................1
1.1 Particulate Organic Matter.................................................................................1
1.2 In-situ Measurement Techniques.......................................................................3
1.3 Thesis Outline ....................................................................................................6
2. Experimental Methods .....................................................................................................7
2.1 Chemical Ionization Mass Spectrometry ...........................................................7
2.2 Ion Chemistry Description...............................................................................10
3. The Heterogeneous OH Oxidation of Palmitic Acid Aerosol as a Proxy for Saturated Particulate Organic Matter Aging in the Atmosphere .................................................13
3.1 Introduction......................................................................................................13
3.1.1 Heterogeneous Oxidation of Particulate Organic Matter..................13
3.1.2 Reaction Mechanism.........................................................................15
3.1.3 The Reaction Probability,γ ..............................................................17
3.1.4 Outline...............................................................................................18
3.2 Experimental Section .......................................................................................19
3.2.1 Aerosol Generation and Characterization.........................................20
3.2.2 OH Production and Quantification ...................................................21
3.2.3 CIMS Detection Method...................................................................23
3.3 Results..............................................................................................................26
3.3.1 Kinetics of Heterogeneous Oxidation...............................................26
3.3.2 Palmitic Acid Oxidation Products ....................................................29
3.4 Discussion and Analysis ..................................................................................31
3.4.1 Reaction Mechanism.........................................................................31
3.4.2 Model ................................................................................................32
i
ii
3.4.3 Comparison of Model and Data........................................................35
3.4.4 Hydroperoxide Photochemistry as a Secondary Chemistry Mechanism........................................................................................37
3.5 Conclusions and Atmospheric Implications ....................................................40
4. In-situ Measurement of Particulate Organic Matter Using Micro-Orifice Volatilization Impactor Coupled to a Chemical Ionization Mass Spectrometer (MOVI-CIMS).......42
4.1 Introduction......................................................................................................42
4.1.1 Inertial Impaction..............................................................................42
4.1.2 Aerosol Volatilization by Thermal Desorption.................................47
4.2 Impactor Designs .............................................................................................49
4.2.1 Large Pressure Drop Impactor (LPI) ................................................49
4.2.2 Small Pressure Drop Impactor (SPI).................................................52
4.3 Initial Performance...........................................................................................54
4.2.1 Micro-Orifice Volatilization Impactor..............................................54
4.2.2 Linearity and Sensitivity ...................................................................57
4.3.3 Particle Collection Efficiency ...........................................................59
4.4 Application to laboratory Studies of Heterogeneous Oxidation ......................61
4.4.1 Ozonolysis of Unsaturated Organic Aerosol Particles......................62
4.4.2 OH Oxidation of Palmitic Acid Aerosol Particles............................69
4.4 Conclusions and Future Work .........................................................................71
References..........................................................................................................................74
Appendix A........................................................................................................................88
iii
LIST OF FIGURES
Figure Number Page
2.1 Schematic of the laboratory CIMS ................................................................................8
3.1 Proposed reaction mechanism for the OH oxidation of alkane surfaces .....................16
3.2 Chemical structure of Palmitic acid (C16H32O2) ..........................................................19
3.3 Schematic of the experimental setup for OH oxidation of Palmitic acid aerosol particles ........................................................................................................................20
3.4 OH calculated from the photochemical model (line) compared to that inferred from monitoring the decay of SO2 from its reaction with OH (circles)....................23
3.5 Change in m/z 383 ion corresponding to I-.Palmitic acid cluster................................25
3.6 Relative loss of PA as a function of OH exposure.......................................................27
3.7 Relative change is aerosol size as a function of OH exposure ....................................28
3.8 Difference spectrum showing products (mainly carboxylic acids due to the detection method used) from OH oxidation of PA aerosol particles ...........................30
3.9 Plot showing the evolution of two condensed-phase products: PA + 14 amu, and PA + 16 amu ......................................................................................................31
4.1 Principle of operation of an Inertial Impactor..............................................................43
4.2 Schematic of the Large Pressure Drop Impactor (LPI) ...............................................50
4.3 Schematic of the Small Pressure Drop Impactor (SPI)................................................53
4.4 Pressure drop across the nozzles as a function of sample flow rate for the SPI ..........54
4.5 Schematic of the MOVI process ..................................................................................55
4.6 Gas-phase (100amu) and condensed-phase (270amu, PA + 14amu) products observed during heterogeneous OH oxidation of Palmitic acid using MOVI-CIMS.........................................................................................................................56
4.7 Condensed-phase products observed during ozonolysis of oleic acid.........................57
4.8 Time series of Palmitic acid aerosol obtained using the LPI.......................................58
4.9 Calibration curve for the LPI using Palmitic acid .......................................................58
4.10 Schematic of the flow setup for collection efficiency test of the SPI........................59
4.11 Collection efficiency curves for oleic acid and palmitic acid aerosol particles.........60
4.12 Chemical structure of Oleic acid (C18H34O2).............................................................62
4.13 Schematic of the experimental setup used for oleic acid ozonolysis experiments ....63
iv
4.14 Oleic acid decay as a function of ozone exposure obtained using the LPI................66
4.15 Oleic acid decay as a function of ozone exposure obtained using the SPI ................67
4.16 Products from oleic acid ozonolysis in condensed-phase obtained using the SPI.............................................................................................................................69
4.17 Relative loss of palmitic acid as a function of OH exposure obtained using the LPI.......................................................................................................................70
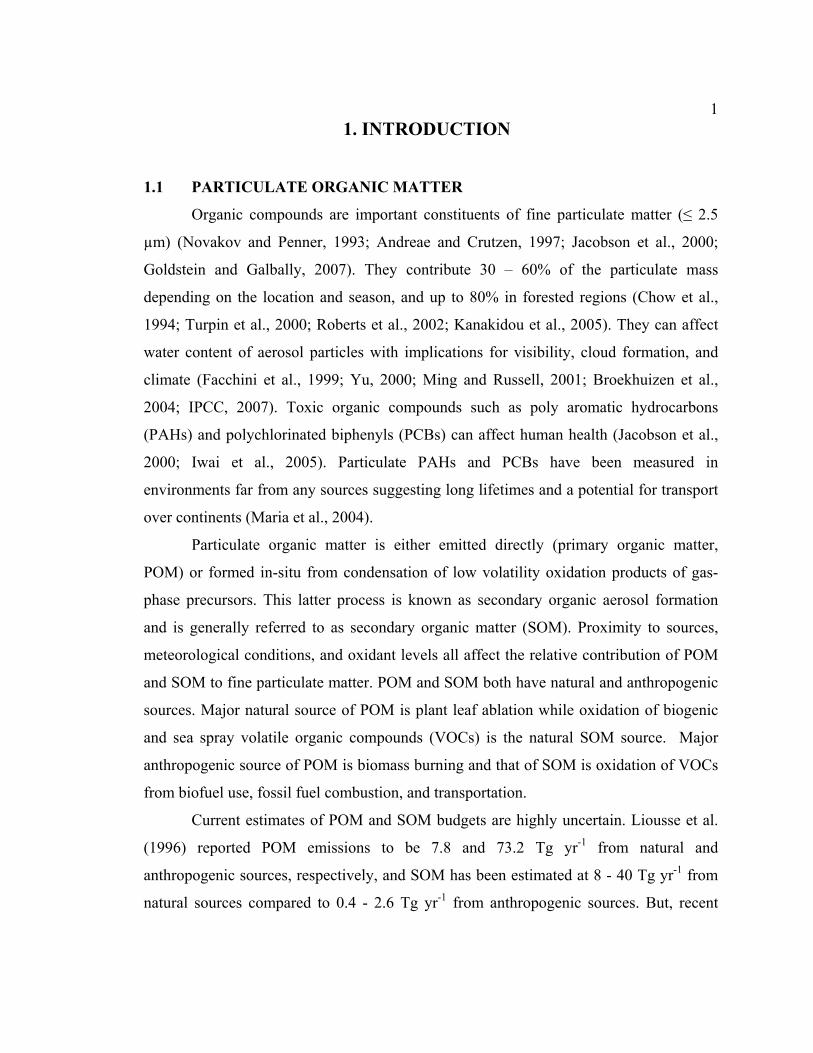
11. INTRODUCTION
1.1 PARTICULATE ORGANIC MATTER
Organic compounds are important constituents of fine particulate matter (≤ 2.5
µm) (Novakov and Penner, 1993; Andreae and Crutzen, 1997; Jacobson et al., 2000;
Goldstein and Galbally, 2007). They contribute 30 – 60% of the particulate mass
depending on the location and season, and up to 80% in forested regions (Chow et al.,
1994; Turpin et al., 2000; Roberts et al., 2002; Kanakidou et al., 2005). They can affect
water content of aerosol particles with implications for visibility, cloud formation, and
climate (Facchini et al., 1999; Yu, 2000; Ming and Russell, 2001; Broekhuizen et al.,
2004; IPCC, 2007). Toxic organic compounds such as poly aromatic hydrocarbons
(PAHs) and polychlorinated biphenyls (PCBs) can affect human health (Jacobson et al.,
2000; Iwai et al., 2005). Particulate PAHs and PCBs have been measured in
environments far from any sources suggesting long lifetimes and a potential for transport
over continents (Maria et al., 2004).
Particulate organic matter is either emitted directly (primary organic matter,
POM) or formed in-situ from condensation of low volatility oxidation products of gas-
phase precursors. This latter process is known as secondary organic aerosol formation
and is generally referred to as secondary organic matter (SOM). Proximity to sources,
meteorological conditions, and oxidant levels all affect the relative contribution of POM
and SOM to fine particulate matter. POM and SOM both have natural and anthropogenic
sources. Major natural source of POM is plant leaf ablation while oxidation of biogenic
and sea spray volatile organic compounds (VOCs) is the natural SOM source. Major
anthropogenic source of POM is biomass burning and that of SOM is oxidation of VOCs
from biofuel use, fossil fuel combustion, and transportation.
Current estimates of POM and SOM budgets are highly uncertain. Liousse et al.
(1996) reported POM emissions to be 7.8 and 73.2 Tg yr-1 from natural and
anthropogenic sources, respectively, and SOM has been estimated at 8 - 40 Tg yr-1 from
natural sources compared to 0.4 - 2.6 Tg yr-1 from anthropogenic sources. But, recent
2 observations suggest that we greatly underestimate SOM production (Heald et al., 2005;
Heald et al., 2006; Johnson et al., 2006; Volkamer et al., 2006; Weber, 2007; de Gouw,
2008). Volkamer et al. (2006) and Henze et al. (2008) suggested that SOM from
anthropogenic sources can be as large as 3 - 25 Tg yr-1 and 2 – 12 Tg yr-1, and Kanakidou
et al. (2005) estimated SOM from biogenic sources to be 61 – 79 Tg yr-1. Rather than a
bottom-up estimate relying on initial SOM yields from smog-chamber studies, Goldstein
and Galbally (2007) calculated a global SOM burden using a top-down approach based
on four independent methods: a) global VOC mass balance, b) SOM removal pathways,
c) comparison with sulfate budget, and d) observed global mean SOM vertical
distributions. Using these approaches they calculated SOM to be 510-910 Tg C yr-1, 225-
575 Tg C yr-1, 140-540 Tg C yr-1, and 223-615 Tg C yr-1, respectively. If these estimates
are utilized rather than that calculated from smog-chamber experiments, SOM will have a
larger effect on the radiation budget than presently predicted by the models. Clearly, our
understanding of the source strengths, and burden of POM and SOM is still far from
complete (Fuzzi et al., 2006).
Over the past decade numerous studies have focused on understanding SOM
formation and composition in smog chambers and laboratory environments (Takekawa et
al., 2003; Claeys et al., 2004; Iinuma et al., 2004; Bahreini et al., 2005; Donahue et al.,
2006; Kroll et al., 2007; Shilling et al., 2008). Empirical models have been developed to
describe the formation of SOM in these experiments (Odum et al., 1996; Pankow et al.,
2001; Griffin et al., 2005; Donahue et al., 2006; Chan et al., 2007; Olcese et al., 2007;
Pun and Seigneur, 2007). These models typically assume that each parent compound
produces two condensable products. Yields and partitioning coefficients for these
condensable products are obtained for each parent compound from a set of experiments.
These parameters have recently been incorporated into state-of-the-art chemical transport
models to predict regional and global SOM burdens (Kanakidou et al., 2005; Johnson et
al., 2006; Henze et al., 2008). But organic mass predicted by these models using the best
estimates is still underestimated (Heald et al., 2006; Johnson et al., 2006).
Apart from uncertainties in POM and SOM sources, a lack of understanding of
their sinks and chemical transformation in the atmosphere is another major obstacle to
3improving measurement-model agreement. Once emitted, organic material is believed to
be removed primarily through wet deposition (rainout) on a time scale of 4 - 11 days
(Kanakidou et al., 2005). Dry deposition is thought to be of less importance because of
small deposition velocities associated with the typical size range of particulate organic
mass (Seinfeld and Pandis, 1998). Another poorly studied loss process is in-situ oxidation
of organic material by oxidants such as OH, NO3, and O3 (Ellison et al., 1999; Molina et
al., 2004). Chapter 3 will discuss this issue in detail and provide results from my recent
laboratory experiments (McNeill et al., 2008).
The inability of models to reproduce particulate organic mass demonstrates that
either there are unknown sources, or the loss processes are not accurately parameterized,
or that the current formulations derived from smog chamber experiments are not
applicable to the atmosphere. A combination of all three possibilities is not out of the
question. Given that SOM mass yields depend on a large number of variables that span
large ranges in the atmosphere (NOx, T, actinic flux), it is likely we don’t yet have
adequate molecular-level understanding of the abundance and speciation of gas-phase
SOM precursors, and the processes which convert these precursors to SOM. Significant
uncertainties related to particle formation mechanisms, loss rates, and direct/indirect
effects persist due, in part, to a lack of an understanding of the species which make up
particulate organic matter. Answering these questions is important for ultimately
elucidating the impact of SOM on air quality and climate.
This problem has inspired whole new directions in organic aerosol research.
Included among these efforts is the present thesis. My research efforts to date are focused
on two areas: 1) heterogeneous oxidation of particulate organic matter by atmospheric
oxidants and its implications for tropospheric organic chemistry, and 2) developing an
aerosol mass spectrometric technique to investigate the molecular-level composition and
temporal variations of POM and SOM.
1.2 IN-SITU MEASUREMENT TECHNIQUES
Present methods to speciate particulate organic matter are complex, and require
lengthy derivatization and analysis procedures which tend to only identify 15 – 30% of
4 the aerosol mass (Rogge et al., 1993; Schauer et al., 2002; de Gouw, 2008). Techniques
that are capable of speciation and quantification are generally offline. Therefore they are
subject to matrix effects and/or require long sampling times, which limit our ability to
understand the changes in product composition with temperature, relative humidity, solar
radiation, oxidant concentrations, and NOx levels. Hence, there is a need for continuous
methods that can measure certain components of particulate organic matter, in-situ, with
sufficiently fast time response to elucidate variations associated with drivers of POM and
SOM, and thus better constrain atmospheric chemistry models.
Over the past decade numerous continuous and semi-continuous sampling and
analysis techniques have been developed to investigate ambient aerosol particle
composition. Techniques so far developed generally use either a gas chromatography
(GC) column (Williams et al., 2006; Goldstein et al., 2008), quadrupole (Tobias and
Ziemann, 1999; Hearn and Smith, 2004a), time-of-flight (Noble and Prather, 1996), or a
quadrupole ion trap (Reilly et al., 1997) coupled to a mass spectrometer for real-time
particle analysis. Nobel and Prather (1996) developed an aerosol time-of-flight mass
spectrometer (ATOFMS) to obtain size-segregated single particle composition data.
Using this technique they were able to identify organic functional groups, elemental
carbon, metals, sulphate, nitrate and ammonium in a size-resolved manner. Tobias and
Ziemann (1999) used a temperature-programmed thermal desorption particle beam mass
spectrometer (TD-PBMS) for general separation and identification. The sample was first
pre-concentrated, then thermally desorbed and by using a temperature ramp rate of 1 oC
min-1 they achieved separation of compounds having a factor of 5 difference in vapour
pressure. Aerodyne aerosol mass spectrometer (AMS) is another instrument that is used
to identify components in fine aerosol particles (Jayne et al., 2000). More recently, Zhang
et al. (2005) developed a data analysis technique for the data collected using the AMS
and quantified mass concentrations of hydrocarbon-like and oxygenated organic aerosol
(HOA and OOA) with high time resolution. This instrument is now widely used to
understand POM and SOM distributions in urban and rural environments (Zhang, 2007)
though this method is not specific at the molecular-level.
5 One of the daunting challenges in this field is identification of specific
compounds from the complex mass spectra obtained. Gas chromatography coupled to a
mass spectrometer has been in use for offline analysis of aerosol samples collected on
filters for several decades. But recently, Williams et al. (2006) and Goldstein et al. (2008)
used GC/MS for in-situ analysis of ambient particulate organic matter. Similar to other
techniques they pre-concentrated the aerosol particles before thermal desorption.
Although this setup provides data at the compound level, quantification of highly
oxygenated and polar functional groups remains a challenge due to the inherent
limitations of chromatographic separation.
Thermal desorption followed by chemical ionization mass spectrometry (CIMS)
is another technique that has proven effective in analyzing complex organic aerosol
particles. This technique was first used by Hoffmann and his co-workers to detect low
vapour pressure products formed by reacting a biogenic hydrocarbon, α-pinene, with O3
(Hoffmann et al., 1998). More recently, Hearn and Smith (2004a; 2006) using a cold trap,
to concentrate particles, reported detection of non-volatile and semi-volatile organics
with various functionalities, such as alkanes, alkenes, alcohols, aldehydes, ketones, and
carboxylic acids. Most of these improvements are well-suited for laboratory studies, but
lack the ability to truly differentiate between gas and particle-phase compounds in a
dilute chamber or field experiments. One exception is the semi-continuous technique,
recently developed by Voisin et al. (2003), which couples CIMS to an electrostatic
precipitator for collection of sub-20nm aerosol particles. They report very low detection
limits for sulfate and ammonium but have not yet demonstrated its use for speciated
particulate organic matter. In addition, this instrument is designed to investigate aerosol
nucleation but not the accumulation mode aerosol particles (0.1μm<dp<1μm), which is
responsible for climate and health effects and where the majority of organic mass resides.
These existing analytical techniques certainly provide a wealth of information on
bulk and single particle compositions greatly improving our knowledge of particulate
organic matter. But other complementary methods are needed to fully acquire a
molecular-level understanding of the evolution of particulate organic matter, its
6 abundance, and speciation in the atmosphere. Chapter 4 is focused on the collection
technique that I developed to answer some of the questions raised above.
1.3 THESIS OUTLINE
The next 3 chapters describe my efforts to resolve some of the issues raised
above. Chapter 2 provides an overview of the laboratory CIMS setup and a brief
description of the ion-chemistry. Chapter 3 focuses on a study of the heterogeneous
oxidation of saturated organic matter and its implications on tropospheric chemistry.
Chapter 4 will describe the design development and characterization of a new aerosol
collection technique, called micro-orifice volatilization impactor (MOVI), for analysis of
particulate organic matter. Coupled to a CIMS, this technique can provide molecular
information on timescales of minutes to hours. Section 1 of chapter 4 is focused on
explaining the theory of inertial impaction. In section 4.2 I explain the design and
operation of two prototypes that have been tested using laboratory experiments. Section
4.3 will present tests conducted to evaluate the performance of the MOVI-CIMS.
Application to laboratory study of heterogeneous oxidation is discussed in section 4.4,
and finally in section 4.5 I discuss plans for future improvements to the design.
72. EXPERIMENTAL METHODS
2.1 CHEMICAL IONIZATION MASS SPECTROMETRY (CIMS)
Chemical Ionization (CI) is a technique which has found application in many
fields to measure inorganic and organic compounds (Jennings, 1979; Harrison, 1983;
Arnold and Hauck, 1985; Budzikiewicz, 1986; Viggiano, 1993; Huey et al., 1995; de
Gouw et al., 2003; Huey, 2006). The technique uses ion-molecule reactions to ionize
analyte molecules in a sample gas. The first step is conversion of a reagent gas to
selective reagent ions. In the second step, these reagent ions react with molecules of
interest in the sample gas. The low energy of chemical ionization produces ions with
minimal fragmentation, and thus these ions are characteristic of the parent molecules
making CIMS advantageous over other techniques, such as Electron Impact (EI). A
uniqueness of this technique is that its selectivity can be suited to the need by changing
the reagent ion used, making it possible to either detect many compounds (product
identification) or only specific compounds (mass quantification) (Harrison, 1983). It can
be very sensitive, and has a fast response limited ultimately by reaction time in the ion-
molecule region. Presently, there are very few techniques that can be used in-situ with
these capabilities to capture the temporal variability of organic species in ambient air.
Gaseous organic molecules have been detected using positive reagent ions such as
H3O+, O2+,and NO+, among which H3O+ is most widely used and is termed as proton-
transfer reaction mass spectrometry, PTR-MS (de Gouw et al., 2003). The dominant
ionization process is via transfer of a proton to species with a proton affinity greater than
H2O, which includes essentially all oxygenated VOCs (OVOCs). PTR-MS is quite
sensitive, but not very selective, making the mass spectra very challenging to interpret if
a complex mixture of organic matter is analyzed, which is generally the case for ambient
air. On the other hand, negative reagent ions can be very selective. Using negative ions
for specific organic compounds, appreciable sensitivity and selectivity can be achieved.
Commonly used negative ions are I − , 6SF − , 2O− , 3CO− , and this method is termed negative
ion chemical ionization mass spectrometry, NI-CIMS. In this present study I use NI-
8 CIMS (here-on referred to as only CIMS), with I − and 6SF − as reagent ions to
specifically detect organic acids in gas and condensed-phases. Further discussion on
negative ion chemistry is presented in the next section.
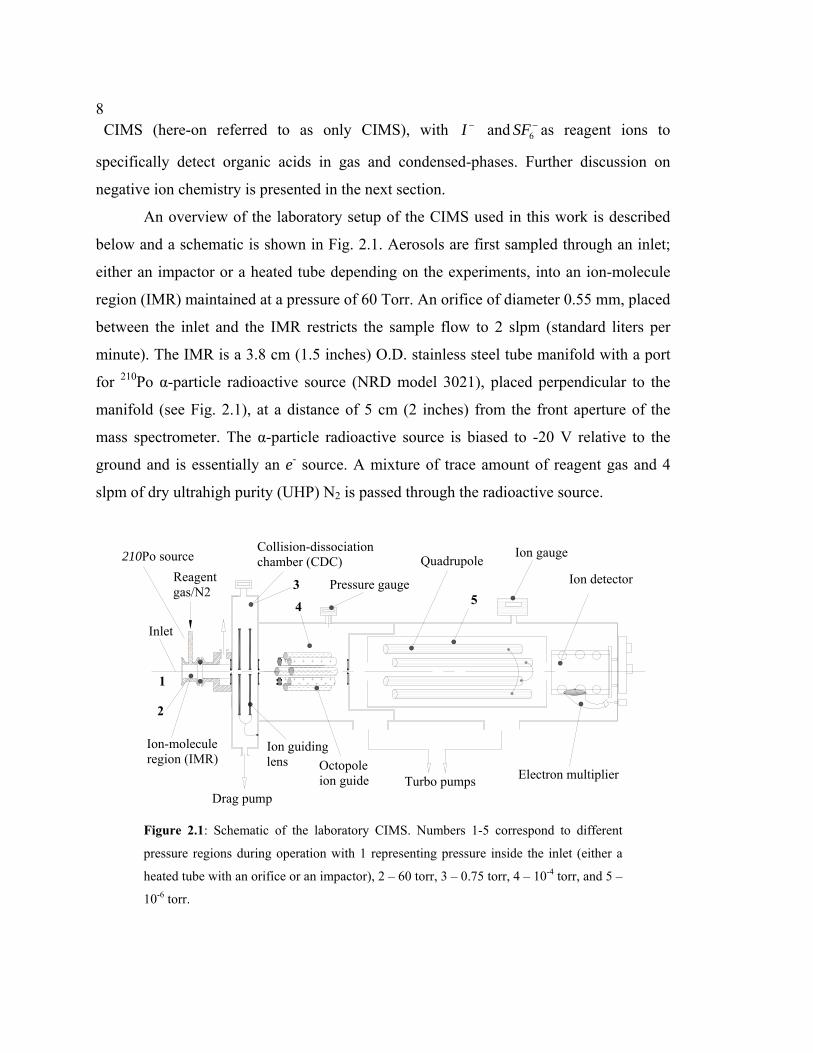
An overview of the laboratory setup of the CIMS used in this work is described
below and a schematic is shown in Fig. 2.1. Aerosols are first sampled through an inlet;
either an impactor or a heated tube depending on the experiments, into an ion-molecule
region (IMR) maintained at a pressure of 60 Torr. An orifice of diameter 0.55 mm, placed
between the inlet and the IMR restricts the sample flow to 2 slpm (standard liters per
minute). The IMR is a 3.8 cm (1.5 inches) O.D. stainless steel tube manifold with a port
for 210Po α-particle radioactive source (NRD model 3021), placed perpendicular to the
manifold (see Fig. 2.1), at a distance of 5 cm (2 inches) from the front aperture of the
mass spectrometer. The α-particle radioactive source is biased to -20 V relative to the
ground and is essentially an e- source. A mixture of trace amount of reagent gas and 4
slpm of dry ultrahigh purity (UHP) N2 is passed through the radioactive source.
Inlet
Ion-moleculeregion (IMR)
210Po sourceCollision-dissociation chamber (CDC)
Octopole ion guide
Pressure gauge
QuadrupoleReagent gas/N2
Turbo pumpsDrag pump
Ion gauge
Electron multiplier
Ion detector
Ion guiding lens
1
2
3
4 5
Figure 2.1: Schematic of the laboratory CIMS. Numbers 1-5 correspond to different
pressure regions during operation with 1 representing pressure inside the inlet (either a
heated tube with an orifice or an impactor), 2 – 60 torr, 3 – 0.75 torr, 4 – 10-4 torr, and 5 –
10-6 torr.
9
•
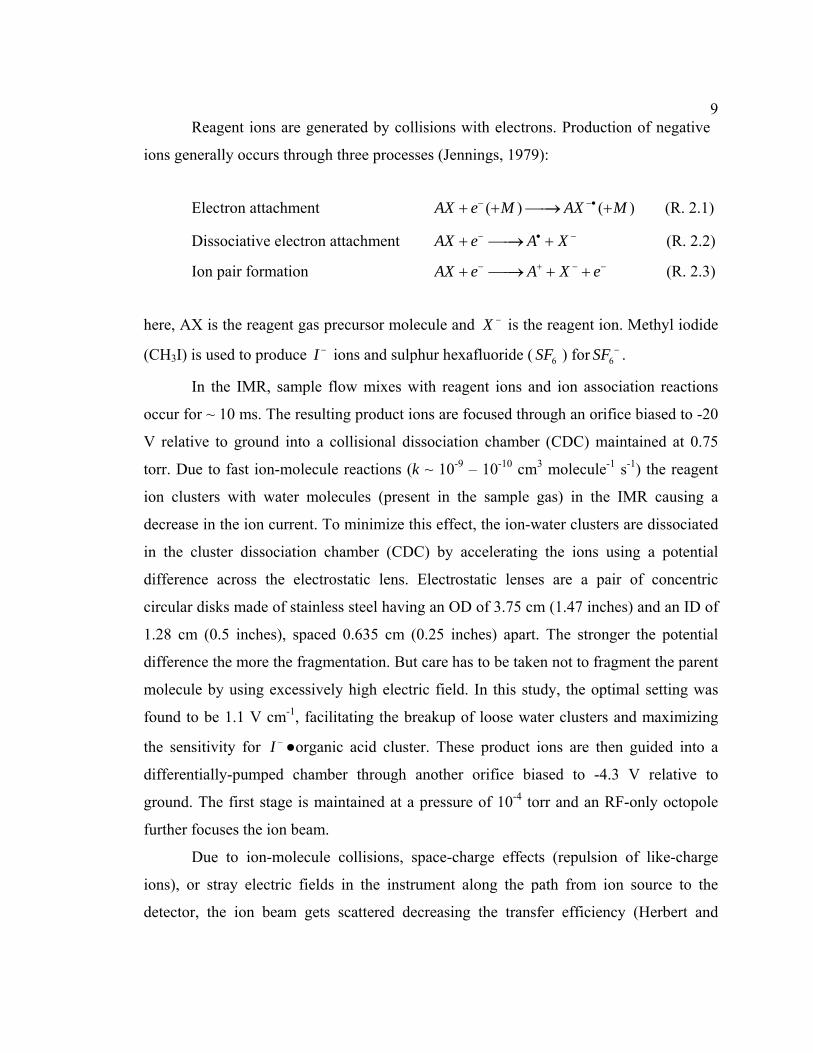
Reagent ions are generated by collisions with electrons. Production of negative
ions generally occurs through three processes (Jennings, 1979):
Electron attachment (R. 2.1) ( ) ( )AX e M AX M− −+ + ⎯⎯→ +
Dissociative electron attachment AX e A X− • −+ ⎯⎯→ + (R. 2.2)
Ion pair formation AX e A X e− + − −+ ⎯⎯→ + + (R. 2.3)
here, AX is the reagent gas precursor molecule and X − is the reagent ion. Methyl iodide
(CH3I) is used to produce I − ions and sulphur hexafluoride ( ) for . 6SF 6SF −
In the IMR, sample flow mixes with reagent ions and ion association reactions
occur for ~ 10 ms. The resulting product ions are focused through an orifice biased to -20
V relative to ground into a collisional dissociation chamber (CDC) maintained at 0.75
torr. Due to fast ion-molecule reactions (k ~ 10-9 – 10-10 cm3 molecule-1 s-1) the reagent
ion clusters with water molecules (present in the sample gas) in the IMR causing a
decrease in the ion current. To minimize this effect, the ion-water clusters are dissociated
in the cluster dissociation chamber (CDC) by accelerating the ions using a potential
difference across the electrostatic lens. Electrostatic lenses are a pair of concentric
circular disks made of stainless steel having an OD of 3.75 cm (1.47 inches) and an ID of
1.28 cm (0.5 inches), spaced 0.635 cm (0.25 inches) apart. The stronger the potential
difference the more the fragmentation. But care has to be taken not to fragment the parent
molecule by using excessively high electric field. In this study, the optimal setting was
found to be 1.1 V cm-1, facilitating the breakup of loose water clusters and maximizing
the sensitivity for I − ●organic acid cluster. These product ions are then guided into a
differentially-pumped chamber through another orifice biased to -4.3 V relative to
ground. The first stage is maintained at a pressure of 10-4 torr and an RF-only octopole
further focuses the ion beam.
Due to ion-molecule collisions, space-charge effects (repulsion of like-charge
ions), or stray electric fields in the instrument along the path from ion source to the
detector, the ion beam gets scattered decreasing the transfer efficiency (Herbert and
10 Johnstone, 2003). Therefore, to counteract these problems, active ion transmission
guides such as an octopole is used to re-focus the ion beam and keep them on track. The
octopole consists of 8 stainless steel cylindrical rods, 0.635 cm (0.25 inches) in diameter
and ~ 11.4 cm (4.5 inches) long, equally spaced on a 0.9 cm (0.35 inches) diameter circle
with neighboring poles connected to opposite phases. The RF-only power supply for the
octopole is custom built and operates at 200 V and 2 MHz.
Finally, ions are mass selected by a quadrupole (1.9 cm (0.75 inches) OD rods,
300 W, 1.2 MHz) and counted by an electron multiplier operated to detect negative ions
and maintained at 10-6 torr. An MTS 100 preamplifier converts pulses from the multiplier
into 0-5 v type true logic (TTL) signal, the frequency of which is measured by counter
chips on a National Instrument (NI) A/D board. The quadrupole, multiplier, preamp, and
static lens are controlled by Extrel Co. (Pittsburg, PA) power supplies. The mass
spectrometer is controlled by custom lab-view software, which also records and stores the
data.
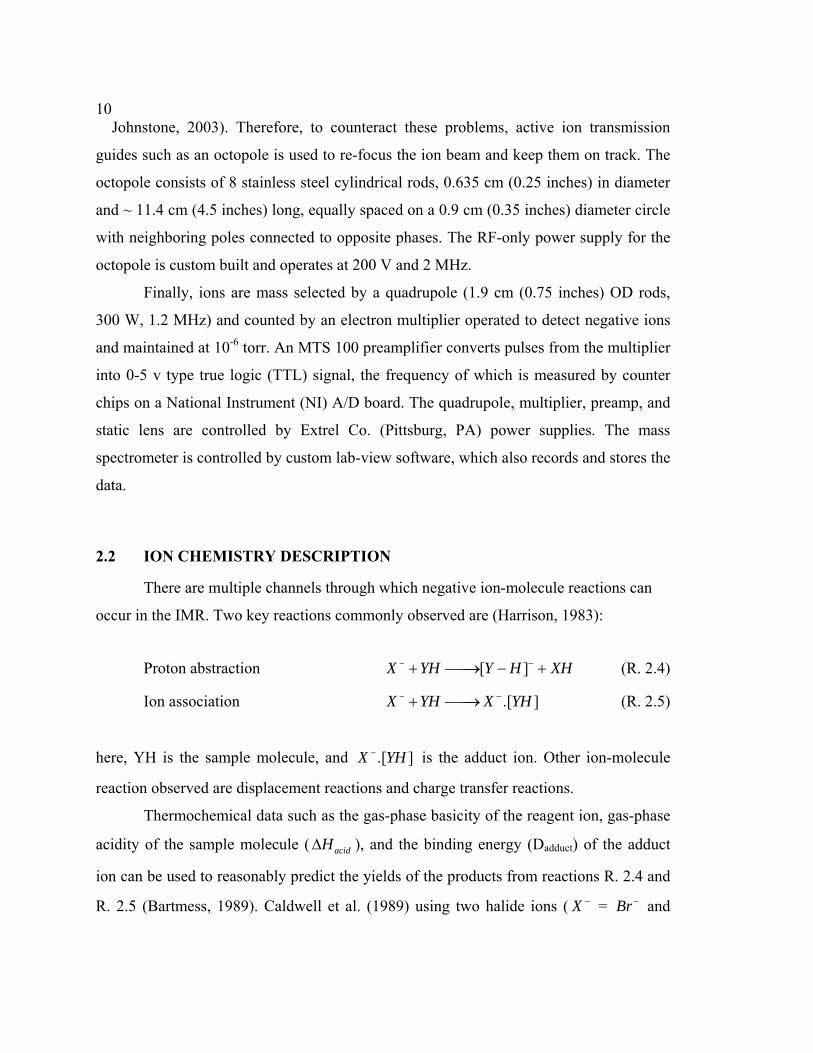
2.2 ION CHEMISTRY DESCRIPTION
There are multiple channels through which negative ion-molecule reactions can
occur in the IMR. Two key reactions commonly observed are (Harrison, 1983):
Proton abstraction [ ]X YH Y H XH− + ⎯⎯→ − +− (R. 2.4)
Ion association .[ ]X YH X YH− −+ ⎯⎯→ (R. 2.5)
here, YH is the sample molecule, and .[ ]X YH− is the adduct ion. Other ion-molecule
reaction observed are displacement reactions and charge transfer reactions.
Thermochemical data such as the gas-phase basicity of the reagent ion, gas-phase
acidity of the sample molecule ( ), and the binding energy (DacidHΔ adduct) of the adduct
ion can be used to reasonably predict the yields of the products from reactions R. 2.4 and
R. 2.5 (Bartmess, 1989). Caldwell et al. (1989) using two halide ions ( X − = Br− and
11I − ), showed that for weak acids (1674 KJ mol-1> acidHΔ >1464 KJ mol-1) the reaction
is very slow yielding no products, whereas for strong acids ( acidHΔ <1464 KJ mol-1) the
primary product is the adduct ion ( .[ ]X YH− ) with minor yields of [ because of
the increase of D
]Y H −−
adduct with the strength of the acid. They also noted that the proton
transfer increases with the exothermicity of the ion-molecule reactions. Thus, proton
transfer for various organic acids ( acidHΔ >1554 KJ mol-1) is exothermic for reactions
with ion where as reactions involving F − I − ion were endothermic, leading to the
formation of an adduct ion only.
In a similar study using dicarboxylic acids and 4 different halide ions ( X − = F − ,
, Cl− Br− and I − ), Vairmani and Saraswathi (1989) and Kumar et al. (2004) showed that
proton transfer reaction R. 2.4, is possible only when [ ]Y H −− ions can be stabilized by
hydrogen bonding (forming a stable cyclic structure) through a carboxylic hydrogen or a
hydroxylic hydrogen and where this is not possible the major product formed is the
adduct ion .[ ]X YH− . More recently, Veres et al. (2008) using CIMS and the acetate ion
( ), reported detecting carboxylic acids using proton abstraction. 3 ( )CH C O O−
The experiments reported here are either performed using I − or reagent ions,
both of which have been used before for chemical ionization and are reported to react
very fast (Huey et al., 1995). The reaction of carboxylic acids with
6SF −
I − proceeds through
ion association and that of 6SF − is through fluoride ( F − ) transfer
( ) . ( )I RC O OH I RC O OH− −+ ⎯⎯→ (R. 2.3)
6 ( ) . ( )SF RC O OH F RC O OH SF− −+ ⎯⎯→ 5+ (R. 2.4)
These reactions allow the detection of sample molecule with minimal
fragmentation at the parent mass plus 126.9 amu and 19 amu, for I − and 6SF − ,
respectively. Because of the decrease in Dadduct with halide ion radius (rion, F − < Cl− <

12 Br− < I − ), I − ions are much more selective than F − towards acids as opposed to
alcohols or aldehydes (Caldwell et al., 1989). In this study, this aspect is successfully
exploited to detect organic acids produced during aerosol oxidation experiments.
133. THE HETEREGENOUS OH OXIDATION OF PALMITC ACID
AEROSOL PARTICLES AS A PROXY FOR SATURATED
PARTICULATE ORGANIC MATTER AGING IN THE
ATMOSPHERE
3.1 INTRODUCTION
3.1.1 Heterogeneous oxidation of particulate organic matter
Organic matter is an important constituent of atmospheric aerosol particles which
play a major role in climate through their interaction with solar and terrestrial radiation
(Andreae and Crutzen, 1997; Kanakidou et al., 2005). What determines the light-
scattering and CCN formation ability is the aerosol’s physical and chemical properties
which can change with atmospheric aging (Ellison et al., 1999). Atmospheric aging
makes the particles more oxidized. As a result of that they become more hygroscopic and
this increases their probability of acting as CCN or wet-deposition. This particular issue
has been the focus recent studies trying to understand the heterogeneous oxidation of
organic aerosols and their transformation in the atmosphere (Rudich et al., 2007). While
it is accepted that the chemical composition of condensed organic species can be
significantly altered by heterogeneous reactions with oxidants such as OH, O3, NO3 and
halogens, major uncertainties remain with regard to the mechanism that should be
incorporated into global models and the extent to which such processing might be a sink
for particulate organic matter by volatilization of oxidation products.
Molina et al. (2004) reported efficient reaction of OH radicals with self-assembled
monolayers and organic surfaces, representative of alkane and aromatic aerosols in the
atmosphere. They observed a loss of 6 – 9 carbons per OH collision and concluded that
loss of organic aerosol due to oxidation is possible in 6 days, comparable to loss due to
wet-deposition. Also, the oxidized material volatilizes becoming a source of oxidized
VOCs (OVOCs) to the atmosphere. OVOCs are ubiquitous throughout the troposphere
and their photolysis can be a major source of HOx radicals in the upper troposphere

14 (Wennberg et al., 1998). Transport by convective systems is generally regarded as the
main source for these oxidized compounds (Jaegle et al., 1997). Ellison et al. (1999)
hypothesized that heterogeneous oxidation of particulate organic matter can also be a
source of the observed concentrations of aldehydes, ketones and peroxides.
The level of volatilization observed by Molina et al (2004) was used by Kwan et
al. (2006) to explain upper-tropospheric VOC observations made during INTEX-NA.
Based on the measurements of atmospheric oxidants and aerosol size distributions in the
free troposphere, they calculated a summer time OVOC flux due to OH oxidation to be as
large as 70 pptv C day-1, resulting in a global flux of carbon from organic aerosol
oxidation of ~ 150 Tg C yr-1, which can potentially be a major source in the upper
troposphere.
Recent laboratory studies offer conflicting evidence of aerosol mass loss by
volatilization initiated by heterogeneous oxidation (Docherty and Ziemann, 2006; Knopf
et al., 2006; George et al., 2007; Hearn et al., 2007a). For example, George et al. (2007)
reported observing only 17% decrease of particle volume due to volatilization at the
highest OH exposures (~ 2.2x10¹² molecules cm-3) even though OH reaction with liquid
Bis(2-ethylhexyl) sebacate (BES) aerosol particles was very efficient. Although these
results corroborates the idea that VOC production is possible, but the magnitude of such a
source is in doubt.
The physical state and morphology of the aerosol particles can affect the aging
process and be affected by aging (Knopf et al., 2006; George et al., 2007; Rudich et al.,
2007; Hearn et al., 2007a; Hearn and Smith, 2007b). Density changes have been observed
during oxidation of liquid aerosol particles (Kartib et al., 2005; George et al., 2007;
Hearn et al., 2007a) suggesting oxidative changes in chemical character of the aerosol
particles. Furthermore, Knopf et al. (2005) observed change in microstructure and slower
aging when multicomponent multiphase mixtures were exposed to O3, indicating the
importance of physical state of the particles. Thermodynamically, as the number of
components in the particle phase increase, solid particles should convert to more liquid-
like (Marcolli et al., 2004), but this has never been observed.
15More over, it is not yet clear how oxidative aging rates should be
parameterized, in part because, whether the reaction occurs in the bulk, at the surface or
in sub-surface layers is still an open question and whether secondary condensed phase
chemistry occurs remains uncertain. Some studies have observed bulk phase/sub-surface
reactions (Morris et al., 2002), whereas others have observed surface-only reactions for
the same aerosol-oxidant system (Hearn et al., 2005a). Also, diffusion of a gas-phase
oxidant will be slow in a solid, supercooled, or structured organic particle compared to
liquid particles (Hearn and Smith, 2005b), especially for OH, thereby limiting the
reaction to the particle surface or very-near surface region (Bertram et al., 2001; Worsnop
et al., 2002; Molina et al., 2004; George et al., 2007; Lambe et al., 2007).
Katrib et al. (2005) reported an increase in density and oxygen content with
continued O3 exposure of oleic acid (OA) particles, even after all OA was lost. They
suggested that this behavior indicated reaction of organic products with O3 or with
themselves. Similarly, Hearn et al., (2007a) in a recent study found very efficient Cl-
initiated oxidation of liquid BES particles and concluded that radical-assisted secondary
chemistry was occurring in the particles. In contrast, George et al., (2007) reported very
efficient OH oxidation of liquid BES particles but no secondary chemistry. These aspects
still require more attention.
3.1.2 Reaction Mechanism
The reaction mechanism for heterogeneous oxidation of saturated organic species
by OH radicals is similar to gas-phase alkane oxidation reviewed in detail by Atkinson et
al. (1997). The reaction scheme shown in Fig. 3.1 was proposed by Molina et al. (2004)
and is reproduced here for NOx free conditions.
The initial step in the heterogeneous oxidation of an alkane by OH radicals is the
abstraction of hydrogen (H) atom from the methyl group to form water and an alkyl
radical, R. The alkyl radical quickly reacts with oxygen in the atmosphere to form an
alkylperoxy radical, RO2. The RO2 radical has three main pathways through which it can
be lost: a) self reaction leading to formation of stable carbonyl and alcohol products, b)
self reaction resulting in two alkoxy radicals, RO, and O2, or c) reaction with the

16 hydroperoxy radical, HO2, to form organic hydroperoxides, ROOH. There are, in turn,
three different possible decomposition pathways for the RO radicals: a) isomerization
(1,5 H-shift) leading to formation of a hydroxyalkyl radical, R’OH, which can react with
O2 to form a hydroxyperoxy radical, b) reaction with O2 to form a stable carbonyl
compound and a HO2 radical, or c) decomposition through C-C bond scission producing
small molecular weight compounds (aldehydes and ketones) that are volatile and can
evaporate leading to mass loss (Tyndall et al., 2001). Except for RO decomposition, the
other two reaction pathways add functional groups, likely keeping them in the
condensed-phase, and increasing particle hygroscopicity and possibly CCN activity of the
aerosol (Molina et al., 2004).
R’OH (Isomerization)
R” + R’CHO (Bond scission)
RO2R”OH
+ R”R’C=O
RO2
RO O2
R”R’C=O +
HO2
RO2
HO2ROOH
OH
RH
H2O
R
O2
hν
Figure 3.1: Proposed reaction mechanism for OH oxidation of alkane surfaces (Adapted
from Molina et al. (2004))
17Molina et al. (2004) observed substantial volatilization and concluded that
production of volatile products due to carbon-carbon bond scission is the main fate of the
RO radical formed during the oxidation processes. Eliason et al. (2004) observed short
chain aldehydes and ketones in the condensed-phase only, and not in gas-phase, by
reacting OH with thin liquid films of hexadecane, concluding that RO2 to RO followed
by bond scission is not the major pathway. The importance of RO formation followed by
decomposition has also been questioned by observations that show preferential formation
of condensed-phase carbonyl and alcohol products (George et al., 2007; Lambe et al.,
2007; Hearn et al., 2007a). Knopf et al. (2006) exposed self assembled monolayers
(SAMs) of an alkane, and Docherty and Ziemann (2006) exposed alkenoic acid particles,
to NO3 radicals and observed formation of aldehydes, ketones, carboxylic acids, and
organic nitrates with < 10% volatilization. Based on this they concluded that carbonyl +
alcohol channel is the main pathway for RO2 radicals in condensed-phase.
3.1.3 The Reaction probability,γ
The reaction probability, or reactive uptake coefficient, is a key parameter
describing the efficiency of loss of a trace gas-phase oxidant (such as OH or O3) to the
surface of a particle. It is generally defined as (Ammann et al., 2003):
Number of collisions leading to loss of xTotal number of collision of x
xγ = (Eq. 3.1)
where, x is the gas-phase oxidant. Therefore, for efficient heterogeneous loss of x we
have xγ = 1. In general, xγ is considered to be a function of the rates of individual
processes that affect the uptake of x to the particle surface: gas-phase diffusion of x
( ), interfacial resistance to mass transport (termed as mass accommodation
coefficient, α), solubility (S, for liquid particles), chemical reactions (on the surface and
in the bulk, ), and the diffusion limited transport within the particle (
diffΓ
rxnΓdiff
pΓ ) (Worsnop
18 et al., 2002). Assuming the particle to be solid and the collision probability for x is 1 (α
= 1), we can write a simplified expression to calculate the true xγ as:
1 1 1x xtrue meas diffγ γ
= −Γ (Eq. 3.2)
In this study, the diffusion limitation is incorporated into the rate constant rather than
correcting for it later using Eq. 3.2.
Oxidation by OH is generally fast for many volatile organic compounds in gas-
phase (Atkinson, 1997). But, the reactions between OH and condensed-phase compounds
have only been studied over the past few years (Bertram et al., 2001; Molina et al., 2004;
George et al., 2007; Lambe et al., 2007). All of these studies have indicated that OH also
reacts efficiently on organic surfaces. Bertram et al. (2001) determined that the reaction
probability of OH ( OHγ ) on various bulk organic surfaces (monolayers, mixture of n-
alkanes, and methane-soot) is >0.1, with soot showing even higher reaction efficiency
(>0.5). Similarly, Molina et al. (2004) showed that OHγ >0.2 for films and monolayers of
various alkane and aromatic compounds. More recently, George et al. (2007), and Lambe
et al. (2007) measured OHγ ~ 1.
3.1.4 Outline
In this study I investigated the heterogeneous oxidation of saturated organic
aerosol particles by OH in a NOx free environment. My goal was to elucidate the reaction
mechanism by first starting with a simple one component aerosol rather than an aerosol
matrix, and a system without any NOx which is representative of remote regions, such as
over oceans. Although pure, single component aerosols do not exactly mimic the actual
atmosphere, this is a first step in understanding the processing of particulate organic
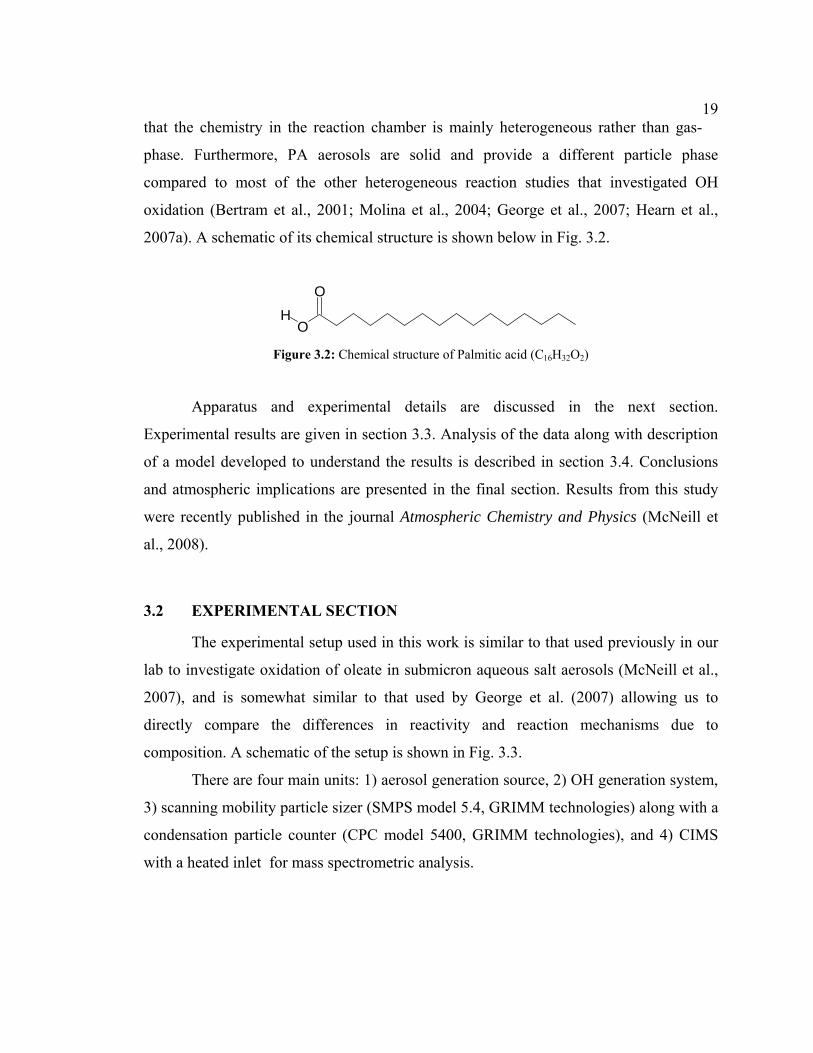
matter. Palmitic acid (PA, C16H32O2) was used as a proxy for saturated particulate
organic matter because its long alkyl chain can act as a surrogate of large hydrocarbons in
emissions (Rogge et al., 1991), and has also be previously used in laboratory
investigations (Bertram et al., 2001). It has a low vapor pressure giving us confidence
19that the chemistry in the reaction chamber is mainly heterogeneous rather than gas-
phase. Furthermore, PA aerosols are solid and provide a different particle phase
compared to most of the other heterogeneous reaction studies that investigated OH
oxidation (Bertram et al., 2001; Molina et al., 2004; George et al., 2007; Hearn et al.,
2007a). A schematic of its chemical structure is shown below in Fig. 3.2.
O
OH
Figure 3.2: Chemical structure of Palmitic acid (C16H32O2)
Apparatus and experimental details are discussed in the next section.
Experimental results are given in section 3.3. Analysis of the data along with description
of a model developed to understand the results is described in section 3.4. Conclusions
and atmospheric implications are presented in the final section. Results from this study
were recently published in the journal Atmospheric Chemistry and Physics (McNeill et
al., 2008).
3.2 EXPERIMENTAL SECTION
The experimental setup used in this work is similar to that used previously in our
lab to investigate oxidation of oleate in submicron aqueous salt aerosols (McNeill et al.,
2007), and is somewhat similar to that used by George et al. (2007) allowing us to
directly compare the differences in reactivity and reaction mechanisms due to
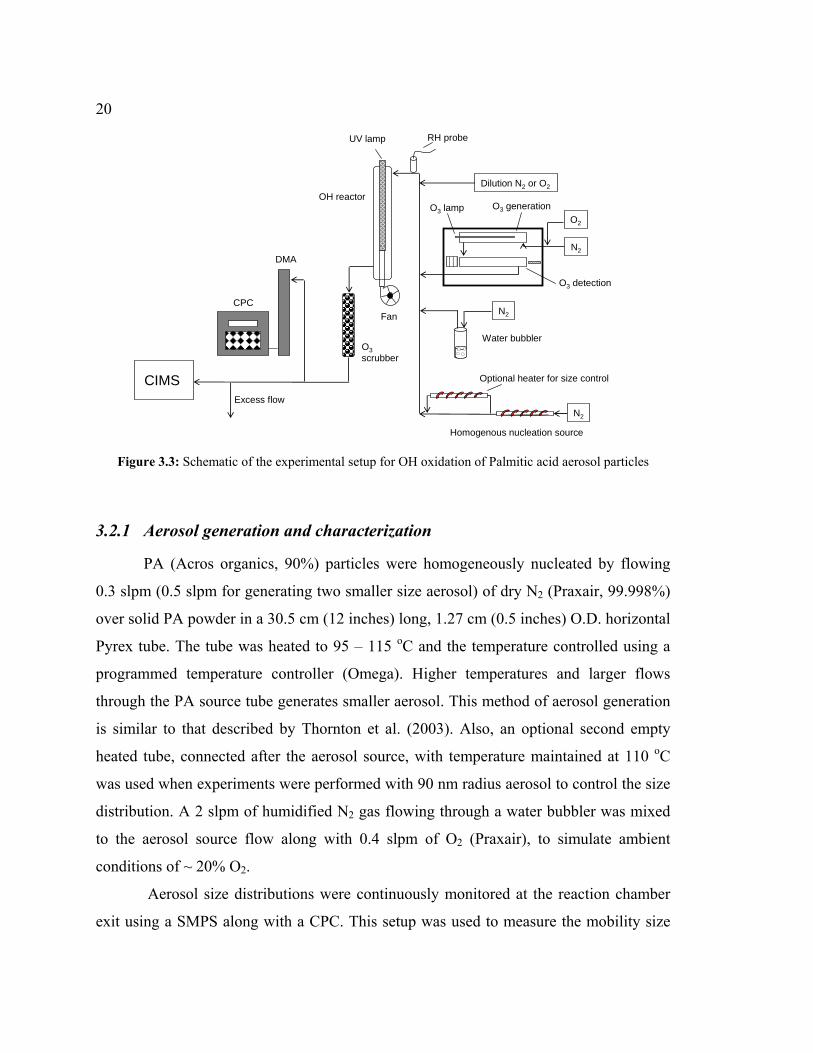
composition. A schematic of the setup is shown in Fig. 3.3.
There are four main units: 1) aerosol generation source, 2) OH generation system,
3) scanning mobility particle sizer (SMPS model 5.4, GRIMM technologies) along with a
condensation particle counter (CPC model 5400, GRIMM technologies), and 4) CIMS
with a heated inlet for mass spectrometric analysis.
20
N2
N2
N2
O2
Dilution N2 or O2
Fan
CIMS
O3scrubber
CPC
DMA
Water bubbler
Homogenous nucleation source
O3 detection
UV lamp
OH reactorO3 generationO3 lamp
RH probe
Optional heater for size control
Excess flow
Figure 3.3: Schematic of the experimental setup for OH oxidation of Palmitic acid aerosol particles
3.2.1 Aerosol generation and characterization
PA (Acros organics, 90%) particles were homogeneously nucleated by flowing
0.3 slpm (0.5 slpm for generating two smaller size aerosol) of dry N2 (Praxair, 99.998%)
over solid PA powder in a 30.5 cm (12 inches) long, 1.27 cm (0.5 inches) O.D. horizontal
Pyrex tube. The tube was heated to 95 – 115 oC and the temperature controlled using a
programmed temperature controller (Omega). Higher temperatures and larger flows
through the PA source tube generates smaller aerosol. This method of aerosol generation
is similar to that described by Thornton et al. (2003). Also, an optional second empty
heated tube, connected after the aerosol source, with temperature maintained at 110 oC
was used when experiments were performed with 90 nm radius aerosol to control the size
distribution. A 2 slpm of humidified N2 gas flowing through a water bubbler was mixed
to the aerosol source flow along with 0.4 slpm of O2 (Praxair), to simulate ambient
conditions of ~ 20% O2.
Aerosol size distributions were continuously monitored at the reaction chamber
exit using a SMPS along with a CPC. This setup was used to measure the mobility size
21change due to oxidation rather than that caused by wall losses during transfer of the
effluent. The aerosols were polydisperse with a mean volume weighted radii (rp) of 62 –
185 nm and a standard deviation, σg = 1.25. To characterize the PA source, since gradual
decrease in mass concentration was observed over a course of few hours and to see if
CIMS produced enough mass signals for the planned OH exposures, many experiments
were performed (data not shown here). These experiments helped optimize PA source
flow and temperatures to obtain enough mass and needed aerosol size distribution.
3.2.2 OH production and quantification
OH radicals were produced by photolysis of O3 at 254 nm in the presence of
water vapor. O3 was generated continuously by flowing a mixture of dry N2 and O2
through a cell containing a 185 nm Hg pen-ray lamp (UVP). At this wavelength,
2 ( 185 ) 2O h nm Oν+ < → (R. 3.1)
(R. 3.2) 2( )2
M NO O O+ ⎯⎯⎯→ 3
O3 concentration was monitored continuously by measuring its absorbance at 254 nm
before it was added to the aerosol flow. This was done by flowing the O3/N2/O2 mixture
into a UV absorbance cell, fitted with another Hg pen-ray lamp (Jelight) coated to
primarily emit 254 nm, a 254 nm interference filter, and a photodiode (Thorlabs). O3
concentration was controlled by changing the flows of N2 or O2. Finally, before the
mixed humidified aerosol/O3 flow was introduced into the reaction chamber (OH reactor)
its relative humidity (RH) was measured using a hygrometer (Vaisala). To maintain RH
at approximately 18 - 24%, excess N2 was added increasing the total volumetric flow to 2
slpm and a residence time of approximately 15 sec in the reaction chamber.
The reaction chamber is a quartz photocell ~ 25.4 cm (10 inches) long and 5 cm
(2 inches) in diameter with a 1 cm (0.39 inches) inner sleeve. It is maintained at 1 atm
and 25 oC and contains a 23.5 cm (9.25 inches) long ozone-free Hg pen-ray lamp
(Jelight) to photolyze O3. This lamp has a primary energy output of 254 nm and is cooled
continuously by purging it with room air. OH radicals are generated by the following
reactions,
22 2
13 ( 254 ) ( )O h nm O O Dν+ < → + (R. 3.3)
(R. 3.4) 12( ) 2O D H O OH+ →
OH concentrations in the reaction chamber were calculated by using a photochemical box
model. This model included ozone photolysis to yield O(1D) and its reaction with H2O to
produce OH, many HOx reactions, diffusion-limited loss of OH to the reaction chamber
walls, and the loss of OH on aerosols (reactions are listed in Appendix A). The
experimental inputs to the model are O3 and H2O concentrations in the reaction chamber.
O3 concentrations in the reaction chamber were calculated from its concentration at the
O3 detector and the flow dilution ratios. This model was compared to inferred OH
concentrations from calibration experiments performed by measuring the loss of SO2 in
the presence of OH. The rate constant used for the reaction of SO2 with OH is from
DeMore et al. (1997).
High concentration SO2 (50 ppm, Advanced Specialty Gases, NV) was first
diluted in N2, and then a small volume ~ 5 – 10 sccm, of this mixture was further diluted
by adding 1.4 – 1.6 slpm humidified N2 giving a concentration of 4.5 – 7.5x10¹²
molecules cm-3 SO2 in the reaction chamber. Note that SO2 was only used for OH
calibration, it was absent during actual experiments. CIMS with 6SF − as the reagent ion
was used to monitor the decay of SO2 as a function of OH exposure. Reactions between
the ion and SO6SF −2 are fast, k = 1x10⁻⁹ cm3 molecule-1 s-1 (Huey et al., 1995), giving us
an ion peak at m/z 83 corresponding to 2FSO− . The change in this ion signal was
monitored to infer the loss of SO2. A series of control experiments were also performed,
finding that the UV lamp, O3 and aerosol, in isolation did not change the SO2 signal.
Two parameters in the OH model were adjusted using this observed SO2
reactivity: the photolysis rate constant for O3 (3Oj ), and the rate constant for diffusion-
limited loss of OH to the walls (kwall). Good agreement was achieved between the
modeled and inferred OH concentrations by adjusting both the parameters rather than just
one. Figure 3.4 shows OH calibration data along with that predicted by the model with a
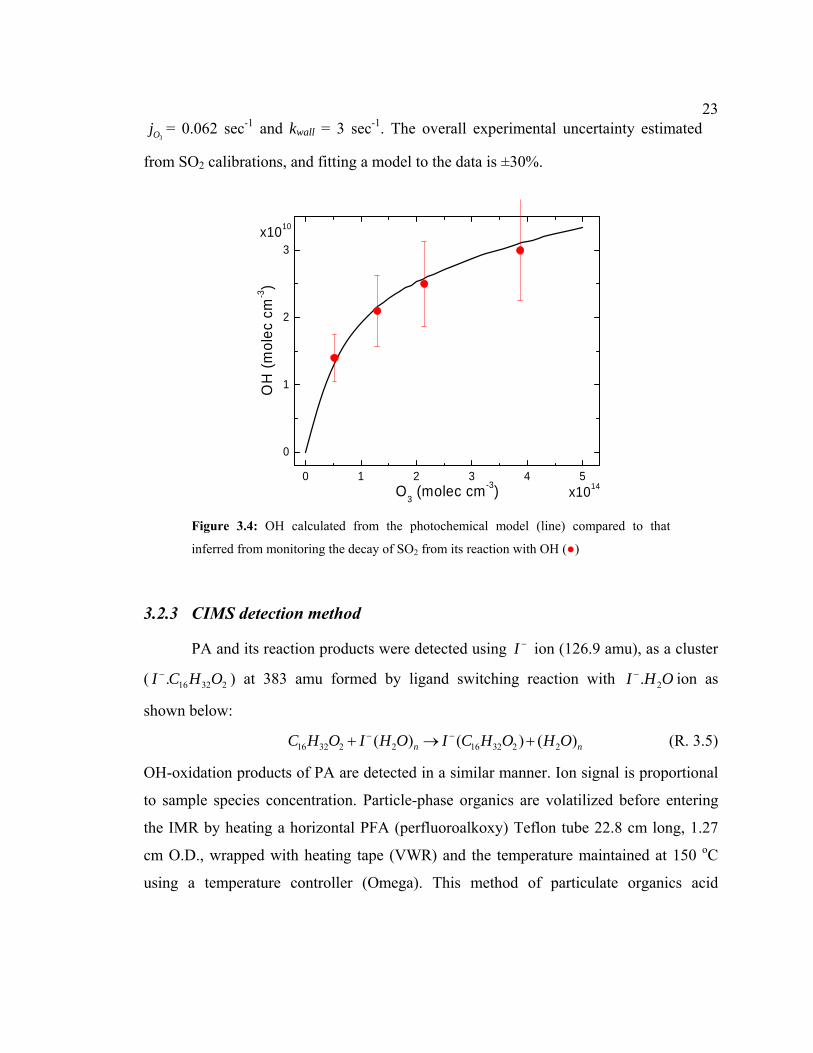
233Oj = 0.062 sec-1 and kwall = 3 sec-1. The overall experimental uncertainty estimated
from SO2 calibrations, and fitting a model to the data is ±30%.
0 1 2 3 4 5
0
1
2
3
x1010
O
H (m
olec
cm
-3)
O3 (molec cm-3) x1014
Figure 3.4: OH calculated from the photochemical model (line) compared to that
inferred from monitoring the decay of SO2 from its reaction with OH (●)
3.2.3 CIMS detection method
PA and its reaction products were detected using I − ion (126.9 amu), as a cluster
( 16 32 2.I C H O− ) at 383 amu formed by ligand switching reaction with 2.I H O− ion as
shown below:
16 32 2 2 16 32 2 2( ) ( ) ( )n nC H O I H O I C H O H O− −+ → + (R. 3.5)
OH-oxidation products of PA are detected in a similar manner. Ion signal is proportional
to sample species concentration. Particle-phase organics are volatilized before entering
the IMR by heating a horizontal PFA (perfluoroalkoxy) Teflon tube 22.8 cm long, 1.27
cm O.D., wrapped with heating tape (VWR) and the temperature maintained at 150 oC
using a temperature controller (Omega). This method of particulate organics acid
24 detection is similar to that used in our lab previously (McNeill et al., 2007), and also
reported by other studies (Hearn and Smith, 2004a).
To calculate the instrument sensitivity for PA, varying levels of mass
concentrations were sampled and was observed that the ion signal generated at 383 amu
(PA + I − ) was linear (McNeill et al., 2007). This yielded a sensitivity of 268±34 Hz μg-1
m3 for PA. I assumed that all other carboxylic acids will be detected with similar
sensitivity, to within a factor of 2, for the same water vapor concentrations. Therefore, no
attempt was made to calibrate for individual products. The main disadvantage of which is
that calculating absolute product yields is impossible. To minimize effects of O3 on the
ion chemistry, the sample was passed through a diffusion tube packed with Carulite O3-
scrubbing catalyst (Caruschem) before it entered the heated CIMS inlet.
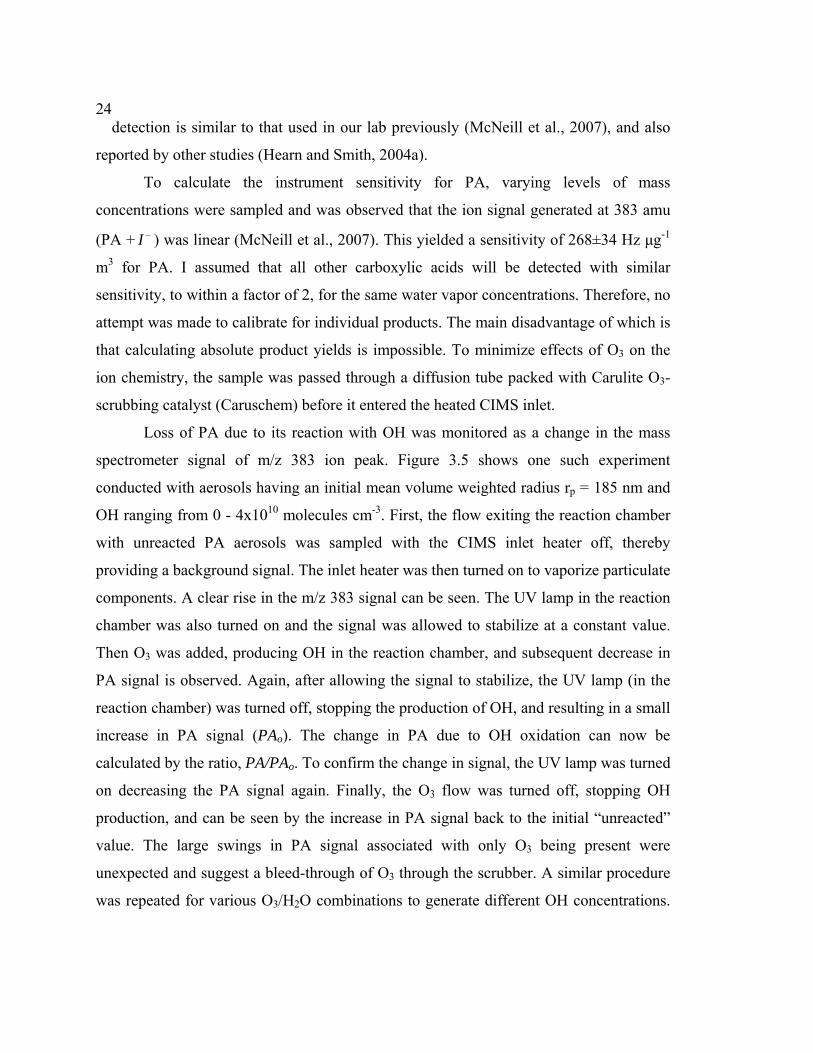
Loss of PA due to its reaction with OH was monitored as a change in the mass
spectrometer signal of m/z 383 ion peak. Figure 3.5 shows one such experiment
conducted with aerosols having an initial mean volume weighted radius rp = 185 nm and
OH ranging from 0 - 4x10¹⁰ molecules cm-3. First, the flow exiting the reaction chamber
with unreacted PA aerosols was sampled with the CIMS inlet heater off, thereby
providing a background signal. The inlet heater was then turned on to vaporize particulate
components. A clear rise in the m/z 383 signal can be seen. The UV lamp in the reaction
chamber was also turned on and the signal was allowed to stabilize at a constant value.
Then O3 was added, producing OH in the reaction chamber, and subsequent decrease in
PA signal is observed. Again, after allowing the signal to stabilize, the UV lamp (in the
reaction chamber) was turned off, stopping the production of OH, and resulting in a small
increase in PA signal (PAo). The change in PA due to OH oxidation can now be
calculated by the ratio, PA/PAo. To confirm the change in signal, the UV lamp was turned
on decreasing the PA signal again. Finally, the O3 flow was turned off, stopping OH
production, and can be seen by the increase in PA signal back to the initial “unreacted”
value. The large swings in PA signal associated with only O3 being present were
unexpected and suggest a bleed-through of O3 through the scrubber. A similar procedure
was repeated for various O3/H2O combinations to generate different OH concentrations.
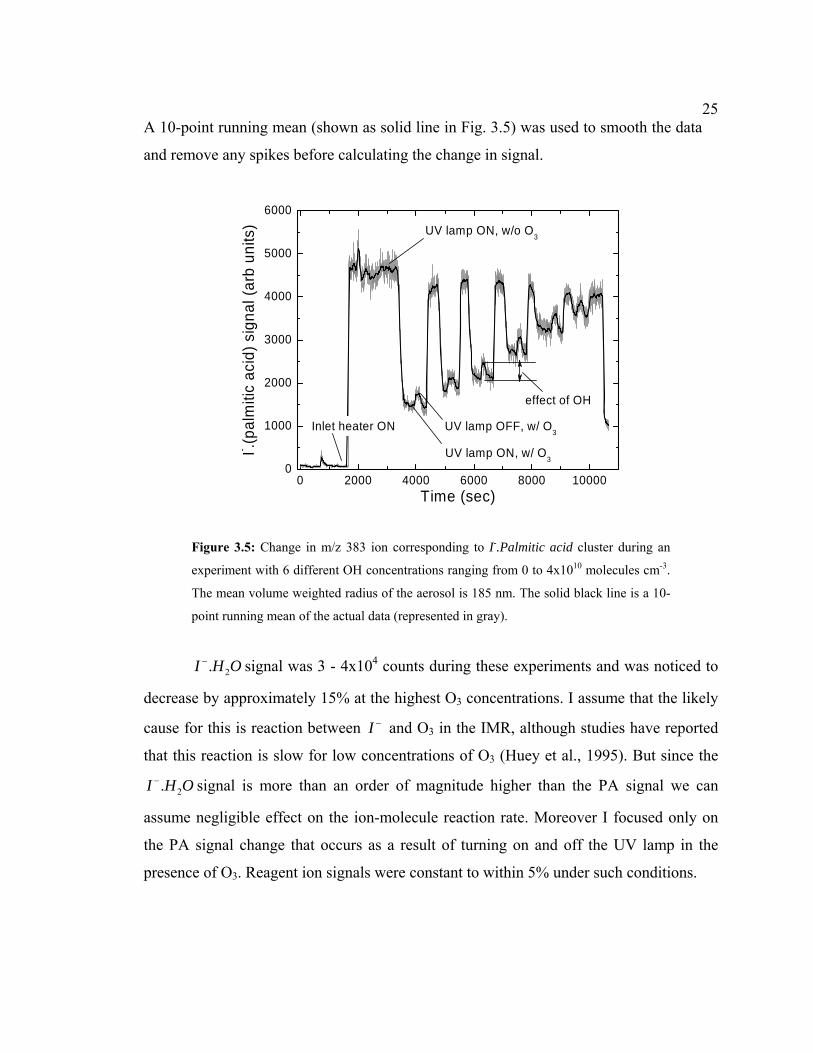
25A 10-point running mean (shown as solid line in Fig. 3.5) was used to smooth the data
and remove any spikes before calculating the change in signal.
0 2000 4000 6000 8000 100000
1000
2000
3000
4000
5000
6000
effect of OH
UV lamp OFF, w/ O3
UV lamp ON, w/ O3
I- .(pal
miti
c ac
id) s
igna
l (ar
b un
its)
Time (sec)
UV lamp ON, w/o O3
Inlet heater ON
Figure 3.5: Change in m/z 383 ion corresponding to I-.Palmitic acid cluster during an
experiment with 6 different OH concentrations ranging from 0 to 4x10¹⁰ molecules cm-3.
The mean volume weighted radius of the aerosol is 185 nm. The solid black line is a 10-
point running mean of the actual data (represented in gray).
2.I H O− signal was 3 - 4x10⁴ counts during these experiments and was noticed to
decrease by approximately 15% at the highest O3 concentrations. I assume that the likely
cause for this is reaction between I − and O3 in the IMR, although studies have reported
that this reaction is slow for low concentrations of O3 (Huey et al., 1995). But since the
2.I H O− signal is more than an order of magnitude higher than the PA signal we can
assume negligible effect on the ion-molecule reaction rate. Moreover I focused only on
the PA signal change that occurs as a result of turning on and off the UV lamp in the
presence of O3. Reagent ion signals were constant to within 5% under such conditions.
26 3.3 RESULTS
3.3.1 Kinetics of heterogeneous oxidation
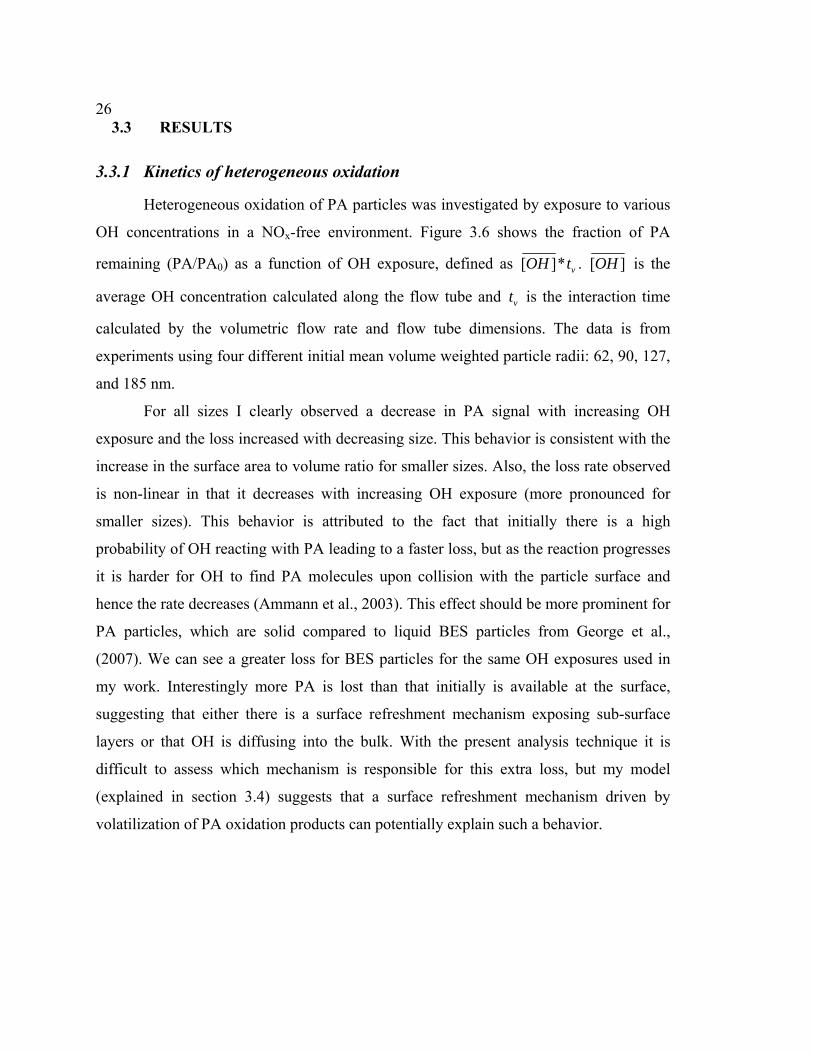
Heterogeneous oxidation of PA particles was investigated by exposure to various
OH concentrations in a NOx-free environment. Figure 3.6 shows the fraction of PA
remaining (PA/PA0) as a function of OH exposure, defined as [ ]* vOH t . [OH ] is the
average OH concentration calculated along the flow tube and is the interaction time
calculated by the volumetric flow rate and flow tube dimensions. The data is from
experiments using four different initial mean volume weighted particle radii: 62, 90, 127,
and 185 nm.
vt
For all sizes I clearly observed a decrease in PA signal with increasing OH
exposure and the loss increased with decreasing size. This behavior is consistent with the
increase in the surface area to volume ratio for smaller sizes. Also, the loss rate observed
is non-linear in that it decreases with increasing OH exposure (more pronounced for
smaller sizes). This behavior is attributed to the fact that initially there is a high
probability of OH reacting with PA leading to a faster loss, but as the reaction progresses
it is harder for OH to find PA molecules upon collision with the particle surface and
hence the rate decreases (Ammann et al., 2003). This effect should be more prominent for
PA particles, which are solid compared to liquid BES particles from George et al.,
(2007). We can see a greater loss for BES particles for the same OH exposures used in
my work. Interestingly more PA is lost than that initially is available at the surface,
suggesting that either there is a surface refreshment mechanism exposing sub-surface
layers or that OH is diffusing into the bulk. With the present analysis technique it is
difficult to assess which mechanism is responsible for this extra loss, but my model
(explained in section 3.4) suggests that a surface refreshment mechanism driven by
volatilization of PA oxidation products can potentially explain such a behavior.
27
0 1 2 3 4 5 60.4
0.5
0.6
0.7
0.8
0.9
1
0.4
0.5
0.6
0.7
0.8
0.9
10 1 2 3 4 5 6
185nm
x1011OH Exposure (molec cm-3 s)
127nm
90nm
P
A/P
Ao
62nm George et al.
(2007) - 75 nm
Processing Time (days)
Figure 3.6: Relative loss of PA as a function of OH exposure for four different volume-
weighted mean radii of 62 ( ), 90 (◄), 127 (□), and 185 nm (●). Model results for
respective sizes are represented by the lines. For comparison, OH oxidation of 75nm
liquid BES particles reported by George et al., (2007) is shown (◊) along with the model
result for their experimental conditions. Axis on the top represents the atmospheric
processing time with a globally averaged OH concentration of 1x10⁶ molecule cm-3
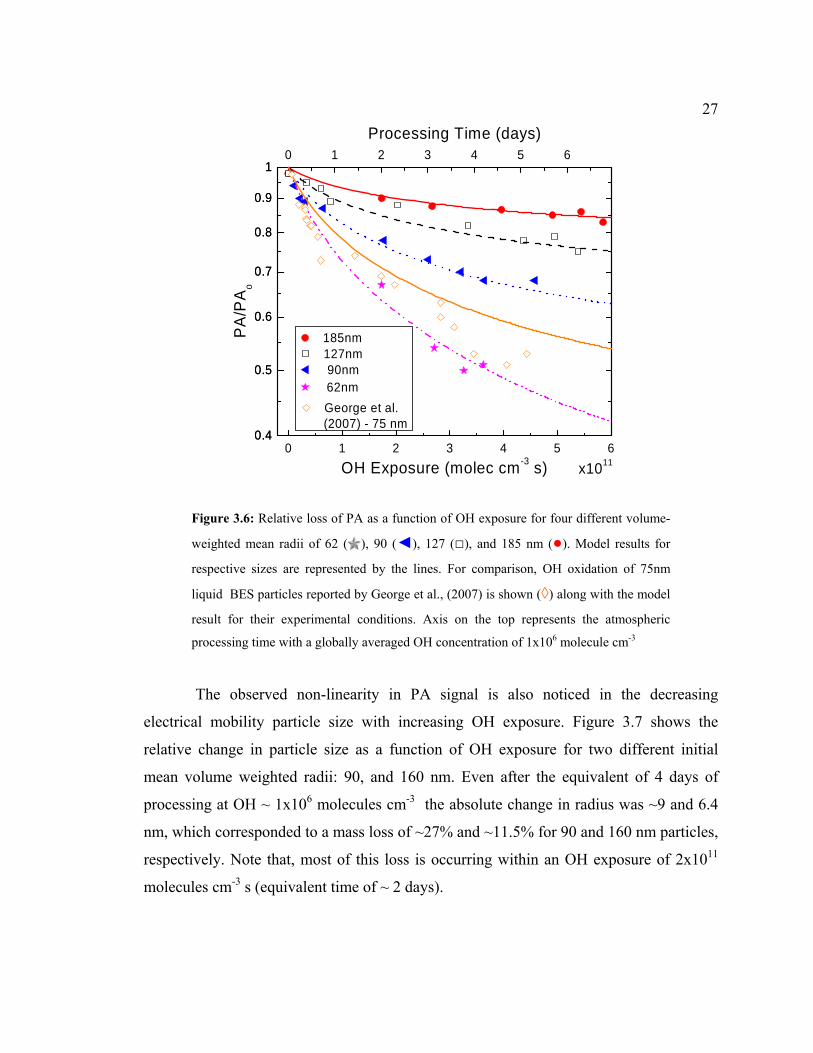
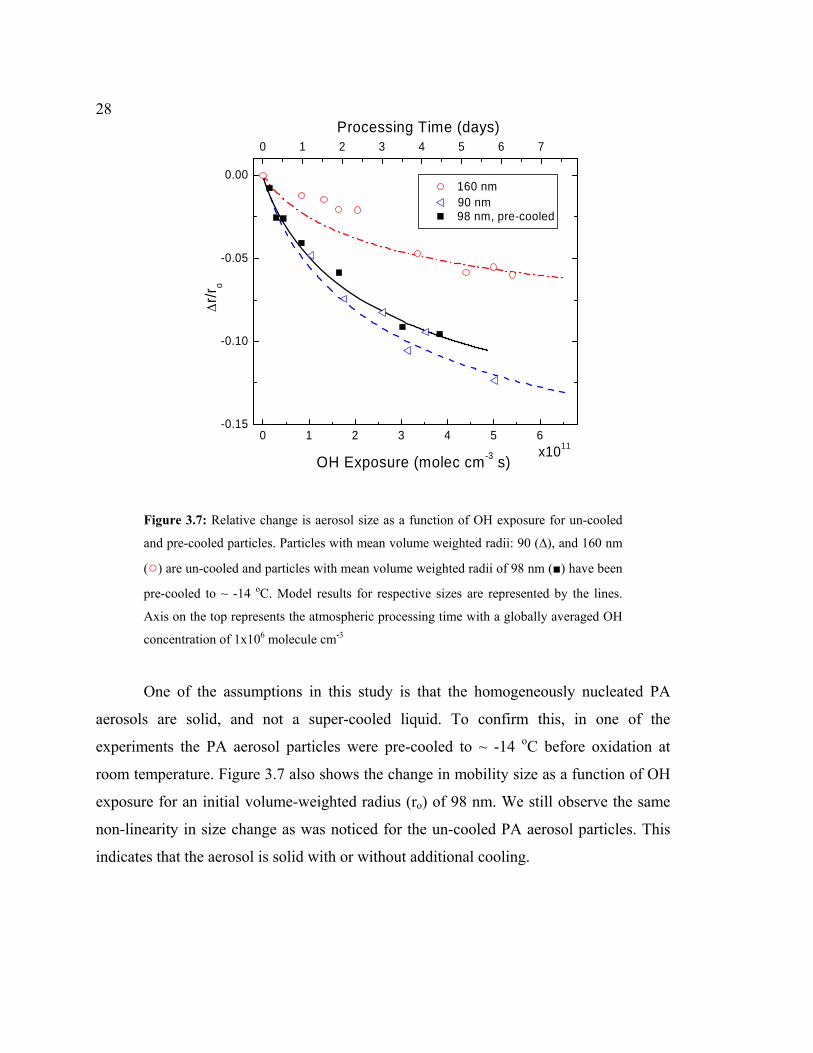
The observed non-linearity in PA signal is also noticed in the decreasing
electrical mobility particle size with increasing OH exposure. Figure 3.7 shows the
relative change in particle size as a function of OH exposure for two different initial
mean volume weighted radii: 90, and 160 nm. Even after the equivalent of 4 days of
processing at OH ~ 1x10⁶ molecules cm-3 the absolute change in radius was ~9 and 6.4
nm, which corresponded to a mass loss of ~27% and ~11.5% for 90 and 160 nm particles,
respectively. Note that, most of this loss is occurring within an OH exposure of 2x10¹¹
molecules cm-3 s (equivalent time of ~ 2 days).
28
0 1 2 3 4 5 6-0.15
-0.10
-0.05
0.00
0 1 2 3 4 5 6 7Processing Time (days)
x1011
OH Exposure (molec cm-3 s)
Δr/r
o
160 nm
98 nm, pre-cooled 90 nm
Figure 3.7: Relative change is aerosol size as a function of OH exposure for un-cooled
and pre-cooled particles. Particles with mean volume weighted radii: 90 (∆), and 160 nm
(○) are un-cooled and particles with mean volume weighted radii of 98 nm (■) have been
pre-cooled to ~ -14 oC. Model results for respective sizes are represented by the lines.
Axis on the top represents the atmospheric processing time with a globally averaged OH
concentration of 1x10⁶ molecule cm-3
One of the assumptions in this study is that the homogeneously nucleated PA
aerosols are solid, and not a super-cooled liquid. To confirm this, in one of the
experiments the PA aerosol particles were pre-cooled to ~ -14 oC before oxidation at
room temperature. Figure 3.7 also shows the change in mobility size as a function of OH
exposure for an initial volume-weighted radius (ro) of 98 nm. We still observe the same
non-linearity in size change as was noticed for the un-cooled PA aerosol particles. This
indicates that the aerosol is solid with or without additional cooling.
293.3.2 Palmitic acid oxidation products
To elucidate the reaction mechanism and to characterize the oxidation products
produced from the reaction of OH with PA aerosol; mass spectra were obtained in the
presence and absence of both OH and the aerosol. Determination of products consisted of
the following steps: first, a mass spectrum was taken with only OH present. Then,
another mass spectrum was immediately taken with only aerosols, O3 and H2O present.
These three spectra give us the background signal from impurities associated with PA
powder, Teflon-line or the reaction chamber. Finally, a mass spectrum was taken when
both OH and aerosols were present. Figure 3.8 shows a difference spectrum produced
from subtracting the first two spectra from the latter one for an OH exposure of 4.7x10¹¹
molecules cm-3 s. Peaks higher than zero correspond to masses produced from OH
oxidation and peaks lower than zero are lost due to OH oxidation, both of which can be
seen in Fig. 3.8.
Positive peaks with both lower and higher molecular weights than PA are
observed. The peak corresponding to m/z 272.4 amu (PA + 16 amu) is one exception,
which appeared when PA aerosols were exposed to O3 only, but then increased above this
baseline with OH. Formic acid (HCOOH, m/z 46 amu) is the dominant product signal,
but clusters of peaks between 75 and 175 amu (see inset) are also produced due to OH
oxidation of PA. I expect the detected products are mainly carboxylic acids (-C(O)OH)
due to the detection method used. Ketones and aldehydes are not detected unless they
also have a carboxylic acid moiety attached.
To distinguish between gas and condensed-phase products I obtained a similar
mass spectrum as described above, but with the CIMS inlet heater off. Without heating, I
observed similar signals for all oxidation products below ~ 175 amu shown in Fig. 3.8,
indicating that they are likely gas-phase products. Note that the O3-scrubber, located after
the reaction chamber, was removed before taking the products mass spectrum to avoid
additional loss of gas-phase products. The regularity of masses that are 14 amu apart
indicates that the carbon-chain lengths of volatile products differ by a CH2 group. It is
estimated that these products are monocarboxylic acids or aldehydic acids. Recently after
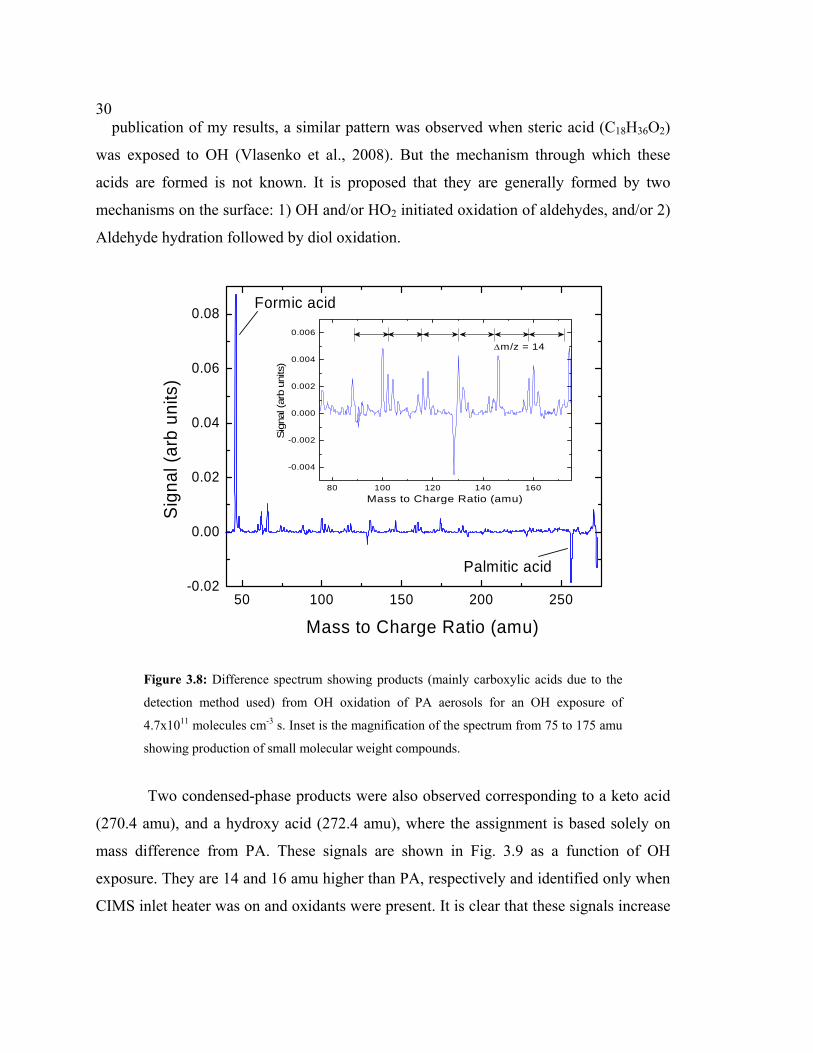
30 publication of my results, a similar pattern was observed when steric acid (C18H36O2)
was exposed to OH (Vlasenko et al., 2008). But the mechanism through which these
acids are formed is not known. It is proposed that they are generally formed by two
mechanisms on the surface: 1) OH and/or HO2 initiated oxidation of aldehydes, and/or 2)
Aldehyde hydration followed by diol oxidation.
50 100 150 200 250-0.02
0.00
0.02
0.04
0.06
0.08
80 100 120 140 160
-0.004
-0.002
0.000
0.002
0.004
0.006
Mass to Charge Ratio (amu)
Sign
al (a
rb u
nits
)
Δm/z = 14
Palmitic acid
Formic acid
Sig
nal (
arb
units
)
Mass to Charge Ratio (amu)
Figure 3.8: Difference spectrum showing products (mainly carboxylic acids due to the
detection method used) from OH oxidation of PA aerosols for an OH exposure of
4.7x10¹¹ molecules cm-3 s. Inset is the magnification of the spectrum from 75 to 175 amu
showing production of small molecular weight compounds.
Two condensed-phase products were also observed corresponding to a keto acid
(270.4 amu), and a hydroxy acid (272.4 amu), where the assignment is based solely on
mass difference from PA. These signals are shown in Fig. 3.9 as a function of OH
exposure. They are 14 and 16 amu higher than PA, respectively and identified only when
CIMS inlet heater was on and oxidants were present. It is clear that these signals increase
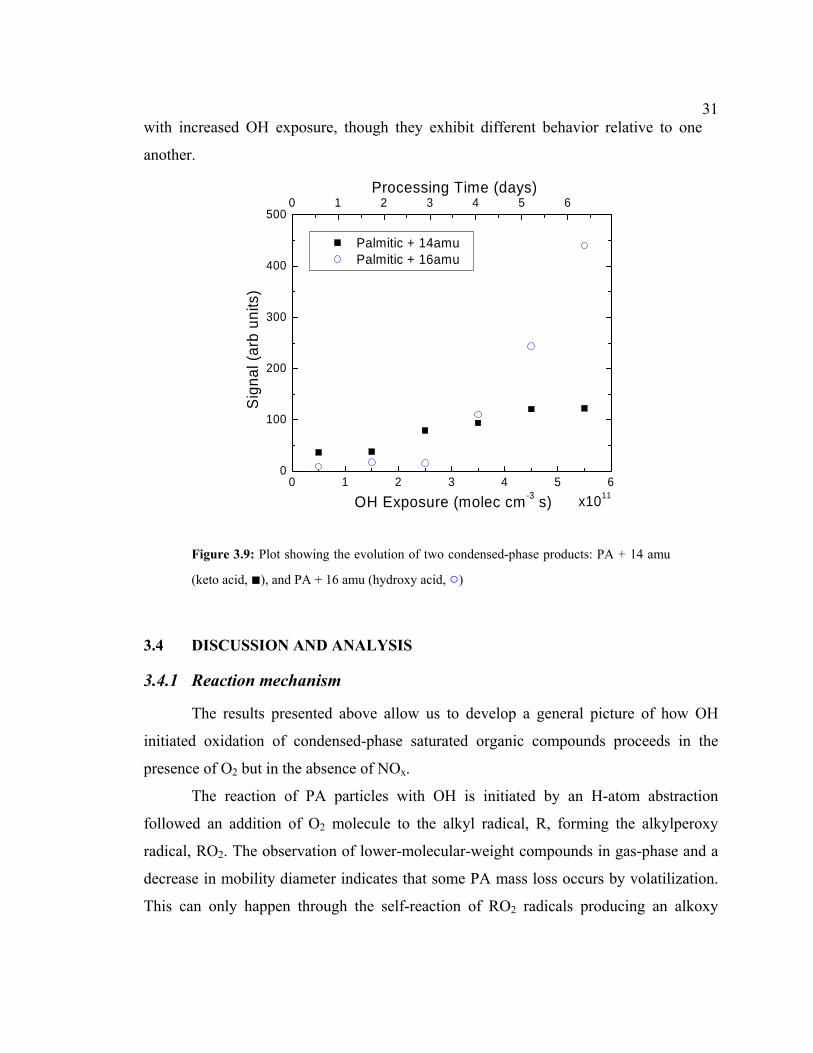
31with increased OH exposure, though they exhibit different behavior relative to one
another.
0 1 2 3 4 5 60
100
200
300
400
5000 1 2 3 4 5 6
Processing Time (days)
Palmitic + 14amu Palmitic + 16amu
Sig
nal (
arb
units
)
x1011OH Exposure (molec cm-3 s)
Figure 3.9: Plot showing the evolution of two condensed-phase products: PA + 14 amu
(keto acid, ■), and PA + 16 amu (hydroxy acid, ○)
3.4 DISCUSSION AND ANALYSIS
3.4.1 Reaction mechanism
The results presented above allow us to develop a general picture of how OH
initiated oxidation of condensed-phase saturated organic compounds proceeds in the
presence of O2 but in the absence of NOx.
The reaction of PA particles with OH is initiated by an H-atom abstraction
followed an addition of O2 molecule to the alkyl radical, R, forming the alkylperoxy
radical, RO2. The observation of lower-molecular-weight compounds in gas-phase and a
decrease in mobility diameter indicates that some PA mass loss occurs by volatilization.
This can only happen through the self-reaction of RO2 radicals producing an alkoxy
32 radical, RO, which then undergoes bond scission to yield smaller OVOCs fragments.
These products along with that formed through other reaction pathways can further
undergo OH oxidation partly through the scission pathway. The results presented above
are qualitatively consistent with that of Molina et al. (2004). Also, they indicate that the
formation of an alcohol and a carbonyl due to self-reaction of RO2 is not the only
pathway in this system at low OH exposures as concluded by some of the pervious
studies (George et al., 2007; Hearn and Smith, 2007b). At high OH exposures, there may
be a shift in the reaction mechanism towards the formation of alcohols as shown by the
increase in hydroxy acid (see Fig. 3.9). This difference in the degree of volatilization
observed for different systems may be related to particle phase.
The loss of PA observed is more than that present at the surface. For a liquid
aliphatic particle, the reacto-diffusive length is very short, ~ 1 nm, since OH reacts as
soon as it collides with the surface of an aerosol. For a solid particle (such as a PA
aerosol), this reactive region should be even shorter. Thus, higher than expected loss can
only occur: a) through volatilization, a mechanism to refresh the surface exposing fresh
PA in sub-surface layers to OH, b) through secondary condensed-phase radical
chemistry, a mechanism to propagate reaction into the bulk. Since resistance to bulk-
phase diffusion is very high in solids (D ~ 10-10 cm2 s), surface renewal through mixing
can be neglected for PA aerosol. In liquid aerosol this is not the case, because of higher
diffusion (D ~ 2x10⁻⁷ cm2 s) and/or instantaneous mixing with-in the aerosol. I compared
the PA mass loss data to a model developed by Worsnop et al. (2002) which assumes that
OH reacts with liquid PA aerosol every time it collides with the surface. But the model
did not represent the data well (not shown here), which alludes to volatilization and/or
secondary-chemistry being important.
3.4.2 Model To explain the observations described in the previous section a surface-only
oxidation model was modified and further developed. The key advantage of the model is
that I do not need any a priori assumptions about the particle phase or that there is
instantaneous mixing within the particle. Also the unique aspect is that the OH oxidation
33of PA occurs at the surface. The model consists of three main processes: 1) surface-
only reactions between PA and OH, 2) secondary chemistry between unreacted PA and
oxidation products, and 3) a surface renewal process which exposes fresh PA to OH. In
addition, the model calculates aerosol size change as a function of OH exposure relating
loss of PA mass by volatilization of oxidized products. During an experiment aerosol size
change data is obtained by the SMPS connected at the exit of the reaction chamber.
Therefore, we can compare the model and measurements for not only the loss of PA mass
but also change in size.
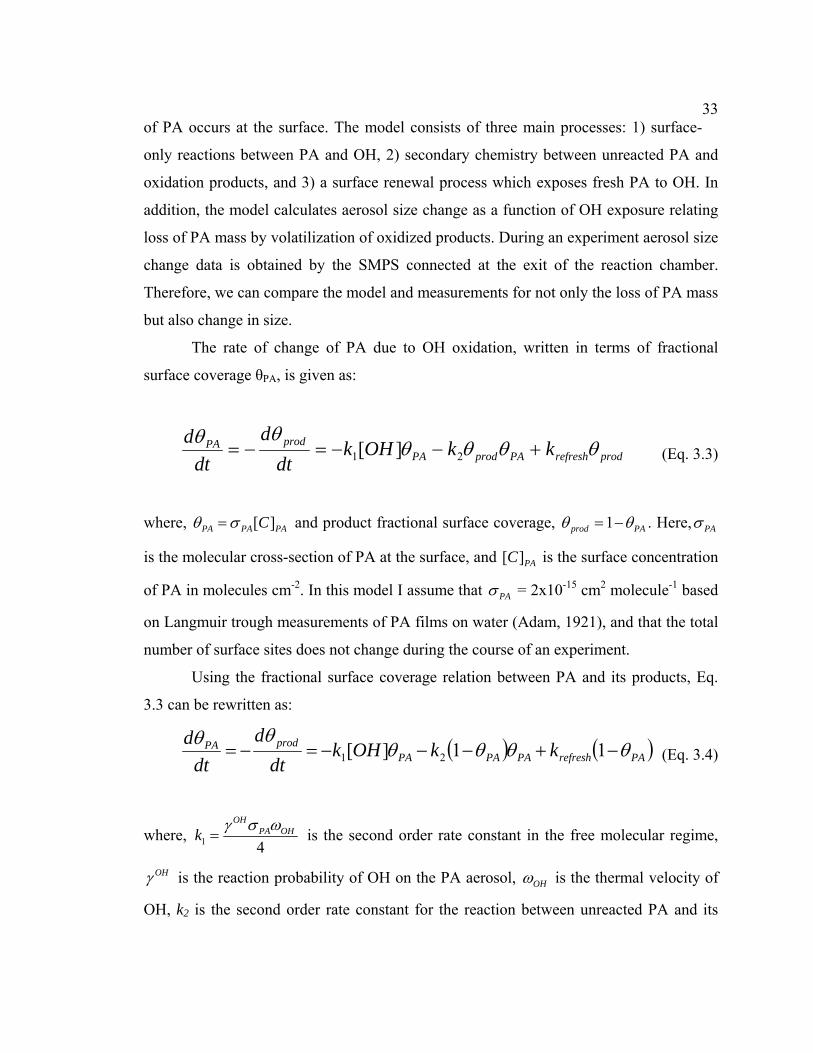
The rate of change of PA due to OH oxidation, written in terms of fractional
surface coverage θPA, is given as:
prodrefreshPAprodPAprodPA kkOHk
dtd
dtd θθθθ
θθ+−−=−= 21 ][ (Eq. 3.3)
where, [ ]PA PA PC Aθ σ= and product fractional surface coverage, 1prod PAθ θ= − . Here, PAσ
is the molecular cross-section of PA at the surface, and [ ]PAC is the surface concentration
of PA in molecules cm-2. In this model I assume that PAσ = 2x10-15 cm2 molecule-1 based
on Langmuir trough measurements of PA films on water (Adam, 1921), and that the total
number of surface sites does not change during the course of an experiment.
Using the fractional surface coverage relation between PA and its products, Eq.
3.3 can be rewritten as:
( ) ( PArefreshPAPAPAprodPA kkOHk
dtd
dtd θθθθ )θθ
−+−−−=−= 11][ 21 (Eq. 3.4)
where, 1 4
OHPA OHk γ σ ω
= is the second order rate constant in the free molecular regime,
OHγ is the reaction probability of OH on the PA aerosol, OHω is the thermal velocity of
OH, k2 is the second order rate constant for the reaction between unreacted PA and its
34 OH oxidation products in the surface layer, and krefresh is the surface refreshment
process of PA. The physical interpretation of krefresh includes the volatilization of
oxidation products exposing fresh PA in sub-surface layers or changing phase of the
particle from solid to more liquid like enhancing PA mixing and/or diffusion of OH into
the bulk. k1 has been corrected for gas-phase diffusion and transition regime effects,
Knudsen number ~ 1 (Fuchs and Sutugin, 1970).
A more suitable quantity to compare model to the experimental data is change in
volume (or mass) as a function of OH. Therefore, Eq. 3.4 is written in terms of ratio of
PA remaining after exposure to that initially present ( ),0/PA PAn n :
( ) ( )( ),01 2
,0
/ 1 3 [ ] 1PA PAPA PA
PA
d n nk OH k
dt n r PAθ θ θσ
= − − − (Eq. 3.5)
Size change due to vaporization is modeled using the expression:
( )3,0
2
/3
PA PAovap
d n nrdrdt r dt
χ= (Eq. 3.6)
where, ro is the initial particle radius and vapχ is the factor relating the changes in density
and mass loss by volatilization to the rate of PA oxidation. Eq. 3.4 – Eq. 3.6 are solved
simultaneously along with OH production and destruction reactions with integration time
equal to the residence time of aerosol in the reaction chamber (~ 15 sec). The four main
inputs to the model are RH and O3 inside the reaction chamber, particle surface area, and
initial volume weighted radius rp of PA particles. Finally, the model is fit to the oxidation
data (shown in Fig. 3.6) through trial and error by adjusting OHγ , k2, krefresh, and vapχ .
Presently, I am trying to implement a nonlinear least-squares fitting routine (using
Levenberg-Marquardt method) to have a more quantitative method to assess how well
constrained each parameter (and thus the process) is.
353.4.3 Comparison of model and data
Figures 3.6 – 3.8 compare model results to experimental data for PA oxidation.
Through trial and error it was noticed that by using a single set of parameters both the PA
mass loss and mobility size change data was simulated very well: OHγ = 1, k2 = 0.22 s-1,
krefresh = 0.35 s-1, and vapχ = 0.9. Each of these parameters affects different regions of the
model curve. At low OH exposures, the model is most sensitive to OHγ and k2, whereas
at high OH exposures, the oxidation of PA is limited by the surface renewal process.
Also, OHγ and k2 are coupled in that the similar behavior can be maintained by increasing
one and decreasing the other, and vice versa, to some extent. For example, the model can
grossly reproduce the data by setting a value of OHγ = 0.5 and increasing the value of k2
to 0.4 s-1, but the curve is too steep at low OH exposures and too shallow at high OH
exposures. The value of vapχ can range between 0.75 to 1, without too much loss of
agreement to mass loss data but it significantly affects the mobility size change data. This
is due to the fact that it directly controls the particle size change (see Eq. 3.6) whereas
mass loss is affected only by change in gas-phase diffusion limitation with changing
particle size (mainly for the smallest size particles when the diffusion limitation becomes
negligible and thus OH flux to the particle increases).
To test the model to other studies reported in the literature, the model was run for
the conditions of George et al. (2007). These model results are also plotted in Fig. 3.6 (◊).
The model consistently underestimates the loss of BES for the same model parameters
that best match the PA data. In order to model their data, the rate of secondary chemistry,
k2, and the surface renewal term, krefresh, has to be increased indicating the effect of
particle phase (BES is a liquid aerosol), and a higher value for these terms indicates; a)
OH is penetrating deeper into the BES particle, and/or b) enhanced mixing inside the
particles exposing fresh BES to OH.
36 OHPhysical interpretation of γ and k2
The reaction probability of OH on pure PA aerosol, OHγ ~ 1, is in line with other
literature reported studies for OH reaction with single component monolayers, films, and
aerosol (Bertram et al., 2001; Molina et al., 2004; George et al., 2007; Lambe et al.,
2007). The value of OHγ used in the model can range between 0.8 and 1 without loss of
agreement with the data. This indicates that OH oxidation of saturated alkane aerosol is
very efficient.
The rate constant for hypothetical secondary reactions, k2, is an important
parameter in the model and to achieve good agreement, a non-zero value is required, 0.22
s-1, when θPA = 1, i.e. the surface is mostly composed of PA, and decreases as the
products are formed. Thus, while loss due to reaction with OH is the main fate of PA,
secondary-chemistry can account for 10 to 30% of the loss according to my
simplifications. This supports the existence of secondary condensed-phase chemistry and
can explain OHγ > 1 observed by other studies (George et al., 2007; Hearn and Smith,
2007b).
Physical interpretation of krefresh and vapχ
The physical interpretation of the surface renewal process is a combination of: a)
exposure of sub-surface layers of PA due to volatilization of its oxidation products from
the surface, and b) diffusion of PA to the surface or OH into the bulk due to liquification
of the surface layers as a result of oxidation. The data supports that the former process is
significant in this study, while my impaction results, described in chapter 4, hint that
process (b) may also be operating. Irrespective of the actual process, we need a krefresh
term in the model to explain my observations that more PA is oxidized than that initially
present in the surface layers.
The surface renewal rate constant can be compared to the diffusion-limited rate
constant for OH oxidation of PA at the surface, a typical value being ~ 0.45 s-1 for OH
concentrations of 3x10¹⁰ molecules cm-3 and rp = 150 nm. Since both of these rate
constant are similar, we can perform an analysis similar to that of Molina et al. (2004).
37Assuming that surface renewal proceeds only by volatilization (process (a) above) I
conclude that essentially two oxidation events convert a PA molecule into volatile
compounds and leads to the exposure of sub-surface layers. For example, Molina et al.
(2004) observe that 6 to 9 carbons are lost for each OH reaction. If the first OH reaction
event were to volatilize 6 carbons from PA (a C16 molecule), we will be left with a non-
volatile C10 product on the surface (generally compounds higher than 9 carbon atoms are
in condensed-phase (Goldstein and Galbally, 2007)) . In the second reaction event, this
product will convert to a C4 and a C6 product, both potentially volatile. Also, the fact that
I observe short-chain carboxylic acids in the gas-phase and a decrease in electrical
mobility diameters indicates volatilization being a surface renewal process. Note that,
liquification is thermodynamically preferred for multi component organic systems
(Marcolli et al., 2004).
The value of vapχ ~ 0.9 is required to best reproduce the change in radius data.
This indicates that the particle size changes at the same rate as the bulk PA oxidation rate,
which is not constant with OH exposure as seen in Fig. 3.7. The rate of decrease of
particle size slows with OH exposure. This finding suggests using a constant value for
carbon lost per OH collision, as implied by Molina et al. (2004) and used by Kwan et al.
(2006) is flawed. Therefore this implies that heterogeneous oxidation cannot be a major
loss process for POM as suggested by Molina et al. (Molina et al., 2004) and .
3.4.4 Hydroperoxide photochemistry as a secondary chemistry mechanism
Apart from the loss of RO2 radicals due to self-reaction, RO2 can be lost through
reaction with HO2 radicals.
2 2,gasRO HO ROOH O2+ ⎯⎯→ + (R. 3.6)
In this study and that of George et al. (2007), HO2 radicals are formed in gas-
phase by the reaction . Therefore, surface-bound RO 3 2OH + O HO + O⎯⎯→ 2 2 radicals
can react with gas-phase HO2 radicals producing hydroperoxides, ROOH. At 254 nm,
ROOH can photolyze, leading to a source of RO and OH radicals in the condensed-phase.
These radicals are now added to the pool already present from other reaction pathways.
38 Therefore, the net effect of this photochemistry is to enhance the loss of PA and
branching through RO radicals and thus possibly enhancing the formation of OVOCs.
This formation and photolysis of ROOH can be one explanation for the enhanced
loss of PA and can also be inferred as the secondary condensed-phase chemistry I require
to explain the loss of PA. In a recent study, Gomez et al. (2006) exposed oxidized
undecylenic acid ( , monounsaturated) films to 254 nm wavelength light and
observed gas-phase OVOCs ( and ). Based on results from iodometric-
spectrophotometric method they concluded that the formation of volatile gas-phase
species was possibly due to photodissociation of hydroperoxides formed on the surface of
the films. To evaluate the potential of this mechanism the surface-chemistry model was
modified to incorporate formation and loss of ROOH. One of the assumptions is that
every HO
11 20 2C H O
HCOOH HCHO
2 collision with an RO2 produces an ROOH, photolysis of which then leads to
the oxidation of a PA molecule. Therefore the estimate provided here is an upper limit.
Modified model
The reaction mechanism for the formation and photolysis of ROOH leading to
enhanced oxidation of PA is given below. Due to the lack of essential rate constants and
products I assume: a) the photolysis frequency of ROOH is the same as for CH3OOH
(DeMore et al., 1997) which is calculated relative to the calibrated ozone photolysis
frequency using the ratio of CH3OOH and O3 absorption cross-sections at 254 nm, and b)
no further loss of PA through the secondary chemistry is allowed. Based on this, the new
set of reactions are:
2gasOH PA RO+ → ( , R. 3.7) 1k
2 2,gasRO HO ROOH+ → ( , R. 3.8) '2k
hvsurfaceROOH RO OH⎯⎯→ + ( , R. 3.9) ROOHj
2surfaceOH PA RO+ → ( , R. 3.10) 4k
2 2 2 2RO RO RO O+ → + ( , R. 3.11) 3k
39Mass balance equations based on the above reactions can be written as,
1[ ] [ ] (1PA )gas PA ROOH refresh PAd k OH j ROOH k
dtθ θ θ= − − + − (Eq. 3.7)
,01
,0
( ) 1 3 ( [ ] [ ]PA PAgas PA ROOH
PA
d n nk OH j ROOH
dt n rθ
σ= − − ) (Eq. 3.8)
2
' 221 2,[ ] [ ] [ ][ ] [ ]gas PA ROOH gas
dRO k OH j ROOH k HO RO k ROdt
θ= + − −2 3 2 (Eq. 3.9)
2
'2, 2[ ][ ] [gas ROOH
dROOH k HO RO j ROOHdt
= − ] (Eq. 3.10)
where, 2
2'2 4
HOPA HOk
γ σ ω= is the second order rate constant similar to k1 and is corrected
for diffusion-limitation of HO2 to the aerosol surface. In the above equations,
[ ]ROOH and 2[ ]RO are in fractional surface coverage units (same as PAθ ) and Eq 3.9 is
the rate limiting step. Eq. 3.6 – Eq. 3.10 along with those governing the production and
loss of OH and HO2 are solved simultaneously. Finally, the model is fit to the PA
oxidation data through trial and error by adjusting the four parameters: OHγ , 2HOγ , ,
and
refreshk
vapχ .
This new model simulates the data generally well at high OH exposures but
continues to under estimate the PA loss at low OH exposures. Very efficient reactive
uptake of OH on PA aerosol is still required with OHγ between 1 and 1.4. While good
simulation at high OH exposures suggests ROOH chemistry could explain a significant
fraction of the secondary chemistry inferred from the simpler model, values higher than 1
for OHγ suggest that not all PA loss processes have been identified in the present scheme.
Neither this study nor that of George et al. (2007) identified any of the ROOH products
so it is not possible to confirm the presence of this reaction mechanism. Nevertheless, the
main conclusions do not change regardless of ROOH chemistry: a) loss of OH on PA
particles is very efficient with OHγ ≈1 and b) mass loss due to volatilization cannot
40 compete with other loss processes in the atmosphere, and it cannot be an important
source of OVOCs, as suggested by Molina et al. (2004), and Kwan et al. (2006).
3.5 CONCLUSIONS AND ATMOSPHERIC IMPLICATIONS
This study has shown that oxidation by OH of saturated particulate organic matter
(PA aerosols as a proxy) is highly efficient with reaction probability OHγ ≈ 1. This is in
good agreement with those obtained from the coated wall flow tube study of Bertram et
al. (2001) and from the aerosol flow tube study of George et al. (2007).
A model consisting of surface-only reaction between OH and PA, secondary-
reactions between oxidation products and PA, a surface renewal process due to
volatilization of the oxidation products represented the data very well. Oxidation of pre-
cooled aerosol proved my assumption that PA aerosols are initially solid. Lower-
molecular-weight, volatile products observed in the gas-phase corroborate the work of
others (Ellison et al., 1999; Molina et al., 2004; Vlasenko et al., 2008) that heterogeneous
oxidation of particulate organic matter can potentially be a source of OVOCs to the
atmosphere. The faster loss of PA I observe at low OH exposures is consistent with the
calculations of Kwan et al. (2006) that heterogeneous oxidation may results in OVOC
fluxes of up to 70 pptv C day-1. But as the particle ages, my results suggest that the
OVOC flux decreases. In this study, I observed approximately 10% loss of size for a 90
nm aerosol, which corresponded to a maximum volume loss of 30% even after an
equivalent 4 days of OH processing in the atmosphere. Hence, heterogeneous oxidation
as loss process cannot compete with wet-deposition in the atmosphere, and likely is an
unimportant source of OVOC unless there is substantial aliphatic character present in the
aerosol.
Kinetics and OVOC product yields of heterogeneous reactions are highly
dependent on the oxidant type, particle composition and phase. This is clearly evident
from the difference in results from this study compared to others. Observation of volatile
products indicates that RO formation followed by C-C bond scission is an important
pathway. This pathway is particularly significant for solid compared to liquid aerosol,
41
2
and my results in this regard have recently been confirmed by others (after publication
of my work) (Vlasenko et al., 2008). Finally, production of hydroperoxides (ROOH) due
to 2RO HO+ reactions may be occurring in this reactive system possibly leading to a
shift in the reaction pathway from the formation of carbonyl and alcohols as observed by
George et al. (2007). But the eventual fate of ROOH is loss due to photolysis to form
alkoxy radicals RO which can enhance the decomposition pathway leading to increase in
OVOCs. Therefore, this reaction mechanism has to be further investigated to understand
laboratory kinetics but it is unlikely to be important in the atmosphere unless the ROOH
formed by this chemistry photolyze appreciably at wavelengths > 300nm.
Idealistic scenarios such as single component aerosol are highly unrealistic, but
studies such as this one can provide insight into the oxidation of saturated particulate
organic matter in the atmosphere. Other limitations that have to be resolved are the
unrealistically high OH concentrations, low relative humidity and NOx-free conditions.
The effects of these parameters along with presence of more than one aerosol species on
heterogeneous oxidation and production of OVOCs is critical to understanding oxidative
aging of particulate organic matter.
42 4. IN-SITU MEASUREMENT OF PARTICULATE ORGANIC
MATTER USING MICRO-ORIFICE VOLATILIZATION
IMPACTOR COUPLED TO A CHEMICAL IONIZATION MASS
SPECTROMETER (MOVI-CIMS)
4.1 INTRODUCTION
The objective of this research is to develop a novel technique to provide high time
resolution, in-situ speciated measurements of aerosol organic matter. The goal is to
provide observations which can be correlated with several environmental parameters so
that chemical and physical mechanisms controlling the sources and sinks of organic
compounds in particles can be elucidated. The method I developed and am presently
characterizing is micro orifice volatilization impactor - chemical ionization mass
spectrometry (MOVI-CIMS). This method couples two well-proven techniques, inertial
impaction and CIMS, to collect and analyze aerosols in-situ on a continuous basis with
high sensitivity and high specificity. Although these techniques have been used
separately over the years, this will be the first attempt to use both of them online for
measurements of organic aerosol composition.
4.1.1 Inertial Impaction
Inertial impaction is a widely used method for aerosol collection. It is a process
where sample air is forced through a nozzle producing a concentrated jet. This jet of
particle laden air is then directed onto a flat collection plate. Aerosols below a certain
size, called the cut-point diameter (aerodynamic diameter, d50), follow the gas
streamlines, whereas aerosols larger than the d50 impact and are collected on the plate due
to inertia. Figure 4.1 provides a conceptual diagram of the method. The cut point of an
impactor is the size at which 50% collection is reached. Ideally, an impactor should
collect particles larger than d50 with 100% efficiency while allowing smaller particles to
pass through. But in real impactors the efficiency varies with particle size (Marple and
Liu, 1975) and phase.
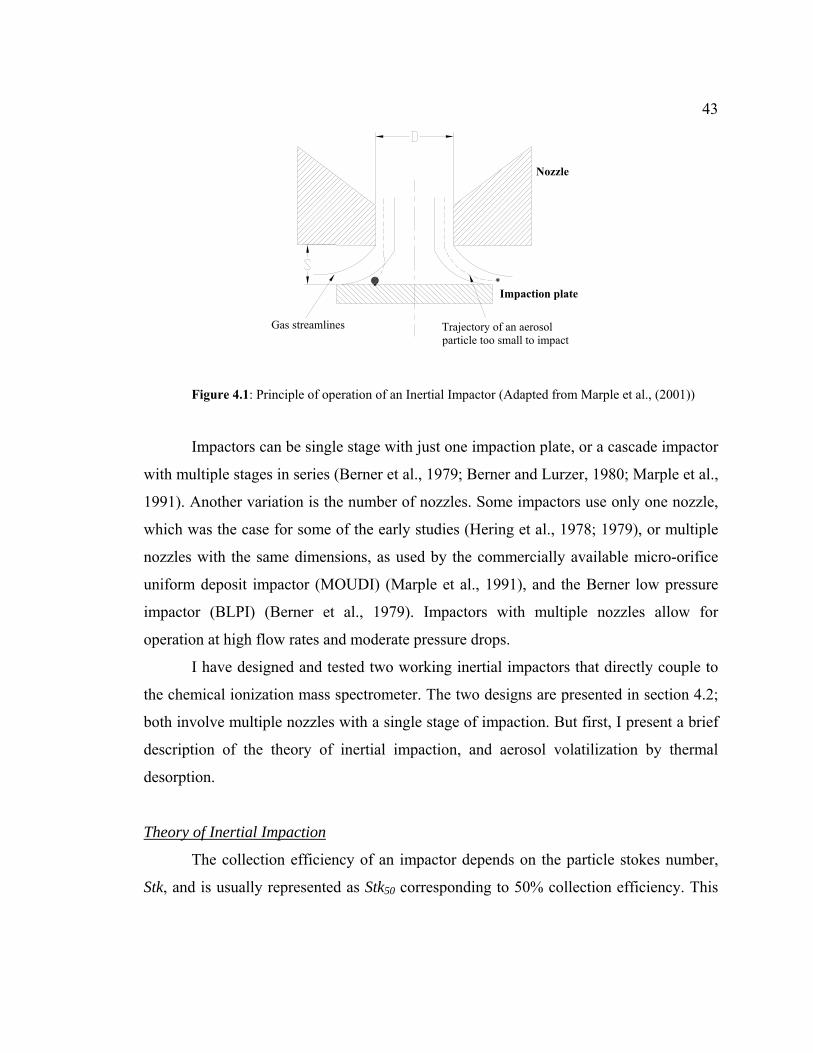
43
Trajectory of an aerosol particle too small to impact
Gas streamlines
Nozzle
Impaction plate
Figure 4.1: Principle of operation of an Inertial Impactor (Adapted from Marple et al., (2001))
Impactors can be single stage with just one impaction plate, or a cascade impactor
with multiple stages in series (Berner et al., 1979; Berner and Lurzer, 1980; Marple et al.,
1991). Another variation is the number of nozzles. Some impactors use only one nozzle,
which was the case for some of the early studies (Hering et al., 1978; 1979), or multiple
nozzles with the same dimensions, as used by the commercially available micro-orifice
uniform deposit impactor (MOUDI) (Marple et al., 1991), and the Berner low pressure
impactor (BLPI) (Berner et al., 1979). Impactors with multiple nozzles allow for
operation at high flow rates and moderate pressure drops.
I have designed and tested two working inertial impactors that directly couple to
the chemical ionization mass spectrometer. The two designs are presented in section 4.2;
both involve multiple nozzles with a single stage of impaction. But first, I present a brief
description of the theory of inertial impaction, and aerosol volatilization by thermal
desorption.
Theory of Inertial Impaction
The collection efficiency of an impactor depends on the particle stokes number,
Stk, and is usually represented as Stk50 corresponding to 50% collection efficiency. This
44 is a dimensionless constant defined as the ratio of the particle’s stopping distance to the
diameter of the nozzle (Marple et al., 1991): 250
50 9p cC d V
StkD
ρη
= (Eq. 4.1)
2
4QVDπ
= (Eq. 4.2)
where, D is diameter of the nozzle, d50 is the particle diameter having 50% collection
efficiency, V is the average air velocity at the nozzle exit, Q is the volumetric flow rate
through the nozzles, ρp is the particle density, Cc is the Cunningham slip correction
factor, and η is the coefficient of viscosity of air. For theoretical calculation of the cut-
point diameter, a known value of Stk50 is used, which for circular nozzles is 0.24 (Hinds,
1999). But usually Stk50 is estimated from collection efficiency experiments and depends
on the nozzle exit-to-collection plate distance (see Fig. 4.1) and the jet Reynolds number
(Marple and Liu, 1974). For large pressure drop impactors, Stk50 in the range 0.21 – 0.11
have been reported (Hering, 1987; Hillamo and Kauppinen, 1991).
Inspection of Eq. 4.1 shows that for a fixed mass flow rate Q, to collect smaller
aerosol (decrease d50), we can either increase the slip correction factor, Cc, or decrease
the nozzle diameter D. All the other parameters in the expression are constants. The slip
correction factor is a function of the ratio of the particle diameter (dp) to the mean free
path of air molecules (λ), and is given as (Hinds, 1999),
0.39*( , )( , )1 2.34 1.05*
pP T
cp
dP TCd
λλ⎛ ⎞−⎜ ⎟⎜⎝
⎛ ⎞⎜= + +⎜⎝ ⎠
e⎟⎠ ⎟⎟
(Eq. 4.3)
The mean free path of air (λ), defined as the average distance traveled by a molecule
between successive collisions, is a function of pressure, P, temperature, T, and is given as
(Marjamaki et al., 2000),
00 0
0
1( , ) ( , )* * *
1
SuP TTP T P T SuT P
T
λ λ
⎛ ⎞+⎜ ⎟⎛ ⎞ ⎛ ⎞ ⎜= ⎜ ⎟ ⎜ ⎟ ⎜ ⎟⎝ ⎠⎝ ⎠ +⎜ ⎟⎝ ⎠
0 ⎟ (Eq. 4.4)
45The air viscosity (η) also depends on pressure and temperature and can be calculated
using: 1.5
00
0
aT T ST T S
η η⎛ ⎞+⎛ ⎞= ⎜⎜ ⎟ +⎝ ⎠ ⎝ ⎠
⎟ (Eq. 4.5)
In the above, Po is 101.3 kPa, To is 298 K, λ(Po,To) is 0.066μm (Seinfeld and Pandis,
1998), Su is called the Sutherland’s constant and is 110.4K for air, Ta is 296 K (Hillamo
and Kauppinen, 1991) and 0η is 1.81x10⁻⁵ Pa s at 295 K.
From Eq. 4.3 & Eq. 4.4 we see that pressure is one of the controlling parameters.
By decreasing pressure, we decrease the drag on the particles in the impactor which
increases the collision distance between the particles, i.e. λ, and therefore Cc. Thus, for
the same Stk50 value a decrease in pressure leads to a smaller cut-point. This method was
used in many initial designs (Hering et al., 1978; Berner et al., 1979; Hering et al., 1979;
Berner and Lurzer, 1980; Biswas and Flagan, 1984; Marjamaki et al., 2000), and is
generally called a low pressure impactor or a large pressure drop impactor (LPI). One of
the prototypes described herein uses this principle (see section 4.2).
The other method of collecting smaller particles is by employing large numbers of
small diameter nozzles. For example, one stage of the MOUDI has 2000 nozzles each
having a diameter of 52 μm, resulting in a cut-point of 0.056 μm for a flow rate of 30
slpm. This geometry also keeps the pressure drop small thus keeping the jet velocity low
(Marple et al., 1991). The second prototype described herein uses this principle of design
and is called a small pressure drop impactor (SPI).
Jet velocity and jet Reynolds number
For inertial impactors that operate at high velocities, flow through the nozzle
becomes compressible (Mach number, M>0.3), and the assumption that air density stays
constant across the jet is no longer valid. Therefore it is important to calculate the
temperature and density under these jet conditions before calculating the d50 and the jet
Reynolds number, Re.
46 Assuming adiabatic flow, the average jet velocity is calculated by iteration
using (Hering, 1987):
2
0
( 1)12
aMV VRT
γβγ
⎡ ⎤⎡ ⎤−= −⎢ ⎥⎢ ⎥
⎢ ⎥⎣ ⎦⎣ ⎦ (Eq. 4.6)
where β is the velocity for isothermal conditions, where γ is the heat capacity ratio (~1.4
for air), Ma is the molecular weight of air (28.96 kg kmol-1), R is the ideal gas constant
(8314 J K-1 kmol-1), P0, T0, and ρ0 are the pressure, temperature and density, respectively,
for upstream stagnation conditions, m is the mass flow rate, and A is the jet cross-section
area. The isothermal velocity, β, is calculated from
0
0
PmA P
βρ
⎛= ⎜⎝ ⎠
⎞⎟ (Eq. 4.7)
The jet velocity increases with decreasing pressure ratio (r = P/P0) until it reaches a sonic
limit, after which further reductions in pressure have no effect on the jet velocity (Biswas
and Flagan, 1984). This condition is called critical (or chocked) flow and is reached when
( 1)
0
2( 1)
PrP
γγ
γ
⎛ ⎞⎜ ⎟−⎝ ⎠⎛ ⎞
∗ = >⎜ ⎟+⎝ ⎠ (Eq. 4.8)
Therefore the jet velocity at this condition is:
02( 1)critical
a
VM
γγ
⎛ ⎞= ⎜ +⎝ ⎠
RT ⎟ (Eq. 4.9)
Once calculated, the jet velocity is used to determine the decrease in temperature caused
by the expansion of air downstream of the nozzle (Hering, 1987):
2
0( 1)
2aMVT T
Rγ −⎛= − ⎜
⎝ ⎠⎞⎟ (Eq. 4.10)
For compressible flow, air density changes appreciably near the impaction surface and
therefore has to be calculated in terms of upstream stagnation conditions, P0, T0 and ρ0
using (Hering, 1987),
00,
0air air
TPP T
ρ ρ⎛ ⎞⎛ ⎞= ⎜ ⎟⎜ ⎟
⎝ ⎠⎝ ⎠ (Eq.4.11)
47 Marple & Liu (1975) have shown that sharper cut-off diameters (an
approximate step like increase in efficiency from 0 to 100%) are attained for jet
Reynolds numbers in the range of 500-3000. The jet Reynolds number, Re, is defined as
the ratio of inertial to viscous forces on a particle and is given as,
Re airVDρη
= (Eq. 4.12)
where airρ is density of air at pressure P calculated via Eq. 4.11. For Reynolds numbers
larger than 3000, velocity profile at the nozzle exit is not greatly affected while for that
lower than 100, poor cut-off characteristics are noticed (Marple and Liu, 1975).
In the case of multi-jet impactors, cross-flow interferences at the impaction
surface, resulting from the flow of air through many nozzles, can reduce the collection
efficiency (Fang et al., 1991). Therefore, it is desirable to space the nozzles far enough to
decrease this potential interference. Fang et al. (1991) derived an expression for the
cross-flow parameter (CFP), using which, we can predict the jet centerline deflection
caused by cross-flow and can be expressed as:
4 c
DNCFPD
= (Eq. 4.13)
where, D is the nozzle diameter, N is the number of nozzles, and Dc the diameter of the
nozzle cluster. For mutlijet impactors to operate satisfactorily, CFP should be less than
1.2 (Fang et al., 1991).
4.1.2 Aerosol Volatilization by Thermal Desorption
Thermal desorption (TD) is a common approach to analyze solid or liquid
components with gas detectors. Samples are heated to volatilize condensed phase species,
where the heat required is a function of a compound’s enthalpy of vaporization or heat of
vaporization, ΔvH. Until recently, TD techniques used for analysis of organic aerosol
have been off-line. The aerosols are first collected on a quartz fiber filter or a substrate
and later heated in vacuum and the gas analyzed. Schuetzle et al. (1975) used a
temperature programmed probe connected to a high-resolution mass spectrometer to
analyze aerosol collected on filters and impactor plates in Pasadena, CA. The probe was
48 heated from 20 to 400 oC allowing analysis of compounds based on their volatility.
They identified alkanes, alkenes, aromatics (naphthalene, PAHs), and many carboxylic
acids for the first time in smog aerosol using TD-MS.
More recently higher molecular weight n-alkanes (C20 – C33) and polycyclic
aromatic hydrocarbons (molecular weights 178 – 276) were identified using an offline
setup (Waterman et al., 2000). Taking it one step further Williams et al. (2006) and
Goldstein et al. (2008) coupled TD-GC/MS to an inertial impaction technique and
analyzed organic aerosols in near real-time. Temperature programmed TD has also been
used with particle beam MS to assess the range of vapor pressures in multi component
particles (Tobias and Ziemann, 1999). CIMS has recently been used for specific
compound identification using TD. Voisin et al. (2003) and Smith et al. (2004) used TD-
CIMS to detect inorganic compounds (sulfate, nitrate and ammonium) in ultrafine aerosol
(diameter range of 6 – 20 nm) in laboratory generated and ambient conditions
respectively. Hearn and Smith (2004a; 2006) and McNeill et al. (2007; 2008) coupled a
continuous-flow heated inlet to a CIMS to vaporize organic aerosol containing different
functional groups. These studies proved the ability of CIMS to detect organic ions with
minimal fragmentation and high selectivity, in a laboratory setting.
A major issue with the detection and quantification of ambient particulate organic
matter is that it is a mixture of numerous compounds with no single component
dominating the mass fraction. Quantification requires mass accumulation above the
detection limit of the technique. For example, a typical organic aerosol mass
concentration in a polluted setting is 5 μg m-3 of air, which corresponds to a gas-phase
mixing ratio of 0.61 ppb assuming an average molecular weight of 200 amu. If a
component were present at 1% of the mass, this level would correspond to 6.1 ppt when
volatilized, below the detection limit of state-of-the-art CIMS instrument. Therefore, we
need to couple a concentrator that can increase signal-to-noise without significant
reduction in sampling frequency.
This thesis describes the development and initial characterization of one such
aerosol-collection thermal-desorption technique, which is directly coupled to a CIMS,
and we call it the Micro-Orifice Volatilization Impactor (MOVI). A main advantage of
49this design is the ability to differentiate between gas- and condensed-phase products on
hourly timescales with high molecular specificity. Two prototype impactors have been
designed to test the MOVI-CIMS technique. The first prototype is a large pressure drop
impactor (LPI) in which the pressure is decreased from ambient (760 torr, 1000 hPa) to
60 torr (~ 80 hPa) to obtain a low cut-point diameter (d50 ~ 40 nm). The second prototype
has a smaller pressure drop across the nozzles and is thus called a small pressure drop
impactor (SPI). Design details along with various evaluation tests conducted to
characterize their performance are discussed in the next two sections.
4.2 IMPACTOR DESIGNS
4.2.1 Large pressure drop impactor (LPI)
The principle of using large pressure drop to collect aerosol was first tested by A.
Berner, in Europe, and S. V. Hering and her co-workers, in United States. Berner et al.
(1979; 1980) collected aerosol of 0.06 μm in diameter using a LPI with multiple stages
and also multiple nozzles in each stage. Using multiple nozzles decreases the jet velocity
and eliminates some of the complication associated with sonic and supersonic flows.
Hering et al. (1978; 1979) used a single nozzle LPI, with multiple pressure stages from 8
to 744 torr, to collect aerosols in the size range of 0.05 to 4.0 μm.
Flagan (1982) investigated and provided a theoretical formulation for changes in
physical parameters of the gas, due to fluid compressibility at sonic flow velocities
caused by a large pressure drop, and its effects on the fluid flow. The advantage of being
able to collect sub-micron size particles promoted substantial use of this design by many
researchers; Biswas and Flagan (1984), Hering (1987), Marjaamaki et al. (2000), and
Geller et al. (2002). Deposition of fine particles to surfaces or thin films and fine line
pattern formation by aerosol jet etching uses large pressure drop impaction. This wide use
of LPIs has led to an improvement in their design and mathematical modeling (Jurcik et
al., 1989).
Figure 4.2 shows a schematic of the LPI constructed for this thesis. The impactor
manifold housing is designed such that it is directly connected to the ion-molecule region
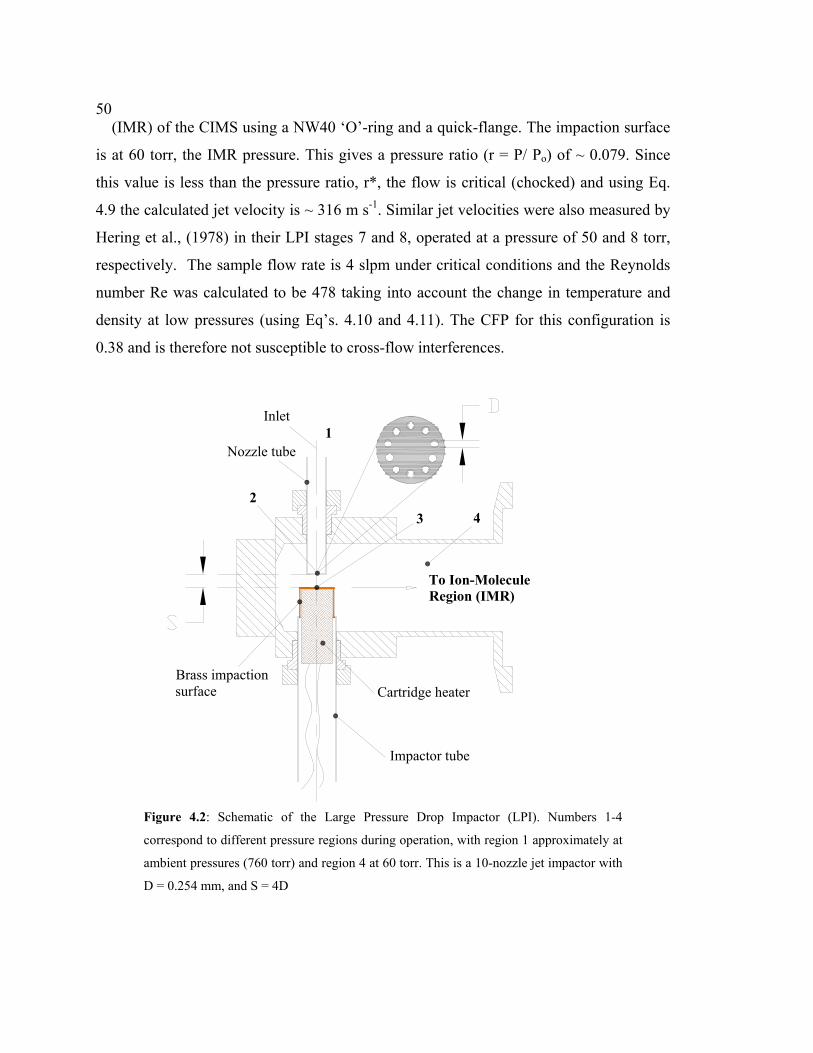
50 (IMR) of the CIMS using a NW40 ‘O’-ring and a quick-flange. The impaction surface
is at 60 torr, the IMR pressure. This gives a pressure ratio (r = P/ Po) of ~ 0.079. Since
this value is less than the pressure ratio, r*, the flow is critical (chocked) and using Eq.
4.9 the calculated jet velocity is ~ 316 m s-1. Similar jet velocities were also measured by
Hering et al., (1978) in their LPI stages 7 and 8, operated at a pressure of 50 and 8 torr,
respectively. The sample flow rate is 4 slpm under critical conditions and the Reynolds
number Re was calculated to be 478 taking into account the change in temperature and
density at low pressures (using Eq’s. 4.10 and 4.11). The CFP for this configuration is
0.38 and is therefore not susceptible to cross-flow interferences.
Inlet
Nozzle tube
To Ion-Molecule Region (IMR)
Cartridge heater
Impactor tube
Brass impaction surface
1
23 4
Figure 4.2: Schematic of the Large Pressure Drop Impactor (LPI). Numbers 1-4
correspond to different pressure regions during operation, with region 1 approximately at
ambient pressures (760 torr) and region 4 at 60 torr. This is a 10-nozzle jet impactor with
D = 0.254 mm, and S = 4D
51 The LPI is a single stage impactor with 10 nozzles. These nozzles are equally
spaced in a circular patter, each with a diameter D = 254 μm, drilled into a 0.635 cm
(0.25 inches) aluminum tube which is placed S = 4D = 1mm from the collection surface.
A circular pattern for the nozzles was chosen because this was shown to produce minimal
cross flow interference (Kwon et al., 2002). The collection (or impaction) surface is a
small stub machined from brass and soldered to a 1.27 cm (0.5 inches) OD stainless steel
tube. The underside of the brass impaction surface is resistively heated using a 0.95 cm
(0.375 inches) OD, 5 cm (2 inches) long cartridge heater inserted into the stainless tube
and connected to a variable-AC power controller.
We chose brass for the impaction surface because of its thermal conductivity,
coefficient of thermal expansion (CTE) and its inertness in an oxidizing atmosphere
relative to copper. Brass has a higher thermal conductivity (123 W m-1 K-1 at 100 oC) than
stainless steel (16.3 W m-1 K-1 at 100 oC) which helps maintain a constant temperature
profile across the impaction surface, minimizing any “cold spots”. Although copper has a
higher thermal conductivity (395 W m-1 K-1 at 100 oC) than brass, it expands more at
higher temperatures and can readily oxidize altering the deposited aerosol matrix making
it unsuitable for this application. Both the nozzle tube and the collection surface tube are
mounted on to the manifold block using Swagelok compression fittings. The aluminum
manifold block is 3.7 cm (1.45 inches) in diameter at the center and 7.24 cm (2.85 inches)
long with ports for the nozzle and impaction tubes, at a distance of 5 cm (2 inches) from
the NW 40 quick-flange.
During sampling, aerosols are collected on the brass impaction surface at room
temperature (~ 25 oC) while the gas along with aerosols below the d50 follow into the
IMR region. Here, the gas is ionized by the reagent ions and a small part of it is sampled
into the quadrupole chamber and mass analyzed while most of it is pumped away. After
collection, as the cartridge heater ramps the impaction surface temperature upto ~ 100 oC,
the sample air is replaced with dry N2, and the collected particle material desorbs into this
carrier gas.
An advantage of the LPI is its ability to collect particles as small as 0.04 μm
(theoretical d50) in diameter. But operation at reduced pressures provides some potential
52 disadvantages. One disadvantage is the potential for loss of semi volatile organics from
aerosols when collected at low pressures. Another disadvantage is a possibility for higher
particle bounce-off due to high jet velocities. Particle bounce is a well documented
problem for inertial impactors and ultimately leads to reduced collection efficiency,
especially for solid particles. In addition, in the present design, the large surface area
downstream of the impaction surface, before the sample molecules are ionized, increases
the chance for low volatility species to condense onto the walls causing a delayed
response and/or increased transfer loss unless these surfaces are also heated continuously.
To address some of these limitations, a new impactor which has a much smaller pressure
drop compared to the LPI was also designed and is described below.
4.2.2 Small Pressure Drop Impactor (SPI)
The goal of this design was to develop an impactor with as small as a cut-point
diameter and pressure drop as possible while minimizing the potential for loss of semi-
volatiles (as in the LPI at 60 torr). A schematic of the design is shown in Fig. 4.3. This
configuration is also a single stage, mutlijet impactor with 100 nozzles, each with a
diameter D = 0.15 μm drilled into a 1.27 cm (0.5 inches) OD aluminum tube. The
impaction surface is still brass and has the same design as that in the LPI.
The main difference from the LPI, apart from the number of nozzles, is that the
impaction surface and the IMR regions are separated by a 0.55mm diameter orifice which
helps maintain a higher pressure in the impaction region and limits the IMR flow to 2.0
slpm. A small vacuum pump connected to a 0.95 cm (0.375 inches) Swagelok
compression fitting along with an inline orifice maintains a sample flow of 10 slpm
through the nozzles. An added advantage that the SPI provides is the decrease in sample
collection time, and thus a higher time resolution, because of more than twice the sample
flow rate relative to the LPI. Also, the amount of surface area exposed to the sample gas
has been decreased substantially to reduce condensation of semi-volatile and low-volatile
vapors. For the design and flow conditions above, pressure drop across the nozzles is 114
torr (15% of ambient) resulting in a downstream pressure of 646 torr. A plot of the
pressure drop as a function of the sample flow is shown in Fig 4.4 for the SPI. Using the
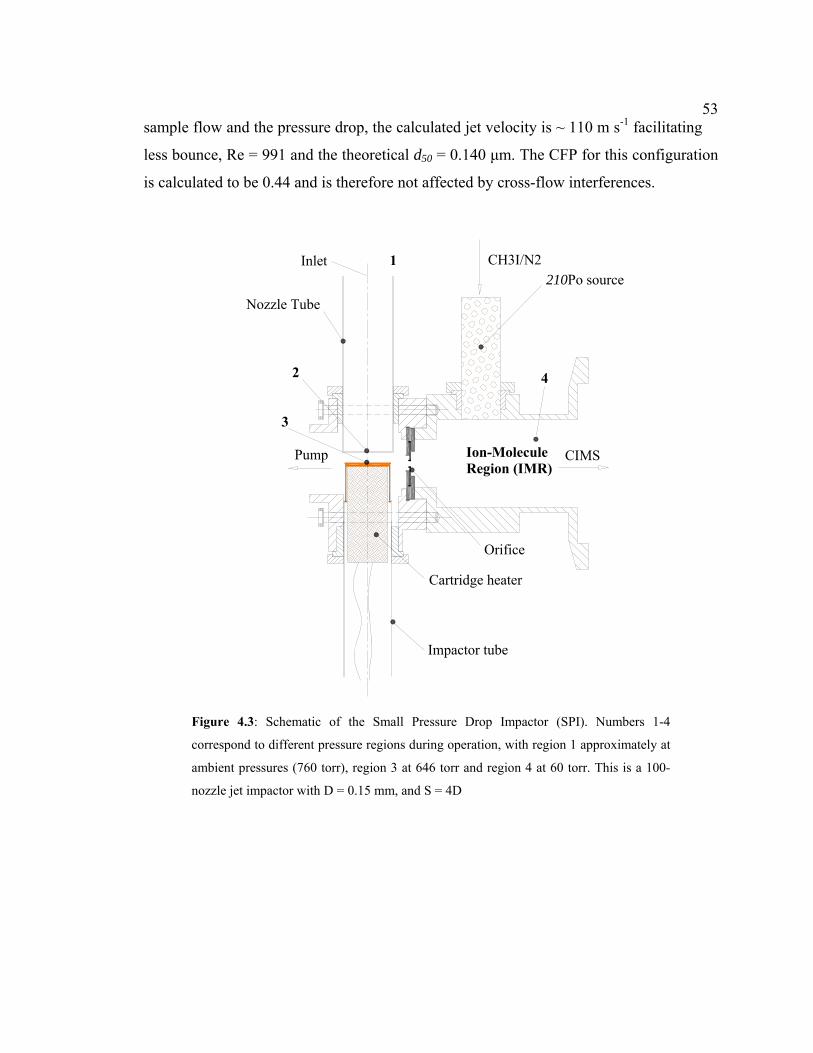
53sample flow and the pressure drop, the calculated jet velocity is ~ 110 m s-1 facilitating
less bounce, Re = 991 and the theoretical d50 = 0.140 μm. The CFP for this configuration
is calculated to be 0.44 and is therefore not affected by cross-flow interferences.
Nozzle Tube
Pump
210Po source
Ion-Molecule Region (IMR)
CIMS
Impactor tube
Cartridge heater
Orifice
Inlet 1
2
3
4
CH3I/N2
Figure 4.3: Schematic of the Small Pressure Drop Impactor (SPI). Numbers 1-4
correspond to different pressure regions during operation, with region 1 approximately at
ambient pressures (760 torr), region 3 at 646 torr and region 4 at 60 torr. This is a 100-
nozzle jet impactor with D = 0.15 mm, and S = 4D
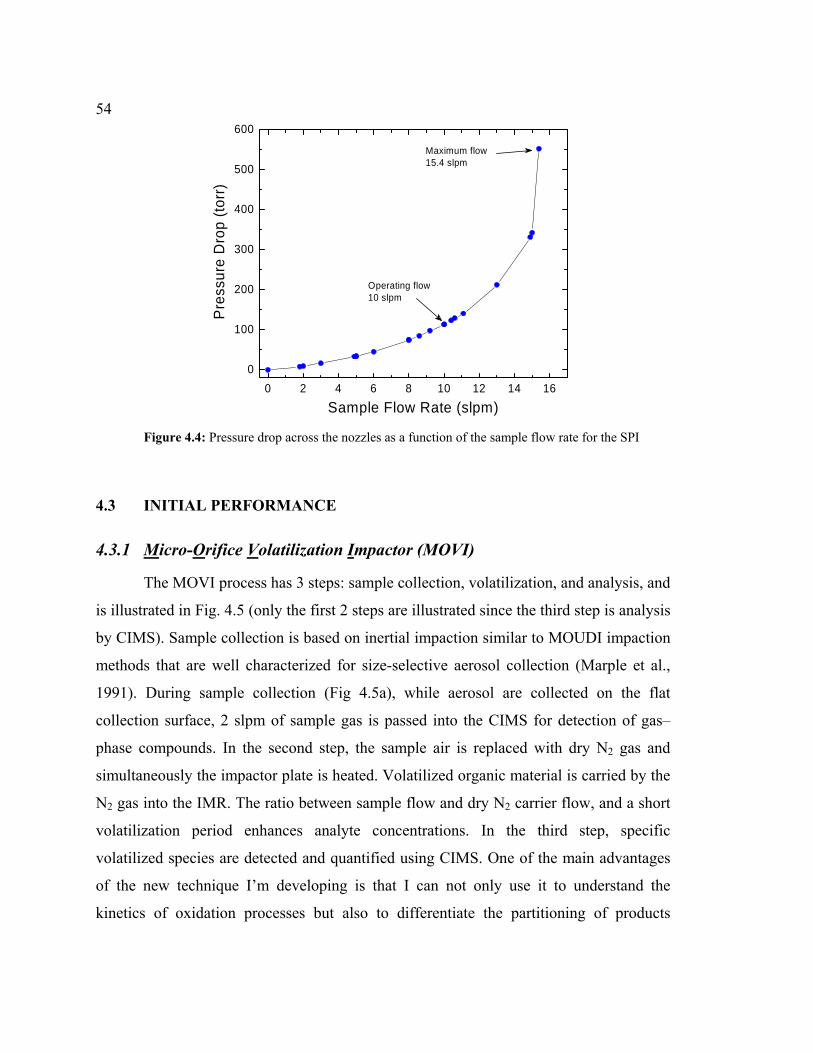
54
0 2 4 6 8 10 12 14 160
100
200
300
400
500
600
Operating flow10 slpm
Pre
ssur
e D
rop
(torr
)
Sample Flow Rate (slpm)
Maximum flow15.4 slpm
Figure 4.4: Pressure drop across the nozzles as a function of the sample flow rate for the SPI
4.3 INITIAL PERFORMANCE
4.3.1 Micro-Orifice Volatilization Impactor (MOVI)
The MOVI process has 3 steps: sample collection, volatilization, and analysis, and
is illustrated in Fig. 4.5 (only the first 2 steps are illustrated since the third step is analysis
by CIMS). Sample collection is based on inertial impaction similar to MOUDI impaction
methods that are well characterized for size-selective aerosol collection (Marple et al.,
1991). During sample collection (Fig 4.5a), while aerosol are collected on the flat
collection surface, 2 slpm of sample gas is passed into the CIMS for detection of gas–
phase compounds. In the second step, the sample air is replaced with dry N2 gas and
simultaneously the impactor plate is heated. Volatilized organic material is carried by the
N2 gas into the IMR. The ratio between sample flow and dry N2 carrier flow, and a short
volatilization period enhances analyte concentrations. In the third step, specific
volatilized species are detected and quantified using CIMS. One of the main advantages
of the new technique I’m developing is that I can not only use it to understand the
kinetics of oxidation processes but also to differentiate the partitioning of products
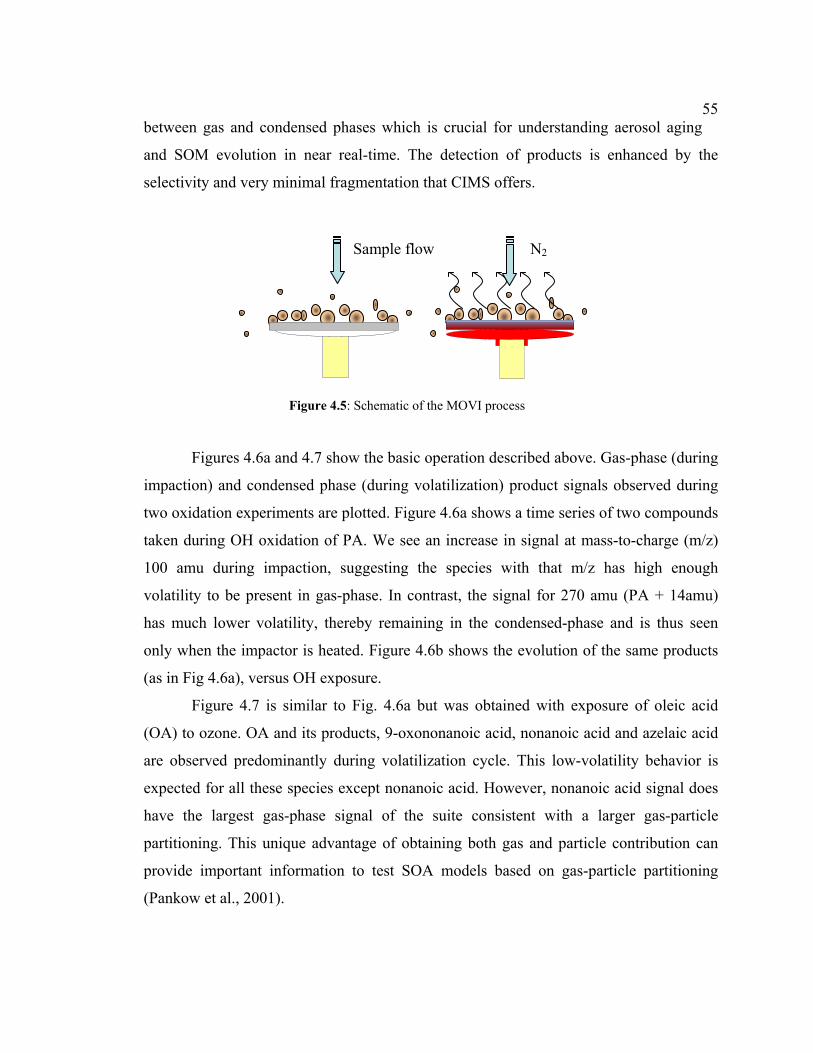
55between gas and condensed phases which is crucial for understanding aerosol aging
and SOM evolution in near real-time. The detection of products is enhanced by the
selectivity and very minimal fragmentation that CIMS offers.
N2Sample flow
Figure 4.5: Schematic of the MOVI process
Figures 4.6a and 4.7 show the basic operation described above. Gas-phase (during
impaction) and condensed phase (during volatilization) product signals observed during
two oxidation experiments are plotted. Figure 4.6a shows a time series of two compounds
taken during OH oxidation of PA. We see an increase in signal at mass-to-charge (m/z)
100 amu during impaction, suggesting the species with that m/z has high enough
volatility to be present in gas-phase. In contrast, the signal for 270 amu (PA + 14amu)
has much lower volatility, thereby remaining in the condensed-phase and is thus seen
only when the impactor is heated. Figure 4.6b shows the evolution of the same products
(as in Fig 4.6a), versus OH exposure.
Figure 4.7 is similar to Fig. 4.6a but was obtained with exposure of oleic acid
(OA) to ozone. OA and its products, 9-oxononanoic acid, nonanoic acid and azelaic acid
are observed predominantly during volatilization cycle. This low-volatility behavior is
expected for all these species except nonanoic acid. However, nonanoic acid signal does
have the largest gas-phase signal of the suite consistent with a larger gas-particle
partitioning. This unique advantage of obtaining both gas and particle contribution can
provide important information to test SOA models based on gas-particle partitioning
(Pankow et al., 2001).
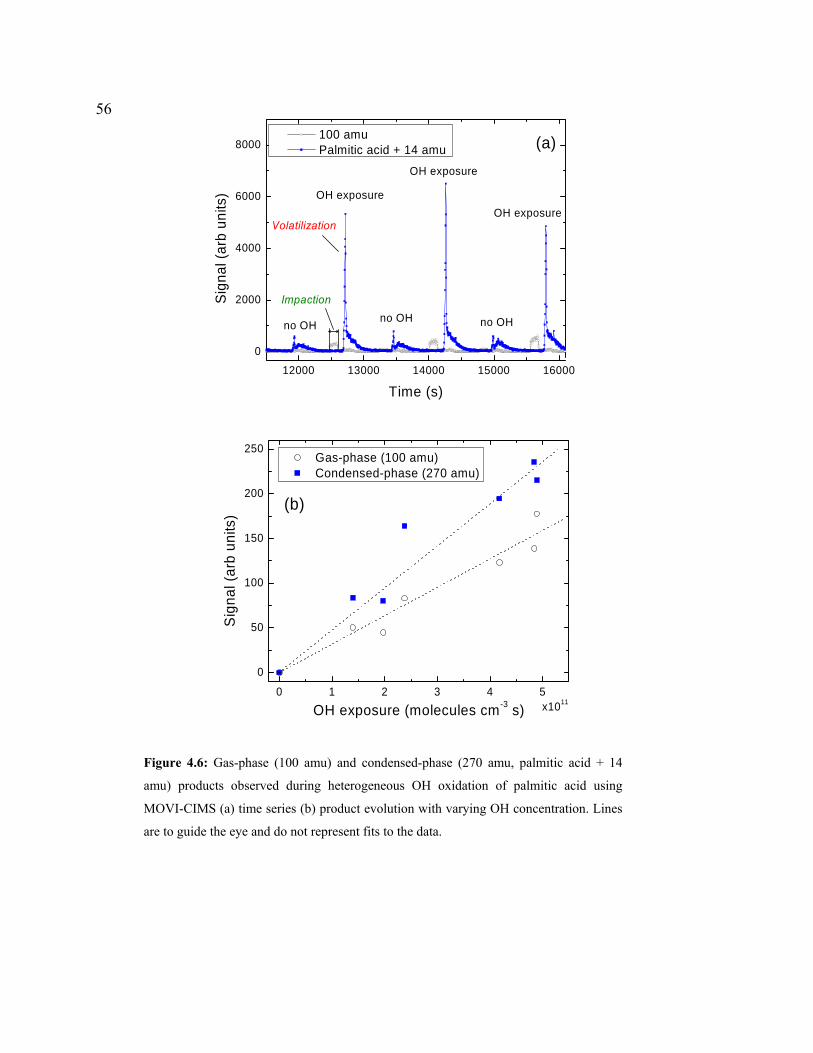
56
12000 13000 14000 15000 16000
0
2000
4000
6000
8000
OH exposure
OH exposure
OH exposure
no OHno OHno OH
100 amu (a)
VolatilizationSi
gnal
(arb
uni
ts)
Time (s)
Palmitic acid + 14 amu
Impaction
0 1 2 3 4 5
0
50
100
150
200
250 Gas-phase (100 amu) Condensed-phase (270 amu)
Sig
nal (
arb
units
)
OH exposure (molecules cm-3 s) x1011
(b)
Figure 4.6: Gas-phase (100 amu) and condensed-phase (270 amu, palmitic acid + 14
amu) products observed during heterogeneous OH oxidation of palmitic acid using
MOVI-CIMS (a) time series (b) product evolution with varying OH concentration. Lines
are to guide the eye and do not represent fits to the data.
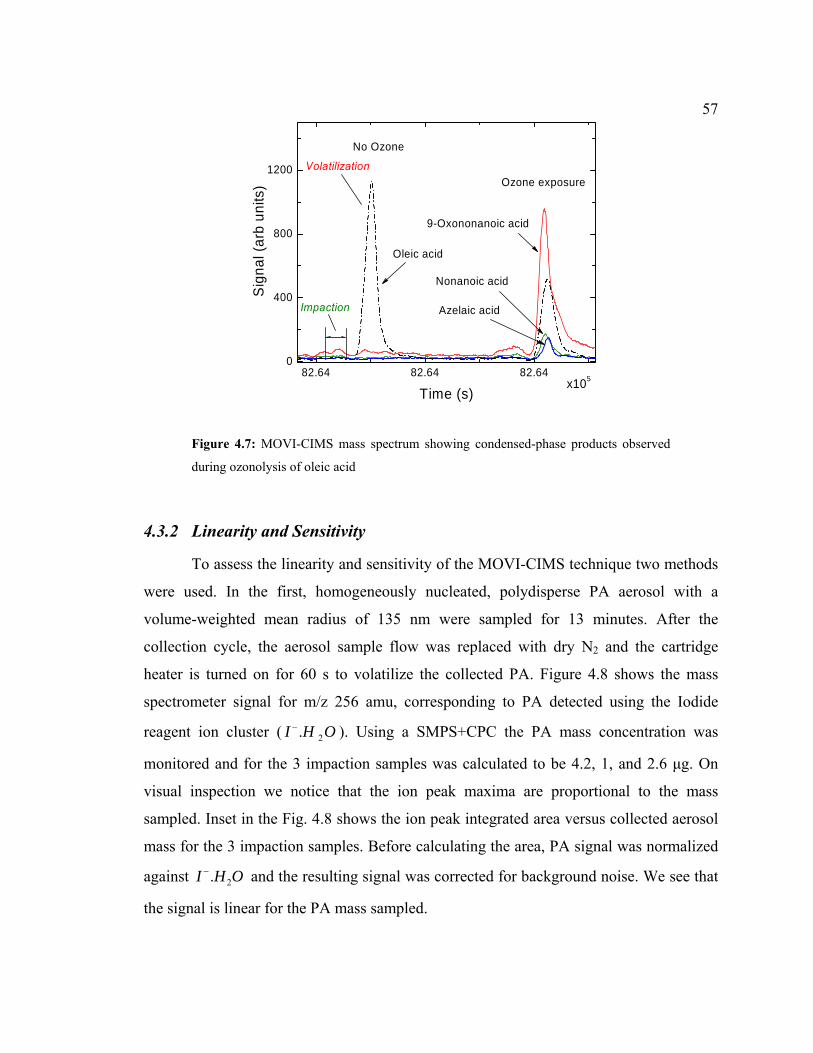
57
82.64 82.64 82.640
400
800
1200Ozone exposure
Volatilization
Azelaic acid
Nonanoic acid
Sig
nal (
arb
units
)
Time (s)
Oleic acid
9-Oxononanoic acid
No Ozone
x105
Impaction
Figure 4.7: MOVI-CIMS mass spectrum showing condensed-phase products observed
during ozonolysis of oleic acid
4.3.2 Linearity and Sensitivity
To assess the linearity and sensitivity of the MOVI-CIMS technique two methods
were used. In the first, homogeneously nucleated, polydisperse PA aerosol with a
volume-weighted mean radius of 135 nm were sampled for 13 minutes. After the
collection cycle, the aerosol sample flow was replaced with dry N2 and the cartridge
heater is turned on for 60 s to volatilize the collected PA. Figure 4.8 shows the mass
spectrometer signal for m/z 256 amu, corresponding to PA detected using the Iodide
reagent ion cluster ( 2.I H O− ). Using a SMPS+CPC the PA mass concentration was
monitored and for the 3 impaction samples was calculated to be 4.2, 1, and 2.6 μg. On
visual inspection we notice that the ion peak maxima are proportional to the mass
sampled. Inset in the Fig. 4.8 shows the ion peak integrated area versus collected aerosol
mass for the 3 impaction samples. Before calculating the area, PA signal was normalized
against 2.I H O− and the resulting signal was corrected for background noise. We see that
the signal is linear for the PA mass sampled.

58
0 500 1000 1500 2000 2500 3000 35000
1000
2000
3000
4000
5000
10000
100000
1 2 3 40.0
0.5
1.0
1.5
2.0
Nor
mal
ized
pea
k ar
ea (a
rb u
nits
)
Palmitic acid sampled (μg)
Impaction
13 min
Impaction
13 min
Sig
nal (
arb
units
)
Time (s)
I-(H2O)
I-(Palmitic acid)
Impaction
13 min
Figure 4.8: Time series of Palmitic acid aerosol obtained using the LPI
0.0 0.2 0.4 0.6 0.8 1.0
0
1
2
3
4
Nor
mal
ized
pea
k ar
ea (a
rb u
nits
)
Palmitic acid sampled (μg) Figure 4.9: Calibration curve for the LPI using Palmitic acid
The second method is a direct deposition method. First, a known amount of PA is
dissolved in acetone and deposited on the brass collection surface of the impactor using a
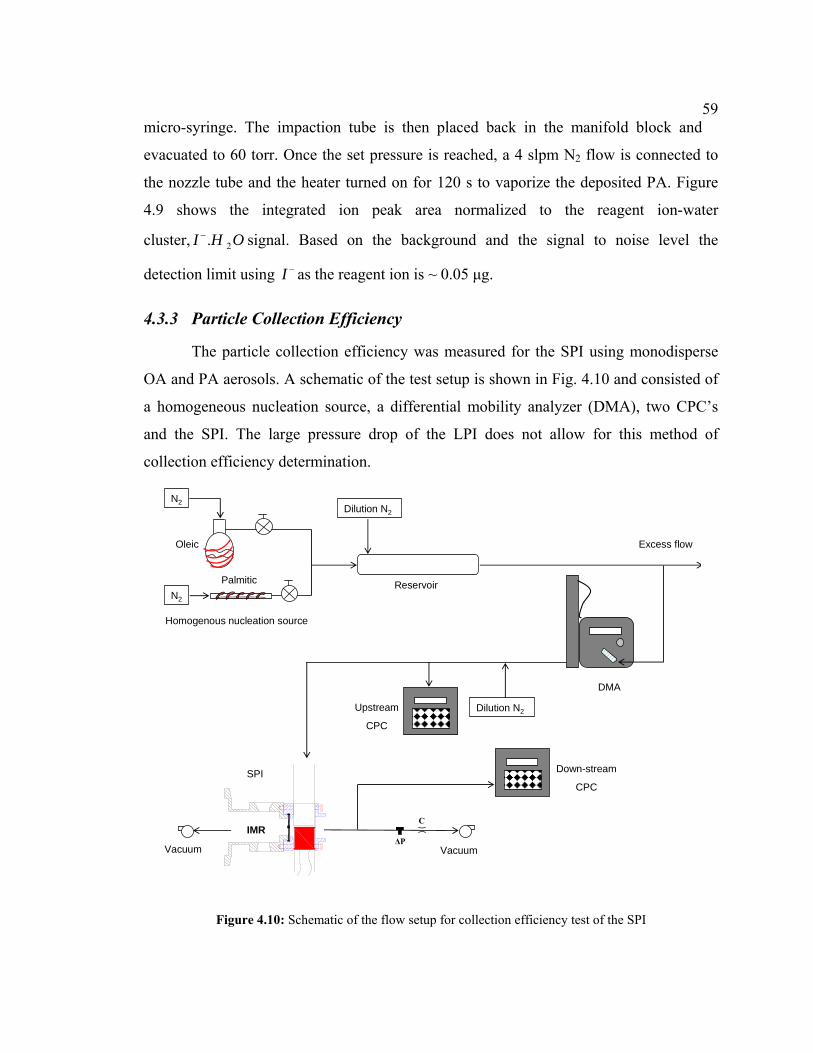
59micro-syringe. The impaction tube is then placed back in the manifold block and
evacuated to 60 torr. Once the set pressure is reached, a 4 slpm N2 flow is connected to
the nozzle tube and the heater turned on for 120 s to vaporize the deposited PA. Figure
4.9 shows the integrated ion peak area normalized to the reagent ion-water
cluster, 2.I H O− signal. Based on the background and the signal to noise level the
detection limit using I − as the reagent ion is ~ 0.05 μg.
4.3.3 Particle Collection Efficiency
The particle collection efficiency was measured for the SPI using monodisperse
OA and PA aerosols. A schematic of the test setup is shown in Fig. 4.10 and consisted of
a homogeneous nucleation source, a differential mobility analyzer (DMA), two CPC’s
and the SPI. The large pressure drop of the LPI does not allow for this method of
collection efficiency determination.
N2
N2Dilution N2
Reservoir
Homogenous nucleation source
Excess flow
DMA
Dilution N2Upstream
CPC
VacuumΔP
Vacuum
Down-stream
CPC
C
SPI
Palmitic
Oleic
IMR
Figure 4.10: Schematic of the flow setup for collection efficiency test of the SPI
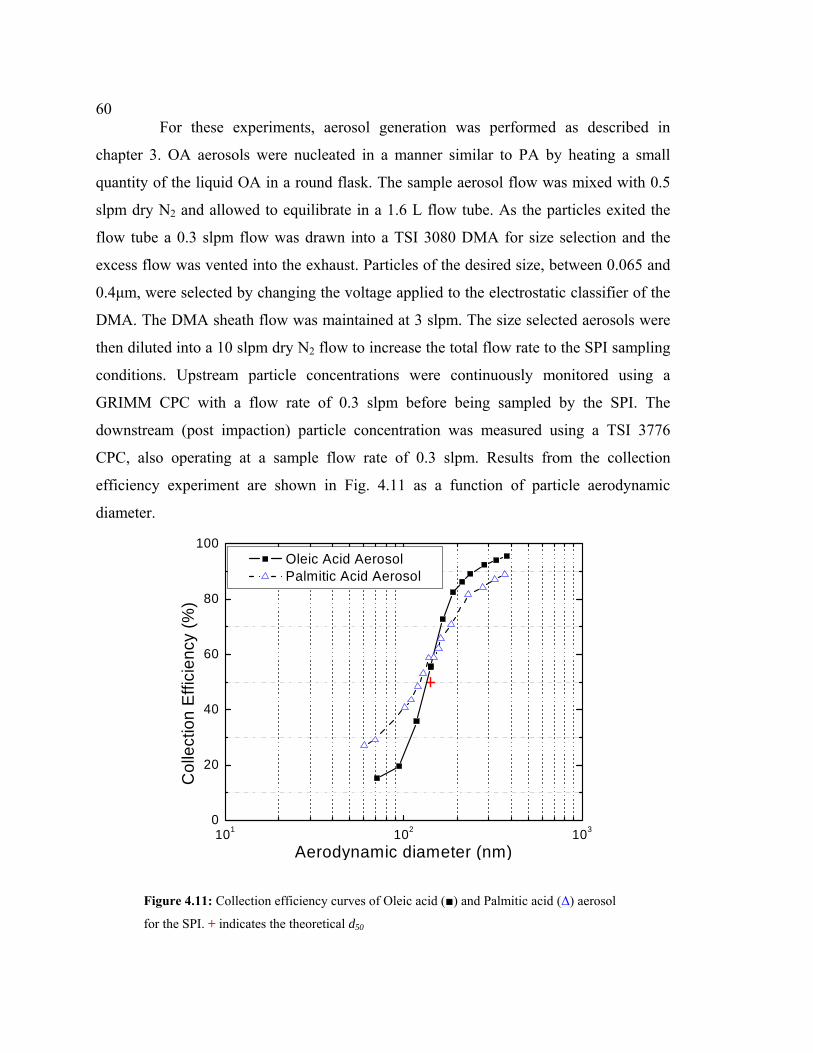
60 For these experiments, aerosol generation was performed as described in
chapter 3. OA aerosols were nucleated in a manner similar to PA by heating a small
quantity of the liquid OA in a round flask. The sample aerosol flow was mixed with 0.5
slpm dry N2 and allowed to equilibrate in a 1.6 L flow tube. As the particles exited the
flow tube a 0.3 slpm flow was drawn into a TSI 3080 DMA for size selection and the
excess flow was vented into the exhaust. Particles of the desired size, between 0.065 and
0.4μm, were selected by changing the voltage applied to the electrostatic classifier of the
DMA. The DMA sheath flow was maintained at 3 slpm. The size selected aerosols were
then diluted into a 10 slpm dry N2 flow to increase the total flow rate to the SPI sampling
conditions. Upstream particle concentrations were continuously monitored using a
GRIMM CPC with a flow rate of 0.3 slpm before being sampled by the SPI. The
downstream (post impaction) particle concentration was measured using a TSI 3776
CPC, also operating at a sample flow rate of 0.3 slpm. Results from the collection
efficiency experiment are shown in Fig. 4.11 as a function of particle aerodynamic
diameter.
101 102 1030
20
40
60
80
100 Oleic Acid Aerosol Palmitic Acid Aerosol
Col
lect
ion
Effic
ienc
y (%
)
Aerodynamic diameter (nm)
Figure 4.11: Collection efficiency curves of Oleic acid (■) and Palmitic acid (Δ) aerosol
for the SPI. + indicates the theoretical d50
61The collection efficiency (CE) for a particle of diameter dp was calculated using the
equation:
( )
(%) 1 100( )
p down stream
p up stream o
N d PCEN d P
−
−
⎛ ⎞⎛ ⎞= − ×⎜ ⎜⎜⎜ ⎝ ⎠⎝ ⎠
⎟⎟⎟⎟ (Eq. 4.14)
here, N(dp)down-stream is the particle number concentration after the impactor whereas
N(dp)up-stream is the particle number concentration before the impactor, and is the
correction for the reduced pressure at the collection surface (Kreisberg, N. M., Aerosol
Dynamics, CA., personal communication). As predicted by impaction theory, the
experimental data for each particle type falls on a single curve with a cut-point (d
/ oP P
50) of
0.13 μm. The experimental d50 is in good agreement with the designed value of 0.14 μm
(shown as + in the figure). The critical stokes number (stokes number corresponding to
50% collection efficiency) is 0.21 and is similar to that suggested for round jet impactors
(Hinds, 1999). In determining the collection efficiency, it was assumed that the collection
of particles on the inside walls (wall loss) of the manifold block was negligible.
4.4 APPLICATION TO LABORATORY STUDIES OF HETEROGENEOUS
OXIDATION
To assess the performance of the MOVI-CIMS technique, I performed an array of
experiments using two heterogeneous reactions. The first was reactive uptake of O3 by
unsaturated liquid organic aerosol particles, and the other was OH oxidation of PA
aerosol (solid). These tests allow comparison of the results obtained with the MOVI-
CIMS technique to those obtained by independent investigations and instruments, and
those I obtained with the continuous-flow heated inlet setup described in Chapter 3.
These comparisons demonstrate the advantages and disadvantages of the MOVI-CIMS as
a tool for laboratory/chamber studies of particulate organic matter.
62 4.4.1 Ozonolysis of Unsaturated Organic Aerosol Particles
The main motivation for this study was to asses the reactive uptake of O3 on OA
aerosol using the MOVI-CIMS technique because this particular reaction is very well-
studied thereby allowing us to compare the MOVI performance both qualitatively and
quantitatively to the results of other OA ozonolysis studies. A detailed review of OA-O3
kinetic studies was recently published (Zahardis and Petrucci, 2007).
OA is a C18-monounsaturated fatty acid (see Fig. 4.12). It is ubiquitously found in
tropospheric aerosols with the main sources being meat cooking and motor vehicle
emissions (Rogge et al., 1993). Because of its chemical structure, it readily reacts with O3
via addition to the double bond. OA forms liquid aerosol particles at room temperature
when homogeneously nucleated, eliminating complications of particle shape and
structure associated with solid particles. Hence, it makes a good proxy for liquid
particulate organic matter and has been used for oxidative aging studies quite extensively
(Moise and Rudich, 2002; Morris et al., 2002; Smith et al., 2002; Knopf et al., 2005;
Ziemann, 2005; Hearn et al., 2005a; Docherty and Ziemann, 2006; Hearn and Smith,
2007b).
Figure 4.12: Chemical structure of Oleic acid (C18H34O2)
Experimental
Except for the aerosol generation, most of the experimental setup to study OA
ozonolysis is similar to that described in the previous chapter for OH oxidation of PA
(see Fig. 3.3). Therefore only the major differences are highlighted below. Figure 4.12 is
a schematic of the experimental setup used for this study.
Polydisperse OA aerosols were generated as described in section 4.3.3 with a flow
rate of 0.2 slpm through the source. To this flow, 0.8 slpm dry N2 and 0.4 slpm O2 was
added. Ozone was added immediately before the particle-laden flow entered the reaction
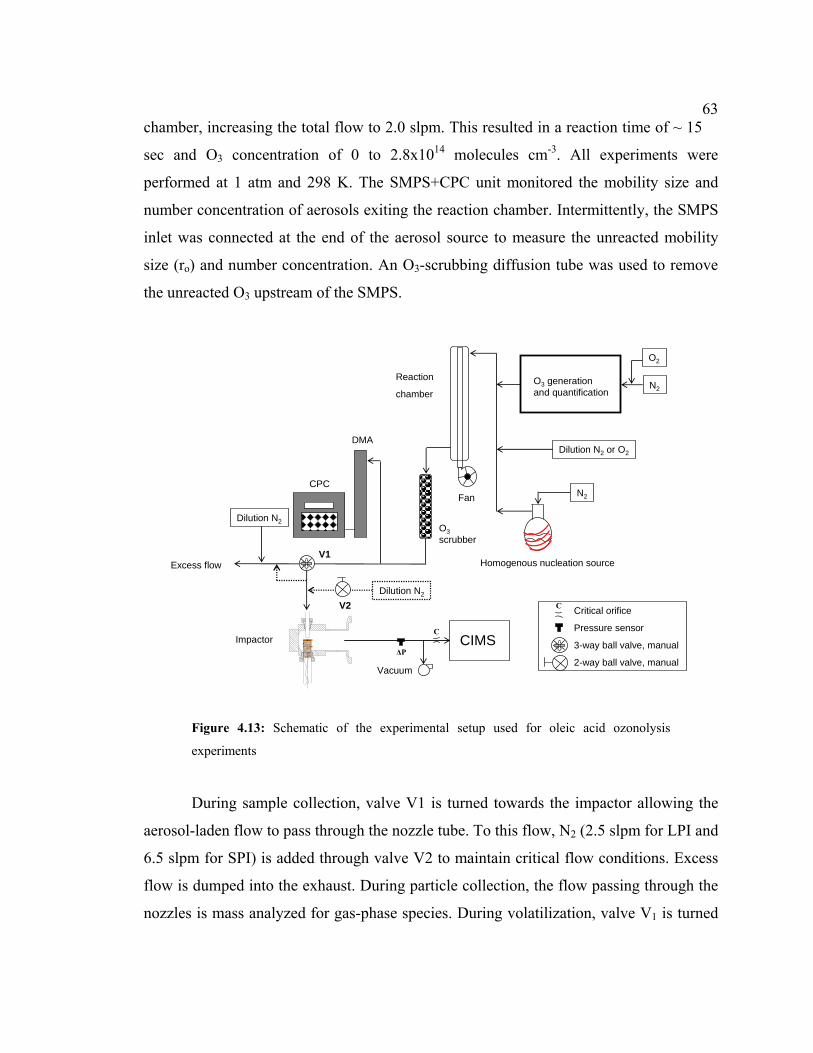
63chamber, increasing the total flow to 2.0 slpm. This resulted in a reaction time of ~ 15
sec and O3 concentration of 0 to 2.8x10¹⁴ molecules cm-3. All experiments were
performed at 1 atm and 298 K. The SMPS+CPC unit monitored the mobility size and
number concentration of aerosols exiting the reaction chamber. Intermittently, the SMPS
inlet was connected at the end of the aerosol source to measure the unreacted mobility
size (ro) and number concentration. An O3-scrubbing diffusion tube was used to remove
the unreacted O3 upstream of the SMPS.
N2
N2
O2
Dilution N2 or O2
Fan
O3scrubber
CPC
DMA
Homogenous nucleation source
O3 generation and quantification
Reaction
chamber
Excess flow
CIMS
Dilution N2
V1
V2
Impactor
Dilution N2
C
ΔP
Vacuum
C Critical orifice
Pressure sensor
3-way ball valve, manual
2-way ball valve, manual
Figure 4.13: Schematic of the experimental setup used for oleic acid ozonolysis
experiments
During sample collection, valve V1 is turned towards the impactor allowing the
aerosol-laden flow to pass through the nozzle tube. To this flow, N2 (2.5 slpm for LPI and
6.5 slpm for SPI) is added through valve V2 to maintain critical flow conditions. Excess
flow is dumped into the exhaust. During particle collection, the flow passing through the
nozzles is mass analyzed for gas-phase species. During volatilization, valve V1 is turned
64 such that the reactor effluent bypasses the impactor inlet and is directly exhausted. The
dilution N2 flow is increased at the impactor inlet to make-up for the shunted reacted flow
(2 slpm). Simultaneously, the aerosol collection surface is rapidly heated to ~ 100 oC,
vaporizing the collected mass. For this study, both the sample collection and vaporization
was for 60 s each. After the volatilization cycle, the heater is turned off and the impactor
is allowed to cool for ~ 6 minutes with the help of 2 small AC-powered fans. At the end
of the cooling cycle, dilution N2 flow through value V2 is decreased and V1 is opened for
sample collection again. This procedure is repeated for various reactant concentrations to
develop an understanding of the reaction kinetics. Organic acid detection was by fluoride
( ) transfer with as the reagent ion. Trace amounts of was added to 4 slpm NF −6SF −
6SF 2
before the flow entered a 210Po α-particle source.
Results
Figures 4.14 and 4.15 show the decay of OA as a function of O3 exposure
obtained using the LPI and SPI for volume-weighted mean mobility radius of 75 and 93
nm, respectively. The decay of OA is given as (Worsnop et al., 2002):
3
33[ ]
4
OgasO mea
p
n cd OAdt r
γ= − s
(Eq. 4.15)
where, 3
gasOn is the number density of O3 (molecules cm-3), c the mean thermal velocity of
O3 molecules (cm s-1), rp is the particle radius (cm) and 3Omeasγ is the reaction probability of
O3 with OA particles. But as described in section 3.1.3, the measured reaction probability
is a combination of various other microphysical parameters and thus has to be decoupled
from individual components to obtain the true value, 3Otrueγ . Typically 3Oγ is calculated by
using five limiting cases (Smith et al., 2002; Worsnop et al., 2002; Hearn et al., 2005a).
These cases are: (a) uptake limited by gas-phase diffusion of the oxidant, , or mass
accommodation ,α , (b) uptake controlled by fast reaction, (c) uptake controlled by slow
reaction, (d) uptake limited by reaction at the surface, and finally (e) uptake limited by
diffΓ
65particle-phase diffusion of the oxidant, p
diffΓ . Some studies have reported that OA is
depleted in sub-surface layers (approximately <5% of the particle radius) suggesting a
fast reaction of O3 with OA, as in case 2 (Moise and Rudich, 2002; Morris et al., 2002).
In contrast Hearn et al. (2005a) have argued that the reaction between OA and O3 is
mainly surface limited.
The solution for the case where it is assumed that O3 reacts only in sub-surface
layers is,
3 3
0 0
3( ) 12
gas pO O
p
RTn H D kOA t tOA r OA
= − (Eq. 4.16)
and 3Oγ can be calculated using the expression,
3304 p
OOHRT D kOA
cγ = (Eq. 4.17)
where, R is the universal gas constant (8.206x10⁻² atm K-1 M-1), T is temperature (K), H is
the Henry’s law coefficient (M atm-1 L-1), k is the second order rate constant for the
reaction of OA with O3, OA0 is the initial particle-phase concentration of OA at time t=0
(OA0 = 3.15M). Equation 4.16 indicates that a plot of 0/OA OA as a function of O3
exposure yield straight lines with slopes inversely proportional to the particle radius. The
straight line (---) shown in Figs. 4.14a and 4.15a is the fit using Eq. 4.16 with 3
pOH D k =
0.15 and 0.17 M1/2 atm-1 cm s-1 for the LPI and SPI, respectively Substituting this value
into Eq. 4.17 yields the reaction probability for O3 on OA, 3Oγ = (7.2±1.5)x10-4 and
(8.1±3)x10-4
This value of 3Oγ is similar to the other OA-O3 kinetic studies (Moise and Rudich,
2002; Thornberry and Abbatt, 2004; Hearn and Smith, 2004b; Knopf et al., 2005; Hearn
et al., 2005a). Hearn and Smith (2004b) measured 3Oγ = (7.5±1.2)x10-4 for particle sizes
ranging from 0.8 to 1.5 µm with a maximum O3 exposure of 5x10⁻⁴ atm s. Both Moise
and Rudich (2002) and Thornberry and Abbatt (2004) using OA coated tubes and
measuring the loss of gas-phase O3 with a CIMS reported 3Oγ = (8.3±0.2)x10-4 and
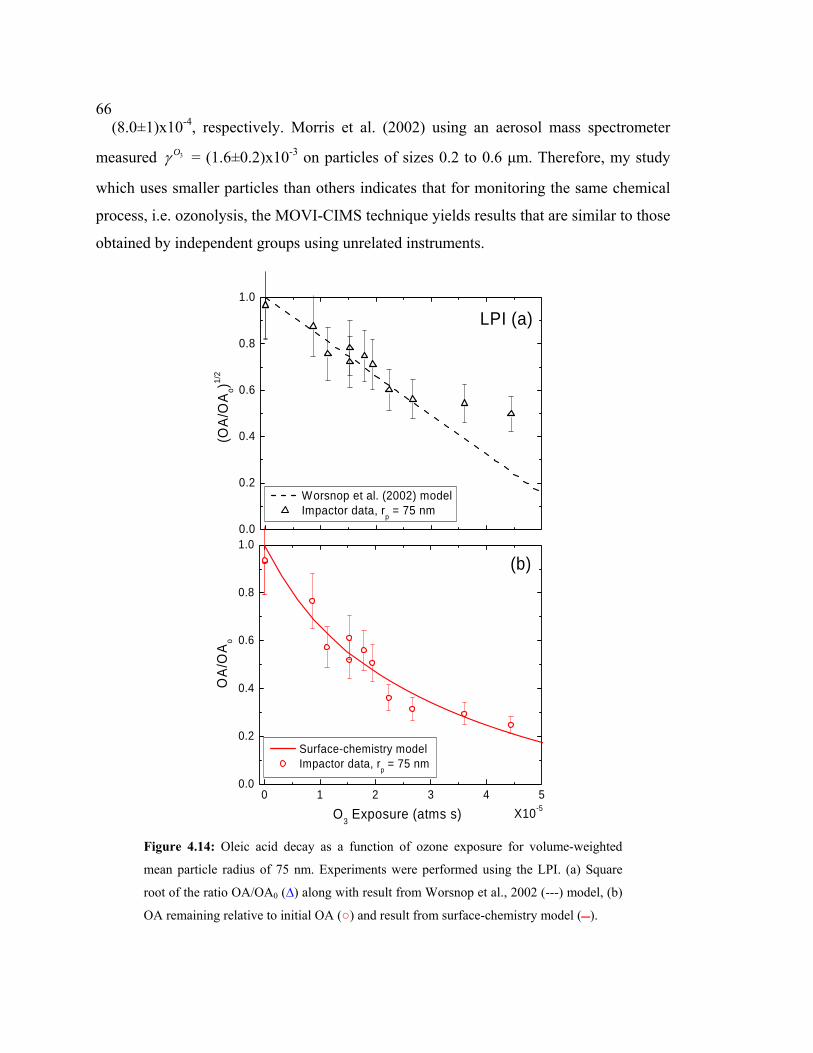
66 (8.0±1)x10-4, respectively. Morris et al. (2002) using an aerosol mass spectrometer
measured 3Oγ = (1.6±0.2)x10-3 on particles of sizes 0.2 to 0.6 μm. Therefore, my study
which uses smaller particles than others indicates that for monitoring the same chemical
process, i.e. ozonolysis, the MOVI-CIMS technique yields results that are similar to those
obtained by independent groups using unrelated instruments.
0 1 2 3 40.0
0.2
0.4
0.6
0.8
1.0
5
Surface-chemistry model Impactor data, rp = 75 nm
OA
/OA
o
X10-5O3 Exposure (atms s)
(b)
0.0
0.2
0.4
0.6
0.8
1.0
LPI (a)
(OA
/OA
o)1/2
Worsnop et al. (2002) model Impactor data, rp = 75 nm
Figure 4.14: Oleic acid decay as a function of ozone exposure for volume-weighted
mean particle radius of 75 nm. Experiments were performed using the LPI. (a) Square
root of the ratio OA/OA0 (∆) along with result from Worsnop et al., 2002 (---) model, (b)
OA remaining relative to initial OA (○) and result from surface-chemistry model ().
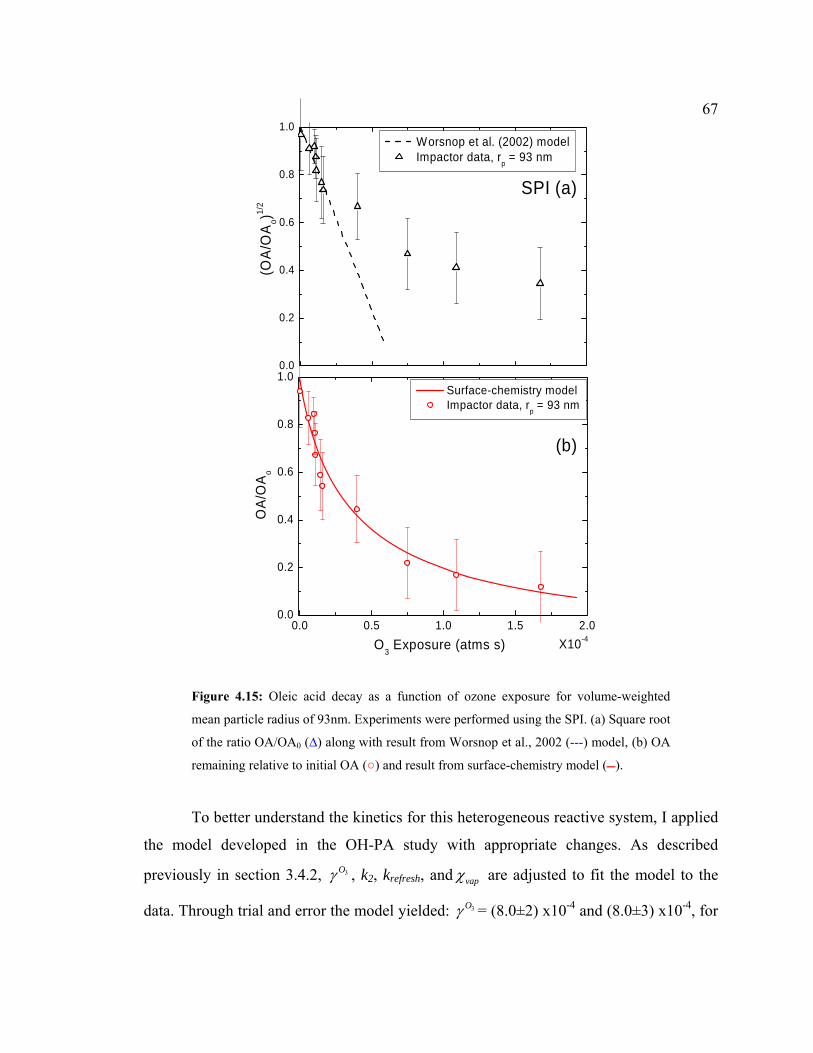
67
0.0
0.2
0.4
0.6
0.8
1.0 Worsnop et al. (2002) model Impactor data, rp = 93 nm
(OA
/OA
o)1/2
SPI (a)
0.0 0.5 1.0 1.5 2.00.0
0.2
0.4
0.6
0.8
1.0
(b)
Surface-chemistry model Impactor data, rp = 93 nm
OA
/OA
o
X10-4O3 Exposure (atms s)
Figure 4.15: Oleic acid decay as a function of ozone exposure for volume-weighted
mean particle radius of 93nm. Experiments were performed using the SPI. (a) Square root
of the ratio OA/OA0 (∆) along with result from Worsnop et al., 2002 (---) model, (b) OA
remaining relative to initial OA (○) and result from surface-chemistry model ().
To better understand the kinetics for this heterogeneous reactive system, I applied
the model developed in the OH-PA study with appropriate changes. As described
previously in section 3.4.2, 3Oγ , k2, krefresh, and vapχ are adjusted to fit the model to the
data. Through trial and error the model yielded: 3Oγ = (8.0±2) x10-4 and (8.0±3) x10-4, for

68 LPI and SPI respectively, with k2 = 0.6 s-1, krefresh = 2.1±0.2 s-1, and vapχ = 0.4. The
value of 3Oγ was corrected for gas-phase diffusion by using the Fuchs and Sutugin (1970)
empirical formulation. The gas-phase diffusion coefficient of O3 ( ) and the molecular
cross-section of OA at the surface used in this calculation are 0.159 cm
3OD2 s-1 (Wesely,
1989), and 4.8x10⁻¹⁵ cm2 molecule-1 (Langmuir, 1917), respectively. The model result
(curved line) presented in Figs. 4.14b and 4.15b clearly represents the full dataset well
compared to the Worsnop et al. (2002) model though we have more free parameters to
adjust.
The other three adjustable parameters k2, krefresh, vapχ also indicate, to some extent,
that the surface-chemistry model I developed is appropriate for this heterogeneous
reaction. To match the steep loss of OA at low O3 exposure, we need some secondary-
chemistry or a higher 3Oγ , which is qualitatively consistent with the results of Hearn et al.
(2005a). Assuming secondary reactions between Criegee intermediates and the
carboxylic acid moiety, they calculated 3Oγ to be (8.8±0.5) x10-4 using an aerosol CIMS.
The large value for the surface renewal parameter krefresh compared to that used for my
analysis of PA oxidation, is consistent with the liquid phase of aerosols and indicates that
the diffusion of OA to surface layers is relatively fast. As the oxidation progresses, the
observed products remain in the particle, consistent with no significant change in the
mobility size of the OA aerosol observed (data not shown) and thus lowers vapχ .
Figure 4.16 shows the evolution of three major products, 9-Oxononanoic acid,
nonanoic acid, and azelaic acid as a function of O3 exposure from the SPI experiments.
Apart from 9-Oxononanoic acid, nonanoic acid, and azelaic acid, nonanal is the other
product commonly observed from heterogeneous ozonolysis of OA (Zahardis and
Petrucci, 2007), but is not detected with the ion chemistry used in this study (only acids
are detected). Azelaic acid has been reported to have a much smaller yield, 1 – 6%, than
the other 3 products, consistent with the relative signals (Fig. 4.16). Since we did not
calibrate CIMS for either the products or OA, we do not know the sensitivity for these
compounds and therefore it is impossible to calculate their absolute yields from the data.

69But, if we assume that the instrument sensitivity is same for 9-Oxononanoic acid,
nonanoic acid, and azelaic acid we can calculate their relative yields. As shown in Fig.
4.16, 9-Oxononanoic acid has a relative yield approximately 3.5 times that of nonanoic
acid and 5 times that of azelaic acid, and is consistent with other literature reported trends
(Zahardis and Petrucci, 2007).
0.0 0.5 1.0 1.5 2.00
1
2
3
4 X10³
Sig
nal (
arb
units
)
X10-4O3 Exposure (atms s)
Nonanoic acid 9-Oxononanoic acid Azelaic acid
Figure 4.16: Products of oleic acid ozonolysis in condensed-phase obtained using the
SPI; 9-Oxononanoic acid (●), nonanoic acid (■) and azelaic acid (∆) with progressive
ozone exposure.
4.3.2 OH oxidation of Palmitic acid aerosol particles
An additional experiment was carried out mainly to compare the performance of
MOVI-CIMS to the continuous flow heated inlet technique in order to examine the
behavior of solid aerosol (PA) relative to liquid aerosol (OA). The experimental setup
was a combination of those described in sections 3.2 and 4.4.1. Aerosol generation, OH
production and reaction chamber are similar to that described in section 3.2 where as the
aerosol sampling and volatilization is similar to that discussed in section 4.4.1. The PA
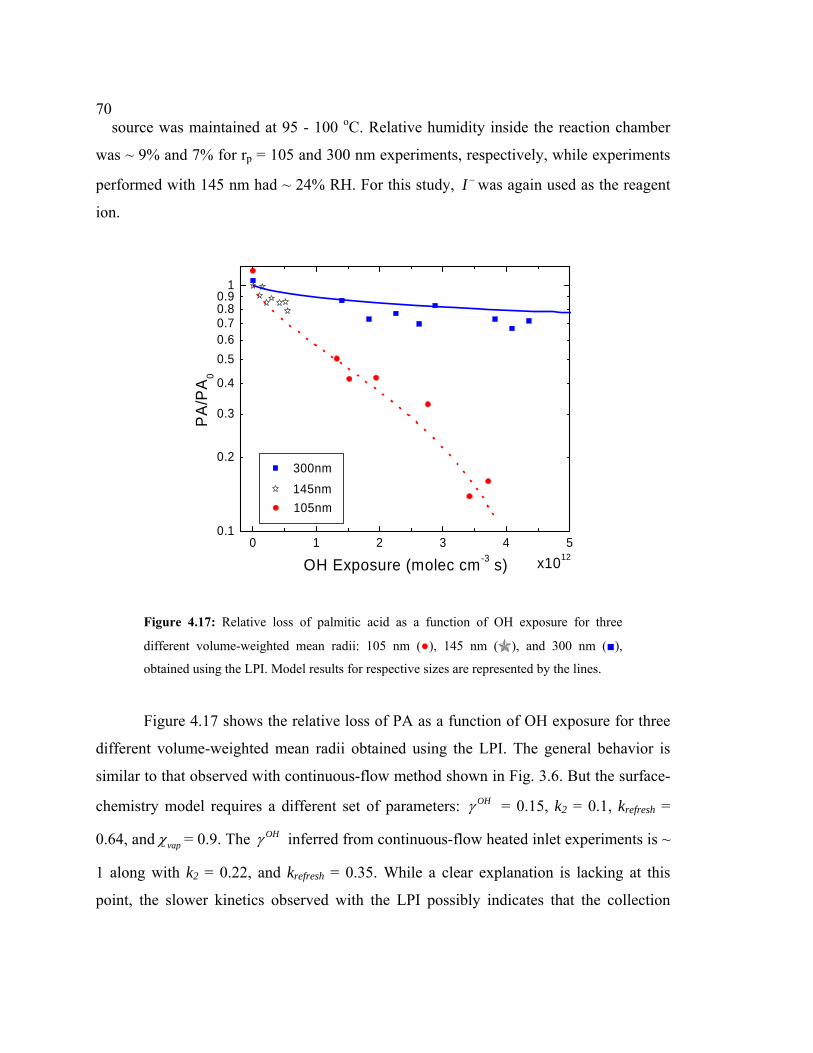
70 source was maintained at 95 - 100 oC. Relative humidity inside the reaction chamber
was ~ 9% and 7% for rp = 105 and 300 nm experiments, respectively, while experiments
performed with 145 nm had ~ 24% RH. For this study, I − was again used as the reagent
ion.
0.1
0.2
0.3
0.4
0.50.60.70.80.9
1
0 1 2 3 4 5
105nm
PA
/PA
0
x1012OH Exposure (molec cm-3 s)
300nm
145nm
Figure 4.17: Relative loss of palmitic acid as a function of OH exposure for three
different volume-weighted mean radii: 105 nm (●), 145 nm ( ), and 300 nm (■),
obtained using the LPI. Model results for respective sizes are represented by the lines.
Figure 4.17 shows the relative loss of PA as a function of OH exposure for three
different volume-weighted mean radii obtained using the LPI. The general behavior is
similar to that observed with continuous-flow method shown in Fig. 3.6. But the surface-
chemistry model requires a different set of parameters: OHγ = 0.15, k2 = 0.1, krefresh =
0.64, and vapχ = 0.9. The OHγ inferred from continuous-flow heated inlet experiments is ~
1 along with k2 = 0.22, and krefresh = 0.35. While a clear explanation is lacking at this
point, the slower kinetics observed with the LPI possibly indicates that the collection
71efficiency is increasing with increasing OH exposure, i.e. the solid PA particles are
changing phase to liquid-like particles (becoming sticky) upon oxidation. More
experiments are needed using the new design (SPI) to assess the affect of particle bounce-
off, a major concern for LPIs, and/or if any design changes are required for the collection
surface to understand the discrepancy with PA particles.
Generally, to minimize loss due to particle bounce-off most of the large pressure
drop impactors (with offline sample analysis) use grease or silicone oil (Hering et al.,
1978; Turner and Hering, 1987; Marple et al., 1991; Pak et al., 1992). But for online
analysis techniques it is preferred not to use any adhesive coating due to a possibility of
their interference with the sample species collected. One way to improve the collection
efficiency is by making the aerosol sticky by increasing their water content. This was first
tested by Stein et al. (1994) who reported observing very little bounce when RH was
greater than 70%. More recently, Stolzenburg et al. (2003) and Williams et al. (2006)
successfully employed this technique to increase particle adhesion and eliminate particle
bounce by using a series of semi-permeable Nafion tubes before impaction to increase
RH above 65%. But none of the above studies tested this method with hydrophobic
particles and therefore this aspect needs further validation.
4.4 CONCLUSIONS AND FUTURE WORK
The MOVI-CIMS technique described herein has shown good reliability,
especially for sampling liquid particles, and proved to be a useful tool for simultaneously
characterizing gas and condensed phases of laboratory generated reaction mixtures. I
have tested two working prototypes: a large pressure drop impactor and a small pressure
drop impactor. LPI shows a linear response with a detection limit of ~ 50 ng for
monocarboxylic acids using I − as the reagent ion. The small pressure drop impactor has
a much higher flow rate making it suitable for faster in-situ analysis. Also, the surface
area inside this impactor has been reduced considerably to minimize any transfer losses
compared to the LPI. The experimental cut-point for SPI is 0.13 μm and compares well
with the theoretically predicted value of 0.14 μm.
72 The kinetics of the heterogeneous oxidation of OA by O3 was investigated
using the MOVI-CIMS. The reaction probability, 3Oγ , was inferred to be (8.0±2)x10-4 and
(8.0±3) x10-4 for LPI and SPI respectively, by fitting the experimental data to the
heterogeneous surface-chemistry model and is similar to that reported by various studies.
9-Oxononanoic acid was the major product observed along with nonanoic acid and
azelaic acid as minor products. While my focus so far has been to characterize the
technique, and not to determine the yields of gas- and condensed-phase products or their
vapor pressures, such studies will be part of my future research.
Development of a humidifying system that can be attached to the impactor inlet
and raise the RH to 70% is ongoing to minimize particle bounce. In addition, instrument
sensitivity could be further improved by other reagent ions. So far only I − and have
been tested. Although these ions have proved very useful, it is of interest to investigate
others still maintaining high selectivity that CIMS offers. For example, recently acetate
ion ( ) was tested to detect various organic acids and was reported to have
high sensitivity with minimal fragmentation (Veres et al., 2008). Similarly,
6SF −
3 ( )CH C O O−
Br− has
shown selectivity when used for detection of dicarboxylic acids (Caldwell et al., 1989).
A major scientific need required to improve our understanding of SOM formation
is to constrain the volatility distribution of gas and particle components. It is this need
that I ultimately plan to uniquely address with the MOVI-CIMS method. By using the
evaporation temperature, and a modified evaporation rate theory developed by
Chattopadhyay et al. (2001; 2005) I will be able to measure the vapor pressure of various
compounds from the change in signal during volatilization. This effort will take place in
upcoming experiments planned at Pacific Northwest National Lab (PNNL) in Richland,
WA. The focus of these experiments will be to use their smog chamber and
complementary instrumentation to obtain detailed information on individual species
formed during the oxidation of secondary organic aerosol mass under controlled
conditions.
Change in hygroscopicity due to in-situ oxidation of POM or condensation of
SOM on pre-existing aerosol particles is considered to be a critical factor in determining
73the climatic effects of aerosols. Recent laboratory experiments (Varutbangkul et al.,
2006) and field studies (Quinn et al., 2005; Wang et al., 2007; Mochida et al., 2008) have
shown that changes in the POM fraction can significantly alter the physicochemical
character, and thus, the optical properties of aerosol particles. The impaction technique
and chemical kinetics methods described herein can be coupled to an apparatus for
hygroscopic growth measurements. Such experiments can provide a deeper
understanding of the influence of POM composition and chemistry on the physical
properties of aerosol particles.
74 REFERENCES
Adam, N. K.: The properties and molecular structure of thin films of palmitic acid on water. Part 1, Proc. Royal. Soc. Lon. A, 99, 336-351, 1921.
Ammann, M., Poschl, U., and Rudich, Y.: Effects of reversible absorption and Langmuir-Henshelwood surface reactions on gas uptake by atmospheric particles, Phy. Chem. Chem. Phy, 5, 351-356, 2003.
Andreae, M. O., and Crutzen, P. J.: Atmospheric aerosols: Biogeochemical sources and role in atmospheric chemistry, Science, 276, 1052-1058, 1997.
Arnold, F., and Hauck, G.: Lower stratosphere trace gas detection using aircraft borne active chemical ionization mass spectrometry, Nature, 315, 307-309, 1985.
Atkinson, R.: Gas-phase tropospheric chemistry of volatile organic compounds: 1. Alkanes and alkenes, J. Phys. Chem. Ref. Data Monograph, 26, 2, 215-290, 1997.
Bahreini, R., Keywood, M. D., Ng, N. L., Varutbangkul, V., Gao, S., Flagan, R. C., Seinfeld, J. H., Worsnop, D. R., and Jimenez, J. L.: Measurements of secondary organic aerosol from oxidation of cycloalkanes, terpenes, and m-xylene using an aerodyne aerosol mass spectrometer, Environ. Sci. Technol., 39, 5674-5688, 2005.
Bartmess, J. E.: Gas-phase equilibrium affinity scales and chemical ionization mass spectrometry, Mass. Spectrom. Rev., 8, 297-343, 1989.
Berner, A., and Lurzer, C.: Mass size distributions of traffic aerosols at Vienna, J. Phys. Chem. A, 84, 2079-2083, 1980.
Berner, A., Lurzer, C., Pohl, F., Preining, O., and Wagner, P.: The size distribution of the urban aerosol in Vienna, The Sci. Total Environ., 13, 245-261, 1979.
Bertram, A. K., Ivanov, A. V., Hunter, M., Molina, L. T., and Molina, M. J.: The reaction probability of OH on organic surfaces of tropospheric interest, J. Phys. Chem. A, 105, 9415-9421, 2001.
Biswas, P., and Flagan, R. C.: High-velocity inertial impactors, Environ. Sci. Technol., 18, 611-616, 1984.
75Broekhuizen, K., Pradeep Kumar, P., and Abbatt, J. P. D.: Partially soluble organics as
cloud condensation nuclei: Role of trace soluble and surface active species, Geophys. Res. Lett., 31, L01107, doi:10.1029/2003GL018203, 2004.
Budzikiewicz, H.: Negative chemical ionization (NCI) of organic compounds, Mass. Spectrom. Rev., 5, 345-380, 1986.
Caldwell, G. W., Masucci, J. A., and Ikonomou, M. G.: Negative ion chemical ionization mass spectrometry - binding of molecules to bromide and iodide anions, Org. Mass Spectrom., 24, 8-14, 1989.
Chan, A. W. H., Kroll, J. H., Ng, N. L., and Seinfeld, J. H.: Kinetic modeling of secondary organic aerosol formation: effects of particle- and gas-phase reactions of semivolatile products, Atmos. Chem. Phys., 7, 4135-4147, 2007.
Chattopadhyay, S., Tobias, H. J., and Ziemann, P. J.: A method for measuring vapor pressures of low-volatility organic aerosol compounds using a thermal desorption particle beam mass spectrometer, Anal. Chem., 73, 3797-3803, 2001.
Chattopadhyay, S., and Ziemann, P. J.: Vapor pressures of substituted and unsubstituted monocarboxylic and dicarboxylic acids measured using an improved thermal desorption particle beam mass spectrometry method, Aerosol Sci. Technol., 39, 1085-1100, 2005.
Chow, J. C., Watson, J. G., Fujita, E. M., Lu, Z., and Lawson, D. R.: Temporal and seasonal variations of PM(2.5) and PM(10) aerosol in the southern California air-quality study, Atmos. Environ., 28, 12, 2061-2080, 1994.
Claeys, M., Graham, B., Vas, G., Wang, W., Vermeylen, R., Pashynska, V., and al., e.: Formation of secondary organic aerosols through photooxidation of isoprene, Science, 303, 1173-1176, 2004.
de Gouw, J. A., et al.: Sources of particulate matter in the northeastern United States in summer: 1. Direct emissions and secondary formation of organic matter in urban plumes, J. Geophys. Res. Atmos, 113, D08301, doi:10.1029/2007JD009243, 2008.
de Gouw, J. A., Warneke, C., Karl, T., Eerdekens, G., Veen, C., and Fall, R.: Sensitivity and specificity of atmospheric trace gas detection by proton-transfer-reaction mass spectrometry, Int. J. Mass Spectrom., 223-224, 365-382, 2003.
76 DeMore, W. B., Sander, S. P., Golden, D. M., Hampson, R. F., Kurylo, M. J., Howard, C. J., Ravishankara, A. R., Kolb, C. E., and Molina, M. J. (1997), Chemical kinetics and photochemical data for use in stratospheric modeling, National Aeronautics and Space Administration Jet Propulsion Laboratory, Pasadena, CA.
Docherty, K. S., and Ziemann, P. J.: Reaction of Oleic acid particles with NO3 radicals: products, mechanisms, and implications for radical-initiated organic aerosol oxidation, J. Phys. Chem. A, 110, 3567-3577, 2006.
Donahue, N. M., Robinson, A. L., Stanier, C. O., and Pandis, S. N.: Coupled partitioning, dilution, and chemical aging of semivolatile organics, Environ. Sci. Technol., 40, 2635-2643, 2006.
Eliason, T. L., Gilman, J. B., and Vaida, V.: Oxidation of organic films relevant to atmospheric aerosols, Atmos. Environ., 38, 1367-1378, 2004.
Ellison, G. B., Tuck, A. F., and Vaida, V.: Atmospheric processing of organic aerosols, J. Geophys. Res. Atmos, 104, 11633-11641, 1999.
Facchini, M. C., Mircea, M., Fuzzi, S., and Charlson, R. J.: Cloud albedo enhancement by surface-active organic solutes in growing droplets, Nature, 401, 257-259, 1999.
Fang, C. P., Marple, V. A., and Rubow, K. L.: Influence of cross-flow on particle collection characteristics of multi-nozzle impactors, J. Aerosol Sci., 22, 4, 403-415, 1991.
Flagan, R. C.: Compressible flow inertial impactors, J. Coll. Inter. Sci., 87, 1, 291-299, 1982.
Fuchs, N. A., and Sutugin, A. G. (1970), Highly dispersed aerosols, 47-59 pp., Ann Arbor Science Publishers, Ann Arbor, MI, USA.
Fuzzi, S., Andreae, M. O., and Huebert, B. J., et al.: Critical assessment of the current state of scientific knowledge, terminology, and research needs concerning the role of organic aerosols in the atmosphere, climate, and global change, Atmos. Chem. Phys., 6, 2017-2012-2038, 2006.
Geller, M. D., Kim, S., Misra, C., Sioutas, C., Olson, B. A., and Marple, V. A.: A methodology for measuring size-dependent chemical composition of ultrafine particles, Aerosol Sci. Technol., 36, 748-762, 2002.
77George, I. J., Vlasenko, A., Slowik, J. G., and Abbatt, J. P. D.: Heterogeneous
oxidation of saturated organic aerosols by hydroxyl radicals: uptake kinetics, condensed-phase products, and particle size change, Atmos. Chem. Phys., 7, 4187-4201, 2007.
Goldstein, A. H., and Galbally, I. E.: Known and unexplored organic constituents in the earth's atmosphere, Environ. Sci. Technol., 1515-1521, 2007.
Goldstein, A. H., Worton, D. R., Williams, B. J., Susanne, V. H., Kreisberg, N. M., Panic, O., and Gorecki, T.: Thermal desorption comprehensive two-dimensional gas chromatography for in-situ measurements of organic aerosols, J. Chromatography, 1186, 340-347, 2008.
Gomez, A. L., Park, J., Walser, M. L., and Nizkorodov, S. A.: UV photodissociation spectroscopy of oxidized undecylic acid films, J. Phys. Chem. A, 110, 3584-3592, 2006.
Griffin, R. J., Dadbub, D., and Seinfeld, J. H.: Development and initial evaluation of a dynamic species-resolved model for gas phase chemistry and size-resolved gas/particle partitioning associated wit hsecondary organic aerosol formation, J. Geophys. Res. Atmos, 110, doi:10.1029/2004JD005219, D05304, 2005.
Harrison, G. A. (1983), Chemical ionzation mass spectrometery, CRC Press, Boca Roton, Florida.
Heald, C. L., Jacob, D. J., Park, R. J., Russell, L. M., Huebert, B. J., Seinfeld, J. H., Liao, H., and Weber, R. J.: A large organic aerosol source in the free troposphere missing from current models, Geophys. Res. Lett., 32, L18809, doi:10.1029/2005GL023831, 2005.
Heald, C. L., Jacob, D. J., Turquety, S., Hudman, R. C., Weber, R. J., Sullivan, A. P., Peltier, R. E., Atlas, E. L., De Gouw, J. A., Warneke, C., Holloway, J. S., Neuman, J. A., Flocke, F. M., and Seinfeld, J. H.: Concentrations and sources of organic carbon aerosols in the free troposphere over North America, J. Geophys. Res. Atmos, 111, D23S47, doi:10.1029/2006JD007705, 2006.
Hearn, J. D., Lovett, A. J., and Smith, G. D.: Ozonolysis of oleic acid particles: Evidence for a surface reaction and secondary reactions involving criegee intermediates, Phy. Chem. Chem. Phy, 7, 501-511, 2005a.
78 Hearn, J. D., Renbaum, L. H., Wang, X., and Smith, G. D.: Kinetics and products from reaction of Cl radicals with dioctyl sebacate (DOS) particles in O2: a model for radical-initiated oxidation of organic aerosols, Phy. Chem. Chem. Phy, 9, 4803-4813, 2007a.
Hearn, J. D., and Smith, G. D.: A chemical ionization mass spectrometry method for the online analysis of organic aerosols, Anal. Chem., 76, 2820-2826, 2004a.
Hearn, J. D., and Smith, G. D.: Kinetics and product studies for ozonolysis reactions of organic particles using aerosol CIMS, J. Phys. Chem. A, 108, 10019-10029, 2004b.
Hearn, J. D., and Smith, G. D.: Measuring rates of reaction in supercooled organic particles with implications for atmospheric aerosol, Phy. Chem. Chem. Phy, 7, 2549-2551, 2005b.
Hearn, J. D., and Smith, G. D.: Reactions and mass spectra of complex particles using aerosol CIMS, Int. J. Mass Spectrom., 258, 95-103, 2006.
Hearn, J. D., and Smith, G. D.: Ozonolysis of mixed oleic acid/n-docosane particles: the role of phase, morphology, and metalstable states, J. Phys. Chem. A, 111, 43, 11059-11065, 2007b.
Henze, D. K., Seinfeld, J. H., Ng, N. L., Kroll, J. H., Fu, T. M., Jacob, D. J., and Heald, C. L.: Global modeling of secondary organic aerosol formation from aromatic hydrocarbons: high- vs low-yield pathways, Atmos. Chem. Phys., 8, 2405-2421, 2008.
Herbert, C. G., and Johnstone, R. A. W. (2003), Mass spectrometry basics, 371-382 pp., CRC Press, Boca Raton, Fl.
Hering, S. V.: Calibration of the QCM impactor for stratospheric sampling, Aerosol Sci. Technol., 7, 257-274, 1987.
Hering, S. V., Flagan, R. C., and Friedlander, S. K.: Design and evaluation of new low-pressure impactor, 1, Environ. Sci. Technol., 12, 6, 667-673, 1978.
Hering, S. V., Friedlander, S. K., Collins, J. J., and Richards, W. L.: Design and evaluation of a new low-pressure impactor, 2, Environ. Sci. Technol., 13, 2, 184-188, 1979.
79Hillamo, R. E., and Kauppinen, E. I.: On the performance of the Berner Low Pressure
Impactor, Aerosol Sci. Technol., 14, 33-47, 1991.
Hinds, W. C. (1999), Aerosol Technology: Properties, behavior, and measurements of airborne particles, John Wiley & Sons, Inc., New York.
Hoffmann, T., Bandur, R., Marggraf, U., and Linscheid, M.: Molecular composition of organic aerosols formed in the α-pinene/O3 reaction: Implications for new particle formation processes, J. Geophys. Res. Atmos, 103, D19, 25569-25578, 1998.
Huey, L. G.: Measurement of trace atmospheric species by chemical ionization mass spectrometry: speciation of reactive nitrogen and future directions, Mass. Spectrom. Rev., 26, 166-184, 2006.
Huey, L. G., Hanson, D. R., and Howard, C. J.: Reactions of SF6- and I- with atmospheric trace gases, J. Phys. Chem. A, 99, 5001-5008, 1995.
Iinuma, Y., Böge, O., Gnauk, T., and Herrmann, H.: Aerosol-chamber study of the α-pinene/O3 reation: influence of particle acidity on aerosol yields and products, Atmos. Environ., 38, 761-773, 2004.
IPCC (2007), Climate change 2007: The physical science basis. Contribution of working group I to the fourth assessment report of the intergovernmental panel on climate change, edited by S. Solomon, Qin, D., et al., Cambridge University Press, NY, USA.
Iwai, K., Mizuno, S., Miyasaka, Y., and Mori, T.: Correlation between suspended particles in the environmental air and causes of disease among inhabitants: Cross-sectional studies using the vital statistics and air pollution data in Japan, Env. Res., 99, 1, 106-117, 2005.
Jacobson, M. C., Hansson, H. C., Noone, K. J., and Charlson, R. J.: Organic atmospheric aerosols: Review and state of science, Rev. Geophy., 38, 267-294, 2000.
Jaegle, L., Jacob, D. J., Wennberg, P. O., Spivakovsky, C. M., Hanisco, T. F., Lanzendorf, E. J., Hintsa, E. J., Fahey, D. W., Keim, E. R., Proffitt, M. H., Atlas, E. L., Flocke, F. M., Schauffler, S. M., McElroy, C. T., Midwinter, C., Pfister, L., and Wilson, J. C.: Observed OH and HO2 in the upper troposphere suggest a major source from convective injection of peroxides, Geophys. Res. Lett., 24, 24, 3181-3184, 1997.
80 Jayne, J. T., Leard, D. C., Zhang, X., Davidovits, P., Smith, K. A., Kolb, C. E., and Worsnop, D. R.: Development of an aerosol mass spectrometer for size and composition analysis of submicron particles, Aerosol Sci. Technol., 33, 49-70, 2000.
Jennings, K. R.: Negative ions, Phil. Trans. Royal Soc. Lon. A, 293, 1400, 125-133, 1979.
Johnson, D., Utembe, S. R., Jenkin, M. J., Derwent, R. G., Hayman, G. D., Alfarra, M. R., Coe, H., and McFiggans, G.: Simulating regional scale secondary organic aerosol formation during the TORCH 2003 campign in the southern UK, Atmos. Chem. Phys., 6, 403-418, 2006.
Jurcik, B. J., Brock, J. R., and Trachtenberg, I.: A Study of low pressure particle impaction process, J. Aerosol Sci., 20, 6, 701-711, 1989.
Kanakidou, M., Seinfeld, J. H., Pandis, S. N., Barnes, I., and Dentener, F. J., et al.: Organic aerosol and global climate modeling: a review, Atmos. Chem. Phys., 5, 1053-1123, 2005.
Kartib, Y., Martin, S. T., Rudich, Y., Davidovits, P., Jayne, J. T., and Worsnop, D. R.: Density changes of aerosol particles as a result of chemical reaction, Atmos. Chem. Phys., 5, 275-291, 2005.
Knopf, D. A., Anthony, L. M., and Bertram, A. K.: Reactive uptake of O3 by multicomponent and multiphase mixtures containing oleic acid, J. Phys. Chem. A, 109, 25, 5579-5589, 2005.
Knopf, D. A., Mak, J., Gross, S., and Bertram, A. K.: Does atmospheric processing of saturated hydrocarbon surfaces by NO3 lead to volatilization? Geophys. Res. Lett., 33, doi:10.1029/2006GL026884, 2006.
Kroll, J. H., Chan, A. W. H., Ng, N. L., Flagan, R. C., and Seinfeld, J. H.: Reactions of semivolatile organics and their effects on secondary organic aerosol formation, Environ. Sci. Technol., 41, 3545-3550, 2007.
Kumar, M. R., Prabhakar, S., Kumar, M. K., Reddy, T. J., and Vairamani, M.: Negative ion electrospray ionization mass spectral study of dicarboxylic acids in the presence of halide ions, Rapid Commun. Mass Spectrom., 18, 1109-1115, 2004.
81Kwan, A. L., Crounse, J. D., Clarke, A. D., and Shinozuka, Y., et al.: On the flux of
oxygenated volatile organic compounds from organic aerosol oxidation, Geophys. Res. Lett., 33, L15815, doi:10.1029/2006GL026144, 2006.
Kwon, S. B., Kim, M. C., and Lee, K. W.: Effects of jet configuration on the performance of multi-nozzle impactors, J. Aerosol Sci., 33, 859-869, 2002.
Lambe, A. T., Zhange, J. Y., Sage, A. M., and Donahue, N. M.: Controlled OH radical production via ozone-alkene reactions for use in aerosol aging studies, Environ. Sci. Technol., 41, 2357-2363, 2007.
Langmuir, I.: The shapes of group molecules forming the surfaces of liquids, PNAS USA, 3, 4, 251-257, 1917.
Liousse, C., Penner, J. E., Chuang, C., Walton, J. J., Eddleman, H., and Cachier, H.: A global three-dimensional study of carbonaeous aerosols, J. Geophys. Res. Atmos, 101, 19411-19432, 1996.
Marcolli, C., Luo, B. P., and Peter, T.: Mixing of te organic aerosol fractions: liquids as the thermodynamically stable states, J. Phys. Chem. A, 108, 2216-2224, 2004.
Maria, S. F., Russell, L. M., Gilles, M. K., and Myneni, S. C. B.: Organic aerosol growth mechanisms and their climate-forcing implications, Science, 306, 1921-1924, 2004.
Marjamaki, M., Keskinen, J., Chen, D.-R., and Pui, D. Y. H.: Performance evaluation of the electrical low-pressure impactor (ELPI), J. Aerosol Sci., 31, 2, 249-261, 2000.
Marple, V. A., and Liu, B. Y. H.: Characteristics of laminar jet impactors, Environ. Sci. Technol., 8, 7, 648-654, 1974.
Marple, V. A., and Liu, B. Y. H.: On fluid flow and aerosol impaction in inertial impactors, J. Coll. Inter. Sci., 53, 1, 31-34, 1975.
Marple, V. A., Olson, B. A., and Rubow, K. L. (2001), Inertial, gravitational, centrifugal, and thermal collection techniques, in Aerosol measurements: principles, techniques, and applications, edited by P. A. Baron and K. Willeke, pp. 229-260, Willey-InterScience Inc.
Marple, V. A., Rubow, K. L., and Behm, S. M.: A microorifice uniform deposit impactor (MOUDI): Description, calibration and use, Aerosol Sci. Technol., 14, 434-446, 1991.
82 McNeill, V. F., Wolfe, G. M., and Thornton, J. A.: The oxidation of oleate in submicron aqueous salt aerosols: Evidence of a surface process, J. Phys. Chem. A, 111, 1073-1083, 2007.
McNeill, V. F., Yatavelli, R. L. N., Thornton, J. A., Stipe, C. B., and Landgrebe, O.: Heterogeneous OH oxidation of palmitic acid in single component and internally mixed aerosol particles: vaporization and the role of particle phase, Atmos. Chem. Phys., 8, 5465-5476, 2008.
Ming, Y., and Russell, L. M.: Predicted hygroscopic growth of sea salt aerosol, J. Geophys. Res. Atmos, 106, 28259-28274, 2001.
Mochida, M., Miyakawa, T., Takegawa, N., Morino, Y., Kawamura, K., and Kondo, Y.: Significant alteration in the hygroscopic properties of urban aerosol particles by the secondary formation of organics, Geophys. Res. Lett., 35, doi:10.1029/2007GL031310, 2008.
Moise, T., and Rudich, Y.: Reactive uptake of ozone by aerosol-associated unsaturated fatty acids: kinetics, mechanism, and products, J. Phys. Chem. A, 106, 6469-6476, 2002.
Molina, M. J., Ivanov, A. V., Trakhtenberg, S., and Molina, L. T.: Atmospheric evolution of organic aerosol, Geophys. Res. Lett., 31, L22104, doi:10.1029/2004GL020910, 2004.
Morris, J. W., Davidovits, P., Jayne, J. T., Jimenes, J. L., Shi, Q., Kolb, C. E., Worsnop, D. R., Barney, W. S., and Cass, G.: Kinetics of submicron oleic acid aerosols with ozone: a novel aerosol mass spectrometric technique, Geophys. Res. Lett., 29, 9, doi:10.1029/2002GL014692, 2002.
Noble, C. A., and Prather, K. A.: Real-time measurement of correlated size and composition profiles of individual atmospheric aerosol particles, Environ. Sci. Technol., 30, 9, 2667-2680, 1996.
Novakov, T., and Penner, J. E.: Large contribution of organic aerosols to cloud-condensation-nuclei concentrations, Nature, 365, 823-826, 1993.
Odum, J. R., Hoffman, T., Bowman, F., Collins, D., Flagan, R. C., and Seinfeld, J. H.: Gas/particle partitioning and secondary organic aerosol yields, Environ. Sci. Technol., 30, 2580-2585, 1996.
83Olcese, L. E., Penner, J. E., and Sillman, S.: Development of a secondary organic
aerosol formation mechanism: comparison with smog chamber experiments and atmospheric measurements, Atmos. Chem. Phys., 7, 8361-8393, 2007.
Pak, S. S., Liu, B. Y. H., and Rubow, K. L.: Effect of coating thickness on particle bounce in inertial impactors, Aerosol Sci. Technol., 16, 141-150, 1992.
Pankow, J. F., Seinfeld, J. H., Asher, W. E., and Erdakos, G. B.: Modeling the formation of secondary organic aerosol. 1. Application of theoretical principles to measurements obtained in the α-pinene/, β-pinene/, sabinene/, Δ3-carene/, and cyclohexene/ozone systems, Environ. Sci. Technol., 35, 1164-1172, 2001.
Pun, B. K., and Seigneur, C.: Investigative modeling of new pathways for secondary organic aerosol formation, Atmos. Chem. Phys., 7, 2199-2216, 2007.
Quinn, P. K., Bates, T. S., Baynard, T., Clarke, A. D., Onasch, T. B., Wang, W., Rood, M. J., Andrews, E., Allan, J., Carrico, C. M., Coffman, D., and Worsnop, D. R.: Impact of particulate organic matter on the relative humidity dependence of light scattering: a simplified parameterization, Geophys. Res. Lett., 32, doi:10.1029/2005GL024322, 2005.
Reilly, P. T. A., Gieray, R. A., Yang, M., Whitten, W. B., and Ramsey, J. M.: Tandem mass spectrometry of individual airborne microparticles, Anal. Chem., 69, 1, 36-39, 1997.
Roberts, G. C., Artaxo, P., Zhou, J., Swietlicki, E., and Andreae, M. O.: Sensitivity of CCN spectra on chemical and physical properties of aerosols: A case study from the Amazon Basin, J. Geophys. Res. Atmos, 107, D20.8070, 2002.
Rogge, W. F., Hildemann, L. M., Mazurek, M. A., and Cass, G. R.: Sources of fine organic aerosol. 1. Charboilers and meat cooking operations, Environ. Sci. Technol., 25, 1112-1125, 1991.
Rogge, W. F., Hildemann, L. M., Mazurek, M. A., Cass, G. R., and Simonelt, B. R. T.: Quantification of urban organic aerosols at a molecular level - Identification, abundance and seasonal-variation, Atmos. Environ., 27A, 1309-1330, 1993.
Rudich, Y., Donahue, N. M., and Mentel, T. F.: Aging of organic aerosol: bridging the gap between laboratory and field studies, Ann. Rev. Phys.Chem., 58, 321-352, 2007.
84 Schauer, J. J., Keelman, M. J., Cass, G. R., and Simoneit, B. R. T.: Measurements of emissions from air pollution sources: C1-C32 organic compounds from gasoline-powered motor vehicles, Environ. Sci. Technol., 36, 6, 1169-1180, 2002.
Schuetzle, D., Cronn, D., Crittenden, A. L., and Charlson, R. J.: Molecular composition of secondary aerosol and its possible origin, Environ. Sci. Technol., 9, 9, 838-845, 1975.
Seinfeld, J. H., and Pandis, S. (1998), Atmospheric Chemistry and Physics: from air pollution to climate change, John Wiley & Sons, Inc., New York.
Shilling, J. E., Chen, Q., King, S. M., Rosenoern, T., Kroll, J. H., Worsnop, D. R., McKinney, K. A., and Martin, S. T.: Particle mass yield in secondary organic aerosol formed by the dark ozonolysis of α−pinene, Atmos. Chem. Phys., 8, 2073-2088, 2008.
Smith, G. D., Woods, E., DeForest, C. L., Baer, T., and Miller, R. E.: Reactive uptake of ozone by oleic acid aerosol particles: application of single-particle mass spectrometry to heterogeneous reaction kinetics, J. Phys. Chem. A, 106, 8085-8095, 2002.
Smith, J. N., Moore, K. F., McMurry, P. H., and Eisele, F. L.: Atmospheric measurement of sub-20nm diameter particle chemical composition by thermal desorption chemical ionization mass spectrometry, Aerosol Sci. Technol., 38, 100-110, 2004.
Stein, S. W., Turpin, B. J., Cai, X., Huang, P.-F., and McMurry, P. H.: Measurements of relative humidity-dependent bounce and density for atmospheric particles using the DMA-impactor technique, Atmos. Environ., 28, 10, 1739-1746, 1994.
Stolzenburg, M. R., Dutcher, D. D., Kirby, B. W., and Hering, S. V.: Automated measurement of the size and concentration of airborne particulate nitrate, Aerosol Sci. Technol., 37, 537-546, 2003.
Takekawa, H., Minoura, H., and Yamazaki, S.: Temperature dependence of secondary organic aerosol formation by photooxidation of hydrocarbons, Atmos. Environ., 37, 3413-3424, 2003.
Thornberry, T., and Abbatt, J. P. D.: Heterogeneous reaction of ozone with liquid unsaturated fatty acids: detailed kinetics and gas-phase product studies, Phy. Chem. Chem. Phy, 6, 1, 84-93, 2004.
85Thornton, J. A., Braban, C. F., and Abbatt, J. P. D.: N2O5 hydrolysis on sub-micron
organic aerosols: the effect of relative humidity, particle phase, and particle size, Phy. Chem. Chem. Phy, 5, 4593-4603, 2003.
Tobias, H. J., and Ziemann, P. J.: Compound identification in organic aerosols using temperature-programmed thermal desorption particle beam mass spectrometry, Anal. Chem., 71, 3428-3435, 1999.
Turner, J. R., and Hering, S. V.: Greased and oiled substrates as bounce-free impaction surfaces, J. Aerosol Sci., 18, 2, 215-224, 1987.
Turpin, B. J., Saxena, P., and Andrews, E.: Measuring and simulating particulate organics in the atmosphere: Problems and prospects, Atmos. Environ., 34, 2983-3013, 2000.
Tyndall, G. S., Cox, R. A., Granier, C., Lesclaux, R., Moortgat, G. K., Pilling, M. J., Ravishankara, A. R., and Wallington, T. J.: Atmospheric chemistry of small organic peroxy radicals, J. Geophys. Res. Atmos, 106, 12157-12182, 2001.
Vairamani, M., and Saraswathi, M.: Negative ion chemical ionization (Br-) mass spectra of dicarboxylic acids, Org. Mass Spectrom., 24, 355-356, 1989.
Varutbangkul, V., Brechtel, F. J., Bahreini, R., Ng, N. L., Keywood, M. D., Kroll, J. H., Flagan, R. C., Seinfeld, J. H., Lee, A., and Goldstein, A. H.: Hygroscopicity of secondary organic aerosols formed by oxidation of cycloalkenes, monoterpenes, sesquiterpenes, and related compounds, Atmos. Chem. Phys., 6, 2367-2388, 2006.
Veres, P., Roberts, J. M., Warneke, C., Welsh-Bon, D., Zahniser, M., Herndon, S., Fall, R., and De Gouw, J. A.: Development of negative-ion proton-transfer chemical-ionization mass spectrometry (NI-PT-CIMS) for the measurement of gas-phase organic acids in the atmosphere, Int. J. Mass Spectrom., 274, 48-55, 2008.
Viggiano, A. A.: An in situ mass spectrometry and ion chemistry in the stratosphere and troposphere, Mass. Spectrom. Rev., 12, 115-137, 1993.
Vlasenko, A., George, I. J., and Abbatt, J. P. D.: Formation of volatile organic compounds in the heterogeneous oxidation of condensed-phase organic films by gas-phase OH, J. Phys. Chem. A, 112, 1552-1560, 2008.
Voisin, D., Smith, J. N., Sakurai, H., McMurry, P. H., and Eisele, F. L.: Thermal desorption chemical ionization mass spectrometer for ultrafine particle chemical composition, Aerosol Sci. Technol., 37, 471-475, 2003.
86 Volkamer, R., Jimenez, J. L., Martini, F. S., Dzepina, K., Zhang, Q., Salcedo, D., Molina, L. T., Worsnop, D. R., and Molina, M. J.: Secondary organic aerosol formation from anthropogenic air pollution: Rapid and higher than expected, Geophys. Res. Lett., 33, L17811, doi:10.1029/2006GL026899, 2006.
Wang, W., Rood, M. J., Carrico, C. M., Covert, D. S., Quinn, P. K., and Bates, T. S.: Aerosol optical properties along the northeast coast of North America during the new england air quality study - intercontinental transport and chemical transformation 2004 campaign and the influence of aerosol composition, J. Geophys. Res. Atmos, 112, doi:10.1029/2006JD007579, 2007.
Waterman, D., Horsfield, B., Leistner, F., Hall, K., and Smith, S.: Quantification of polycyclic aromatic hydrocarbons in the NIST standard reference material (SRM1649A) urban dust using thermal desorption GC/MS, Anal. Chem., 72, 3563-3567, 2000.
Weber, R. J., et al.: A study of secondary organic aerosol formation in the anthropogenic-influenced southeastern United States, J. Geophys. Res. Atmos, 112, D13302, doi:10.1029/2007JD008408, 2007.
Wennberg, P. O., Hanisco, T. F., Jaegle, L., Jacob, D. J., Hintsa, E. J., Lanzendorf, E. J., Anderson, J. G., Gao, R., -S., Keim, E. R., Donnelly, S. G., Del Negro, L. A., Fahey, D. W., McKeen, S. A., Salawitch, R. J., Webster, C. R., May, R. D., Herman, R. L., Proffitt, M. H., Margitan, J. J., Atlas, E. L., Schauffler, S. M., Flocker, F., McElroy, C. T., and Bui, T. P.: Hydrogen radicals, nitrogen radicals, and the production of O3 in the upper troposphere, Science, 279, 49-53, 1998.
Wesely, M. L.: Parameterization of surface resistances to gaseous dry deposition in regional-scale numerical models, Atmos. Environ., 23, 6, 1293-1304, 1989.
Williams, B. J., Goldstein, A. H., Kreisberg, N. M., and Hering, S. V.: An in-situ instrument for speciated organic composition of atmospheric aerosols: thermal desorption aerosol GC/MS-FID (TAG), Aerosol Sci. Technol., 40, 627-638, 2006.
Worsnop, D. R., Morris, J. M., Shi, Q., Davidovits, P., and Kolb, C. E.: A chemical kinetic model for reactive transformations of aerosol particles, Geophys. Res. Lett., 29, doi:10.1029/2002GL015542, 2002.
Yu, S.: Role of organic acids (formic, acetic, pyruvic, and oxalic) in the formation of cloud condensation nuclei (CCN): a review, Atmos. Res., 53, 185-217, 2000.
87Zahardis, J., and Petrucci, G. A.: The oleic acid-ozone heterogeneous reaction system:
products, kinetics, secondary chemistry, and atmospheric implications of a model system - a review, Atmos. Chem. Phys., 7, 1237-1274, 2007.
Zhang, Q., Alfarra, M. R., Worsnop, D. R., Allan, J. D., Coe, H., Canagaratna, M. R., and Jimenez, J. L.: Deconvolution and quantification of hydrocarbon-like and oxygenated organic aerosols based on aerosol mass spectrometry, Environ. Sci. Technol., 39, 13, 4938-4952, 2005.
Zhang, Q., et al.: Ubiquity and dominance of oxygenated species in organic aerosols in anthropogenically-influenced Northern Hemisphere midlatitudes, Geophys. Res. Lett., 34, L13801, 2007.
Ziemann, P. J.: Aerosol products, mechanisms, and kinetics of heterogeneous reactions of ozone with oleic acid in pure and mixed particles, Faraday Discuss., 130, 469-490, 2005.
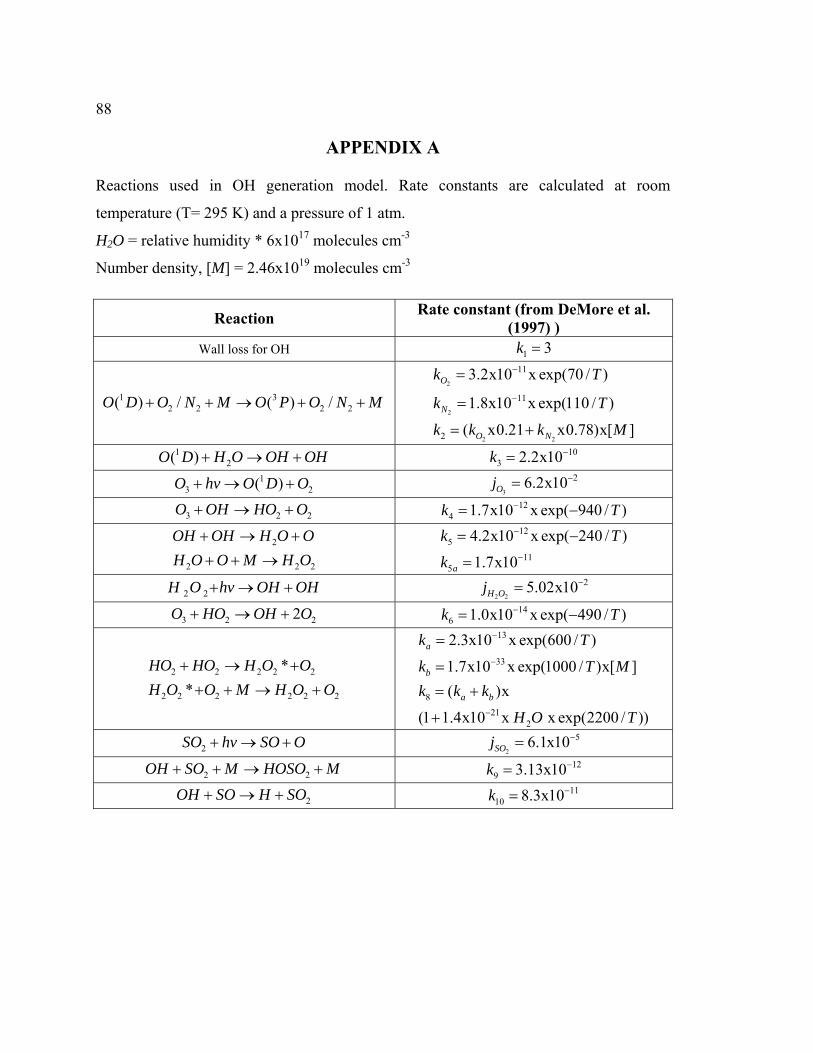
88
APPENDIX A Reactions used in OH generation model. Rate constants are calculated at room
temperature (T= 295 K) and a pressure of 1 atm.
H2O = relative humidity * 6x10¹⁷ molecules cm-3
Number density, [M] = 2.46x10¹⁹ molecules cm-3
Reaction Rate constant (from DeMore et al. (1997) )
Wall loss for OH 1 3k =
1 32 2 2 2( ) / ( ) /O D O N M O P O N M+ + → + +
2
2
2 2
11
11
2
3.2x10 x exp(70 / )
1.8x10 x exp(110 / )
( x0.21 x0.78)x[ ]
O
N
O N
k T
k T
k k k M
−
−
=
=
= +
12( )O D H O OH OH+ → + 10
3 2.2x10k −= 1
3 2( )O hv O D O+ → + 3
26.2x10Oj−=
3 2O OH HO O+ → + 2 124 1.7x10 x exp( 940 / )k T−= −
2
2 2
OH OH H O OH O O M H O
+ → ++ + → 2
12
511
5
4.2x10 x exp( 240 / )
1.7x10a
k T
k
−
−
= −
=
2 2H O hv OH OH+ → + 2 2
25.02x10H Oj −=
3 2 2O HO OH O+ → + 2 146 1.0x10 x exp( 490 / )k T−= −
2 2 2 2 2
2 2 2 2 2 2
**
HO HO H O OH O O M H O O
+ → ++ + → +
13
33
821
2
2.3x10 x exp(600 / )
1.7x10 x exp(1000 / )x[ ]( )x
(1 1.4x10 x x exp(2200 / ))
a
b
a b
k T
k Tk k k
H O T
−
−
−
=
=
= +
+
M
2SO hv SO O+ → + 2
56.1x10SOj −=
2 2OH SO M HOSO M+ + → + 129 3.13x10k −=
2OH SO H SO+ → + 1110 8.3x10k −=