particulate matter sampling and correlations to wind ...uranium.sdsmt.edu/downloads/pm results final...
TRANSCRIPT

Particulate Matter Sampling and Correlations to Wind Tunnel Dust Samples from the Cave Hills, Harding Co., South Dakota
Prepared by Dr. Larry D. Stetler, CPG Associate Professor of Geological Engineering
Dr. James J. Stone, PE
Assistant Professor of Environmental Engineering
Report # 03-08 Department of Geology & Geological Engineering
SD School of Mines & Technology Rapid City, SD
Submitted to US Forest Service Northern Regional Office
Missoula, MT ATT: Mr. Robert Wintergerst
March 6, 2008

PM Sampling Sites A total of six particulate matter (PM) filter samples were collected in 2007 to assess the potential for detection of radionuclide transport by dust. Four of the filters were collected at field sites in the North and South Cave Hills and two were prepared lab samples that were made at SDSM&T. Sampling sites were designated by the filter number and are shown in Figure 1. Figure. 1. Field sampling sites (red pins) for PM dust collected during the 2007 field season. All samples were collected using a Graseby-Anderson high volume air sampler having a particulate matter cut size of 10 micrometers aerodynamic diameter, designated as PM10. The
2

sampler operates on 110v AC vacuum motor (utilizing a portable generator) that generates a nominal air flow rate of 1132 L/min. These samplers are EPA approved for collecting PM samples and utilize opposed-jet inertial separation to achieve the cut size. Figure 2 shows this sampler deployed at the four field sites during the 2007 field season.
D C
A B
Figure 2. PM10 sampler deployed approximately 2 miles SE of Bluff B (A), approximately 0.5 miles W of Bluff J (B), approximately 1.5 miles NW of the South Cave Hills (C), and approximately 4 miles east of Bluff B. The two filter samples prepared at SDSM&T utilized a surface dust sample collected using the wind tunnel during the 2006 field season. Sample NCH-WT-5-4 was located about 5 miles east of Riley Pass and had surface dust uranium concentration of 1.603 mg/kg, one of the three highest uranium concentrations detected. Each of the two prepared filters contained differing masses of soil, 1 gram and 0.5 gram, on respective filters. The dust was loaded onto the filters through the sampler inlet over a period of 10 minutes. The field samples were collected during several hours of operation in varying wind conditions. Wind speeds were measured in the field using a hand-held anemometer. The National Weather Service records for Bowman, ND and a weather Co-op site in Buffalo, SD were used to determine the number of days since any precipitation fell in the area. Sampling was only initiated if there had been a minimum of six days without recorded precipitation. Details related to each of the four
3

samples are given below. Filter Sample 7815100 The collection dates were July 16-17, 2007. The site was about 15 feet from the ambient dust collection site NCH-AD-2 and was located on US Forest Service land on the bluff above the Rotenberger ranch and about 2 miles SW of the Riley Pass mine complex. Wind conditions during July 16 were calm to very calm and the air contained no visible dust. What breeze there was came from the SE and completely subsided in the early evening. The sampler was turned off from 7:15 PM until 9:40 AM, July 17 when a slight breeze began to blow out of the east. The instrument continued operating until 3:40 PM when rain began falling across the entire Cave Hills region. The total sampling time was 11 hours. Filter Sample 7815097 The collection dates were July 30-31, 2007. The site was located on the Clarkson Ranch less than 0.5 miles west of Bluff J and slightly farther from Bluffs K1 and K2. Wind was 10-15 mph from the E-NE and was optimal for sampling downwind of abandoned mine sites. The atmosphere contained slightly visible dust. The instrument was shut off between 9:40 PM and 6:55 AM due to no wind. On the 31st, wind conditions were light but continuous. The instrument site was taken down at 4 PM. Total collection time was 15.5 hours. Filter Sample 7815096 The collection date was October 5, 2007. The site was located on the JJ Ranch about 1.5 miles NW of the South Cave Hills and about 2 miles NW from the Lonesome Pete Mine. Wind was 12-14 mph from the SE with frequent sustained gusts of 20 mph, making this a downwind sampling site for the South Cave Hills. By early evening clouds had moved in, temperatures fell, and at 9 PM a heavy rain began. The site was closed at 8:40 PM after a total collection time of 9.5 hours. Filter Sample 7815095 The collection dates were October 18-19, 2007. The site was located on the Rotenberger Ranch about 4 miles W of the Riley Pass abandoned mines. Wind speeds were from between 15-20 mph with higher gusts coming from the NW. The air was visibly clean. The sampler was shut off at 1:40 PM on the 19th after 23 hours of continuous operation. Impact of Radionuclide Transport by Dust As part of the 2006 field season sampling program, a portable wind tunnel (Stetler, 1999) was utilized at 30 sites (Fig. 3) to generate fine particulate matter liberated under ~40 mph winds. Collected dust samples were used to assess depositional and re-entrainment processes for aerosol dusts potentially having an origin from the North Cave Hills. Samples were analyzed for eight metals (Table 1) to assess potential contamination due to past uranium mining activity in the area. Sampling included the use of a hand-held Geiger counter to measure ambient background low-level radiation values from alpha, beta, gamma, and x-ray radiation. The average ambient background value for all sites was 40 counts per minute (CPM) and the average for the dust samples was 70 CPM (Table 2). Although the dust samples were 57 % higher than the ambient background, they did not vary significantly and indicate no sampling locations were a radioactive hot spot. By comparison, the abandoned mine sites in the North Cave Hills routinely yielded readings of multiple hundred counts per minute to reading of several thousand in localized areas.
4

In August 2006, a general survey was made of two abandoned mine sites in the South Cave Hills (Daisy May and the Lonesome Pete) and the radiation readings at these sites were 1200 CPM and 3500 CPM, respectively. Thus, differences in radiometric readings between soil and dust, from 40 to 70 CPM, are insignificant. Table 2 also shows the concentrations of radionuclides in analyzed dust samples from the wind tunnel.
Figure 3. Wind tunnel sampling sites in the North Cave Hills from the 2006 field season.
5

Table 1. Target analytes for wind tunnel and PM samples collected during the 2006-2007 field seasons and analytical detection limit (DL).
Analyte Name Chemical Symbol DL (mg/kg) Arsenic As 0.5 Copper Cu 0.5 Lead Pb 0.5 Molybdenum Mo 0.5 Selenium Se 0.5 Thorium 232 Th 0.5 Uranium U 0.5 Vanadium V 0.5
Wind tunnel sampling sites were selected to ensure the dust originated either from dust-fall or in-situ soil forming processes, however, time between active mining and the sampling period could easily have diluted the metals contamination in the dust by rain removal of particles, infiltration to deeper layers of the soil resulting in reductions in the concentration, and re-entrainment and transport by wind. These potential dilution factors formed the primary reason PM samples were obtained, i.e., to determine if active dust movement contains elevated radionuclide values. The concentrations of the radioactive analytes from the wind tunnel dust samples were also converted from milligram per kilogram (mg/kg) to picocuries per gram (pCi/g) in order to obtain information specifying the amount of radioactivity present in the samples, i.e., the rate at which radiation was emitted by the disintegration of the radionuclides (especially uranium and thorium) in the dust samples (Table 3)
For Table 3, the concentration of uranium (mg/kg) obtained from the ICP-MS analysis was distributed according to the natural abundance of uranium isotopes; 99.274% for U238, 0.72% for U235, and 0.0055% for U234 (Walter, 2005). The concentration of the individual radionuclides, including thorium, was converted to pCi/g by combining a relationship between mass of a radionuclide and its half-life. The method used is given in Appendix A.
One gram of U234 naturally contains the highest specific activity (SA) defined as the radioactivity per gram of the radionuclide (App. A). Expressed as pCi/mg of the radionuclide (Table A-1, App. A), the amount of disintegration per second is 5 orders-of-magnitude greater for U234 than for U238. Thus, their relative natural abundances differ accordingly and the amount of U238 per unit mass of a dust sample is far greater than that of the other uranium isotopes since they have largely disintegrated. This also results in the measurement being more a factor of U234 and U235 disintegration than that of U238, even though there are more atoms of U238 per unit mass of dust sample.
However, the disintegration rates per unit sample mass were generally small and the maximum observed value was 1.2 pCi/g for U234 at site # NCH-WT-32-1. All but six of the remaining samples were less than 0.4 pCi/g, with the other six between 0.4 and 0.7 pCi/g. These values represent a calculated range that would be expected for uranium isotopes if a full radiochemical analysis were performed on the dust samples.
6

Table 2. Background (BGR) radiation counts in counts per minute (CPM) measured at wind-tunnel sites, from the dust samples (WTD), and concentration of radionuclides (Th, U) in the analyzed dust samples.
Sample ID
BGR CPM
WTD CPM
Th mg/kg
U mg/kg
NCH-WT-1-2 56 74 3.226 0.882NCH-WT-2-2 46 70 2.452 0.728 NCH-WT-3-2 70 72 1.807 0.736 NCH-WT-4-4 34 70 3.303 0.887 NCH-WT-5-4 36 76 3,464 1.603 NCH-WT-6-3 46 72 1.138 1.204 NCH-WT-7-2 34 72 1.829 0.561 NCH-WT-8-3 56 68 1.747 0,980 NCH-WT-9-3 76 82 1.826 1.197 NCH-WT-10-2 66 68 2.139 1.148 NCH-WT-11-2 42 70 1.616 0,698 NCH-WT-12-2 56 68 2.947 0.685 NCH-WT-13-1 56 70 5.725 1.242 NCH-WT-14-2 58 80 3.092 1.055 NCH-WT-15-2 46 62 1.772 <0.500 NCH-WT-I6-2 42 50 0.536 0.501 MCH-WT-17-2 42 74 2.621 0.662 NCH-WT-18-3 40 78 1.049 0.590 NCH-WT-19-4 42 62 0682 1,959 NCH-WT-20-2 60 78 2.414 1.656 NCH-WT-21-2 60 72 3.652 0.914 NCH-WT-22-2 46 70 3.269 0.528 NCH-WT-23-3 42 72 2.573 0.580 NCH-WT-24-2 42 76 1.710 0.683 NCH-WT-27-1 34 60 2.542 0.674 NCH-WT-29-1 56 60 3.375 0.691 NCH-WT-30-1 44 68 2561 0.643 NCH-WT-31-1 60 66 2.127 0.969 NCH-WT-32-1 62 74 5994 3.485 NCH-WT-34-1 52 68 2.736 0.665 NCH-WT-35-1 46 74 1.708 0.585
Average 49.9 70.1
7

Table 3. Concentrations of uranium and thorium radionuclides in dust samples. Sample ID U238 U235 U234 Th232 U238 U235 U234 Th232
mg/kg mg/kg mg/kg mg/kg pCi/g pCi/g pCi/g pCi/g NCH-WT-1-2 0.8755 0.0063 0.0001 3.2253 0.2941 0.0137 0.3129 0.3549 NCH-WT-2-2 0.7225 0.0052 0.0000 2.4515 0.2427 0.0113 0.2504 0.2697 NCH-WT-3-2 0.7300 0.0053 0.0000 1.8068 0.2452 0.0114 0.2504 0.1988 NCH-WT-4-4 0.8802 0.0064 0.0001 3.3027 0.2957 0.0138 0.3129 0.3634 NCH-WT-5-4 1.5911 0.0115 0.0001 3.4631 0.5344 0.0249 0.5633 0.3810 NCH-WT-6-3 1.1949 0.0087 0.0001 1.1372 0.4014 0.0187 0.4381 0.1251 NCH-WT-7-2 0.5562 0.0040 0.0000 1.8281 0.1868 0.0087 0.1878 0.2011 NCH-WT-8-3 0.9725 0.0071 0.0001 1.7463 0.3266 0.0152 0.3129 0.1921 NCH-WT-9-3 1.1881 0.0086 0.0001 1.8257 0.3991 0.0186 0.4381 0.2009 NCH-WT-10-2 1.1389 0.0083 0.0001 2.1389 0.3826 0.0178 0.3755 0.2353 NCH-WT-11-2 0.6922 0.0050 0.0000 1.6159 0.2325 0.0108 0.2504 0.1778 NCH-WT-12-2 0.6794 0.0049 0.0000 2.9463 0.2282 0.0106 0.2504 0.3242 NCH-WT-13-1 1.2328 0.0089 0.0001 5.7245 0.4141 0.0193 0.4381 0.6298 NCH-WT-14-2 1.0470 0.0076 0.0001 3.0915 0.3517 0.0164 0.3755 0.3401 NCH-WT-15-2 <0.4965 <0.0036 <0.00028 1.7719 <0.1670 <0.0077 <1.720 0.1950 NCH-WT-16-2 <0.4965 <0.0036 <0.00028 0.5359 <0.1670 <0.0077 <1.721 0.0590 NCH-WT-17-2 0.6571 0.0048 0.0000 2.6203 0.2207 0.0103 0.2504 0.2883 NCH-WT-18-3 0.5853 0.0042 0.0000 1.0487 0.1966 0.0092 0.1878 0.1154 NCH-WT-19-4 1.9439 0.0141 0.0001 0.6815 0.6529 0.0305 0.6885 0.0750 NCH-WT-20-2 1.6437 0.0119 0.0001 2.4139 0.5521 0.0257 0.5633 0.2656 NCH-WT-21-2 0.9067 0.0066 0.0001 3.6514 0.3045 0.0142 0.3129 0.4017 NCH-WT-22-2 0.5236 0.0038 0.0000 3.2687 0.1759 0.0082 0.1878 0.3596 NCH-WT-23-3 0.5752 0.0042 0.0000 2.5728 0.1932 0.0090 0.1878 0.2831 NCH-WT-24-2 0.6773 0.0049 0.0000 1.7095 0.2275 0.0106 0.2504 0.1881 NCH-WT-27-1 0.6686 0.0048 0.0000 2.5418 0.2246 0.0105 0.2504 0.2797 NCH-WT-29-1 0.6854 0.0050 0.0000 3.3742 0.2302 0.0107 0.2504 0.3712 NCH-WT-30-1 0.6376 0.0046 0.0000 2.5606 0.2142 0.0100 0.2504 0.2817 NCH-WT-31-1 0.9615 0.0070 0.0001 2.1265 0.3230 0.0151 0.3129 0.2340 NCH-WT-34-1 0.6598 0.0048 0.0000 2.7356 0.2216 0.0103 0.2504 0.3010 NCH-WT-35-1 0.5801 0.0042 0.0000 1.7078 0.1948 0.0091 0.1878 0.1879 NCH-WT-32-1 3.4592 0.0251 0.0002 5.9931 1.1619 0.0542 1.1892 0.6594
The radiochemical concentration values obtained from the dust samples were compared to the average values of contaminant concentrations for certain radionuclides in sedimentary and igneous rocks (Table 4) (U.S. EPA, 2006). Comparison between concentrations in Table 3 and the average U238 and Th232 concentrations in Table 4 indicates that the dominant rock type that would yield the observed values would be sedimentary rocks. This, in fact, makes perfect sense as the Cave Hills buttes consist of sedimentary rocks, predominantly sandstone and shale with interlayers of coal and siltstone. Native soil would have been derived from weathering and soil genesis of these sediments. The presence of abandoned uranium mines in Harding County has undoubtedly raised concerns related to potential health risks to the general public. Indeed, these concerns were a primary factor in the initiation of this project. The primary hazardous characteristics of uranium mine waste are
8

1) elevated radioactivity as radon emanations (radioactive gaseous isotopes of radon), 2) elevated radiation in the vicinity of the mine sites, and 3) potential for heavy metals migration and contamination to soil, surface, and ground water. Abandoned mine sites potentially serve as not only pollution sources for water and soil but also as emission sources for generation of airborne radioactive contaminants. Wind erosion of contaminated mine spoils would enhance opportunity for continuous emission of dust or resuspended soil particles that might contain radionuclides in particulate forms (Eastern Research Group Inc., 2004). Thus, it has been deemed necessary to evaluate if inhalation of dust and soil particles in the study area constitutes a potential health hazard. Specifically, interest lies in assessment of potential disposition of contaminated particles, i.e., are dust particles contaminated with high enough concentration of radionuclides to cause elevated radiation, and where are such particle being deposited. From a human health standpoint, contaminated PM particles small enough to settle in the bronchi and lungs could lead to adverse health conditions. Table 4. Concentrations of certain natural radionuclides in igneous and sedimentary rocks (from U.S. EPA, 2006). Bq = Becquerel = 1 disintegration per second.
Rock Type
Igneous 1.30 48.0 1.30 48.0 1.30 48.0 22.0 810.0Sandstone 0.71 26.0 0.40 15.0 0.65 24.0 8.8 330.0Shale 1.08 40.0 0.40 15.0 1.10 41.0 22.0 810.0Limestone 0.42 16.0 0.40 15.0 0.14 5.1 2.2 81.0
K-40 Bq/g
Radium ThoriumUranium PotassiumRa-226 pCi/g
Ra-226 Bq/g
U-238 pCi/g
U-238 Bq/g
Th-232 pCi/g
Th-232 Bq/g
K-40 pCi/g
Inhalation of dust containing radionuclides that could lead to irradiated lung tissue is a major hazard of airborne radioactive contamination. Radiological studies from uranium mine environments reveal tumor, atrophy of functional tissue, and increased susceptibility to other disease agents, as basic types of radiation injury in the respiratory tract. Possible effects related to external radiation and effects related to deposition of dust particles containing radionuclides on the skin and in the eyes are considered minor with respect to those of respiratory tract (U.S. EPA, 1967). On the other hand, effects of PM inhalation have been widely studied in humans and animals and include asthma, lung cancer, cardiovascular issues, and even premature death. The main determinant of where in the respiratory tract the particle will come to rest when inhaled is particle size. Larger particles are generally filtered in the nose and throat and do not cause problems, but PM particles smaller than about 10 micrometers, PM10, can settle in the bronchi and lungs and potentially lead to health problems. The 10 micrometer size does not represent a strict boundary between respirable and non-respirable particles, but has been agreed upon for monitoring of airborne PM by most regulatory agencies. Similarly, particles smaller than 2.5 micrometres, PM2.5, tend to penetrate into the gas-exchange regions of the lung, and very small particles (< 100 nanometers) can pass through the lungs to affect other organs. There is also evidence that particles smaller than 100 nanometers can pass through cell membranes (U.S. EPA, 1991). Thus, PM sampling, as was performed in this study, was more appropriate than collecting total suspended particles (TSP). TSP will produce greater mass loading on filters but includes particles sizes up to several hundred micrometers. As interest is on the health impacts of inhalable dusts, the PM10 size was the most appropriate for collection and analysis with the realization that
9

mass loadings would be significantly lower than other types of aerosol monitoring. Analytical Methods Filter analysis was conducted by acidification and filter digestion per EPA Method 3050B for preparation of sample for metals analysis. The resulting liquid was analyzed for total metals following EPA Method 200.8 by Inductively Coupled-Mass Spectrometry (ICP-MS). Complete filter digestion was necessary due to the interwoven fabric of the filter effectively trapping the dust particles and not allowing them to be dislodged and remain uncontaminated. All analysis was made by ICP-MS. Appendix B contains the analytical summary, laboratory reports for each filter, the QA/QC summary report, and the chain of custody form that was provided by Energy Laboratories, Inc. In addition, only one of the prepared filters was submitted for analysis; that being the filter having the 1.0 gram soil mass (#7815099). There were two reasons why only one filter was analyzed: 1) it was thought the preloaded filter having the highest mass of dust with a known uranium concentration would be of immediate use in validating the method, i.e., to determine if PM dust captured using a high volume PM sampler contain enough mass to provide opportunity for analytical detection, and 2) the filter having the 0.5 grams of mass was nearly visually indistinct from a clean filter (Fig. 4) and was deemed too low of a mass loading to yield an analysis. Figure 4. Comparison of a new, clean filter (right) to the prepared filter having 0.5 gram dust mass from sample NCH-WT-5-4 (left). Note the ~0.5 inch clean border and a slightly darker interior from dust loading. Inset is the clean filter loaded into the filter holder that is installed in the high volume sampler. White ruler at bottom of filter holder is 7 inches long.
10

Results and Discussion Results of the filter analysis showed that no analyte on any of the five filters (Fig. 5) contained a metals concentration that was above the detection limit of 0.5 mg/kg. There may be several reasons for this. First, the samples may actually have been devoid of any of the metal analytes. Second, the concentration of any metals present may have been lower than analytical detection limits as a result of a low mass of collected material analyzed. Using supplied values obtained from the ICP-MS analysis performed, it appears likely that the latter reason is most valid. As reported, all analytes were below the detection limit (App. B) but the analysis also provided an estimated value below reporting limits (analytical value, Table 5). If obtained values exceed the detection limit, the calculated concentration was reported. If they did not, than a non-detect was issued. Using the analytical values for uranium concentrations from the analysis and the known mass loading on the filters, uranium concentrations in mg/kg have been calculated. These values appear to be validated based on the control filter, 7815099, having a 1.0 gm mass loading and a uranium concentration of 1.603 mg/kg. 7815100 7815095 7815096 7815099 (0.5 g) 7815097 Figure 5. Clean filter in center surrounded by a piece of each of the loaded filters. Filter number is shown by the piece. Note the differing visual appearance resulting from differing mass loadings. Each filter piece is from an edge and contains a loaded section and a clean border. For the control filter, Table 5 shows that if the entire 1.0 gm of mass was actually loaded on the
11

filter that the uranium concentration would have been 3.57 mg/kg, approximately double the value obtained in 2006 but within an order-of-magnitude. This value was derived by multiplying the mass (in milligrams) by the analytical value (1000 mg x 0.00357 mg/filter = 3.57 mg/filter). A 1.0 g mass on the filter would then translate to units of mg/kg and the result was 3.57 mg/kg. Any mass loading value less than 1.0 gram would lower the calculated concentration value. Calculated U concentrations for the four field PM samples were determined similarly using the measured mass loadings adjusting for the weighed mass on the filter (column 2 in Table 5). For example, filter #7815095 was 0.045 g x 1000 mg/g x 0.00926 mg/filter = 0.4167 mg/filter x 0.9569 = 0.3896 mg/kg (1) The multiplier 0.9569 was the percentage of the filter sent in for analysis. The remaining ~5% of the mass was retained and is shown in figure 5. Each calculation, using the percentage of the filter submitted for analysis, was performed using this method. Basing on the above arguments and calculations, and assuming analytical values in Table 5 are order-of-magnitude, then for the dust mass loadings on the filters, the uranium concentrations for these samples would be close to those shown in column 4 of Table 5. The average for the four field PM samples is 0.16 mg/kg and is 22 % of the average uranium concentration determined for the wind tunnel surface dusts (0.74 mg/kg background). Table 5. Calculated dust mass loadings on filters and analytical values reported by ELI. These analysis are for discussion only since all concentrations were below the detection limit of the instrument.
Filter ID Dust Mass Analytical Value U No. gm mg/filter mg/kg
7815100 0.029 0.00102 0.02835 7815099 1.0 0.00357 3.57035 7815098 NOT USED IN ANALYSIS 7815097 0.009 0.00060 0.00515 7815096 0.025 0.00860 0.20886 7815095 0.045 0.00926 0.39861
As part of the field work, peak background radiation measurements were acquired at the wind tunnel sites and on samples and was almost always less than 80 CPM and only rarely did counts rise to ~120. The concentrations of U and Th determined from geochemical analysis of the dust samples collected at the sites were also low (Table 2). Results obtained for U and Th (picocuries per gram) in the dust samples (Table 3) indicate that radionuclide concentrations were at background levels for natural materials (Table 4). Subsequent human health impact assessment was related to established standards for respirable dusts. EPA regulations do not specify concentration limits or maximum contaminant levels for uranium in dust samples. However, inhalation standards for work-related respirable dusts are given by the Occupational Safety and Health Administration (OSHA) 29 CFR 1926.55 which specifies a uranium on dust standard of 0.2 mg/m3 of air. Direct comparison between values reported in Table 5 (mg/kg) to OSHA standards (mg/m3) may
12

be made using the following methodology and assumptions:
1) mass of metal retained on the filter (Table 5) correlates to total mass of metal contained within the total volume of air filtered
2) the mass of metal retained is divided by the volume of air filtered (m3) for comparison to OSHA dust standard (mg/m3)
Using the steps described above, the comparable OSHA concentrations for filter # 7815095 may be estimated. This filter was sampled for 23 hours at 1132 L/min nominal flow rate equating to 1,562 m3 of air sampled. The equivalent mass concentration of uranium retained on the filter was 0.00926 mg. For this mass to be collected during the sampling period, the average equivalent mass concentration per m3 of air would need to be:
36
3 9.5562,100926.0
mmgEm
mg −= (2)
This value is greater than 4 orders-of-magnitude less than the OSHA uranium standard of 0.2 mg/m3. Likewise, the approximate mass of uranium required to be retained on a filter to exceed the standard over the same time teriod can also be calculated:
mgmxmmg 4.312562,12.0 3
3 = (3)
This calculated mass is nearly 33,000 times the mass of uranium actually retained on the filter (0.00926 mg). Lastly, the abundance of particles in the immediate area able to become part of the respirable aerosol dust must be evaluated. Laser particle analysis performed on soil samples (Onyeukwu, 2007) indicate that availability of particles less than 2.5 and 10 microns (PM2.5 and PM10) were significantly small (less than 1%). Moreover, tentative results obtained from analysis of ambient background dust samples (Stone et al., 2007) indicate low concentrations of analytes, especially the radionuclides, whose concentrations were generally below detection limits. Conclusions
• No PM filter sample analysis contained a detection of contaminant metals; • Calculations based on analytical data indicate PM uranium concentrations are 22% of
uranium concentrations on surface dusts; • Uranium concentrations on surface dusts are seven times less than those determined for
soils (Stone et al., 2007); • Calculations based on analytical data indicate PM uranium concentrations are four orders-
of-magnitude less than the OSHA uranium standard for dust of 0.2 mg/m3. Based on the above data and supporting calculations, these results suggests that uranium concentration on aerosol dusts is very low and does not constitute a negative human health impact. It is not expected that continued inhalation of dust particles in the study area will be a potential radiological hazard.
13

Future Sampling Prudence would suggest that at least two additional samples be collected during the 2008 field season meeting these criteria: 1) the wind speeds be near to or above threshold erosion condition, estimated at about 13 mph for Cave Hills soils, 2) the sampler be connected to a outlet source of power so that the generator (and the frequent gas-ups) can be eliminated, and 3) the sampling time be for several days to a week to ensure a well-saturated filter having at least 1 gram of dust mass. Potential sites would be located east of the Riley Pass mine complex on private lands near dwellings or water wells. Analysis of these filters will be utilized to confirm or disprove the above analytical hypothesis. References Eastern Research Group Inc. 2004. Methods for estimating fugitive air emissions of radionuclides
from diffuse sources at DOE facilities: final report for US Environmental Research Agency, Office or Radiation and Indoor Air Radiation Protection, Pennsylvania. pp. 2-2 – 3-8.
Onyeukwu, K. 2007. Assessment of wind- and soil-related hazard associated with abandoned uranium mines in the North Cave Hills, Harding County, South Dakota. Unpub. MS thesis, Department of Geology & Geological Engineering, SD School of Mines, Rapid City, SD, 192p.
Stetler, L.D. 1999. Design and construction of a portable wind tunnel for soil erosion research. in Higgins, K.E. (ed), Proc. SD Acad of Sci., 78:23-33.
Stone, J.J., L.D. Stetler, and A. Schwalm. 2007. Final report: North Cave Hills abandoned uranium mines impact investigation: Report No. 07-03, Department of Civil and Environmental Engineering, South Dakota School of Mines and Technology. Prepared for USDA-USFS Northern Regional Office, Missoula, MT. March 2007.
U.S. EPA. 1967. Guidance for the control of radiation hazards in uranium mining: staff report of the Federal Radiation Council: Report No.8, Revised. http://www.epa.gov/radiation/docs/federal/frc_rpt8.pdf
U.S. EPA. 1991. Methods for the determination of metals in environmental samples: http://www.epa.gov/microbes/methmans.html#Metals%20Orig
U.S. EPA. 2006. Technologically enhanced naturally occurring radioactive materials from uranium mining.Vol.1: Mining and Reclamation Background. pp. 1-8 – 1-20. http://www.epa.gov/radiation/docs/tenorm/402-r-05-007.pdf
Walter, J.V. 2005. Essentials of Geochemistry. pp. 357 – 390. Washington State Department of Health. 2002. Uranium-233 at the Hanford nuclear site. Fact
Sheet #34, Office of Radiation Protection, 3p.
14

APPENDIX A
15

A direct relationship exists between the mass of a radionuclide and its degree of radioactivity and, thus, the number of transformations per unit time, i.e., disintegrations per second (dps). This is also referred to as picocuries (pCi) where 1 dps = 1 Becquerel (Bq) = 3.7∗ 10-10 Curies (Ci). The resulting amount of activity, per unit mass of dust sample, would be an activity concentration, e.g., in pCi/g. If radioactive atoms are thought of in terms of an atom population, and with the same type of radioactive atom, each atom would have an equal probability of undergoing a disintegration or decay. A decay can be achieved through the emission of an alpha, beta, and/or gamma ray. Because the specific radionuclide's nuclear configuration dictates its stability, it will decay at a certain unique rate, with a particular half-life. The half-life is the time for half of the population of radioactive atoms to disintegrate and emit a radiation transforming into some other decay product. Depending on the radionuclide, the half-life can be as short as a fraction of a second or over a billion years. The half-life (T1/2) is mathematically defined as equal to the natural log of 2 divided by a decay constant, λ :
)()2ln(2/1 sT=
λ (1)
Most often the half-life is given for a particular radionuclide, and one can rearrange equation (1) to determine the decay constant:
)()2ln(
2/1
sT
=λ (2)
Once the decay constant has been determined for any radionuclide, it can be multiplied by the number of atoms (N) present resulting in a calculated amount of radioactivity (A) present, where A = N ∗ (λ), in disintegration per second (dps) or Becquerel (Bq). In addition, the number of atoms per gram of a particular element can be determined using Avogadro’s number (6.023 x 10²³) and the element's atomic weight or atomic mass, M. Thus, the decay constant (or half-life) can be used to calculate any given radionuclide's specific activity (SA), i.e., its radioactivity per gram in Ci/g or Bq/g. This relation is shown below:
SA (dps/g or Bq/g) = M
λ*)10*023.6( 23
(3)
Substituting equation (2) into equation (3) yields:
SA (dps/g) = 2/1
23
*10*175.4
TM (4)
16

U238 has an atomic mass of M = 238.0507 and a relatively long half-life, T1/2 = 4.47 ∗ 109 years (or 1.41 10∗ 17s). Substitution of these values into equation (4) results in a fairly low SA = 12,433 dps/g or Bq/g. Comparatively, U234 has a calculated SA = 2.31 * 108 dps/g, or ~18,000 time the activity of U238. Using the unit conversion of 3.7∗ 1010 dps/Ci, U238 activity converts to 3.36∗ 10-7 Ci/g, or 3.36 10∗ -10 Ci/mg. In terms of the picocurie prefix, where 1 pCi = 1∗ 10-12 Ci, the resulting SA = 3.36 10∗ 2 pCi/mg. The U238 SA of 3.36∗ 102 pCi/mg now becomes a conversion factor (CF) for the U238 data. CF for U234 is 6.26*106 pCi/mg, 6.26*106 pCi/mg for U235, and 1.1*102 for Th232 (Table A-1). Table A-1. Data table for calculation of specific activity and conversion factors for uranium radionuclides.Radionuclide Molar mass (M ) Half-life,T 1/2 (yr) Occurrence (%) CF (pCi/mg )
U238 238.05070 4.47E+09 99.274 3.36 x 10²
U235 235.04392 7.04E+08 0.72 2.16 x 10³
U234 234.04094 2.44E+05 0.0055 6.26 x 10⁶
Th 232.03806 1.40E+10 100 1.1 x 10²
Thus, the analytical concentration (mg/kg) for these radionuclides are multiplied by their corresponding CF (pCi/mg) to derive the values in pCi/kg. These present the amount of radioactivity per kilogram of dust sample. Dividing the resulting quantity by 1000 yields the amount in picocuries per gram (pCi/g) of the dust sample and are given in Table 2.
17

APPENDIX B
18

-—-r,, ENERGY LABORATORIES, INC. 2821 Plant Street Rapid City, SD 57702 www.energylab.com Toll Free 888.672.1225 Voice 605.342.1225 > Fax 605.342.1397 ° [email protected]
ANALYTICAL SUMMARY REPORT January 24, 2008 Larry D Stetler SDSM&T 4-10130 501 E St Joe Rapid City, SD 57701 Workorder No.: R08010001 Project Name: Cave Hills Project Quote ID: R235 Energy Laboratories Inc. received the following 5 samples from SDSM and T 4-10130 on 12/28/2007 for analysis.
19
Sample ID Client Sample ID R08010001-001 7815100
R08010001-002 7815099
R08010001-003 7815097
R08010001-004 7815096
07/16/07 0:00 12/28/07
10/05/0 0:00 12/28/07
Test Metals by ICP/ICPMS, Total Digestion, Total Metals Same As Above
Same As Above
Same As Above
R08010001-005 7815095 10/18/070:00 12/28/07 Same As
Above
Thank you for submitting your samples to Energy Laboratories, Inc. - Rapid City. The following pages contain the results of the sample tests listed above and applicable analytical notes.
The samples were analyzed in accordance with the methods specified on the analytical reports. All analyses were accompanied by appropriate quality control samples throughout the test. Where applicable, the results of these quality control samples will be included, following your analytical data.
If you have any questions regarding the analyses performed or the results of these analyses, please contact Energy Laboratories Inc. - Rapid City at (605) 342-1225, (888) 672-1225 or [email protected].
Collect Date Receive DateFilter
07/19/07 0:00 12/28/07 Filter
07/30/07 0:00 12/28/07 Filter
Filter
Filter

ENERGY LABORATORIES, INC. 2821 Plant Street Rapid City, SD 57702 www.energylab.com Toll Free 888.672.1225 Voice 605.342.1225 Fax 605.342.1397 rapid_ city@energylab. com
LABORATORY ANALYTICAL REPORT Client: SDSM and T 4-10130 Project: Cave Hills Project Lab ID: R08010001-001 Client
Report Date: 01/24/08 Collection Date: 07/16/07 Date Received: 12/28/07 Matrix: FILTER
20
TOTAL METALS ANALYSES
Arsenic ND mg/filter 0.50 10 SW6020 01/1 0/08 06:24/eli-c Copper ND mg/filter 0.50 10 SW6020 01/10/08 06:24/eli-c Lead ND mg/filter 0.50 10 SW6020 01/10/08 06:24/eli-c Molybdenum ND mg/filter 0.50 10 SW6020 01/10/08 06:24/eli-c Selenium ND mg/filter 0.50 10 SW6020 01/10/08 06:24/eli-c Thorium 232 ND mg/filter 0.50 10 SW6020 01/1 1/08 22:42/eli-c Uranium ND mg/filter 0.50 10 SW6020 01/10/08 06:24/eli-c
MCL/Qual RL QCL DF Method
Vanadium ND mg/filter 0.50 10 SW6020 01/1 0/08 06:24/eli-c
Analysis Date / ByAnalyses Result Units
RL-Analyte reporting limit. QCL - Quality control limit.
MCL - Maximum contaminant level. ND - Not detected at the reporting limit.
Paae 1 of 5Report Definitions:

21
ENERGY LABORATORIES, INC. 2821 Plant Street Rapid City, SD 57702 www.energylab.com Toll Free 888.672.1225 ° Voice 605.342.1225 • Fax 605.342.1397 • [email protected]
LABORATORY ANALYTICAL REPORT
Client: SDSM and T 4-10130 Project: Cave Hills Project Lab ID: R08010001-002 Client Sample ID: 7815099
Report Date: 01/24/08Collection Date: 07/19/07Date Received: 12/28/07Matrix: FILTER
MCL/ Result Units Qual RL QCL DF Method
TOTAL METALS ANALYSES
Arsenic ND mg/filter 0.50 10 SW6020 01/10/08 06:32/eli-c Copper ND mg/filter 0.50 10 SW6020 01/1 0/08 06:32/eli-c Lead ND mg/filter 0.50 10 SW6020 01/10/08 06:32/eli-c Molybdenum ND mg/filter 0.50 10 SW6020 01/1 0/08 06:32/eli-c Selenium ND mg/filter 0.50 10 SW6020 01/10/08 06:32/eli-c Thorium 232 ND mg/filter 0.50 10 SW6020 01/11 /OS 22:49/eli-c Uranium ND mg/filter 0.50 10 SW6020 01/10/08 06:32/eli-c Vanadium ND mg/filter 0.50 10 SW6020 01/10/08 06:32/eli-c
Analyses Analysis Date / By
RL - Analyte reporting limit. QCL - Quality control limit.
MCL - Maximum contaminant level. ND - Not detected at the reporting limit.
Paae 2 of 5Report Definitions:

ENERG Y LABOR A TORIES, INC. - 2821 Plant Street Rapid City, SD 57702 www. energylab. com Toll Free 888.672.1225 • Voice 605.342.1225 • Fax 605.342.1397 • rapid_ city@energylab. com
LABORATORY ANALYTICAL REPORT
Client: SDSM and! 4-10130 Project: Cave Hills Project Lab ID: R08010001-003 Client Sample ID: 7815097
Report Date: 01/24/08Collection Date: 07/30/07Date Received: 12/28/07Matrix: FILTER
22
TOTAL METALS ANALYSES
Arsenic ND mg/filter 0.50 10 SW6020 01/1 0/08 06:39/eli-c Copper ND mg/filter 0.50 10 SW6020 01/10/08 06:39/eli-c Lead ND mg/filter 0.50 10 SW6020 01/1 0/08 06:39/eli-c Molybdenum ND mg/filter 0.50 10 SW6020 01/1 0/08 06:39/eli-c Selenium ND mg/filter 0.50 10 SW6020 01/1 0/08 06:39/eli-c Thorium 232 ND mg/filter 0.50 10 SW6020 01/11 /OS 22:56/eli-c Uranium ND mg/filter 0.50 10 SW6020 01/1 0/08 06:39/eli-c Vanadium ND mg/filter 0.50 10 SW6020 01/10/08 06:39/eli-c
Analyses Result Units Analysis Date / ByQual RL MCL/ DF Method QCL
RL - Analyte reporting limit. QCL - Quality control limit.
MCL - Maximum contaminant level. ND - Not detected at the reporting limit.
Page 3 of 5Report Definitions:

23
ENERG Y LABOR A TORIES, INC. • 2821 Plant Street Rapid City, SD 57702 www. energy lab. com Toll Free 888.672.1225 Voice 605.342.1225 • Fax 605.342.1397 • rapid_ city@energylab. com
Client: SDSM and T 4-10130 Project: Cave Hills Project Lab ID: R08010001-004
LABORATORY ANALYTICAL REPORT
Report Date: 01/24/08 Collection Date: 10/05/07 Date Received: 12/28/07
Client Sample ID: 7815096
Matrix
: FILTER
Analyses
Result
Units RL MCL/ QCL
DF
Method
Analysis Date / By
TOTAL METALS ANALYSES Arsenic ND mg/f liter 0.50 10 SW6020 01/10/08 06:47/eli-c Copper ND mg/f liter 0.50 10 SW6020 01/1 0/08 06:47/eli-c Lead ND mg/f liter 0.50 10 SW6020 01/10/08 06:47/eli-c Molybdenum ND mg/f liter 0.50 10 SW6020 01/1 0/08 06:47/eli-c Selenium ND mg/filter 0.50 10 SW6020 01/1 0/08 06:47/eli-c Thorium 232 ND mg/f liter 0.50 10 SW6020 01/11/08 23:03/eli-c Uranium ND mg/filter 0.50 10 SW6020 01/1 0/08 06:47/eli-c Vanadium ND mg/filter 0.50 10 SW6020 01/1 0/08 06:47/eli-c
RL - Analyte reporting limit. QCL - Quality control limit.
MCL - Maximum contaminant level. ND - Not detected at the reporting limit.
Page 4 of 5Report Definitions:

ENERGY LABORATORIES, INC. 2821 Plant Street Rapid City, SD 57702 www.energylab.com Toll Free 888.672.1225 Voice 605.342.1225 • Fax 605.342.1397 > [email protected]
LABORATORY ANALYTICAL REPORT
Client: SDSM and T 4-10130 Project: Cave Hills Project Lab ID: R08010001-005 Client Sample ID: 7815095
24
TOTAL METALS ANALYSES
Arsenic ND mg/f liter 0.50 10 SW6020 01/1 0/08 06:54/eli-c Copper ND mg/f liter 0.50 10 SW6020 01/1 0/08 06:54/eli-c Lead ND mg/filter 0.50 10 SW6020 01/10/08 06:54/eli-c Molybdenum ND mg/filter 0.50 10 SW6020 01/10/08 06:54/eli-c Selenium ND mg/filter 0.50 10 SW6020 01/10/08 06:54/eli-c Thorium 232 ND mg/filter 0.50 10 SW6020 01/11/0823:09/eli-c Uranium ND mg/filter 0.50 10 SW6020 01/1 0/08 06:54/eli-c Vanadium ND mg/filter 0.50 10 SW6020 01/1 0/08 06:54/eli-c
Report Date: 01/24/08Collection Date: 10/18/07Date Received: 12/28/07Matrix: FILTER
Qual RL MCL/ DF Method QCLResult UnitsAnalyses
RL - Analyte reporting limit. QCL - Quality control limit.
Report Definitions:
Analysis Date / By
MCL - Maximum contaminant level. ND - Not detected at the reporting limit.
5 of 5

ENERGY LABORATORIES, INC. 2821 Plant Street Rapid City, SD 57702 www.energylab.com Toll Free 888.672.1225 Voice 605.342.1225 • Fax 605.342.1397 • rapid_ city@energylab. com
QA/QC Summary Report
25
Analyte
Result
Units
RL %REC Low Limit High Limit
RPD RPDLimit Qual
Method: SW6020 Batch: C_17437
Sample ID: NIB-17437 Method Blank Run: SUB-095385 01/10/0805:25
Arsenic ND mg/kg-dry 0.006 Copper 0.006 mg/kg-dry 0.003 Lead ND mg/kg-dry 0.003 Molybdenum ND mg/kg-dry 0.003 Selenium ND mg/kg-dry 0.02 Uranium ND mg/kg-dry 0.003 Vanadium ND mg/kg-dry 0.003
Report Date: 01/24/08
Work Order: R08010001
Client: SDSM and T 4-10130
Project: Cave Hills Project
Laboratory Control Sample 0.050
Sample ID: LCS1-17437 Uranium - Spiked only with
0.50 96Run: SUB-C95385
70 130 01/10/08 06:02
Sample ID: R08010001-005A Post Digestion Spike Run: SUB-C95385 01/10/0807:02 Arsenic 0.51 mg/kg-dry 0.50 96 75 125 Copper 0.56 mg/kg-dry 0.50 99 75 125 Lead 0.53 mg/kg-dry 0.50 100 75 125 Molybdenum 0.51 mg/kg-dry 0.50 96 75 125 Selenium 0.51 mg/kg-dry 0.50 96 75 125 Uranium 0.53 mg/kg-dry 0.50 101 75 125 Vanadium 0.53 mg/kg-dry 0.50 100 75 125
Sample ID: R08010001-005A Post Digestion Spike Duplicate Run: SUB-C95385 01/10/0807:39
Arsenic 0.51 mg/kg-dry 0.50 96 75 125 0.4 20 Copper 0.55 mg/kg-dry 0.50 97 75 125 1.8 20 Lead 0.52 mg/kg-dry 0.50 98 75 125 2.2 20 Molybdenum 0.49 mg/kg-dry 0.50 93 75 125 0.0 20 Selenium 0.49 mg/kg-dry 0.50 93 75 125 0.0 20 Thorium 232 0.48 mg/kg-dry 0.50 91 75 125 0.0 20 Uranium 0.53 mg/kg-dry 0.50 100 75 125 0.8 20 Vanadium 0.53 mg/kg-dry 0.50 99 75 125 0.4 20
Sample ID: R08010001-005A Post Digestion Spike Run: SUB-C95494 01/11/0823:16
Arsenic 0.50 mg/kg-dry 0.50 95 75 125 Copper 0.54 mg/kg-dry 0.50 95 75 125 Lead 0.51 mg/kg-dry 0.50 97 75 125 Molybdenum 0.51 mg/kg-dry 0.50 97 75 125 Selenium 0.49 mg/kg-dry 0.50 92 75 125 Thorium 232 0.51 mg/kg-dry 0.50 96 75 125 Uranium 0.52 mg/kg-dry 0.50 99 75 125 Vanadium 0.50 mg/kg-dry 0.50 95 75 125
Qualifiers: RL -Analyte reporting limit. ND - Not detected at the reporting limi
Page 1 of 2
26
ENERGY LABORATORIES, INC. • 2821 Plant Street Rapid City, SD 57702 www.energylab.com Toll Free 888.672.1225 Voice 605.342.1225 • Fax 605.342.1397 • rapid_ city@energylab. com
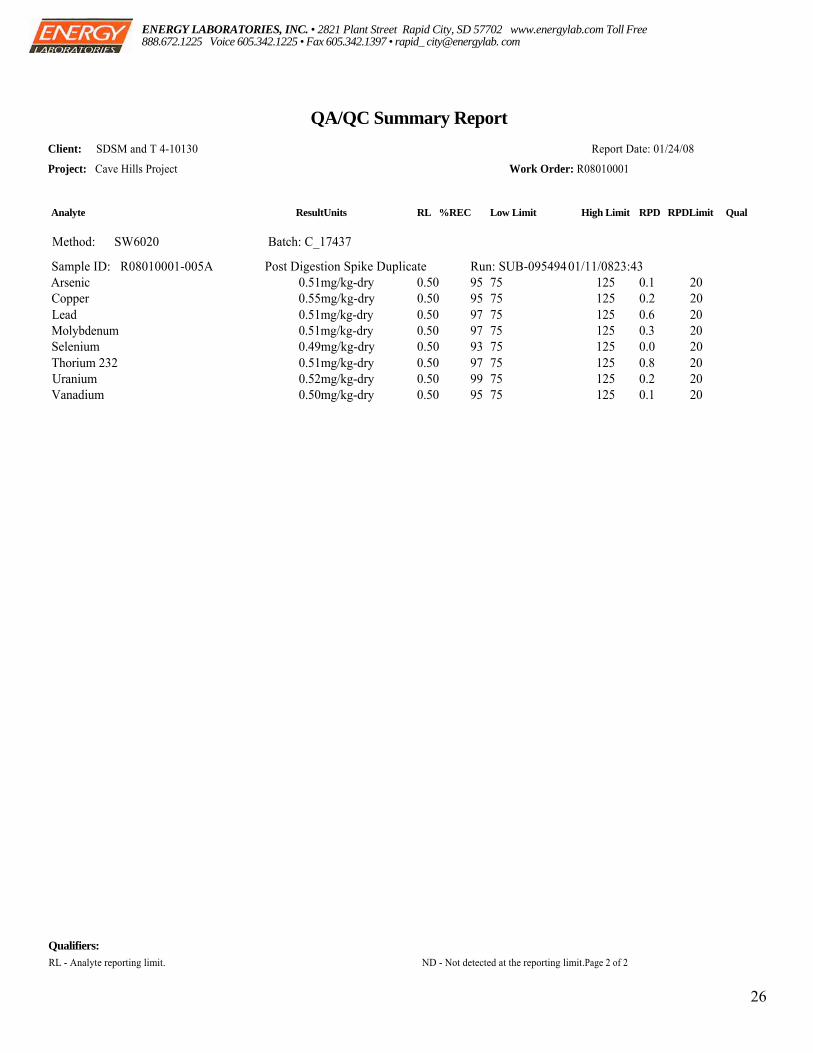
QA/QC Summary Report Client: SDSM and T 4-10130 Report Date: 01/24/08
Project: Cave Hills Project Work Order: R08010001
Analyte ResultUnits RL %REC Low Limit High Limit RPD RPDLimit Qual
Method: SW6020 Batch: C_17437
Sample ID: R08010001-005A Post Digestion Spike Duplicate Run: SUB-095494 01/11/0823:43 Arsenic 0.51mg/kg-dry 0.50 95 75 125 0.1 20 Copper 0.55mg/kg-dry 0.50 95 75 125 0.2 20 Lead 0.51mg/kg-dry 0.50 97 75 125 0.6 20 Molybdenum 0.51mg/kg-dry 0.50 97 75 125 0.3 20 Selenium 0.49mg/kg-dry 0.50 93 75 125 0.0 20 Thorium 232 0.51mg/kg-dry 0.50 97 75 125 0.8 20 Uranium 0.52mg/kg-dry 0.50 99 75 125 0.2 20 Vanadium 0.50mg/kg-dry 0.50 95 75 125 0.1 20
Qualifiers: RL - Analyte reporting limit. ND - Not detected at the reporting limit.Page 2 of 2

- 1 -