particleboard: a life-cycle inventory of manufacturing
TRANSCRIPT
CORRIM: Phase II Final Report
Module F
Particleboard: A Life-Cycle Inventory of Manufacturing Panels from Resource through Product
June 2008
Prepared by:
James B. Wilson1
1 Wilson is the Principal Investigator and Professor Emeritus, Department of Wood Science and Engineering, Oregon State University, Corvallis, OR 97331-5751. [email protected], 541-737-4227


Acknowledgements This research project would not have been possible without the financial support provided by the USDA Forest Service Forest Products Laboratory (04-CA-11111137-094), CORRIM’s contributing University members, and the contributions of many companies. Special recognition is extended to the Composite Panel Association and its membership who provided technical assistance in the form of survey production data and technical review, as well as financial support. Any opinions, findings, conclusions or recommendations expressed in this article are those of the author and do not necessarily reflect the views of contributing entities.
ii
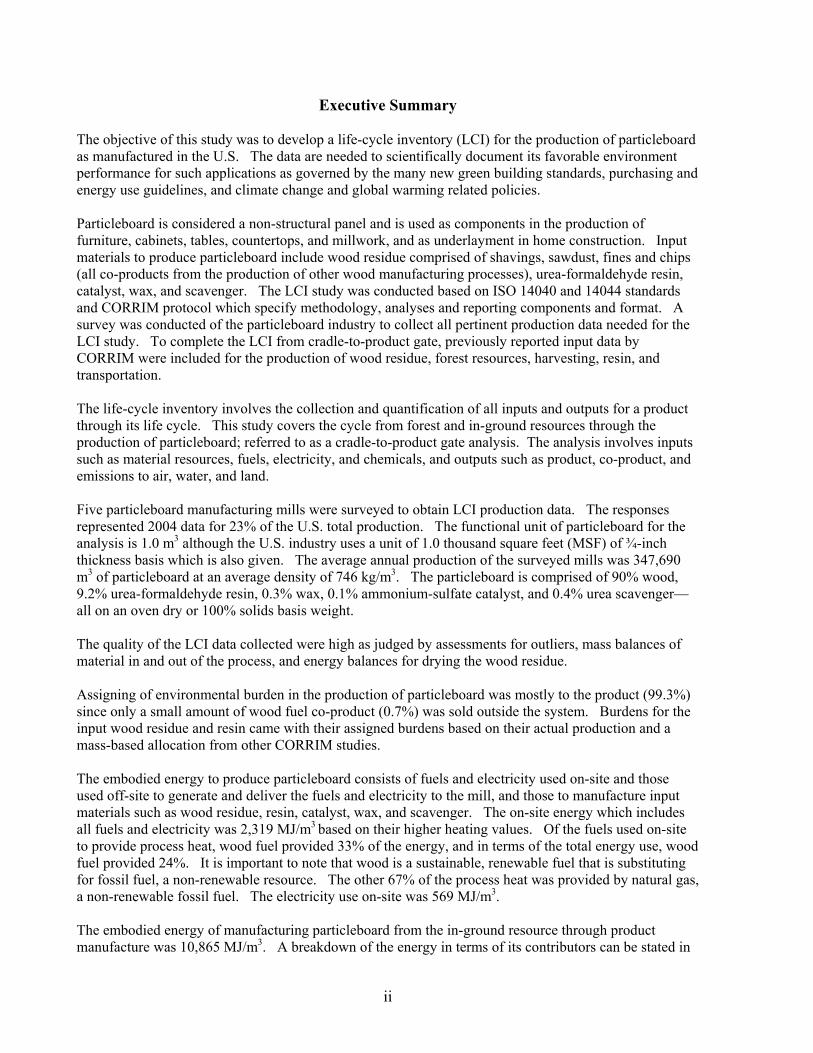
Executive Summary The objective of this study was to develop a life-cycle inventory (LCI) for the production of particleboard as manufactured in the U.S. The data are needed to scientifically document its favorable environment performance for such applications as governed by the many new green building standards, purchasing and energy use guidelines, and climate change and global warming related policies. Particleboard is considered a non-structural panel and is used as components in the production of furniture, cabinets, tables, countertops, and millwork, and as underlayment in home construction. Input materials to produce particleboard include wood residue comprised of shavings, sawdust, fines and chips (all co-products from the production of other wood manufacturing processes), urea-formaldehyde resin, catalyst, wax, and scavenger. The LCI study was conducted based on ISO 14040 and 14044 standards and CORRIM protocol which specify methodology, analyses and reporting components and format. A survey was conducted of the particleboard industry to collect all pertinent production data needed for the LCI study. To complete the LCI from cradle-to-product gate, previously reported input data by CORRIM were included for the production of wood residue, forest resources, harvesting, resin, and transportation. The life-cycle inventory involves the collection and quantification of all inputs and outputs for a product through its life cycle. This study covers the cycle from forest and in-ground resources through the production of particleboard; referred to as a cradle-to-product gate analysis. The analysis involves inputs such as material resources, fuels, electricity, and chemicals, and outputs such as product, co-product, and emissions to air, water, and land. Five particleboard manufacturing mills were surveyed to obtain LCI production data. The responses represented 2004 data for 23% of the U.S. total production. The functional unit of particleboard for the analysis is 1.0 m3 although the U.S. industry uses a unit of 1.0 thousand square feet (MSF) of ¾-inch thickness basis which is also given. The average annual production of the surveyed mills was 347,690 m3 of particleboard at an average density of 746 kg/m3. The particleboard is comprised of 90% wood, 9.2% urea-formaldehyde resin, 0.3% wax, 0.1% ammonium-sulfate catalyst, and 0.4% urea scavenger—all on an oven dry or 100% solids basis weight. The quality of the LCI data collected were high as judged by assessments for outliers, mass balances of material in and out of the process, and energy balances for drying the wood residue. Assigning of environmental burden in the production of particleboard was mostly to the product (99.3%) since only a small amount of wood fuel co-product (0.7%) was sold outside the system. Burdens for the input wood residue and resin came with their assigned burdens based on their actual production and a mass-based allocation from other CORRIM studies. The embodied energy to produce particleboard consists of fuels and electricity used on-site and those used off-site to generate and deliver the fuels and electricity to the mill, and those to manufacture input materials such as wood residue, resin, catalyst, wax, and scavenger. The on-site energy which includes all fuels and electricity was 2,319 MJ/m3 based on their higher heating values. Of the fuels used on-site to provide process heat, wood fuel provided 33% of the energy, and in terms of the total energy use, wood fuel provided 24%. It is important to note that wood is a sustainable, renewable fuel that is substituting for fossil fuel, a non-renewable resource. The other 67% of the process heat was provided by natural gas, a non-renewable fossil fuel. The electricity use on-site was 569 MJ/m3. The embodied energy of manufacturing particleboard from the in-ground resource through product manufacture was 10,865 MJ/m3. A breakdown of the energy in terms of its contributors can be stated in

iii
terms of the fuel type or major component. In terms of fuel type the major contributors are natural gas at 47.1%, wood at 22.2%, oil at 14.9%, coal at 13.1%, plus a number of insignificant fuel contributors. In terms of the major component contributors they are wood residue at 32.3%, urea-formaldehyde resin at 28.6%, electricity at 15.8%, natural gas at 14.1%, wood fuel at 5.2%, and a number of other minor contributors that total 4.1%. Wood for fuel as an energy source plays a significant and favorable environmental role. Of the on-site air emissions for manufacturing particleboard, wood fuel generates 56 kg/m3 of CO2, most of the CO that totaled 0.2 kg, and almost all of the VOC, particulate, and HAPs. Combustion of natural gas and use of a small amount of fuel oil and fuels to operate fork lifts generated 57 kg/m3 of CO2, some of the CO and methane, and almost all of the NOx and SOx with only a small amount contributed by wood fuels. Emissions of CO2 biogenic as a result of the combustion of wood has a neutral impact on global warming according to the EPA, whereas CO2 fossil such as from the combustion of natural gas, contribute significantly to global warming. The total emissions considering both on- and off-site emissions resulted in 242 kg of CO2 biogenic and 368 kg of CO2 fossil—an increase over on-site emission of 432% for biogenic and 646% for fossil. Most of the off-site emission of CO2 biogenic was from the production of wood residue at the lumber, plywood, and OSB mills. Carbon storage occurs in trees as a result of CO2 uptake as they grow, using carbon to form wood tissue and releasing oxygen back to the atmosphere. Carbon stored in trees—in both wood and bark—is important to prevent its emissions as CO2 to the atmosphere which would negatively impact climate change and global warming. The carbon remains stored in wood products such as particleboard or as its waste in the landfill until it is either combusted or decays, releasing CO2 back to the atmosphere. About half the mass of wood and bark is carbon, to determine the equivalents of carbon dioxide that was removed from the air to form the wood and bark, multiply the wood carbon content in kg by 3.67 kg CO2/kg which is the molar mass ratio of CO2 to C of 44 to 12. In the life cycle of particleboard from the tree seedling to the product, to produce 1.0 m3 of it the amount of carbon dioxide removed from the atmosphere based on its carbon store is 1,290 kg which can be used to offset 368 kg due to the combustion of fossil fuel. This leaves 922 kg of unused carbon dioxide credit which can be used to offset CO2 equivalents emission of other greenhouse gases from manufacturing and in the atmosphere, thereby reducing its impact on climate change and global warming. The CO2 biogenic emissions for wood fuel are offset by their own store and are not included in this analysis since they are considered global warming impact neutral. The carbon store remains in the particleboard for the life of it service and even longer if recycled or placed in a modern landfill where it can last for over a 100 years. A sensitivity analysis was conducted by examining the impact fuel type use has on particleboard manufacturing. To conduct the analysis the contribution of process heat by wood fuel was increased from 33% to 100%, and the natural gas use decreased from 67% to 0%. Emissions decreased for CO2 fossil (-17%), methane (-21%)—both contributors to global warming—and for NMVOC (-22%), and sulfur oxides (-23%), and increased for benzene (20%), CO2 biogenic (48%), CO (24%), and phenol (24%). With concern over climate change and global warming, substituting wood fuel for natural gas to generate process heat for manufacturing would be a favorable decision in terms of the environment and resource depletion. This study provides a comprehensive database for the life-cycle inventory of particleboard. The data should be used as the basis for any life-cycle assessment of its environmental performance to improve processing or to compare to other materials. This data will be available to the public at www.corrim.org and through the U.S. LCI Database at www.nrel.gov/lci/. To obtain full benefit from the availability of the LCI database for particleboard the following studies are recommended: 1) extract pertinent data to document the favorable environmental performance of

iv
particleboard, 2) develop life-cycle inventory data from the output gate of its production through its incorporation into products such as underlayment, office and residential furniture, through its service life and eventual disposal or recycle, 3) conduct a life-cycle assessment of particleboard in comparison to competitive materials and products, and 4) extend the study of fuel type and amount of its use on its impact on the environment, human health, and resource depletion to foster increased substitution of wood for fossil fuel.

v
Table of Contents Page
Acknowledgements ...................................................................................................................................... i Executive Summary .................................................................................................................................... ii
1.1 Introduction ....................................................................................................................................... 1 1.1.1 Survey Data Analysis ................................................................................................................. 2 1.1.2 Manufacturing Process .............................................................................................................. 3 1.1.3 Functional Unit .......................................................................................................................... 5 1.1.4 System Boundary Conditions ..................................................................................................... 5 1.1.5 Materials Flow ........................................................................................................................... 6 1.1.6 Transportation ........................................................................................................................... 7 1.1.7 Assumptions ............................................................................................................................... 8
1.2 Product Yields ................................................................................................................................... 9 1.3 Manufacturing Energy Summary .................................................................................................... 11
1.3.1 Sources of Energy .................................................................................................................... 11 1.3.2 Electricity Use Summary .......................................................................................................... 11
1.4 Fuel Use As A Heat Source ............................................................................................................. 12 1.5 Mill Emissions For Producing Particleboard .................................................................................. 13 1.6 Cradle-To-Product Gate Process Related Resource Use And Emissions ........................................ 14 1.7 Cradle-To-Product Gate Resource Use For Embodied Energy ....................................................... 18 1.8 Sensitivity Analysis ......................................................................................................................... 19 1.9 Carbon Balance For Particleboard Production ................................................................................ 22 1.10 Study Discussion ........................................................................................................................... 23 1.11 Conclusion ..................................................................................................................................... 27
2.0 References ........................................................................................................................................... 29 Appendix 1: Particleboard Mill Survey Form ...................................................................................... 31 Appendix 2: Contributors To Lci Output Materials And Emissions .................................................. 47

vi
List of Figures Page
Figure 1.1. The life cycle of particleboard and its cradle-to-product gate LCI. ........................................... 2 Figure 1.2. On-site process flow for the production of particleboard. ......................................................... 3 Figure 1.3. System boundaries for both on-site and cradle-to-product gate impact analyses. ..................... 6 List of Tables Page
Table 1.1. Listing of input materials, co-product, and product for the manufacture of particleboard. ........ 7 Table 1.2. Breakdown of material components in a particleboard panel. .................................................... 7 Table 1.3. One-way delivery distance by truck for input materials to particleboard mill. ........................... 8 Table 1.4. Inputs and outputs for the production of particleboard. ............................................................ 10 Table 1.5. Wood mass balance for the production of particleboard. .......................................................... 11 Table 1.6. U.S. electricity data by fuel source for 2004 (EIA 2007).......................................................... 12 Table 1.7. On-site fuel, electricity, and energy1 use in the manufacture of particleboard. ........................ 13 Table 1.8. On-site reported outputs for the production of 1.0 MSF ¾-inch basis and 1.0 m3 of
particleboard. ........................................................................................................................... 14 Table 1.9. SimaPro output of allocated, cumulative emissions cradle-to-product gate for the
production of particleboard. .................................................................................................... 16 Table 1.10. A breakdown by fuel source to produce particleboard cradle-to-product gate. ...................... 18 Table 1.11. A breakdown of energy contributors to produce particleboard cradle-to-product gate
(based on higher heating values of fuel). ................................................................................ 19 Table 1.12. Contribution by input parameter to use of raw materials and air emissions for the
manufacture of particleboard. .................................................................................................. 20 Table 1.13. LCI in terms of raw materials and air emissions for all wood fuel use scenario in
manufacture of particleboard. .................................................................................................. 22 Table 1.14. Tracking of wood-based carbon inputs and outputs for particleboard production. ................. 23 Table 1.15. Comparison of on-site emissions data with that collected by NCASI (1999). ........................ 25 Table 1.16. Comparison of particleboard on-site production inputs and outputs to Rivela et al. (2006)
data for a state-of-art mill in Spain. ......................................................................................... 26

1
1.0 Particleboard
1.1 Introduction The objective of this study is to develop the life-cycle inventory (LCI) data for the composite wood panel product particleboard. An LCI consists of an accounting of all inputs and outputs of a material from its resources in the ground through production of a product—this is referred to as a cradle-to-product gate study. LCI data are invaluable when it comes to establishing the greenness of a product and for comparison to competitive materials. The data forms the foundation for the scientific assessment in terms of a variety of environmental performance measures. It provides data that can be used to establish the performance of particleboard for many green type standards, guidelines and policies. Issues where the data can be used are sustainability, global warming, climate change, carbon storage, carbon trading and caps, carbon taxes, bio-fuel use, green purchasing, and green building. The data can be effective at establishing performance of particleboard in comparison to other materials by conducting life-cycle assessments with output measures in terms of impacts on human health, environment, and resource use. CORRIM researchers have documented the favorable environmental performance of structural wood products for buildings (Perez-Garcia et al. 2005); developing a database for particleboard can serve a similar basis for establishing its favorable environmental performance. Particleboard is a non-structural panel product developed in the 1950s to utilize industrial wood residue from the production of primary wood products such as softwood lumber and plywood. These wood residues were previously burned or sent to landfill to dispose of them as waste material. Over the years the product has evolved into a highly engineered product designed to meet specific end-use requirements. Particleboard generally falls into two product categories, underlayment used in housing floor construction and industrial used for making furniture, cabinets, tables, countertops, and millwork. The production of particleboard falls into the Standard Industrial Classification (SIC) Code 2493, reconstituted wood products, which includes other wood composite products such as hardboard, insulation board, medium density fiberboard, and oriented strand board (U.S. Census Bureau 2007). The six-digit Source Classification Code (SCC) for particleboard production is 307006 (USEPA 2007). Particleboard is produced from industrial wood residues such as shavings, sawdust, plywood trim, fines, and chips, and can be produced from chips from logs or trees. The residues are refined to small particles that are dried, blended with adhesive and wax, formed into a mat that is consolidated and cured under pressure and heat. Particleboard is produced in densities ranging from 37 lb/ft3 to 50 lb/ft3 to material properties listed in the American National Standard ANSI A208.1-1999 (ANSI 1999). Production in the U.S. is measured on a thousand square foot (MSF) ¾-inch basis, which in SI units is equivalent to 1.7698 m3. In 2004 the U.S. industry produced 7,618,167 m3 and Canada produced 3,134,914 m3 of particleboard (CPA 2005). Survey data for this study of the life-cycle inventory of particleboard production in the U.S. collected data from mills that produced 1,738,448 m3 in 2004, representing 23% of total U.S. production. The panels are produced in thicknesses ranging from 3/8 inch to 1-1/4 inch and in widths from 4 to 5 ft and lengths from 8 to 24 ft. The goal of this study was to document the life-cycle inventory (LCI) of manufacturing particleboard based on industrial wood residues for the U.S. The study covers the environmental impacts from the wood resource, resin, catalyst, and wax through manufacture of the particleboard. This is referred to as a cradle-to-gate study, see Figure 1.1. The manufacturing data were collected by survey of the industry, and the LCI data for the input wood residues were from data and analyses done in earlier CORRIM studies for the production of residues as co-products from plywood and lumber manufacture (Wilson and Sakimoto 2005, Milota et al 2005). Also included from earlier CORRIM studies are the LCI of the forest resources, harvesting, and transportation impacts. This study considers those impacts in the manufacture of particleboard, documenting all inputs of materials, fuel, and electricity, and all outputs of product, co-

2
product, and emissions to air, water and land. The boundary conditions are defined in Section 1.1.3. Primary e were collected by direct survey of particleboard manufacturers. The survey questionnaire is included in Appendix 1 of this report. Supplemental secondary data were obtained for impacts associated with the manufacture, delivery, and consumption of electricity and all fuels (Franklin Associates 2004, PRé Consultants 2007, USDOE 2007), from another CORRIM study on the life-cycle inventory of urea-formaldehyde resin (Wilson 2009), and wax, catalyst and urea scavenger and their input chemicals (Ecoinvent 2004), they were adjusted to U.S. energy values. The survey data represents particleboard production in terms of input materials, electricity, and fuel use, and emissions for the 2004 production year. The five mills surveyed were selected to be representative of U.S. production practices
Forest Resource
Fuel for harvesting
logs
Veneer, LVL, etc. Manufacturing
Fuel for log transportation
Wood, fuel, electricity, resin, wax and water
Particleboard Manufacturing
Fuel for transportation
Emissions to air, water, and land
CO2 to growing trees
OxygenLandfill
Reuse, Recycle, or for Fuel
logs
Plywood Manufacturing
Lumber Manufacturing
Shavings, sawdust, ply trim, veneer clippings, fines, chips, etc.
Cabinet, furniture, millwork, etc. Manufacturing and Use
Fuel for transportation
Wood, fuel, electricity, resin, water, etc.
Wood, fuel, electricity, resin, wax and water
Cradle-to-product gate LCI
OSB Manufacturing
Forest Resource
Fuel for harvesting
logs
Veneer, LVL, etc. Manufacturing
Fuel for log transportationFuel for log transportation
Wood, fuel, electricity, resin, wax and water
Wood, fuel, electricity, resin, wax and water
Particleboard Manufacturing
Fuel for transportationFuel for transportation
Emissions to air, water, and land
CO2 to growing trees
OxygenLandfill
Reuse, Recycle, or for Fuel
logs
Plywood Manufacturing
Lumber Manufacturing
Shavings, sawdust, ply trim, veneer clippings, fines, chips, etc.
Cabinet, furniture, millwork, etc. Manufacturing and Use
Fuel for transportationFuel for transportation
Wood, fuel, electricity, resin, water, etc.
Wood, fuel, electricity, resin, water, etc.
Wood, fuel, electricity, resin, wax and water
Wood, fuel, electricity, resin, wax and water
Cradle-to-product gate LCI
OSB Manufacturing
Figure 1.1. The life cycle of particleboard and its cradle-to-product gate LCI. The life-cycle inventory study was conducted in accordance with the Consortium for Research on Renewable Industrial Materials (CORRIM) guidelines (CORRIM 2001) and ISO 14040 and 14044 protocol (ISO 2006a and ISO 2006b). 1.1.1 Survey Data Analysis The survey data from the five mills were analyzed for quality by assessing for outliers, and conducting mass and energy balances. The data for each mill were converted to a unit of production basis, in this case one thousand square feet (MSF) ¾-inch, to make the comparison. Any outliers were resolved by contacting the mills. Mass balance considering all inputs of materials—wood, resin, wax, catalyst, and scavenger—and all outputs of product, co-product, and emissions were within 5% balance, an acceptable value. Energy balances were done to determine the expected energy use to dry the desired amount of water from the wood residues during processing. The average moisture content of wood material incoming to the mill was 25.7% on an oven-dry weight basis and the target moisture content for the dried material was 3-5%. Considering the energy use of the fuels and the amount of moisture removed, the energy use per pound of water removed was 3,358 Btu/lb (7.810 MJ/kg) for the fuels’ higher heating value (HHV) and 2,424 Btu/lb (5.638 MJ/kg) for their lower heating value (LHV) which considers the effects of the combustion of the water in the fuel. The energy use was found to be as expected. The data for the mills were then weight-averaged based on the production of each mill and the total production.

3
Only the weight-averaged data are presented in this report. The weight-averaged mill produced 196,456 MSF ¾-inch basis (347,690 m3) annually of particleboard at an average density of 46.6 lb/ft3 (746 kg/m3) oven dry. The data for all wood inputs and outputs were given as oven dry, whereas chemical inputs of resin, wax, catalyst and scavenger were given at 100% solids, for reference their actual solids percentage as use in the mill is stated. 1.1.2 Manufacturing Process The particleboard manufacturing process is highly automated, process controlled and fairly linear. The process is shown in Figure 1.2.
Wood Residue
Residue Storage
Screening
Blending
Drying
Forming
Hot Pressing
Panel Cooling
Sawing
Sanding
Particleboard
Resin, wax, catalyst, and scavenger
Refine or Hammermill Baghouse; fines to dryer
Baghouse; fines to process
Baghouse; fines to heater
Cyclones/RTO; particulates to process
Air heater
Boiler
Wood Residue
Residue Storage
Screening
Blending
Drying
Forming
Hot Pressing
Panel Cooling
Sawing
Sanding
Particleboard
Resin, wax, catalyst, and scavenger
Refine or Hammermill Baghouse; fines to dryer
Baghouse; fines to process
Baghouse; fines to heater
Cyclones/RTO; particulates to process
Air heater
Boiler Figure 1.2. On-site process flow for the production of particleboard. The process consists of the following steps:
Sort and store—wood residue is delivered to the mill normally by truck; the residue, also referred to in the industry as wood furnish, consists of shavings, sawdust, ply trim, fines, and chips of various moisture contents; the residue is sorted by geometry and moisture content and stored under cover; the moisture content of the residue can range from 10 to 100% on an oven-dry weight basis. Screening—the wood residue is passed through a set of screens that sort them by size, with oversize particles going to refining; desired sized particles can be sorted for use in face and core layers, and undersized particles referred to as fines can either be put into the board which is the most common practice, or sometimes used as fuel for dryers.
Refining—wood residue is then refined, a process of mechanically reducing the residue geometry into uniform sizes of desired dimensions; this process is usually accomplished with the use of refiners, hammermills and occasionally flakers and hogs. Particulate emissions are addressed by baghouses and cyclones.

4
Drying—the particles are sent through dryers, normally rotary dryers of either single pass or triple pass configuration, the particles enter the dryers at moisture contents of 10-100% oven-dry wood basis, and are dried to a targeted moisture content of about 3-5% depending on whether the particles will be used for face or core layers. The dryers are normally fired directly with natural gas, although some dryers also use sander dust from a later process step. As wood dries at elevated temperatures in the dryers, particulates and air emissions of volatile organic compounds (VOCs) are released. Emissions from dryers go to cyclones and control devices such as regenerative thermal oxidizers (RTOs), catalytic regenerative oxidizers (RCOs), and biofilters.
Blending—a process whereby resin, wax, catalyst, and scavengers are distributed onto the particles in the form of discrete droplets. The resin most used is urea-formaldehyde, however some products are made with either melamine-urea-formaldehyde or polymeric isocyanate resins for those products where moisture resistance is desired.
Forming—the blended particles are distribute into a flat mat in usually multiple layers of three or five consisting of face and core layers—the size of particles, their moisture and resin content are controlled for the face and core layers to obtain desire panel properties.
Hot pressing—the formed mats are conveyed into large presses, most are stack presses of multiple openings, presses operate at sufficient temperature (about 340oF) and duration to cure the resin, and sufficient pressure (about 750 psi) to consolidate the mat to a desired density of 37 to 50 lb/ft3; the physical properties of the panel are controlled during pressing. As a result of the elevated temperature and resin curing, particulates and air emissions of VOCs, HAPs, and other resin related emissions are generated. Emissions, if treated, go to control devices such as RTOs, RCOs, and biofilters.
Cooling—hot panels exiting the press are placed on a cooling wheel to enable the temperature of the panels to drop below a value where the UF resin will start to break down with time and emit formaldehyde gas. Limited amounts of air emissions occur at this point.
Sanding—panels are sanded on both major surfaces to targeted thickness and smoothness. Sander dust coming off this process can either be put back into residue prior to the mat at the forming process, or it is used as fuel for the dryers.
Sawing—relatively large panels are sawn to dimensions of panel widths of 4 or 5 ft and lengths of 8 or 9 ft or even longer lengths. Panel trim is hammermilled into particles and sent back with the sawdust into the process prior to the former.
The panels are then stacked and prepared for shipping. Other important processes not included in this flow process but should also be mentioned are the boiler and oil heater and their combustion of fuel to generate processing heat, and emission control devices such as baghouses, cyclones, biofilters (BFs), regenerative thermal oxidizers (RTOs) and regenerative catalytic oxidizers (RCOs). The boilers are generally fired with wood residue, natural gas, or oil fuels; with this combustion, air emissions of CO2, CO and others are generated. The emission control devices are used to reduce particulate and chemical emissions. Of significance is the large quantity of natural gas and electricity used to operate the RTO and RCO systems, and similar large quantities of electricity to operate BF systems. Three of the five mills used a combination of cyclones, baghouses and RTOs to reduce particulates, VOC, and HAP emission levels. Implementation of the new Plywood and Composite Wood Products Maximum Achievable Control Technology (PCWP MACT) (USEPA 2004) rule after the low risk emissions subcategory was delisted by the court, will in October 2007 necessitate that all particleboard plants reduce HAPs by 90%, therefore the other two mills will need to install HAP control systems resulting in a

5
lowering of the average HAP emissions below those stated in this report and in turn increasing emissions related to the use of natural gas and/or electricity for their operation depending on the control system installed.2 1.1.3 Functional Unit For the life-cycle inventory all material flows, fuels and electricity, as well as product, co-product and emissions are normalized to the functional unit of 1.0 MSF (thousand square feet) ¾-inch basis and 1.0 m3 of particleboard panel. 1.1.4 System Boundary Conditions A black box approach was selected for modeling the life-cycle inventory of the particleboard production process. Whereas unit process approaches were used in earlier CORRIM studies of lumber and plywood production (Milota, et al 2005, Wilson and Sakimoto 2005), it is not needed in this case since unlike those processes that have a higher percentage of co-product that are generated at various steps throughout the process, particleboard production has little if any co-products. In a black box approach all input flows into the box and all output flows out of the box—see Figure 1.3. For on-site emissions, only those inputs and outputs directly associated with the manufacturing process are considered—those emissions that occur due to on-site combustion of fuels whether for process heat or operating equipment and those as a result of processing the wood are considered. For the cumulative or total emissions, in this case referred to as cradle-to-product gate emissions, all impacts are considered including those for the manufacture and delivery of wood residue, fuels, electricity, wax, catalyst, and scavenger. This cumulative system boundary provides the cradle-to-product gate impacts from the forest and raw resources in the ground through all product and co-product processing steps. Only a small amount of co-product was produced—0.7%—as wood fuel sold to other manufacturers.
2 To reduce VOC and HAP emissions, RTOs use large amounts of natural gas to combust the emissions, and large amounts of electricity to operate fans to transport the emissions; RCOs use a combination of a catalytic converter and the combustion of natural gas as well as electricity to operate the fans, and BFs use bio-organisms to convert emissions and electricity to operate fans (no natural gas is needed, however electricity use can be as great or greater than to operate RCOs or RTOs).

6
Particleboard mill
Resin, wax, catalyst, scavenger
Natural gas, LPG, oil, diesel, gasoline,
and DFO
Electricity
Softwood lumber mill—shaving,
sawdust and chips
Softwood plywood mill—ply trim and
chips
OSB mill—fines
Forest Resource—seed to logs
Natural gas, coal, uranium, crude oil,
etc. in ground
Natural gas and crude oil in ground
Input chemicals back to resource
Emissions to air, water and
land
Particleboard and co-product
On-site system boundary
Cradle-to-product gate system boundary
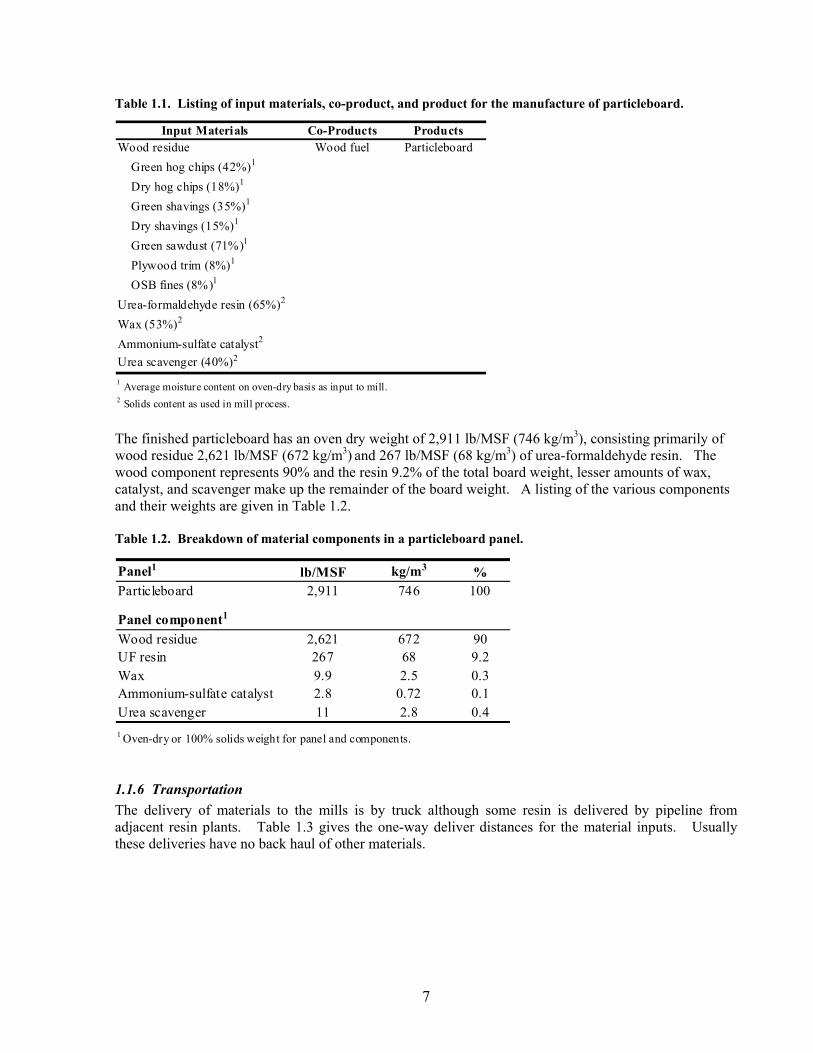
Figure 1.3. System boundaries for both on-site and cradle-to-product gate impact analyses. 1.1.5 Materials Flow Those materials considered in the LCI analysis included those listed in Table 1.1. Input materials considered were wood residues, urea-formaldehyde (UF) resin, emulsion wax, ammonium sulfate (NH4)2SO4 catalyst, and urea scavenger. Other resins were used for making moisture resistant panels, however, because of their small percentage of use they were not considered in this study. The other resins included melamine urea formaldehyde (MUF) and polymeric isocyanate (pMDI). The life-cycle inventory data of this study are only for UF bonded particleboard which represents 98% of panels produced in the survey. Although the non-wood inputs are given on a 100% solids weight, they were used in manufacturing as neat (with water) at their average percentage of solids as follows: UF resin 65%, wax 53%, ammonium sulfate catalyst 30%, and urea scavenger 40%. The urea scavenger is used to “capture” excess formaldehyde to prevent its emission from the panel. Other catalyst and scavenger chemicals can be used, but these are representative of practice. The wood residue is representative of the wood species used to produce lumber and plywood in the major production centers of the U.S., which includes softwoods for the southeast and Pacific Northwest regions, and hardwoods for the Northeast and Northcentral regions of the U.S.
7
Table 1.1. Listing of input materials, co-product, and product for the manufacture of particleboard.
Input Materials Co-Products ProductsWood residue Wood fuel Particleboard Green hog chips (42%)1
Dry hog chips (18%)1
Green shavings (35%)1
Dry shavings (15%)1
Green sawdust (71%)1
Plywood trim (8%)1
OSB fines (8%)1
Urea-formaldehyde resin (65%)2
Wax (53%)2
Ammonium-sulfate catalyst2
Urea scavenger (40%)2
1 Average moisture content on oven-dry basis as input to mill.2 Solids content as used in mill process. The finished particleboard has an oven dry weight of 2,911 lb/MSF (746 kg/m3), consisting primarily of wood residue 2,621 lb/MSF (672 kg/m3) and 267 lb/MSF (68 kg/m3) of urea-formaldehyde resin. The wood component represents 90% and the resin 9.2% of the total board weight, lesser amounts of wax, catalyst, and scavenger make up the remainder of the board weight. A listing of the various components and their weights are given in Table 1.2. Table 1.2. Breakdown of material components in a particleboard panel.
Panel1 lb/MSF kg/m3 %Particleboard 2,911 746 100
Panel component1
Wood residue 2,621 672 90UF resin 267 68 9.2Wax 9.9 2.5 0.3Ammonium-sulfate catalyst 2.8 0.72 0.1Urea scavenger 11 2.8 0.41 Oven-dry or 100% solids weight for panel and components. 1.1.6 Transportation The delivery of materials to the mills is by truck although some resin is delivered by pipeline from adjacent resin plants. Table 1.3 gives the one-way deliver distances for the material inputs. Usually these deliveries have no back haul of other materials.

8
Table 1.3. One-way delivery distance by truck for input materials to particleboard mill.
Materialmile km
Wood residue 85 136Urea-formaldehyde resin 77 124Wax 77 124Ammonium-sulfate catalyst 77 124Urea scavenger 77 124
Delivery Distance
1.1.7 Assumptions The data collection, analysis, and assumptions followed protocol as defined in Consortium for Research on Renewable Industrial Materials (CORRIM)—Research Guideline for Life Cycle Inventories (CORRIM 2001) and the ISO 14040 and 14044 standards for environmental management and documentation (ISO 2006a and 2006b). The environmental impact analysis was done using SimaPro 7.1 software which was developed in the Netherlands and has a Franklin Associates (FAL) database to provide impacts for fuels and electricity for the U.S (PRé Consultants 2007). For materials not covered in the FAL database, the Ecoinvent v1.0 database, a comprehensive database for Europe was used to determine environmental impacts; however, to adjust to the U.S. analysis, fuels and electricity within the database were converted to FAL processes (Ecoinvent 2004). Additional conditions include:
• All data from the survey were weight averaged for the five mills based on their production in comparison to the total production for the year. Where appropriate, missing data from various mills were not included in weight averages.
• Mass-based allocation was used to assign environmental burdens to the particleboard and co-product of wood fuel sold outside of the system boundary.
• A black-box approach was used to model the particleboard process since the percentage of co-product is very small (0.7%) and the approach does not impact the accuracy of assigning the burdens.
• Environmental impacts were assessed for both on- and off-site particleboard manufacturing that included all impacts from resource through the production of wood residue, resin, wax, catalyst, electricity and fuels. The life-cycle data for the wood residue consisting of shavings, sawdust, chips, plywood trim and fines were determined for earlier CORRIM studies of softwood lumber, plywood, and other primary wood products.
• To determine the energy content of fuels, their higher heating values (HHV) were used. The HHV is defined as the amount of heat released by a fuel initially at 25oC when it is combusted and the products have returned to their initial temperature. For wood it is the maximum achievable energy value for oven dry wood. In contrast, the lower heating value (LHV) is determined when the cooling is stopped at 150oC and only some of the reaction energy is recovered. The HHV provides a fuel’s intrinsic property whereas the LHV is used as a practical number.
• Site emissions of CO2 were not reported in the surveys; therefore the values were determined using the Franklin Associates’ database for the combustion of the various fuels.
• Carbon dioxide (CO2) was tracked separately through the processes as “biogenic” for the combustion of wood fuels whether they are bark, sander dust, waste or hogged fuel, and as “fossil” for the combustion of fossil fuels such as oil, natural gas, and propane. The U.S. Environmental Protection Agency (EPA) considers CO2 biogenic as impact neutral when it comes

9
to global warming impact because the CO2 can be removed from the atmosphere by the growing of trees that absorb it, breaking it down into carbon to form wood substance and releasing oxygen back to the atmosphere (USEPA 2003).
• Unaccounted wood mass between input and output material flows in the production of particleboard, based on survey, was found to be 4.8% which was within the maximum 5% condition specified in the CORRIM protocol.
1.2 Product Yields The inputs to produce 1.0 MSF ¾-inch basis are 2,621 lb (672 kg/m3) of industrial wood residue on an oven dry weight basis produced as co-product in the manufacture of lumber, plywood, and other primary wood products. See Table 1.4 for all inputs and outputs for the manufacture of particleboard. These inputs yielded 2,911 lb/MSF (746 kg/m3) of particleboard comprised of wood, resin, wax, catalyst, and scavenger. The input wood residue also provided wood for process fuel and wood sold as fuel Of the wood fuel generated internally in the manufacturing process, 98 lb (25 kg/m3) of sander dust was burned in the particle dryers and 8.1 lb (2.1 kg/m3) of wood waste was burned in either the boiler or dryer. A small amount of co-product was produced as wood residue that was sold for boiler fuel (5.2 kg), and a very small amount of wood waste (0.4 kg) was sent to the landfill.

10
Table 1.4. Inputs and outputs for the production of particleboard.
INPUTSMaterials Unit Unit/MSF SI Unit SI Unit/m3
Wood residue1
Green hog chips lb 232 kg 60Dry hog chips lb 192 kg 49Green shavings lb 127 kg 32Dry shavings lb 1,582 kg 405Green sawdust lb 358 kg 92Plywood trim lb 116 kg 30OSB fines lb 12 kg 3.1Total wood furnish lb 2,621 kg 672
Urea-formaldehyde (UF) resin2 lb 267 kg 68Wax2 lb 9.8 kg 2.5Ammonium-sulfate catalyst2 lb 2.8 kg 0.72Urea scavenger2 lb 11 kg 2.9
ElectricityElectricity kWh 280 MJ 569
FuelsNatural gas ft3 1,890 m3 30Sander dust (wood) lb 98 kg 25Generated wood fuel lb 8.1 kg 2.1Diesel gal 0.12 liter 0.26LPG gal 0.15 liter 0.33Gasoline and kerosene gal 0.0098 liter 0.021Distillate fuel oil gal 0.026 liter 0.057
Water UseMunicipal water source gal 142 liter 304
OUTPUTS3
Particleboard lb 2,911 kg 746Wood boiler fuel sold lb 20.2 kg 5.18Wood waste to landfill lb 1.56 kg 0.4Boiler fly ash to landfill lb 0.4 kg 0.11 All wood weights given as oven dry.
3 Emissions to air and water listed in separate table.
2 Weight at 100% solids; mill use was at solids content of UF resin 65%, wax 53%, catyalst 30%, and scavenger 40%.
The mass balance found from the survey that in terms of input and output wood materials, it differed by 4.8%, with slightly more wood going out than coming in, see Table 1.5. This difference is within the acceptable 5% limit of the CORRIM protocol.

11
Table 1.5. Wood mass balance for the production of particleboard.
Inputs1 lb/MSF kg/m3
Green hog chips 232 60Dry hog chips 192 49Green shavings 127 32Dry shavings 1582 405Green sawdust 358 92Plywood trim 116 30OSB fines 12 3.1Sander dust (wood only) to boiler (88) (23)In-mill wood waste to boiler (8.1) (2.1)Total 2,523 647
Outputs1
Particleboard (wood only) 2,621 672Wood waste to landfill 1.56 0.40Particulate emissions 0.84 0.21Sold boiler fuel 20 5.2Total 2,644 678
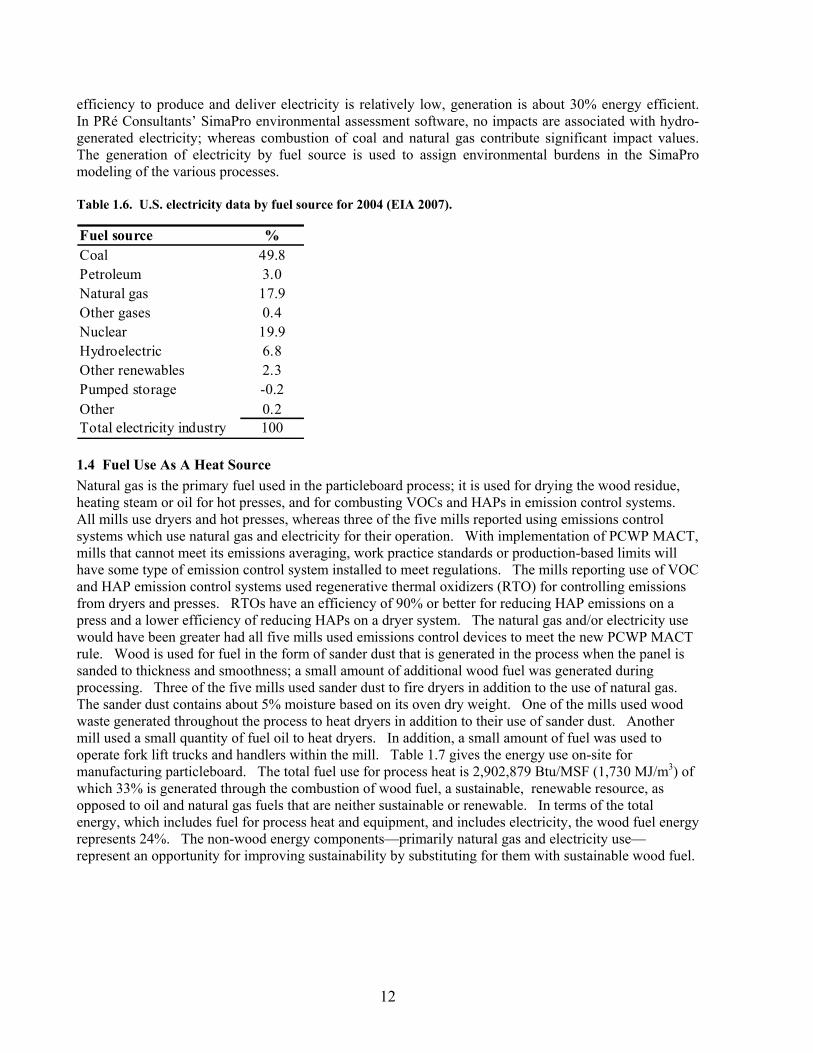
Outputs-inputs difference % 4.8 4.81 Oven-dry weights. 1.3 Manufacturing Energy Summary 1.3.1 Sources of Energy Energy for the production of particleboard comes from electricity, wood sources, natural gas, and oil, whereas other fuels such as diesel, liquid propane gas (LPG), and gasoline are used to operate equipment. With the volatile and increasing fuel and electricity prices, this topic will attract considerable attention in the coming years as mills seek to maintain profitability by reducing costs. Also, with the further installation of emissions control systems to meet PCWP MACT (USEPA 2004) regulations, there will be increased use of natural gas and/or electricity to operate these systems, resulting in increases of CO2 fossil emissions. The electricity is used to operate equipment within the plant, equipment such as conveyors, refiners, chippers, fan motors, hydraulic motors, sanders, and emission control devices. Electricity is used throughout the process. The fuels for equipment are used for loaders and forklifts, and the natural gas is used to operate rotary dryers and heat presses. Wood fuel is used in boilers to generate process heat for presses and dryers, and is used to direct fire dryers. 1.3.2 Electricity Use Summary The source of fuel used to generate the electricity used in the manufacturing process is very important in determining the type and amount of environmental impact as a result of its use. The electricity use on average was 280 kWh/MSF (569 MJ/m3). The breakdown of fuel source to generate the electricity was based on the U.S. average as stated by the U.S. Energy Information Agency (EIA 2007) for 2004. The dominant fuel source is coal at 49.8%, followed by nuclear at 19.9% and natural gas at 17.9%. Table 1.6 gives a breakdown of the electricity generation by fuel source. The less contributing sources are hydroelectric at 6.8%, petroleum at 3.0% and other renewables at 2.3%, much smaller quantities are produced by other gases (0.4%) and other (0.2%). The fuel source to generate electricity is important in any life-cycle inventory since the impacts are traced back to the “in-ground” source of the fuel used. The
12
efficiency to produce and deliver electricity is relatively low, generation is about 30% energy efficient. In PRé Consultants’ SimaPro environmental assessment software, no impacts are associated with hydro-generated electricity; whereas combustion of coal and natural gas contribute significant impact values. The generation of electricity by fuel source is used to assign environmental burdens in the SimaPro modeling of the various processes. Table 1.6. U.S. electricity data by fuel source for 2004 (EIA 2007).
Fuel source %Coal 49.8Petroleum 3.0Natural gas 17.9Other gases 0.4Nuclear 19.9Hydroelectric 6.8Other renewables 2.3Pumped storage -0.2Other 0.2Total electricity industry 100 1.4 Fuel Use As A Heat Source Natural gas is the primary fuel used in the particleboard process; it is used for drying the wood residue, heating steam or oil for hot presses, and for combusting VOCs and HAPs in emission control systems. All mills use dryers and hot presses, whereas three of the five mills reported using emissions control systems which use natural gas and electricity for their operation. With implementation of PCWP MACT, mills that cannot meet its emissions averaging, work practice standards or production-based limits will have some type of emission control system installed to meet regulations. The mills reporting use of VOC and HAP emission control systems used regenerative thermal oxidizers (RTO) for controlling emissions from dryers and presses. RTOs have an efficiency of 90% or better for reducing HAP emissions on a press and a lower efficiency of reducing HAPs on a dryer system. The natural gas and/or electricity use would have been greater had all five mills used emissions control devices to meet the new PCWP MACT rule. Wood is used for fuel in the form of sander dust that is generated in the process when the panel is sanded to thickness and smoothness; a small amount of additional wood fuel was generated during processing. Three of the five mills used sander dust to fire dryers in addition to the use of natural gas. The sander dust contains about 5% moisture based on its oven dry weight. One of the mills used wood waste generated throughout the process to heat dryers in addition to their use of sander dust. Another mill used a small quantity of fuel oil to heat dryers. In addition, a small amount of fuel was used to operate fork lift trucks and handlers within the mill. Table 1.7 gives the energy use on-site for manufacturing particleboard. The total fuel use for process heat is 2,902,879 Btu/MSF (1,730 MJ/m3) of which 33% is generated through the combustion of wood fuel, a sustainable, renewable resource, as opposed to oil and natural gas fuels that are neither sustainable or renewable. In terms of the total energy, which includes fuel for process heat and equipment, and includes electricity, the wood fuel energy represents 24%. The non-wood energy components—primarily natural gas and electricity use—represent an opportunity for improving sustainability by substituting for them with sustainable wood fuel.

13
Table 1.7. On-site fuel, electricity, and energy1 use in the manufacture of particleboard.
Fuel for process heat Unit Unit/MSF Btu/MSF SI Unit SI Unit/m3 MJ/m3 % Natural gas ft3 1,890 1,946,294 m3 30 1,160Sander dust lb 98 880,174 kg 25 525In-mill generated wood fuel lb 8.1 72,731 kg 2.07 43Distillate fuel oil (DFO) gal 0.03 3,679 liter 0.06 2.2Subtotal 2,902,879 1,730 74.6
Fuel for equipmentDiesel gal 0.12 16,948 liter 0.26 10.1LPG gal 0.15 14,711 liter 0.33 8.8Gasoline and kerosene gal 0.010 1,229 liter 0.021 0.73Subtotal 32,888 19.6 0.8
Electricity Electricity purchased kWh 280 954,569 MJ 569 569 24.5
Total energy 3,890,336 2,319 1001 Higher heating values (HHV) used; coal 26.2 MJ/kg, DFO 45.5 MJ/kg, LPG 54.0 MJ/kg, natural gas 54.4 MJ/kg, RFO 43.4 MJ/kg, gasoline 54.4 kg, wood/bark 20.9 MJ/kg, and electricity 3.6 MJ/kWh. 1.5 Mill Emissions For Producing Particleboard Outputs for the production of particleboard include a small quantity (0.7%) of co-product in the form of wood fuel sold to other mills, and emissions to air, water and land, see Table 1.8. Emissions are generated due to the mechanical processing which can result in particulate wood emissions of various sizes, emissions to air that occur when wood is subjected to elevated temperatures, and emissions due to the combustion of fuels such as natural gas, propane, and wood. Emissions to air include particulate and particulate PM10 (less than 10 µm in size) that occur in refining, drying, sawing and sanding. Other air emissions include the VOCs and HAPs that occur in drying, pressing, and panel cooling; the HAPs are comprised of acetaldehyde, acrolein, formaldehyde, methanol, phenol, and propionaldehyde. All mills in the survey reported VOC, HAPS, formaldehyde, and methanol, while only two mills reported acetaldehyde and phenol, and only one mill reported acrolein. No mills reported propionaldehyde emissions. Only mills reporting a given emission were included in the weight averaging for that emission. The sum of all the HAPs emissions should add to the total HAPS value, but since there is a difference in the number of mills providing data on individual HAPS, the resulting values differ slightly. The individual HAPS are identified in the table as (H) and the greenhouse gases as (GHG). The CO2 for both the biogenic (wood) and fossil fuel sources, and the methane, were not reported in the survey, rather they were determined by entering the fuel for both heat source and equipment into the SimaPro software, then using the Franklin database for U.S. fuels, the carbon dioxide and methane values were determined. CO2 biogenic is not considered a greenhouse gas according to the U.S. Environmental Protection Agency since it does not contribute to global warming because of its life cycle where it is absorbed by growing of trees, releasing oxygen to the atmosphere and taking the carbon to make wood substance (USEPA 2003).
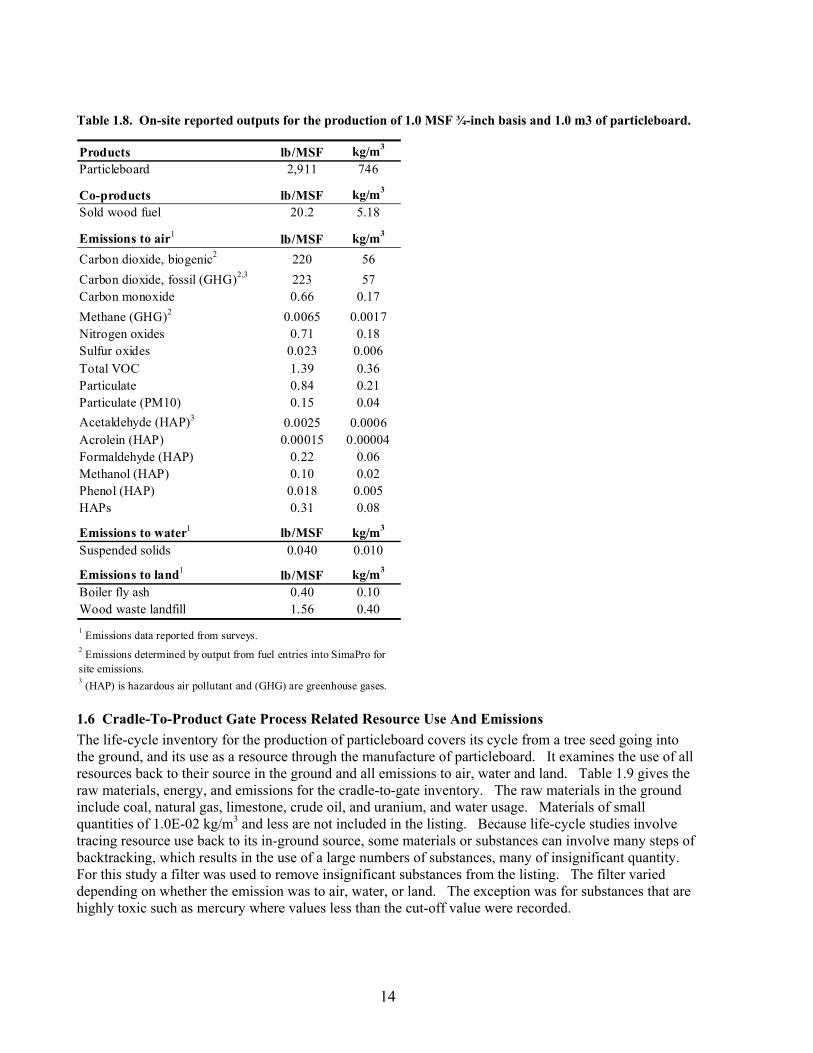
14
Table 1.8. On-site reported outputs for the production of 1.0 MSF ¾-inch basis and 1.0 m3 of particleboard.
Products lb/MSF kg/m3
Particleboard 2,911 746
Co-products lb/MSF kg/m3
Sold wood fuel 20.2 5.18
Emissions to air1 lb/MSF kg/m3
Carbon dioxide, biogenic2 220 56Carbon dioxide, fossil (GHG)2,3 223 57Carbon monoxide 0.66 0.17Methane (GHG)2 0.0065 0.0017Nitrogen oxides 0.71 0.18Sulfur oxides 0.023 0.006Total VOC 1.39 0.36Particulate 0.84 0.21Particulate (PM10) 0.15 0.04Acetaldehyde (HAP)3 0.0025 0.0006Acrolein (HAP) 0.00015 0.00004Formaldehyde (HAP) 0.22 0.06Methanol (HAP) 0.10 0.02Phenol (HAP) 0.018 0.005HAPs 0.31 0.08
Emissions to water1 lb/MSF kg/m3
Suspended solids 0.040 0.010
Emissions to land1 lb/MSF kg/m3
Boiler fly ash 0.40 0.10Wood waste landfill 1.56 0.401 Emissions data reported from surveys.
3 (HAP) is hazardous air pollutant and (GHG) are greenhouse gases.
2 Emissions determined by output from fuel entries into SimaPro for site emissions.
1.6 Cradle-To-Product Gate Process Related Resource Use And Emissions The life-cycle inventory for the production of particleboard covers its cycle from a tree seed going into the ground, and its use as a resource through the manufacture of particleboard. It examines the use of all resources back to their source in the ground and all emissions to air, water and land. Table 1.9 gives the raw materials, energy, and emissions for the cradle-to-gate inventory. The raw materials in the ground include coal, natural gas, limestone, crude oil, and uranium, and water usage. Materials of small quantities of 1.0E-02 kg/m3 and less are not included in the listing. Because life-cycle studies involve tracing resource use back to its in-ground source, some materials or substances can involve many steps of backtracking, which results in the use of a large numbers of substances, many of insignificant quantity. For this study a filter was used to remove insignificant substances from the listing. The filter varied depending on whether the emission was to air, water, or land. The exception was for substances that are highly toxic such as mercury where values less than the cut-off value were recorded.

15
For record keeping only, wood used for fuel is listed although not a true raw material in the sense its origin is a tree seed. Wood is considered a renewable resource unlike the other material in the listing, thus it doesn’t appear in the raw materials listing other than for fuel. Some sources of energy or fuels cannot be traced back to its original resource in the ground. Such energies include “energy from hydro power,” “electricity from other gases” and “electricity from renewables” which are not defined in terms of identifiable fuels. These are listed in a separate category defined as Energy. Emissions for the cradle-to-gate scenario are listed in Table 1.9 also. The emissions to air and water used a cut-off value of 1.0E-04 kg/m3, and to land used a cut-off of 1.0E-02 kg/m3, waste of 2.0E-01 kg/m3, and radiation terms used a cut-off of 1E+04 Bq/m3. Some emissions because of their toxicity, even though in quantities below the cut-off value, are recorded. The greenhouse gases (GHG) and the HAPs associated with the production of wood products are identified. Raw materials and emissions for a cradle-to-product gate inventory are far greater in general than those resources and emissions that occur at the production site, this is true for all processes. The difference between site and cradle-to-product gate resource use can be found by comparing Tables 1.8 and 1.9. Of significance is the raw material source of “carbon dioxide in air” which accounts for the uptake of CO2 during the growing of trees. About half the mass of wood and bark at their oven dry weight is carbon; therefore to determine the equivalent of carbon dioxide (CO2) that was removed from the air to form this carbon (C) in wood and bark, multiply the wood carbon content in kg by 3.67 kg CO2/kg which is the molar mass ratio of CO2 to C of 44 to 12. To produce 1.0 m3 of particleboard the “carbon dioxide in air” total is 1,532 kg which is comprised of 1,290 kg-CO2 equivalents due to the wood carbon component of the particleboard and 242 kg-CO2 equivalents for the carbon component of the wood fuel used in the production of wood residue and the particleboard. This CO2 equivalent of carbon store can be used to offset CO2 fossil and biogenic emissions as well as other greenhouse gas emissions due to processing, product use and disposal, and even offset some CO2 in the atmosphere; which reduces the impact of particleboard’s life cycle upon global warming and climate change.

16
Table 1.9. SimaPro output of allocated, cumulative emissions cradle-to-product gate for the production of particleboard.
Raw material lb/MSF kg/m3
Calcite in ground 4.30E-01 1.10E-01Carbon dioxide in air1 5.97E+03 1.53E+03Clay in ground 1.23E-01 3.16E-02Coal in ground 2.12E+02 5.42E+01Crude oil in ground 1.39E+02 3.55E+01Gravel in ground 3.62E+00 9.28E-01Iron ore in ground 1.98E-01 5.09E-02Limestone in ground 1.23E+01 3.14E+00Natural gas in ground 3.67E+02 9.41E+01Nickel in ground 1.12E-01 2.88E-02Scrap external 6.99E-02 1.79E-02Sodium chloride in ground 2.30E-01 5.90E-02Uranium in ground 9.20E-04 2.36E-04Water unspecified natural orign 3.05E+03 7.81E+02Water, well, in ground 4.87E+02 1.25E+02Wood fuel 4.50E+02 1.15E+02 Emissions to air lb/MSF kg/m3
Acetaldehyde (HAP)2 7.42E-03 1.90E-03Acetic acid 2.07E-03 5.31E-04Acetone 9.41E-04 2.41E-04Acrolein (HAP) 5.76E-04 1.48E-04Aldehydes, unspecified 3.85E-02 9.88E-03Alpha-pinene 9.67E-03 2.48E-03Aluminum 1.95E-03 5.00E-04Ammonia 7.05E-01 1.81E-01Barium 1.96E-03 5.02E-04Benzene 3.93E-03 1.01E-03Beta-pinene 3.75E-03 9.61E-04Butane 4.07E-03 1.04E-03Carbon dioxide 3.62E-01 9.27E-02Carbon dioxide, biogenic 9.43E+02 2.42E+02Carbon dioxide, fossil (GHG) 1.43E+03 3.68E+02Carbon disulfide 8.16E-04 2.09E-04Carbon monoxide 9.68E+00 2.48E+00Carbon monoxide, fossil 6.00E-01 1.54E-01Chlorine 3.53E-03 9.04E-04Dinitrogen monoxide (GHG) 8.28E-03 2.12E-03Ethanol 6.02E-04 1.54E-04Formaldehyde 2.45E-01 6.28E-02HAPS 3.06E-01 7.83E-02Hydrocarbons, unspecified 2.22E-02 5.69E-03Hydrogen chloride 4.10E-02 1.05E-02Hydrogen fluoride 5.57E-03 1.43E-03Iron 2.32E-03 5.95E-04Lead 6.87E-04 1.76E-04Limonene 1.09E-03 2.78E-04
Manganese 4.06E-03 1.04E-03Mercury 1.66E-05 4.25E-06Methane (GHG) 3.39E+00 8.70E-01Methane, biogenic (GHG) 1.05E-03 2.69E-04Methane, fossil (GHG) 2.86E-01 7.33E-02Methanol 1.90E-01 4.86E-02Naphthalene 1.07E-03 2.74E-04Nickel 1.80E-03 4.60E-04Nitrogen dioxide 2.61E-03 6.69E-04Nitrogen oxides 7.38E+00 1.89E+00Organic substances, unspecified 8.06E-03 2.07E-03NMVOC, non-methane VOC 4.48E+00 1.15E+00NOx 1.03E-03 2.63E-04Organic substances, unspecified 6.36E-01 1.63E-01Particulates 1.14E+00 2.92E-01Particulates, < 10 um 1.73E+00 4.43E-01Particulates, < 2.5 um 2.37E-01 6.07E-02Particulates, > 10 um 1.84E-01 4.73E-02Particulates, > 2.5 um, < 10um 9.39E-02 2.41E-02Particulates, SPM 7.27E-04 1.86E-04Particulates, unspecified 6.38E-01 1.64E-01Pentane 6.96E-03 1.78E-03Phenol (HAP) 3.62E-02 9.27E-03Potassium 3.47E-01 8.90E-02Propane 1.23E-03 3.15E-04SO2 1.61E-03 4.13E-04Sodium 9.52E-03 2.44E-03Sulfur dioxide 1.50E-01 3.86E-02Sulfur oxides 1.63E+01 4.17E+00Toluene 1.22E-03 3.12E-04Vanadium 5.22E-03 1.34E-03VOC 2.35E+00 6.02E-01Zinc 2.06E-03 5.28E-04 Emissions to air Bq/m3
Noble gases, radioactive, unspec. 2.86E+04Radioactive species, unspec. 2.76E+06Radon-222 5.53E+04 Emissions to water lb/MSF kg/m3
Aluminum 2.37E-03 6.08E-04Ammonia 8.04E-04 2.06E-04Ammonium, ion 7.33E-02 1.88E-02BOD5 4.82E-02 1.23E-02Boron 2.05E-02 5.26E-03Cadmium, ion 8.91E-04 2.28E-04Calcium, ion 1.81E-02 4.64E-03Chloride 9.35E-01 2.40E-01Chromium 9.06E-04 2.32E-04

17
Emissions to water (cont.) lb/MSF kg/m3
COD 3.19E-01 8.17E-02DOC 3.70E-02 9.49E-03Fluoride 4.03E-02 1.03E-02Formaldehyde 1.27E-02 3.24E-03Iron 2.90E-02 7.44E-03Iron, ion 2.70E-03 6.91E-04Lead 4.29E-05 1.10E-05Magnesium 5.85E-04 1.50E-04Manganese 1.66E-02 4.26E-03Metallic ions, unspecified 3.02E-03 7.73E-04Methanol 3.80E-03 9.73E-04Nickel, ion 6.17E-04 1.58E-04Nitrogen 2.47E-02 6.34E-03Nitrogen, organic bound 4.00E-04 1.03E-04Oils, unspecified 3.47E-01 8.90E-02Organic substances, unspecified 5.96E-02 1.53E-02Phenol 1.28E-03 3.28E-04Phosphate 3.23E-02 8.28E-03Phosphorus 1.27E-03 3.25E-04Silicon 1.47E-01 3.76E-02Sodium, ion 1.97E-02 5.06E-03Solids, inorganic 6.80E-04 1.74E-04Solved solids 1.96E+01 5.02E+00Sulfate 8.36E-01 2.14E-01Sulfuric acid 5.13E-03 1.31E-03suspended solids 3.99E-02 1.02E-02Suspended solids, unspecified 5.98E-01 1.53E-01TOC, Total Organic Carbon 3.70E-02 9.49E-03Zinc, ion 3.95E-04 1.01E-04
Emissions to land lb/MSF kg/m3
Boiler fly ash 3.99E-01 1.02E-01Wood waste 1.55E+00 3.97E-01
Waste lb/MSF kg/m3
Packaging waste, paper&board 8.82E-01 2.26E-01Waste, inorganic 1.69E+00 4.34E-01Waste, solid 1.61E+02 4.13E+01Wood waste 4.95E-01 1.27E-01
2 (HAP) is hazardous air pollutant common to wood products industry and (GHG) are greenhouse gases.
1 Includes CO2 uptake for carbon component of particleboard (1,290 kg-CO2 equiv) and wood fuel (242 kg-CO2 equiv).

18
1.7 Cradle-To-Product Gate Resource Use For Embodied Energy The embodied energy to produce particleboard can be given in several manners. For this study it is useful to examine the energy breakdown in terms of both its source of fuel in the ground and its contribution by the various input substances. Table 1.10 gives the cumulative energy use from cradle-to-product gate for the production of particleboard in terms of its fuel source in the ground. To produce 1.0 m3 of particleboard it takes a total of 10,865 MJ of embodied energy based on the higher heating values of the fuels. Natural gas provides 47.1% of the energy, followed by wood fuel at 22.2%, oil at 14.9% and coal at 13.1%, all other sources are of minor significance. The importance of the wood fuel contribution is it is renewable whereas the other fuel sources of natural gas, oil, and coal are not. The non-renewable portion can be considered as an opportunity buy reducing the use of fossil fuels buy substituting for them with renewable wood fuels, at least for some practical portion of the fossil fuels. Table 1.10. A breakdown by fuel source to produce particleboard cradle-to-product gate.
ContributionSubstance Btu/MSF MJ/m3 %Coal in ground 2,381,179 1,419 13.1Natural gas in ground 8,585,983 5,118 47.1Crude oil in ground 2,710,874 1,616 14.9Uranium in ground 150,729 90 0.8Wood fuel 4,042,555 2,410 22.2Energy, from hydro power 326,916 195 1.8Energy, renewable 25,348 15 0.1Energy, other gases 4,408 3 0.02TOTAL 18,227,992 10,865 1001 Energy values based on their higher heating values (HHV) of Table 1.7 and uranium at 381,000 MJ/kg. Energy contribution by the input component to the manufacturing can be of value in assessing the major contributors and for identifying opportunities for reducing energy use. Table 1.11 gives the embodied energy breakdown for manufacturing particleboard from tree seed to the output gate of the mill. The total energy is 10,865 MJ/m3 with the wood residue and the UF resin making the major contributions of 32.3% and 28.6%, respectively, followed by electricity and natural gas at 15.8% and 14.1%, respectively, and then wood fuel at 5.2%, all other contributors of lesser significance. Transportation of wood, resin, wax, and scavenger to the mill represents only 2.8% of the total energy. Over 50% of the energy contribution is to produce the wood residue consisting of shavings, sawdust, plywood trim, and chips and the urea-formaldehyde resin. Energy to provide manufacturing process heat and electricity represents 35% of the total, with electricity representing 15.8%.

19
Table 1.11. A breakdown of energy contributors to produce particleboard cradle-to-product gate (based on higher heating values of fuel).
ContributionProcess component Btu/MSF MJ/m3 %Wood residue 5,878,529 3,504 32.3UF resin 5,208,894 3,105 28.6Ammonium-sulfate catalyst 43,226 26 0.2Wax 26,760 16 0.1Urea scavanger 146,991 88 0.8Transportation diesel 510,755 304 2.8Natural gas 2,565,307 1,529 14.1Wood fuel 940,733 561 5.2Distillate fuel oil 4,866 3 0.0Electricity 2,877,501 1,715 15.8Diesel & other equipment fuels 22,497 13 0.1Total 18,226,061 10,865 100 1.8 Sensitivity Analysis The sensitivity analysis involves examining the impact of varying an input parameter such as fuel to a process and examining the magnitude of the change of an output parameter such as resource use or carbon dioxide (fossil) emission. The magnitude of the impact is dependent on the input parameter and also on the output parameter of interest. For example if the interest is the impact on the embodied energy of the product, Table 1.11 shows that the dominant contributors are the wood residue (32.3%) followed by UF resin (28.6%), and to a lesser extent by electricity (15.8%) and natural gas use (14.1%). Other contributors are of lesser significance. As such, changing the dominant parameters will have a significant impact on the total embodied energy whereas changes of other lesser parameters such as catalyst, wax, scavenger, transportation fuel, forklift fuel and boiler DFO fuel will have little if any impact. The embodied energy and its source of fuel can also impact resource use and emissions. Another way to examine this impact is to look at the list of raw materials in-ground and the air emissions in terms of their process contributors, see Table 1.12. For example, electricity use greatly impacts the use of raw materials such as coal and uranium, as well as emissions of CO2 fossil, mercury, methane, NOx, and SOx. Whereas the use of UF resin impacts the use of crude oil, natural gas, and water, and emissions of benzene, methane, methanol, and NMVOC. Contributions of fuels for fork lifts and other similar mill transport equipment were insignificant and left off the table .

20
Table 1.12. Contribution by input parameter to use of raw materials and air emissions for the manufacture of particleboard.
PB Process Wood furnish UF resin Catyalst Wax Urea scav. Transport Nat. gas Wood fuel DFO ElectricityRaw Materials lb/MSF kg/m3 % % % % % % % % % % %Calcite in ground 0.43 0.11 0 0 96 0 0 4 0 0 0 0 0Carbon dioxide in air 5,978 1,532 0 100 0 0 0 0 0 0 0 0 0Clay in ground 0.12 0.03 0 0 96 0 0 4 0 0 0 0 0Coal in ground 212 54 0 13 12 0 0 0 0 0 0 0 73Crude oil in ground 139 36 0 27 45 0 0 2 17 1 0 0 6Gravel in ground 3.62 0.93 0 0 96 0 0 4 0 0 0 0 0Iron ore in ground 0.20 0.05 0 100 0 0 0 0 0 0 0 0 0Limestone, in ground 12 3.1 0 14 12 0 0 0 0 0 0 0 72Natural gas in ground 367 94 0 17 43 0 0 1 0 29 0 0 9Nickel in ground 0.11 0.03 0 0 96 0 0 4 0 0 0 0 0Scrap external 0.07 0.02 0 100 0 0 0 0 0 0 0 0 0Sodium chloride in ground 0.23 0.06 0 15 85 0 0 0 0 0 0 0 0Uranium in ground 0.00092 0.00024 0 15 12 0 0 0 0 0 0 0 72Water , cooling, unspec. natural origin 1,273 326 0 0 83 0 17 0 0 0 0 0 0Water , process, dr inking 6 2 0 100 0 0 0 0 0 0 0 0 0Water , process, unspec. natural origin 197 51 0 0 87 3 4 6 0 0 0 0 0Water , process, well, in ground 407 104 0 92 8 0 0 0 0 0 0 0 0Water , unspecified natural origin 1,511 387 78 0 18 0 4 1 0 0 0 0 0Water , well, in ground 80 20 0 20 79 0 0 1 0 0 0 0 0Wood and wood waste fuel 340 87 0 100 0 0 0 0 0 0 0 0 0Wood hog fuel self-generated 7.7 2.0 0 0 0 0 0 0 0 0 100 0 0Wood sander dust for fuel 97 25 0 0 0 0 0 0 0 0 100 0 0
Emissions to airAcetaldehyde 7.42E-03 1.90E-03 33 63 4 0 0 0 0 0 0 0 0Acrolein 5.76E-04 1.48E-04 25 73 0 0 0 0 0 0 0 0 1Benzene 3.93E-03 1.01E-03 0 31 56 0 0 3 0 0 10 0 0Carbon dioxide, biogenic 9.43E+02 2.42E+02 0 77 0 0 0 0 0 0 23 0 0Carbon dioxide, fossil 1.43E+03 3.68E+02 0 21 25 0 0 1 5 17 0 0 30Carbon monoxide 9.68E+00 2.48E+00 0 61 9 0 0 0 7 6 15 0 2Formaldehyde 2.45E-01 6.28E-02 87 10 2 0 0 0 0 0 0 0 0HAPS 3.06E-01 7.83E-02 100 0 0 0 0 0 0 0 0 0 0Mercury 1.66E-05 4.25E-06 0 13 16 0 0 1 0 1 0 0 68Methane 3.39E+00 8.70E-01 0 16 34 0 0 1 0 21 0 0 28Methanol 1.90E-01 4.86E-02 51 12 37 0 0 0 0 0 0 0 0Nitrogen oxides 7.38E+00 1.89E+00 0 36 19 0 0 1 9 11 2 0 22NMVOC, non-methane 4.48E+00 1.15E+00 0 21 41 0 0 1 6 22 0 0 8Particulates 1.14E+00 2.92E-01 73 27 0 0 0 0 0 0 0 0 0Particulates, < 10 um 1.73E+00 4.43E-01 8 77 3 0 0 0 5 1 0 0 5Phenol 3.62E-02 9.27E-03 50 50 0 0 0 0 0 0 0 0 0Sulfur oxides 1.63E+01 4.17E+00 0 17 36 0 0 1 1 23 0 0 21VOC, volatile organic compounds 2.33E+00 5.97E-01 59 41 0 0 0 0 0 0 0 0 0
Boiler and dryer fuel

21
An example of the sensitivity of the impact can be shown by selecting and changing the wood fuel and natural gas use mix and re-examining the impact on resource use and some of the more dominant emissions. If all the fossil fuel use to produce particleboard on-site was replaced with wood fuel, the 30 m3 of natural gas would be replaced by 55.5 kg of wood fuel and the 0.06 liters of DFO fuel would be replaced with 0.11 kg of wood fuel based on the higher heating value (HHV) of each fuel. This results in the purchase of 55.6 kg of wood fuel in addition to all other wood inputs into the base case. This would increase the total on-site mill use of wood fuel to 82.7 kg oven dry weight. Redoing the base-case (33% of process energy from wood fuel and 67% from nature gas) SimaPro model to reflect the change in fuel mix to all wood gives the life-cycle inventory output for the cradle-to-product gate values for resource use (in-ground raw material) and selected air emissions as shown in Table 1.13. Increasing the use of wood to displace all fossil fuel used in the particleboard mill decreases overall natural gas use by 29% (most of the remaining use is to generate electricity) and decreases emissions of CO2 fossil by 17%, methane by 21%, NMVOC by 22% and sulfur oxides (SOx) by 23%. This results in a positive shift from emissions of CO2 fossil to a biogenic emission that reduces the impact on global warming. The carbon storage in wood increases in terms of CO2 removed from the atmosphere to make the wood by 100 kg (7%) over the base case. Increases of emissions occur for benzene (20%), carbon monoxide (25%) and phenol (24%). Similar analyses of other major input parameters could be done to study their sensitivity and impact on the various output parameters. As the government legislate policies to reduce global warming through carbon cap and trade programs, emissions regulations, and the use of sustainable fuels, the use of wood as a substitute for fossil fuels and for fossil-fuel intensive products will become increasingly important. Furthermore, with increasing costs of fossil fuels and the possibility of a federal carbon tax on fossil fuel use, even more opportunities will develop for using wood as a fuel. These opportunities should be explored and developed further.

22
Table 1.13. LCI in terms of raw materials and air emissions for all wood fuel use scenario in manufacture of particleboard.
DifferenceWood-base
Raw Materials lb/MSF kg/m3 lb/MSF kg/m3 %Carbon dioxide in air 5,978 1,532 6,368 1,632 7Coal in ground 212 54 211 54 0Natural gas in ground 367 94 259 66 -29Limestone in ground 12 3.1 37 9.5 203Crude oil in ground 139 36 139 36 0Uranium in ground 0.00092 0.00024 0.00092 0.00024 0Water, unspecified natural origin 3,026 776 3,026 776 0Water, well, in ground 487 125 487 125 0Wood fuel 445 114 662 170 49
Emissions to airAcetaldehyde (HAP) 0.0074 0.0019 0.0081 0.0021 9Acrolein (HAP) 0.00058 0.00015 0.00058 0.00015 0Benzene 0.0039 0.0010 0.0047 0.0012 20Carbon dioxide, biogenic 943 242 1,395 358 48Carbon dioxide, fossil (GHG) 1,434 368 1,185 304 -17Carbon monoxide 9.68 2.48 12.11 3.10 25Formaldehyde (HAP) 0.24 0.063 0.25 0.06 1HAPs 0.31 0.078 0.31 0.08 0Mercury 0.000017 0.000004 0.000016 0.000004 -1Methane (GHG) 3.39 0.87 2.68 0.69 -21Methanol (HAP) 0.19 0.049 0.19 0.05 0Nitrogen oxides 7.38 1.89 7.05 1.81 -4NMVOC, non-methane 4.48 1.15 3.47 0.89 -22Particulates 1.14 0.29 1.14 0.29 0Particulates, < 10 um 1.73 0.44 1.75 0.45 1Particulates, unspecified 0.64 0.16 0.63 0.16 -1Phenol (HAP) 0.036 0.009 0.045 0.011 24Sulfur oxides 16.28 4.17 12.50 3.20 -23VOC 2.33 0.60 2.33 0.60 0
Base case Wood case33% wood-67% nat gas 100% wood
1.9 Carbon Balance For Particleboard Production Carbon was tracked for the production of particleboard. Approximately half of wood’s chemical composition consists of carbon; by tracking wood flow in and out of the manufacturing process a balance can be determined for its carbon flow. A check list was derived to balance the inputs of carbon with the outputs to show the carbon flow for the production of particleboard. This analysis followed carbon from the inputs of wood materials through production of product, co-product and the generation of emissions. The percentage of carbon in wood was taken as an average value for those referenced in earlier CORRIM LCI studies of softwood lumber, plywood, and OSB as 52.43% (Milota et al 2005, Wilson and Sakimoto 2005, and Kline 2005) which provided the input wood residue LCI data. Table 1.14 gives the carbon content of wood materials from input to output. The input consists of wood shavings, sawdust, chips, ply trim, and OSB fines, and the outputs of particleboard, sold wood fuel, and wood emissions. Much of the air emissions are due to the combustion of wood fuel for the process. The wood carbon content of 1.0 m3 of particleboard is 352 kg. The difference between the input and output flow is 5.5% with more carbon flow out than in which can be attributed to the accuracy of measuring differences for inputs and outputs and the higher than expected CO2 emissions from the use of the FAL database in the SimaPro software.

23
Table 1.14. Tracking of wood-based carbon inputs and outputs for particleboard production.
CarbonInputs lb/MSF kg/m3 % lb/MSF kg/m3
Green hog chips 232 60 52 122 31Dry hog chips 192 49 52 101 26Green shavings 127 32 52 66 17Dry shavings 1582 405 52 829 213Green sawdust 358 92 52 188 48Plywood trim 116 30 52 61 16OSB fines 12 3 52 6 2Total 1,373 352
OutputsParticleboard (wood only) 2621 672 52 1,374 352Sold boiler fuel 20 5 52 11 3Sum of air emissions 62 16Sum of land emissions 1 0.3Total 1,449 371
Outputs-inputs difference % 5.5 5.5
Elemental carbonWood weight
The store of carbon in particleboard due to its wood component can be used to offset greenhouse gases that occur during its life cycle and even some in the atmosphere. The carbon store in wood develops as a result of photosynthesis during the growing of trees, absorbing CO2 from the atmosphere to form wood substance from the carbon (C) and releasing oxygen (O2) back to the atmosphere. About half the mass of wood and bark is carbon, to determine the equivalent of carbon dioxide that was removed from the air to form this carbon store in wood and bark, multiply the wood carbon content in kg by 3.67 kg CO2/kg which is the molar mass ratio of CO2 to C of 44 to12. The carbon content of 1.0 m3 of particleboard is 352 kg which times 3.67 kg-CO2/kg is 1,290 kg-CO2 equivalents. This CO2 equivalent of carbon store can be used to offset CO2 fossil emissions as well as other greenhouse gas emissions due to processing, product use and disposal, and even some CO2 in the atmosphere; thereby reducing the impact of particleboard’s life cycle upon global warming and climate change. The CO2 biogenic emissions for wood fuel use are offset by their own store and are not included in this analysis; as such the use of wood fuel is considered carbon neutral. Subtracting 368 kg-CO2 due to combustion of fossil fuel cradle-to-gate from the 1,290 kg-CO2 equivalents of the store in particleboard leaves 922 kg-CO2 equivalents to offset other greenhouse gas emissions such as methane and nitrous oxide, as well as additional CO2 and other greenhouse gases in the atmosphere, further reducing their impact upon global warming. The carbon store remains in the particleboard for the life of its service and even longer if recycled or placed in a modern landfill where much of it can last for over a 100 years. 1.10 Study Discussion The data documented in this report on the manufacture of particleboard forms a foundation for the scientific assessment of its environmental performance. The data can be used in a number of ways to show its favorable performance for such environmental issues as sustainability, global warming, climate change, carbon storage, carbon trading and caps, carbon taxes, bio-fuel use, green purchasing, and green building. The data can be used as stated or in a life-cycle assessment to compare wood products to various competitive materials or assemblies of materials.

24
The Intergovernmental Panel on Climate Change (IPCC) recognized the potential of mitigating climate change by substitution for fossil fuel and fossil-fuel intensive products (IPCC 1991). The human-induced greenhouse effect could be reduced if wood was used to substitute for competitive materials saving on fossil-generated energy to produce these materials and on the consequent carbon emissions prevalent with these products. The carbon emissions from combustion of wood are considered global warming impact neutral because trees can absorb CO2 from the atmosphere storing the carbon as wood tissue and releasing the oxygen back to the environment (USEPA 2003). IPCC described three strategies associated with wood to reduce CO2 in the atmosphere; two of the three included the use of wood products (IPCC 1996). They later stated that the substitution effect of wood products for fossil-fuel intensive products provide cumulative and permanent avoidance of fossil carbon emissions, while storage in trees provide limited, and possibly transient emissions avoidance. Simply put it is environmentally more effective to use trees for products that displace fossil-intensive products for reducing carbon emissions to the atmosphere than it is to store the carbon in trees (IPCC 2001a, IPCC 2001b, and Sathre 2007). These same strategies are addressed with the manufacture and use of particleboard where wood is used as fuel for a significant portion of its energy need and as product to displace fossil-intensive products. LCI data are invaluable when it comes to establishing the greenness of a product and its performance in comparison to competitive materials. The data forms the foundation for a scientific assessment with outputs in terms of a variety of environmental performance measures. It provides data that can be used to establish the performance of particleboard for many green type standards, guidelines and policies. Such topics where the data can be used are sustainability, global warming, climate change, carbon storage, carbon trading and caps, carbon taxes, bio-fuel use, green purchasing, and green building. The data can be effective at establishing particleboard’s performance in comparison to other materials by conducting life-cycle assessments with output measures in terms of impacts on human health, environment, and resource use. Individual LCI data can be used as a benchmark for process or product improvements or for comparing performance to those of other materials. A life-cycle assessment (LCA) based on the LCI data can be used when comparing materials or assemblies comprised of various materials. The LCA output is given in terms of environmental performance indices of human health, environment, and resource impacts. Such a comparison was conducted by CORRIM in its assessment of residential structures that were built with various materials of wood, concrete, and steel (Perez-Garcia et al. 2005). In this assessment wood was shown to perform environmentally the best in most categories of comparison. However, particleboard is not a structural building material; it is used for non-structural applications such as for underlayment, cabinets, tables, countertops, furniture, and millwork. For an LCA approach to establish particleboard’s environmental performance it would therefore be effective to conduct an analysis of various assemblies such as finished tables, desks, and cabinets based on their components. In this manner a desk comprised of particleboard and other materials could be compared to a desk made of metal and other materials. It is recommended that these types of comparisons be identified and then conducted to document particleboard’s favorable performance. One approach to assessing the quality of the LCI data collected and analyzed is to compare it to existing data in the literature. This can be done by comparing the data in this report to data reported earlier by NCASI for emissions generated in the production of particleboard (NCASI 1999). Another comparison can be made to LCI data reported in the literature (Rivela et al. 2006) for particleboard production in Spain. NCASI did a study in the late 1990s assessing the emissions of various wood product manufacturing operations in terms of their sources within the mill. Table 1.15 gives a comparison of the NCASI values to those of this study for VOC, HAPS, methanol and formaldehyde. The values differed for all emissions with the NCASI measured data being 129 to 787% higher. This major difference can be explained in that the NCASI data were collected just prior to 1999 when all four mills studied did not use

25
emissions control systems such as a RTO or RCO, whereas the three of five mills in this study had RTOs to reduce VOC and HAP emissions. It is evident that the systems are effective for reducing these emissions which includes all four emissions given in the table. In the NCASI report they pointed out that the greatest source of emissions within the mill was due to the dryers, specifically identifying the green dryers used to dry the higher moisture content residue; other significant emissions occurred at the hot press. HAP emissions which include methanol and formaldehyde are expected to be reduced further for the particleboard industry with the implementation in 2007/2008 of PCWP MACT regulations (USEPA 2004). With the implementation of this rule, those manufacturers that do not already meet this regulation will be required to install emission control systems based on RTO or RCO technologies that use large quantities of natural gas and electricity to combust HAP emissions, or on BF technologies that use bio-organisms to convert HAP emissions and large quantities of electricity to transport emissions through the bed of organisms. As such, mill VOC and HAP emissions will decrease further, however, emissions of SOx, NOx, CO2 fossil, CO and/or those emissions associated with the generation of electricity off-site, will increase significantly. Table 1.15. Comparison of on-site emissions data with that collected by NCASI (1999).
NCASI-CORRIM
lb/MSF kg/m3 lb/MSF kg/m3 %HAPs 0.308 0.079 1.861 0.477 504Methanol 0.097 0.025 0.865 0.222 787Formaldehyde 0.216 0.055 0.493 0.126 129Total VOC 1.392 0.357 7.966 2.042 4721 Sum of all source emissions averaged.
CORRIM data NCASI values1
Table 1.16 gives a comparison of LCI data from this CORRIM study to that of Rivela et al. (2006) for particleboard produced in a representative state-of-art mill in Spain. The studies differ considerably in their boundary systems and the stated information on material input conditions and stated energy use. The Rivela et al LCI study ignores the environmental impacts associated with the growing, harvesting, and residue processing of all wood inputs to the manufacturing process; they treat the wood as true waste with no burden other than transportation. In this Wilson study of the LCI of particleboard the wood residue contributes 32% (see Table 1.11) of the total cradle-to-gate energy; as such it is a significant contributor not only in energy use but environmental burden and should not be ignored. Of further concern is that Rivela et al do not state the moisture conditions of the wood residue and fuels and the solids content of the input chemicals when giving weights, and do not give how the energy values were determined for the various fuels—whether HHV or LHV, and what combustion efficiency was assumed. Of lesser concern is the very small quantity of water use. Since the Rivela et al LCI study gives only data for the manufacturing boundary system, only this stage of the process is compared (Table 1.16). Assuming that the Rivela input wood data are green conditions as is the case in their later pub on the LCI of MDF (Rivela 2007), and determining fuel use based on higher heating values, this comparative table of data were constructed. The data sets for input materials, electricity and transportation are very similar, as are the air emissions for particulate and formaldehyde. Differences between the two data sets appear for water use—Rivela et al data appears to be too small—and they lack data on other wood related emissions of concern. Overall both data sets comparable favorably for on-site LCI data with the greatest shortcoming of the Rivela et al data being the limited boundary system that ignores the burden associated with the preparation of the wood residue, and their data lacks details on the moisture conditions of the wood residue weights and the solids contents of the chemical input weights.
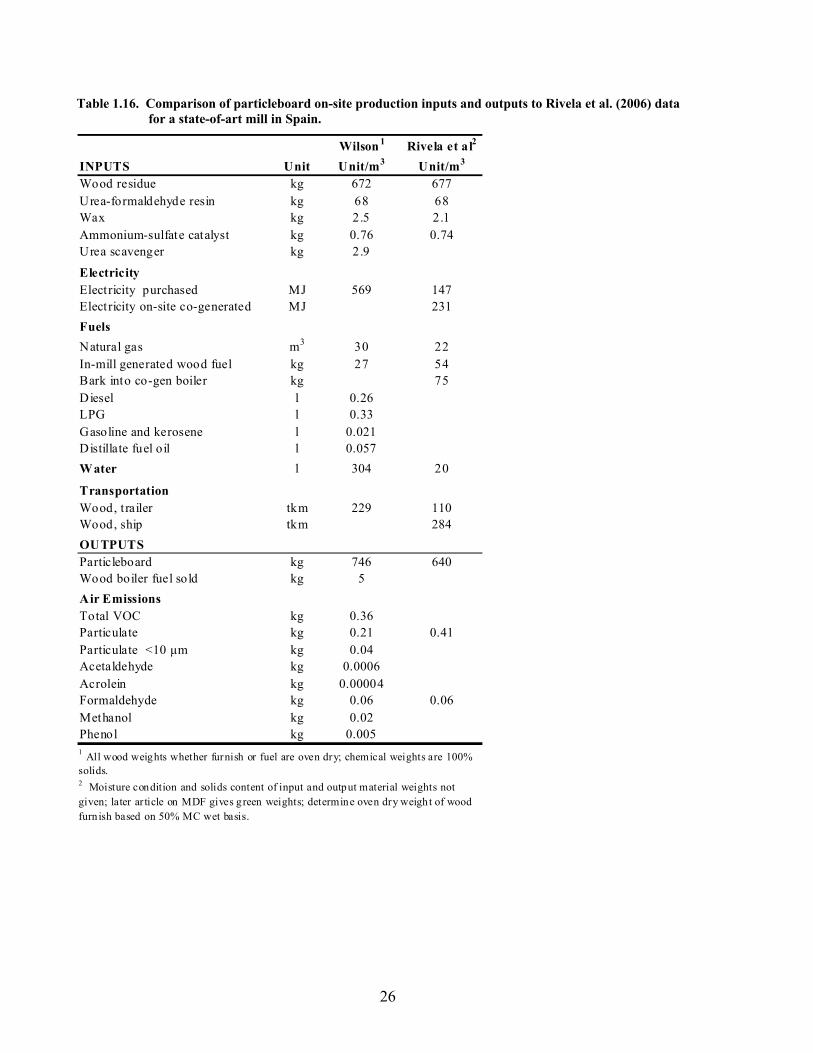
26
Table 1.16. Comparison of particleboard on-site production inputs and outputs to Rivela et al. (2006) data for a state-of-art mill in Spain.
Wilson 1 Rivela et al2
INPUTS Unit Unit/m3 Unit/m3
Wood residue kg 672 677Urea-formaldehyde resin kg 68 68Wax kg 2.5 2.1Ammonium-sulfate catalyst kg 0.76 0.74Urea scavenger kg 2.9
ElectricityElectricity purchased MJ 569 147Electricity on-site co-generated MJ 231FuelsNatural gas m3 30 22In-mill generated wood fuel kg 27 54Bark into co-gen boiler kg 75Diesel l 0.26LPG l 0.33Gasoline and kerosene l 0.021Distillate fuel oil l 0.057Water l 304 20
TransportationWood, t railer tkm 229 110Wood, ship tkm 284OUTPUTSParticleboard kg 746 640Wood boiler fuel sold kg 5Air EmissionsTotal VOC kg 0.36Particulate kg 0.21 0.41Particulate <10 μm kg 0.04Acetaldehyde kg 0.0006Acrolein kg 0.00004Formaldehyde kg 0.06 0.06Methanol kg 0.02Phenol kg 0.0051 All wood weights whether furnish or fuel are oven dry; chemical weights are 100% solids.2 Moisture condition and solids content of input and output material weights not given; later ar ticle on MDF gives green weights; determine oven dry weight of wood furn ish based on 50% MC wet basis.
27
1.11 Conclusion A cradle-to-product gate life-cycle inventory (LCI) study was conducted of manufacturing 1.0 MSF ¾-inch basis—the industry functional unit—and 1.0 m3—the LCI functional unit—of particleboard in the U.S. The study covered data analyses from the resources in the ground through particleboard manufacturing based upon prior CORRIM studies for forest resources, harvesting, transportation, input wood residue resources consisting of wood shavings, sawdust, plywood trim, OSB fines and chips from the manufacture of softwood lumber and plywood, OSB, urea-formaldehyde resin, and survey collected data of five particleboard manufacturing mills for the production year 2004. The mills in the survey represented 23% of total U.S. production with the average mill annually producing 347,690 m3 of particleboard at an average density of 746 kg/m3. The particleboard panel is comprised of 90% wood, 9.2% urea-formaldehyde resin, 0.3% wax, 0.1% ammonium-sulfate catalyst, and 0.4% urea scavenger—all on an oven dry or 100% solids basis weight. The quality of the LCI data collected for the manufacture of particleboard was high as judged by assessments for outliers, a mass balance of material in and out of the process, and an energy balance for drying wood within the process. Any data outliers were resolved by re-contacting the manufacturers that participated in the survey. The mass balance of input and output material had a 4.8% difference which is within the specified 5% of the CORRIM protocol. The energy to dry the wood per pound of water removed was 2,424 Btu/lb (5.64 MJ/kg) based on the lower heating value of the fuels which is relatively close to the expected 2,000 Btu/lb (4.65 MJ/kg) value based upon experience with drying other wood products. Assigning of environmental burden in the production of particleboard was primarily to the product (99.3%) with the small remaining amount to wood fuel sold outside the system. Of the output functional unit, 746 kg was for 1.0 m3 of particleboard and 5.2 kg for wood fuel sold. The embodied energy to produce 1.0 m3 of particleboard consists of fuels and electricity used on-site and the fuels used off-site to generate and deliver fuels and electricity to the mill, and those fuels used to manufacture input materials such as wood residue, resin, wax, catalyst, and scavenger. The on-site energy which includes all fuels and electricity was 2,319 MJ/m3 based on the fuel higher heating values. Of the fuel use on-site to provide process heat, wood fuel provided 33%, and in terms of the total on-site energy, the wood fuel provided 24%. This is important since wood as a sustainable, renewable fuel is substituting for fossil fuel, a non-renewable fuel. The other 67% of the process heat was provided by natural gas and represents an opportunity for replacing it with wood fuel. The total embodied energy of manufacturing particleboard from resource in the ground through product manufacture, referred to as cradle-to-product gate, was 10,865 MJ/m3 which as expected is significantly higher than the on-site use. The total energy covers both the on-site and off-site energy use. A breakdown of the total energy in terms of its contributors can be stated by fuel type or major components. In terms of fuels, the major contributors are natural gas at 47.1%, wood at 22.2%, oil at 14.9%, coal at 13.1%, plus a number of insignificant fuel contributors. In terms of the major component contributors, wood residue (consisting of sawdust, sander dust, shavings, OSB fines and chips) is 32.3%, urea-formaldehyde resin production 28.6%, electricity 15.8%, natural gas 14.1%, wood fuel 5.2%, and a large number of other minor contributors that total 4.1%. In both cases, wood for fuel (which includes a significant portion embedded in the production of wood residue) as an energy source plays a significant and favorable environmental role; its increased use should be explored further because there is significant opportunity to substitute it for fossil fuel. The source of fuels to generate electricity delivered to the mills for processing plays an important role in any life-cycle inventory assessment. A U.S. average for generating electricity in 2004 by fuel source was

28
selected for this study consisting of 49.8% coal, 19.9% nuclear, 17.9% natural gas, 6.8% hydroelectric, 3.0% oil, and smaller percentages of other sources. Of the on-site emissions for manufacturing 1.0 m3 of particleboard, wood fuel generated 56 kg of CO2, most of the CO that totaled only 0.2 kg, and all of the VOC, particulate and HAPs. Combustion of natural gas, a small amount of distillate fuel oil, and the use of a small amount of fossil fuels to operate equipment such as fork lift trucks generated 57 kg of CO2 and some of the carbon monoxide, methane, and almost all of the NOx and SOx with a small amount due to combustion of wood fuels. Emissions of CO2 biogenic due to the combustion of wood has a neutral impact on global warming according to the U.S. Environmental Protection Agency (USEPA 2003); whereas CO2 fossil emissions due to combustion of fossil fuels such as natural gas contribute significantly to global warming. Other on-site emissions consisted of VOC at 0.36 kg, HAPs at 0.08 kg, total particulates at 0.21 kg, formaldehyde at 0.06 kg and methanol at 0.02 kg. Only a small amount of waste is generated on-site, with 0.1 kg of boiler fly ash and 0.4 kg of wood waste going to the landfill. The total emissions considering those both on-site and off-site to generate fuels, electricity, resin, and other inputs, resulted in 242 kg of CO2 biogenic, and 368 kg of CO2 fossil—an increase over on-site emissions of 432% for CO2 biogenic and 646% for CO2 fossil. Of the total emissions, its increase over the on-site emissions was 7% for CO, 0% for formaldehyde, 0% for methanol, 12% for nitrogen oxides, a huge increase for sulfur oxides, 36% for total particulates, and 67% for VOC. It is significant to note that there is a very favorable effect of carbon storage by both wood and bark as a result of their formation as trees grow. Photosynthesis by trees absorbs carbon dioxide from the atmosphere, using the carbon to make wood and bark substance and releasing oxygen to the atmosphere. About half the mass of wood and bark is carbon, to determine the carbon dioxide equivalent that was removed from the air in its formation, multiply the carbon content of particleboard’s wood component in kg by 3.67 kg CO2/kg which is the molar mass ratio of CO2 to C of 44 to 12. The carbon content of 1.0 m3 of particleboard is 1,290 kg-CO2 equivalents which can be used to offset the CO2 emissions of 368 kg due to the combustion of fossil fuel during its cradle-to-gate life cycle. This leaves 922 kg of carbon dioxide as a credit to offset an equivalent amount of CO2 of other greenhouse gas emissions in manufacturing as well as greenhouse gases in the atmosphere, thereby reducing its impact upon global warming. The CO2 biogenic emissions for wood fuel are offset by their own store and are not included in this analysis. The carbon storage remains in the particleboard for the life of its service and even longer if recycled or placed in a modern landfill where much of it can last for over a 100 years. A sensitivity study was conducted to examine the impact of using more wood fuel as a substitute for fossil fuel in the production of particleboard. For the survey collected data 33% of the process heat was provided by wood fuel and 67% by natural gas. To study the effect of fuel type on the environmental impact, the wood fuel was increased to 100% and the natural gas decreased to 0%. For a cradle-to-product gate study of the 100% wood fuel use scenario in comparison to the survey data, the natural gas in the ground resource decreased by 29% and wood fuel use increased by 49%. As expected the emissions decreased for CO2 fossil (-17%), methane (-21%)—both contributors to global warming, and decreased for NMVOC (-22%), and sulfur oxides (-23%), and increased for benzene (20%), CO2 biogenic (48%), CO (25%) and phenol (24%). To help offset some of the CO2 emissions, an additional 100 kg of CO2 was removed from the air to provide the additional wood fuel. If the goal is to reduce global warming, then substituting wood fuel for natural gas, a fossil fuel, to generate process heat is a good decision for the environment because it decreases CO2 from fossil fuel combustion and decreases resource depletion of natural gas a non-renewable source and increases wood fuel use a renewable, sustainable fuel. This study provides a comprehensive database for the life-cycle inventory of particleboard. The data should be used as the basis for any life-cycle assessment of its environmental performance to improve

29
processing or to compare to other materials. This data will be available to the public on www.corrim.org and through the U.S. LCI Database at www.nrel.gov/lci/ (NREL 2008). To benefit from the availability of the LCI database for particleboard, the following studies are recommended: 1) extract pertinent data that documents the favorable environmental performance of particleboard, 2) develop life-cycle inventory data from the output gate for the production of particleboard through its incorporation into products such as office and residential furniture, cabinets, countertops, and flooring through their service life and eventual disposal or recycle, 3) conduct a life-cycle assessment of particleboard in comparison to selected competitive materials and products, and 4) extend the study on the impact of fuel type and amount of use on the environmental, human health, and resource depletion to foster the increased substitution of wood for fossil fuel.
2.0 References ANSI. 1999. American National Standard. ANSI A208.1-1999. Particleboard. Composite Panel
Association, Gaithersburg, MD. 11 pp. Composite Panel Association (CPA). 2005. 2004 North American Shipments Report – Particleboard,
Medium Density Fiberboard, and Hardboard. CPA, 18922 Premiere Court, Gaithersburg, MD 20879. CORRIM. 2001. Research Guidelines for Life Cycle Inventories. Consortium for Research on Renewable
Industrial Materials. (CORRIM, Inc.) Seattle, WA. 2 Apr. 47 pp. Ecoinvent. 2004. Ecoinvent Database and Methodology. Data version 1.1.
http://www.ecoinvent.org/fileadmin/documents/en/01_OverviewAndMethodology.pdf June. (15 Jan 08)
Energy Information Administration (EIA). 2007. Net Generation by Energy Source by Type of Producer, 1995 through 2006 http://www.eia.doe.gov/cneaf/electricity/epa/epat1p1.html. (27 Nov 07)
Franklin Associates LTD (FAL). 2004. The Franklin Associates Life Cycle Inventory Database. SimaPro7 Life-Cycle Assessment Software Package version 7.1 http://www.pre.nl/download/manuals/DatabaseManualFranklinUS98.pdf June. (15 Jan 08)
Intergovernmental Panel on Climate Change (IPCC). 1991. Climate Change: the IPCC Response Strategies. Island Press, Washington D.C.
___________________________________________. 1996. Climate Change 1995- Impacts, Adaptations and Mitigation of Climate Change: Scientific-Technical Analyses. Cambridge University Press, Camabridge, UK.
___________________________________________. 2001a. Climate Change 2001: The Scientific Basis. Contribution of Working Group I to the Third Assessment Report. Cambridge Unviersity Press, Cambridge, UK.
___________________________________________. 2001b Climate Change 2001: The Mitigation. Contribution of Working Group III to the Third Assessment Report. Cambridge Unviersity Press, Cambridge, UK.
International Organization for Standardization (ISO). 2006a. Environmental management-life cycle assessment-principles and framework. ISO 14040. First Editon 2006-06-31. Geneva, Switzerland. 32 pp.
_________________________________________________. 2006b. Environmental management—life cycle assessment—Requirements and guidelines. ISO 14044. First Edition 2006-07-01. Geneva, Switzerland. 46 pp.

30
Johnson, L.R., B. Lippke, J.D. Marshall, and J. Comnick. 2005. Life-cycle impacts of forest resource activities in the Pacific Northwest and Southeast United States. Wood Fiber Sci. 37 CORRIM Special Issue:pp. 30-46.
Kline, E. D. 2005. Gate-to-gate life inventory of oriented strand board. Wood Fiber Sci. 37 CORRIM Special Issue:pp. 74-84.
Milota, M. R., C. D. West, and I. D. Hartley. 2005. Gate-to-gate life inventory of softwood lumber production. Wood Fiber Sci. 37 CORRIM Special Issue:pp. 47-57
National Renewable Energy Laboratory (NREL). 2008. Life-cycle inventory database project. http://www.nrel.gov/lci/.
National Council for Air and Stream Improvement, Inc. (NCASI). 1999. Volatile Organic Compound Emissions from Wood Products Manufacturing Facilities. Part IV ─Particleboard. Technical Bulletin No. 771. Research Triangle Park, N.C. January.
Perez-Garcia, J., B. Lippke, D. Briggs, J. B. Wilson, J. Bowyer, and J. Meil. 2005. The Environmental Performance of Renewable Building Materials in the Context of Residential Construction. Wood and Fiber Sci. 37 CORRIM Special Issue:pp. 3-17.
PRé Consultants. 2007. SimaPro7 Life-cycle assessment software package, Version 7.10. Plotterweg 12, 3821 BB Amersfoort, The Netherlands. http://www.pre.nl/simapro/manuals/default.htm. (27 Feb 07).
Rivela, B, A. Hospido, M. Moreira and G. Feijoo. 2006. Life cycle inventory of particleboard: A case study in the Wood Sector. Int. J. LCA. 11(2): 106-113.
Rivela, B, M. Moreira and G. Feijoo 2007. Life Cycle Inventory of Medium Density Fibreboard. Int. J. LCA. 12(3): 143-150.
Sathre, R. 2007. Life-Cycle Energy and Carbon Implications of Wood-based Products and Construction. Mid Sweden University. Ostersund, Sweden. pp. 102 plus papers.
United States Department of Energy (USDOE). 2006. Net Generation by Energy Source by Type of Producer. http://www.eia.doe.gov/cneaf/electricity/epa/generation_state.xls (15 January 2007)
U.S. Census Bureau. 2007. 2002 NAICS Definitions. http://www.census.gov/epcd/naics02/def/ND321219.HTM. (27 Nov 07)
U.S. Environmental Protection Agency (USEPA). 2003. Wood waste combustion in boilers. 20 pp. In AP42 Fifth Edition Volume I Chapter 1: External combustion sources. http://www.epa.gov/tnn/chief/ap42/ch01/index.html. (18 Jan 08)
_________________________________________. 2004. National Emission Standards for Hazardous Air Pollutants: Plywood and Composite Wood Products; Effluent Limitations Guidelines and Standards for the Timber Products Point Source Category; List of Hazardous Air Pollutants, Lesser Quantity Designations, Source Category List. http://www.epa.gov/EPA-WATER/2004/July/Day-30/w6298a.htm. (10 Dec 07)
_________________________________________. 2007. Source Classification Codes. http://www.epa.gov/ttn/chief/codes/scc_feb2004.xls. (27 Nov 07)
Wilson, J.B., and E.T. Sakimoto. 2005. Gate-to-gate life-cycle inventory of softwood plywood production. Wood Fiber Sci. 37 CORRIM Special Issue:pp. 58-73.
Wilson, J. B. 2009. Resins: A life-cycle inventory of resins used in the wood composites industry. Consortium for Research on Renewable Industrial Materials. (CORRIM, Inc.) University of Washington. Seattle, WA. pp. (In Progress)

31
Appendix 1: Particleboard Mill Survey Form
CORRIM SURVEY The Consortium for Research on Renewable Industrial Materials (CORRIM, Inc.)1-15-2005 The information from this survey will be used in a project by CORRIM, a consortia comprised of universities, industry, and government groups. CORRIM is conducting a life-cycle assessment that will describe environmental influences of wood products. CORRIM’s objective is to acquire a database and produce life-cycle models of environmental performance for all wood products. We recently completed the database for structural wood products and are now doing other wood products. The database will be the basis for the scientific evaluation of feasible alternatives affecting the environmental releases and energy requirements of wood products through their life cycles. It is hoped that the output of the study will be used to competitively position wood in the marketplace over other types of materials. This CORRIM survey is designed specifically for particleboard mills. Questions will be concentrated on annual production, electricity production and usage, fuel use, material flows, and environmental emissions. We realize that you may not have all the information requested, especially when it comes to specific equipment and processing groups. The data you are able to provide will be greatly appreciated. We intend to maintain the confidentiality of data and companies participating in this survey. Please contact me if you have any questions.
Company:
Facility Site (city, state):
Should we have a follow-up question about the data, please provide the name and the following information for the contact in your company.
Name: Title:
Telephone: E-mail:
If you have questions about the survey, please contact me. Either mail or fax completed survey to: Jim Wilson Professor Department of Wood Science and Engineering 234 Richardson Hall Oregon State University Corvallis, OR 97331-5751 541-737-4227 phone [email protected]

32
Annual Production (Please provide units of measurement if different than stated.)
State basis used TOTAL ANNUAL PRODUCTION
1. Particleboard produced in 2004 (preferred) or 2003; circle year
MSF 3/4-inch basis
give production year if different
2. Estimated average density of panels lb/ft3
3. Number of employees
4. Number of production lines
5. Year of installation of each line: Line 1 Line 2
6. Other materials sold (i.e., sander dust)
a. lb. or tons (dry weight)
b. lb. or tons (dry weight)
c. lb. or tons (dry weight)
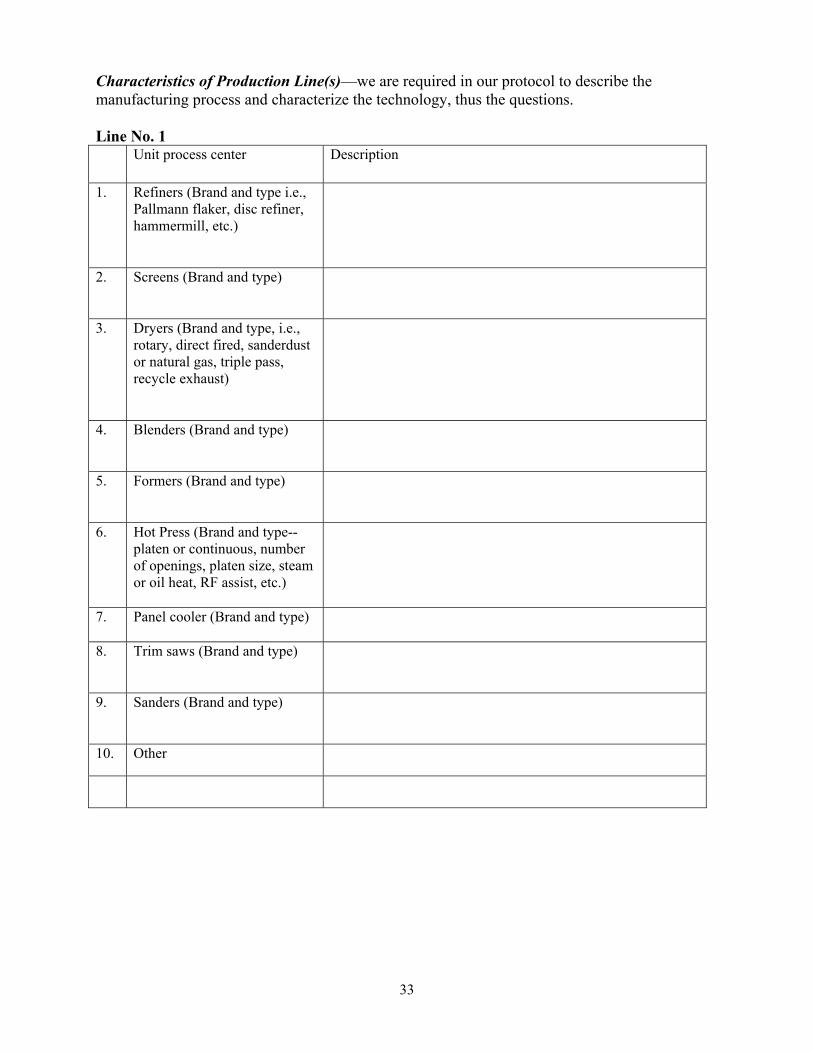
33
Characteristics of Production Line(s)—we are required in our protocol to describe the manufacturing process and characterize the technology, thus the questions. Line No. 1 Unit process center Description
1. Refiners (Brand and type i.e., Pallmann flaker, disc refiner, hammermill, etc.)
2. Screens (Brand and type)
3. Dryers (Brand and type, i.e., rotary, direct fired, sanderdust or natural gas, triple pass, recycle exhaust)
4. Blenders (Brand and type)
5. Formers (Brand and type)
6. Hot Press (Brand and type--platen or continuous, number of openings, platen size, steam or oil heat, RF assist, etc.)
7. Panel cooler (Brand and type)
8. Trim saws (Brand and type)
9. Sanders (Brand and type)
10. Other

34
Line No. 2 (skip this question if you only have one production line) Unit process center Description
1. Refiners (Brand and type i.e., Pallmann flaker, disc refiner, hammermill, etc.)
2. Screens (Brand and type)
3. Dryers (Brand and type, i.e., rotary, direct fired, sanderdust or natural gas, triple pass, recycle exhaust)
4. Blenders (Brand and type)
5. Formers (Brand and type)
6. Hot Press (Brand and type--platen or continuous, no. openings, platen size, steam or oil heat, RF assist, etc.)
7. Panel cooler (Brand and type)
8. Trim saws (Brand and type)
9. Sander (Brand and type)
10. Other

35
Annual Wood Use for Mill (Please provide units of measurement.)
Wood type (list as shavings green, shavings dry, ply trim, sawdust, etc.)
MC of wood as delivered (% on ovendry weight basis)
Annual Use Weight (list as tons or lbs oven dry, or volume—give units)
1.
2.
3.
4.
5.
6.
7.
8.
Total wood use
Species Mix of wood residue used by plant
Wood Species (either hardwood or softwood; or actual species if known)
% of Total Mix
1. Softwoods
2. hardwoods
3.
4.
5.
6.
Total 100%

36
Annual Energy Consumption (Total use for boilers, oil heaters, forklifts, etc. Please provide units of measurement if different.) 1. Purchased electricity kWh 2. Purchased steam lbs. (at temperature oF?) If you know fuel source used to generate steam, please state type,
i.e. natural gas, hog fuel
3. Coal Tons (oven dry) 4. Hog fuel Self-generated Tons (oven dry)
Purchased Tons (oven dry) Wood waste Tons (oven dry) Sander dust Tons (oven dry) Residual fuel oil 42 Gal. Bbls. Distillate fuel oil 42 Gal. Bbls. Liquid propane gas Gallons Natural gas ft.3 Gasoline and kerosene Gallons Diesel Gallons Other (Specify) Less energy sold or transferred
a. Electricity kWh b. Steam lbs. (at temperature oF?) c. Hog fuel Tons (oven dry) d. Wood waste Tons (oven dry)
Note: please list fuel (i.e., propane, diesel, etc.) consumption in appropriate category above for use of forklifts in mill.
Characteristics of heat sources 1. Do you have a boiler, fuel cell, or oil heater? Check appropriate boxes.
Boiler Fuel cell Oil heater Other
2. If you have a boiler, what is its heat source? Check appropriate box. Hogged fuel Oil Natural gas Other
3. If you have a fuel cell, what is its heat source? Check appropriate boxes. Hogged fuel Oil Natural gas Other
4. If you have a oil heater, what is its heat source? Check appropriate box. Hogged fuel Oil Natural gas Other
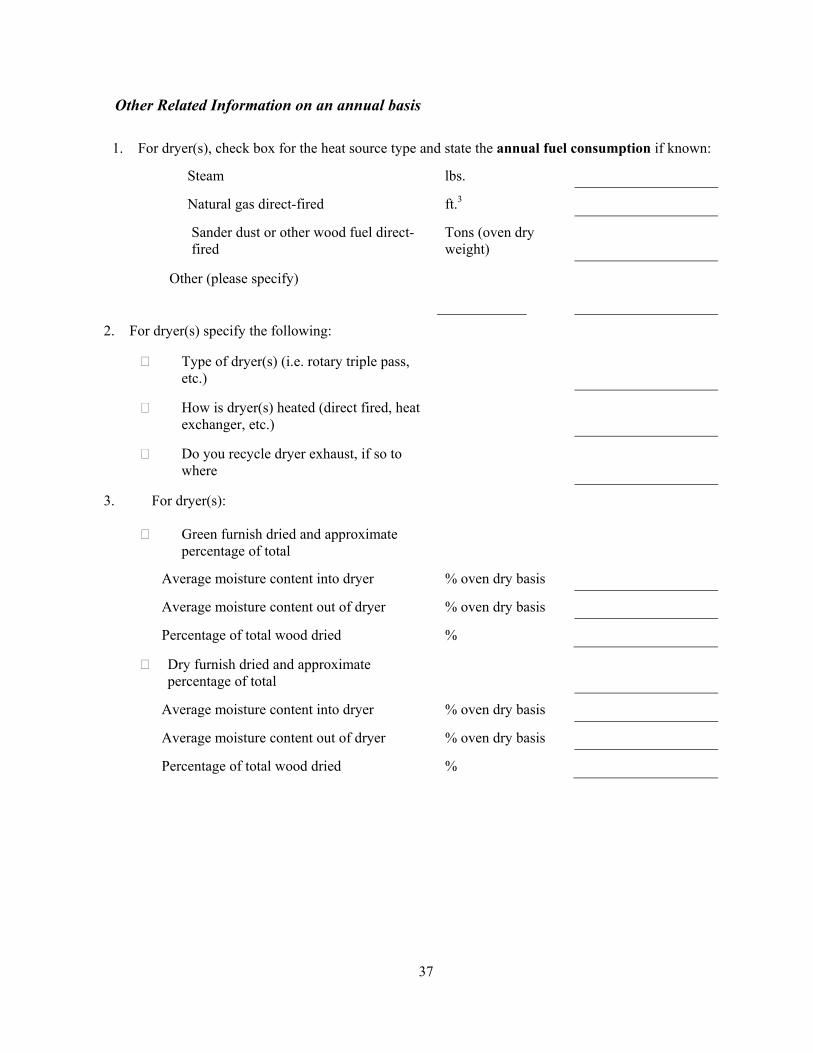
37
Other Related Information on an annual basis
1. For dryer(s), check box for the heat source type and state the annual fuel consumption if known:
� Steam lbs.
� Natural gas direct-fired ft.3
� Sander dust or other wood fuel direct-fired
Tons (oven dry weight)
� Other (please specify)
2. For dryer(s) specify the following:
Type of dryer(s) (i.e. rotary triple pass, etc.)
How is dryer(s) heated (direct fired, heat exchanger, etc.)
Do you recycle dryer exhaust, if so to where
3. For dryer(s):
Green furnish dried and approximate percentage of total
Average moisture content into dryer % oven dry basis
Average moisture content out of dryer % oven dry basis
Percentage of total wood dried %
Dry furnish dried and approximate percentage of total
Average moisture content into dryer % oven dry basis
Average moisture content out of dryer % oven dry basis
Percentage of total wood dried %
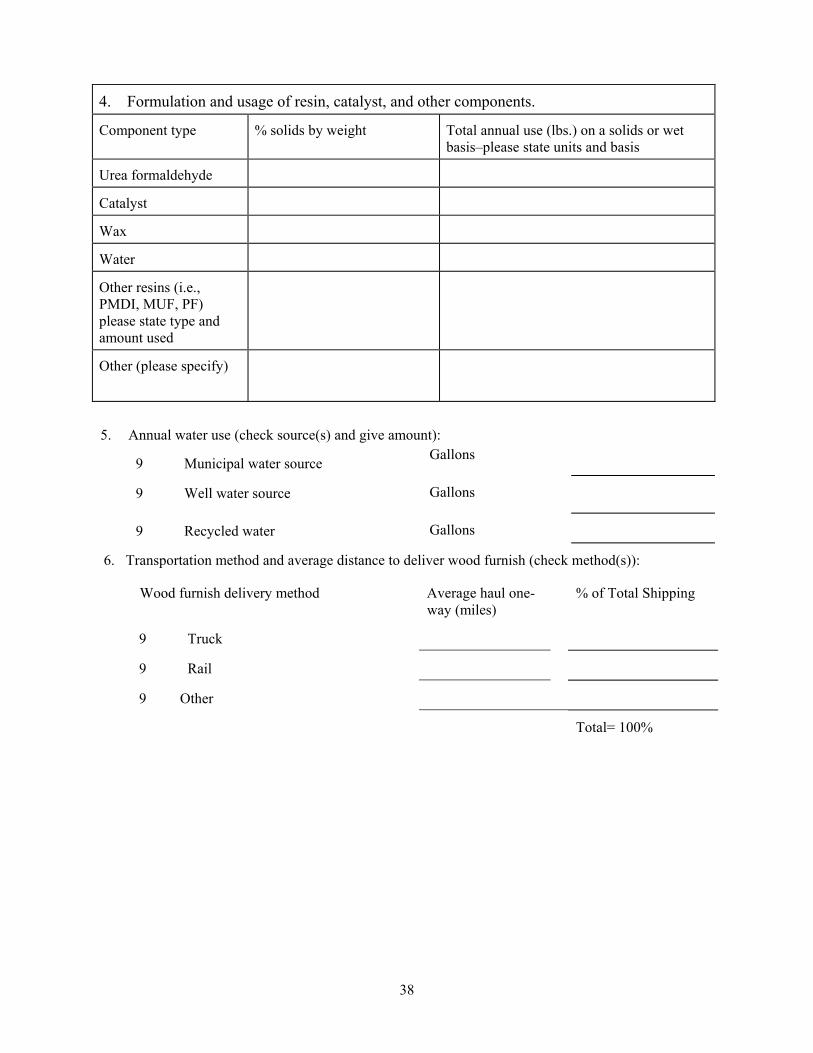
38
4. Formulation and usage of resin, catalyst, and other components.
Component type % solids by weight Total annual use (lbs.) on a solids or wet basis–please state units and basis
Urea formaldehyde
Catalyst
Wax
Water
Other resins (i.e., PMDI, MUF, PF) please state type and amount used
Other (please specify)
5. Annual water use (check source(s) and give amount):
9 Municipal water source Gallons
9 Well water source Gallons
9 Recycled water Gallons
6. Transportation method and average distance to deliver wood furnish (check method(s)):
Wood furnish delivery method Average haul one-way (miles)
% of Total Shipping
9 Truck
9 Rail
9 Other
Total= 100%

39
7. Transportation method used to deliver resin
Average haul one-
way (miles) % of Total Shipping
9 Truck
9 Rail
9 Other
Total 100
8. Transportation method used to ship panels
Average haul one-
way (miles) % of Total Shipping
9 Truck
9 Rail
9 Other
100

40
Energy Use by Unit Process –most mills won’t have specifics, however, if you can provide the approximate use of energy in percentage of total mill use, this will be extremely helpful to us. Breakdown of Natural Gas Use Percent (%) or Annual ft3 use Dyers
Boiler
Oil Heater
Emissions Control Devices
Other
Total
100% or _________ ft3
Breakdown of Electricity Use Percent (%) or Annual kWh use Refiners
Screens
Dryers
Blenders
Formers
Press(es)
Cooler
Trim saws
Sander(s)
Boiler(s)
Emissions control device(s)
Other
Total
100% or _________ kWh

41
Process and Material Flows To enable us to model the flow through your operation we would like to know the process order and any by-products generated by the process and where they go. For the order, if the process flow depicted below isn’t correct, please draw a line from the left of the box to where it is in your process. For the by-product give the pounds (lbs) per year and where they go, if back into the process draw a line to where it goes. If there are other by-products, please write them in and provide information. For emissions, draw a line from the process to emission control device. If a process shown isn’t used, draw a line through it, if a process is missing, please add it.
Store
Refine
Screen
Dry
Blend
Form
Press
Cool
Trim
Sand
Fines—lbs. per year and where do they
Overs—lbs. per year and where do they go?
Trim—lbs. per year and where does it
Sander dust—lbs. per year and where does it go?
?
Boiler
Emission Control
Baghouse
Oil Heater
Particulate—lbs. per year and where does it go?

42
Annual Material Flow This is a general material flow survey for particleboard mills. This survey is designed to trace all wood coming into the plant and out. You have already provided the input material and the output panel production, what we now need to track is by-products through the operation and where they go. Unit Process Material type Amount of material
(lb or tons oven dry) Where does it go? (back into a specific unit process, boiler, sold, etc.)
Screen
Screening fines
Screening overs
Saw & trim
Saw trim
Sanding
Sander dust
Bag house
Bag house dust
Cyclone
Cyclone dust
Other?

43
Particleboard dryers. Please provide units of measurement.
Dryer No. 1 Dryer No. 2 Dryer No. 3 Dryer No. 4 Dryer No. 5 Annual Dryer Throughput: (dry weight basis, lbs or tons)
Dryer fuel consumption:
Wood waste (i.e., sander dust, lbs or tons) Natural gas (ft3 or Dtherm)
Propane (gal.)
Other? Please state what
Heating method; check method that applies: Direct-fired
Indirect-fired (heat exchanger)
Dryer type; check type that applies: Single pass
Triple pass
Conveyor
Other (please name)
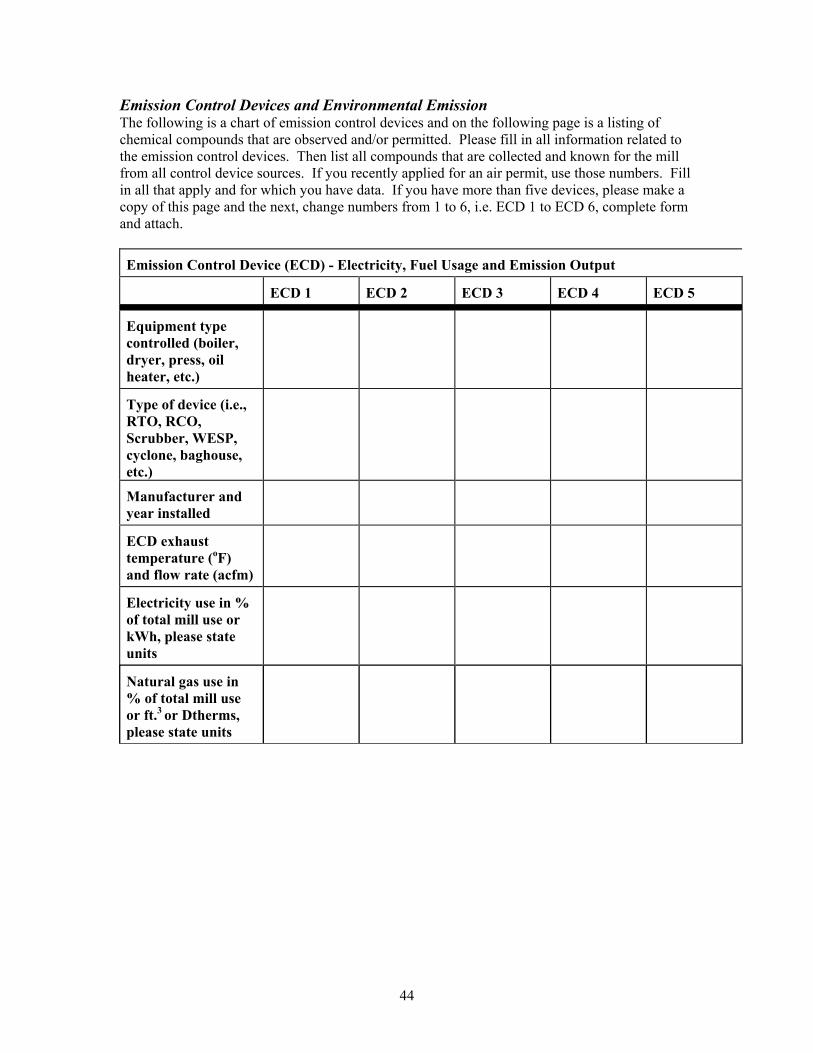
44
Emission Control Devices and Environmental Emission The following is a chart of emission control devices and on the following page is a listing of chemical compounds that are observed and/or permitted. Please fill in all information related to the emission control devices. Then list all compounds that are collected and known for the mill from all control device sources. If you recently applied for an air permit, use those numbers. Fill in all that apply and for which you have data. If you have more than five devices, please make a copy of this page and the next, change numbers from 1 to 6, i.e. ECD 1 to ECD 6, complete form and attach.
Emission Control Device (ECD) - Electricity, Fuel Usage and Emission Output
ECD 1 ECD 2 ECD 3 ECD 4 ECD 5
Equipment type controlled (boiler, dryer, press, oil heater, etc.)
Type of device (i.e., RTO, RCO, Scrubber, WESP, cyclone, baghouse, etc.)
Manufacturer and year installed
ECD exhaust temperature (oF) and flow rate (acfm)
Electricity use in % of total mill use or kWh, please state units
Natural gas use in % of total mill use or ft.3 or Dtherms, please state units

45
Annual Emissions to Air (provide data for same device identified on prior page; please provide unit of measurement for each.) Organic Compound ECD 1 ECD 2 ECD 3 ECD 4 ECD 5
Equipment type controlled (boiler, dryer, press, etc.) Units Tons/year Tons/year Tons/year Tons/year Tons/year CO2 (you probably don’t have this number but provide if you do) CO NOX SOx Total VOC Particulates PM10 Lead Acrolien* Acetaldehyde* Propionaldehyde* Formaldehyde* Methanol* Phenol* Water Vapor * HAPS; please provide total HAPS if you have it, and provide whatever individual HAPS that you have data Other (Please Specify

46
Solid Emissions to Land From All Known Sources (please provide units of measurement)
Emission Amount (i.e., tons, lbs.) Method of disposal or end use (i.e., land fill)
Wood waste
Boiler ash and fly ash
Recovered particulates from pollution abatement equipment
Other (please specify)
Emissions to Water From All Known Sources (please provide units of measurement)
Emission Quantity (i.e., tons, lbs.) Method of disposal or end use (i.e., sewer)
Suspended solids
Dissolved solids
BOD
COD
Chlorides
Oil and grease
Other (please specify)
pH of water discharged

47
Appendix 2: Contributors To Lci Output Materials And Emissions
Total PB Process Wood furnish UF resin Catyalst Wax Urea scav. Transport Nat. gas Wood fuel DFO Raw Materials lb/MSF kg/m3 % % % % % % % % % % %Calcite, in ground 0.43 0.11 100 0 0 96 0 0 4 0 0 0 0Clay, unspecified, in ground 0.12 0.03 100 0 0 96 0 0 4 0 0 0 0Coal in ground 212 54 100 0 13 12 0 0 0 0 0 0 0Crude oil in ground 139 36 100 0 27 45 0 0 2 17 1 0 0Gravel, in ground 3.62 0.93 100 0 0 96 0 0 4 0 0 0 0Iron ore, in ground 0.20 0.05 100 0 100 0 0 0 0 0 0 0 0Limestone in ground 12 3.1 100 0 14 12 0 0 0 0 0 0 0Natural gas in ground 367 94 100 0 17 43 0 0 1 0 29 0 0Nickel in ground 0.11 0.03 100 0 0 96 0 0 4 0 0 0 0Scrap, external 0.07 0.02 100 0 100 0 0 0 0 0 0 0 0Sodium chloride, in ground 0.23 0.06 100 0 15 85 0 0 0 0 0 0 0Uranium in ground 0.00092 0.00024 100 0 15 12 0 0 0 0 0 0 0Water, cooling, unspecified natural origin 1,273 326 100 0 0 83 0 17 0 0 0 0 0Water, process, drinking 6 2 100 0 100 0 0 0 0 0 0 0 0Water, process, unspecified natural origin 197 51 100 0 0 87 3 4 6 0 0 0 0Water, process, well, in ground 407 104 100 0 92 8 0 0 0 0 0 0 0Water, unspecified natural origin 1,511 387 100 78 0 18 0 4 1 0 0 0 0Water, well, in ground 80 20 100 0 20 79 0 0 1 0 0 0 0Wood and wood waste fuel 340 87 100 0 100 0 0 0 0 0 0 0 0Wood hog fuel self-generated 7.7 2.0 100 0 0 0 0 0 0 0 0 100 0Wood sander dust for fuel 97 25 100 0 0 0 0 0 0 0 0 100 0
EnergyElectricity from other gases, Wh/m3 730 100 0 0 13 0 0 1 0 0 0 0Electricity from other renewables, MJ/m3 15 100 0 0 13 0 0 1 0 0 0 0Energy, from hydro power, MJ/m3 195 100 0 77 3 0 0 0 0 0 0 0
Boiler and dryer fuel

48
Total PB Process Wood furnish UF resin Catyalst Wax Urea scav. Transport Nat. gas Wood fuel DFO Emissions to air lb/MSF kg/m3 % % % % % % % % % % %Acetaldehyde 7.42E-03 1.90E-03 100 33 63 4 0 0 0 0 0 0 0Acetic acid 2.07E-03 5.31E-04 100 0 0 95 0 0 5 0 0 0 0Acetone 9.41E-04 2.41E-04 100 0 68 30 0 0 1 0 0 0 0Acrolein 5.76E-04 1.48E-04 100 25 73 0 0 0 0 0 0 0 0Aldehydes, unspecified 3.85E-02 9.88E-03 100 0 28 21 0 0 1 45 2 0 0Alpha-pinene 9.67E-03 2.48E-03 100 0 100 0 0 0 0 0 0 0 0Ammonia 7.05E-01 1.81E-01 100 0 0 95 0 0 4 0 0 0 0Arsenic 9.07E-05 2.33E-05 100 0 37 34 0 0 1 0 0 10 0Barium 1.96E-03 5.02E-04 100 0 76 0 0 0 0 0 0 24 0Benzene 3.93E-03 1.01E-03 100 0 31 56 0 0 3 0 0 10 0Beta-pinene 3.75E-03 9.61E-04 100 0 100 0 0 0 0 0 0 0 0Carbon dioxide, biogenic 9.43E+02 2.42E+02 100 0 77 0 0 0 0 0 0 23 0Carbon dioxide, fossil 1.43E+03 3.68E+02 100 0 21 25 0 0 1 5 17 0 0Carbon monoxide 9.68E+00 2.48E+00 100 0 61 9 0 0 0 7 6 15 0Ethanol 6.02E-04 1.54E-04 100 0 0 95 0 0 5 0 0 0 0Formaldehyde 2.45E-01 6.28E-02 100 87 10 2 0 0 0 0 0 0 0HAPS 3.06E-01 7.83E-02 100 100 0 0 0 0 0 0 0 0 0Hydrogen chloride 4.10E-02 1.05E-02 100 0 12 18 0 0 1 0 0 0 0Iron 2.32E-03 5.95E-04 100 0 65 15 0 0 1 0 0 20 0Lead 6.87E-04 1.76E-04 100 0 60 18 0 0 1 0 0 18 0Limonene 1.09E-03 2.78E-04 100 0 100 0 0 0 0 0 0 0 0Manganese 4.06E-03 1.04E-03 100 0 76 0 0 0 0 0 0 23 0Mercury 1.66E-05 4.25E-06 100 0 13 16 0 0 1 0 1 0 0Methane 3.39E+00 8.70E-01 100 0 16 34 0 0 1 0 21 0 0Methanol 1.90E-01 4.86E-02 100 51 12 37 0 0 0 0 0 0 0Naphthalene 1.07E-03 2.74E-04 100 0 76 0 0 0 0 0 0 23 0Nickel 1.80E-03 4.60E-04 100 0 12 74 0 0 3 0 0 3 0Nitrogen oxides 7.38E+00 1.89E+00 100 0 36 19 0 0 1 9 11 2 0NMVOC, non-methane 4.48E+00 1.15E+00 100 0 21 41 0 0 1 6 22 0 0NOx 1.03E-03 2.63E-04 100 0 100 0 0 0 0 0 0 0 0Organic substances, unspecified 6.36E-01 1.63E-01 100 0 36 7 0 0 0 53 0 3 0Particulates 1.14E+00 2.92E-01 100 73 27 0 0 0 0 0 0 0 0Particulates, < 10 um 1.73E+00 4.43E-01 100 8 77 3 0 0 0 5 1 0 0Particulates, unspecified 5.70E-01 1.46E-01 100 0 14 14 0 0 1 1 1 0 0Phenol 3.62E-02 9.27E-03 100 50 50 0 0 0 0 0 0 0 0Potassium 3.47E-01 8.90E-02 100 0 76 0 0 0 0 0 0 24 0Sodium 9.52E-03 2.44E-03 100 0 64 15 0 0 1 0 0 20 0Sulfur oxides 1.63E+01 4.17E+00 100 0 17 36 0 0 1 1 23 0 0Toluene 1.22E-03 3.12E-04 100 0 0 95 0 0 5 0 0 0 0VOC, volatile organic compounds 2.33E+00 5.97E-01 100 59 41 0 0 0 0 0 0 0 0Zinc 2.06E-03 5.28E-04 100 0 73 5 0 0 0 0 0 22 0
Boiler and dryer fuel

49
Boiler and dryer fuel
Total PB Process Wood furnish UF resin Catyalst Wax Urea scav. Transport Nat. gas Wood fuel DFO Emissions to Water lb/MSF kg/m3 % % % % % % % % % % %Aluminum 2.37E-03 6.08E-04 100 0 0 80 0 18 2 0 0 0 0Ammonia 8.04E-04 2.06E-04 100 0 20 27 0 0 1 5 14 0 0Ammonium, ion 7.33E-02 1.88E-02 100 0 0 95 0 0 5 0 0 0 0BOD5, Biological O0ygen Demand 4.82E-02 1.23E-02 100 0 8 74 0 1 1 1 12 0 0Calcium, ion 1.81E-02 4.64E-03 100 0 0 93 0 3 3 0 0 0 0Chloride 9.35E-01 2.40E-01 100 0 17 44 0 0 1 0 28 0 0Chromium 9.06E-04 2.32E-04 100 0 19 42 0 0 1 0 29 0 0COD, Chemical Oxygen Demand 3.19E-01 8.17E-02 100 0 15 50 0 1 1 1 25 0 0DOC, Dissolved Organic Carbon 3.70E-02 9.49E-03 100 0 0 98 0 1 1 0 0 0 0Fluoride 4.03E-02 1.03E-02 100 0 98 0 0 0 0 0 0 0 0Formaldehyde 1.27E-02 3.24E-03 100 0 0 100 0 0 0 0 0 0 0Iron 2.90E-02 7.44E-03 100 0 14 12 0 0 0 0 0 0 0Magnesium 5.85E-04 1.50E-04 100 0 0 73 0 24 3 0 0 0 0Metallic ions, unspecified 3.02E-03 7.73E-04 100 0 27 45 0 0 2 17 1 0 0Methanol 3.80E-03 9.73E-04 100 0 0 100 0 0 0 0 0 0 0Nitrogen 2.47E-02 6.34E-03 100 0 0 95 0 0 5 0 0 0 0Nitrogen, organic bound 4.00E-04 1.03E-04 100 0 0 96 0 0 4 0 0 0 0Oils, unspecified 3.47E-01 8.90E-02 100 0 17 43 0 0 1 1 29 0 0Organic substances, unspecified 5.96E-02 1.53E-02 100 0 17 41 0 0 1 0 28 0 0Phenol 1.28E-03 3.28E-04 100 0 0 99 0 0 0 0 0 0 0Phosphate 3.23E-02 8.28E-03 100 0 93 1 0 0 0 0 0 0 0Silicon 1.47E-01 3.76E-02 100 0 0 96 0 0 4 0 0 0 0Solids, inorganic 6.80E-04 1.74E-04 100 0 0 98 0 0 2 0 0 0 0Solved solids 1.96E+01 5.02E+00 100 0 17 42 0 0 1 1 29 0 0Sulfate 8.36E-01 2.14E-01 100 0 16 41 0 0 1 0 24 0 0Sulfuric acid 5.13E-03 1.31E-03 100 0 13 13 0 0 0 0 1 0 0suspended solids 3.99E-02 1.02E-02 100 100 0 0 0 0 0 0 0 0 0Suspended solids, unspecified 5.98E-01 1.53E-01 100 0 16 20 0 0 1 0 17 0 0TOC, Total Organic Carbon 3.70E-02 9.49E-03 100 0 0 98 0 1 1 0 0 0 0Zinc, ion 3.95E-04 1.01E-04 100 0 16 48 0 4 1 0 23 0 0
Emissions to landBoiler fly ash 3.99E-01 1.02E-01 100 100 0 0 0 0 0 0 0 0 0Wood waste 1.55E+00 3.97E-01 100 100 0 0 0 0 0 0 0 0 0
WastePackaging waste, paper and board 8.82E-01 2.26E-01 100 0 100 0 0 0 0 0 0 0 0Waste, inorganic 1.69E+00 4.34E-01 100 0 100 0 0 0 0 0 0 0 0Waste, solid 1.61E+02 4.13E+01 100 0 31 17 0 0 0 0 7 0 0Wood waste 4.95E-01 1.27E-01 100 0 100 0 0 0 0 0 0 0 0