particle number size distributions in urban air before and after volatilisation
TRANSCRIPT

Atmos. Chem. Phys., 10, 4643–4660, 2010www.atmos-chem-phys.net/10/4643/2010/doi:10.5194/acp-10-4643-2010© Author(s) 2010. CC Attribution 3.0 License.
AtmosphericChemistry
and Physics
Particle number size distributions in urban air before and aftervolatilisation
W. Birmili 1, K. Heinke1,2, M. Pitz3,4, J. Matschullat2, A. Wiedensohler1, J. Cyrys3,4, H.-E. Wichmann3, and A. Peters3
1Leibniz Institute for Tropospheric Research (IfT), Permoserstrasse 15, 04318 Leipzig, Germany2Interdisciplinary Environmental Research Centre (IOZ), TU Bergakademie Freiberg, 09599 Freiberg, Germany3Helmholtz Zentrum Munchen (HMGU), German Research Center for Environment Health, Institute of Epidemiology,85758 Neuherberg/Munich, Germany4University of Augsburg, Center for Science and Environment, 86159 Augsburg, Germany
Received: 25 February 2009 – Published in Atmos. Chem. Phys. Discuss.: 7 April 2009Revised: 12 May 2010 – Accepted: 14 May 2010 – Published: 21 May 2010
Abstract. Aerosol particle number size distributions (sizerange 0.003–10 µm) in the urban atmosphere of Augsburg(Germany) were examined with respect to the governing an-thropogenic sources and meteorological factors. The two-year average particle number concentration between Novem-ber 2004 and November 2006 was 12 200 cm−3, i.e. similarto previous observations in other European cities. A seasonalanalysis yielded twice the total particle number concentra-tions in winter as compared to summer as consequence ofmore frequent inversion situations and enhanced particulateemissions. The diurnal variations of particle number wereshaped by a remarkable maximum in the morning during thepeak traffic hours. After a mid-day decrease along with theonset of vertical mixing, an evening concentration maximumcould frequently be observed, suggesting a re-stratificationof the urban atmosphere. Overall, the mixed layer heightturned out to be the most influential meteorological param-eter on the particle size distribution. Its influence was evengreater than that of the geographical origin of the prevailingsynoptic-scale air mass.
Size distributions below 0.8 µm were also measured down-stream of a thermodenuder (temperature: 300◦C), allowingto retrieve the volume concentration of non-volatile com-pounds. The balance of particle number upstream and down-stream of the thermodenuder suggests that practically allparticles>12 nm contain a non-volatile core while addi-tional nucleation of particles smaller than 6 nm could be ob-
Correspondence to:W. Birmili([email protected])
served after the thermodenuder as an interfering artifact ofthe method. The good correlation between the non-volatilevolume concentration and an independent measurement ofthe aerosol absorption coefficient (R2
=0.9) suggests a closecorrespondence of the refractory and light-absorbing particlefractions. Using the “summation method”, an average di-ameter ratio of particles before and after volatilisation couldbe determined as a function of particle size. The results in-dicated that particles>60 nm contain a significantly higherfraction of non-volatile compounds, most likely black car-bon, than particles<60 nm. The results are relevant for fu-ture health-related studies in that they explore the size distri-bution and time-dependent behaviour of the refractory com-ponent of the urban aerosol over an extended time period.
1 Introduction
Atmospheric particles (particulate matter, PM), particularlysuch of anthropogenic origin, have been associated with ad-verse health effects in humans (e.g.,Pope and Dockery,2006; WHO, 2004, 2006). To reduce the number of pre-mature deaths and disease caused by particulate air pollu-tion, legal limit values have been implemented in the Euro-pean Union, thus regulating the total mass concentration ofparticles with diameter less than 10 µm (EC, 1999). How-ever, the health risk due to environmental particle exposureis probably not an effect of total particle mass but more likelyof a combination of specific, more toxic sub-fractions (HEI,2002; Sioutas et al., 2005). Identification of the more haz-ardous sub-fractions of the aerosol would permit abatement
Published by Copernicus Publications on behalf of the European Geosciences Union.

4644 W. Birmili et al.: Size distributions before and after volatilisation
measures that are beneficial for public health. Legal mea-sures to reduce ambient PM levels could be designed morecost-effectively if they were targetted on the abatement ofspecific particle types rather than the total PM mass.
Several particle types have been proposed to be associatedwith adverse health effects. Ultrafine particles (UFPs, di-ameter<100 nm), for example, have been suggested to actmore toxically after inhalation than bigger particles (Wich-mann and Peters, 2000; von Klot et al., 2005; Oberdorsteret al., 2005). Due to their small size, UFPs can penetratemore deeply into the alveolar region, and also contain ahigher mass-specific particle surface area, which is the inter-face where particles interact with the human organism. Otherlines of argument have pointed to the overwhelming carbona-ceous character of atmospheric UFPs: Insoluble UFPs, suchas originating from anthropogenic high-temperature combus-tion, have a high possibility to deposit in alveolar spacesand subsequently translocate into their interstitial spaces andlater to other organ systems (Moller et al., 2008). A linkto respiratory and cardiovascular disease has been suggested(Kreyling and Scheuch, 2000; Schwarze et al., 2006). Otherreported risk factors are related to the biological surface re-activity, as well as specific (bio-)chemical compounds as dis-tinct as transition metals and endotoxins. Concluding fromthe above discussion, a more specific physical and chemi-cal aerosol characterisation would be desirable for both, spe-cialised health-related studies as well as government moni-toring networks.
One useful parameter is the particle number size distri-bution, from which various parameters such as the numberof ultrafine particles can be derived, and the particle sur-face area can be estimated. Long-term measurements ofambient particle size distributions have been scarce until re-cently, but the body of reports on such measurements is aug-menting. Ambient size distribution measurements have re-vealed that the engine exhaust of motor vehicles releasesenormous numbers of particles into the vicinity of urbanroads (Hitchins et al., 2000; Wehner et al., 2002a; Charronand Harrison, 2003; Ketzel et al., 2003; Zhu et al., 2004;Voigtlander et al., 2006) or motorways (Zhu et al., 2004;Rosenbohm et al., 2005; Imhof et al., 2005; Birmili et al.,2009a). In cities where motor traffic is the dominating sourceof anthropogenic particles, the particle size distribution at ur-ban background sites shows an attenuated image of the dailytraffic cycle (Ebelt et al., 2001; Kreyling et al., 2003; Wehnerand Wiedensohler, 2003; van Dingenen et al., 2004; Hus-sein et al., 2004; Ketzel et al., 2004; Aalto et al., 2005). Inthe presence of solar radiation, the total particle number inurban areas is also influenced by photochemically-inducedsecondary formation (Kulmala et al., 2004; Costabile et al.,2009).
Volatility analysis has been developed as a technique todiscriminate classes of chemical compounds in airborne par-ticles by their different degree of volatility. Previous re-search has been particularly directed towards differentiating
between, for instance, sulphuric acid, neutralised sulphate,sodium chloride, and elemental carbon (Clarke, 1991; Smithand O’Dowd, 1996; Kreidenweis et al., 1998; Schmid et al.,2002). Thermodenuders are widely used as conditioning de-vices in which volatile compounds are stripped off the parti-cles while these remain airborne (Burtscher et al., 2001). Re-cently, the design of thermodenuders has been improved withrespect to efficient vapour removal (Wehner et al., 2002b;Fierz et al., 2007), short transit time (An et al., 2007), andrapid response towards temperature changes (Huffman et al.,2008).
In the polluted atmosphere, particulate emissions of dieselvehicles exhibit a soot particle mode with diameters around80 nm, and a smaller nucleation mode originating from re-condensation of unburnt fuels (Ntziachristos et al., 2004).While the diesel soot mode is rather non-volatile at tempera-tures of 300◦C, the condensation mode is composed mainlyof long-chained organics volatile above 100◦C (Sakuraiet al., 2003). Measurements with volatility analysers (Philip-pin et al., 2004; Rose et al., 2006) or thermodenuders inconjunction with particle mobility spectrometers (Hasegawaet al., 2004) have confirmed the ubiquity of traffic-derivedsoot particles in the proximity of highly trafficked roads. In astreet canyon in Leipzig, for example, the number fraction ofexternally mixed soot particles was concluded to amount to60% compared to 6% at a rural reference station (Rose et al.,2006). Besides, thermodenuder/mobility spectrometer com-binations have also been used to examine nucleation modeparticles evolving from photochemically-induced secondaryformation (Wehner et al., 2005; Ehn et al., 2007). The latterworks suggested that even freshly nucleated particles duringto photochemical processes contain a core that is non-volatileat 300◦C.
The aim of this work was to quantify and discuss particlenumber size distributions and their non-volatile componentsin the city of Augsburg, southern Germany. Particular inter-est in Augsburg derives from the interdisciplinary researchplatform KORA (Kooperative Gesundheitsforschung in derRegion Augsburg– cooperative health research in the Augs-burg region), which was established as early as 1984 (Holleet al., 2005). A comprehensive body of epidemiological stud-ies within KORA has suggested a link between air pollutionand cardiovascular diseases, but also revealed the need of amore detailed characterization of air pollutants, notably thephysical and chemical properties of airborne particles andtheir temporal variability (Peters et al., 2005; von Klot et al.,2005). Within KORA, particular efforts are directed towardsidentifying the health-relevant sub-fractions in the ambientaerosol.
This study aims at establishing the basic characteristicsof long-term particle size distribution observations (0.003–10 µm) in Augsburg, with emphasis on the non-volatile com-ponents measured downstream of a thermodenuder. In thesub-µm range, the non-volatile fraction has broadly been as-sociated with black carbon, although other particle types,
Atmos. Chem. Phys., 10, 4643–4660, 2010 www.atmos-chem-phys.net/10/4643/2010/

W. Birmili et al.: Size distributions before and after volatilisation 4645
such as mineral dust or biological particles are admitted tocontribute to the non-volatile fraction as well. Using lo-cal meteorological parameters as well as back trajectory cal-culations, the study provides an assessment of the climato-logically relevant processes that control the environmentalaerosol in Augsburg.
2 Experimental
2.1 Sampling site
In November 2004, the Helmholtz Zentrum Munchen(HMGU) started particle number size distribution measure-ments at an urban background monitoring station in Augs-burg. The HMGU monitoring station is located at an urbanbackground setting on premises of Augsburg’s Universityof Applied Sciences (Fachhochschule Augsburg) (48◦ 22′ N;10◦ 54′ E). The station is located about 1 km south of Augs-burg’s city centre with the nearest street being about 100 mnorth-east of the site (Fig.1). Spatially resolved measure-ments of total particle number suggested this site of beingrepresentative of urban background conditions (Cyrys et al.,2008). Additional details of the site have been reported byPitz et al.(2008a). The HMGU station is also a member ofthe German Ultrafine Aerosol Network (GUAN), designedat monitoring health-related properties of the environmentalaerosol in Germany (Birmili et al., 2009b).
2.2 Instrumentation
Particle number size distributions in a diameter (Dp) range3–800 nm were measured using a flow-regulated twin differ-ential mobility particle sizer (TDMPS). This instrument isbased on two differential mobility analysers covering com-plementary size ranges (Birmili et al., 1999). Briefly, thefirst subsystem combines an ultrafine Vienna-type differen-tial mobility analyzer (electrode length 11 cm) with an ultra-fine condensation particle counter (UCPC model 3025, TSIInc., Shoreview (MN), USA) to measure particles across arange from 3 to 23 nm. The second subsystem combines an-other differential mobility analyzer (electrode length 28 cm)with a condensation particle counter (CPC model 3010, TSIInc.) to measure particles between 18 and 800 nm. Thesheath air is circulated in a closed loop, at relative humidi-ties ranging mostly between 10 and 30%.
Upstream of the TDMPS, a thermodenuder (TD) was de-ployed as an option to remove volatile aerosol components.Our TD follows the design ofWehner et al.(2002b). Volatileparticle material is evaporated at a temperature of 300◦C,and subsequently removed with the assistance of active car-bon in a cooling section. The temperature of 300◦C wasselected with the aim of evaporating the overwhelming frac-tion of inorganic ions – particularly ammonium sulfate andnitrate, although not sodium chloride as well as most organic
Fig. 1. Regional map of Augsburg, Germany, including the detailedsurroundings of the HMGU monitoring station. The lower insetillustrates the concurrent measurement of TDMPS and APS sizedistributions with the option of using a thermodenuder upstreamthe TDMPS.
carbon from the particle phase1. On the other hand, 300◦Cis a temperature at which charring2 of organic compounds isavoided.
The standard operation procedure for the TDMPS was torecord size distributions upstream and downstream of theTD in alternating sampling intervals of 10 min (cf. inset inFig. 1). This procedure provided a steady flow of size dis-tributions both with and without the TD, and an overall timeresolution of 20 min for each of these measurement modes.Before further data analysis, the size distribution data wasaveraged to hourly values.
In the TD, the aerosol sample is subject to enhanced parti-cle losses. One can think of, e.g., diffusional as well as ther-mophoretic losses, which are both a function of particle size.Prior to the field experiment, these particle losses were quan-tified in the laboratory using spherical silver particles (solidat 300◦C), and by measuring the particle counts upstreamand downstream of the TD. The penetration of solid particlesthrough the heated thermodenuder was about 0.34 at 3 nm,0.66 at 10 nm and 0.85 for particles bigger than 100 nm. AllTD number size distributions shown in this work were cor-rected for these particle losses.
Occasionally, extreme concentrations of particles with di-ameters less than 6 nm were observed downstream of theTD, which were identified as the re-nucleation of gas-phasespecies in the cooling section of the TD due to incomplete re-
1Ammonium nitrate and ammonium sulphate are reported tohave volatilisation temperatures of ca. 75 and 202◦C, respectively(Pinnick et al., 1987; Johnson et al., 2004). Engler et al.(2007)(Table 1) provides a brief overview of known volatilisation temper-atures.
2Charring is the incomplete combustion of (oxygenated) hydro-carbons removing hydrogen and oxygen, and leaving pure carbon.
www.atmos-chem-phys.net/10/4643/2010/ Atmos. Chem. Phys., 10, 4643–4660, 2010

4646 W. Birmili et al.: Size distributions before and after volatilisation
moval of volatilized material. This operational artifact couldnot be completely eliminated. Figure2 gives an illustrationof its effect on total particle number concentration. In somecases, the total particle number concentration downstreamof the TD may largely exceed the concentration upstream.When ignoring size channels below 7 nm, however, the par-ticle number balance across the thermodenuder becomes ap-proximately unity. The nucleation effect disappears com-pletely when truncating the distribution downstream of theTD at 10 nm.
The instrumentation also contains an aerodynamic parti-cle sizer (APS model 3321, TSI Inc.) which measures aero-dynamic size distributions of ambient particles between 0.8and 10 µm. We refrained from connecting the APS to the TDbecause of the considerable length of tubing associated withthe thermodenuder; this would lead to considerable samplinglosses of the super-µm particles. Additional measurementsinvolve gravimetric PM2.5 and PM10 mass concentrationsusing a tapered element oscillating microbalances (TEOM)equipped with a filter dynamics measurement system.
Mass concentrations of black carbon (BC) were deter-mined using an aethalometer (Type 8100, Thermo FisherScientific Inc.). The aethalometer converts light attenuationthrough a particle-laden quartz fiber filter into BC mass con-centration using the experimentally determined specific at-tenuation cross-section of 16.6 m2 g−1 at a wavelength of880 nm. To validate the aethalometer’s performance, wecompared the instrument in Augsburg during one month (9September–8 October 2008) against a high quality referenceinstrument, the multi-angle absorption photometer (MAAP;seePetzold and Schonlinner, 2004; Petzold et al., 2005). Theintercomparison suggested that the aethalometer values arebiased by a value around+0.3 µg m−3 at the zero end, whilethe mean concentration during the period was matched ratherprecisely (MAAP: 1.89 µg m−3, aethalometer: 1.87 µg m−3).The exact relation to determine standardised (i.e. MAAP-based) black carbon concentrations from the aethalometer isas follows:
BCMAAP = 1.111·BCaeth−0.18 (1)
For aethalometer concentrations below 1.36 µg m−3, asquared fit represents the data more accurately:
BCMAAP = −0.033·BC2aeth+1.335·BCaeth−0.43 (2)
Both fits show a high measure of determinaton (R2) of 0.96.Finally, wind speed, wind direction, temperature, and rela-
tive humidity were collected continuously at the HMGU sta-tion, and at FH Augsburg’s meteorological roof-top station20 m above ground and distant at about 0.5 km. While thewinds at the HMGU station tend to be influenced by the sur-rounding buildings, the winds at the roof-top station are con-sidered representative for the entire urban area.
307 400 500 600 700 800 900 10000.3
1
10
100 3.0 nm/6.0 nm 7.0 nm/14 nm 10 nm/20 nm
Rat
io N
(with
TD
) / N
(with
out T
D)
Days (after 01/01/2004)
Fig. 2. Ratio between the total particle number concentrations up-stream and downstream the thermodenuder. The labels indicate thepairs of lower threshold diameters that were applied to the non-conditioned and conditioned size distributions, respectively, beforecomputing the integral number concentration. Time is coded in daysafter 01 January 2004. Plotted is every fifth daily average value ofthe measurement campaign.
2.3 Size distribution evaluation
TDMPS size distributions were evaluated according to thedetailed description given byPitz et al. (2008b). Briefly,the branches of both differential mobility analyser subsys-tems were assimilated into a single mobility distribution en-compassing 3–800 nm. The mobility distributions were con-verted into size distributions using a multiple charge inver-sion, taking into account experimentally determined CPCand DMA transfer functions. Diffusional particle losses inthe heated TD were corrected by a transmission function ob-tained from a laboratory calibration with silver particles be-tween 3 and 50 nm in size. TDMPS and APS size distribu-tions were combined into a single size distribution between3 and 10 000 nm assuming an effective density of 1.7 g cm−3
for the conversion of aerodynamic into mobility diameters.Pitz et al.(2008b) obtained this particular value by match-ing TDMPS and APS size distributions in the overlap regionbetween 800–900 nm in mobility diameter. Moreover, thevalue is within the uncertainty range of the effective densitythat reconciles TDMPS/APS volume size distributions with agravimetric PM2.5 measurement (1.5–1.8 g cm−3; Pitz et al.,2008a).
2.4 Autocorrelation analysis
The time fluctuations of the size distribution data were ex-amined by auto-correlation analysis. Auto-correlation is thecross-correlation of a time-dependent signal with itself, andallows to identify periodical patterns that may, at first glance,
Atmos. Chem. Phys., 10, 4643–4660, 2010 www.atmos-chem-phys.net/10/4643/2010/

W. Birmili et al.: Size distributions before and after volatilisation 4647
be obscured by other confounding variables. The auto-correlation of environmental time series has been analysed toconclude on the time scales of variation of meteorological pa-rameters (Wigley et al., 1998), but also tropospheric aerosolsin marine (Heintzenberg et al., 2004), continental (SunderRaman et al., 2008), and urban (Wehner and Wiedensohler,2003) observation sites.
The auto-correlation function (ACF) was calculated as
rxx(τ ) =1
n
n∑t=0
x(t) ·x(t +τ), (3)
with x(t) being the standardised time series (zero mean, unitstandard deviation) of particle number concentration.
2.5 Diameter shrinking factors
To relate the size distributions obtained with and without ap-plication of the TD, the summation method (SM) was used.The method was developed to quantify size-segregated diam-eter changes in particle size distributions caused by humidi-fication (Birmili et al., 2009c), or thermodesorption (Engleret al., 2007). The SM assumes that the particle number sizedistribution is rearranged as a result of the aerosol condition-ing. It associates segments of equal particle number con-centration under the conditioned and non-conditioned sizedistributions – beginning at their upper tail, and continuingdownwards. The ratio between the mean diameters of twocorresponding particle number segments is the particle di-ameter shrinking factor (SF), concretely the fraction of theiroriginal diameter onto which particles collapse after passagethrough the TD. A detailed account on the numerical proce-dure is given inBirmili et al. (2009c).
An important prerequisite of the SM is that the total par-ticle number is conserved during aerosol conditioning. Fig-ure 2 shows the ratio between the respective experimentalparticle number concentrations downstream and upstreamthe thermodenuder. It is noteworthy that at certain times, newparticles are observed to nucleate at the exit of the thermode-nuder due to the cooling of vapours that have not been com-pletely absorbed by the tube walls. This leads to ratios in thenumber concentration downstream/upstream the TD biggerthan 1. This effect, which was found at a rural observationsite as well during an earlier experiment (Fig. 4 inEngleret al., 2007), can lead to an overestimation of this numberconcentration ratio up to 100.
To estimate the error induced by post-thermodenuder nu-cleation, different pairs of lower cut-off diameters (3 and6 nm, 7 and 14 nm, and 10 and 20 nm) were used to evalu-ate the sensitivity of this ratio on wether ignoring or not thelowest size channels, i.e. those actually affected by nucle-ation. Figure2 suggests that total particle number concen-tration across the thermodenuder in Augsburg is conservedwithin the accuracy of measurement, as long as only uncon-ditioned particles>20 nm are considered.
A second prerequisite of the SM is that the external mix-ture of the sampled aerosol varies only slowly with particlediameter. A suitable tool for the verification of this prerequi-site is the volatility tandem analyser method (e.g.,Rose et al.,2006). In (Engler et al., 2007) we were able to establish thatthe diameter shrinking factors obtained by the SM indeedcorrespond to the shrinking behaviour of monodisperse par-ticle populations selected by a volatility tandem analyser.
Limitations of the SM arise due to limited counting statis-tics at the upper tail of the size distribution, and due to thepossibly incomplete recovery of particle losses occurring inthe TD. As a consequence of both experiences, we limitedthe output range of the shrinking factors (SFs) to 30–300 nm.Additional uncertainly derives from the non-simultaneity ofthe conditioned and non-conditioned size distribution mea-surements. This uncertainly was alleviated by first, using aspherical buffer volume (a 20 l glass bulb) in the aerosol inletsystem and second, by averaging size distributions to hourlyvalues before applying the SM. It needs to be admitted thatthe buffer volume in the sampling caused additional particlelosses. The particle penetration through the Augsburg buffervolume was not measured directly – only with a comparabledevice in the laboratory. The particle penetration was 0.45 at10 nm, 0.93 at 54 nm and roughly unity at particle diametersbigger than 100 nm. Due to the uncertainty in determiningthe losses, we refrained from applying these corrections tothe measurement data.
2.6 Determination of the mixed layer height
The mixed layer height (MLH) is the most important sin-gle meteorological parameter describing vertical air ex-change and pollutant dispersal (Stull, 1988). For an es-timate of the MLH we evaluated the nearest regular ra-diosounding data, recorded daily at 13:00 local time at Mu-nich/Oberschleissheim (50 km east of Augsburg). The MLHwas derived from the pseudopotential temperature using thesimple parcel method (Holzworth, 1964). The aerosol datain Augsburg were aggregated to a daily average covering theperiod between 12:00 and 18:00 LT, which captures essen-tially the daily minimum in Aitken and accumulation particleconcentrations (cf. Fig.5b–e below).
2.7 Back trajectory cluster analysis
A k-means cluster analysis combining 3d-back trajectoriesand vertical temperature profiles was applied to the entiredataset in close analogy to the work ofEngler et al.(2007).The inclusion of vertical potential temperature profiles intothe cluster analysis proved vital in understanding the rea-sons for high and low levels of particle number in Augs-burg. The cluster algorithm divided the dataset into a pre-determined number of 13 trajectory clusters. 6-day back tra-jectories were calculated for each day 13:00 UTC using theHYSPLIT model on the NOAA AR Ready Website (Draxler
www.atmos-chem-phys.net/10/4643/2010/ Atmos. Chem. Phys., 10, 4643–4660, 2010

4648 W. Birmili et al.: Size distributions before and after volatilisation
3 10 100 1000 8000101
102
103
104
dV/d
log
Dp ,
µm3 c
m-3
dN/d
log
Dp ,
cm-3
Dp , nm
10-1
100
101
upstream of TD downstream of TD
Volume
Number
Fig. 3. Median number and volume size distributions of ambient(TDMPS/APS) and non-volatile (TDMPS with TD) particle con-centrations in Augsburg between November 2004 and November2006. Volume size distributions were calculated assuming spheri-cal particles. Dashed lines mark the location of the two particlesmodes in the non-volatile distribution.
and Hess, 2004). Particle size distributions were averagedover the time interval 12:00–18:00 LT. According to the min-imum concentrations observed in Fig.5 below, that periodrepresents best a homogeneously mixed boundary layer.
3 Results and discussion
3.1 Non-conditioned particle data
3.1.1 Number concentrations and size distributions
Figure3 illustrates the median number and volume distribu-tions in Augsburg for the entire 2-year period. The numberdistribution of particles upstream of the thermodenuder (TD)features a single maximum in the Aitken mode (∼40 nm),while the volume size distribution shows two peaks that markthe accumulation and coarse particle modes. The latter twomodes are separated by a clear minimum around 1 µm. Thepassage through the TD modifies both distributions, and isdiscussed in detail in Sect.3.2below.
For a more accessible version of the data, the size distri-butions were integrated over six diameter intervals (see Ta-ble 1). It is worth noting that the boundaries of integration(3, 10, 30, 300, 800, 2000, 10 000 nm) were chosen so thatparticle populations of a maximum statistical independencewere generated (cf. auto-correlation analysis below).
The mean particle number concentration in Augsburg was12 000 cm−3 for the size range 3–10 000 nm and the bi-ennial period (sum ofµ in Table 1), with the size inter-val 30–300 nm encompassing the majority of total parti-cle number (7600 cm−3). The observed numbers are com-parable with former observations of total particle num-ber in Augsburg (Aalto et al., 2005), and range in the
307 400 500 600 700 800 900 10000.00
0.25
0.50
0.75
1.00
1.25
1.50
1.75
2.00
2.25
01/01/2005 01/01/2006num
ber c
once
ntra
tion
(nor
mal
ized
to u
nity
)
Days (after 01/01/2004)
7 nm 30 nm 80 nm 275 nm 600 nm 2000 nm
-5
0
5
10
15
20
25
tem
pera
ture
in °
C
temperature
Fig. 4. Time series of particle number concentration (30-day run-ning median values) over the entire two-year period. Shown arethe particle concentrations at discrete particle diameters, each nor-malised to an average of unity. Time is coded in days after 01 Jan-uary 2004. The thin line indicates ambient temperature (30-day run-ning median).
lower scale of worldwide urban background observations(5000–50 000 cm−3). We particularly took note of the long-term observations (i.e. covering more than one year) re-ported for Alkmaar and Erfurt (both 18 000 cm−3; Ruuska-nen et al., 2001), Helsinki (16 000 cm−3; Ruuskanen et al.,2001), Leipzig (16 000 cm−3; Wehner and Wiedensohler,2003), Copenhagen (7000 and 24 000 cm−3; Ketzel et al.,2004), Pittsburgh (22 000 cm−3; Stanier et al., 2004), Atlanta(21 000 cm−3; Woo et al., 2001), and Beijing (33 000 cm−3;Wehner et al., 2008).
3.1.2 Annual cycle
Annual cycles of environmental parameters are helpful toidentify possible seasonal changes, such as related to tem-perature, humidity, and also the activity of natural and an-thropgenic particle sources. Figure4 presents particle num-ber concentrations for six discrete particle diameters (7, 30,80, 275, 600, and 2000 nm). Similarly to Sect.3.1.1the di-ameters were selected so that statistically independent parti-cle populations are represented. In addition, the time serieswere normalized to an average of unity, and smoothed by arunning 30-day median.
Figure 4 highlights the occurrence of high number con-centrations during enduring periods with cold ambient tem-peratures. A closer look at the time series – shown in de-tail in Fig. 15 in the appendix, revealed that the high parti-cle concentrations were associated with several cold periods,where temperatures fell particularly low. These were, in de-tail, 16–19 January, 2005 (day 381–384): minimum tempera-ture−7.8◦C; 28–31 January 2005 (day 393–396):−12.2◦C;5–9 February 2005 (day 401–405):−11.7◦C; 22–28 Febru-ary 2005 (day 418–424):−11.9◦C; 3–5 March 2005 (day
Atmos. Chem. Phys., 10, 4643–4660, 2010 www.atmos-chem-phys.net/10/4643/2010/

W. Birmili et al.: Size distributions before and after volatilisation 4649
Table 1. Particle number concentrations in Augsburg for specific particle size intervals.µ indicates the arithmetic mean,σ the standarddeviation,σµ the standard deviation of the mean, andpk thekth percentile of the concentration in the corresponding size interval.
Dp range µ σµ σ p1 p5 p25 p50 p75 p95 p99
3–10 nm 790 19 1300 74 140 310 530 870 1900 630010–30 nm 3700 46 3000 530 850 1700 2900 4700 9300 1500030–300 nm 7600 96 6300 1300 2100 3800 5900 9400 19000 30000300–800 nm 150 3 170 930 17 4700 100 200 430 850800–2000 nm 2 0.04 3 0.12 0.27 0.65 1 2 7 15002000–10 000 nm 0.16 0.01 0.13 0.01 0.03 0.07 0.12 0.20 0.39 0.65
427–429): −12.5◦C; 10–16 January 2006 (day 740–746):−10.4◦C; 23 January–2 February 2006 (day 753–765):−12.4◦C. It is mainly these episodes which lead to a substan-tial difference in average total particle number between win-ter (December–February; 15 000 cm−3) and summer (June,July, August; 10 000 cm−3).
The enhanced concentrations in winter are attributed totwo effects: additional particulate emissions from domesticheating and power generation and second, less pronouncedvertical mixing of the atmosphere. Both effects are partic-ularly the consequence of very cold temperatures. Such anannual cycle is not unusual but has been observed in otherurban size distribution data sets in the Northern Hemispherebefore (Wichmann et al., 2002; Wehner and Wiedensohler,2003; Hussein et al., 2004; Aalto et al., 2005).
We observed that the concentrations of 7 nm particlesshowed a similar annual cycle as the rest of the sub-µm par-ticles. Atmospheric particle formation events as a result ofphotochemical processes were only rarely observed in Augs-burg, even during the warm season. Thus, the new particleformation events have no significance for the annual cycle inFig. 4.
In much contrast to the 7 nm particles, coarse particles at2000 nm show a concentration maximum in summer, withconcentration being higher by approximately 50% comparedto winter. In Fig.4 there is a positive correlation betweencoarse particle concentrations and temperature (R2
=0.5).These observations suggest an increased probability of parti-cle re-suspension from agricultural lands and roads under therather dry conditions in summer.
3.1.3 Diurnal cycle
Figure5 gives diurnal cycles of the particle number concen-trations at the six previously selected diameters. The data aredistinguished between weekdays (Monday–Thursday), Sat-urdays and Sundays. At all particle diameters the concen-trations reveal a maximum during the morning peak trafficperiod (06:00–09:00 LT). Its occurrence in all particle diame-ters suggests a broad impact of traffic emissions on the entireparticle size spectrum. The relative magnitude of this morn-ing peak is the greatest for the lowest particle diameters 7, 30
and 80 nm. While the latter particle diameters are in particu-lar indicative of exhaust emissions, coarse particles – repre-sented by the 2000 nm diameter in Fig.5f, have rather beenassociated with direct sources due to abrasion and vehicle-induced re-suspension (Thorpe and Harrison, 2008).
The particle concentrations at all diameters decreasedsteadily as of 08:00 towards noon. This re-occurring featureis ascribed to the dilution of the emitted pollutants in an in-creasingly well-mixed boundary layer rather than changes intraffic density, the latter remaining rather constant throughoutthe daylight hours. The morning peak turns out considerablylower on Saturdays, and is entirely missing on Sundays as aresult of lower traffic densities at that time of day.
For the particle diameters 30, 80, 275 and 600 nm, con-centrations show a second maximum in the evening (20:00–24:00 LT) as well. We suspect that this second maximum isthe result of pollution trapping, since it coincides with thetime of re-stratification in the urban atmosphere rather thanany increase in traffic. The observations highlight the rel-evance of urban traffic emissions on the HMGU station inAugsburg, but similar to comparable observations at urbanbackground locations in German cities of comparable size(Wehner and Wiedensohler, 2003; Cyrys et al., 2003).
3.1.4 Auto-correlation analysis
Figure6 shows the auto-correlation function (ACF) for fiveselected size channels (10, 50, 120, 600, and 5000 nm). TheACF of 10 and 50 nm particles decreases rapidly with lagtime, indicating a low persistence of their concentrations inthe urban atmosphere. However, their concentrations ex-hibit a significant diurnal autocorrelation, manifested by lo-cal maxima in the ACF at multiples of 1 d. When passingover to larger particles, the diurnal autocorrelation becomesless significant, at the benefit of a slower decrease of the ACFwith the lag time, indicating a higher persistence of the con-centrations. The diurnal autocorrelation reappears as a sinu-soidal signal in the coarse particle mode (5000 nm), indicat-ing the activity of coarse particle sources on a diurnal scale.
The time variations were analysed more systematically bysplitting the ACF into different components by a least-squarefit. Four component functions were fitted:FA, a decreasing
www.atmos-chem-phys.net/10/4643/2010/ Atmos. Chem. Phys., 10, 4643–4660, 2010

4650 W. Birmili et al.: Size distributions before and after volatilisation
0 2 4 6 8 10 12 14 16 18 20 22 240
500
1000
1500
2000
2500
3000
3500
dN/d
log Dp ,
cm
-3dN
/dlo
g Dp ,
cm
-3
0 2 4 6 8 10 12 14 16 18 20 22 240
2000
4000
6000
8000
10000
12000
14000
16000
18000
0 2 4 6 8 10 12 14 16 18 20 22 240
1000
2000
3000
4000
5000
6000
7000
8000
Monday - Thursday Saturday Sunday
0 2 4 6 8 10 12 14 16 18 20 22 240
100
200
300
400
500
600
700
800d. 275 nm
hour of day0 2 4 6 8 10 12 14 16 18 20 22 24
0
5
10
15
20
25
30e. 600 nm
hour of day0 2 4 6 8 10 12 14 16 18 20 22 24
0.0
0.1
0.2
0.3
0.4
0.5f. 2000 nm
c. 80 nmb. 30 nma. 7 nm
hour of day
Fig. 5. Average diurnal cycle of particle number concentration at(a) 7 nm, (b) 30 nm,(c) 80 nm,(d) 275 nm,(e) 600 nm and(f) 2000 nm.The data cover the entire measurement campaign and are keyed after different periods of the week.
exponential curve representing the persistent (long-lasting)component;FB , a sinusoidal curve with period time 1 d rep-resenting the daily periodical component;FC , a sinusoidalcurve with period time 7 d representing the weekly periodicalcomponent;FD, an additional constant used for achieving abetter numerical fit. Figure7 shows the integrals values overFA, FB , andFC as a function of particle size.
As indicated in Fig.6 before, the persistent componentFA
was found to be dominant between 100 and 5000 nm, peak-ing at 600 nm. This confirms the accumulation mode andthe lower part of the coarse particle mode as the long-lastingaerosol components at the HMGU station in Augsburg: Theconcentrations in the size range 100–5000 nm change onlyslowly; they are determined by atmospheric processes last-ing a few days and longer.
The diurnal componentFB , in contrast, was dominant inthe size range<10 nm and showed non-negligible contri-butions>2000 nm. In the size range<10 nm, this pointsto daily variations of newly formed particles as a result ofphotochemical processes along with solar radiation, while inthe coarse mode it indicates the activity of abrasion and re-suspension sources. Finally, the weekly periodic componentFC shows a maximum at 20 nm and a minor maximum in thecoarse mode. The weekly component reflects, in any case,co-variations over 7 days and therefore represents the inten-sity of anthropogenic contributions.
0 1 2 3 4 5 6 7 8 9 10 11 12 13 14-0.1
0.0
0.1
0.2
0.3
0.4
0.5
0.6
0.7
0.8
0.9
1.0
auto
corr
elat
ion
func
tion
time lag in d
10 nm 50 nm 120 nm 600 nm 5000 nm
Fig. 6. Auto-correlation function of particle number concentrationat selected particle diameters.
Based on Figs.5 and7 we draw the following conclusions:Particles observed at the HGMU station in Augsburg in thesize range 10–30 nm seem to derive at high proportions fromvehicle exhaust. This derives from their sensitivity on the dayof the week, Fig.5b being representative of 30 nm particles,and the prevalence of the weekly, necessarily anthropogeniccomponent in the ACF (Fig.7). Particles smaller than 10 nm
Atmos. Chem. Phys., 10, 4643–4660, 2010 www.atmos-chem-phys.net/10/4643/2010/

W. Birmili et al.: Size distributions before and after volatilisation 4651
still originate from traffic in notable amounts (cf. morningmaximum in Fig.5a); however, an increasing influence onphotochemical secondary formation can be noticed with de-creasing diameter. A crucial indication, on the one hand, isthe relative increase of the mid-day levels of 7 nm particles(10:00–18:00 LT – partially attributed to photochemical par-ticle production) compared to those of 30 nm and 80 nm par-ticles (Fig.5a). On the other hand, the weekly periodicalcomponentFC in the ACP diminishes below 10 nm and fallsshort of the daily periodical componentFB . We are aware,however, that the methods used here do not permit a highlyquantitative assessment of the relative contributions of thedifferent sources to the observed particle concentrations.
Moving beyond the size range of particles<30 nm, parti-cle concentrations in the range 30–300 nm exhibit a signifi-cant influence of regional particulate emissions, while parti-cles between 300 and 800 nm, that show the least periodicalvariations (Fig.7), represent the long-range transported frac-tion of the aerosol. (The latter conclusion is not new, buthas been previously obtained for the Central European tro-posphere, for instance, by air mass analysis of particle sizedistributions,Birmili et al., 2001, or statistical multiple-siteanalysis,Costabile et al., 2009). Due to their increasing diur-nal variability (Figs.6 and7), particles in the intervals 0.8–2.0 µm and 2–10 µm are again assumed to originate regionaland local sources, such as direct vehicle emissions, vehicle-induced re-suspension, but also wind-blown dust.
3.2 Particle data after volatilisation at 300◦C
3.2.1 Number concentrations and size distributions
Passage through the thermodenuder (TD) modifies the parti-cle size distribution, notably shifting the size distribution tosmaller diameters (Fig.3). An essential result was that thatthe total particle number remained virtually unchanged afterpassage through the thermodenuder (Fig.2), i.e. it seems thatwithin the accuracy of the measurement, every particle has acore that is non-volatile at 300◦C. As expected, the effect ofthermal conditioning on the total particle volume was rathersignificant: on average, 69% of the particulate volume con-centration (Dp<800 nm) was removed by the TD, leaving anon-volatile volume fraction of 31%.
In contrast to the monomodal size distribution of non-conditioned particles, the distribution of non-volatile resid-uals exhibited two peaks around 10 and 70 nm, respec-tively (Fig. 3). We explain this transformation of a broadmonomodal into a bimodal distribution by the presence ofan external particle mixture: first, a sub-population of nearlynon-volatile particles exists, which remains at roughly theiroriginal size. Second, a population of partly volatile par-ticles exist, which shrink to a small fraction of their origi-nal size. Earlier volatility analyser measurements in Leipzigsuggested that these two populations are relatively well sepa-rated, i.e. very few particles show a transitional behaviour be-
10 100 1000 100000.00
0.25
0.50
0.75
1.00
1.25
1.50
1.75
2.00
auto
corr
elat
ion
func
tion
inte
gral
Dp , nm
FA FB FC
Fig. 7. Integrals of the three auto-correlation function components(0<t<14 d) as a function of particle diameterDp. Here,FA is thepersistent (long-lasting) component,FB the daily periodical com-ponent andFC the weekly periodical component.
tween these two particle types (Rose et al., 2006). The latterauthors also suggested the non-volatile mode around 70 nmto represent direct vehicular soot emissions, which is plau-sible in view of the characteristics of soot particles detectedin diesel exhaust (Sakurai et al., 2003; Ntziachristos et al.,2004; Kittelson et al., 2006). One might argue that crustalmaterial (e.g. silicates) originating from re-suspension mightinterfere with the primary soot particles in the thermodenudermeasurements. An electron microscopic study in the urbanatmosphere of Frankfurt (Germany), however, rejected thatargument by identifying the overwhelming majority of ur-ban particles around 100 nm as soot, and not crustal material(Vester et al., 2007).
In contrast to the diesel soot mode, there is much lessknowledge about the nature of particles the non-volatilemode around 10 nm observed in Augsburg (Fig.3). Whileit seems evident that they are the residuals of bigger, partlyvolatile particles, the chemical composition of their residu-als is unknown. BothWehner et al.(2005) and Ehn et al.(2007) found that even particles<20 nm originating fromphotochemically-induced nucleation, i.e. particles that wereat maximum a few hours old, contained a core that was non-volatile at 300◦C. In view of these results it appears nec-essary to assume that relatively rapid chemical conversionstake place within the particle phase, thereby generating ther-mally resistant compounds. The photooxidation of aromaticcompounds in a reaction chamber gave evidence for the gen-eration of thermally resistant polymers (Kalberer et al., 2004)but it remains unclear to what extent the described processesare relevant to the real urban atmosphere.
www.atmos-chem-phys.net/10/4643/2010/ Atmos. Chem. Phys., 10, 4643–4660, 2010

4652 W. Birmili et al.: Size distributions before and after volatilisation
20 100 4000.4
0.5
0.6
0.7
0.8
volatile
non-volatile
spring summer autumn winter
diam
eter
shr
inki
ng fa
ctor
(SF)
Dp , nm
Fig. 8. Particle diameter shrinking factor (SF) due to thermodes-orption at 300◦C. The data cover the morning traffic peak hours(06:00–09:00 CET) and are keyed after season. Whiskers representplus/minus one sigma of the mean.
3.2.2 Size-dependent shrinking factors
The shrinking factor (SF) indicates the diameter fraction ontowhich the average particle population of a given size col-lapses after passing through the TD. Figure8 shows SF asa function of particle diameter for the morning peak hours(06:00–09:00), i.e. when the contribution of fresh anthro-pogenic aerosol was the highest.
The SF values rise continuously from 30 to about 100 nm.Low values between 0.4 and 0.5 at 30 nm, indicate relativelylow volume fractions of non-volatile material (ca. 10%).Conversely, this indicates higher volume fractions of volatilespecies (ca. 90%), among which we presume organic com-pounds from direct vehicle exhaust emissions but also sec-ondary processes. Between 70 and 120 nm, a relative max-imum in SF and thus the non-volatile fraction is reached(Fig. 8). This maximum coincides with the size range ofdiesel emissions as discussed before. An intermediate min-imum around 200 nm indicates an increasing trend in thevolatile fraction while the non-volatile fraction grows slowlyagain towards 300 nm.
Although the size-segregated trends above 100 nm are onthe borderline of significance, they might plausibly be ex-plained by liquid phase-production of soluble material duringthe processing of particles in non-precipitating cloud, whichis most relevant just above the activation size of cloud con-densation nuclei (∼100 nm). The second, slightly increasingtrend towards 300 nm would be consistent with a growingimportance of crustal material with increasing particle sizereported inVester et al.(2007).
When differentiating the data after season, the maximumof non-volatile material (SF∼0.7) was observed during au-tumn (September–November). A likely explanation was that
0 2 4 6 8 10 12 14 16 18 20 22 240.40
0.44
0.48
0.52
0.56
0.60
0.64
0.68
0.72
30 nm
80 nm
Monday-Thursday Saturday Sunday
diam
eter
shr
inki
ng fa
ctor
(SF)
hour of day
Fig. 9. Average diurnal cycle of the diameter shrinking factor (SF)of 30 nm and 80 nm particles. The data are also distinguished be-tween weekdays and weekends.
during our measurements, the absolute number concentra-tions during the morning peak hours (06:00–09:00) were thehighest during the autumn period: The autumn number con-centrations at 80 nm were, for instance, 10% higher than dur-ing winter (December–February), 25% higher than in sum-mer (June–August), and 28% higher than in spring (March–May). The concentrations measured during the the morningpeak hours are expected to be the most strongly influenced bytraffic sources, thereby contributing non-volatile diesel sootparticles.
The 24 h-average SFs of particles between 30 and 300 nmranged between 0.45 and 0.70 in Augsburg while observa-tions at a rural site in East Germany (Melpitz) yielded aver-age values between 0.35 and 0.55 (Engler et al., 2007). Thecorresponding non-volatile volume fractions are 0.09–0.34 inAugsburg and 0.04–0.17 in Melpitz. Thus, non-volatile par-ticle material is enriched in urban background PM in Augs-burg by a factor of two compared to the rural backgroundatmosphere of Melpitz. This observation is of relevance forthe assessment of particle exposure caused by non-volatileparticulate carbon.
3.2.3 Diurnal cycles of SF
Figure9 shows the diurnal cycles of SF for the particle sizes80 and 30 nm. These populations are remarkable with respectto their relatively high and low fractions of non-volatile par-ticle material (Fig.8). The diurnal cycle of SF (Dp=80 nm)exhibits a pronounced morning maximum at 08:00, in closeanalogy to the particle number concentration upstream of theTD (Fig. 6). This reflects, again, enhanced traffic emissionsas well as a stratified boundary layer in the morning hours.The corresponding non-volatile volume fractions at 08:00 are0.37 on weekdays, and 0.19 on Sundays. Combining this in-formation with the rough doubling of particle concentrations
Atmos. Chem. Phys., 10, 4643–4660, 2010 www.atmos-chem-phys.net/10/4643/2010/

W. Birmili et al.: Size distributions before and after volatilisation 4653
from Sundays to weekdays at the mass-dominating particlediameters 275 and 600 nm (Fig.5d–e) leads to the conclu-sion that up to 50% of the non-volatile particle volume in theurban background of Augsburg can stem from traffic withinthe city itself.
For SF (Dp=30 nm) the case is rather different (Fig.9).Here, the morning peak was missing on weekdays as wellas on weekends. Instead, SF shows a consistent minimumduring the morning rush hour period (06:00–09:00). More-over, SF tends to show lower overall values on weekdayscompared to weekends. Two conclusions can be drawnhere: First, urban 30 nm particles contain considerably lessnon-volatile material than 80 nm particles, as found alreadyabove. Second, traffic-derived 30 nm particles contain a dis-proportionately smaller fraction of non-volatile material, asopposed to 80 nm particles. The latter conclusion is consis-tent with the observed high volatility of traffic-derived con-densation particles (Sakurai et al., 2003). The observationsin Fig. 9 highlight the possibility of the TDMPS/TD methodto quantify the influence of traffic-derived particles on themixture of particle types at an urban background site.
3.2.4 Non-volatile particle volume vs. black carbonconcentration
In Augsburg, gravimetric PM2.5 and PM10 mass concentra-tions were observed to highly correlate with the mass con-centrations calculated from the TDMPS/APS number sizedistributions (Pitz et al., 2008b). Here, however, we scruti-nised another correlation: the non-volatile volume concentra-tion (Dp<800 nm) versus the black carbon (BC) mass con-centration in PM2.5 using the aethalometer. The aethalome-ter data include the corrections against the MAAP describedabove. It is also worth mentioning that the upper size cut-offs of both methods are different. The size range<800 nm,however, encompasses the majority of the PM2.5 mass con-centration (90% based on Fig.3), so the influence of differentupper cut-off sizes are presumed to play a subordinate role.
A scatter plot between the BC mass concentration and thenon-volatile particle volume can be seen in Fig.10. Lin-ear curves were fitted for each season, with coefficients ofdetermination (R2) of 0.88, 0.93, 0.82 and 0.87 for win-ter (December–February), autumn (September–November),summer (June–August) and spring (March–May), respec-tively. Given that black carbon makes up only a sub-fractionof the total PM, the high degree of correlation indicatesa close association between the non-volatile and the light-absorbing components of PM in Augsburg. It is worthy tonote that the fit curves shows a positive intercept on the axisof BC; the reason for this intercept is currently unclear.
Based on Fig.10, one unit amount of non-volatile PM ap-pears to cause more light absorbance in winter compared tosummer. The reasons could be differences in the mixing stateof the non-volatile PM, and also incorrect assumptions on thesphericity of the particles. Both arguments are likely to be
wintery = 1.55 x - 0.79
R2 = 0.88
autumny = 1.04 x - 0.32
R2 = 0.93
springy = 1.28 x - 0.80
R2 = 0.87
summery = 0.70 x - 0.10
R2 = 0.820
2
4
6
8
10
12
14
16
0 1 2 3 4 5 6 7 8 9 10
V nv ,
µm
³/cm
³ (TD
MPS
-TD
)
Black carbon concentration, µg/m³ (Aethalometer - using MAAP correction)
Fig. 10.Black carbon mass concentration (aethalometer) versus thenon-volatile particle mass concentration (Dp<800 nm; TDMPS-TD) on the basis of daily averages.
related to the enhanced contributions of soot from domesticheating, power generation, and also traffic in winter.
Another explanation, which is hard to verify, could be thepresence of absorbing aerosol other than soot during the sum-mer period. Soil dust particles in the aerodynamic size range1–2.5 µm can easily contain light absorbing material that theaethalometer reports as BC. Nevertheless, the comparisonbetween both methods suggests that the non-volatile particlevolume can serve as a surrogate for the mass concentrationof black carbon and vice versa.
3.3 Effects of the mixed layer height
The mixed layer height (MLH) is the most important singlemeteorological parameter describing the likelihood of verti-cal air exchange and pollutant dispersal. Low MLHs inhibitthe dispersal of the pollutants emitted near the ground, par-ticularly under low wind speeds. Here, we sought for a pos-sible connection between the concentrations of non-volatileparticles and the MLH.
Figure11 shows the relationship between the non-volatileparticle volume concentration and the MLH based on the13:00 radiosoundings. A well-known feature is the preva-lence of high MLHs in the summer period; half of the val-ues exceeded 1400 m. A significant anti-correlation can beseen between the particle volume and the MLH. In fact,the highest non-volatile volume concentrations (range 6–20 µm3 cm−3) were only observed for MLHs below 500 m,while concentrations>3 µm3 cm−3 occurred only for MLHsbelow 1200 m. Meanwhile, high MLHs above 1300 m led toconcentrations mainly below 2 µm3 cm−3.
It is essential to note that Fig.11 describes aerosol effectsin Augsburg, which are associated with a MLH that is repre-sentative for a large area, perhaps a few 100 km but in anycase smaller than the synoptic weather scale. We acknowl-edge that the lack of profiling measurements directly in the
www.atmos-chem-phys.net/10/4643/2010/ Atmos. Chem. Phys., 10, 4643–4660, 2010
4654 W. Birmili et al.: Size distributions before and after volatilisation
0 500 1000 1500 2000 25000
2
4
6
8
box:25 - 75% range
whiskers:5 - 95% range
no
n-vo
latil
e vo
lum
e in
µm
3 cm
-3
mixed layer height in m
Mean valuessummerautumnwinterspring
Fig. 11. Relationship between the mixed layer height and the non-volatile particle volume concentration (Dp<800 nm). The Figureindicates mean values as well as 25–75% and 5–95% percentileranges (box, and whiskers, respectively).
city Augsburg might be a constraint of the comparison shownin the figure. Nevertheless, we find our results very con-sistent with the formerly observed dependency of PM10 onthe MLH in various European cities (Kukkonen et al., 2005;Schafer et al., 2006).
From a public health point of view, it is suggestive thatthese episodic values of non-volatile particulate volume con-centration>3 µm3 cm−3 (which are associated with blackcarbon) would be associated with a higher health risk dueto the inhalation of ambient aerosols. It is worthy to notethat a low MLH does not necessarily imply low particulatevolume concentrations: For MLHs<500 m, the majority ofparticle volume concentrations is below 2 µm3 cm−3. Otherfactors, such as the geographic origin of the air mass play aconfounding role in determining the local particle concentra-tions.
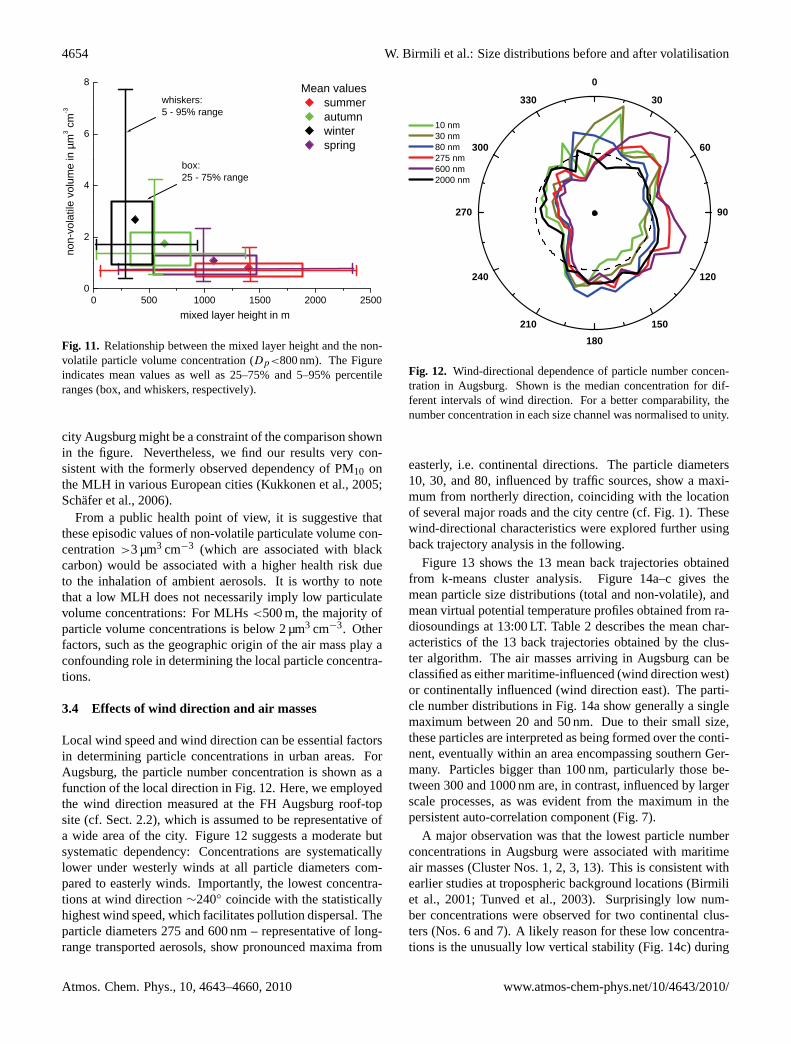
3.4 Effects of wind direction and air masses
Local wind speed and wind direction can be essential factorsin determining particle concentrations in urban areas. ForAugsburg, the particle number concentration is shown as afunction of the local direction in Fig.12. Here, we employedthe wind direction measured at the FH Augsburg roof-topsite (cf. Sect.2.2), which is assumed to be representative ofa wide area of the city. Figure12 suggests a moderate butsystematic dependency: Concentrations are systematicallylower under westerly winds at all particle diameters com-pared to easterly winds. Importantly, the lowest concentra-tions at wind direction∼240◦ coincide with the statisticallyhighest wind speed, which facilitates pollution dispersal. Theparticle diameters 275 and 600 nm – representative of long-range transported aerosols, show pronounced maxima from
0
30
60
90
120
150180
210
240
270
300
330
10 nm 30 nm 80 nm 275 nm 600 nm 2000 nm
Fig. 12. Wind-directional dependence of particle number concen-tration in Augsburg. Shown is the median concentration for dif-ferent intervals of wind direction. For a better comparability, thenumber concentration in each size channel was normalised to unity.
easterly, i.e. continental directions. The particle diameters10, 30, and 80, influenced by traffic sources, show a maxi-mum from northerly direction, coinciding with the locationof several major roads and the city centre (cf. Fig.1). Thesewind-directional characteristics were explored further usingback trajectory analysis in the following.
Figure 13 shows the 13 mean back trajectories obtainedfrom k-means cluster analysis. Figure14a–c gives themean particle size distributions (total and non-volatile), andmean virtual potential temperature profiles obtained from ra-diosoundings at 13:00 LT. Table2 describes the mean char-acteristics of the 13 back trajectories obtained by the clus-ter algorithm. The air masses arriving in Augsburg can beclassified as either maritime-influenced (wind direction west)or continentally influenced (wind direction east). The parti-cle number distributions in Fig.14a show generally a singlemaximum between 20 and 50 nm. Due to their small size,these particles are interpreted as being formed over the conti-nent, eventually within an area encompassing southern Ger-many. Particles bigger than 100 nm, particularly those be-tween 300 and 1000 nm are, in contrast, influenced by largerscale processes, as was evident from the maximum in thepersistent auto-correlation component (Fig.7).
A major observation was that the lowest particle numberconcentrations in Augsburg were associated with maritimeair masses (Cluster Nos. 1, 2, 3, 13). This is consistent withearlier studies at tropospheric background locations (Birmiliet al., 2001; Tunved et al., 2003). Surprisingly low num-ber concentrations were observed for two continental clus-ters (Nos. 6 and 7). A likely reason for these low concentra-tions is the unusually low vertical stability (Fig.14c) during
Atmos. Chem. Phys., 10, 4643–4660, 2010 www.atmos-chem-phys.net/10/4643/2010/

W. Birmili et al.: Size distributions before and after volatilisation 4655
Fig. 13. Mean back trajectories of 13 trajectory clusters arriving atAugsburg. The duration of each trajectory is 6 days. One trajec-tory point corresponds to 24 h. Trajectory No. 8, corresponding tostagnant air masses, is so short that it is not discernable in the figure.
summer time conditions (Table2, season index). The trajec-tory clusters featuring the highest particle number concen-trations were Nos. 12, 4 and 8. These clusters are repre-sentative of subsiding air from the North Atlantic (No. 12),slow south-westerly air subsiding from the Alps (Nos. 4)and stagnant air over Southern Germany (No. 8). Theseair masses originate from entirely different large-scale di-rections. Conversely, trajectory clusters representing con-tinental air masses from Eastern Europe do not belong tothose clusters with the highest particle numbers (Nos. 7, 8,9, 11). The likely reason for the high concentrations associ-ated with the clusters Nos. 12, 4 and 8 is the extraordinaryatmospheric stability, with virtual potential temperature gra-dients between 0.005 and 0.01 K m−1 in the lowest 500 m ofthe atmosphere (Fig.14c). This vertical stability is assumedto lead to the trapping of regional and urban pollution.
As the main conclusion, the particle size distribution in theurban area of Augsburg is shaped by a combination of ratherdifferent effects. The vertical stability of the atmosphere,particularly, proved to be a factor more influential that thelocal or large-scale wind direction. This is worth consider-ing when using such particle data in future epidemiologicalstudies or particle exposure assessments.
4 Conclusions
A comprehensive data set of particle size distributions(0.003–10 µm) was collected between 2004 and 2006 in ur-ban air in Augsburg, Germany. The annual cycle of particlenumber concentration showed higher total particle numberconcentrations in winter (15 000 cm−3) compared to summer(10 000 cm−3), similar to previous observations in Europeancities. An exception was the concentration of coarse particles(>1 µm) showing a maximum in summer most likely due to
3 10 100 8000
4000
8000
12000
16000
20000
dN
/dlo
g D
p , cm
-3
Dp , nm
4 8 12
(a)
3 10 100 8000
2000
4000
6000
8000
10000
12000
14000
16000
dN/d
log
Dp ,
cm-3
Dp , nm
4 8 12
(b)
0 5 10 15 20 25 30 35 40500
1000
1500
2000
2500
3000
3500
stable
instable
heig
ht a
sl, m
θ, K
4 8 12
(c)
Fig. 14. Mean characteristics of the 13 back trajectory clusters.The selection highlights the three clusters exhibiting the accumu-lation mode particle concentrations (4, 8, 12). All other clustersare only indicated as black lines. For detailed concentrations, seeTable 2. (a) Particle number size distributions (12:00–18:00 LT).(b) Non-volatile particle number distributions after volatilisation at300◦C. High concentrations belowDp = 6 nm result from artificialnucleation inside the thermodenuder.(c) Mean vertical profiles ofpseudopotential temperature (θ ) recorded at 13:00 LT. For a directcomparability all profiles were normalised to zero ath = 650 m.
www.atmos-chem-phys.net/10/4643/2010/ Atmos. Chem. Phys., 10, 4643–4660, 2010

4656 W. Birmili et al.: Size distributions before and after volatilisation
Table 2. Mean characteristics of the 13 back trajectory clusters. Season index (SI) reflects occurrence in winter (−1) or summer (+1). WD:wind direction, WS: wind speed, MLH: mixed layer height,N[5−800]: total particle number between 5 and 800 nm,Nnv[30−800]: particlenumber downstream of the thermodenuder (300◦C) between 30 and 800 nm.
No. WD Frequency N[5−800] Nnv[30−800] SI MLH WStraj WDtraj WSlocal WDlocaldays % cm−3 cm−3 m m s−1 m s−1
1 W 28 5 9100 2100 −0.4 1100 1.9 247◦ 3.8 214◦(±20)2 SW 43 7 8000 1900 −0.1 800 2.2 254◦ 3.5 220◦(±10)3 NW 80 14 7300 2200 0.2 730 1.7 268◦ 3.2 236◦(±10)4 SW 25 4 17 000 6400 −0.4 450 0.8 230◦ 1.5 141◦(±30)5 S 78 13 8000 2600 0.1 540 1.3 259◦ 2.7 207◦(±20)6 W 75 13 8500 3100 0.5 720 0.6 0◦ 2.0 162◦(±50)7 O 27 5 10 500 3900 0.2 650 0.3 121◦ 2.0 120◦(±20)8 O 24 4 17 000 6500 −0.6 430 0.4 152◦ 1.8 113◦(±30)9 NO 33 6 13 500 3700 −0.6 400 0.3 75◦ 2.3 119◦(±50)10 NW 83 14 13 000 3900 −0.2 560 0.6 291◦ 2.4 184◦(±80)11 NO 42 7 13 000 3600 0.1 730 0.9 45◦ 2.8 134◦(±80)12 N 13 2 19 000 6200 −0.6 760 0.8 226◦ 1.9 173◦(±30)13 N 43 7 10 500 2600 0.1 1000 0.9 288◦ 3.0 207◦(±20)
enhanced re-suspension. The most extreme particle numberconcentrations, particularly in the accumulation mode, oc-curred predominantly during periods of very low tempera-tures, typically around−10◦C, and are concluded to resultfrom a combination of emissions from heating sources andatmospheric temperature inversion.
Auto-correlation analysis and diurnal profiles showed thatthe concentrations of ultrafine particles (<80 nm) were dom-inated by their diurnal and weekly-anthropogenic cycle.While the dominance of the diurnal component for parti-cles <10 nm points at the importance of photochemically-induced new particle formation, the existence of a weeklycomponent in the size range 10 to 600 nm emphasizes therole of local and regional anthropogenic sources for that sizerange. A maximum persistence was found for particle con-centrations at 600 nm, which are the most representative forlong-range transported aerosol. Coarse particles>2 µm werecharacterised by a mixture of a persistent and a periodic be-haviour.
When heating the ambient aerosol to 300◦C in a ther-modenuder (TD), about 69% of the particulate volume con-centration (<800 nm) vanished, while the particle number(Dp > 6 nm) remained constant within the measurement ac-curacy. The summation method was applied to derive diam-eter shrinking factors (SF) due to the volatilisation step as afunction of particle size. Particles between 60 and 200 nmshrank, on average, to 0.55–0.70 of their original diameter.Towards smaller particles (30 nm), the non-volatile fractiondecreased, but increased towards bigger particles (300 nm).
The diurnal cycle of SF showed a relative maximum for80 nm during the morning peak traffic hours (08:00) whilefor 30 nm a relative minimum occurred. This emphasizes thepresence of soot in traffic-derived 80 nm particles but also its
absence in particulate traffic emissions<30 nm. Correlationsbetween the non-volatile particle volume and (<800 nm) anoptically derived PM2.5 soot concentration yielded measuresof determination (R2) between 0.76 and 0.85, suggesting astrong association between the non-volatile particle residuesand soot.
The meteorological analysis involved a separation of thedata set according to local wind direction, the mixed layerheight, and back trajectories. The prime result was that theheight of the planetary boundary layer played the most im-portant role on the particle number concentrations in Augs-burg. The highest particle number concentrations>30 nmwere associated with the most stable inversion situations,and, slightly surprisingly, not necessarily with air massesfrom the continental source regions of Eastern Europe. Theimportance of the mixing layer height found here confirmsearlier studies of surface-measured particle mass concentra-tions in urban areas (e.g.Schafer et al., 2006).
It is a main conclusion that the particle size distributionin the urban atmosphere of a continental city like Augsburgis shaped by a combination of relatively few effects. Thevertical stability of the atmosphere, particularly, proved to bea very influential factor, more important for instance than thelocal or large-scale wind direction. Our results are valuablebackground information for future epidemiological studiesand particle exposure assessments.
Atmos. Chem. Phys., 10, 4643–4660, 2010 www.atmos-chem-phys.net/10/4643/2010/

W. Birmili et al.: Size distributions before and after volatilisation 4657
370 380 390 400 410 420 430 440-20
-10
0
10
700 710 720 730 740 750 760 770 780 790 800-20
-10
0
10
370 380 390 400 410 420 430 4400
200
400
600
800
700 710 720 730 740 750 760 770 780 790 8000
400
800
1200
1600
°C °C
(b)
(a)
No. of days (after 01/01/2004)
dN/d
log
Dp a
t 600
nm
dN/d
log
Dp a
t 600
nm
No. of days (after 01/01/2004)
Fig. A1. Time history of ambient temperature(a) and the number concentration of 600 nm-particles. The left-hand and right-hand graphscorrespond to the winters 2004/2005 and 2005/2006, respectively. Several episodes that show simultaneous high particle concentrations andlow temperatures are marked by arrows.
Appendix A
Detailed time history
FigureA1 shows the detailed time histories of ambient tem-perature and the number concentration of 600 nm-particlesin Augsburg for the two winters 2004/2005 and 2005/2006,respectively. The seven marked episodes are discussed inSect.3.1.2.
Acknowledgements.We acknowledge Hans Kaufmann (FH Augs-burg) for providing the wind measurements at the roof-top station.Back trajectories were calculated on the NOAA ARL ReadyWebsite using the HYSPLIT (HYbrid Single-Particle LagrangianIntegrated Trajectory) Model (Draxler, R. R. and Hess, G. D.,2003, NOAA Air Resources Laboratory, Silver Spring, MD, USA).Radiosoundings at Oberschleissheim were made by the GermanWeather Service DWD and accessed through the University ofWyoming website (http://weather.uwyo.edu/upperair/). We thankChrista Engler for characterising the particle transmission of thethermodenuder. Part of the data evaluation was supported by theEuropean Integrated project on Aerosol Cloud Climate and AirQuality Interactions (EUCAARI), coordinated by the University ofHelsinki, Finland.
Edited by: V.-M. Kerminen
References
Aalto, P., Hameri, K., Paatero, P., et al.: Aerosol particle numberconcentration measurements in five European cities using TSI-3022 Condensation Particle Counter over three-year period dur-ing health effects of air pollution on susceptible subpopulations,J. Air Waste Manage. Assoc., 55, 1064–1076, 2005.
An, W., Pathak, R., Lee, B., et al.: Aerosol volatility measurementusing an improved thermodenuder: Application to secondary or-ganic aerosol, J. Aerosol Sci., 38, 305–314, 2007.
Birmili, W., Stratmann, F., and Wiedensohler, A.: Design of aDMA-based size spectrometer for a large particle size range andstable operation, J. Aerosol Sci., 30, 549–553, 1999.
Birmili, W., Wiedensohler, A., Heintzenberg, J., and Lehmann, K.:Atmospheric particle number size distribution in Central Europe:Statistical relations to air masses and meteorology, J. Geophys.Res., 106(D23), 32005–32018, 2001.
Birmili, W., Alaviippola, B., Hinneburg, D., Knoth, O., Tuch,T., Borken-Kleefeld, J., and Schacht, A.: Dispersion of traffic-related exhaust particles near the Berlin urban motorway esti-mation of fleet emission factors, Atmos. Chem. Phys., 9, 2355–2374, doi:10.5194/acp-9-2355-2009, 2009a.
Birmili, W., Weinhold, S., Nordmann, S., Wiedensohler, A.,Spindler, G. et al.: Atmospheric aerosol measurements in theGerman Ultrafine Aerosol Network (GUAN): Part 1 – soot andparticle number size distributions, Gefahrst. Reinh. Luft, 69(4),137–145, 2009b.
Birmili, W., Schwirn, K., Nowak, A., et al.: Hygroscopic growthof atmospheric particle number size distributions in the Finnishboreal forest region, Bor. Env. Res., 14, 458–480, 2009c.
Burtscher, H., Baltensperger, U., Bukowiecki, N., et al.: Separationof volatile and non-volatile aerosol fractions by thermodesorp-tion: instrumental development and applications, J. Aerosol Sci.,32, 427–442, 2001.
www.atmos-chem-phys.net/10/4643/2010/ Atmos. Chem. Phys., 10, 4643–4660, 2010

4658 W. Birmili et al.: Size distributions before and after volatilisation
Charron, A. and Harrison, R. M.: Primary particle formation fromvehicle emissions during exhaust dilution in the roadside atmo-sphere, Atmos. Environ., 37, 4109–4119, 2003.
Costabile, F., Birmili, W., Klose, S., Tuch, T., Wehner, B., Wieden-sohler, A., Franck, U., Konig, K., and Sonntag, A.: Spatio-temporal variability and principal components of the particlenumber size distribution in an urban atmosphere, Atmos. Chem.Phys., 9, 3163–3195, doi:10.5194/acp-9-3163-2009, 2009.
Clarke, A. D.: A thermo-optic technique for in-situ analysis of size-resolved aerosol physiochemistry, Atmos. Environ., Part A, 25,635–644, 1991.
Cyrys, J., Stolzel, M., Kreyling, W. G., et al.: Sources and elementalcomposition of ambient particles in Erfurt, Germany, Sci. TotalEnviron., 305, 143–156, 2003.
Cyrys, J., Pitz, M., Heinrich, J., et al.: Spatial and temporal vari-ation of particle number concentration in Augsburg, Germany,Sci. Total Environ., 401, 168–175, 2008.
Draxler, R. and Hess, G.: Description of the HYSPLIT4 modelingsystem, NOAA Technical Memorandum, ERL, ARL-224, 2004.
Ebelt, S., Cyrys, J., Brauer, S., et al.: Air Quality in PostunificationErfurt, East Germany: Associating changes in pollutant concen-trations with changes in emissions, Environ. Health Persp., 109,325–333, 2001.
EC: Council Directive 1999/30/EC, of 22 April 1999: Limit val-ues for sulphur dioxide, nitrogen dioxide and oxides of nitrogen,particulate matter and lead in ambient air (The First DaughterDirective), 1999.
Ehn, M., Petja, T., Birmili, W., Junninen, H., Aalto, P., and Kul-mala, M.: Non-volatile residuals of newly formed atmosphericparticles in the boreal forest, Atmos. Chem. Phys., 7, 677–684,doi:10.5194/acp-7-677-2007, 2007.
Engler, C., Rose, D., Wehner, B., Wiedensohler, A., Bruggemann,E., Gnauk, T., Spindler, G., Tuch, T., and Birmili, W.: Size distri-butions of non-volatile particle residuals (Dp < 800 nm) at a ru-ral site in Germany and relation to air mass origin, Atmos. Chem.Phys., 7, 5785–5802, doi:10.5194/acp-7-5785-2007, 2007.
Fierz, M., Vernooij, M., and Burtscher, H.: An improved low-flowthermodenuder, J. Aerosol Sci., 38, 1163–1168, 2007.
Hasegawa, S., Hirabayashi, M., Kobayashi, S., et al.: Size distribu-tion and characterization of ultrafine particles in roadside atmo-sphere, J. Environ. Sci. Heal. A., 39, 2671–2690, 2004.
HEI: Understanding the health effects of components of the partic-ulate matter mix: progress and next steps, Tech. Rep. 4, HealthEffects Institute, Boston, MA, 2002.
Heintzenberg, J., Birmili, W., Wiedensohler, A., Nowak, A., andTuch, T.: Structure, variability and persistence of the submi-crometre marine aerosol, Tellus, 56B, 357–367, 2004.
Hitchins, J., Morawska, L., Wolff, R., and Gilbert, D.: Concentra-tions of submicrometre particles from vehicle emissions near amajor road, Atmos. Environ., 34, 51–59, 2000.
Holle, R., Happich, M., Lowel, H., and Wichmann, H.: KORA – AResearch platform for population based health research, Gesund-heitswesen, 67, S19–S25, 2005.
Holzworth, C. G.: Estimates of mean maximum mixing depths inthe contiguous United States, Mon. Weather Rev., 92, 235–242,1964.
Huffman, J., Ziemann, P., Jayne, J., Worsnop, D., and Jimenez,J.: Development and characterization of a fast-stepping/scanningthermodenuder for chemically-resolved aerosol volatility mea-
surements, Aerosol Sci. Technol., 42, 395–407, 2008.Hussein, T., Puustinen, A., Aalto, P. P., Makela, J. M., Hameri,
K., and Kulmala, M.: Urban aerosol number size distributions,Atmos. Chem. Phys., 4, 391–411, doi:10.5194/acp-4-391-2004,2004.
Imhof, D., Weingartner, E., Ordonez, C., et al.: Real-world emis-sion factors of fine and ultrafine aerosol particles for differ-ent traffic situations in Switzerland, Environ. Sci. Technol., 39,8341–8350, 2005.
Johnson, G. R., Ristovski, Z., and Morawska, L.: Method for mea-suring the hygroscopic behaviour of lower volatility fractions inan internally mixed aerosol, J. Aerosol Sci., 35, 443455, 2004.
Kalberer, M., Paulsen, D., Sax, M., et al.: Identification of polymersas major components of atmospheric organic aerosols, Science,303, 1659–1662, 2004.
Ketzel, M., Wahlin, P., Berkowicz, R., and Palmgren, F.: Particleand trace gas emission factors under urban driving conditions inCopenhagen based on street and roof-level observations, Atmos.Environ., 37, 2735–2749, 2003.
Ketzel, M., Wahlin, P., Kristensson, A., Swietlicki, E., Berkowicz,R., Nielsen, O. J., and Palmgren, F.: Particle size distributionand particle mass measurements at urban,near-city and rural levelin the Copenhagen area and Southern Sweden, Atmos. Chem.Phys., 4, 281–292, doi:10.5194/acp-4-281-2004, 2004.
Kittelson, D., Watts, W., and Johnson, J.: On-road and laboratoryevaluation of combustion aerosols – Part 1: Summary of dieselengine results, J. Aerosol Sci., 37, 913–930, 2006.
Kreidenweis, S. M., McInnes, L. M., and Brechtel, F. J.: Obser-vations of aerosol volatility and elemental composition at Mac-quarie Island during the First Aerosol Characterization Experi-ment (ACE1), J. Geophys. Res., 103, 16511–16524, 1998.
Kreyling, W. and Scheuch, G.: Clearance of particles deposited inthe lungs, in Particle-Lung Interactions, edited by P. Gehr andJ. Heyder, 323–376, Marcel Dekker, New York, 2000.
Kreyling, W., Tuch, T., Peters, A., et al.: Diverging long-term trendsin ambient urban particle mass and number concentrations asso-ciated with emission changes caused by the German unifcation,Atmos. Environ., 37, 3841–3848, 2003.
Kukkonen, J., Pohjola, M., Sokhi, R., et al.: Analysis and evalua-tion of local scale PM10 air pollution episodes in four Europeancities: Helsinki, London, Milan and Oslo, Atmos. Environ., 39,2759–2773, 2005.
Kulmala, M., Vehkamaki, H., Petaja, T., et al.: Formation andgrowth rates of ultrafine atmospheric particles: A review of ob-servations, J. Aerosol Sci., 35, 143–176, 2004.
Moller, W., Felten, K., Sommerer, K., et al.: Deposition, retention,and translocation of ultrafine particles from the central airwaysand lung periphery, Am. J. Resp. Crit. Care Med., 177, 426–432,2008.
Ntziachristos, L., Mamakos, A., Samaras, Z., et al.: Overview of theEuropean Particulates project on the characterization of exhaustparticulate emissions from road vehicles: Results for light-dutyvehicles, SAE Trans., 113, 1354–1373, 2004.
Oberdorster, G., Oberdorster, G., and Oberdorster, G.: Nanotoxi-cology: an emerging discipline evolving from studies of ultrafineparticles, Environ. Health Persp., 113, 823–839, 2005.
Peters, A., von Klot, S., Heier, M., et al.: Particulate air pollutionand nonfatal cardiac events. Part I. air pollution, personal activi-ties, and onset of myocardial infarction in a case-crossover study,
Atmos. Chem. Phys., 10, 4643–4660, 2010 www.atmos-chem-phys.net/10/4643/2010/

W. Birmili et al.: Size distributions before and after volatilisation 4659
HEI Research Report, 124, 1–82, 2005.Petzold, A. and Schonlinner, M.: Multi-angle absorption photome-
try – a new method for the measurement of aerosol light absorp-tion and atmospheric black carbon, J. Aerosol Sci., 35, 421–441,2004.
Petzold, A., Schloesser, H., Sheridan, P. J., Arnott, W. P., Ogren,J. A., and Virkkula, A.: Evaluation of multiangle absorptionphotometry for measuring aerosol light absorption, Aerosol Sci.Technol., 39, 40–51, 2005.
Philippin, S., Wiedensohler, A., and Stratmann, F.: Measurementsof non-volatile fractions of pollution aerosols with an eight-tubevolatility tandem differential mobility analyzer (VTDMA-8), J.Aerosol Sci., 35, 185–203, 2004.
Pinnick, R. G., Jennings, S. G., and Fernandez, G.: Volatility ofaerosols in the arid southwestern United States, J. Atmos. Sci.,44, 562–576, 1987.
Pitz, M., Schmid, O., Heinrich, J., et al.: Seasonal and diurnal varia-tion of PM2.5 apparent particle density in urban air in Augsburg,Germany, Environ. Sci. Technol., 42, 5087–5093, 2008a.
Pitz, M., Birmili, W., Schmid, O., Peters, A., and Cyrys, J.: Qualityassurance of aerosol particle size distribution measurements atan urban air pollution monitoring station in Augsburg, Germany,J. Environ. Mon., 10, 1017–1024, 2008b.
Pope, C. and Dockery, D.: Health effects of fine particulate air pol-lution: lines that connect, J. Air Waste Manage. Assoc., 56, 709–742, 2006.
Rose, D., Wehner, B., Ketzel, M., Engler, C., Voigtlander, J., Tuch,T., and Wiedensohler, A.: Atmospheric number size distribu-tions of soot particles and estimation of emission factors, At-mos. Chem. Phys., 6, 1021–1031, doi:10.5194/acp-6-1021-2006,2006.
Rosenbohm, E., Vogt, R., Scheer, V., et al.: Particulate size dis-tributions and mass measured at a motorway during the BAB IIcampaign, Atmos. Environ., 39, 5696–5709, 2005.
Ruuskanen, J., Tuch, T., and ten Brink, H.: Concentrations of ul-trafine, fine and PM2.5 particles in three European cities, Atmos.Environ., 35, 3729–3738, 2001.
Sakurai, H., Park, K., McMurry, P., et al.: Size-dependent mixingcharacteristics of volatile and nonvolatile components in dieselexhaust aerosols, Environ. Sci. Technol., 37, 5487–5495, 2003.
Schafer, K., Emeis, S., Hoffmann, H., and Jahn, C.: Influence ofmixing layer height upon air pollution in urban and sub-urbanareas, Meteorolog. Z., 15, 647–658, 2006.
Schmid, O., Eimer, B., Hagen, D., et al.: Investigation of volatilitymethods for measuring aqueous sulfuric acid on mixed aerosols,Aerosol Sci. Technol., 36, 877–889, 2002.
Schwarze, P., Ovrevik, J., and Lag, M.: Particulate matter proper-ties and health effects: Consistency of epidemiological and toxi-cological studies, Hum. Exp. Toxicol., 25, 559–579, 2006.
Smith, M. H. and O’Dowd C. D.: Observations of accumulationmode aerosol composition and soot carbon concentrations bymeans of a high-temperature volatility technique, J. Geophys.Res., 101, 19583–19591, 1996.
Sioutas, C., Delfino, R., and Singh, M.: Exposure assessmentfor atmospheric ultrafine particles (UFPs) and implications inepidemiologic research, Environ. Health Persp., 113, 947–955,2005.
Stanier, C., Khlystov, A., and Pandis, S.: Ambient aerosol size dis-tributions and number concentrations measured during the Pitts-
burgh air quality study, Atmos. Environ., 38, 3275–3284, 2004.Stull, R.: An introduction to boundary layer meteorology, Reidel
Publishing, Dordrecht, 1988.Sunder Raman, R., Hopke, P. K., and Holsen T. M.: Carbona-
ceous aerosol at two rural locations in New York State: Char-acterization and behavior, J. Geophys. Res., 113, D12202,doi:10.1029/2007JD009281, 2008.
Thorpe, A. and Harrison, R. M.: Sources and properties of non-exhaust particulate matter from road traffic: A review, Sci. TotalEnviron., 400, 270–282, 2008.
Tunved, P., Hansson, H.-C., Kulmala, M., Aalto, P., Viisanen, Y.,Karlsson, H., Kristensson, A., Swietlicki, E., Dal Maso, M.,Strom, J., and Komppula, M.: One year boundary layer aerosolsize distribution data from five nordic background stations, At-mos. Chem. Phys., 3, 2183–2205, 2003,http://www.atmos-chem-phys.net/3/2183/2003/.
van Dingenen, R., Raes, F., Puteaud, J.-P., et al.: A Europeanaerosol phenomenology-1: Physical characteristics of particulatematter at kerbside, urban, rural and background sites in Europe,Atmos. Environ., 38, 2561–2577, 2004.
Vester, B., Ebert, M., Barnert, E., et al.: Composition and mixingstate of the urban background aerosol in the Rhein-Main area(Germany), Atmos. Environ., 41, 6102–6115, 2007.
Voigtlander, J., Tuch, T., Birmili, W., and Wiedensohler, A.: Cor-relation between traffic density and particle size distributionin a street canyon and the dependence on wind direction, At-mos. Chem. Phys., 6, 4275–4286, doi:10.5194/acp-6-4275-2006,2006.
von Klot, S., Peters, A., Aalto, P. et al.: Ambient air pollution isassociated with increased risk of hospital cardiac readmissionsof myocardial infarction survivors in five European cities. Reportof the Health Effects of Particles on Susceptible Subpopulations(HEAPSS) Study Group, Circulation, 112, 3073–3079, 2005.
Wehner, B., Birmili, W., Gnauk, T., and Wiedensohler, A.: Particlenumber size distributions in a street canyon and their transfor-mation into the urban background: Measurements and a simplemodel study, Atmos. Environ., 36, 2215–2223, 2002a.
Wehner, B., Philippin, S., Wiedensohler, A., and Haudek, A.: De-sign and calibration of an improved thermodenuder to study thevolatility fraction of aerosol particles, J. Aerosol Sci., 33, 1087–1093, 2002b.
Wehner, B. and Wiedensohler, A.: Long term measurements of sub-micrometer urban aerosols: statistical analysis for correlationswith meteorological conditions and trace gases, Atmos. Chem.Phys., 3, 867–879, doi:10.5194/acp-3-867-2003, 2003.
Wehner, B., Petaja, T., Boy, M., et al.: The contribution of sul-furic acid and non-volatile compounds on the growth of freshlyformed atmospheric aerosols, Geophys. Res. Lett., 32, L17810,doi:10.1029/2005GL023827, 2005.
Wehner, B., Birmili, W., Ditas, F., Wu, Z., Hu, M., Liu, X., Mao,J., Sugimoto, N., and Wiedensohler, A.: Relationships betweensubmicrometer particulate air pollution and air mass history inBeijing, China, 20042006, Atmos. Chem. Phys., 8, 6155–6168,doi:10.5194/acp-8-6155-2008, 2008.
WHO: Health Effects of Air Pollution Results from the WHOProjectSystematic Review of Health Aspects of Air Pollution inEurope, Tech. Rep. E83080, World Health Organisation, Geneva,2004.
www.atmos-chem-phys.net/10/4643/2010/ Atmos. Chem. Phys., 10, 4643–4660, 2010

4660 W. Birmili et al.: Size distributions before and after volatilisation
WHO: Health risks of particulate matter from long-range trans-boundary air pollution, joint WHO/Convention Task Force onthe Health Aspects of Air Pollution, WHOLIS E88189, WorldHealth Organisation, Regional Office for Europe, Bonn, 2006.
Wichmann, H.-E. and Peters, A.: Epidemiological evidence of theeffects of ultrafine particle exposure, Philos. T. Roy. Soc. Lon-don, 358, 2751–2769, 2000.
Wichmann, H.-E., Cyrys, J., Stolzel, M., et al.: Sources and elemen-tal composition of ambient particles in Erfurt, Germany, EcomedVerlag, Landsberg am Lech, 2002.
Wigley, T. M. L, Smith, R. L., and Santer, B. D.: Anthropogenicinfluence on the autocorrelation structure of hemispheric-meantemperatures, Science, 282, 1676–1679, 1998.
Woo, K. S., Chen, D.-R., Pui, D. Y. H., and McMurry, P. H.: Mea-surements of Atlanta aerosol size distribution: Observation of ul-trafine particle events, Aerosol Sci. Technol., 34(1), 75–87, 2001.
Zhu, Y., Hinds, W., Shen, S., and Sioutas, C.: Seasonal and spatialtrends in fine particulate matter – seasonal trends of concentra-tion and size distribution of ultrafine particles near major high-ways in Los Angeles, Aerosol Sci. Technol., 38, 5–13, 2004.
Atmos. Chem. Phys., 10, 4643–4660, 2010 www.atmos-chem-phys.net/10/4643/2010/