particle and thermo-hydraulic maldistribution of
TRANSCRIPT

1
Particle and thermo-hydraulic maldistribution of
nanofluids in parallel microchannel systems
Lakshmi Sirisha Maganti a, Purbarun Dhar b, T. Sundararajan*, c and Sarit K. Das*, d
Department of Mechanical Engineering, Indian Institute of Technology Madras
Chennai – 600036, India
a E–mail: [email protected] ,
b E–mail: [email protected]
* Corresponding authors:
c E–mail: [email protected] ,
d E–mail: [email protected]
Abstract
Fluidic maldistribution in microscale multichannel devices requires deep understanding to
achieve optimized flow and heat transfer characteristics. A thorough computational study has
been performed to understand the concentration and thermo–hydraulic maldistribution of
nanofluids in parallel microchannel systems using an Eulerian–Lagrangian twin phase model.
The study reveals that nanofluids cannot be treated as homogeneous single phase fluids in such
complex flow domains and effective property models fail drastically to predict the performance
parameters. To comprehend the distribution of the particulate phase, a novel concentration
maldistribution factor has been proposed. It has been observed that distribution of particles need
not essentially follow the flow pattern, leading to higher thermal performance than expected
from homogeneous models. Particle maldistribution has been conclusively shown to be due to
various migration and diffusive phenomena like Stokesian drag, Brownian motion,
thermophoretic drift, etc. The implications of particle distribution on the cooling performance
have been illustrated and smart fluid effects (reduced magnitude of maximum temperature) have
been observed and a mathematical model to predict the enhanced cooling performance in such
flow geometries has been proposed. The article presents lucidly the effectiveness of discrete
phase approach in modelling nanofluid thermo–hydraulics and sheds insight on behavior of
nanofluids in complex flow domains.

2
1. Introduction
In the modern era, miniaturization of microelectronic devices and systems coupled with
increased functionalities poses severe challenges to cooling technologies due to generation of
high heat fluxes. Conventional cooling techniques prove inadequate in such cases and might lead
to device failure due to improper thermal management. Parallel microchannel based heat
exchanger devices, where a cooling fluid flows through a large number of parallel, micro
machined or etched conduits, is becoming the preferred cooling device to cool modern electronic
components like MEMS, VLSI circuits, laser diode arrays, high–energy mirrors and other
compact products emitting high transient thermal loads. The microscale flows ensure higher
levels of absorption of energy per unit volume and also provide enhanced values of convective
heat transfer coefficient per unit volume and have thus been a major focus for thermo–fluidics
researchers over the last two decades. In a pioneering work, Tuckerman and Peace [1] proposed
a novel cooling technique using microchannel heat exchangers which are capable of dissipating
large amounts of heat from small areas with high heat transfer rates and less operating fluid
requirements. Later, several researchers stressed upon the applicability of conventional fluidics
theories on microchannel flow domains [2–5] and it has been shown that the classical Navier–
Stokes equations can be utilized for accurate prediction of liquid flow characteristics in
microchannels. Though some discrepancies remain, these have been associated to factors such as
measurement inaccuracies, imperfections induced during test section and geometry fabrication,
entrance, exit and bend effects and effects of surface roughness. However, despite all such
positives, the overall thermal performance of parallel microchannel cooling systems can be
reduced because of non–uniform distribution of the working fluid from the manifold to the
channels. Thereby it becomes an utmost necessity to properly understand the flow
maldistribution behavior in such systems since grossly non–uniform cooling can lead to failure
of certain regions of the source device. The extent of flow maldistribution in macro and mini–
channels are well understood from the several proposed models [6–8] however such models fail
to predict maldistribution of flow in parallel microchannels [9] since such models either neglect
frictional effects within channels or the inertial effects in the manifold while both effects are
equally important in case of parallel microchannels [9]. There are several experimental and
numerical reports that attempt to understand flow distribution of single phase flows in parallel
microchannels [10–13], for both adiabatic and heat transfer cases. Based on experiments and

3
computations, Siva et al. [14] proposed an optimum configuration to reduce single phase flow
maldistribution in parallel microchannel cooling systems.
Later, the attention shifted towards obtaining higher thermal transport by modification of
the flow field or the fluid itself so as to bring in the practical implementation aspects, such as
enhancement of heat transfer using offset fins or employing nanofluids as the working fluid [15,
16]. Nanofluids, which are engineered dilute and stable colloidal suspensions of metallic and/or
ceramic nanoparticles in a conventional base fluid, exhibit thermal conductivity values ~ 20–150
% higher than the base fluids [17]. Several experimental and some theoretical works have been
reported on the enhanced thermal conductivity of nanofluids [18–21] over the past decade. The
thermal transport caliber of any nanofluid depends mainly on nanoparticle concentration, thermal
conductivity, the diameter of particles, base fluid conductivity and temperature [22]. Several
studies [23–25] have conclusively reported that nanofluids show great promise for use in cooling
technologies. The use of nanofluids in microchannel heat exchangers has been recommended as
a potentially feasible solution for cooling microelectronic devices. There are several
experimental and numerical reports that concentrate on understanding the enhanced heat transfer
characteristics and pressure drop of nanofluids in parallel microchannel systems [26–32]. It has
been reported that enhanced heat transfer can be achieved with the use of nanofluid in
microchannels but at the cost of increased pressure drop. Further, the mechanisms involved in
the heat transport phenomena are not fully understood and may need more analysis [33, 34].
Overall there are few reports which concentrate on the modeling of flow and heat transfer
characteristics of with nanofluids in microchannels but all these consider nanofluids as
homogeneous single component fluids for analysis; which has been conclusive reported [16] to
be an inefficient and incorrect assumption. Thorough survey of literature reveals there are no
reports which try to understand the effects of flow and particle concentration distribution of
nanofluids (treated as non–homogeneous twin component fluids) in parallel microchannels and
its impact vis–à–vis thermal capabilities and uniformity. So there is a need to carry out an in–
depth study to understand the effects of nanofluid maldistribution along with nanoparticle
concentration and temperature maldistribution in parallel microchannel cooling systems since
such a study may directly contribute towards design and optimization of nanofluid properties and
microchannel systems for increasing the performance of parallel microchannel cooling systems
employing nanofluids.
4
2. Numerical formulation
To understand the concentration and thermo-hydraulic maldistribution of nanofluids within
parallel microchannels, detailed numerical investigation on the flow and heat transfer of
alumina–water nanofluid in parallel microchannel system has been carried out. There are two
different approaches used in the present work, Effective Property Modeling (EPM) and Discrete
Phase Modeling (DPM) (Eulerian–Lagrangian approach). The former one considers the
nanofluid as single phase homogeneous fluid with effective physical properties which are linear
functions of fluid and particle material properties. The latter considers nanofluid as two phase
non–homogeneous fluid i.e., fluid phase as continuous phase with nanoparticles as a discrete
dispersed phase and considers all the prevalent diffusion and migration mechanisms of the
nanoparticles within the fluid, viz. hydrodynamic forces, Brownian and thermophoresis
diffusion, shear induced migration, etc. The present work focuses on elaborating why the DPM is
a must requirement to model nanofluid behavior in microchannel systems.
2.1. Governing equations for the continuous phase
The governing equations for the EPM and continuous phase of the DPM are the continuity
equation (mass), Navier–Stokes equation (momentum) and energy equation. The following
equations respectively represent the mathematical formulations for the same.
𝜕𝜌
𝜕𝑡+ 𝛻. (𝜌𝑉 ⃗⃗ ⃗) = 0 (1)
𝜕𝜌�⃗⃗�
𝜕𝑡+ 𝛻. (𝜌�⃗� �⃗� ) = −𝛻𝑃 + 𝛻. (𝜇(𝛻𝑉 ⃗⃗ ⃗ + 𝛻𝑉𝑇)) + 𝑆𝑚 (2)
𝜌𝐶 [𝜕𝑇
𝜕𝑡+ �⃗� .𝛻𝑇] = 𝛻. [𝑘𝛻𝑇]+ 𝑆𝑒 (3)
The effects of viscous dissipation and work due to compressibility are assumed to be negligible
in the energy equation. In Eqns. (1)–(3), ρ is density of liquid, V is velocity of the liquid, t is
time, P is pressure, g is the acceleration due to gravity, C is the specific heat of fluid, k is thermal
conductivity of fluid and T is fluid temperature. Sm and Se are source terms representing
momentum and energy exchange respectively between the continuous phase (fluid) and discrete
phase (nanoparticles) and the terms are zero for single phase model i.e. EPM.

5
2.2. Governing equations for the dispersed phase
The particle trajectories in the flow field are determined by Newton’s second law of motion.
Considering a Lagrangian frame of reference, the governing equation (in Cartesian coordinates)
for the motion of the nanoparticles is expressed as
𝑑𝑉𝑝
𝑑𝑡= 𝐹 (4)
𝐹 = 𝐹𝐷 + 𝐹𝐺 + 𝐹𝐵 + 𝐹𝑇 + 𝐹𝐿 + 𝐹𝑃 + 𝐹𝑉 (5)
Where Vp is the instantaneous velocity of the particles and F is the net specific force acting on
the particle. The terms FD, FG, FB, FT , FL, FP and FV represent the forces due to fluidic drag,
gravity, Brownian motion, thermophoretic drift, Saffman lift, contribution due to pressure
gradient and contribution due to virtual mass respectively. The forces can be expressed
mathematically as follows [35]
𝐹𝐷 =18𝜇
𝜌𝑝𝑑𝑝2
𝐶𝐷 𝑅𝑒
24 (6)
For submicron particles as is the present case, the classical form of Stokesian drag needs to be
modified so as to accommodate the non–continuum or slip boundary effects (which creeps in for
high Knudsen number systems, such as flow past nanoscale particles) at the particle–fluid
interface and can be expressed as
𝐹𝐷 = 18𝜇
𝜌𝑝𝑑𝑝2𝐶𝑐
(7)
Where Cc represents the Cunningham correction factor to Stokes law and the expression for the
same is as
𝐶𝑐 = 1 +2𝜆
𝑑𝑝 (1.257 + 0.4𝑒−(1.1𝑑𝑝 2𝜆⁄ )) (8)
𝐹𝐺 =𝑔(𝜌𝑝−𝜌)
𝜌𝑝 (9)
Since Brownian motion is random in nature with zero net directional flux, a probability function
is required to model the force. The amplitude of the Brownian force components is expressed as

6
𝐹𝐵𝑖= 휁𝑖√
𝜋𝑆0
∆𝑡 (10)
where ζi is a random number which is part of a Gaussian distribution with zero mean. The
amplitudes of the Brownian force components are estimated at each step of the discrete phase
calculations. The components of the Brownian randomness are modeled as Gaussian white noise
process with the expression for the spectral intensity Sn,ij expressible as [36]
𝑆𝑛,𝑖𝑗 = 𝑆0𝛿𝑖𝑗 (11)
where δij is the Kronecker delta function and the expression for the amplitude of the spectrum S0
is expressed as
𝑆0 = 216𝜈𝑘𝐵𝑇
𝜋2𝜌𝑑𝑝5 (
𝜌𝑝
𝜌)2𝐶𝑐
(12)
The dispersed particles within a continuous phase subjected to a temperature gradient experience
a force in the direction opposite to that of the gradient due to higher degree of molecular
bombardment on the particles at the heated region, driving it towards the colder region where the
net force due to bombardment is less. The phenomenon is known as thermophoresis or Soret
effect and the expression for the force generated due to the drift is expressed as
𝐹𝑇 = −𝐷𝑇,𝑃1
𝑚𝑝𝑇
𝜕𝑇
𝜕𝑥 (13)
Where DT,P is the thermophoretic coefficient [37]
𝐷𝑇,𝑃 =6𝜋𝑑𝑝𝜇2𝐶𝑠(𝑘+𝐶𝑡𝑘𝑛)
𝜌(1+3𝐶𝑚𝑘𝑛)(1+2𝑘+2𝐶𝑡𝑘𝑛) (14)
Where Cm=1.146, Cs=1.147 and Ct=2.18 are the momentum exchange, thermal slip and
temperature jump coefficients respectively.
The Saffman lift force which is generated due to shear on the particle by the continuous phase
(this form of lift arises for small particles in flow) is expressed as
𝐹𝐿 =2𝑘𝑠𝜈
12𝜌𝑑𝑖𝑗
𝜌𝑝𝑑𝑝(𝑑𝑙𝑘𝑑𝑘𝑙)1/4 (𝑉 − 𝑉𝑝) (15)
7
where ks =2.594 is a constant and dij is the deformation tensor for the continuous phase which
governs the shear generated around the particle.
The force arising on the particles due to pressure gradient within the fluid is expressed as
𝐹𝑃 = (𝜌
𝜌𝑝)𝑉𝑝
𝜕𝑉
𝜕𝑥 (16)
The inertia required to propel the fluid surrounding the particles gives rise to a virtual mass force
and can be expressed as
𝐹𝑉 =1
2
𝜌
𝜌𝑝
𝑑
𝑑𝑡(𝑉 − 𝑉𝑝) (17)
2.3. Effective Property Model
The following formulations have been used for determining the effective properties (density,
specific heat, viscosity and thermal conductivity in ascending order of equation numbers) of
alumina–water nanofluid considering such fluids as homogeneous single component systems
[38]
𝜌𝑛𝑓 = (1 − 𝜙)𝜌𝑏𝑓 + 𝜙𝜌𝑝 (18)
(𝜌𝐶𝑝)𝑛𝑓 = (1 − 𝜙)(𝜌𝐶𝑝)𝑏𝑓 + 𝜙(𝜌𝐶𝑝)𝑝 (19)
𝜇𝑛𝑓 = 𝜇𝑏𝑓(1+ 10𝜙) (20)
𝑘𝑒𝑓𝑓 = 𝑘𝑓
[𝑘𝑝+(𝑛−1)𝑘𝐵𝐹−(𝑛−1)𝜙(𝑘𝐵𝐹−𝑘𝑝)]
[𝑘𝑝+(𝑛−1)𝑘𝐵𝐹+𝜙(𝑘𝐵𝐹−𝑘𝑝)] (21)
2.4. Computational details
A 3–D, U type, parallel microchannel domain has been created, meshed and fluid flow and heat
transfer solved employing ANSYS Fluent 14.5. Fig. 1(a) shows the geometrical configuration
utilized in the present study. This particular geometry has been revealed to have the worst flow

8
distribution characteristics [9] and hence studies on the same provide information on nanofluid
flow in microchannels for the worst case scenario; an essentiality for design and optimization.
The details of dimensions of geometry and working fluid are as follows: hydraulic diameter (Dh)
of channel is 100µm, area ratio (Achannel/Amanifold) is 0.2, number of channels (N) is 7, aspect ratio
of channel (H/W) is 0.1, working fluid is water and Al2O3–water nanofluid. A mesh consisting of
quadrilateral elements has been utilized and employs the grid at the inlet of the manifold for
injecting the nanoparticles. A grid independence study is carried out by considering different
mesh element numbers and Fig. 1 (b) shows the grid independent study results considering the
flow maldistribution parameter (expressed in Eqn. 22) criteria [9] for grid independence test. As
evident from the figure, there is no change in maldistribution parameter with respect to number
of mesh elements beyond 1250000. A finer element size (1455237 number of mesh elements) is
considered for the present study since availability of large number of surfaces at inlet to inject
more particle streams renders tracking more accurate. Uniform heat flux has been applied at the
bottom and side walls for heat transfer cases and the top wall has been considered adiabatic.
Figure 1: (a) Geometry of parallel microchannel system used as the simulation domain (b) Grid
independence test (maldistribution parameter with respect to number of mesh elements).
9
The present numerical model has been validated with respect to the published reports by
Siva et al. [9] and Singh et al. [16]. The former study discusses in details flow maldistribution of
water in parallel microchannel systems whereas the later study comprises detailed report on the
thermo–hydraulic performance of nanofluids in single microchannel system. The present study
being an effort to shed insight on to the flow and thermal behavior of nanofluids in parallel
microchannel systems is thereby justifiably validated from the two mentioned sources and the
plots have been illustrated in Fig. 2(a), (b) and (c). Fig. 2 (a) validates the present microchannel
model against published data [9], wherein the maldistribution of water among the parallel
channels for two different hydraulic diameters (88µm and 176µm and flow at Re=70) has been
considered. It can be observed from Fig. 2 (a) that the present simulations accurately track the
reported results and this paves a roadway for justifying the homogeneous model results for
nanofluids in parallel microchannels (presented in later sections). Fig. 2 (b) and (c) illustrates the
efficacy of the present model in simulating flow and thermal transport compared to the
experimental reports [16]. The experiments report flow and heat transfer in nanofluids within a
single microchannel and illustrates the effectiveness of the Eulerian–Lagrangian particle tracking
models in such twin phase flows. It is evident from the figure that the present Discrete Phase
Model (DPM) agrees well with reported experimental investigations. Consequently, validating
against documented experimental data for flow of simple fluids and nanofluids in both single as
well as multiple microchannel assemblies essentially provides evidence that the present model
can effectively simulate both homogeneous and discrete phase approaches to determine
performance of nanofluids in microchannel cooling and to provide insight onto the associated
flow and thermal physics.
3. Results and Discussions:
3.1. Adiabatic flows
3.1.1. Pressure drop and flow maldistribution:
In order to comprehensively project the performance of nanofluids as potential coolants
in microelectronics or micromechanical devices employing parallel microchannel systems, it is
of utmost importance to first shed light onto the adiabatic transport of the same. While in case of

10
simple and/or single phase fluids the major adversity to be addressed or modified is the hydraulic
maldistribution in the channel systems, in case of complex and non–homogeneous fluids such as
nanofluids, maldistribution of the effective concentration is also expected to pose additional
concerns towards performance of such systems. Thereby it deems a necessity that a detailed
Eulerian–Lagrangian particle tracking model be employed to simulate such flows and establish
the deviances from the homogeneous property models. Furthermore, it is pertinent that the flow
regimes be identified for the system geometry under consideration within which such
maldistribution is appreciably high and sensitive to changes in flow Reynolds number.
Accordingly, the effects of Reynolds number and concentration on flow and concentration
maldistribution of nanofluids in parallel microchannel systems have been numerically
investigated using the DPM. The flow maldistribution has been quantified based on the flow
maldistribution factor (FMF) expressible as [9]
휂 = (1 −∆𝑃𝑚𝑖𝑛
∆𝑃𝑚𝑎𝑥 ) (22)
Similarly, the extent of concentration maldistribution is quantified using the concentration
maldistribution factor (CMF), defined as
휀 = (1 −𝜙𝑚𝑖𝑛
𝜙𝑚𝑎𝑥 ) (23)
The magnitudes of the FMF and CMF vary between 0 and 1, where 1 represents a scenario of
maximal maldistribution.
The present study utilizes generalized nanofluid formulation throughout and owing to
excellent transport characteristics and stability, aluminum oxide (40–50 nm) and water based
nanofluids have been used [23]. Furthermore, a basic U–type manifold and channel geometry is
considered as it has been reported to exhibit highest maldistribution (compared to I and Z
configurations, [9] and hence a clear picture of nanofluid performance in the worst case scenario
can be obtained. Channel wise pressure drop, a parameter important to characterize flow features
and pumping requirements in parallel channel systems, has been illustrated in Fig. 3 (a), for
nanofluid at three different concentrations (1, 3 and 5 vol. %) and for two different Reynolds
numbers (2 and 50; one low another moderately high). As evident from the figure, the pressure
drop across the channels is higher for the nanofluid compared to water, which is expected given
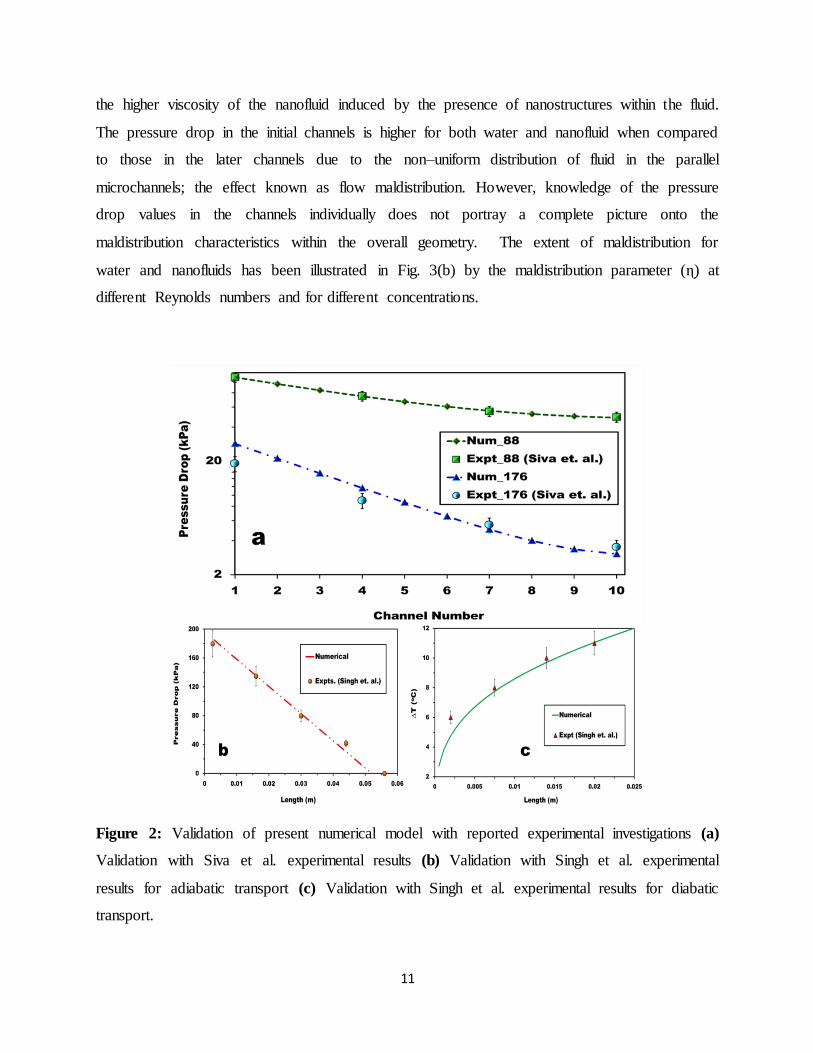
11
the higher viscosity of the nanofluid induced by the presence of nanostructures within the fluid.
The pressure drop in the initial channels is higher for both water and nanofluid when compared
to those in the later channels due to the non–uniform distribution of fluid in the parallel
microchannels; the effect known as flow maldistribution. However, knowledge of the pressure
drop values in the channels individually does not portray a complete picture onto the
maldistribution characteristics within the overall geometry. The extent of maldistribution for
water and nanofluids has been illustrated in Fig. 3(b) by the maldistribution parameter (ɳ) at
different Reynolds numbers and for different concentrations.
Figure 2: Validation of present numerical model with reported experimental investigations (a)
Validation with Siva et al. experimental results (b) Validation with Singh et al. experimental
results for adiabatic transport (c) Validation with Singh et al. experimental results for diabatic
transport.

12
It can be observed from the figure that hydraulic maldistribution increases gradually as a
function of nanofluid concentration and the effect is further enhanced at lower Reynolds
numbers. However, in reality, enhanced viscosity is expected to induce more uniform
distribution and the enhanced flow maldistribution at higher concentration thus provides the first
hint at the behavior of nanofluids as complex, non–homogeneous fluids, where the distribution
of the particles governs the flow behavior. At high Reynolds numbers, the flow is dominated by
inertia, enabling the later channels more share of the working fluid which in turn reduces
maldistribution. Due to high inertial effects, the shear and diffusion induced migration of the
nanoparticles is arrested and the particles are forced to track the streamlines along the direction
of flow, and accordingly, the FMF becomes independent of nanofluid concentrations at high
flow velocities. However, at low Reynolds numbers, the inertia of flow is less and hence
resistance to the random motion of particles due to Brownian effect and shear induced migration
is less. Thereby, the enhanced motion of the nanoparticles leads to concentration maldistribution,
which in turn affects the localized viscous forces and causes further maldistribution of flow. It
can be thus inferred that flow maldistribution exhibits sensitivity to particle concentration and
the deviation from the base flow increases with increasing particle concentrations at low
Reynolds numbers (flow regimes expected in real scenario applications of microscale flow based
heat transfer devices). Nanofluids will therefore not behave as homogeneous fluids in such
devices and hence their transport capabilities in microchannel systems cannot be predicted by
conventional numerical methods employing Effective Property Models (EPM) wherein the
nanofluid is treated as a homogeneous, single component fluid.
Further insight into the behavior of nanofluids in such complex flow paths can be
assessed from comparison of maldistribution obtained from DPM and EPM analyses, as
illustrated in Fig. 4. As observable, the FMF predicted by the EPM remains independent to
changes in either concentration or Re, except for highly concentrated fluids and this anomaly
arises due to the EPM’s treatment of nanofluids as homogeneous and single component, wherein
fluid properties are calculated based on effective material properties. From Fig. 4 it can be
observed that the EPM FMF at 1 and 3 vol. % are similar in magnitude and this occurs due to the
usage of expressions such as Einstein’s or Batchelor’s’ equations [39] for determining viscosity
of suspensions in the EPM. These expressions work well only for very dilute suspensions and the
predictions are weakly dependent on concentration, which leads to similar viscosity values in the

13
two cases, leading to similar FMF. However, at 5 %, the viscosity value predicted by the EPM
increases marginally, leading to marginal drop in the FMF, but all the predictions remain
independent of Re since the distribution of the single phase nanofluid is unaffected by the inertial
effects in the range considered. On the contrary, the variation of FMF can be observed clearly as
functions of Re and concentration when DPM is resorted to and the observations are credible as
Eulerian–Lagrangian approach of modeling nanofluids has been reported to predict experimental
observations unlike its single phase counterparts.
Figure 3: (a) Comparison of nanofluid pressure drop across each channel for three different
concentrations (1, 3 and 5 vol. %) with water (b) Behavior of FMF (ɳ) with respect to
concentration at three Re (in the low, moderate and high inertial regimes).

14
Figure 4: Comparison of FMF of nanofluid obtained utilizing DPM and EPM approaches at
three different concentrations and for three different Re.
The DPM approach is able to capture the proper FMF as the model considers the particles
as a phase in some ways independent of the fluid phase and tracks the migration of the particles
(considering all the diffusive effects like Brownian fluctuations, Saffmann lift, thermophoresis,
Stokesian drag, rotation and so on) within the continuous phase and its interactions with the fluid
as well as neighboring particles. It can be observed in Fig. 4 that increment in concentration at a
particular Re leads to increased DPM FMF, as opposed to the decreasing trend in EPM.
Enhanced particle population expectedly enhanced the viscosity of the nanofluid, which in
accordance to EPM should lead to reduced FMF. However, the fact that increased particle count
per unit volume introduces higher degree of Brownian fluctuations and more importantly drag,
are taken into consideration by the DPM. Exemplary scenario for the enhanced maldistribution
can be provided at this instance. If the first channel be considered, the fluid component of the
nanofluid gets distributed similarly to that of the base fluid. However, owing to higher inertia of
the particles (due to the higher density), only a small fraction of the particle enter the first
channel and effectively enhance the concentration of the fluid heading to the next channel. This
15
enhanced and varying load thereby prevents the fluidic phase to be distributed similar to the base
fluid in the later channels and this continues so forth, thereby inducing higher degrees of
maldistribution to the flow. With increasing concentration, this effect enhances, leading to
further hampering of flow distribution. Increase in flow Re leads to deceased FMF and this is
caused by the dominance of flow inertia. At higher flow velocities, the diffusive and migration
effects of the particles decrease and they more or less follow the flow pattern, leading to more
uniform distribution. In fact, the DPM FMF approaches the EPM FMF as Re increases,
providing evidence that the nanofluid behavior asymptotically approaches homogeneous fluid
behavior at high inertia regimes.
3.1.2. Concentration maldistribution
As discussed in the preceding section, it is also important to understand the particle
concentration distribution during nanofluid flow in parallel microchannels and is something that
all published reports in the field have overlooked. Since it directly affects the cooling
performance, a comprehensive understanding can provide better suited design approaches for
nanofluid based microchannel heat exchangers. Common intuition, considering nanofluids
similar to single phase systems suggests that the nanofluid should distribute similar to the base
fluid, however, this is far from the reality. Fig. 5 illustrates a comparison between the FMF and
concentration maldistribution factor (CMF) for different concentrations and Re. As discussed, it
can be inferred from the figure that nanofluids do not behave like homogeneous fluids as the
FMF and CMFs are grossly dissimilar at different Re and concentrations. While the trends of
both flow and concentration maldistributions as function of inlet concentration are qualitatively
similar at low Re, they are absolutely different at high Re. In fact, Fig 5 provides further
evidence as to the failure of the EPM and the process by which the maldistribution of
concentration in turn leads to non–intuitive flow maldistribution can be gauged. While the FMF
is expected to reduce for concentrated nanofluids, the reverse occurs.
At low Re, the particles are more independent to migrate and diffuse across the
streamlines, and this in turn leads to non–uniform distribution of concentration. As the particle
loading increases, the migration effects, fluidic drag and inter–particle interactions increase,
16
leading to higher CMF. This in turn affects the flow and the FMF enhances too, as discussed in
the preceding section. As Re increases, EPM predicts no noticeable changes in the FMF than
that of low Re, however, DPM predicts appreciable changes. While the decrease in FMF
compared to low Re scenario can be justified based on the higher inertia of flow which arrests
particle migration to some extent; the decrease of CMF at higher Re with increasing
concentrations needs deeper insight. With increasing Re for the same hydraulic diameter, the
flux of the fluid increases and accordingly the streamlines are packed closer. In such cases,
although inertia has arrested diffusive movements orthogonal to the streamlines severely, the
particles still have scope to diffuse and migrate along the direction of the flow. This effect still
leads to uneven distribution and hence at low particle populations, the CMF remains fairly
unaffected. However, as the concentration is increased, the population is packed within the
closely placed streamlines and the migratory movements along the streamlines are also cut off
due to excessive particles in the system. The system thus begins to behave like a packed bed of
granular media and flows more or less along with the base fluid, thereby reducing the
concentration maldistribution. This effect is further pronounced at higher Re values and the CMF
at high concentration further decreases.
The distribution of the particles within the flow geometry also requires a qualitative
analysis so as to understand the overall behavior of nanofluids in microchannel systems. The
DPM concentration profiles at the horizontal geometry mid–plane at low Re for three different
concentrations have been illustrated in the Fig. 6 (a), (b) and (c). As discussed earlier, at low Re,
the particle concentration distribution is relatively uniform at low concentrations compared with
high concentrations and this can be seen qualitatively from Fig. 6. At low concentrations, it can
be observed that a large fraction of the population is channelized through channel 1, followed by
channel 2, whereas the later channels experience flows of much reduced concentration. With
increased concentration to 3 %, the scenario improves with the 3rd and 4th channels getting a fair
share of particles. This happens expectedly as a major fraction of the increased population cannot
travel through the 1st and 2nd channels completely. As the concentration is further increased, the
end channels also start experiencing a large fraction of the particles. In fact, as discussed earlier,
movement analogous to that of a packed bed leads to higher concentration flows within the
central and end channels.
17
Figure 5: Comparison of DPM FMF and CMF for the nanofluid at three different Re and
concentrations.
The concentration distribution contours at a cross section of the inlet manifold (as shown
by arrow) and a cross section of the outlet manifold (as shown by the arrow) have been
illustrated in Fig. 6(b1) and (b2). It can be observed that while the area weighted mean
concentration of the two sections remain same (preservation of continuity of the discrete phase);
the distribution patterns are grossly different. While the distribution at the inlet manifold consists
of many regions of concentrated zones of particle population, its outlet counterpart consists of a
more diffused concentration distribution. In the inlet region, the sole flow mechanism that
actuates mixing of the particulate phase is the convergence of the boundary layers within the
developing region. Within the developing region the mixing is null in the potential flow zone and
full scale mixing begins only convergence and establishment of complete viscid flow regime.
However, the outlet manifold contains flow already experienced to the effects of entrance, exit
and bend of the flow and to mixing of different merging streams of different effective

18
concentrations. Accordingly, the discrete phase is much more diffused and well dispersed within
the outlet manifold than the inlet.
An accurate qualitative assessment of the impact of the particle slip forces on the
concentration maldistribution can be made from the maldistribution pattern at sections very near
(within a few grid lengths) the entrance of the inlet manifold. The concentration distribution
contours at a section proximal to the inlet cross section at different Re have been shown in Fig.
6(d). A non–uniform concentration distribution can be observed to prevail at the entrance of the
inlet manifold at low Re and the uniformity of concentration distribution improves as Re
increases. The diffusion or migration of particles away from the point of entry at regions very
near the entrance of the manifold is due to Brownian motion, since in this region it is the only
slip mechanism which is existent (at the inlet flow is yet to be established and hence drag, lift
etc. are not present). At very low Re, the inertia of the continuous phase is small in magnitude
and the Brownian velocity of particles is comparable with the continuous phase velocity. Hence,
diffusion or migration of the particles away from the streamlines takes place spontaneously;
leading to non–uniform distribution of concentration at the entrance of the manifold itself. This
effect perishes as the Re increases and the phenomenon is observed only when ratio of
continuous phase velocity to Brownian velocity is below 500 (VC / VB< 500). To justify the
above observations, simulations have also been carried out by switching–off the Brownian
component in the governing equations and the corresponding results have been illustrated in Fig.
7. Fig. 7(a) and (b) exhibit the concentration distribution contours at entrance and exit of the inlet
and outlet manifolds respectively without the Brownian effect. Fig.7(c) and (d) illustrate the
same with the Brownian effect incorporated. As observable, while the outlets show some
similarities in the distribution pattern, the inlets are grossly dissimilar and the effect of Brownian
motion on particle maldistribution can be comprehensively understood, thereby making it one of
the most important phenomena at low Re flows of nanofluids in microscale flow devices.

19
Figure 6: Contours of dispersed phase concentration of the nanofluid among the parallel
microchannels at Re=2 for different concentrations (a) ϕ = 1 vol. % (b) ϕ = 3 vol. % (b1)
Concentration distributions at inlet manifold cross section (b2) Concentration distributions at
outlet manifold cross section (c) ϕ = 5 vol. % (d) Contours of concentration distribution at inlet
cross section of inlet manifold at different Reynolds numbers for 1 vol. % with Brownian
diffusion active within the DPM formulation.
The effect of flow inertia on the distribution of the nanofluid and its implications vis–à–
vis concentration maldistribution among the individual can be assessed from the concentration
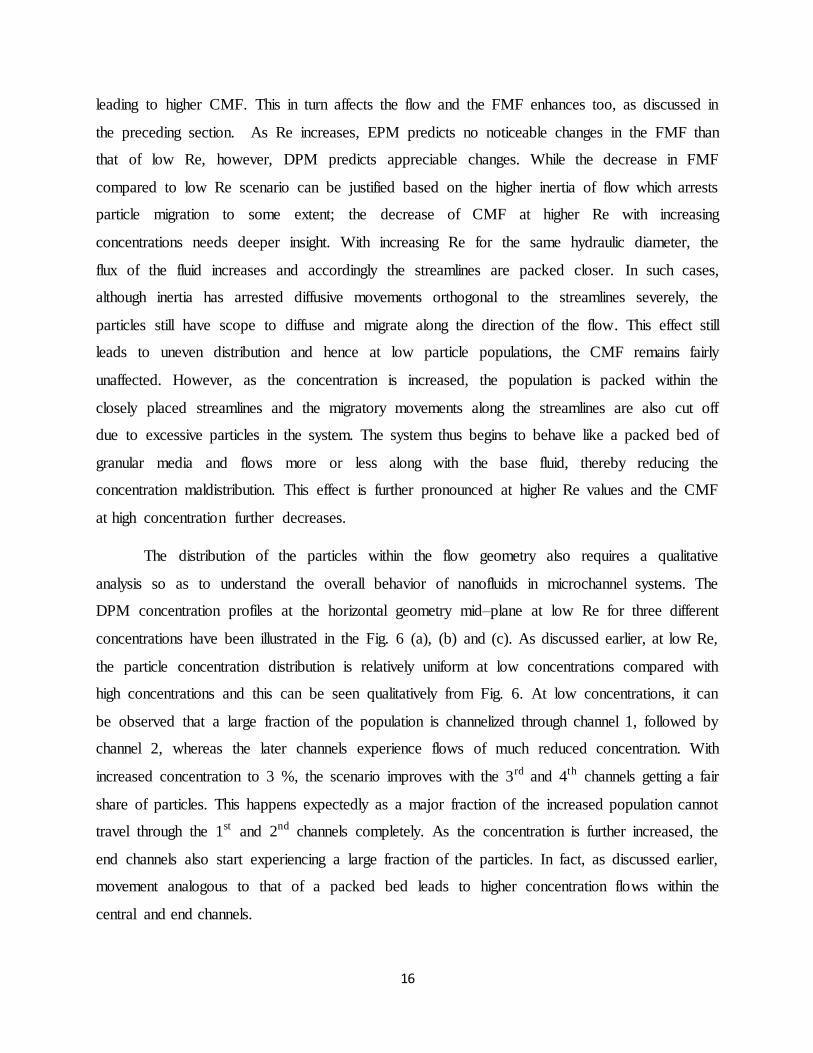
contours within specific channel inlets for different Re. Fig. 8 illustrates the cross sectional
concentration contours at regions very near the inlets of channels 3, 5 and 7 for three different
Re. At low Re, the inertia of the fluid within the inlet manifold is low, thereby allowing the front
channels to get a fair share of the particle population than the case at higher Re, where majority
of the population is flushed to the later channels. This can be observed in Fig. 8, where the
concentration contour in channel 3 at higher Re is much more diffused and has no particle flow

20
aggregations as those in low Re. Channel 5, being almost within the central region, experiences
very little change in distribution pattern with changing Re value. At low Re, a large extent of the
particles travel into the front channels and at high Re they travel through the latter channels,
leaving the central channels with fairly constant share of particles. At low Re, the last channel
gets a dilute flow, as observed in the figure, where large fractions of disappearing dilution can be
observed. As the Re increases, the flushing event pushes more particles to the latter channels and
as evident from the figure, the distribution in channel 7 at moderate and high Re improves
drastically compared to the low inertia regime. Thereby, when used in cooling technologies,
probability of occurrence of hot spots can be deduced to be low among the regions housing the
central channels for almost all inertial regimes.
Figure 7: Dispersed phase mass concentration distribution contours at Re =2 at the (a) entrance
of the inlet manifold with Brownian effect switched off (b) exit of the outlet manifold with
Brownian effect switched off (c) entrance of the inlet manifold with Brownian effect
incorporated (d) exit of the outlet manifold with Brownian effect incorporated.
21
Figure 8: Effect of flow inertia on the concentration distribution within individual channels (at a
section proximal to the channel inlet) for nanofluid of a fixed concentration.
3.2. Diabatic flows
3.2.1. Flow maldistribution
Although understanding flow maldistribution is important for optimizing the pumping
characteristics, understanding the same with increasing heat loads is required for efficient design
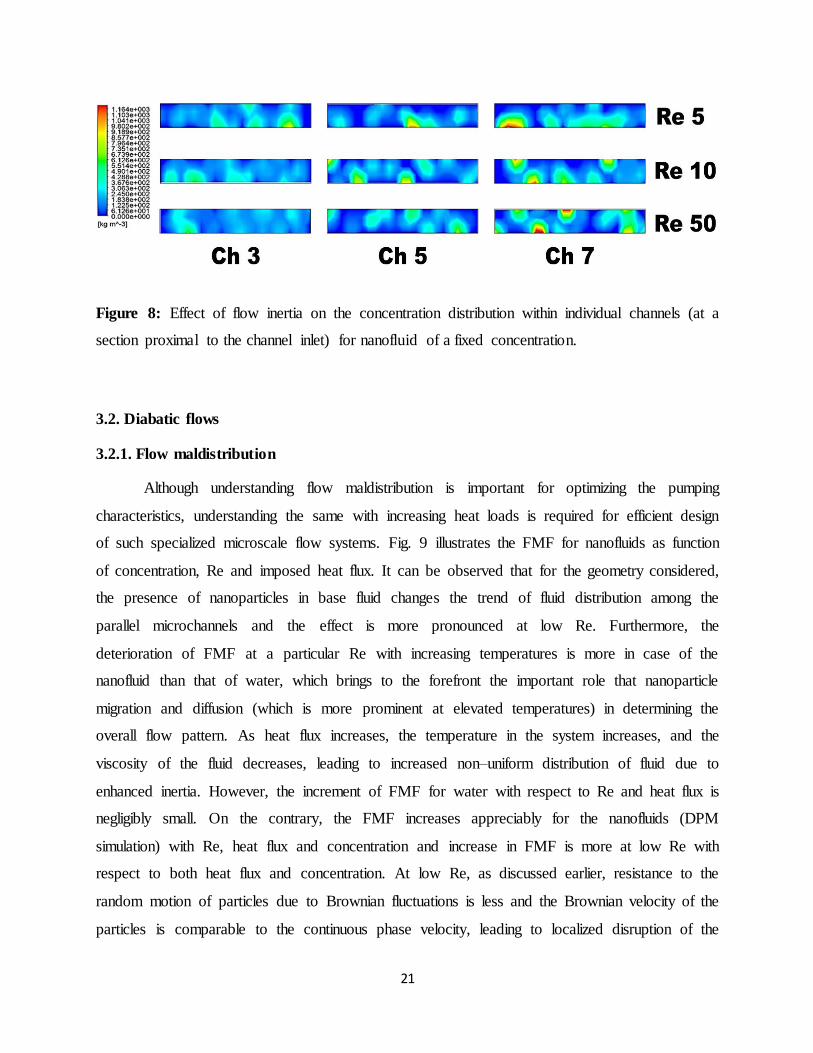
of such specialized microscale flow systems. Fig. 9 illustrates the FMF for nanofluids as function
of concentration, Re and imposed heat flux. It can be observed that for the geometry considered,
the presence of nanoparticles in base fluid changes the trend of fluid distribution among the
parallel microchannels and the effect is more pronounced at low Re. Furthermore, the
deterioration of FMF at a particular Re with increasing temperatures is more in case of the
nanofluid than that of water, which brings to the forefront the important role that nanoparticle
migration and diffusion (which is more prominent at elevated temperatures) in determining the
overall flow pattern. As heat flux increases, the temperature in the system increases, and the
viscosity of the fluid decreases, leading to increased non–uniform distribution of fluid due to
enhanced inertia. However, the increment of FMF for water with respect to Re and heat flux is
negligibly small. On the contrary, the FMF increases appreciably for the nanofluids (DPM
simulation) with Re, heat flux and concentration and increase in FMF is more at low Re with
respect to both heat flux and concentration. At low Re, as discussed earlier, resistance to the
random motion of particles due to Brownian fluctuations is less and the Brownian velocity of the
particles is comparable to the continuous phase velocity, leading to localized disruption of the

22
flow field by the particle diffusion and maldistribution of fluid due to summation of the effects.
As heat flux increases, the viscosity of the fluid decreases and simultaneously the thermal
migration of the nanoparticles increases and the net effect lead to higher degrees of
maldistribution. At high Re, inertia dominates within the flow regime and resistance to the
random motion of particle is high and thus presence of particles in base fluid does not affect the
distribution of fluid among the channels to appreciable extents. However, it can be observed that
the FMF tends to a plateau value as the concentration increases. At concentrations beyond 5 vol.
% (already in the concentrated regime), the effect of particle migration is greatly reduced by
overcrowding and the viscosity of the overall fluid enhances drastically, leading to attainment of
a saturation value for FMF. Several associated phenomena have been discussed in the subsequent
sections where concentration maldistribution at enhanced temperatures has been dealt with in
depth.
Figure 9: FMF for nanofluids with respect to concentration at three different heat fluxes for
three different Re.
23
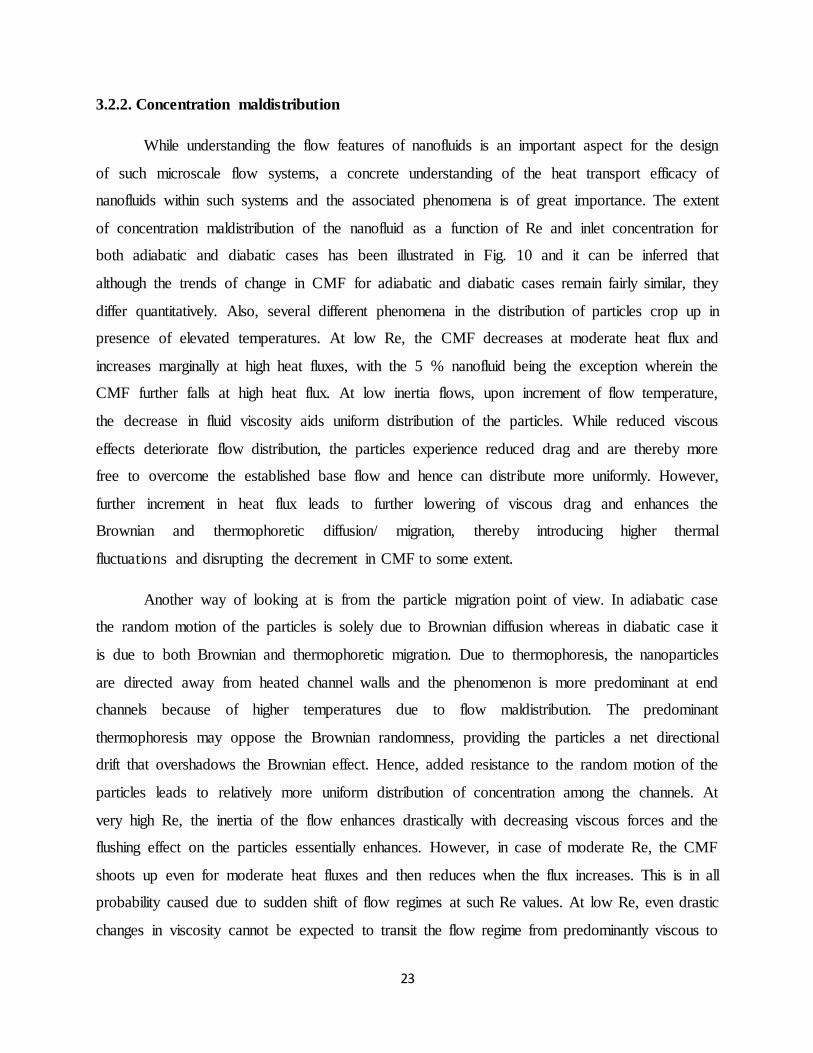
3.2.2. Concentration maldistribution
While understanding the flow features of nanofluids is an important aspect for the design
of such microscale flow systems, a concrete understanding of the heat transport efficacy of
nanofluids within such systems and the associated phenomena is of great importance. The extent
of concentration maldistribution of the nanofluid as a function of Re and inlet concentration for
both adiabatic and diabatic cases has been illustrated in Fig. 10 and it can be inferred that
although the trends of change in CMF for adiabatic and diabatic cases remain fairly similar, they
differ quantitatively. Also, several different phenomena in the distribution of particles crop up in
presence of elevated temperatures. At low Re, the CMF decreases at moderate heat flux and
increases marginally at high heat fluxes, with the 5 % nanofluid being the exception wherein the
CMF further falls at high heat flux. At low inertia flows, upon increment of flow temperature,
the decrease in fluid viscosity aids uniform distribution of the particles. While reduced viscous
effects deteriorate flow distribution, the particles experience reduced drag and are thereby more
free to overcome the established base flow and hence can distribute more uniformly. However,
further increment in heat flux leads to further lowering of viscous drag and enhances the
Brownian and thermophoretic diffusion/ migration, thereby introducing higher thermal
fluctuations and disrupting the decrement in CMF to some extent.
Another way of looking at is from the particle migration point of view. In adiabatic case
the random motion of the particles is solely due to Brownian diffusion whereas in diabatic case it
is due to both Brownian and thermophoretic migration. Due to thermophoresis, the nanoparticles
are directed away from heated channel walls and the phenomenon is more predominant at end
channels because of higher temperatures due to flow maldistribution. The predominant
thermophoresis may oppose the Brownian randomness, providing the particles a net directional
drift that overshadows the Brownian effect. Hence, added resistance to the random motion of the
particles leads to relatively more uniform distribution of concentration among the channels. At
very high Re, the inertia of the flow enhances drastically with decreasing viscous forces and the
flushing effect on the particles essentially enhances. However, in case of moderate Re, the CMF
shoots up even for moderate heat fluxes and then reduces when the flux increases. This is in all
probability caused due to sudden shift of flow regimes at such Re values. At low Re, even drastic
changes in viscosity cannot be expected to transit the flow regime from predominantly viscous to
24
high inertia. Similarly, high Re flows being predominantly inertial remain inertial due to
decrease in viscosity. At moderate Re, where the flows are not dominated totally by either
viscous or inertial regimes, a slight alteration in viscosity value can shift the flow to fully inertial
regime, leading to drastic localized particle maldistribution. This is possibly why the CMF
increases suddenly even at moderate heat fluxes. However, at high heat flux, the viscous forces
further decrease and flushing in behavior slowly sets in, which reduces the maldistribution as in
high Re scenarios. Also, at high Re, Brownian fluctuations are effectively arrested by inertia and
thermophoretic drift reduces due to more uniform cooling at high flow velocities, resulting in
similar concentration distribution among the channels for different concentrations.
Figure 10: CMF for nanofluid as function of inlet concentration and Re for adiabatic flow and
diabatic flows with 1 and 2 kW/m2 heat fluxes applied to the geometry (legend : heat flux _
concentration).
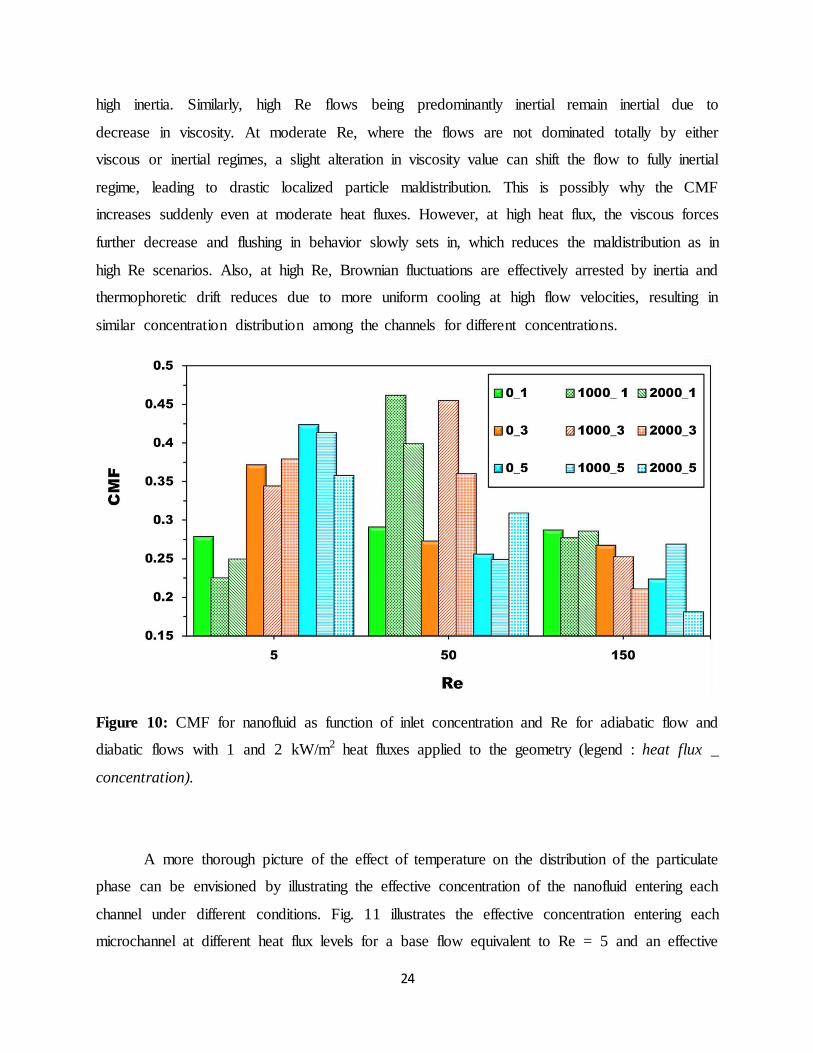
A more thorough picture of the effect of temperature on the distribution of the particulate
phase can be envisioned by illustrating the effective concentration of the nanofluid entering each
channel under different conditions. Fig. 11 illustrates the effective concentration entering each
microchannel at different heat flux levels for a base flow equivalent to Re = 5 and an effective
25
concentration of 5 vol. % entering the inlet manifold. It can be observed from Fig. 11 that the
effective concentration in the individual microchannels is different for different heat fluxes,
thereby leading to differences in the CMF. Increment in temperature due to the moderate heat
flux can be observed to lead to a shift in the distribution pattern. While for the adiabatic
condition the former channels and the very last channel received flows of appreciable
concentration, the 1 kW/m2 condition leads to much better distribution among the central
channels as well. As heat flux is applied, thermophoresis comes into the picture along with
Brownian diffusion and since the Re is low, the resistance to the migration of the particles due to
both the effects is less. Thermophoresis directs the particle population away from the manifold
outer walls (due to less cooling than the channel side) and essentially towards the channels,
causing the particles to distribute more uniformly among the channels than adiabatic conditions.
This is in agreement to the observations if Fig. 11. For increased heat flux i.e. 2 kW/m2, the
location of the valleys (low effective concentration) and peaks are qualitatively similar to the
adiabatic case, except for the end channels. With increment in temperature, the effect of
Brownian motion increases drastically and the directionality of the thermophoretic drift is
overshadowed (but not obliterated) to some extent, leading to deteriorated distribution similar to
adiabatic conditions. However, towards the end of the manifold, where the temperature gradients
are higher due to flow maldistribution caused by reduced viscosity, the thermophoretic drift
regains upper hand and leads to better distribution than the adiabatic case.
The effect of temperature on the distribution of the particulate phase can also be
qualitatively understood from the concentration contours within each channel. Fig. 12 illustrates
the same at a section located at the lengthwise center of the channels for different heat fluxes and
for a nanofluid of 5 vol. % and manifold flow corresponding to Re = 5. From the contours it can
be observed that at 0, 1 and 2 kW/m2 the maximum effective concentration exists in channel 7,
channel 4 and channel 6 respectively and the minimum effective concentration can be observed
in channel 5, channel 7 and channel 2 respectively (which are in agreement with the quantified
data in Fig. 11a). It can further be seen that in the diabatic cases, especially for the later channels,
there exist distinguishable regions of very low concentration near the side and bottom walls
(such as in channels 5, 6 and 7 of 1 kW/m2 and channels 6 and 7 of 2 kW/m2). Such migration
away from the heated channel walls is clear evidence of thermophoretic drift and is strong in the
later channels as these experience large thermal gradients caused by maldistribution in the base

26
flow. The concentration within the front channels are more diffused due to the greater degree of
mixing by the base flow. As the flow moves towards the later channels, it loses inertia and the
particulate phase sluggishly drifts along, forming occasional clustered regions due to lack of
inertia induced mixing. However, as the viscous resistance reduces with temperature, the
diffused contour can be seen to extend up to channel 4 in 2 kW/m2 case as compared to channel 2
in the adiabatic case. Such observations provide firm support on the efficacy of nanofluids as
future generation micro device coolants.
Figure 11: (a) Effective concentration in individual microchannel for different heat fluxes for
Re=5 and concentrated nanofluid (5 vol. %). (b) The behavior of the CMF at different heat
fluxes for conditions equivalent to (a).

27
Figure 12: Particle mass concentration distribution contours in individual channels at different
heat fluxes for Re=5 and 5 vol. %.
Having discussed the distribution patterns of the nanoparticles in the individual channels and
also the effect of temeprature on the same, more insight can be shed onto the subject matter by
considereing the effect of temperature on the distribution cross section of the nanoparticles along
a particular channel. Fig. 13 illustrates the concentration cross section for the nanoparticles
within channel 3 (for adiabatic conditions) and channel 5 (at 2 kW/m2). These cases have been
meticulously chosen as these channels receive nanofluid flow of the same effective concentration
(evident from Fig. 11). As observable, the distribution pattern in case of the adiabatic flow
remains qualitativley similar whereas that of the diabatic case clearly shows signs of
redistribution and mixing. The fact that the particles tend to stay away from the heated bottom
wall of the channel in the diabatic case further proves the vital effect of thermophoresis in
particle distribution and subsequent heat transport. As the flow traverses towards the end of the
channel, it gathers more heat and the Brownian flux increases, leading to more diffused
distribution than that of the channel entrance regions.

28
Figure 13: Particle mass concentration contours of nanoparticles at Re = 5 and 5 vol. %
nanofluid in channel 3 and channel 5 at different cross sections for 0 W/m2 and 2 kW/m2
respectively. The channels have been so chosen since they have the same equivalent
concentrations entering from the manifold (Fig. 11 (a)).
3.2.3. Thermal performance
The cooling capability of the nanofluids is of course a major focus of the present article.
Fig. 14 (a) and (b) illustrate the difference between the temperatures at the inlet and outlet in
individual channels at 1000 W/m2. The temperature drop different Re for 5 vol. % nanofluid has
been shown in Fig. 10 (a). From the figure it can be inferred that the temperature drop for initial
channels is less when compared to those of end channels and this is because of non–uniform
distribution of fluid due to flow maldistribution. Increase in Re enhances the heat transfer
coefficient as well as the increased inertia leads to better fluid distribution among later channels,
leading to less temperature drop across the channels. As discussed earlier, the presence of
nanoparticles in base fluid leads to change in flow distribution among channels and this effect is
more obvious at low Re and high concentrations (as illustrated in Fig. 3(b)) and the same can
also be observed in Fig 10 (a) and (b). At high Re, the temperature drop in channels follow an
inclined line with a constant slope whereas the slope of the line gradually increases at low Re. At
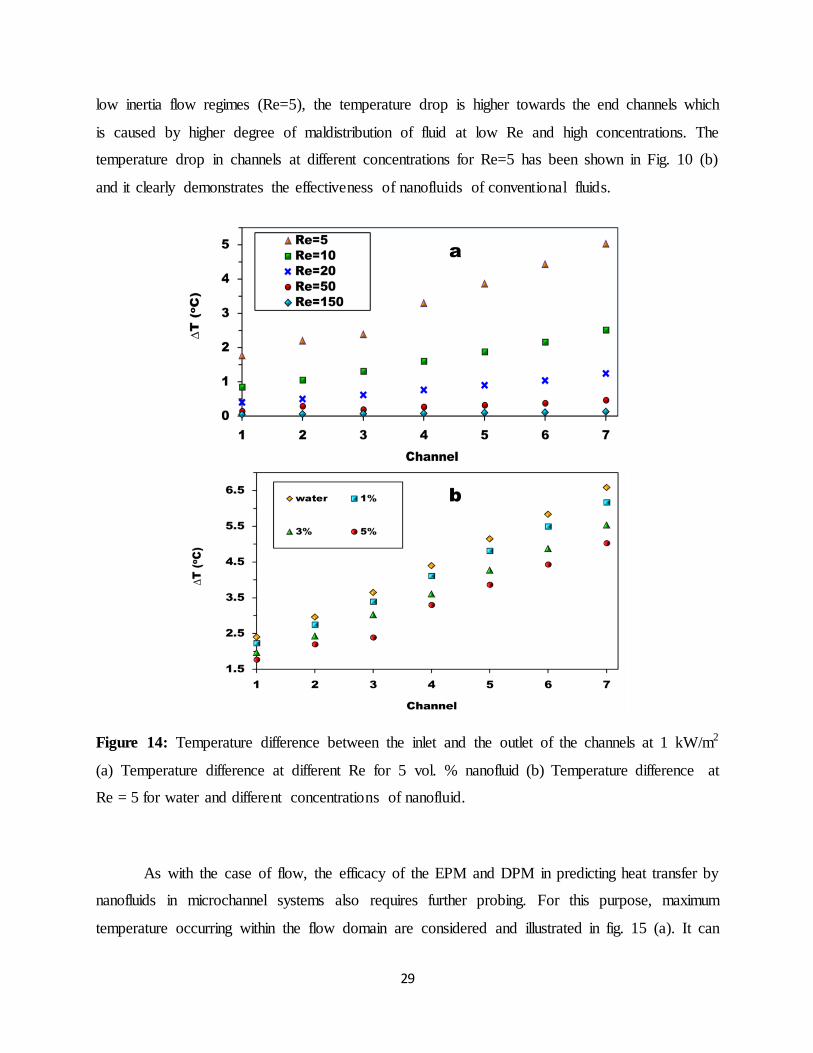
29
low inertia flow regimes (Re=5), the temperature drop is higher towards the end channels which
is caused by higher degree of maldistribution of fluid at low Re and high concentrations. The
temperature drop in channels at different concentrations for Re=5 has been shown in Fig. 10 (b)
and it clearly demonstrates the effectiveness of nanofluids of conventional fluids.
Figure 14: Temperature difference between the inlet and the outlet of the channels at 1 kW/m2
(a) Temperature difference at different Re for 5 vol. % nanofluid (b) Temperature difference at
Re = 5 for water and different concentrations of nanofluid.
As with the case of flow, the efficacy of the EPM and DPM in predicting heat transfer by
nanofluids in microchannel systems also requires further probing. For this purpose, maximum
temperature occurring within the flow domain are considered and illustrated in fig. 15 (a). It can
30
be observed that the results obtained from EPM analysis are consistently higher than those
obtained from DPM analysis and this difference increases with increase in heat load. Essentially,
the figure further shed light onto the effectiveness of DPM in modeling convective transport in
nanofluids. Since the maximum temperature within the domain is lower in case of DPM than
EPM, it essentially means that the non–homogeneous nature of the nanofluids lead to efficient
cooling of hotspots within the domain, thus establishing the ‘smart fluid’ characteristics of
nanofluids and the efficacy of DPM in capturing the same. The EPM predicts higher degrees of
thermal maldistribution compared to DPM, up to 5 oC in case of 5 kW/m2 heat load and Re =5,
since it does not account the particle migration effects. Effects such as enhanced Brownian and
thermophoretic flux due to high heat flux leads to enhanced transport of heat from the channel
walls to the bulk fluid as well as modifies particle distribution patterns (as discussed earlier),
leading to more cooling, both in magnitude and uniformity. It is only beyond Re values of 50
that the predictions by EPM are similar to that of DPM since at high velocity flows, the
migration effects are arrested and the cooling essentially occurs due to increased mass flux of
fluid. However, for microscale devices where low Re flows are expected in reality, such analysis
is required for predicting cooling capabilities of nanofluids as working fluids. A larger
magnitude of the standard deviation of temperatures at a statistical population of data points in
the domain essentially signifies more non–uniformity in the cooling characteristics. The
differences between the standard deviations obtained for EPM and DPM based computations
have been illustrated in Fig. 15 (b). As observable from Fig. 15 (b), nanofluids are more effective
cooling fluids than water, irrespective of the model employed for prediction. The caliber of the
EPM can be seen to deteriorate with increasing concentration and this is further evidence that the
particle migration and diffusive events are major governing parameters towards understanding
thermofluidic performance of nanofluids.
Finally, having established the physics of flow distribution of nanofluids in parallel
microchannel systems and the overall cooling effectiveness, it deems a necessity to
mathematically predict the cooling capability of a given nanofluid for a particular geometry so as
to reduce experimental trials for system optimization. The performance of a fluid in cooling a
complex geometry can be assessed from the average temperature of the system and the standard
deviation of a statistical population of temperatures. It has already been established that
nanofluids are better coolants when the average temperature is concerned, as it is lower than that

31
due to the base fluid itself. Furthermore, as shown in Fig. 15 (b), the standard deviation of the
temperatures of a large number of points in the heated domain is also low in case of nanofluids,
thereby proving that these fluids not only cool a system better but does the same much more
uniformly than normal fluids. However, the extent of this uniformity needs to be mathematically
predicted in order to understand the effects of nanofluid concentration and flow domains on the
cooling caliber. From analysis of data, the standard deviation of the temperature drop in the
channels (proposed here as the Cooling Performance Uniformity Factor) can be related to
standard deviation for water as base fluid (at same Re), the Re and concentration are expressed
as
Figure 15: Quantitative illustration of the efficiency of the DPM over the conventional EPM in
prediction thermofluidics features of nanofluid flows. (a) Difference between the maximum
temperatures, as obtained from EPM and DPM simulations, of a multitude of temperature data
32
points extracted from the total domain, for different Re. The high cooling capability of
nanofluids can solely be predicted by the DPM which incorporates particle migration effects. (b)
The increasing performance of DPM in prediction of cooling caliber of nanofluids with
increasing concentration validates the importance of particle migration effects in such fluids.
, ,Re Re
Re( ) ( )
Re
critch nf ch bfCPUF T T
(24)
The predictions obtained from the described equation have been compared with respect to the
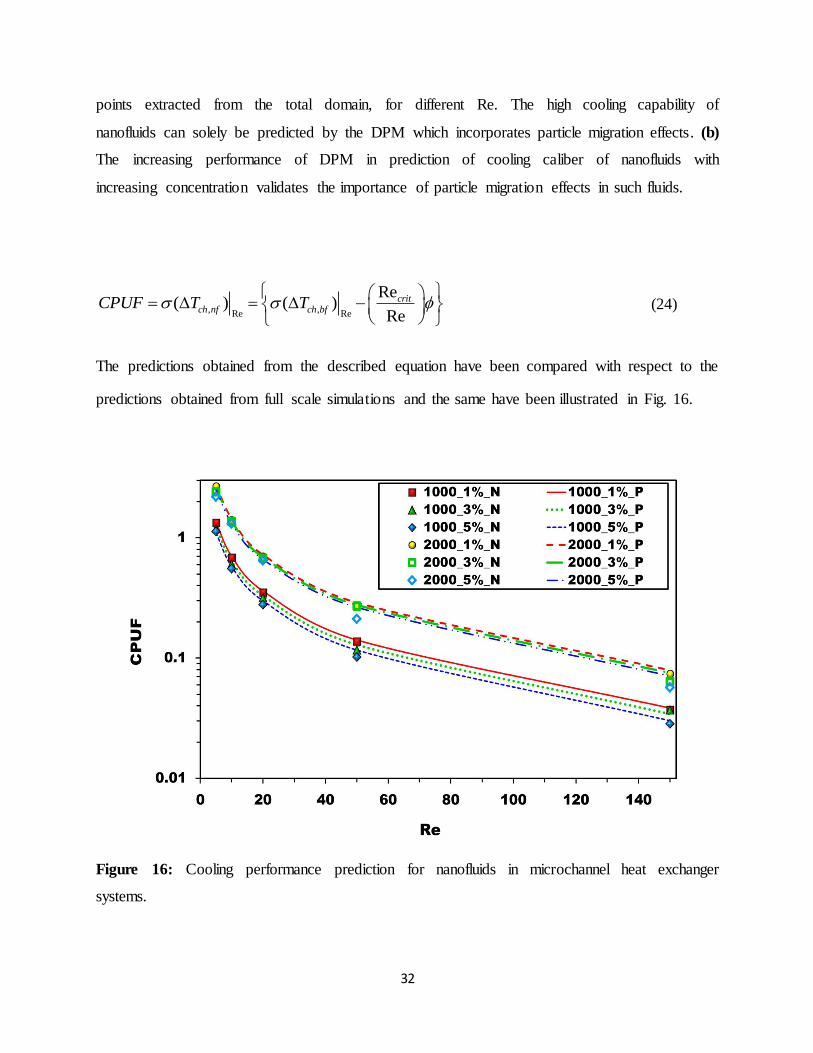
predictions obtained from full scale simulations and the same have been illustrated in Fig. 16.
Figure 16: Cooling performance prediction for nanofluids in microchannel heat exchanger
systems.

33
The uniformity parameter has been found to be a direct function of concentration, i.e., the
reduction in standard deviation compared to that of water is higher when concentrated nanofluids
are employed. While this sounds promising, very high concentrations lead to excessive pumping
power and stability issues for the nanofluid in reality. Accordingly, the concentration requires
being optimal so as to obtain minimal increment in pumping power and maximum possible
uniformity in cooling. Similarly, the inverse relation to the Re implies that flows of higher
velocity lead to reduction in uniformity and this has been observed before that as Re increases,
the behavior tends towards that of a homogeneous fluid. Accordingly, the Re also requires
optimization so as to obtain maximal uniformity in cooling but should not be too low such that
the average cooling performance deteriorates at the expense of uniformity. The effect of
geometry comes into the picture through the critical Re value, which is purely dependent on the
geometry. At low Re, the CMF increases with increment in concentration and at higher Re, it
decreases. The transit Re value at which the CMF becomes independent of the concentration is
termed as the critical Re and can be deduced from analysis of simulation results. For the present
geometry, this is determined to be ~ 30 and a clear scrutiny of Fig. 5 shows that the CMF is
fairly constant for Re = 50, thus providing credibility to the obtained value.
4. Conclusions
To infer, the present article deals with the flow and concentration maldistribution of nanofluids
in parallel microchannel systems. Reports in literature treat nanofluids as homogeneous single
phase fluids with enhanced effective properties and conclude improved cooling performance in
such devices. However, experiments reveal that such predictions fall short of the real fluid
distribution and cooling performance and hence a non–homogeneous two phase model has to be
utilized to model nanofluid flows. In this article, an Eulerian–Lagrangian model for nanofluid
flow in U configuration parallel microchannels has been considered and distribution of particles
as well as the fluid and their impact vis-à-vis thermal performance has been reported. It has been
observed that EPM cannot be used to predict nanofluid performance in complex flow geometries
34
as the distribution of particles and the fluid are inter–dependent on the distribution patter of one
another. This leads to grossly different flow distribution patterns and the effective particle
concentration flowing in the individual channels. This distribution is further dependent on
temperature and the distribution has been observed to be more uniform at high heat fluxes.
Essentially, this leads to ‘smart’ and more uniform cooling and this is only predicted by DPM
formulation. A mathematical predictive model has also been proposed to determine a
quantitative measure of the uniformity of cooling performance of the nanofluid over water as
base fluid. The present findings can be utilized to obtain a priori estimates of nanofluid behavior
within a particular micro–geometry for optimizing flow and thermal performance in parallel
microchannel heat sinks employing nanofluid coolants.
Acknowledgements
The authors thank the Defence Research and Development Organization (DRDO) of India for
partial financial support for the computational facilities. (Grant no. ERIP/ER/RIC/2013/M/
01/2194/D (R&D)). LSM would like to thank the Ministry of Human Resource Development
(Govt. of India) for the doctoral scholarship. PD would like to thank IIT Madras for the post–
doctoral fellowship.
References
[1] D. B. Tuckerman and R. F. W. Pease, High performance heat sinking for VLSI, IEEE
Electron Device Letters 2 (5) (1981) 126-129.
[2] Q. Weilin and I. Mudawar, Analysis of three dimensional heat transfer in micro- channel
heat sinks, International Journal of Heat and Mass Transfer 45 (19) (2002) 3973-3985.
[3] X. F. Peng, G. P. Peterson and B. X. Wang, Heat transfer characteristics of water flowing
through microchannels, Experimental Heat Transfer 7 (4) (1994) 265-283.
[4] W. Qu, G. M. Mala and D. Li, Pressure driven water flows in trapezoidal silicon
microchannels, International Journal of Heat and Mass Transfer 43 (3) (2000) 353-364.
[5] J. Judy, D. Maynes and B. W. Web, Characterization of frictional pressure drop for liquid
flows through microchannels, International Journal of Heat and Mass Transfer 45 (17)
(2002) 3477-3489.
35
[6] M. K. Bassiouany and H. Martin, Flow distribution and pressure drop in plate heat
exchanger-I U-type, Chemical Engineering Science 39 (4) (1983) 693-700.
[7] M. K. Bassiouany and H. Martin, Flow distribution and pressure drop in plate heat
exchanger-II Z-type, Chemical Engineering Science 39 (4) (1983) 701-704.
[8] S. Maharudrayya, S. Jayanti and A. P. Deshpande, Pressure drop and flow distribution in
multiple parallel channel configuration used in PEM fuel cell stacks, Journal of Power
Sources 157 (1) (2006) 358-367.
[9] M. V. Siva, A. Pattamatta and S. K. Das, Investigation on flow maldistribution in parallel
microchannel systems for integrated microelectronic device cooling, IEEE Transactions
on Components, Packing and Manufacturing Technology 4 (3) (2014) 438-450.
[10] B. J. Jones, P. Lee, and S. V. Garimella, Infrared micro-particle image velocimetry
measurements and predictions of flow distribution in a microchannel heat sink,
International Journal of Heat and Mass Transfer 51 (7-8) (2008) 1877-1887.
[11] S. S. Seghal, K. Murugesan and S. K. Mohapatra, Experimental investigation of the effect
of flow arrangements on the performance of a micro-channel heat sink, Experimental
Heat Transfer 24 (3) (2011) 215-233.
[12] R. Chein and J. Chen, Numerical study of the inlet/outlet arrangement effect on
microchannel heat sink performance, International Journal of Thermal Sciences 48 (8)
(2009) 1627-1638.G.
[13] G. Kumaraguruparan, R. Manikanda Kumaran, T. Sornakumar and T. Sundararajan, A
numerical and experimental investigation of flow maldistribution in a microchannel heat
sink, International Communications in Heat and Mass Transfer 38 (10) (2011) 1349–
1353.
[14] M. V. Siva, A. Pattamatta and S. K. Das, A numerical study of flow and temperature
maldistribution in a parallel microchannel system for heat removal in microelectronic
devices, ASME Journal of Thermal Sciences and Engineering Applications 5 (4) (2013)
041008-1–041008-8.
[15] A. Bejan and A. M. Morega, Optical arrays of pin fins and plate fins in laminar forced
convection, ASME Journal of Heat Transfer 115 (1) (1993) 75-81.
[16] P. K. Singh, P. V. Harikrishna, T. Sundarajan and S. K. Das, Experimental and numerical
investigation into the heat transfer study of nanofluids in microchannel, ASME Journal of
Heat Transfer 133 (12) (2011) 121701-1–121701-9.
[17] S. U. S. Choi, and J. A. Eastman, Enhancing thermal conductivity of fluids with
nanoparticles, in: proceedings of the 1995 ASME International Mechanical Engineering
Congress and Exposition, San Francisco, CA, USA, 1995.
[18] B. Pak and Y. I. Cho, Hydrodynamic and Heat Transfer Study of Dispersed Fluids with
Submicron Metallic Oxide Particle, Experimental Heat Transfer 11 (1998) 151-170.
[19] P. Dhar, S. Sengupta, S. Chakraborty, A. Pattamatta and S. K. Das, The role of
percolation and sheet dynamics during heat conduction in polydispersed graphene
nanofluids, Applied Physics Letters 102 (16) (2013) 163114.

36
[20] S. Lee, S. U. S. Choi, S. Li, and J. A. Eastman, Measuring Thermal Conductivity of
Fluids Containing Oxide Nanoparticles, Journal of Heat Transfer 121 (1999) 280–289.
[21] J. Koo and C. Kleinstreuer, A new thermal conductivity model for nanofluids, Journal of
Nanoparticle Research 6 (2004) 577-588.
[22] S. K. Das, N. Putra, P. Thiesen and W. Roetzel, Temperature dependence of thermal
conductivity enhancement for nanofluids, Journal of Heat Transfer 125 (4) (2003) 567-
574.
[23] Das, S. K., Choi, S. U. S., and Patel, H. E., 2006, Heat transfer in nanofluids- A Review,
Heat Transfer Engineering 27(10), 3-19.
[24] S. M. S. Murshed, K. C. Leong and C. Yang, Thermo-physical and Electro kinetic
Properties of Nanofluids—A Critical Review, Applied Thermal Engineering 28 (17–18)
(2008) 2109–2125.
[25] S. Özerinç, S. Kakaç, A.G. Yazıcıoğlu, Enhanced thermal conductivity of nanofluids: a
state-of-the-art review, Microfluidics Nanofluidics 8 (2010) 145–170.
[26] C.J. Ho, L.C. Wei, Z.W. Li, An experimental investigation of forced convective cooling
performance of a microchannel heat sink with Al2O3/water nanofluid, Applied Thermal
Engineering 30 (2010) 96–103.
[27] H. A. Mohammed, G. Bhaskaran, N.H. Shuaib, H.I. Abu-Mulaweh, Influence of
nanofluids on parallel flow square microchannel heat exchanger performance,
International Communications in Heat and Mass Transfer 38 (2011) 1–9.
[28] C.-H. Chen, C.-Y. Ding, Study on the thermal behavior and cooling performance of a
nanofluid-cooled microchannel heat sink, International Journal of Thermal Sciences 50
(2011) 378–384.
[29] M. Kalteh, A. Abbassi, M. Saffar-Avval, J. Harting, Eulerian–Eulerian two-phase
numerical simulation of nanofluid laminar forced convection in a microchannel,
International Journal of Heat and Fluid Flow 32 (2011) 107–116.
[30] T.-C. Hung, W.-M. Yan, X.-D. Wang, C.-Y. Chang, Heat transfer enhancement in
microchannel heat sinks using nanofluids, International Journal of Heat and Mass
Transfer 55 (2012) 2559–2570.
[31] A. Raisi, B. Ghasemi, S.M. Aminossadati, A Numerical Study on the Forced Convection
of Laminar Nanofluid in a Microchannel with Both Slip and No-Slip Conditions,
Numerical Heat Transfer Part A Applications 59 (2011) 114–129.
[32] S.P. Jang, S.U.S. Choi, Cooling performance of a microchannel heat sink with
nanofluids, Applied Thermal Engineering 26 (2006) 2457–2463.
[33] B.H. Salman, H.A. Mohammed, K.M. Munisamy and A. Sh. Kherbeet, Characteristics of
heat transfer and fluid flow in microtube and microchannels using conventional fluids
and nanofluids: A Review, Renewable Sustainable Energy Reviews 28 (2013) 848-880.
[34] H.A. Mohammed, G. Bhaskaran, N.H. Shuaib and , R. Saidur, Heat transfer and fluid
flow characteristics in microchannel heat exchangers using nanofluids- A Review,
Renewable Sustainable Energy Reviews 15 (3) (2011) 1502-1512.

37
[35] FLUENT 12.0 User manual, ANSYS FLUENT.
[36] A. Li, and G. Ahmadi, Dispersion and Deposition of Spherical Particles From Point
Sources in A turbulent Channel Flow, Aerosol Science and Technology 16 (4) (1992)
209–226.
[37] L. Talbot, R. K. Cheng, R. W. Schefer and D. R. Willis, Thermophoresis of Particles in a
Heated Boundary Layer, Journal of Fluid Mechanics 101 (4) (1980) 737–758.
[38] K. B. Anoop, S. Kabelac, T. Sundararajan and S. K. Das, Rheological and Flow
Characteristics of Nanofluids: Influence of Electroviscous Effects and Particle
Agglomeration, Journal of Applied Physics 106 (2009) 034909.
[39] P. Dhar, H. Ansari, S. Sengupta, V.M. Siva, T. Pradeep, A. Pattamatta and S.K. Das,
Percolation network dynamicity and sheet dynamics governed viscous behavior of
polydispersed graphene nanosheet suspensions, Journal of Nanoparticle Research 15 (12)
(2013) 1–12.