participative management and productivity: partners or
TRANSCRIPT

Western Michigan University Western Michigan University
ScholarWorks at WMU ScholarWorks at WMU
Dissertations Graduate College
6-1995
Participative Management and Productivity: Partners or Participative Management and Productivity: Partners or
Adversaries? Adversaries?
Michael Heenan Swearingen Western Michigan University
Follow this and additional works at: https://scholarworks.wmich.edu/dissertations
Part of the Educational Assessment, Evaluation, and Research Commons, and the Educational
Leadership Commons
Recommended Citation Recommended Citation Swearingen, Michael Heenan, "Participative Management and Productivity: Partners or Adversaries?" (1995). Dissertations. 1769. https://scholarworks.wmich.edu/dissertations/1769
This Dissertation-Open Access is brought to you for free and open access by the Graduate College at ScholarWorks at WMU. It has been accepted for inclusion in Dissertations by an authorized administrator of ScholarWorks at WMU. For more information, please contact [email protected].
PARTICIPATIVE MANAGEMENT AND PRODUCTIVITY:PARTNERS OR ADVERSARIES?
by
Michael Heenan Swearingen
A Dissertation Submitted to the
Faculty of The Graduate College in partial fulfillment of the
requirements for the Degree of Doctor of Education
Department of Educational Leadership
Western Michigan University Kalamazoo, Michigan
June 1995
Reproduced with permission of the copyright owner. Further reproduction prohibited without permission.
PARTICIPATIVE MANAGEMENT AND PRODUCTIVITY:PARTNERS OR ADVERSARIES?
Michael Heenan Swearingen, Ed.D.
Western Michigan University, 1995
The purpose of this study was to determine what style of management was
used by different office furniture manufacturers and whether or not a participative
style of management affected organizational productivity. Organizational produc
tivity was defined by factoring together the yearly sales and the financial stability
for the organization, as defined by Dun & Bradstreet.
The five hypotheses studied were:
1. The higher the educational level of the organization's management
is, the more likely they are to use a participative style of management.
2. The older an organization is, the less likely they are to use a partic
ipative style of management.
3. The older an organization's managers are, the less likely they are to
use a participative style of management.
4. Organizations that use a participative style of management are more
likely to be smaller in size than organizations that use a rigid style of management.
5. Organizations that use a participative style of management will have
increased productivity that will result in increased financial stability.
Likert's Profile of Organizational Characteristics was sent to 673 execu
tives of 120 companies listed in Dun & Bradstreet's Million Dollar Directory, as
having the Standard Industrial Classification code of 2521 or 2522. Additional
Reproduced with permission of the copyright owner. Further reproduction prohibited without permission.
demographic data were collected on the respondent's age, sex, educational level,
their place in the organizational and the age and size of the organization (number
of employees and buildings). A total of 162 replies was received back and or
dered into response groups from executives within the same organization.
No conclusions could be drawn about the first, second, third or fifth
hypotheses. The analysis of the fourth hypothesis, that smaller organizations are
more likely to use participative management, revealed a positive relationship;
however, this would be interpreted as the larger the organization is, the more
likely it would be to use participative management, the opposite of the original
hypothesis.
An analysis of the difference between the responses by female and males
within the same organization showed that females, in organizations where a female
was the top executive, responded in nearly the same manner as their male coun
terparts. Females in organizations where males were in the top executive posi
tions gave responses that were substantially different Gower) than their male
peers.
Reproduced with permission of the copyright owner. Further reproduction prohibited without permission.
INFORMATION TO USERS
This manuscript has been reproduced from the microfilm master. UMI films the text directly from the original or copy submitted. Thus, some thesis and dissertation copies are in typewriter face, while others may be from any type of computer printer.
The quality of this reproduction is dependent upon the quality of the copy submitted. Broken or indistinct print, colored or poor quality illustrations and photographs, print bleedthrough, substandard margins, and im proper alignment can adversely affect reproduction.
In the unlikely, event that the author did not send UMI a complete manuscript and there are missing pages, these will be noted. Also, if unauthorized copyright material had to be removed, a note will indicate the deletion.
Oversize materials (e.g., maps, drawings, charts) are reproduced by sectioning the original, beginning at the upper left-hand comer and continuing from left to right in equal sections with small overlaps. Each original is also photographed in one exposure and is included in reduced form at the bade of the book.
Photographs included in the original manuscript have been reproduced xerographically in this copy. Higher quality 6" x 9" black and white photographic prints are available for any photographs or illustrations appearing in this copy for an additional charge. Contact UMI directly to order.
Reproduced with permission of the copyright owner. Further reproduction prohibited without permission.
A Bell & Howell Information Company 300 North Z eeb Road. Ann Arbor. Ml 48106-1346 USA
313/761-4700 800/521-0600

Reproduced with permission of the copyright owner. Further reproduction prohibited without permission.
UMI Number: 9533811
Copyright 1995 by Swearingen, Michael Heenan All rights reserved.
UMI Microform 9533811 Copyright 1995, by UMI Company. All rights reserved.
This microform edition is protected against unauthorized copying under Title 17, United States Code.
UMI300 North Zeeb Road Ann Arbor, MI 48103
Reproduced with permission of the copyright owner. Further reproduction prohibited without permission.
Copyright by Michael Heenan Swearingen
1995
Reproduced with permission of the copyright owner. Further reproduction prohibited without permission.
ACKNOWLEDGEMENTS
Not being a "traditional" student, my path on the road of knowledge has
been long and rocky. Frequently, just prior to the completion of a long project, I
found myself wondering if I really wanted to continue or just pull the plug and let
everything quietly expire. It was during these periods that my wife, through both
flattery and threats, helped me jump start myself again. Without her help and
patience, I never would have finished.
I would also like to thank A1 Demers, Simonds Industries Corporate
Manager for Accounts Receivable/Payable. A1 performed a lifesaving act by
getting me the financial information I needed on the various organizations that
responded. Without Al's help, my fifth hypothesis could never have been tested.
Last, but not least, I would like to thank my committee members, Uldis
Smidchens, Dale Brethower and Patrick Jenlink. Dr. Smidchens, especially,
probably thought I had died and was buried in an unmarked grave when he hadn't
heard from me. His calls to me were another source of inspiration of "I want you
done and out of here".
All joking aside, I could not have done it without the people mentioned and
I want each of them to know how much I appreciate their help and concern.
Michael Heenan Swearingen
ii
Reproduced with permission of the copyright owner. Further reproduction prohibited without permission.
TABLE OF CONTENTS
ACKNOWLEDGEMENTS..................................................................................... ii
LIST OF TABLES................................................................................................. vi
CHAPTER
I. INTRODUCTION....................................................................................... 1
Statement of the Problem....................................................................... 1
Purpose of the Study.............................................................................. 2
Summary................................................................................................ 3
II. REVIEW OF RELATED LITERATURE................................................... 5
Introduction............................................................................................ 5
Increased Communication.................................................................... 3
Quality Circles (QC).............................................................................. 9
Quality of Work Life (QWL)............................................................... 11
Joint Decision Making........................................................................ 12
Conflict Resolution.............................................................................. 15
Increased Job Satisfaction................................................................... 16
Increased Cooperation........................................................................ 17
Productivity.......................................................................................... 18
Summary.............................................................................................. 29
in . DESIGN AND METHODOLOGY........................................................... 31
Design of the Study............................................................................ 31
Participants in the Study...................................................................... 32
Instrumentation..................................................................................... 32
Reproduced with permission of the copyright owner. Further reproduction prohibited without permission.
Table of Contents - Continued
CHAPTER
Collection of Data............................................................................... 34
Analysis of Data.......................................................................... 35
Hypothesis 1............................................................................... 36
Hypothesis I I ............................................................................ 36
Hypothesis III............................................................................. 37
Hypothesis IV ............................................................................. 37
Hypothesis V .............................................................................. 38
Summary.......................................................................................... 40
IV. RESULTS................................................................................................ 41
Introduction..................................................................................... 41
Demographic Characteristics of the Sample....................................... 44
Level 1 Female Present............................................................... 46
Level 1 Female Not Present.................................................. 46
Analyses Results................................................................................. 47
Results of Hypothesis 1...................................................................... 52
Results of Hypothesis II ..................................................................... 53
Results of Hypothesis III................................................................... 54
Results of Hypothesis IV ................................................................... 55
Results of Hypothesis V ..................................................................... 56
Summary.......................................................................................... 57
V. CONCLUSIONS AND RECOMMENDATIONS..................................... 59
Conclusions....................................................................................... 59
Response Rate......................... 60
iv
Reproduced with permission of the copyright owner. Further reproduction prohibited without permission.
Table of Contents - Continued
CHAPTER
Correlational Analyses......................................................... 61
Hypotheses........................................................................................ 64
Hypothesis 1............................................................................... 64
Hypothesis I I .............................................................................. 65
Hypothesis HI.......................................................................... 65
Hypothesis IV ............................................................................ 66
Hypothesis V .............................................................................. 67
Recommendations.............................................................................. 67
Study Format Changes............................................................... 69
Summary.......................................................................................... 70
APPENDICES
A. Protocol Clearance From the Human SubjectsInstitutional Review Board........................................................................ 71
B. Cover Letter Sent to Participants.............................................................. 73
C . Profile of Organizational Characteristics andDemographic Survey.......................................................................... 75
D. Correlational Analyses of POC Sub-Factors WithPOC Sub-Factors................................................................................. 78
E. List of POC and Demographic Survey Components................................ 80
F . Summary Table of Correlational Analyses............................................... 82
G. Original SPSS-X Data Print Out..................................................... 84
BIBLIOGRAPHY.............................................................................................. 108
v
Reproduced with permission of the copyright owner. Further reproduction prohibited without permission.
LIST OF TABLES
1. Demographic Characteristics of the Respondent Sample............................. 44
2. Comparison Between POC Sub-Factors andSub-Factor Average (Factor 2 6 ).................................................................... 47
3. Correlations Between POC Factors.............................................................. 48
4. Correlations Between Demographic Factors Exceeding 0.29........................ 49
5. Correlations Within Financial D ata.............................................................. SO
vi
Reproduced with permission of the copyright owner. Further reproduction prohibited without permission.
CHAPTER I
INTRODUCTION
Statement of the Problem
Much has been said about participative management. Its adherents,
companies such as Hewlett-Packard, Harman International Industries, Cooperati-
va Central, International Group Plans, and British Triumph Motorcycle, to name
a few, tout it as the cure for all ills while its opponents, including General Foods,
McCaysville Industries, Rushton Mining Company, and Vermont Asbestos
Group, label it as an ivory tower pipe dream, unworkable in the "real world".
Those who are in favor of a participative style of management state that
the persons who oppose it really do not understand what they are opposing, that
participative management leads to increased productivity by increasing employee
involvement, and this leads to increased employee morale, which helps boost
productivity even farther. Participative management is composed of several
essential ingredients, including increased communication, quality circles (QC),
quality of work life (QWL), joint decision making, conflict resolution, increased
job satisfaction, and increased cooperation. There are other parts of the participa
tive management system, but they play a relatively minor role as compared to the
listed building blocks (Glaser, 1973).
Some organizations have a written policy stating that they believe in and
use a participative management style of management (South Bend Lathe, Inc.,
Saratoga Knitting Mill, and Mohawk Valley Community Corporation, for exam-
1
Reproduced with permission of the copyright owner. Further reproduction prohibited without permission.
pie), however, it commonly becomes the case that although the organization may
subscribe to or pay lip service to the goal of participative management, the
communication is still from the top down with all decision and policy making held
in the hands of the top management personnel. This could be caused by several
factors, including unfamiliarity with what participative management really is and
how it works, and a static organization that has become complacent and actually
does not want to "rock the boat". One of the most commonly voiced concerns is
how much it will affect productivity and the "bottom line". If a program increases
productivity, but costs more than the additional productivity it generates, then the
program is essentially useless, since the goal of nearly all organizations, unless
they are non-profit or governmental agencies, is to make a profit..Is 1
Purpose of the Study
This study examined the relationship between the style of management
used and level of productivity, measured in terms of the organization's financial
stability. Other variables examined included the age of the top level managers,
their educational level, the size and age of the organization, and the organiza
tion's physical parameters.
In this study, the answers the respondents gave to the Profile of Organi
zational Characteristics (POC), were grouped for managers within the same
organization. The responses from within the organization were averaged to
produce a set of single values for each organization that were then compared to
other organizations as well as other factors, including financial stability. Chapter
n consists of the following major sections devoted to the various aspects of partic
ipative management: increased communications, quality circles, quality of work
Reproduced with permission of the copyright owner. Further reproduction prohibited without permission.
life, joint decision making, conflict resolutions, increased job satisfaction, in
creased cooperation and productivity.
The sources of information for this study came from many sources, in
cluding various periodicals, books, papers presented at professional conferences,
studies performed by governmental agencies and educational institutions and
dissertations, to name a few.
The following hypotheses were tested during this study:
1. The higher the education level of the organization's managers is,
the more likely they are to use a participative management style of management.
2. The older an organization is, the less likely they are to use a partic
ipative style of management.
3. The older the organization's managers are, the less likely they are
to use a participative style of management.
4. Organizations that use a participative style of management are more
likely to be smaller in size than organizations that use a more rigid style of
management.
3. Organizations that use a participative style of management will
have increased productivity that will result in increased financial stability.
Summary
By determining whether or not productivity is affected by the use of a
participative style of management, we are laying the ground work for making
companies more competitive. As companies become more competitive, the cost
of the items they produce becomes lower, allowing the consumer to spend less
money on individual products which, in turn, allows them to make additional
Reproduced with permission of the copyright owner. Further reproduction prohibited without permission.
purchases of other items. The conclusions from this study could point the way to
making companies more competitive by adding additional information to the
management process.
Reproduced with permission of the copyright owner. Further reproduction prohibited without permission.
CHAPTER n
REVIEW OF RELATED LITERATURE
Introduction
A great number of studies have dealt with the concept of participative
management, what factors enhance it, what factors detract from it and what fac
tors influence whether or not it will even work. A review of the literature was
necessary to help determine the factors involved in defining whether or not other
studies that were done previously even addressed the issues that were targeted or
if they were pertinent, what the results were. The studies reviewed were divided
into one of seven categories, increased communication, quality circles (QC),
quality of work life (QWL), joint decision making, conflict resolution, increased
job satisfaction, increased cooperation and productivity (Glaser, 1973).
A number of sources were used in this review including periodicals, books
by established participative management experts, government and educational
agency publications, dissertations, article abstracts and other materials.
Increased Communication
Theological seminaries, as a rule, are rather bound by tradition, however,
Isenhart (1986) examined the issue of increasing employee participation in the
decision making and management processes of a Roman Catholic seminary. Data
were collected on how the decisions were made after Likert's Profile of Organiza
tional Analysis (POC) was explained to the participants at the seminary. Each
5
Reproduced with permission of the copyright owner. Further reproduction prohibited without permission.
decision, after it was made, was rated by the persons involved as to whether it was
made using System 1, 2 3, or 4 (exploitive, benevolent, consultative, and partici
pative). The results demonstrated that there was a shift towards the participative
style of management, and that communication more easily flowed both up and
down through the hierarchy concerning these joint decisions. The paper conclud
ed on the note that there was little likelihood that employee participation in deci
sion making would advance beyond the present level due to the fact that the Vati
can had the final authority over the seminary, even though this style appeared to
produce more positive attitudes among the lower echelons.
One of the primary identifying components of a participative style of
management is the increase in communication from the lower to upper echelons.
One hundred three clerical employees and the lowest level of supervisors were
part of a study conducted at a comprehensive eastern university (Wheeless, et al,
1982). The questionnaire filled out by the participants measured communication
satisfaction with supervisors, supervisory receptivity to information, decision
participation level, actual participation versus desired participation difference, and
job satisfaction in relation to the supervisor, coworkers, promotions, compensa
tion, and work. The highest correlations within the study were found to be those
of communication satisfaction with the supervisors (0.9596) and satisfaction with
supervisors (0.9507) in regards to job satisfaction, that is, job satisfaction ap
peared to be highly correlated with communication satisfaction with supervisors
and general satisfaction with supervision. Interestingly enough, the lowest corre
lation found to exist (0.4275) was satisfaction with the communication with co
workers correlated with job satisfaction. This study was strictly a survey tool and
no training in the style of participative management was given prior to the admin
Reproduced with permission of the copyright owner. Further reproduction prohibited without permission.
istration of the survey. The main thrust of this study was to show that job satisfac
tion is greatest when there is open communication between the workers and super
visors, one of the main premises of participative management. One blot on this
otherwise rosy picture occurred when the correlation of 0.43 was found between
job satisfaction and communication between co-workers. Communication in a true
style of participative management occurs not only up and down, but also within
levels, something which is obviously lacking to some extent here.
Phillips (1977) conducted research into the types of communication pat
terns used by two television group owners, whom he defined as fully owning
more than one United States commercial television station. The station manager
and subordinate managers were given Likert's Profile of Organizational Charac
teristics to help delineate and define what management style was used to generate
communication within the organization. The results of the study were that
although both of the general managers had similar roles, the philosophy of one
organization was more in line with a participative management style which result
ed in more open channels of communication between the various levels in the
organization.
Neil Bamhard (1980), developed a continuing education course for the
beginning or inexperienced supervisor. It was the feeling of Mr. Bamhard and
the program development staff, that the most important areas to concentrate on
were leadership, communication, conflict resolution, and motivation skills. The
article concentrates on the necessity of the supervisor and subordinate working as
a team, with open communication and a share in the decision making process,
both of which are essential components of participative management.
Flood (1985) wrote a treatise on effective leadership. His primary conten-
Reproduced with permission of the copyright owner. Further reproduction prohibited without permission.
tion is that unless you have an effective leadership style, you really won't be
leading, but will just happen to be at the head of a pack going in a specific direc
tion. Although he describes his favorite style as consultative, his preferred style
has a number of participative management factors leavened in. The primary keys
to having good workers are communication, involvement in the decision making
process, and group involvement.
Most people consider quality circles (QC) and quality of work life pro
grams (QWL) to be synonymous with the concept of participative management,
however, while QC and QWL programs are similar, they do have some differ
ences and are a part of participative management systems, not a system in and of
themselves. Savage and Romano (1983) articulated what they perceive as the
differences in a paper presented at the Annual Meeting of the Eastern Communi
cation Association. They argued that QCs are usually involve employees with
similar backgrounds solving technical problems related to the job whereas with
QWL programs, the employees come from different levels and are involved in the
entire work environment. The QCs in Japan do not focus their programs strictly
on developing solutions for technical problems, rather they offer alternative
method for dealing with the company. Through the QC program, the average
Japanese worker can assist in planning production, receiving additional training,
and assist in modifying the work environment to more carefully suit the workers.
QC teams in the United States however, are formed to solve only technical prob
lems and are not allowed to roam outside the technical area of interest. This
causes the QC to succeed initially, but fail in the long run since the curiosity of the
participants eventually diminishes. The QWL offers a concept similar to what the
Japanese use as a QC concept, but involves the employee at a greater level than
Reproduced with permission of the copyright owner. Further reproduction prohibited without permission.
the Japanese QC does. Whichever a company decides to use, either QC or QWL
program, they should be part of an integrated package that comprises a participa
tive management system.
Quality Circles (QC)
One of the major components normally seen in most participative man
agement programs is quality circles. Small (1987) examined participative man
agement in public school systems, specifically,an elementary and middle school in
the Baltimore public school system. Using an open ended questionnaire, the
teachers in each building were queried as to what they felt were the most pressing
problems facing them each day. The quality circle took the resulting answers and
tabulated them, and deciding to tackle the problems which were most frequently
mentioned. The teachers involved in the circle would brainstorm to come up with
possible solutions to each of the problems, come to a general consensus as to
which solution would be the most practical, and finally, submit their recommenda
tions to the appropriate authority. It is the contention of the author that participa
tive management can be introduced into organizations and work successfully as
long as there are upper level managers who are willing to commit resources to and
support quality circles and participative management.
In 1985, J. P. Elvins investigated how quality circles affected communica
tion within the organization. A random sample consisting of 102 quality circle
members from five different organizations were given Likert's Profile of Organi
zational Characteristics and an open ended survey concerning the respondent's
personal experiences with quality circles. The results of the study evidenced the
fact that the employees in the quality circles felt that quality circles had positive
Reproduced with permission of the copyright owner. Further reproduction prohibited without permission.
effects on perceived individual influence, communication with superiors, subordi
nates and peers. The responses given, however, placed the organizations in either
a benevolent exploitative or consultative management system.
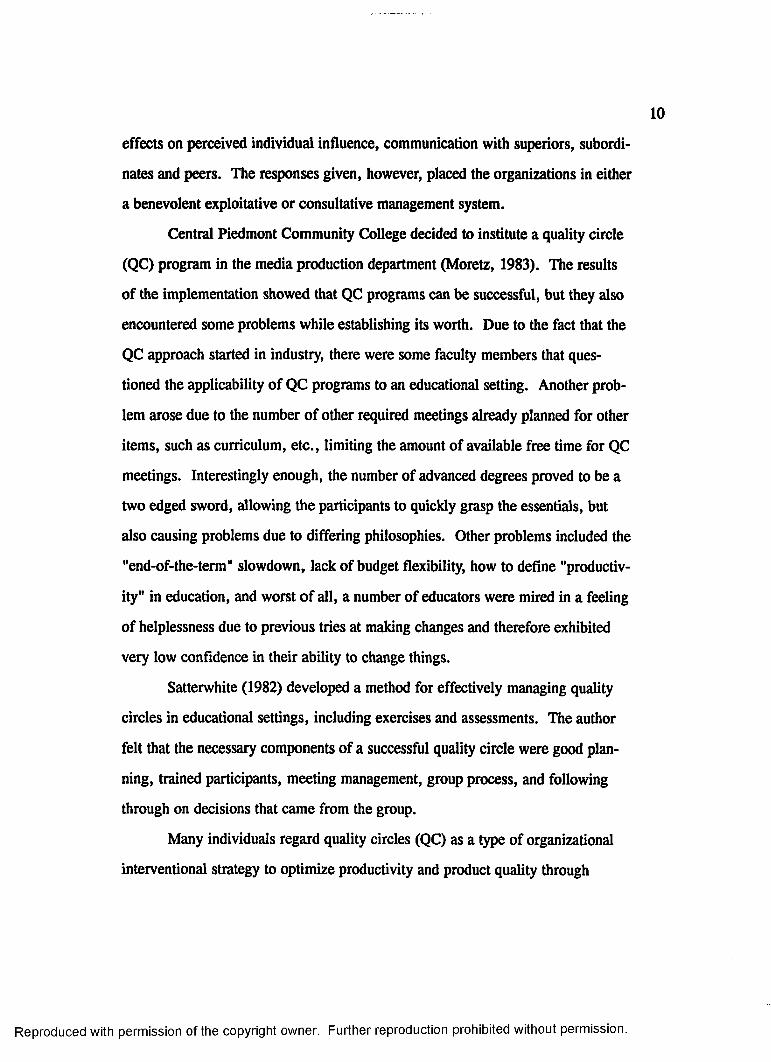
Central Piedmont Community College decided to institute a quality circle
(QC) program in the media production department (Moretz, 1983). The results
of the implementation showed that QC programs can be successful, but they also
encountered some problems while establishing its worth. Due to the fact that the
QC approach started in industry, there were some faculty members that ques
tioned the applicability of QC programs to an educational setting. Another prob
lem arose due to the number of other required meetings already planned for other
items, such as curriculum, etc., limiting the amount of available free time for QC
meetings. Interestingly enough, the number of advanced degrees proved to be a
two edged sword, allowing the participants to quickly grasp the essentials, but
also causing problems due to differing philosophies. Other problems included the
"end-of-the-term" slowdown, lack of budget flexibility, how to define "productiv
ity" in education, and worst of all, a number of educators were mired in a feeling
of helplessness due to previous tries at making changes and therefore exhibited
very low confidence in their ability to change things.
Satterwhite (1982) developed a method for effectively managing quality
circles in educational settings, including exercises and assessments. The author
felt that the necessary components of a successful quality circle were good plan
ning, trained participants, meeting management, group process, and following
through on decisions that came from the group.
Many individuals regard quality circles (QC) as a type of organizational
interventional strategy to optimize productivity and product quality through
Reproduced with permission of the copyright owner. Further reproduction prohibited without permission.
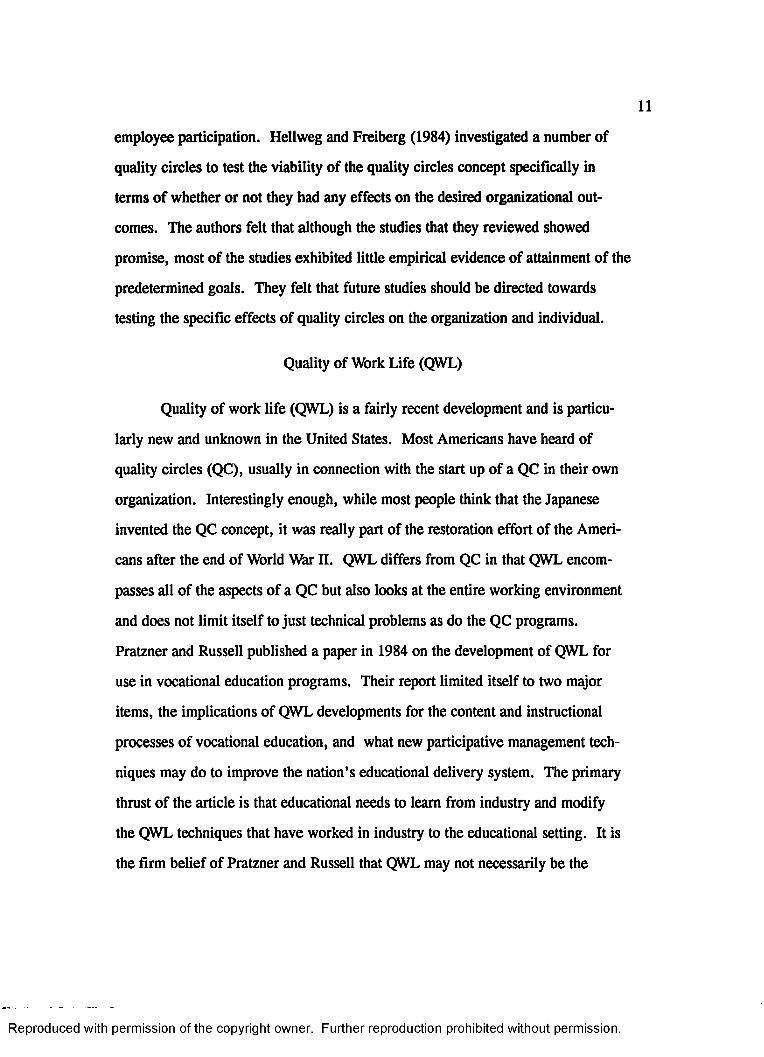
employee participation. Hellweg and Freiberg (1984) investigated a number of
quality circles to test the viability of the quality circles concept specifically in
terms of whether or not they had any effects on the desired organizational out
comes. The authors felt that although the studies that they reviewed showed
promise, most of the studies exhibited little empirical evidence of attainment of the
predetermined goals. They felt that future studies should be directed towards
testing the specific effects of quality circles on the organization and individual.
Quality of Work Life (QWL)
Quality of work life (QWL) is a fairly recent development and is particu
larly new and unknown in the United States. Most Americans have heard of
quality circles (QC), usually in connection with the start up of a QC in their own
organization. Interestingly enough, while most people think that the Japanese
invented the QC concept, it was really part of the restoration effort of the Ameri
cans after the end of World War II. QWL differs from QC in that QWL encom
passes all of the aspects of a QC but also looks at the entire working environment
and does not limit itself to just technical problems as do the QC programs.
Pratzner and Russell published a paper in 1984 on the development of QWL for
use in vocational education programs. Their report limited itself to two major
items, the implications of QWL developments for the content and instructional
processes of vocational education, and what new participative management tech
niques may do to improve the nation's educational delivery system. The primary
thrust of the article is that educational needs to learn from industry and modify
the QWL techniques that have worked in industry to the educational setting. It is
the firm belief of Pratzner and Russell that QWL may not necessarily be the
Reproduced with permission of the copyright owner. Further reproduction prohibited without permission.
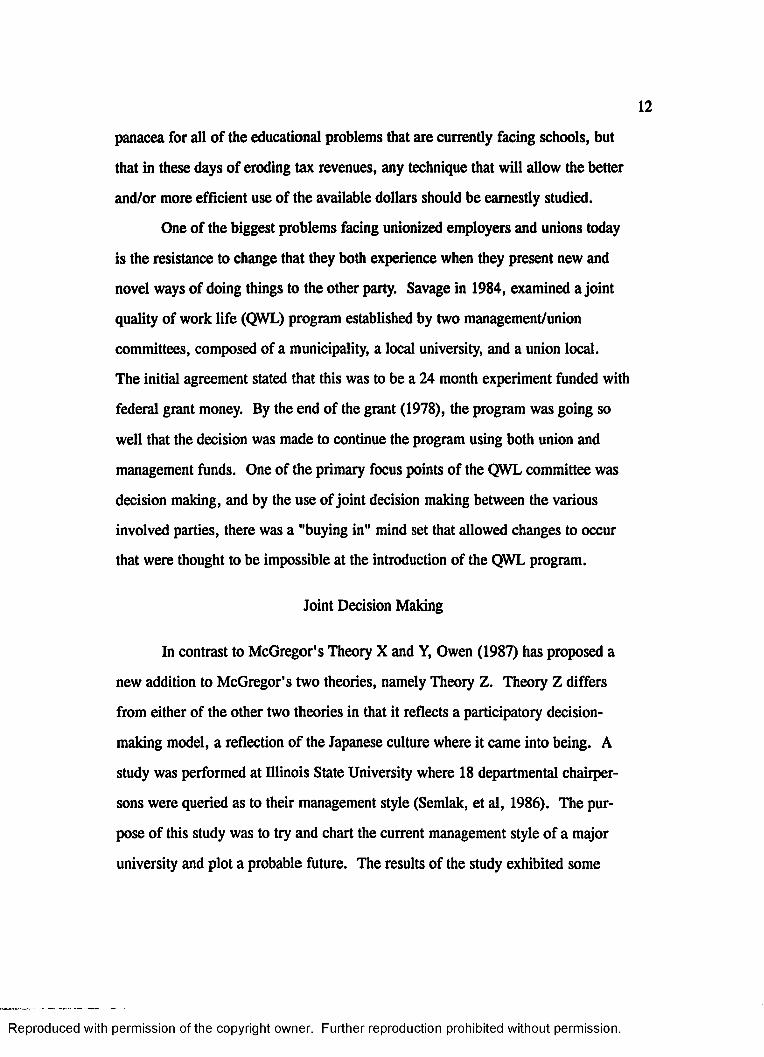
panacea for all of the educational problems that are currently facing schools, but
that in these days of eroding tax revenues, any technique that will allow the better
and/or more efficient use of the available dollars should be earnestly studied.
One of the biggest problems facing unionized employers and unions today
is the resistance to change that they both experience when they present new and
novel ways of doing things to the other party. Savage in 1984, examined a joint
quality of work life (QWL) program established by two management/union
committees, composed of a municipality, a local university, and a union local.
The initial agreement stated that this was to be a 24 month experiment funded with
federal grant money. By the end of the grant (1978), the program was going so
well that the decision was made to continue the program using both union and
management funds. One of the primary focus points of the QWL committee was
decision making, and by the use of joint decision making between the various
involved parties, there was a "buying in" mind set that allowed changes to occur
that were thought to be impossible at the introduction of the QWL program.
Joint Decision Making
In contrast to McGregor's Theory X and Y, Owen (1987) has proposed a
new addition to McGregor's two theories, namely Theory Z. Theory Z differs
from either of the other two theories in that it reflects a participatory decision
making model, a reflection of the Japanese culture where it came into being. A
study was performed at Illinois State University where 18 departmental chairper
sons were queried as to their management style (Semlak, et al, 1986). The pur
pose of this study was to try and chart the current management style of a major
university and plot a probable future. The results of the study exhibited some
Reproduced with permission of the copyright owner. Further reproduction prohibited without permission.

rather strange characteristics. The chairpersons, by and large, regarded their
management styles as being derived from Theory Z, however, on the two most
important issues (for Theory Z), they went wholeheartedly with a Theory X
stance. These two issues were quality control of the product (a top priority with
the Japanese), and tenure/promotion. The quality control statement that they
objected to was "In my department the entire faculty feels responsible for main
taining quality teaching, research and service. We continually have discussions of
how we can improve in these areas. ". They felt that tenure and promotion did
not arise from hard work but rather by "...getting along with key faculty members
in the department." These contradictions put a large stumbling block in way of
accepting that they have a Theory Z style of participatory management. A pro
vocative point to consider here is that while industry is moving towards a Theory
Z style of management, one of the leading universities in Illinois is moving to
wards a Theory X style of management.
Worker participation in decision making has often been touted as a "cure-
all" for labor related problems. Lloyd and Rehg (1983), investigated the quality
circle concept, which is considered by many to be one of the cornerstones of
participative management. They chose the area of vocational education to exam
ine what should be done to insure that quality circles were as successful as possi
ble.
The authors suggested that a quality circle course be included during the
final year of education and that the course be based upon the practical applica
tions of the quality circle process. The first skills to be taught were those of
management and leadership, supplemented by goal setting and conflict resolution.
As the students enter the third and fourth quarters, they would find themselves
Reproduced with permission of the copyright owner. Further reproduction prohibited without permission.
14
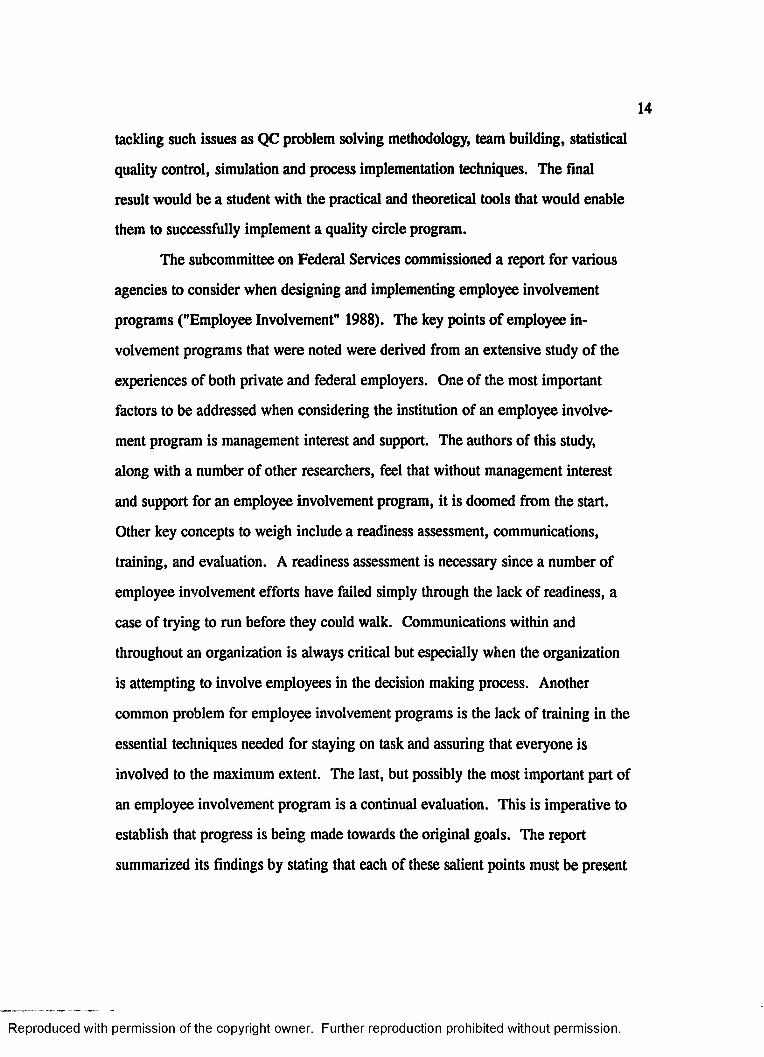
tackling such issues as QC problem solving methodology, team building, statistical
quality control, simulation and process implementation techniques. The final
result would be a student with the practical and theoretical tools that would enable
them to successfully implement a quality circle program.
The subcommittee on Federal Services commissioned a report for various
agencies to consider when designing and implementing employee involvement
programs ("Employee Involvement" 1988). The key points of employee in
volvement programs that were noted were derived from an extensive study of the
experiences of both private and federal employers. One of the most important
factors to be addressed when considering the institution of an employee involve
ment program is management interest and support. The authors of this study,
along with a number of other researchers, feel that without management interest
and support for an employee involvement program, it is doomed from the start.
Other key concepts to weigh include a readiness assessment, communications,
training, and evaluation. A readiness assessment is necessary since a number of
employee involvement efforts have failed simply through the lack of readiness, a
case of trying to run before they could walk. Communications within and
throughout an organization is always critical but especially when the organization
is attempting to involve employees in the decision making process. Another
common problem for employee involvement programs is the lack of training in the
essential techniques needed for staying on task and assuring that everyone is
involved to the maximum extent. The last, but possibly the most important part of
an employee involvement program is a continual evaluation. This is imperative to
establish that progress is being made towards the original goals. The report
summarized its findings by stating that each of these salient points must be present
Reproduced with permission of the copyright owner. Further reproduction prohibited without permission.
or the final product will probably not reach fruition.
Another study also examined participative management in an educational
setting. Robinson (1976) chose to examine the 675 teachers were given a ques
tionnaire that dealt with each person's input into the decision making in the school
system. The results of this study showed that the principals believe that the teach
ers have a greater role in the decision making than the teachers perceive that they
do, and the teachers believe that the principal's role in decision making is greater
than the principals themselves perceive it to be. Robinson feels that by increasing
the amount of participative management in the schools, the levels of teacher job
satisfaction and organizational productivity will also rise.
One of the primary constituents of a good participative management system
is participation in the decision making process. Steve (1984) was commissioned to
identify career development needs for students entering the National Institute for
the Deaf. One of the most essential ingredients for success that he found was
decision making/problem solving. In his paper, the various models and concepts
of participative management were reviewed, including ideas and views by Hep-
pner (1978), Greeno (1978), Bruner, et al (1956), and others. The conclusion of
the paper was that decision making/problem solving was one of the primary keys
to success, however, the process of decision making/problem solving is not an
instinctive procedure, but rather something that each person must be trained in
order to insure that they have the fundamental tools and strategies in order to
successfully solve a problem by devising and implementing a solution
Conflict Resolution
Another problem facing organizations is conflict, how to manage and
Reproduced with permission of the copyright owner. Further reproduction prohibited without permission.
resolve it. In 1983, the New Mexico Research and Study Council performed an
analysis of the results of conflict within an organization, how to best manage them
so that they are productive rather than counterproductive, lb do this, they listed
the various sources of organizational conflict, reactions of the participants and
observers, and conflict resolution strategies. The study's authors believe that
conflict can be a valuable addition to the organization as long as the managers/
administrators can effectively respond to the conflict using the proper techniques
including increasing inter-group interactions, development of superordinate goals,
and organizational restructuring.
Increased Job Satisfaction
Another aspect of participative management was analyzed in 1985 by Fish
and Adams, by comparing the size of the organization with its management style
and the job satisfaction of the Program Directors associated with each of the
respondent television stations. Questionnaires were sent to 274 randomly selected
stations with a return rate of 66.1 % (181). The results of the survey revealed that
as the stations grew larger in size, they were more likely to use a participative
style of management, and that Program Directors who were oriented towards
higher levels of management were more likely to express greater job satisfaction
than those who were not oriented to higher levels of management.
Unlike Beehr and Gupta (1982), Gaziano and Coulson (1987) did not find
that a "looser" style of management promoted job satisfaction among employees.
They examined two newspapers that were owned by the same company, a morning
paper and an evening paper. The 125 journalists that were polled using a 12 page
survey rated the morning paper as a blend of "democratic and authoritarian" while
Reproduced with permission of the copyright owner. Further reproduction prohibited without permission.
the evening paper was considered to be authoritarian. The results of the survey
were that the journalists on both papers felt that their participation in decision
making was important, but the employees at the morning paper (democratic/au
thoritative) were no more likely to participate in decision making than the em
ployees of the more formal evening paper. In fact, there was more satisfaction
found in the working relationships between the journalists and the editors at the
evening paper than at the morning paper. The factors which caused this "dif
ference" from what was expected are unknown, but the authors suspect that it may
have to do with the fact that journalists tend to be more transient than other pro
fessionals.
Increased Cooperation
There have been major developments over the course of time in labor-
management relations, especially in the area of cooperation. There have been
many changes in the direction of negotiations between unions and the manage
ment. Two of the most profound changes have been the cooperation between
unions and management, and cooperation between management and the individual
employees. McCabe (1984) performed an integrative analysis on these two as
pects of cooperation between labor and management in an effort to help balance
the overwhelming glowing reports of participative management that usually
manage to either gloss over or ignore the negative features of participative man
agement. The final point of his analysis is that cooperation and participative
management are not ventures that can be put into place immediately and yield
instantaneous results, but rather need to be introduced slowly over a protracted
length of time.
Reproduced with permission of the copyright owner. Further reproduction prohibited without permission.
Productivity
In a report on union-management cooperation prepared for the W. E.
Upjohn Institute by M. H. Schuster (1984), the author examined a number of
organizations over a five year period with the primary focus of the study being
improved productivity. One of the sections of this study dealt with a comparison
between Scanlon plans and Quality Circles. Some people use the two terms inter
changeably, they are, however, not the same thing. Scanlon plans are the
"brainchild" of Joseph Scanlon, a cost accountant and United Steel Workers union
official. During the mid 1930's, Scanlon devised a plan where a formula was
devised to help share the profits with all of a company's employees. This ap
proach encouraged increased union-management cooperation that changed their
previous adversarial working arrangement to one where the main focus was aimed
at reducing costs and increasing output (Moore and Ross, 1987).
Quality Circle committees usually involve more people than Scanlon
committees, rewards for suggestions usually are distributed between the members
of the circle whereas the Scanlon plans distribute the savings over the entire work
force, and last, the author notes that most companies who establish Quality Circles
are more likely to maintain traditional, authoritarian views on employee participa
tion and involvement.
The educational and organizational strategies required for improvement of
worker-centered productivity was the subject of a paper by Drewes (1982).
Drewes felt that unless a person was able to accurately assess productivity, there
could be no meaningful decision on whether or not changes that were made in the
organization were actually part of the solution and not an additional part of the
cause. The equation developed was that productivity equals the output (system
Reproduced with permission of the copyright owner. Further reproduction prohibited without permission.
products) divided by the input (resources used). Using this equation, it is easily
understood that increased productivity could be caused by any of the following: (a)
an increase in the overall output (input remaining constant), (b) a decrease in the
resources used (output remaining constant), (c) an increase in the output with a
simultaneous decrease in the input, (d) a larger increase in the output than in the
input, and finally, (e) a smaller decrease in the output than is found in the input.
These five different scenarios must be considered whenever there is a major
change in the organizational philosophy, such as the introduction of a participative
management system. Drewes felt that there are four vital ingredients to successful
productivity improvement, information distribution, communication between indi
viduals, a mutual understanding and general consensus as to what the problem to
be tackled is, and finally, involvement of all parties. All of these issues must be
addressed through increased education of the involved workers into how to func
tion as a team and open the channels of communication, therefore it becomes vital
ly important that a participative management program is not just installed in place
without adequate training for all workers as to its function and purpose.
Although participative management systems appear to be the solution to
many of today's organizational work problems, one of the main factors to be
concerned about is productivity. If the productivity stays constant while the costs
go up, the organization will eventually go bankrupt and close, causing catastrophic
dislocations among its employees. In a study performed under the auspices of the
U.S. General Accounting Service, 36 firms who had installed productivity sharing
plans and nine who were either considering or had rejected productivity sharing
plans were interviewed. The results showed that 34 of the 36 firms with plans
currently in place detected an increase in productivity after the plans were initiated
Reproduced with permission of the copyright owner. Further reproduction prohibited without permission.
20
and were going to continue to use the plans. There were two firms that were
unhappy with the plans in place. One firm had been increasing the amount of
automation that was associated with the job, reducing the potential of the workers
to affect production. The other company had come to feel that money was no
longer a good incentive for the workers and was planning to institute a Quality of
Work Life (QWL) program to replace its productivity sharing plan. On the
whole, it appears that productivity sharing plans, such as Scanlon, Rucker, and
Improshare, do have a positive effect on the productivity of the employees.
Previously, Frost, Wakely, and Ruh (1974) performed a rather intensive
look at Scanlon plans, what they were, how they were used, what were the advan
tages and pitfalls. Their analysis of the Scanlon plan showed an increase in
communication and an increase in productivity, however, a noticeable defect in
their study was that the productivity increase was never examined for short or long
term negative effects, such as short term increased costs, or long term losses due
to increased costs, etc. One negative side effect that did turn up was that in
several cases, increased productivity did not result in increased profits for the
company which could be passed on to the employees as bonuses. This had soured
the participating employees on any sort of participative management style profit-
sharing plan.
Beehr and Gupta (1982), examined two automotive supply organizations
which were similar in both size and level of technology used to conduct business,
but differed in managerial style. One plant was high unionized and therefore had
a very rigid hierarchical structure while the other plant used a modified Scanlon
plan (Frost, Wakely, & Ruh, 1974). The results of the study showed that the
employees at the unionized plant had a greater level of stress then the employees
Reproduced with permission of the copyright owner. Further reproduction prohibited without permission.
of the plant that utilized the modified Scanlon plan, which manifested itself not
only in the measures taken through structured interviews, but was also seen in the
fact that the absenteeism was approximately 4 times greater in the unionized plant.
This difference is significant, however, Beehr and Gupta (1982) did not mention
analyzing the union contract to determine whether or not the contract language
might have inadvertently lead to increased absenteeism. The final conclusion of
this study was that the work environment was less stressful for the "rank and file”
but more stressful for the managerial staff in the organization where participative
management was used.
Steven Pejovich (1984) presents a contrasting point of view concerning
participative management as he depicts the style of participative management as it
is practiced in four different countries, West Germany, Norway, Ireland, and the
United States. Pejovich carefully outlines the conditions under which participative
management existed in the study's population, and then proceeded to show the
underlying assumptions that have been used for the rationale for the styles found.
In West Germany, several laws have been enacted to insure that the labor groups
represent approximately half of the entire board of directors in all companies that
have over 2,000 employees. Norway has gone even further into mandatory partic
ipative management by decreeing that labor participation in small firms (less than
50 employees) are subject to voluntary negotiations, medium sized firms (50-200
employees) must allow the employees to elect up to one third of the board if 50%
of the employees so desire, and it is mandatory that large firms (greater than 200
employees) have one third of the board comprised of employees. Another interest
ing feature of Norway's attitude towards participative management is that local
governments are not asking for a direct board representation.
Reproduced with permission of the copyright owner. Further reproduction prohibited without permission.
22
Ireland, in 1977, passed the Worker Participation Act which mandated, in
a fashion similar to Norway's provisions, that one third of all boards of directors
must be composed of employees who are employed with the specific company
whose board they are on.
At the present time, participative management in the United States is
primarily a joint voluntary effort between the workers (or unions) and the man
agement. Signs of mandatory employee involvement are beginning to be seen in
the statements of participative management proponents, whose primary argument
for the passage of laws is that this would replace conflict between labor and
management with cooperation. In fact, in the countries where such laws have
been passed, it appears that the board usually divides itself into two camps, stock
holders and employees. Prior to each full board session, each of the groups meet
to discuss and map out strategy for the next meeting. This turns the board meet
ings into negotiation sessions rather than incubators for ideas. One critical issue is
the problem of confidentiality, and evidence from West Germany suggests that the
employee board members have leaked essential information to the unions during
wage negotiations.
The prime premise of this study is that if participative management pro
duces such excellent results, then why does it have to be legislated, since compa
nies are usually willing to try almost anything that will positively affect the bottom
line.
Edward Glaser (1973) spent considerable time gathering case studies of
organizations concerned with participative management. In a number of these
studies, the organization was floundering, apparently ready to collapse at any
moment when the upper level management decided to try using a participative
Reproduced with permission of the copyright owner. Further reproduction prohibited without permission.
23
management approach to try and ward off the demise of the organization. In each
case, the company turned around and began to be profitable, or became more
profitable. In each of the case histories that were presented, the underlying theme
was that of a joint effort in problem solving and decision making between the
management and workers.
Some early research by Milutinovich (1971) into job satisfaction and group
cohesiveness was performed using race as one of the discriminant variables.
Using the Job Descriptive Index, Seashore's measure of group cohesiveness, and
Likert's Profile of Organizational Characteristics, the researchers found that there
was little differences between white and black workers in that they both preferred
a participative style of management to the more structured styles and this was
reflected in higher job satisfaction, greater group cohesiveness, increased pay, and
increased number of promotions. In summation, race appeared to play little if any
part at all in terms of job satisfaction and other measures of work group stability.
In fact, the more participative the style of management was, the more likely the
workers were to have increased job satisfaction.
Educational institutions should be on the cutting edge of new ideas, but in
1978, S. A. Prewitt found out differently. Likert's Profile of Organizational
Characteristics was sent out to a random sample of administrative employees from
the 31 educational institutions that make up the Southern Association of Colleges
and Schools (each of the schools in the sample had to have bachelors, masters, and
doctoral programs). The results of the study indicated that nearly all of the admin
istrative employees felt that their school's style of management fell somewhere
within the domain of consultative style. Interestingly enough, none of the re
spondents felt that their institution should be ranked as tending towards a participa-
Reproduced with permission of the copyright owner. Further reproduction prohibited without permission.
tive management style on any of the twenty questions asked.
David Nash (1985) performed a similar study using dental colleges in the
United States. The deans, associate deans, and departmental chairs of the 60 U.S.
dental colleges were given a survey that consisted of a modified version of
Likert's Profile of Organizational Characteristics. The results of the survey
showed that there was very little difference between the results obtained by Pre
witt in his study and the placement of the dental colleges. Both schools tended to
be in the consultative style of management with occasional tendencies towards a
benevolent authoritarian format.
Considerable work and study has been given to the topic of Scanlon plans
and participative management, and one of the acknowledged experts in the field C.
F. Frost, coauthored a book on this matter with J. H. Wakely and R. A. Ruh
(1974). According to Frost, et al, all sharing plans, Scanlon not withstanding,
must have four basic underlying principles, an identity, participation by em
ployees, chance of equity (that is, an equitable return on their invest of ideas,
energy, competence and commitment), and finally, managerial competence. Frost
felt that even if the three other principles were in use, the plans would ultimately
fail if managerial competence was not present. Basically, the authors felt that if
employees believed that management was incompetent and that decisions were
irrational, then they would lose confidence in management and their cooperation
and work would suffer. Additional work by Thylor and Cangemi (1983), con
firmed the suppositions and principles set forth by Frost, et al.
In 1980, Daniel Zwerdling collected a series of case histories on participa
tive management, when it worked, and when it did not. In every case where
participative management styles were introduced, there were some immediate
Reproduced with permission of the copyright owner. Further reproduction prohibited without permission.
changes for the better, however, in some instances, the changes that were wrought
reverted back to the previous unacceptable circumstances. In each instance where
there was a failure, it could be easily seen that much of the failure was due to the
fact that there was more lip service than actual follow through. This caused the
employees to become discontented with their jobs, and thus affected the organiza
tion's productivity. The main point that was driven home was that if a company
plans to introduce a participative management style, they must invest both the time
and effort necessary to make it work, including the retraining of traditional author
itarian managers and educating the employees themselves. Without firm backing
from upper management, including free flowing communications from the top to
the bottom and back, any attempt to introduce participative management will fail
and could actually make things worse than what they may currently be.
Hewlett-Packard is considered by many experts to be a forerunner in the
effort to effectively train and develop its management team (Nilsson, 1984). The
fundamental essence of the Hewlett-Packard program is that each employee is
involved in the company from their first day. They are instructed in the "HP
Way", the methods of corporate communication, decision making/problem solv
ing, and continuing training, to insure that they understand what to expect and
what is expected of them. These "rules of conduct" and corporate philosophy are
stressed through each training course and orientation, including those given to
senior corporate executives. The result is that the channels of communication
flow freely from the bottom to the top of the corporate structure as well as within
each level. This "whole corporation" approach has encouraged the employees to
challenge each other and the company to constantly improve on what they have,
striving for the optimal payback on each dollar spent.
Reproduced with permission of the copyright owner. Further reproduction prohibited without permission.
26
The Duluth Minnesota Public Schools were in trouble in the early 1980's,
as evidenced by teacher strikes and employee relations benchmarks such as absen
teeism and turnover (Moeser & Golen, 1987). In 1984, the school board decided
to improve management and employee relations by instituting a participative
management plan. The plan stressed communication between the various levels of
the system as the best way to achieve results. The board went on to establish a
participative management policy, rules and regulations, a structure for communi
cation and sharing of ideas, and a budget for the process. The results of the
program showed that prior to institution of the plan, 152 grievances were filed,
however, in the first semester of the 1986-87 school year, only nine were filed.
The authors feel that the reduction in grievances is just the tip of the employee
relations iceberg, that there is vastly improved communications between the vari
ous organizational groups and many problems that would have been grieved earlier
are now being jointly resolved through the participative management process.
Three school districts were the focus of a paper that investigated the
concept of team management (Anderson, 1988). The team management approach,
as outlined by the author, is a participative management system that involves the
upper level administrators and excludes the middle level administrators and teach
ers. One of the key principles of the team management approach is that nearly all
of the decisions are a result of team consensus. Although this requires taking
longer to reach a decision, each of the school districts found that adding the extra
time to the beginning of a project shortened the implementation time and caused
fewer problems than had occurred with a "top down" decision.
Harris (1986) proposes three different leadership styles, the manager-as-
technician, manager-as-conductor, and manager-as developer, similar to the lead-
Reproduced with permission of the copyright owner. Further reproduction prohibited without permission.
ership styles expounded upon by Bradford and Cohen in their book Managing for
Excellence (1984). Basically, the manager-as-technician is the manager who has
been promoted up the ladder to the present position. The manager got to the posi
tion by excelling in some area that is linked to the position. An example of this
would be promoting the top salesman to the position of sales training manager, the
supposition being that the best salesman is doing the right things, therefore, the
person must also know how they did it and can teach those skills to others. The
manager-as-conductor is an unfortunate offshoot of the participative management
theory, that is, the manager's prime goal is to try and work through the em
ployees, in other words, to control the individuals under them and make certain
that they perform the correct actions. The problem with both this and the manag-
er-as-technician styles is that both force the subordinates to rely on the manager's
direction, knowledge, and planning, thereby stunting the potential growth of the
subordinates. The third style, manager-as-developer, is the true inheritor of the
participative management mantle. These managers share the responsibility with
their employees and attempt to "develop" the team approach. This leads to the
influx of new ideas and methods to deal with problems that the organization may
face. In concluding his arguments, the author states that being able to effectively
manage "change" is the basic leadership requirement, and in this light, the manag-
er-as-developer is the most effective style.
Most people confuse leading with managing, or feel that the two terms are
synonymous. Leading is defined by Webster as the act of showing someone the
way, while managing is defined as influencing a person so that that person does
what the "manager" wants. The crucial word which clearly distinguishes between
the two is "influencing". Thomas Harris (1987) conducted a poll of randomly
Reproduced with permission of the copyright owner. Further reproduction prohibited without permission.
28
selected non-Fortune 500 companies in the state of Indiana who had an annual
sales of at least $5,000,000. The CEOs or presidents of each company polled
were surveyed about situational leadership using Hershey and Blanchard's Leader
ship Effectiveness and Adaptability Description (LEAD). The results of the study
indicated that the managers favored a management style that was high task and
high relationship, and almost entirely neglecting the delegation of responsibility to
subordinates. The most interesting feature of the results is that although the
managers used a "hands on" style of management, their perception of themselves
was as a manager-as developer.
Wongruangwisan (1980) studied managerial leadership style and organiza
tional effectiveness by examining all privately owned manufacturing companies in
Bangkok which employed at least 1,000 persons (total size of the population which
met these criteria was 53). The random sample of 10 organizations was drawn
from this pool, and questionnaires were sent to each of the upper four levels of the
management, the top manager, the department manager, a supervisor, and three
workers (the supervisor and workers were randomly selected from each depart
ment within the company. The results of the study showed that the most common
type of management could be placed between the benevolent authoritative and
consultative. It was also found that the higher up in the organization a person
was, the more likely they were to practice participative management. Another
hypothesis examined by the study was that there was a positive relationship bet
ween the management system and the organizational effectiveness, which proved
to be true. The final hypothesis tested by this study was that there was a direct
relationship between the educational level of the department manager and the
organizational effectiveness. The null hypothesis was rejected because the ob
Reproduced with permission of the copyright owner. Further reproduction prohibited without permission.
tained values did not exceed critical values, however, the very small difference
between the obtained and critical values indicated that additional research should
be conducted on the relationship between a department manager's educational
level and organizational effectiveness.
In 1982, Edward E. Lawler III, created a position paper on the relationship
between education, management style, and organizational effectiveness. One
study that was cited was a study of the educational levels of managers which
revealed that 49% of the managers who were under 40 had MBAs while only 16%
of the managers who were 50-59 had MBAs. Other points that were made
(supported by research) were that the more education an employee has, the more
likely they are to want participative management; there is little hard data on any
relationship between level of education and productivity; there is very little empir
ical research on organizations who have radically changed their style of manage
ment; there is little research on the effectiveness of high involvement systems
(participative management); and most arguments that favor a switch to participa
tive management rely heavily on comparative studies and on linking societal
change to work place change. His closing statements argue for more research in
the area of organizational effectiveness and productivity with a participative style
of management.
Summary
A review of the available literature shows that participative management is
not just one single, simple concept. Rather, it is an integration of at least six (6)
different, but related concepts, Leadership, Motivation, Communication, Goals,
Decision and Control.
Reproduced with permission of the copyright owner. Further reproduction prohibited without permission.
Studies have been performed in a number of organizations, both private
and public, and in both the "for profit” and "non-profit" types. There have been
some studies that touched on the question of whether or not participative styles of
management increased actual efficiencies of the organization, but none of them
directly addressed this issue.
This study directly attempted to explore the issue of increased productivity
as a direct result of the use of participative styles of management.
Reproduced with permission of the copyright owner. Further reproduction prohibited without permission.
CHAPTER m
DESIGN AND METHODOLOGY
Design of the Study
This study was designed to examine the relationship between the style of
management that an organization uses and its profitability, using Likert's Profile
of Organizational Characteristics (a standardized survey) to define the style of
management used and the Dun & Bradstreet financial rating of the organization to
help define profitability , the underlining premise being that a company with high
productivity is more likely to be profitable. The two terms (productivity and
profitable) are not interchangeable, because the ability to bring about a desired
outcome (productivity) is not the same as obtaining a financial gain or benefit
(profitable), since something can be productive without being profitable, such as
in the case of a child cleaning their room. A child cleaning their room will be
productive for the parent from a time management point of view, but will not
necessarily yield a financial gain for either the parent or the child. A number of
different variables were examined through the use of a demographic section that
was added to the Profile of Organizational Characteristics. The demographic
variables were included to help determine whether any differences in the man
agement style ratings between companies or between individuals within the
companies could be due to inconsistencies that were previously noted in earlier
research. The variables that were investigated are (a) the age of the top level
managers (Hypothesis HI); (b) the educational level of the top level managers
31
Reproduced with permission of the copyright owner. Further reproduction prohibited without permission.
32
(Hypothesis I); (c) the sex of the top level managers (to determine if there is two
terms (productivity and profitable) are not interchangeable, because difference
between female and male responses); (d) the age of the organization (Hypothesis
II); and (e) the size of the organization in terms of both number of employees and
the number of buildings it uses (Hypothesis IV). The data used for the fifth
hypothesis were taken from the Dun & Bradstreet ratings and compared to the
organizational mean response on Likert's Profile of Organizational
Characteristics.
Participants in the Study
The participants in the study were all officers of organizations that manu
facture office furniture in the United States of America, taken from Dun & Brad
street's Million Dollar Directory, further identified by having an Standard Indus
trial Classification code of 2521 or 2522. A SIC Code of 2521 denotes a company
that produces metal office furniture while a SIC Code of 2522 is for organizations
that produce wood office furniture. These codes are by no means exclusive, and a
company could be registered under both. Financial data on the responding organi
zations was taken from the most recent Dun & Bradstreet ratings.
The protocol of this study was categorized as exempt by the Human Sub
jects Institutional Review Board (Appendix A).
Instrumentation
Each subject was sent a letter stating the purpose of the study (Appendix B)
along with a copy of a modified version of Likert's Profile of Organizational
Characteristics (POC - Appendix C). The survey assessed six key elements
Reproduced with permission of the copyright owner. Further reproduction prohibited without permission.

(leadership, motivation, communication, decisions, goals, and control) used to
differentiate between exploitive, benevolent, consultative, and participative styles
of management. Demographic questions were added at the end of the survey to
help more fully characterize the responses received and test the hypotheses. These
questions included the number of full time employees, the number of work sites
(separate buildings, the age of the organization, the level of the respondent in the
organization, how many persons there were on the respondents level, the respon
dent's educational level, their sex and finally, their age.
Likert's Profile of Organizational Characteristics (POC), is comprised of
six sections, Leadership (questions 1-3), Motivation (4-6), Communication (7-
10), Decisions (11 and 12), Goals (13 and 14) and Control (15 and 16). Each of
these questions was compared not only to each of the nine demographic questions
and the two financial factors, but also to each other (Appendices E and F).
The POC currently has three different forms, Form J, Form S and a modi
fied version of Form S. A split half reliability on Forms J and S usually result in
values of +0.90 to + 0.96. This study used Form S, which has been in use since
1977 and in a great number of studies, a number of them performed by the Insti
tute for Social Research at the University of Michigan. J. M. Ketchel (1972), in a
doctoral dissertation study, examined management styles in 17 counties that
comprised the mid-Ohio Health Planning Federation. Ketchel received 158
completed responses from 16 different counties and correlated the mean total
scores for each county with the performance for that county. The correlation
between the POC mean score and the member rating of county effectiveness was
+0.83, while the correlation for POC mean score and member scaled expectancy
rating was +0.74.
Reproduced with permission of the copyright owner. Further reproduction prohibited without permission.
34
There have been a number of studies conducted in Japan, Yugoslavia and
the United States, to name some of the better known studies, and in each case
there was a distinct difference between the scores on the POC and the dependent
variable, production output. In the Japanese studies (two were cited with numbers
for comparison purposes), a t test was performed to determine whether or not
there were significant differences in the styles between production units which
were doing well and production units which were not doing well. The results
showed a fobt of -7.56 with a fcril of 4.30 at the a = 0.05 level with two degrees of
freedom.
Basically, the high productivity plant had a style of management that was
different from the style of the low productivity plant, as measured by the POC.
The researchers concluded that since the plants used similar equipment, produced
the same product and were the same size, that at least in the plants studied, a
participative style of management was more conducive to productivity.
Collection of Data
Surveys were sent to the individuals identified in all organizations in the
United States with the SIC 2521 and/or 2522, identified in Dun & Bradstreet's
Million Dollar Directory. Each individual that the survey was sent to was as
signed a specific four digit identification code that appeared on the upper right
hand comer of the survey. The individuals who received the questionnaire were
asked to complete it within a two week period from date of receipt and return it
via the self addressed, stamped envelope (the assumption was made that it would
have taken no more than one week from date of mailing to receive the letter).
Sixty days after the initial letters were sent out, telephone calls were made to those
Reproduced with permission of the copyright owner. Further reproduction prohibited without permission.
35
individuals who had not responded to the written request.
No more than two telephone calls were made to any listed individual. If
the individual indicated during the first call that they were not interested in filling
out the survey, they were thanked for their time and the conversation was ended.
If the person indicated that they had not received the survey, they were sent anoth
er survey. If the person indicated that they had received the survey but had not
gotten around to filling it out, they were asked to please complete it and return it
as soon as possible.
Only those individuals who stated that they were going to complete the
survey during the first telephone conversation received a second call, approximate
ly 30 days after the first call. No additional calls were made after the second
attempt, the assumption being that if a written request and two telephone calls
failed to get a response, another telephone call would likewise be ignored.
Analysis of Data
The responses were individually keyed into the computer, care being taken
to insure that members of the same organizations would be joined together for an
average organizational response in the final analyses. Means were calculated for
each question to determine whether or not there were any inconsistencies with
regards to previously reported studies involving the POC. Correlational analyses
were performed on each of the questions on the questionnaire. Due to the fact
that Factor 24 dealt with the sex of the respondent, point bi-serial correlations
were performed when there was a comparison between Factor 24 and any other
factor. Additional correlational analyses were performed utilizing the various
sections of the POC (leadership, motivation, communications, decisions, goals and
Reproduced with permission of the copyright owner. Further reproduction prohibited without permission.
controls) with the various demographic questions to help determine whether or not
any of the subsections of the POC correlated with any of the demographic factors
better than the overall POC score. For each hypothesis, the null hypothesis was
expressed in terms of population values of the correlation coefficients equaling
zero, or symbolically represented as:
Ho: p(rho) = 0,
with a level of significance of a = 0.05 (two tailed test). Correlations were
considered only if their absolute value was equal to or exceeded 0.30, due to the
fact that a correlation of 0.30 will account for nearly 10% of the variance of the Y
variable when predicted from the X variable and is frequently used in the social
sciences as the lowest critical correlation that assumptions can be based on.
Hypothesis I
The higher the educational level of the organization's managers is, the
more likely they are to use a participative management style of management.
Within responding organization, the responses from each person respond
ing were averaged and the averages used in a Pearson Product Moment Correla
tion. A positive correlation greater than or equal to 0.30 between the educational
level of the organization's respondents and the score on the PCX! would indicate
that higher educational levels in managers result in an increased use of participa
tive management.
Hypothesis II
The older an organization is, the less likely they are to use a participative
style of management.
Reproduced with permission of the copyright owner. Further reproduction prohibited without permission.
37
Within responding organization, the responses from each person respond
ing were averaged and the averages used in a Pearson Product Moment Correla
tion. A negative correlation less than or equal to -0.30 between the age of the
organization and the average score on the POC would indicate that younger
companies are more likely to use a participative type of management than older,
more established organizations.
Hypothesis III
The older the organization's managers are, the less likely they are to use a
participative style of management.
Within responding organization, the responses from each person respond
ing were averaged and the averages used in a Pearson Product Moment Correla
tion. A negative correlation less than -0.30 between the age of the managers and..x
the score on the POC would indicate that older manager's are less likely to use a
participative style of management.
Hypothesis IV
Organizations who use a participative style of management are more likely
to be smaller in size than organizations who use a more rigid style of management.
Within responding organization, the responses from each person respond
ing were averaged and the averages used in a Pearson Product Moment Correla
tion. A negative correlation less than -0.30 between the size of the organization
and the score on the POC would indicate that smaller organizations are more
likely to use a participative style of management than larger organizations.
Reproduced with permission of the copyright owner. Further reproduction prohibited without permission.
38
Hypothesis. .V
Organizations that use a participative style of management will have in
creased productivity that will result in increased financial stability as compared to
organizations that do not use a participative style of management.
Within responding organization, the responses from each person respond
ing were averaged and the averages used in a Pearson Product Moment Correla
tion. A positive correlation greater than 0.30 between the financial stability of the
organization and the score on the POC would indicate that a participative style of
management results in increased productivity which is translated into increased
financial stability. Productivity was defined in terms of financial stability for a
number of reasons, the most obvious being is that financial stability is something
that can be readily measured in discrete, objective units. Each company was rated
on a financial stability scale that was composed of two parts, yearly sales and a
financial rating from Dun & Bradstreet. Both of these factors were computed for
each responding company using a linear number conversion of the factors. A
number of previous studies using the POC have found that overall sales appears to
be positively correlated with a high score on the POC. Yearly sales of
$1,000,000 to $5,000,000 were assigned a point value of two, $6,000,000 to
$10,000,000 were assigned a value of four, $11,000,000 to $25,000,000 were
assigned a value of six, $26,000,000 to $50,000,000 were given a value of eight,
$51,000,000 to $100,000,000 were assigned a value of 10, and finally, any
companies with yearly sales greater than $100,000,000 were given a value of 12.
Dun & Bradstreet rates financial stability using a five point system, with
1A being the lowest rating and 5A being the highest. Each of these financial
Reproduced with permission of the copyright owner. Further reproduction prohibited without permission.
39
stability ratings was doubled, resulting in the final financial stability rating being
two for 1A, four for 2A, six for 3A, eight for 4A and 10 for 3A.
The numbers obtained from both parts of the financial stability indicator
(yearly sales and the Dun & Bradstreet rating) were separately compared to the
POC average and they were also multiplied (yearly sales times Dun & Bradstreet
rating) and compared to the POC averages. The final results of the study were
analyzed using the factor obtained by multiplying the yearly sales by the Dun &
Bradstreet rating, increasing the spread between companies with sound financial
ratings and those with below average financial ratings.
Correlational analyses were performed on all variables, including the
following: averages of responses on questionnaire, age of organization, size of
organization (number of employees), number of different locations, type of
management style, age of top managers, educational level of top managers, and
sex of top managers. Additionally, correlational analyses were performed bet
ween the demographic variables to determine whether or not there were any other
demographic factors influencing the five hypotheses. The correlations were per
formed in order to determine whether or not any of the five hypotheses were true,
or rather if the null hypothesis for each of the five hypotheses could be false. The
critical value for rejecting the null hypothesis is approximately ± 0.156 (a =
0.05) for all hypotheses that do not involve the financial factors, annual sales,
current financial status (rating) from Dun & Bradstreet and financial stability
rating (Factors 27, 28 and 29). The critical value for rejecting the null hypothesis
for These factors is ± 0.201 (a = 0.05), due to the fact that there were fewer
degrees of freedom.
Reproduced with permission of the copyright owner. Further reproduction prohibited without permission.
Summary
Each of the employees listed as part of the organization's management
team in the Million Dollar Directory within each of the targeted organizations was
sent a copy of the survey instrument, Likert's Profile of Organizational Character
istics (POC), that had been supplemented with nine demographic questions. Sixty
days after the surveys had been sent out, telephone contact was made with all of
those individuals who had not yet responded, and another survey form was sent to
them if they requested one.
The data that was received was analyzed using SPSS, Release 4.1, on an
IBM Model 3090-200E mainframe computer, located at Ferris State University,
Big Rapids, MI. Correlational analyses were performed on all 29 factors/ques
tion, consisting of 16 POC questions, nine demographic questions, a response
average of the 16 POC questions, and three different financial statistics (annual
sales, Dun & Bradstreet rating and a financial stability rating). A t test was per
formed for each of the hypotheses as well as a confidence interval for each of the
pertinent correlation coefficients.
Reproduced with permission of the copyright owner. Further reproduction prohibited without permission.
CHAPTER IV
RESULTS
Introduction
The purpose of this study was to determine if using a participative style of
management would increase the productivity of an organization, thereby increas
ing its financial stability. Additionally, research was conducted to determine
what demographic factors had to be present in order for an organization to use a
participative style of management. Likert’s Profile of Organizational Characteris
tics, with a demographic survey added, was sent to all of the executives listed in
the Dun & Bradstreet Million Dollar Directory with a self-addressed, stamped
envelope for ease of return. The review of the literature in Chapter n outlined
the various components of what comprised a participative style of management
and how each of these components fits into the entire participative management
scenario.
The results of this study, all research hypotheses and other Endings of
interest, are presented in this chapter. Each of the hypotheses are presented in
the same order in which the were discussed in the Erst and second chapters.
673 surveys, complete with stamped, addressed return envelopes, were
mailed with sent to the executives listed in Dun & Bradstreet's Million Dollar
Directory, whose organizations had the SIC (Standard Industrial Classification) of
2521 or 2522. There were 138 initial responses to the survey. Follow up on
non-respondents occurred 60 days after the initial mailing by telephoning the
41
Reproduced with permission of the copyright owner. Further reproduction prohibited without permission.
company and asking for the individual. During the telephone contact, each person
who had failed to respond to the initial request was asked if they had received the
survey and if they had, when would they be able to fill it out. In 18 cases, a
second survey was sent to the person who stated that they had not received it. An
additional 10 surveys were sent to individuals who had replaced the initial person
that the survey was originally sent to. 30 days after the first follow up telephone
calls, an additional 23 completed surveys were received. At this point, additional
telephone contact resulted in no additional surveys, with the exception of one
survey that was received 14 months after the initial mailings.
For the most part, surveys with low ratings were evenly distributed
through the return flow of the surveys. The only exception to this occurred at the
very end of the return period, after the first telephone contact, when two of the
lowest rated POCs were among the last four received.
A return rate of 24% is not particularly high. The most common reason
given for not returning the surveys in the time requested was that the person was
too busy. Other possible participants stated that they had not received the survey
or did not know where to return it. Finally, other potential respondents stated
that they did not fill out surveys.
Correlational analyses on were performed on component factors of the
POC to determine whether or not the POC was valid, in this instance, for the
variables being examined. Comparisons between the various factors have been
performed in other studies and the results from this study compare favorably to
similar correlational analyses performed in other studies between the various
components of the POC. Null hypotheses were constructed for the five hypothes
es under examination in the study, using a = 0.05, as follows:
Reproduced with permission of the copyright owner. Further reproduction prohibited without permission.
43
Ho: p(rho) = 0 (a = 0.05)
A t test for independent means was used to test the existence of a relationship
between the level of education of the organizations's managers, the managers'
ages, the size and age of the organization and the organization's financial stability
and the style of management used by each responding organization. The null
hypotheses (Ho) were:
1. There will be no difference in the educational levels of the mangers
who use a participative style of management and the managers who do not use a
participative style of management.
2. There will be no differences in the ages between organizations that
use a participative style of management and organizations that do not use a partici
pative style of management.
3. There will be no difference in age between managers who use a
participative style of management and managers who do not use a participative
style of management.
4. There will be no difference in size between organizations that use
participative management and organizations that do not use a participative style of
management.
5. There will be no difference in financial stability between organiza
tions that use participative management and organizations that do not use participa
tive management.
Chapter IV consists of the following major sections: demographic charac
teristics of the sample, correlational analyses, female-male response analyses,
hypotheses testing and summary.
Reproduced with permission of the copyright owner. Further reproduction prohibited without permission.
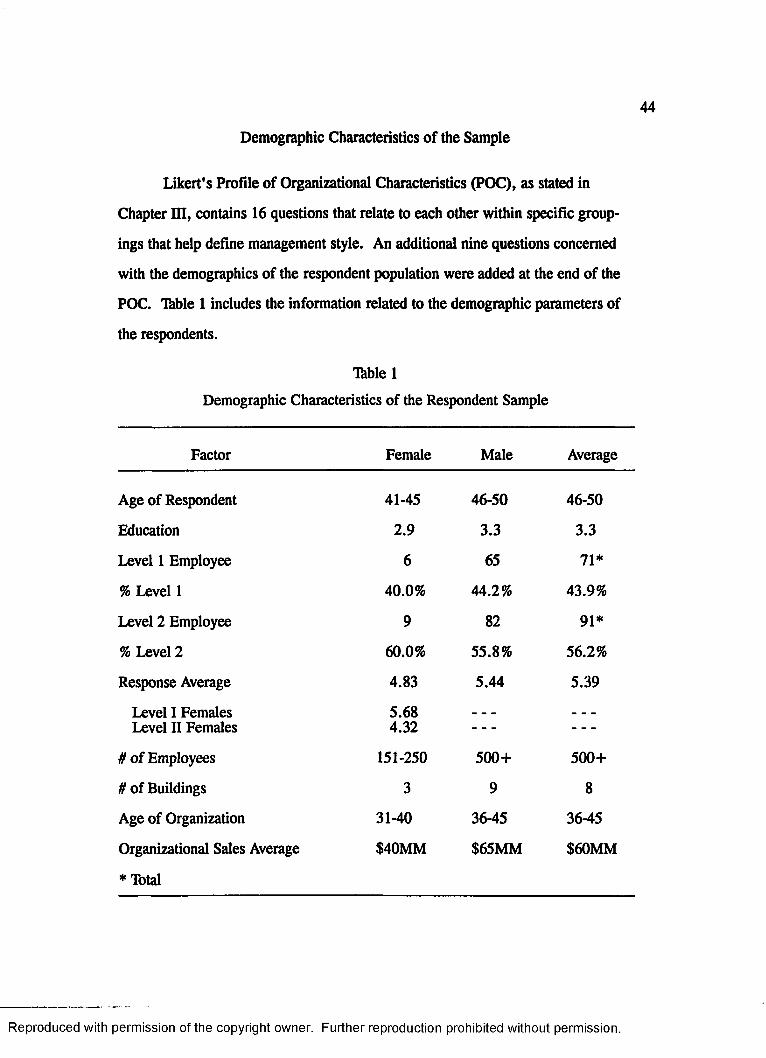
44
Demographic Characteristics of the Sample
Likert's Profile of Organizational Characteristics (POC), as stated in
Chapter m , contains 16 questions that relate to each other within specific group
ings that help define management style. An additional nine questions concerned
with the demographics of the respondent population were added at the end of the
POC. Ihble 1 includes the information related to the demographic parameters of
the respondents.
Thblel
Demographic Characteristics of the Respondent Sample
Factor Female Male Average
Age of Respondent 41-45 46-50 46-50
Education 2.9 3.3 3.3
Level 1 Employee 6 65 71*
% Level 1 40.0% 44.2% 43.9%
Level 2 Employee 9 82 91*
% Level 2 60.0% 55.8% 56.2%
Response Average 4.83 5.44 5.39
Level I Females 5.68 . . . . . .
Level II Females 4.32 ------ ------
# of Employees 151-250 500+ 500+
# of Buildings 3 9 8
Age of Organization 31-40 36-45 36-45
Organizational Sales Average
* Total
$40MM $65MM $60MM
Reproduced with permission of the copyright owner. Further reproduction prohibited without permission.

Approximately 9.3% of the respondents were female, with an average age
somewhere between 41 and 45, and had slightly less than four years of college.
By contrast, the male population had an average age of somewhere between 46
and 50, with slightly more than four years of college. The organizations that
females worked in tended to be smaller (151-250 employees in 3 buildings) than
their average male executive (500+ employees in an average of 9 buildings). The
overall response average for females was 4.83 while for males it was 5.44.
During the inputting of the data, it was noted that in a number of cases, female
respondents appeared have lower average response ratings than males within the
same organization. An analysis was then performed to determine if there was a
relationship between sex and low responses on the POC. A t test was run on the
grand mean for the females as compared to the grand mean for the males, to
determine whether or not the mean of the females could be a subset of the entire
study population. This can be symbolically stated as
Ho: n = 5.39 (a = 0.05)
The results were t = -1.944 and tcv = -2.145. The null hypothesis was not re
jected at the a = 0.05 level.
Although the null hypothesis was not rejected, further examinations were
performed by separating the response averages for Level I and Level II females.
Level I positions are those top executive positions that hold the title of CEO,
president, etc., while Level II positions are typically vice presidents, department
managers, plant managers, etc. At this point the decision was made to separate
out the females who were in organizations with a Level I female and those female
respondents who were in organizations where there were no Level I females. The
means for the two groups were 5.7 and 4.3, respectively. Separate t tests were
Reproduced with permission of the copyright owner. Further reproduction prohibited without permission.
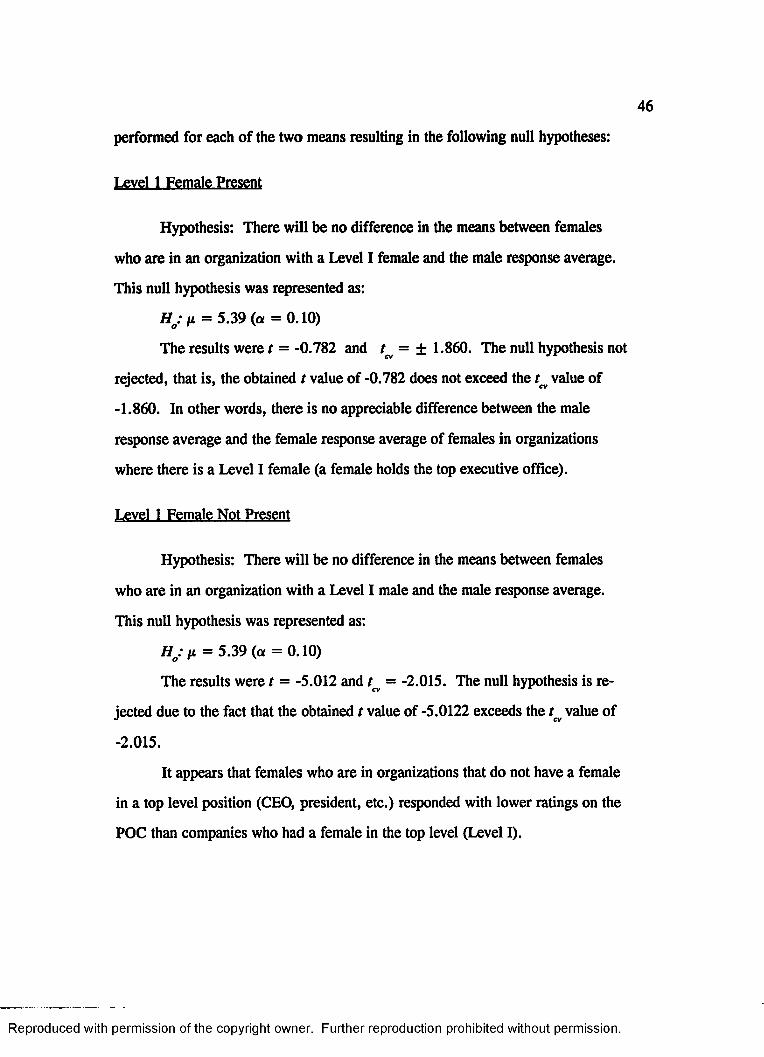
performed for each of the two means resulting in the following null hypotheses:
Level 1 Female Present
Hypothesis: There will be no difference in the means between females
who are in an organization with a Level I female and the male response average.
This null hypothesis was represented as:
Hq: n = 5.39 (a =0.10)
The results were t = -0.782 and tev = ± 1.860. The null hypothesis not
rejected, that is, the obtained t value of -0.782 does not exceed the tn value of
-1.860. In other words, there is no appreciable difference between the male
response average and the female response average of females in organizations
where there is a Level I female (a female holds the top executive office).
Level 1 Female Not Present
Hypothesis: There will be no difference in the means between females
who are in an organization with a Level I male and the male response average.
This null hypothesis was represented as:
Ho: n = 5.39 (a = 0.10)
The results were t = -5.012 and tcv = -2.015. The null hypothesis is re
jected due to the fact that the obtained t value of -5.0122 exceeds the t value of«i cv
-2.015.
It appears that females who are in organizations that do not have a female
in a top level position (CEO, president, etc.) responded with lower ratings on the
POC than companies who had a female in the top level (Level I).
Reproduced with permission of the copyright owner. Further reproduction prohibited without permission.
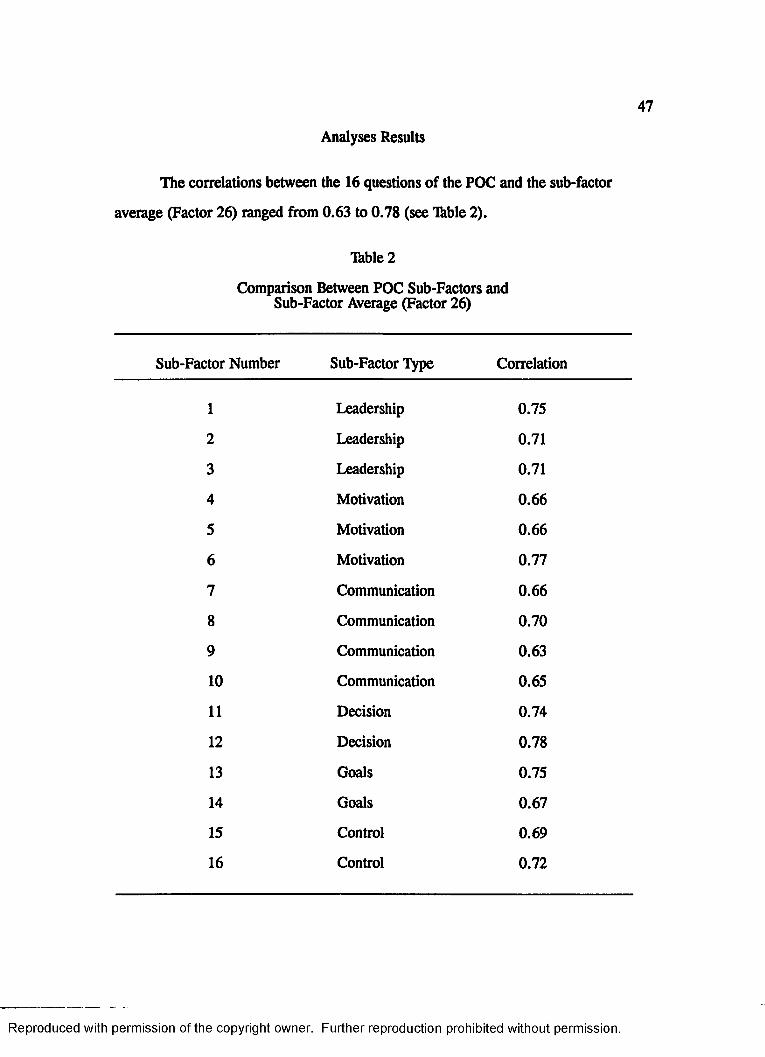
Analyses Results
47
The correlations between the 16 questions of the POC and the sub-factor
average (Factor 26) ranged from 0.63 to 0.78 (see Thble 2).
Thble 2
Comparison Between POC Sub-Factors and Sub-Factor Average (Factor 26)
Sub-Factor Number Sub-Factor Type Correlation
1 Leadership 0.75
2 Leadership 0.71
3 Leadership 0.71
4 Motivation 0.66
5 Motivation 0.66
6 Motivation 0.77
7 Communication 0.66
8 Communication 0.70
9 Communication 0.63
10 Communication 0.65
11 Decision 0.74
12 Decision 0.78
13 Goals 0.75
14 Goals 0.67
15 Control 0.69
16 Control 0.72
Reproduced with permission of the copyright owner. Further reproduction prohibited without permission.
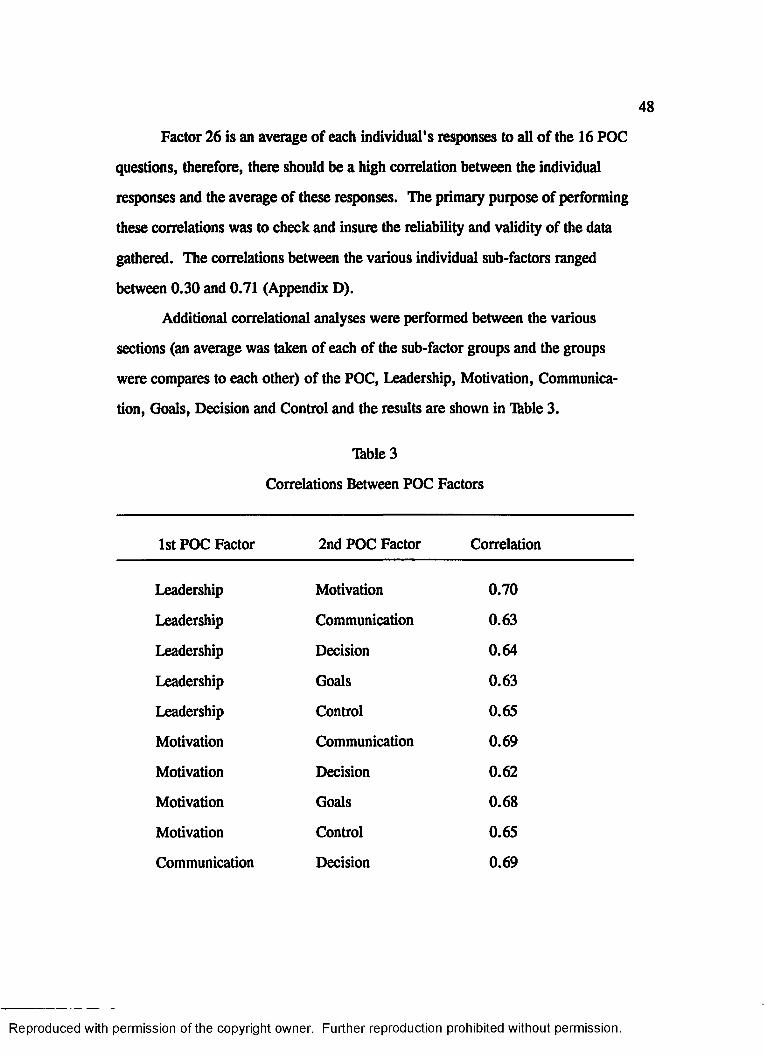
48
Factor 26 is an average of each individual's responses to all of the 16 POC
questions, therefore, there should be a high correlation between the individual
responses and the average of these responses. The primary purpose of performing
these correlations was to check and insure the reliability and validity of the data
gathered. The correlations between the various individual sub-factors ranged
between 0.30 and 0.71 (Appendix D).
Additional correlational analyses were performed between the various
sections (an average was taken of each of the sub-factor groups and the groups
were compares to each other) of the POC, Leadership, Motivation, Communica
tion, Goals, Decision and Control and the results are shown in Ihble 3.
Thble 3
Correlations Between POC Factors
1st POC Factor 2nd POC Factor Correlation
Leadership Motivation 0.70
Leadership Communication 0.63
Leadership Decision 0.64
Leadership Goals 0.63
Leadership Control 0.65
Motivation Communication 0.69
Motivation Decision 0.62
Motivation Goals 0.68
Motivation Control 0.65
Communication Decision 0.69
Reproduced with permission of the copyright owner. Further reproduction prohibited without permission.
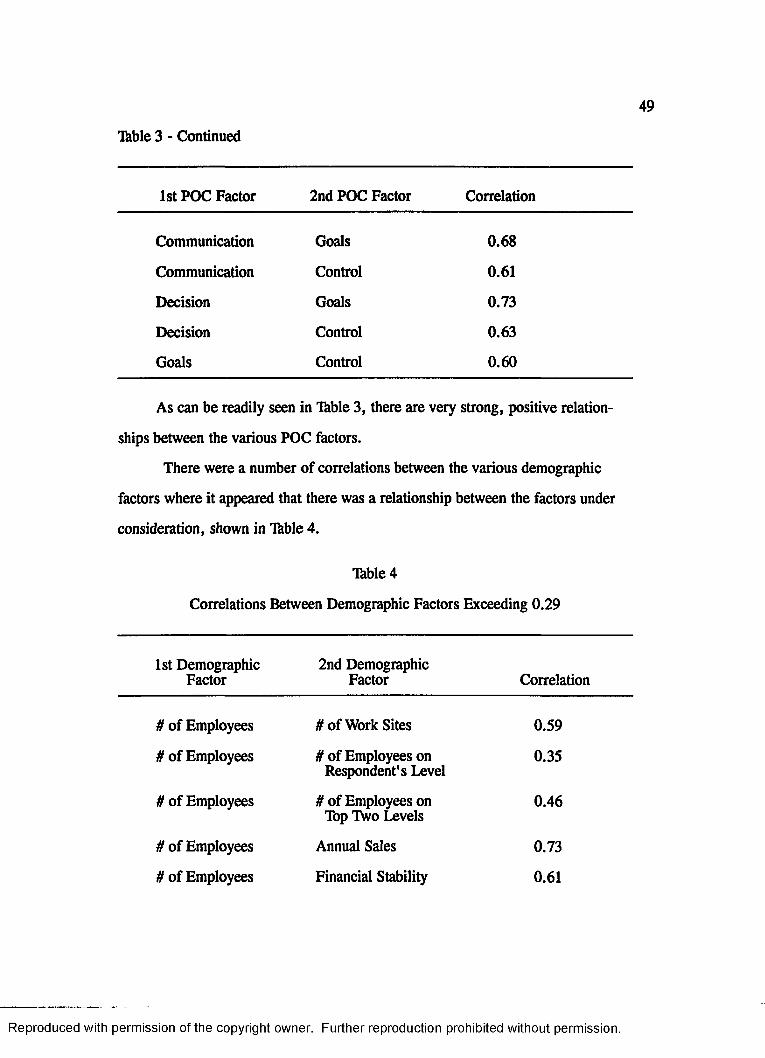
49
Thble 3 - Continued
1st POC Factor 2nd POC Factor Correlation
Communication Goals 0.68
Communication Control 0.61
Decision Goals 0.73
Decision Control 0.63
Goals Control 0.60
As can be readily seen in Table 3, there are very strong, positive relation
ships between the various POC factors.
There were a number of correlations between the various demographic
factors where it appeared that there was a relationship between the factors under
consideration, shown in Ihble 4.
Tible 4
Correlations Between Demographic Factors Exceeding 0.29
1st Demographic Factor
2nd Demographic Factor Correlation
it of Employees if of Work Sites 0.59
# of Employees it of Employees on Respondent's Level
0.35
# of Employees ft of Employees on Tap Two Levels
0.46
# of Employees Annual Sales 0.73
# of Employees Financial Stability 0.61
Reproduced with permission of the copyright owner. Further reproduction prohibited without permission.
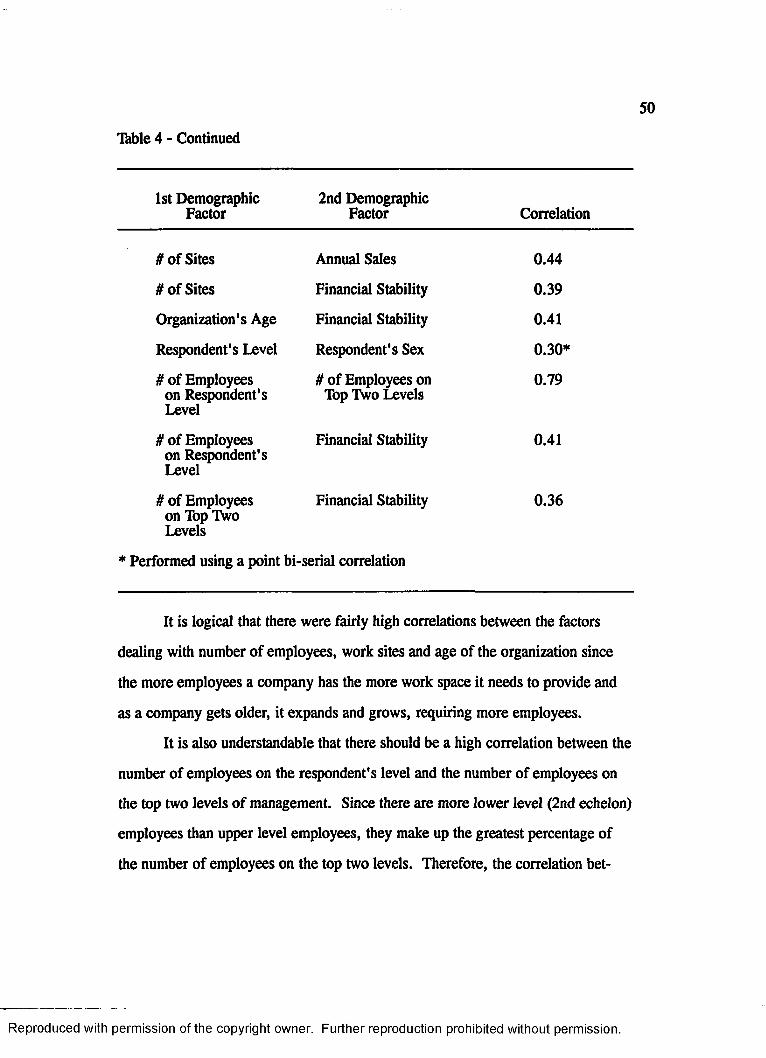
50
Ihble 4 - Continued
1st Demographic Factor
2nd Demographic Factor Correlation
tt of Sites Annual Sales 0.44
it of Sites Financial Stability 0.39
Organization's Age Financial Stability 0.41
Respondent's Level Respondent's Sex 0.30*
it of Employees on Respondent's Level
it of Employees on Top Two Levels
0.79
if of Employees on Respondent's Level
Financial Stability 0.41
it of Employees on Tbp Two Levels
Financial Stability 0.36
* Performed using a point bi-serial correlation
It is logical that there were fairly high correlations between the factors
dealing with number of employees, work sites and age of the organization since
the more employees a company has the more work space it needs to provide and
as a company gets older, it expands and grows, requiring more employees.
It is also understandable that there should be a high correlation between the
number of employees on the respondent's level and the number of employees on
the top two levels of management. Since there are more lower level (2nd echelon)
employees than upper level employees, they make up the greatest percentage of
the number of employees on the top two levels. Therefore, the correlation bet-
Reproduced with permission of the copyright owner. Further reproduction prohibited without permission.
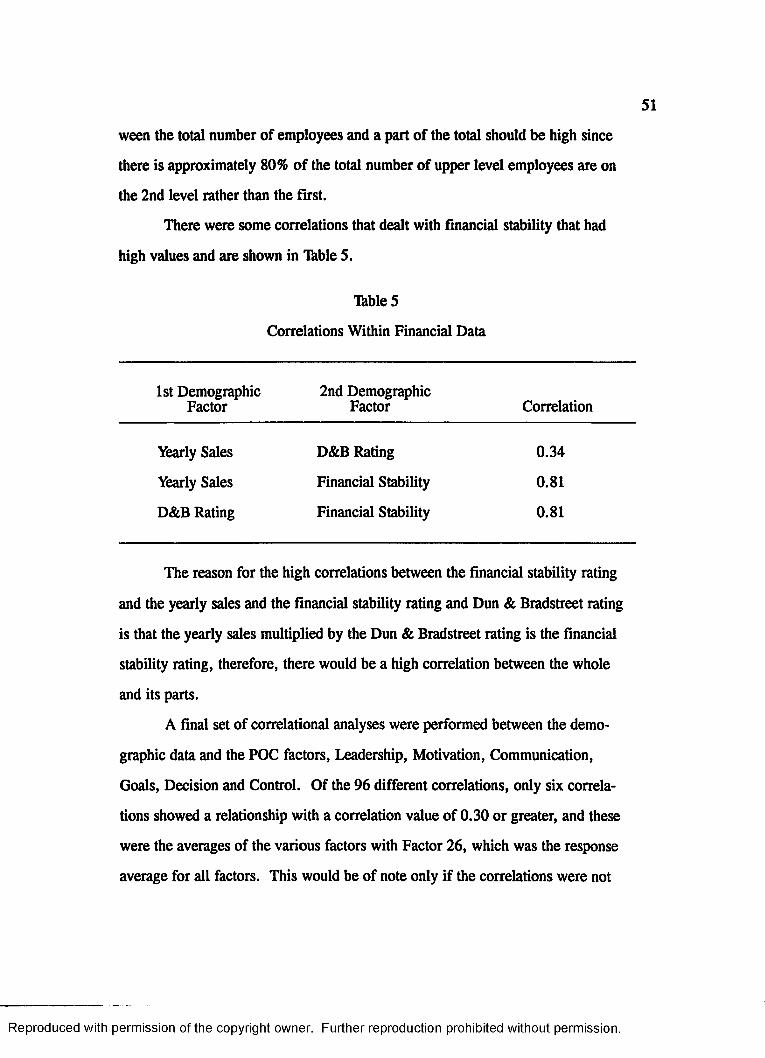
51
ween the total number of employees and a part of the total should be high since
there is approximately 80% of the total number of upper level employees are on
the 2nd level rather than the first.
There were some correlations that dealt with financial stability that had
high values and are shown in Thble 5.
Thble 5
Correlations Within Financial Data
1st Demographic 2nd DemographicFactor Factor Correlation
Yearly Sales D&B Rating 0.34
Yearly Sales Financial Stability 0.81
D&B Rating Financial Stability 0.81
The reason for the high correlations between the financial stability rating
and the yearly sales and the financial stability rating and Dun & Bradstreet rating
is that the yearly sales multiplied by the Dun & Bradstreet rating is the financial
stability rating, therefore, there would be a high correlation between the whole
and its parts.
A final set of correlational analyses were performed between the demo
graphic data and the POC factors, Leadership, Motivation, Communication,
Goals, Decision and Control. Of the 96 different correlations, only six correla
tions showed a relationship with a correlation value of 0.30 or greater, and these
were the averages of the various factors with Factor 26, which was the response
average for all factors. This would be of note only if the correlations were not
Reproduced with permission of the copyright owner. Further reproduction prohibited without permission.
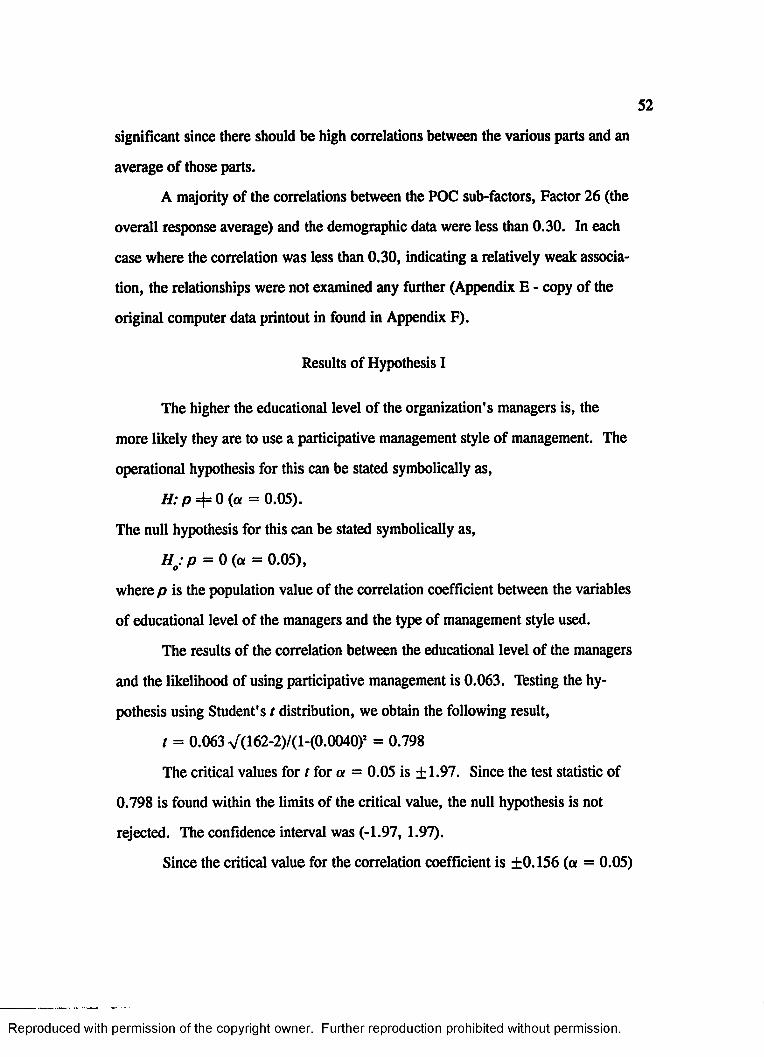
52
significant since there should be high correlations between the various parts and an
average of those parts.
A majority of the correlations between the POC sub-factors, Factor 26 (the
overall response average) and the demographic data were less than 0.30. In each
case where the correlation was less than 0.30, indicating a relatively weak associa
tion, the relationships were not examined any further (Appendix E - copy of the
original computer data printout in found in Appendix F).
Results of Hypothesis I
The higher the educational level of the organization's managers is, the
more likely they are to use a participative management style of management. The
operational hypothesis for this can be stated symbolically as,
H: p 4= 0 (a = 0.05).
The null hypothesis for this can be stated symbolically as,
Ho: p = 0 (a = 0.05),
where p is the population value of the correlation coefficient between the variables
of educational level of the managers and the type of management style used.
The results of the correlation between the educational level of the managers
and the likelihood of using participative management is 0.063. Testing the hy
pothesis using Student's t distribution, we obtain the following result,
t = 0.063 y[ (162-2)/(l-(0.0040)J = 0.798
The critical values for t for a = 0.05 is ±1.97. Since the test statistic of
0.798 is found within the limits of the critical value, the null hypothesis is not
rejected. The confidence interval was (-1.97, 1.97).
Since the critical value for the correlation coefficient is ±0.156 (a = 0.05)
Reproduced with permission of the copyright owner. Further reproduction prohibited without permission.
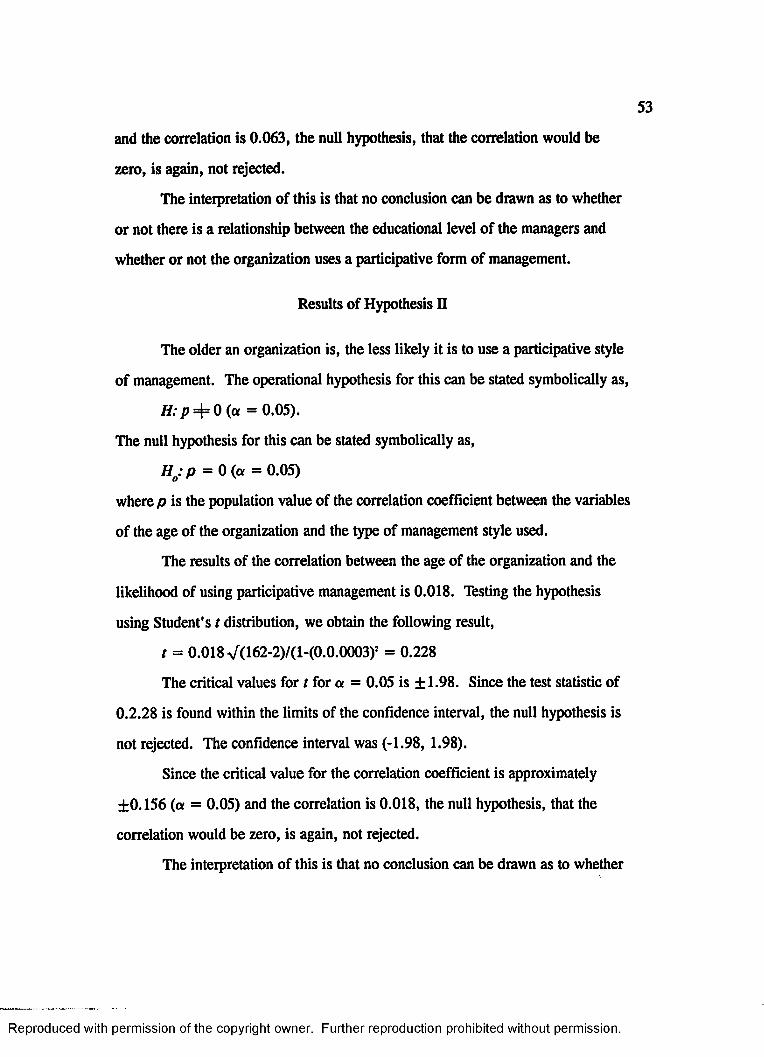
and the correlation is 0.063, the null hypothesis, that the correlation would be
zero, is again, not rejected.
The interpretation of this is that no conclusion can be drawn as to whether
or not there is a relationship between the educational level of the managers and
whether or not the organization uses a participative form of management.
Results of Hypothesis n
The older an organization is, the less likely it is to use a participative style
of management. The operational hypothesis for this can be stated symbolically as,
H: p =H 0 (a = 0.05).
The null hypothesis for this can be stated symbolically as,
Ho: p = 0 (a = 0.05)
where p is the population value of the correlation coefficient between the variables
of the age of the organization and the type of management style used.
The results of the correlation between the age of the organization and the
likelihood of using participative management is 0.018. Testing the hypothesis
using Student's t distribution, we obtain the following result,
t = 0.018 yf (162-2)/(l-(0.0.0003)s = 0.228
The critical values for / for a = 0.05 is ±1.98. Since the test statistic of
0.2.28 is found within the limits of the confidence interval, the null hypothesis is
not rejected. The confidence interval was (-1.98, 1.98).
Since the critical value for the correlation coefficient is approximately
±0.156 (a = 0.05) and the correlation is 0.018, the null hypothesis, that the
correlation would be zero, is again, not rejected.
The interpretation of this is that no conclusion can be drawn as to whether
Reproduced with permission of the copyright owner. Further reproduction prohibited without permission.
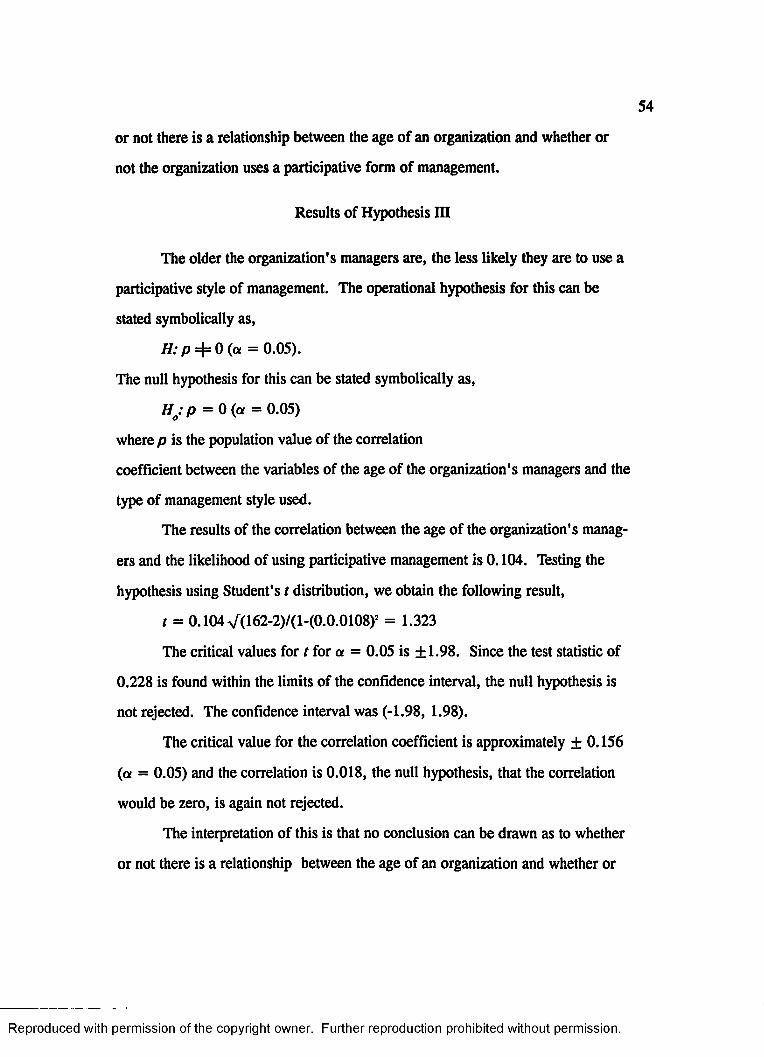
or not there is a relationship between the age of an organization and whether or
not the organization uses a participative form of management.
Results of Hypothesis m
The older the organization's managers are, the less likely they are to use a
participative style of management. The operational hypothesis for this can be
stated symbolically as,
H:p =|= 0 (“ = 0.05).
The null hypothesis for this can be stated symbolically as,
Ho: p = 0 (a = 0.05)
where p is the population value of the correlation
coefficient between the variables of the age of the organization's managers and the
type of management style used.
The results of the correlation between the age of the organization's manag
ers and the likelihood of using participative management is 0.104. Testing the
hypothesis using Student's t distribution, we obtain the following result,
t = 0.104 yf(162-2)/(l-(0.0.0108)2 = 1.323
The critical values for r for a = 0.05 is ±1.98. Since the test statistic of
0.228 is found within the limits of the confidence interval, the null hypothesis is
not rejected. The confidence interval was (-1.98, 1.98).
The critical value for the correlation coefficient is approximately ± 0.156
(a = 0.05) and the correlation is 0.018, the null hypothesis, that the correlation
would be zero, is again not rejected.
The interpretation of this is that no conclusion can be drawn as to whether
or not there is a relationship between the age of an organization and whether or
Reproduced with permission of the copyright owner. Further reproduction prohibited without permission.
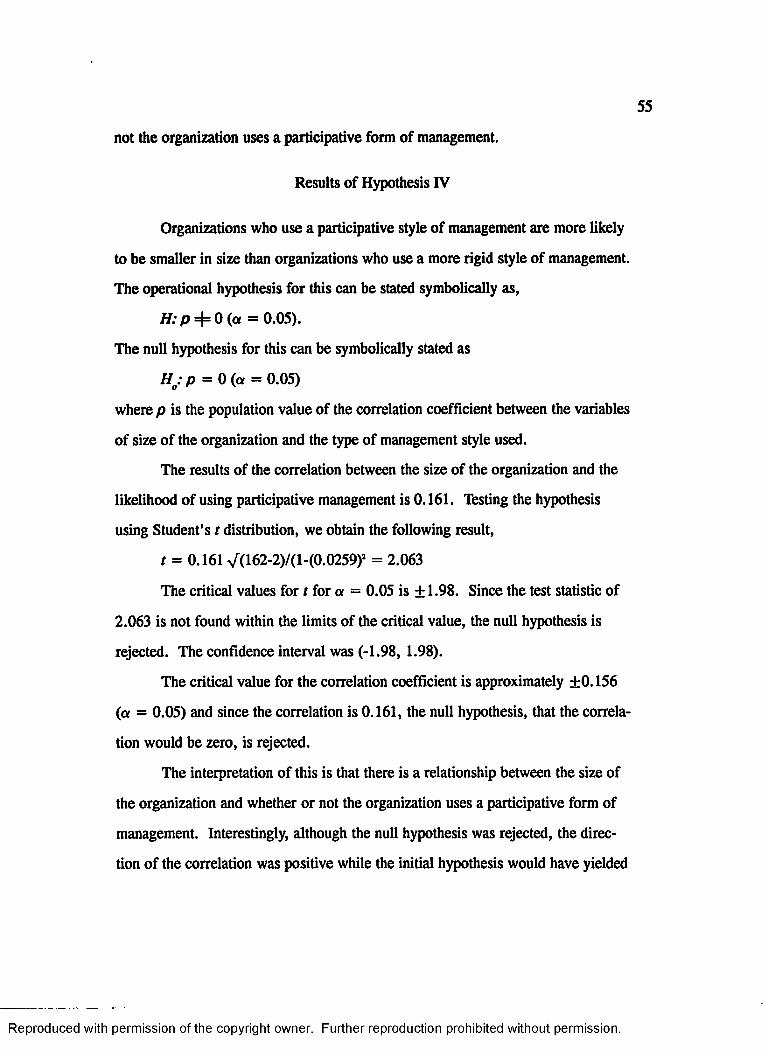
not the organization uses a participative form of management.
55
Results of Hypothesis IV
Organizations who use a participative style of management are more likely
to be smaller in size than organizations who use a more rigid style of management.
The operational hypothesis for this can be stated symbolically as,
H :p =|= 0 (ot = 0.05).
The null hypothesis for this can be symbolically stated as
Ho: p = 0 (a = 0.05)
where p is the population value of the correlation coefficient between the variables
of size of the organization and the type of management style used.
The results of the correlation between the size of the organization and the
likelihood of using participative management is 0.161. Testing the hypothesis
using Student's t distribution, we obtain the following result,
t = 0.161 yf(162-2)/(1-(0.0259)* = 2.063
The critical values for t for a = 0.05 is ±1.98. Since the test statistic of
2.063 is not found within the limits of the critical value, the null hypothesis is
rejected. The confidence interval was (-1.98, 1.98).
The critical value for the correlation coefficient is approximately ±0.156
(a = 0.05) and since the correlation is 0.161, the null hypothesis, that the correla
tion would be zero, is rejected.
The interpretation of this is that there is a relationship between the size of
the organization and whether or not the organization uses a participative form of
management. Interestingly, although the null hypothesis was rejected, the direc
tion of the correlation was positive while the initial hypothesis would have yielded
Reproduced with permission of the copyright owner. Further reproduction prohibited without permission.
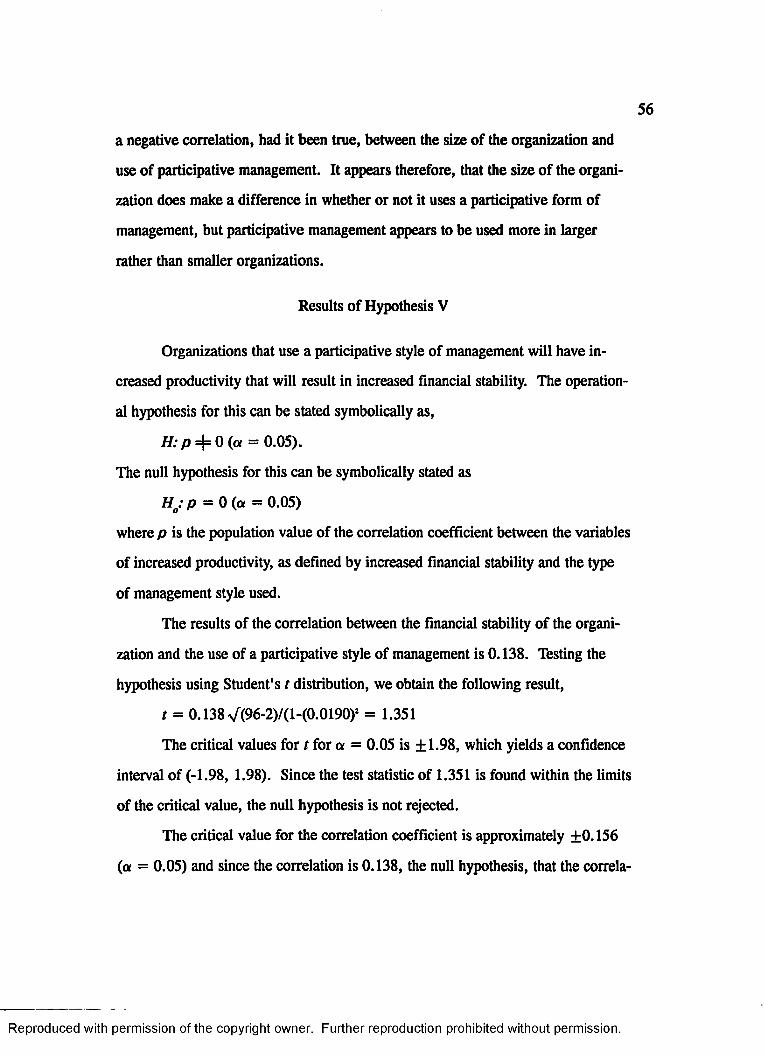
56
a negative correlation, had it been true, between the size of the organization and
use of participative management. It appears therefore, that the size of the organi
zation does make a difference in whether or not it uses a participative form of
management, but participative management appears to be used more in larger
rather than smaller organizations.
Results of Hypothesis V
Organizations that use a participative style of management will have in
creased productivity that will result in increased financial stability. The operation
al hypothesis for this can be stated symbolically as,
H:p =|= 0 (a = 0.05).
The null hypothesis for this can be symbolically stated as
Ho: p = 0 (a = 0.05)
where p is the population value of the correlation coefficient between the variables
of increased productivity, as defined by increased financial stability and the type
of management style used.
The results of the correlation between the financial stability of the organi
zation and the use of a participative style of management is 0.138. Testing the
hypothesis using Student's t distribution, we obtain the following result,
t = 0.138 yf(96-2)/(l-(0.0190)2 = 1.351
The critical values for t for a = 0.05 is ±1.98, which yields a confidence
interval of (-1.98, 1.98). Since the test statistic of 1.351 is found within the limits
of the critical value, the null hypothesis is not rejected.
The critical value for the correlation coefficient is approximately ±0.156
(a = 0.05) and since the correlation is 0.138, the null hypothesis, that the correla-
Reproduced with permission of the copyright owner. Further reproduction prohibited without permission.
57
tion would be zero, is again, not rejected.
The interpretation of this is that no conclusion can be drawn as to whether
or not there is a relationship between the financial stability of an organization and
whether or not the organization uses a participative form of management.
Summary
162 surveys were received back out of 677 sent, or a return rate of 24%,
and 91 of the responses came from companies where financial data was available,
or 13.4% of the total surveys sent out. 9.9 % of the 91 respondents were female
with an average age of 41-46 with an average educational level of 3-4 years of
college, while their male counterparts were 46-50 years old with just over 4 years
of college.
A closer examination of the difference between the average response given
by females and males revealed that females who worked in an organization where
there was a female in the top executive position rated the management style very
similar to their male colleagues whereas females who worked in organizations
where a male held the top executive position rated the organization's style of
management as being much more restrictive than their male colleagues.
An correlational analysis between the POC sub-factors with the average
response of the POC (an average of all of the sub-factors) showed correlations of
0.63 to 0.79. An additional analysis was performed between the various factors of
the POC, Leadership, Motivation, Communication, Goals, Decision and Control.
These correlations ranged from 0.60 to 0.73.
A correlational analysis was executed on the demographic information and
it was found that there were a number of correlations within the collected informa
Reproduced with permission of the copyright owner. Further reproduction prohibited without permission.
tion that showed a definite relationship between the variables. Most of these relat
ed variables were concerned with the size, age and financial stability of the organ
ization. The financial correlations, dealing with yearly sales and Dun & Brad
street ratings, ranged from 0.34 to 0.81.
No support was shown for Hypotheses I, II, m and V, that is, this study
showed no discernible relationship between:
1. The educational level of the organizations's managers and the like
lihood of using a participative style of management.
2. The age of an organization and the likelihood of using a participa
tive style of management.
3. The age of the managers and the likelihood of using a participative
style of management.
5. Whether using a participative style of management causes an in
crease in financial stability.
The fourth hypothesis "Organizations who use a participative style of
management are more likely to be smaller in size than organizations who use a
rigid style of management" did show a positive relationship. Unfortunately,
though, in order to fulfill the requirements of the hypothesis, the result should
have been negative correlation, that is, the smaller organizations should have been
more likely to use a participative style of management. A positive correlation
means that the larger an organization is, the more likely it is to use a participative
style of management, the exact opposite of what was proposed in Hypothesis IV.
Reproduced with permission of the copyright owner. Further reproduction prohibited without permission.
CHAPTER V
CONCLUSIONS AND RECOMMENDATIONS
Conclusions
Optimal productivity is the goal of every "for-profit" organization.
Optimal productivity can be gained through the use of a number of different ele
ments, including technologically advanced machinery, increased computer usage,
redesigning work station flow and advanced management methods, to name a
few.
One of the "new" management techniques is participative management,
where everyone in the organization has some input into the decisions made. The
advantages of participative management are obvious, you get input not only from
the management side, but also from the workers, the employees who will be
performing the work. This group of people know the actual production operation
inside and out and are able to give additional insight that may not be readily
apparent from casual observation.
Participative management also has problems, especially in its inception.
Most managers in established organizations tend to continue running the organiza
tion as it had been run, following the axiom "If it ain't broke, don't fix it". Some
of these managers are not easily able to relinquish the control that they have, and
participative management requires that everyone share the responsibilities and
decisions, although not necessarily on the same level.
Adherents of participative management strongly support the concept being
59
Reproduced with permission of the copyright owner. Further reproduction prohibited without permission.
60
have flaws in how they portray their point of view and that of their opponents.
The review of literature examined a number of organizations, both private
and public non-profit and "for profit" organizations, and their attempt to integrate
some, if not all, of the elements of participative management into their organiza
tion's management structure. The general consensus of the studies was that par
ticipative styles of management help increase the efficiency of the organization,
although actual "pre" and "post" implementation measurements of efficiency were
not performed, therefore the most that can be said is that the use of participative
management leads to better working conditions, in the opinion of the employees
of the organizations about whom the articles were written.
Response Rate
The low response rate occurred for a number of different reasons that were
listed earlier. The most likely reason that the surveys were not completed was that
there was no "buy in" for the participants. It did not directly affect them since
they were not involved other than filling out a questionnaire, it therefore gave
little or no value for the time involved. Future studies of this nature might fare
better if concentration were focused on a smaller number of companies, and these
companies were visited in person. This would cause a face to be attached to the
questionnaire which would allow the respondent to feel as though they were a
bigger part of the project rather than just a set of numbers for another "college
study".
Reproduced with permission of the copyright owner. Further reproduction prohibited without permission.
Correlational Analyses
As stated previously, the correlations did not reveal any startling facts nor
do they lead to any startling conclusions. There were a number of high correla
tions, however, since most of these correlations were measuring the same proper
ty, it would therefore stand to reason that they would correlate fairly well with
themselves or similar factors. The correlations between sex and number of
employees in the organization (0.18) and sex and the respondent's level in the
organization (0.27) were calculated using a point bi-serial correlation because sex
only has two conditions, female or male.
The correlations between number of employees and the number of work
sites (0.59), the number of employees and number of employees on the respon
dent's level (0.35), the number of employees and number of employees in the top
two levels of the company (0.46), the number of employees and annual sales
((0.73), number of employees and financial stability rating (0.61) are obviously
going to be high due to the fact that Factor (Question) 17 asks for the total
number of employees in the company. Each of the factors that correlate highly
with Factor 17 (the number of employees) are concerned in some way with size
of the organization or the logical results that occur as an organization increases in
size. As an organization grows larger, there is an increase in the number of
buildings occupied (Factor 18), more managers (Factors 21 and 22) to run the
organization and the larger the organization the greater the annual sales (Factor
27). The financial stability rating (Factor 29) is a direct product of the annual
sales (Factor 27) and the organization's current financial status, as appraised by
Dun & Bradstreet (Factor 28), so if the correlation between the number of
employees and annual sales is high, then the correlation between the number of
Reproduced with permission of the copyright owner. Further reproduction prohibited without permission.
employees and the financial stability rating will also be high.
The correlations between the number of work sites and annual sales
(0.44), the number of work sites and the financial stability rating (0.39) are high
due primarily to the same reasons that the correlations involving the number of
employees are high, larger organizations have larger infrastructures.
The correlations involving the organization's age and financial stability
rating (0.41)) are also significant for the same reasons that were stated earlier in
the analysis of factors involving the number of employees and the number of work
sites, that is, as organizations grow older, they usually get larger, with more
employees and more work sites.
The high correlation between number of employees on the respondent's
level and number of employees on the top two levels of management (0.79) is
clearly due to the fact that they are both measuring the number of members in
each of the two top levels of the organization. Obviously, there will always be
either the same or more total employees in the top two levels of the organization
than there will be in either of the component levels (the sum is equal to the total
of its parts).
The correlation between the number of employees on respondent's level
and the yearly sales (0.32) is easily explained by the fact that companies with
greater sales volumes are usually larger companies and have more top level
managers.
The final correlations examined were between the yearly sales and the
Dun & Bradstreet rating) (0.34), the yearly sales and the financial stability rating
(0.81), and the Dun & Bradstreet rating and the financial stability rating (0.81).
Basically, the correlation between the yearly sales and the Dun & Bradstreet rating
Reproduced with permission of the copyright owner. Further reproduction prohibited without permission.
shows that the companies who have greater sales volumes are more likely to be
financially secure. This again is a fairly obvious and logical observation. The
correlations between the financial stability rating and the yearly sales and the Dun
& Bradstreet rating are high due to the fact that the financial stability rating is the
product of the numerical values of the annual sales and the Dun & Bradstreet
rating, therefore there would be a direct, positive relationship between the size or
size increase in either of those factors and an increase in the final product.
The correlations between the various parts of the POC correlate rather
highly with themselves, that is, each of the different subsections of the POC are
highly correlated with the other subsections. Although these high correlations
have little bearing on the hypotheses examined in this study, it is important to
note because if the subsections did not correlate well, the entire instrument would
be suspect as a valid measure of management styles.
There were t tests performed on the averages of the responses based on sex
of the respondent, to determine whether or not the response mean of the females
could be part of the sample mean. The first t test was performed to see whether
or not the response averages from females were could be contained within the
sample averages. The null hypothesis (that there was no difference between
female and male response averages) was not rejected , so the females responses
were split into two different averages, those with a female in a Level 1 position
and those without a female in a Level 1 position. It was found that those females
with a female in a Level 1 position had an average that was slightly higher than
the overall population average. It was also found, though, that females in organi
zations where there was not a Level 1 female had response averages that were
well outside critical limits. In other words, females in organizations where there
Reproduced with permission of the copyright owner. Further reproduction prohibited without permission.
were no upper level management females did not see the organization's style of
management in the same light as their male counterparts in the same organization.
This could be interpreted in any number of different ways, but the most
likely interpretation is that there is sexual bias within the organizations polled.
Females who were Level 2 employees within an organization where there was a
Level 1 female employee gave the highest responses for females to the question
naire. At the same time, Level 2 females within organizations with Level 1 males
were more likely to give responses lower than their male colleagues to the POC.
Hypotheses
Four out of five hypotheses that were tested did not prove out, and the one
that did actually resulted in the opposite conclusion from what was originally
stated. There are a number of reasons that this could have occurred that the
hypotheses could have failed. The possible reasons will be discussed for each
hypothesis.
Hypothesis I
The higher the educational level of the organization's management is, the
more likely it is to use a participative style of management.
The basic assumption that was made when this hypothesis was developed
was that participative management techniques are discussed and taught in upper
level college courses, therefore, it is logical to expect that the more higher educa
tion a person has pursued, the more likely it is that they would have been exposed
to the concepts of participative management. One of the most obvious fallacies of
this logic is that participative management has become a very common topic in
Reproduced with permission of the copyright owner. Further reproduction prohibited without permission.
numerous magazines and in many "mini" seminars around the country. Manage
ment experts often point to the Japanese, as models for consensus building, as an
example of participative management at work.
It no longer, therefore, is the case that it is necessary for a person to take
higher level college courses in order to learn about participative management.
Hypothesis II
The older an organization is, the less likely it is to use a participative style
of management. The underlying assumption here was, again, that in order to
learn about participative management, it would be necessary to take advanced
level college courses. Older managers would have taken advanced college level
courses when the theory of participative management was considered to be a "pipe
dream" and something of little or no consequence. Once again, the surprising
dominance of the Japanese in the world marketplace caused the concepts of partic
ipative management to be re-considered in a different light, spawning an avid
desire to know what the Japanese knew and what we did not..Is 1
Hypothesis III
The older an organization's managers are, the less likely they are to use a
participative style of management. The basic management philosophies taught in
the from the early 1900's until the early to mid 1980's were based on Frederick
Thylor and the other early industrial engineers. These philosophies stressed a
"one-man" operation, run from the top down, just like a military unit is run.
The primary job of top management was to make decisions and pass them down to
the middle management for implementation. The middle managers were responsi
Reproduced with permission of the copyright owner. Further reproduction prohibited without permission.
ble to oversee the actual operations and the job of the shop or floor employees was
to perform the work. Good ideas were encouraged from the ranks primarily
through monetary incentives and company recognition. The original conjecture
that formed the base of Hypothesis II was that the older the managers were, the
more likely it was that the fundamental management style that they were taught
was the "top down” model. A item to consider at this point is that the response
average for the entire sample that was used was 5.39 out of a total scale that
ranged from one to eight. This actually puts the response average in the consulta
tive management style rather than in a true participative management style. It is,
therefore, conceivable that although the null hypothesis was not rejected, that the
"top down” model did and still does influence upper management behavior, result
ing in a lower response average.
Hypothesis IV
Organizations who use a participative style of management are more likely
to be smaller in size than organizations who use a rigid style of management.
The null hypothesis was rejected, unfortunately, in order for the original hypothe
sis to be true, the resulting analyses would have to have been numerically nega
tive, that is, if smaller organizations were indeed more likely to use a participa
tive style of management than larger organizations, a numerical decrease in the
size of the organization would have been accompanied by a numerical increase in
the response average on the POC. Instead, the was a increase in the response
average as the organizations grew larger.
There is no logical explanation for this phenomenon, especially since the
number of large, small and medium organizations was equally distributed through
Reproduced with permission of the copyright owner. Further reproduction prohibited without permission.
out the returned responses. At this time, the reason for this result is unknown. It
is unclear whether this is an actual cause and effect relationship or just an anoma
ly.
Hypothesis V
Organizations that use a participative style of management will have in
creased productivity that will result in increased financial stability. In order to
define what effects should be visible in organizations that use participative forms
for management, a number of financial experts were consulted. The general
consensus of the experts was that if an organization was performing efficiently,
its financial stability and annual sales would be the first measurable items that
would be affected. It was also decided to multiply the two items together, thus
enhancing the effects of both good and bad performance by organizations. The
biggest problem was that it appeared that all organizations were using similar
styles of management, as evidenced by the homogeneity of the response averages
for each organization.
Recommendations
The null hypotheses for Hypotheses I, II, III and V were not rejected.
This does not necessarily mean that there is no effect, but rather that whatever
effect that it had was not measurable against background noise. One of the prob
lems is that the instrument is self-administered. This can cause several concerns,
including whether or not the respondent thought or was apprehensive about the
possibility of their answers be available to their superiors. Although the respond
ents were assured that their answers would remain anonymous, if the organization
Reproduced with permission of the copyright owner. Further reproduction prohibited without permission.
style leaned towards the exploitative or even the benevolent style of management,
this could have caused anxiety about answering truthfully.
Another problem with self administered instruments is the fact of interpre
tation of what any particular phrase means. Some people will view an benevolent
style of management as an enlightened way of doing business while others will
view it as a return to the "sweat shops" of the early 1900s. This was seen many
times in the results that were received, particularly in one case where two re
spondents of the same sex, had very similar responses, indicating, by the pattern
of their answers, that the organization was definitely using the participative style
of management. The third respondent from the same organization was of a dif
ferent sex and from their perspective, the style was just short of whips and
chains, with a large number of negative responses.
Another problem may be that the tool used to measure financial stability
may not have been sensitive enough to measure actual differences in worth.
Although the financial ratings of institutions such as Dun & Bradstreet are used
every day to make major, crucial decisions in the business world, these indicators
may not be discriminating enough to help discern between the differences in a
strong market competitor who uses an exploitative style of management and a
strong market competitor who uses a more participative style of management.
It could also be that the tool was not measuring an appropriate co-variant.
As stated previously, one of the assumptions that was being examined is that a
participative style of management increases productivity and increased productivi
ty results in an organization that has increased financial stability. There are
however, other factors that can affect an organization's financial stability, includ
ing currency exchange rates, interest rates, product diversification and so on. At
Reproduced with permission of the copyright owner. Further reproduction prohibited without permission.
69
this point, it is doubtful that there is any financial co-variant that could be used to
measure the true effect of a participative style of management on an organization's
productivity.
Study Format Changes
In order to accurately gauge the effect of a participative style of manage
ment and its effects on productivity, it will be necessary to actually go into the
organizations under study and take productivity measurements, or obtain valid
historical measurements that track productivity over time with care taken to
insure that other competing variables are not influencing any productivity chang
es, such as the introduction of gain sharing or profit sharing plans or the change
from a non-union to a union environment or the visa versa.
Since the null hypothesis of one of the hypotheses (Hypothesis IV),
"Organizations who use a participative style of management are more likely to be
smaller in size than organizations who use a more rigid style of management", was
rejected, then it can be inferred that larger organizations are more likely to use a
participative style of management. It would make any future study of this subject
more valid if comparisons of style were performed on subject organizations that
were closely matched on size and other physical characteristics. The only variable
that would differ between the individual members of matched pairs would be their
ratings on their style of management, with each organization have distinctly differ
ent styles of management.
Part of the study would also involve measurement of the management
style, but do to the interfering factors that were mentioned earlier, it would be
advantageous for the researcher to conduct all analyses of the management style
Reproduced with permission of the copyright owner. Further reproduction prohibited without permission.
70
rather than rely on self administration.
Summary
Although the study did produce some interesting data and insights into the
use of participative management in organizations, there were some flaws.
In order to correct the flaws in the study, it is recommended that for
future studies, the analysis of the organization's style of management be per
formed by one person rather than relying on individuals within the organization to
complete the questionnaire themselves.
The second recommendation would be to match organizations on the basis
of their physical characteristics, that is, size, number of employees, annual sales,
etc., and then assess their efficiency and what style of management they use.
The third and final recommendation is that the study use data from within
each organization on actual efficiencies to determine whether or not a participa
tive style of management would be conducive to increased efficiencies over other
styles of management.
Reproduced with permission of the copyright owner. Further reproduction prohibited without permission.

Appendix A
Protocol Clearance From the Human Subjects Institutional Review Board
71
Reproduced with permission of the copyright owner. Further reproduction prohibited without permission.
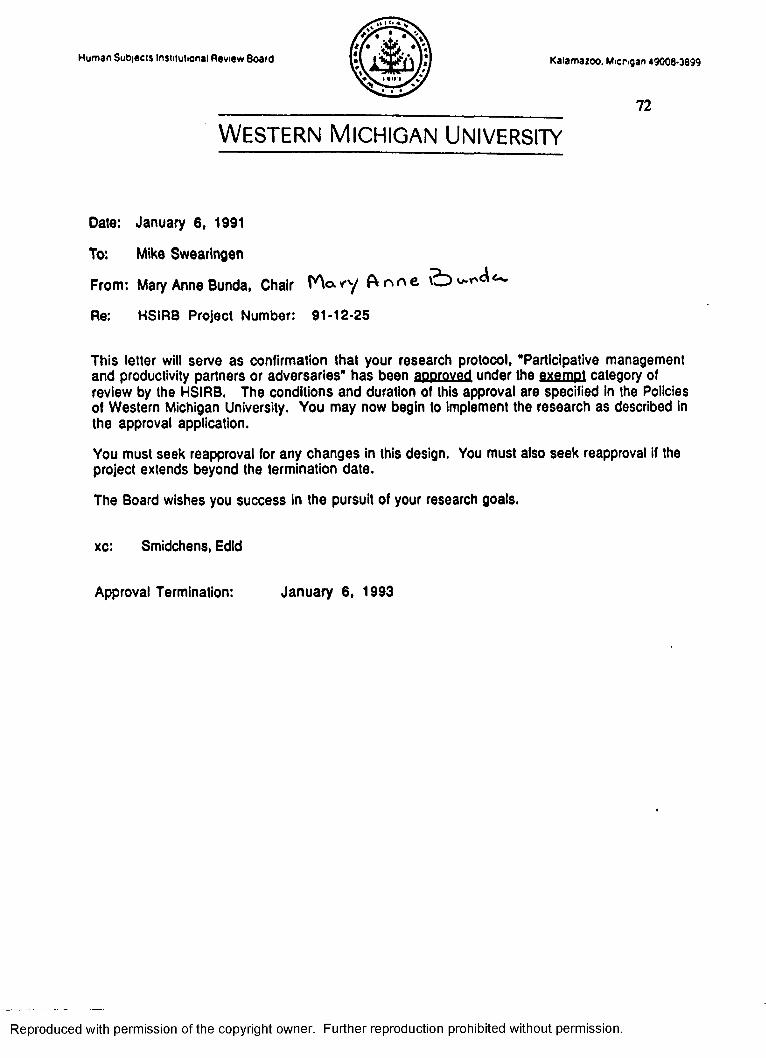
W e s t e r n M ic h ig a n U n iv e r s it y
72
Date: January 6, 1991
To: Mike Swearingen
From: Mary Anne Bunda, Chair M o - v y & n r \ e
Re: HSIRB Project Number: 91-12-25
This letter will serve a s confirmation that your research protocol, "Participative management and productivity partners or adversaries" has been approved under the fiaampi category of review by the HSIRB. The conditions and duration of this approval are specified in the Policies of W estern Michigan University. You may now begin to implement the research as described in the approval application.
You must seek reapproval for any changes in this design. You must also seek reapproval if the project extends beyond the termination date.
The Board wishes you success in the pursuit of your research goals.
xc: Smidchens, Edld
Approval Termination: January 6, 1993
Reproduced with permission of the copyright owner. Further reproduction prohibited without permission.
Appendix B
Cover Letter Sent to Participants
73
Reproduced with permission of the copyright owner. Further reproduction prohibited without permission.

74
Dear John Doe:
I am a doctoral candidate at Western Michigan University, in the Department of Educational Leadership, and am currently conducting research into the relationship between management styles and organizational success in industry.
I would appreciate your help in completing this study. Please complete the enclosed survey (no more than 5-7 minutes), and return it in the stamped, addressed envelope.
Each survey form is identified in the upper right hand corner with an identification number. This number will be used only to help group responses from the same company. Once the responses have been grouped, the identification number will be removed from the survey forms.
Please feel free to call me at (616) 796-4858, if you have any questions. An abstract will be sent to all companies whose management responds. Copies of the final results and an executive summary will be available upon completion of the study, and may be obtained by writing to:
Michael H. Swearingen C/0 Dr. U. Smidchens
Western Michigan University Dept, of Educational Leadership
Kalamazoo, MI 49002
I would like to thank you in advance for your time and effort in helping me with this study.
Sincerely,
Michael H. Swearingen Dr. Uldis SmidchensDoctoral Committee Chairman
Reproduced with permission of the copyright owner. Further reproduction prohibited without permission.
Appendix C
Profile of Organizational Characteristics and Demographic Survey
75
Reproduced with permission of the copyright owner. Further reproduction prohibited without permission.
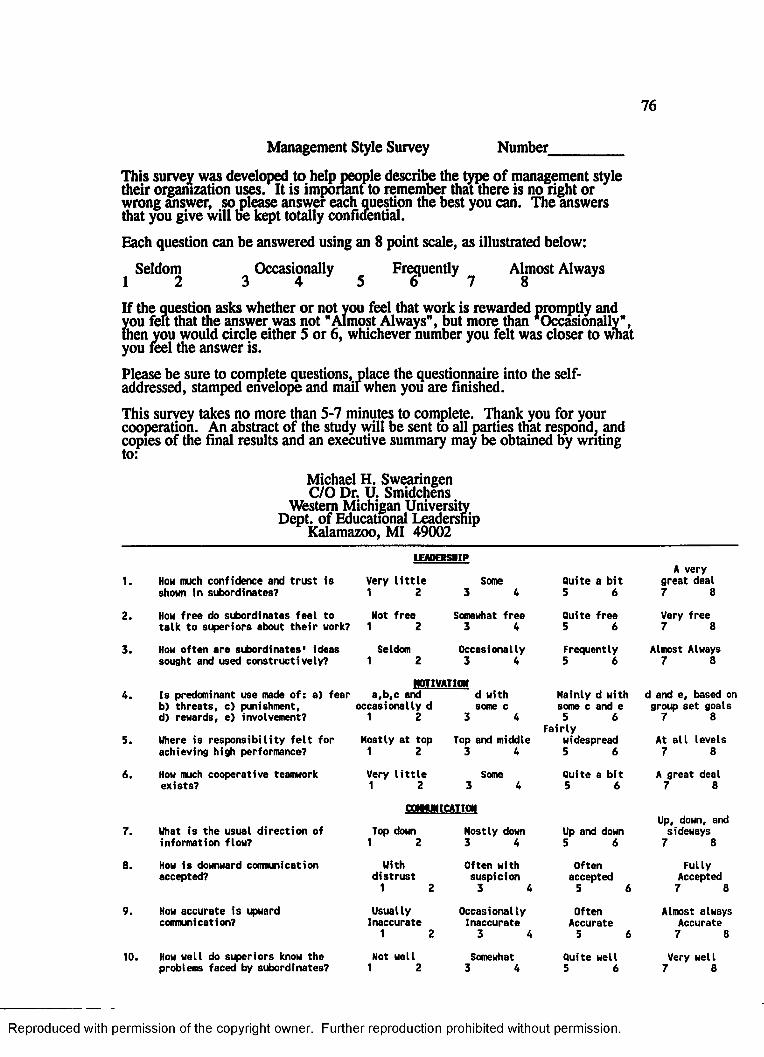
76
Management Style Survey Number
This survey was developed to help people describe the type of management style their organization uses. It is important to remember that there is no right or wrong answer, so please answer each question the best you can. The answers that you give will be kept totally confidential.
Each question can be answered using an 8 point scale, as illustrated below:
Seldom 1 2
^ Occasionally Frequently Almost Always 8
If the question asks whether or not you feel that work is rewarded promptly and you felt that the answer was not "Almost Always”, but more than ‘Occasionally", then you would circle either 5 or 6, whichever number you felt was closer to what you feel the answer is.
Please be sure to complete questions, place the questionnaire into the self- addressed, stamped envelope and mail when you are finished.
This survey takes no more than 5-7 minutes to complete. Thank you for your cooperation. An abstract of the study will be sent to all parties that respond, and copies of the final results and an executive summary may be obtained by writing to:
Michael H. Swearingen C/O Dr. U. Smidchens
Western Michigan University Dept, of Educational Leadership
Kalamazoo, MI 49002LEADCTSHIP
1. How much confidence and tru s t isshown in subordinates?
2. How free do subordinates fee l tota lk to superiors about th e ir uork?
3. How often are subordinates' ideassought and used constructively?
Very l i t t l e 1 2Not free
1 2Seldom
1 2
Some
Somewhat free 3 4
Occasionally 3 4
Quite a b it 5 6
Quite free 5 6
Frequently 5 6
A very great deal 7 8
Very free 7 8
Almost Always 7 8
4. Is predominant use made o f: a) fear b) th rea ts , c) punishment,d) rewards, e) involvement?
5. Where is responsib ility f e l t for achieving high performance?
a ,b ,c and occasionally d
1 2Mostly a t top 1 2
H0TIVAT10Md withsome c
3 4
Top and middle 3 4
Mainly d with some c and e 5 6
Fairlywidespread 5 6
d and e, based on group se t goals
7 8
At a l l levels 7 8
6. How much cooperative teamwork exists?
Very l i t t l e 1 2
Some 3 4
Quite a b it 5 6
A great deal 7 8
7. What is the usual d irec tion of information flow?
COMMUCATICM
Top down Mostly down 1 2 3 4
Up and down 5 6
Up, down, and sideways
7 8
8. How is downward communication accepted?
With d is tru s t
1 2
Often with suspicion
3 4
Often accepted
5 6
Fully Accepted
7 8
9. How accurate is upward communication?
Usually Inaccurate
1 2
Occasionally Inaccurate
3 4
Often Accurate
5 6
Almost always Accurate
7 8
10. How well do superiors know the problems faced by subordinates?
Not well 1 2
Somewhat 3 4
Quite well 5 6
Very well 7 8
Reproduced with permission of the copyright owner. Further reproduction prohibited without permission.
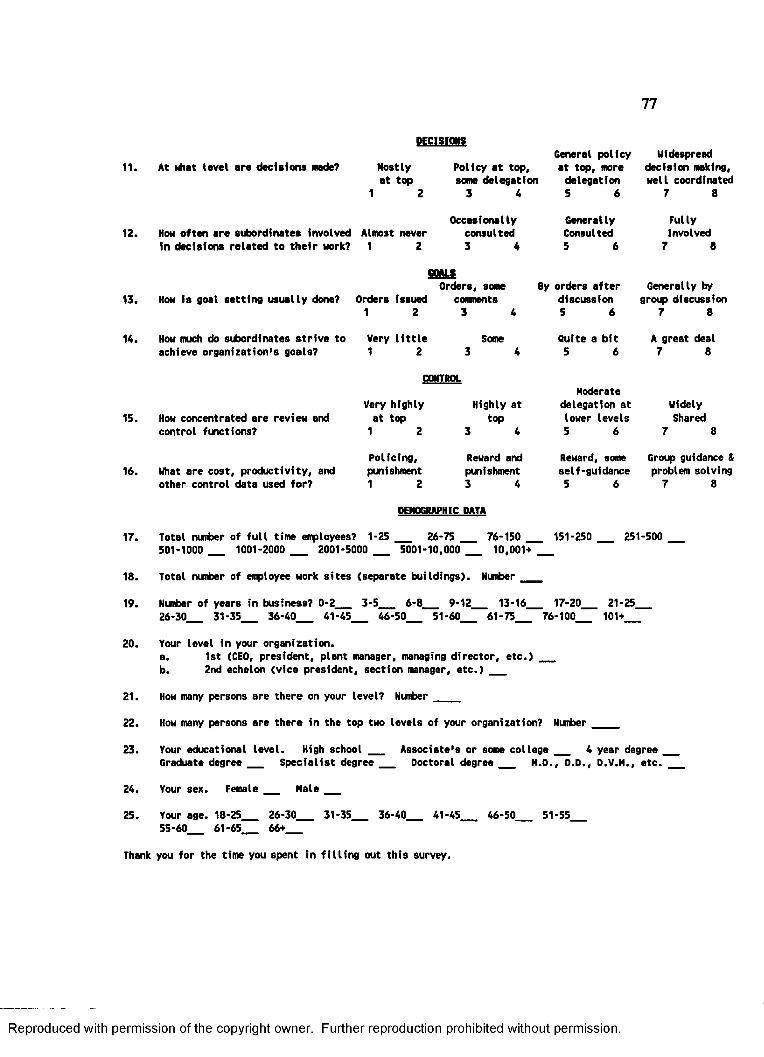
77
11.
DECISIONS
At what level are decisions made? Mostly a t top
1 2
Policy a t top, some delegation
3 4
General policy a t top, more
delegation 5 6
Widespread decision making, well coordinated
7 8
12. How often are subordinates involved Almost never in decisions re la ted to th e ir work? 1 2
Occasionally consulted 3 4
Generally Consulted 5 6
Fully Involved
7 8
13.
GOAISOrders, some By orders a f te r
How is goal se ttin g usually done? Orders issued comments discussion1 2 3 4 5 6
Generally by group discussion
7 8
14. How much do subordinates s t r iv e to Very l i t t l e Some Quite a b i t A great dealachieve organization 's goals? 1 2 3 4 5 6 7 8
15. How concentrated are review and control functions?
CONTROL
Very highly a t top
1 2
Highly a t top
3 4
Moderate delegation a t lower levels 5 6
Widely Shared
7 8
16. What are cost, p roductiv ity , and other control data used for?
Policing, punishment 1 2
Reward and punishment 3 4
Reward, some self-guidance 5 6
Group guidance & problem solving
7 8
DEMOGRAPHIC DATA
17. Total number of fu ll time employees? 1 -2 5 ___ 26-75 76-150 151-250 251-500 ________501-1000 ____ 1001-2000 _ 2001-5000 ___ 5001-10,000 ___ 10,001+___
18. Total number of employee work s i te s (separate buildings). Nunber ___
19. Number of years in business? 0-2____ 3-5__ 6-8__ 9-12___ 13-16____ 17-20__ 21-25___26-30 31-35 36-40 41-45 46-50 51-60 61-75 76-100 101+
20.
21.
22.
23.
24.
25.
Your level in your organization.a. 1st (CEO, presiden t, plant manager, managing d irec to r, e tc .)b. 2nd echelon (vice president, section manager, e tc .) ___
How many persons are there on your level? Number ____
How many persons are there in the top two levels of your organization? Nunber _____
Your educational level. High school _ _ A ssociate 's or some college ___ 4 year degree ___Graduate degree ____ S pecia list degree Doctoral degree M.D., O.D., D.V.M., e tc . ___
Your sex. Female Male
Your age. 18-25___ 26-30___ 31-35___ 36-40___ 41-45_55-60 61-65 66+
46-50 51-55
Thank you for the time you spent in f i l l in g out th is survey.
Reproduced with permission of the copyright owner. Further reproduction prohibited without permission.
Appendix D
Correlational Analyses Results of POC Sub-Factors With POC Sub-Factors
78
Reproduced with permission of the copyright owner. Further reproduction prohibited without permission.
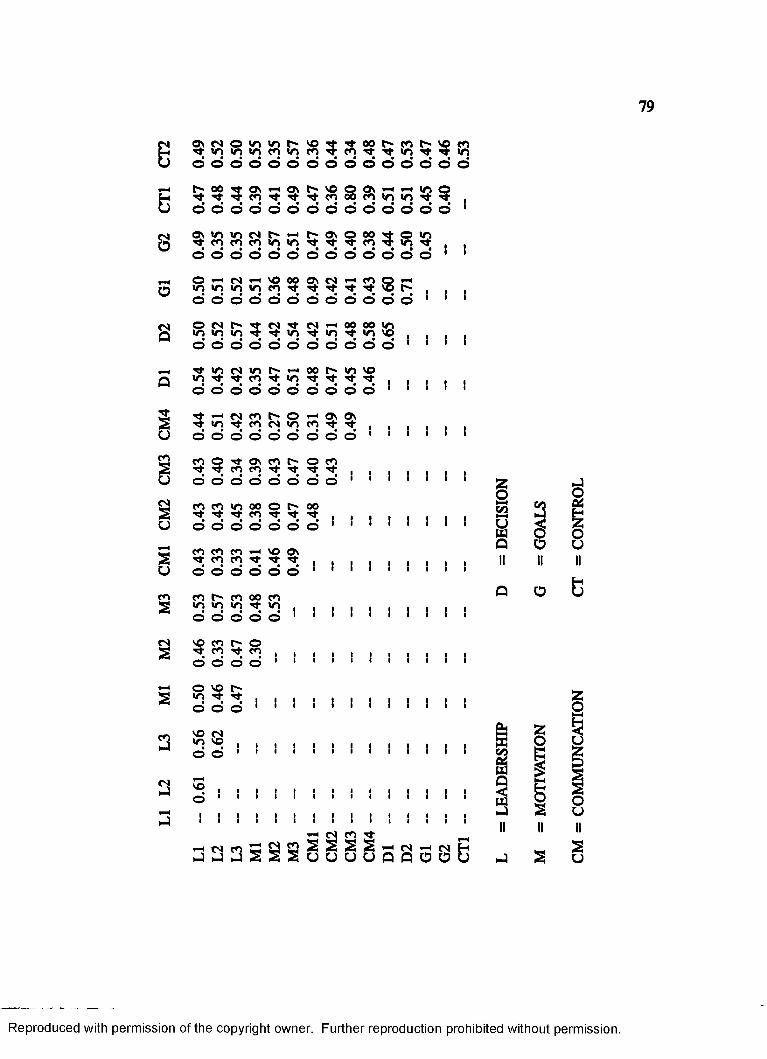
79
CNo
o
Q
iuc oSU
U
suco
5 cnin o•n min s i"in VOCO 5 a 00Tf $ COin 5? 3 COin© o o o o d o o o d o d d o o
00Tf 5 OVCO $ VOCO s ONCO m in T? S ao o o o o o o o o o o o o o i
inCO inCO 8 r-in wo $ § S 00CO oin 3 a ao o o o o o o o d o d o o i I
oin in CNm in voCO 00Tf § 9 8 »Ht" i i Id o d o d d o o o o o o 1 s 1
om cnin in 5 in in 00vt 00in 58 1 i 1 Io o o o o o o o o d o 1 i 1 1
in t? inCO in 00t? vo
| I 1 1 aO d o o d o d o o o 1 1 i I i
•n 9 COCO r*-CN
oin CO 3 i 1 i i 1 io d d o o o o o o i 1 § i 1 i
c otj- oTf t}-CO ONCO CO $ o COTf i i 1 i i 1 id d o o o o d o i i 1 i i ! i
CO 00CO o $oo
i * i 1 i i a id o o d d o o i i i 1 i i S i
c o COCO COCO VO■** ? i i i i 1 i i i id d o © o o i t i i 1 i i i i
COin in COin 00Tf COin i i i i i 1 i i i io d o o o i i i i i 1 i i i i
VOTf COCO $ oCO i i i 1 • i 1 i i i id d d d ■ i i i i i 1 i i i i
oin vo $ i i i i i i i 1 i i i io o o i i i i i i i 1 i i i i
voin CNVO i i i i i i i I I I i i Id o i i i i i i i S 1 I i i i
532 o00 2 pD zw o oQ o uII II II
HQ o u
vo• i i i i i i i i i i i i i i^ i i i i i i i i i i i i i i! ! ! ! ! ! ! ! ! ! ! i ! I !
j j j S S S u u u u q q o o u
Reproduced with permission of the copyright owner. Further reproduction prohibited without permission.
Appendix E
List of POC and Demographic Survey Components
80
Reproduced with permission of the copyright owner. Further reproduction prohibited without permission.
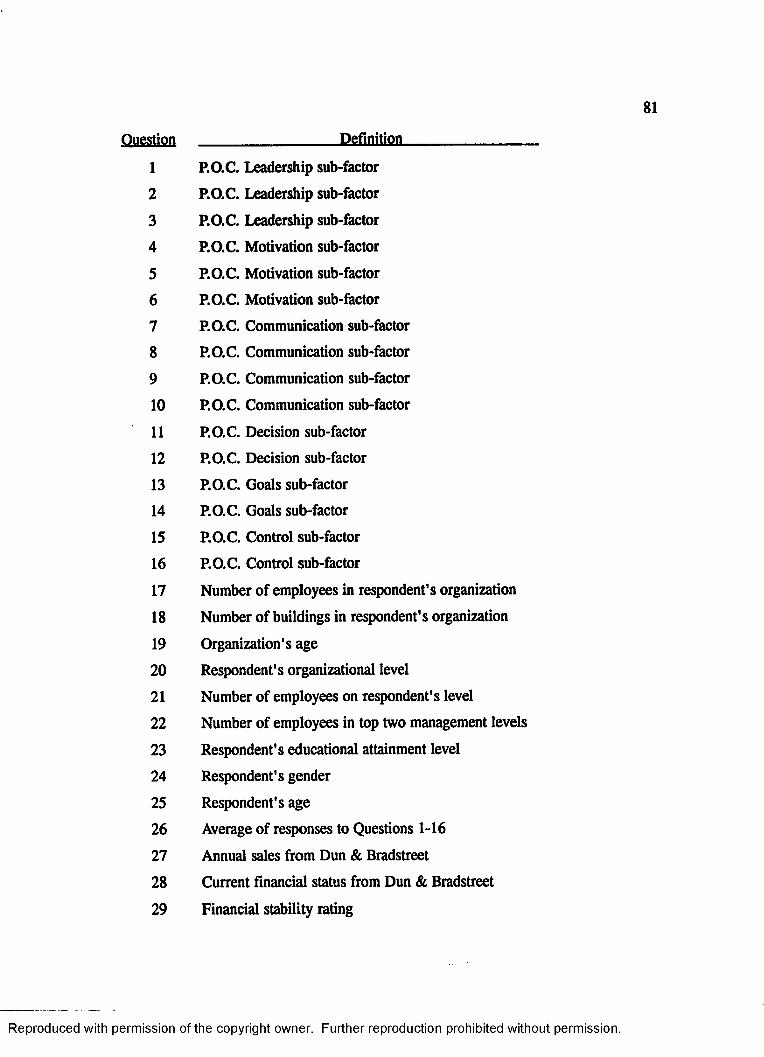
Question Definition
1 P.O.C. Leadership sub-factor
2 P.O.C. Leadership sub-factor
3 P.O.C. Leadership sub-factor
4 P.O.C. Motivation sub-factor
5 P.O.C. Motivation sub-factor
6 P.O.C. Motivation sub-factor
7 P.O.C. Communication sub-factor
8 P.O.C. Communication sub-factor
9 P.O.C. Communication sub-factor
10 P.O.C. Communication sub-factor
11 P.O.C. Decision sub-factor
12 P.O.C. Decision sub-factor
13 P.O.C. Goals sub-factor
14 P.O.C. Goals sub-factor
15 P.O.C. Control sub-factor
16 P.O.C. Control sub-factor
17 Number of employees in respondent's organization
18 Number of buildings in respondent's organization
19 Organization's age
20 Respondent's organizational level
21 Number of employees on respondent's level
22 Number of employees in top two management levels
23 Respondent's educational attainment level
24 Respondent's gender
25 Respondent's age
26 Average of responses to Questions 1-16
27 Annual sales from Dun & Bradstreet
28 Current financial status from Dun & Bradstreet
29 Financial stability rating
Reproduced with permission of the copyright owner. Further reproduction prohibited without permission.
Appendix F
Summary Table of Correlational Analyses
82
Reproduced with permission of the copyright owner. Further reproduction prohibited without permission.
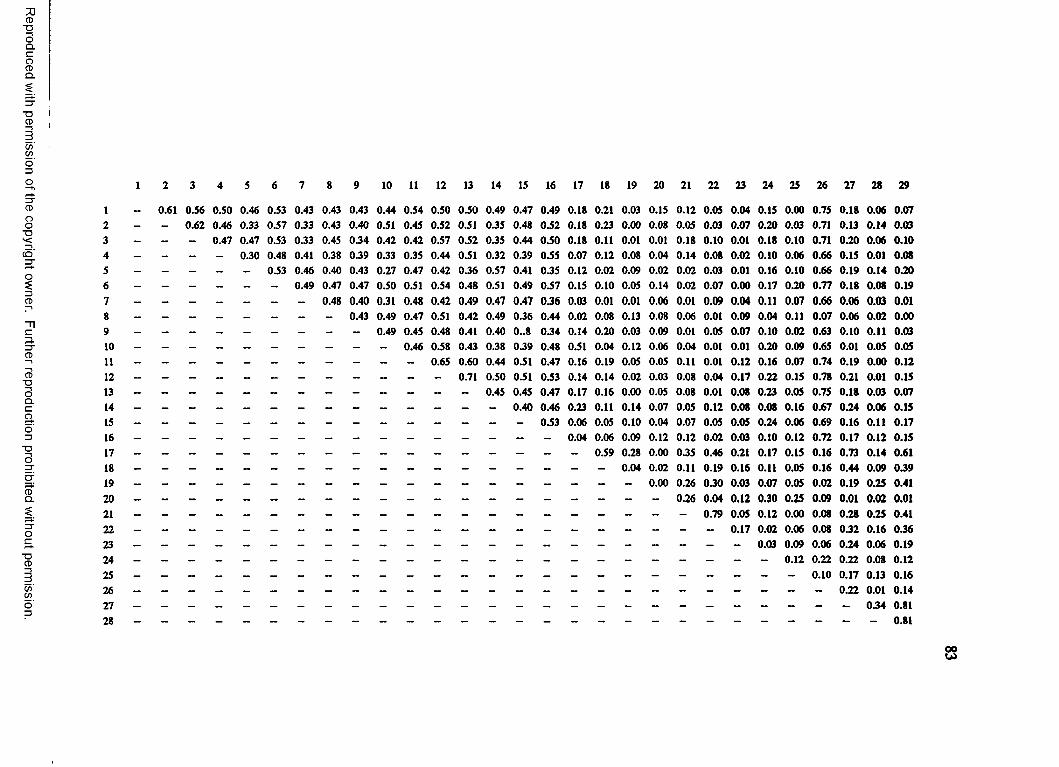
Reproduced
with perm
ission of the
copyright ow
ner. Further
reproduction prohibited
without
permission.
t
1 2 3 4 5 6 7 8 9 10 11 12 13 14 15 16 17 18 19 20 21 22 23 24 25 26 27 28 29
1 _ 0.61 0.56 0.50 0.46 0.53 0.43 0.43 0.43 0.44 0.54 0.50 0.50 0.49 0.47 0.49 0.18 0.21 0.03 0.15 0.12 0.05 0.04 0.15 0.00 0.75 0.18 0.06 0.072 - - 0.62 0.46 0.33 0.57 0.33 0.43 0.40 0.51 0.45 0.52 0.51 0.35 0.48 0.52 0.18 0.23 0.00 0.08 0.05 0.03 0.07 0.20 0.03 0.71 0.13 0.14 0.033 - - - 0.47 0.47 0.53 0.33 0.45 0.34 0.42 0.42 0.57 0.52 0.35 0.44 0.50 0.18 0.11 0.01 0.01 0.18 0.10 0.01 0.18 0.10 0.71 0.20 0.06 0.104 - - - - 0.30 0.48 0.41 0.38 0.39 0.33 0.35 0.44 0.51 0.32 0.39 0.55 0.07 0.12 0.08 0.04 0.14 0.08 0.02 0.10 0.06 0.66 0.15 0.01 0.085 - - - - - 0.53 0.46 0.40 0.43 0.27 0.47 0.42 0.36 0.57 0.41 0.35 0.12 0.02 0.09 0.02 0.02 0.03 0.01 0.16 0.10 0.66 0.19 0.14 0.206 - - - - - - 0.49 0.47 0.47 0.50 0.51 0.54 0.48 0.51 0.49 0.57 0.15 0.10 0.05 0.14 0.02 0.07 0.00 0.17 0.20 0.77 0.18 0.08 0.197 - - — — - - - 0.48 0.40 0.31 0.48 0.42 0.49 0.47 0.47 0.36 0.03 0.01 0.01 0.06 0.01 0.09 0.04 0.11 0.07 0.66 0.06 0.03 0.018 - - - — - - - - 0.43 0.49 0.47 0.51 0.42 0.49 0.36 0.44 0.02 0.08 0.13 0.08 0.06 0.01 0.09 0.04 0.11 0.07 0.06 0.02 0.009 - - - — - - - - - 0.49 0.45 0.48 0.41 0.40 0..8 034 0.14 0.20 0.03 0.09 0.01 0.05 0.07 0.10 0.02 0.63 0.10 0.11 0.0310 0.58 0.43 0.38 0.39 0.48 031 0.04 0.12 0.06 0.04 0.01 0.01 0.20 0.09 0.65 0.01 0.05 0.05U - - - — - - - - - - - 0.65 0.60 0.44 0.51 0.47 0.16 0.19 0.05 0.05 0.11 0.01 0.12 0.16 0.07 0.74 0.19 0.00 0.1212 - - - - - - - - - - - - 0.71 0.50 0.51 033 0.14 0.14 0.02 0.03 0.08 0.04 0.17 0.22 0.15 0.78 0.21 0.01 0.1513 - - - — - - - - - - - - - 0.45 0.45 0.47 0.17 0.16 0.00 0.05 0.08 0.01 0.08 0.23 0.05 0.75 0.18 0.03 0.0714 - - - - - - - - - - - - - - 0.40 0.46 0.23 0.11 0.14 0.07 0.05 0.12 0.08 0.08 0.16 0.67 0.24 0.06 0.1515 - - - - - - - - - - - - - - - 033 0.06 0.05 0.10 0.04 0.07 0.05 0.05 0.24 0.06 0.69 0.16 0.11 0.1716 - - - — - - - - - - - - - - - - 0.04 0.06 0.09 0.12 0.12 0.02 0.03 0.10 0.12 0.72 0.17 0.12 0.1517 - - - - - - - - - - - - - - - - - 0.59 0.28 0.00 0.35 0.46 0.21 0.17 0.15 0.16 0.73 0.14 0.6118 - - - - - - - - - - - - - - - - - - 0.04 0.02 0.11 0.19 0.16 0.11 0.05 0.16 0.44 0.09 03919 - - - - - - - - - - - - - - - - - - - 0.00 0.26 0.30 0.03 0.07 0.05 0.02 0.19 0.25 0.4120 — - - — - - - - - - - - - - - - - - - - 0.26 0.04 0.12 030 0.25 0.09 0.01 0.02 0.0121 - - - - - - - - - - - - - - - - - - - - - 0.79 0.05 0.12 0.00 0.08 0.28 0.25 0.4122 032 0.16 03623 0.03 0.09 0.06 0.24 0.06 0.1924 0.12 0.22 0.22 0.08 0.1225 0.10 0.17 0.13 0.1626 0.22 0.01 0.1427 034 0.8128 0.81
Appendix G
Original SPSS-X Data Print Out
84
Reproduced with permission of the copyright owner. Further reproduction prohibited without permission.
85
a
in 4 4 4 42 4 4 4 4
4 a 4 4 4 4 I**•, 4 « 4 4 r% /I to. 4 « « « t, | *- a. 4 « 4 4 Ct I *1 3 4 4 4 4 U> n 4 • 4 4- in « «tf — 3 4 4 Z
s i t Z J 3 4 4 r it£ •• •- a ... « 4 4 4 Cl**. » . 1*.I* 2 n ^ 4 m « 4 4 U 1 ■£
e >wi i. « « 4 4 4 i ttf »* j <~ L. « 4 4 4 r. n c c cX * I- ' 2 1 4 4 4 4 » L.V. H 3 (.12 c « o < 4 t- •» to. H a3 u. z z 4 r : j c < «xr. u Irt ^ C J 4 C C X - l I jto. L. 4 u o s U
J ►« «t* 3 in 4 nj c <tS m > 1 u. 4 ? - Z t > ni i a - 4 *- 2 m c►- >« FOiftX 2•* o c 4 C U 4 U. 2t-U U 3 2 4 z i n c* U• c - C 4 r . 4
4 W 2 4 — vi 4 n to. into. z 4 3 J y. h- u.<?■ e* 4 4 « 4 4 c 4 to. ^ ̂ tf p»
>• i - r . ' j * - a pir J 4 C J i t S O 2 •> • 4 4 z U to. L. a
c to. c 4 ^ 3 ra 4 m e rto. If 4 c j r. fto e < a.L W * 4 i-. < u z t; ». •- ttolto «' V wC . ; to 1'lto 1̂ w WV 1. W <-*. w •.* «•«* O O C3 y Li 2 4 t C n 1 iZ • • • • • • • • • • • • • • • • • • • • • • • • • • • • • az 3 - z 4 j C 4 t, C i r. r. f. r. *.r. r. p. p| rj p. rj p| p< r ; p, fy r* p. •» p; r. — — r-i t. •m m KV. «• Z * | l * t z u. X l . l. . L X t o t o ' . L . 4 L X X X X u .X U X lX X L l.L X X y L .2 > o 4 r.* i, tto VCc 3 O 3 2 4 C J 4 (.1 1 C J
c C 4 tf - Cto. z Li C Ltor u c a 4 . . : c 3 j c U tfs, > ►- z d < <x 4 _J _Jto tf e /• II*-*►* < c J wl a tu 4 —«£.(.* a li III- 3 Ct tf y i i c 3 4 »« «. u 3 2 2 L& fct in c 3 3 U ~ u. n « CtoCH o O LlklU
C'U u P. u. tf Z 4 n a c r. - c u kl _l JU.L. m z 4 a u* V) 2 Q. 2 u 4 Ui 2 to» 3 o J J L _)3 3 .'m O C z X 4 t‘ J 2 «n•« N* e u d C t o 'C to» w « C 4 0 4 C f *- tf
• 2 if _l i. _i— a o to- £ 4 (t *. r i 4•# 2 to. a 4 O I U tf 4 c r r n i a toNP*a
u. 2 C X w* to- 4 4 « 4 u l"C 1 4 IN p. 1. ii'.U C Lk I L i 4 0 0 •! « « • i ' ^ i u h -e -• li 2 3y'. 1.1 a K z a L. 4 4 4 4 if *. r* ex Vito.♦I tf V. tf C tfO d r 4 4 4 4 J ifl c. -. 4 C T to f. 4 £ r . Pi * C T f, 4 N ♦. 4 N C *S O N O N i <• . —to.. 1- c 2 V Cto. 3 4 4 4 4 « if — — — — — n»r*p.Plf.r. r p i *<4 If. O. tf p. a Jj m C v-c U 4 4 - 4 z r i u i a tf a i/ i_ 3 —-.1 <►- 3 4 4 4 4 a c i - f t o u 1* tf 3 XO,..■r i*. IL 3 v*aviC O 4 4 4 4 I-W C C 3 3 n P« O a. e •*i * ; c i L « 4 4 4 l.tL.U7 2 i: -j a « L. in rs u1.1 l'. I C t C u V h 4 4 4 4 to*U U h or 2
w t: k. S l l .b 'lC *1 4 4 4 4 -J tfC. o o z n a . c. 4 4 4 4 3 u 2 e X 0 0 3i-U H H J 1 Z u ’/I r 4 4 4 4 t f - I.. I* G C<rs a it it c 4 4 4 4 h S Ci a CO 4 UUto
4 3 6 I- if *• 3 c 4 4 4 4 tf 2 to. 7 M . I. o< 3 U 2 u 4 4 4 4 C tf e-b a & L* X H *- C O*> o v,u. V- Zv- x L 21 O 3 U in m - X u. O -i O 1- r»«i to*K •• 3 VI z •- co. a a u s c «• n n pi j u j o ti tf CiU S r K 0 « M » . 4 V- tf r to r < n 5 > 3 t o w r y n ti n. i p. O j n 3 u. vt >- 4 HiC u <A a K j< ta 4 C. 2 M Q 9 C - r 4 f*S in x c e C t o H N C t t t t o . n l j j t o - p - z a « g rx k q ju tf a 4 0 u -*fMn41 •• > j M u . r o u. a d t f t f t f i - H K r c c c u u t f t f r X i b f l u o a a j M u O j i . <i to. toto l; ■« to. tm *.►* 4 o z a a . z 4 i ; I i 'L o .C O C C C C Q l . O C C C C O ttO D C O li O 3 tf IfP- to. a «N to. «toto*p | _ U. V- 4 4 4 4 4 1.1 3 a j J J t t t U O U u Q C O U U U Z Z C i l Z F y . l / i a ^ l i ' .X i i a
C c c c c c o c c o o c c L.
Reproduced with permission of the copyright owner. Further reproduction prohibited without permission.
Reproduced with permission of the copyright owner. Further reproduction prohibited without permission.
87
t ta) « • • • • • • • • • • • • • • • • • • • • • • • • • • • « • • • • • • • • • « • • • • • • • « • • • • • • • « • • • • • • • • • •: u — <% -< ♦ c «»>» x ? o — f« ~ . { N t c 1 ; - - * j •n ♦ a-. ^ua f,Nf. <*.(%<*< •'jNrrrrr*'!'. r. «M.n •*. i r / c ^ c c i ^ c c
c.
• Coe »• c jcc : : • o c c t j o c f u c c : c o r ;ju4 u 3 •!
« • <u r « < K r , i p « ^ t f r cawn s ~-****.fvjr*nnr***f*x«*r>0‘coc — —f a -J N ^ r i N n ' . f j M f f i r i ' i n r r r n n n r n r n r n n n n f 4 < ^ ^u. t . a
Reproduced with permission of the copyright owner. Further reproduction prohibited without permission.
88
• • • • • • • • • • • • • • • • • • • • • • • • • • • • • • a ?r. u. : u u a
o •“ir.•£ « s c
i• .• f^cc '. r ic i• • • • • • • l •~ * L*. £ n £ to f . r « r i | • -
t - I
2 o^Nt'Cwr i oIk • • • • • • • ! IU -Mfor r«*i n i ji -
— >#'£NWNf*ec —r i w r < r j r » ; i n « # 4 ^ ^ ^ p « f . h . f k ^ r ' n n . * ^ i r ^ ^ « N ® » w n ^**♦♦>#«•*♦*«•*•#•**»♦•# c* tfltrj* i.1* k* iflirnr. t/»tr<oift.c
us Ou I •• N *
0 © o
Reproduced with permission of the copyright owner. Further reproduction prohibited without permission.
VALI
D
CAST
S AS
HIS
SIN
G
Reproduced with permission of the copyright owner. Further reproduction prohibited without permission.
90
z ^»nr.o?oSOO 5C - N T O
►* Its z — u* ■#< xnc - I om u • • « • • • • « ! •j o N-f*itSNr mC tt M M P* M N |C5 *. I -
C. |
s n /4 '« S h 9 M|0 u « • • • • • • • ! •o <**«•?< c r» n n i o u - * - — «• r . i i.<. I -
• isr* in«Mc
c <n x ff* r>o r
iCm< -4 M i I t • ■ • • • • • | •-.f** ■# X .# N — I O MNf"- | ©
I —
2 C 4 ) T ? 0 « C
I
C-<C«fNt I ©• • • • • • • I •- r * ^ s ^ s - . | o
-.cj r. ~ i c i - i
s .S O O 3
- e» n o <o c' •/» t o MN-riu i —
p i2 g4-4C,<4IOa. • • • • • • • ( •O — ? •%*; c i f / » | O*1 * f i » Ci | i j- I —
■•« r ■# ir* -c r*
Reproduced with permission of the copyright owner. Further reproduction prohibited without permission.
VALI
D
CASE
? 96
MIS
SIN
G
CA
StS
91
a.a oru l u .
a 4 jwil iA<A<*ufi.1ft*.
* C-'ISW^O C i,i • •«• • • •3 o - r 4£ C 4 £ n u a xir c o
j o «* a3 L.
. ; » j f * IT •# * <T I o • • • • • • • I •« M ^ f* i f ■# •« I f « r n - i
• • • • • • • i •M m « r* *• >♦ — I C
- r r « i j i —
«ap*
■ Nlf./fCO • • • • • • •
rt «* — — 5* ? o
S Z - - P c - « s
- J O<c *x» U J
• • • • « • •^r < c t r -
n p * * >r t n od - j
Z 9 « + * S C O[ L • • • • • • •30 -♦OJCITO u s. - r 4»c.
-JO< a. 3 -
o — r. o * -•<. • • • • • • •— rt‘£
f«P*C4
c «n o ■* — p- • • • ! * • «
— r. 6 * * N *r<rirj
«*r<n
C
Reproduced with permission of the copyright owner. Further reproduction prohibited without permission.
VALI
D
C AS
F S
9* nl
SU
NG
CA
SFS
Reproduced with permission of the copyright owner. Further reproduction prohibited without permission.
Reproduced with permission of the copyright owner. Further reproduction prohibited without permission.
94
Cae.
z «^N irxnt«ro •*, • • • • • • • • « •:oto. ~ t i r n s, t x& c,
• • • • • • • • • • • • • • • • • • a * ** i* ir- ccc^r**r*r»rx«(?e^ac j
j uc a9 i*.
I— n r» r r ̂»r * r f>i i <;n t N S t £ r , 9 « i o
- -**. - | c*I <-I
w C* <3 +i r * t t f g ~ « • n ■_, « • a . j » »* * • . — ~ ) y | u
— r«N-—i of.- i o
L • • « • • • • • • « ! •u» i c
IJ C - ^ C h C I o• • • • • • • • • • • • • • • • • • • • • • I •— + xi<r if + r n c Mf< i c<*•- i »*i —
Li — «r< -*i * co u. U f! «# rfS -c ►».
Reproduced with permission of the copyright owner. Further reproduction prohibited without permission.
95
2 2 £ Cr a. • • • • • • • • • • • • • • • t r 4 • •3 U — ̂ r « srj'C-HC*Nn-c 3 u e -r*c z — — r,wr rtw-if « f* » c 1 u & r wL. L.M 1 a-S. 13 ►- t- iI 3 2 w mm rv n f. ft <*i nrc tv r * 2 1 32 £* i 2►< U • « • • • • • • • • • « • • • • • i •JU 1 M U O 1r:<&. M MM c c a r >2 i cM 1 3 - 1M& 1 & 1
1 fr- I2 ^ m f j I- <M N «■! 'C <*i "* •# * r t* 2 <6 « 1cu. « • • • • • • • • • • • • « • 1 • • 1= u mN«*C rx l> U e*f i ca M M M •’ 1 r * i Jn a M iG. 1 a. itz > “ > io <c 1 Bi X 15 z M MM 2 r ir. i JC u 1 i's* 3 5 ie* 1 ara L. o i wb 1 3 w.
c u. I*. u.c> C 1 4o U■>N«ir<K£0>'.«Nn4ir4 «J 1 li. -JZ V*. 3 M M M M M M M <x o 3 a UC ar t- -I 2U. w. c M « c M3 3 3 W1M M Vs Ifl• 2«* 3 r I C
c O L C O O
Reproduced with permission of the copyright owner. Further reproduction prohibited without permission.
27-o
ct-«
*
sps:
P
fLfa
sr
4.1
fo
p m
i*
oF
/nu
s1
4:o
h:
oi
tf
pi-
is
st
pt
f
un
iuf
ss
ity
lu
n o.ih
i n
us/
xn
96
z sp.so^c e»;ui/<«Nsre>o3s ; +4 • • « • • • • • • • • • • • • • • •
u x -r.<if <f>NMD:e??e(>po
c z Tip^r«ri-cH| b • « • • • • •J U ? - — X t f X . - - «& -
z tir inn^r.ocUi • • • # • • • •u — — —
ro 5u»«<*c-ot' • • • • • • • • • •
L O C - C L -
- . - r w x —
z h'iitif. s — * r- <«Nrnu*in'6x*c?»c)t « . • • • • • • • • • • • • • • • • • • • • • • • « • •30 r — * f* * w y s t f t ' - rus — p;< .'ji/6 :K SM )C jr8ff»e????c
C O.3w
r . r r p i n - f j f , . '• • • • • • • • • <\r e sf- r*N n ♦ * p»
i. l I (. • • | •»-• 1 r l o 1 -•l
fjnnM, n- iv fi ,"* icccc --« --cC ( :c \ • • • « • • • « • • » • • • • • • • • • • • • « !
I c• I •• I o
I• 1 -c1 &•
u c c c
Reproduced with permission of the copyright owner. Further reproduction prohibited without permission.
VALI
D
CA
f.f.
«*>
nlSSIV
G
CA
STS
Reproduced with permission of the copyright owner. Further reproduction prohibited without permission.
•oct
-*>*
irr.r.
b
fub
sf
*.i
fjp
tan
or/
rus
ca::
i r'T
Bis
st
bt
- u
niu
fbsi
ty
mi*
vsii
nus/
xF
98
2 o-«(vrp<ic, nifl<sat'oC ti • • • « ■ • • • • • • • ■ • • • • ■ • • • • • • • • • • • • • • • •3U — ic ?o 3 Uu a
r — r, r . -22 \ ( ) « o - c « c - " * c - » —■'•N«^cnr x « • • • • • • • • • • • • • • • • « • ■ • • •ju c r sr^ni/f^r \r i-<u.3 - j c.
2 i . c * * > ; « o - v - - - c - - - - f « N « N r r ^ . - r , - « - r j N - - «x « • • • • • • ■ • • • • • • • • • • • • • • • • • • • « • • • • <«-• • • • • a j m r « • • n N 4 « n > ^ « S i r h r r . n i f < i “ N r «
Z C V I c
^ _ r i fi _ eg m r* r « r. *• r rw •*. r« jr. — * c r. f* r « r -« . * r <n r -
x < w < o h ' n e r ^ i f N r fjr?* tr < i * c e x 9 23 • • • • • • • ♦ • • • • • • • • • • • • • • • • • • • « • • ■ « • • < o2 rwfMr*r. n*# **#«•<##;.* w.tr ir tr u k o * c *><0 x 2« a m
C o c '
Reproduced with permission of the copyright owner. Further reproduction prohibited without permission.
VALI
D
CAST
S 96
HIS
SIN
G
CA
SFS
i
99
z : n c»T U. • • •3 W «. <*4 Cu ix r< <
Cl:: u uau'hN'Tnriro
C Zlx ? r i ̂«-• -4: • • • 1 •
J U O - M Cr , f 1 tf- 1 ca.- 1 -c. 1
a zM U.J U< < r5 U
.T <*i *“• r * * . I u• • • • • • • • I •
I O- ~ - r . 1
1 -•
L* • « • I •U .'-M C a pi f« 4* 1 ua 1
i"! r. frxcNi/t t u•4«rcr»-u*r- ic . — M Pi I oI —
I»_ — <r 10 t i n w* | 9
a v> C n u u
- JU*ua oi
oi a. tr a & iJ 01 u.
u « KC O <tI •• Nf* * tn
N M L.
C C O U I.
Reproduced with permission of the copyright owner. Further reproduction prohibited without permission.
Reproduced with permission of the copyright owner. Further reproduction prohibited without permission.
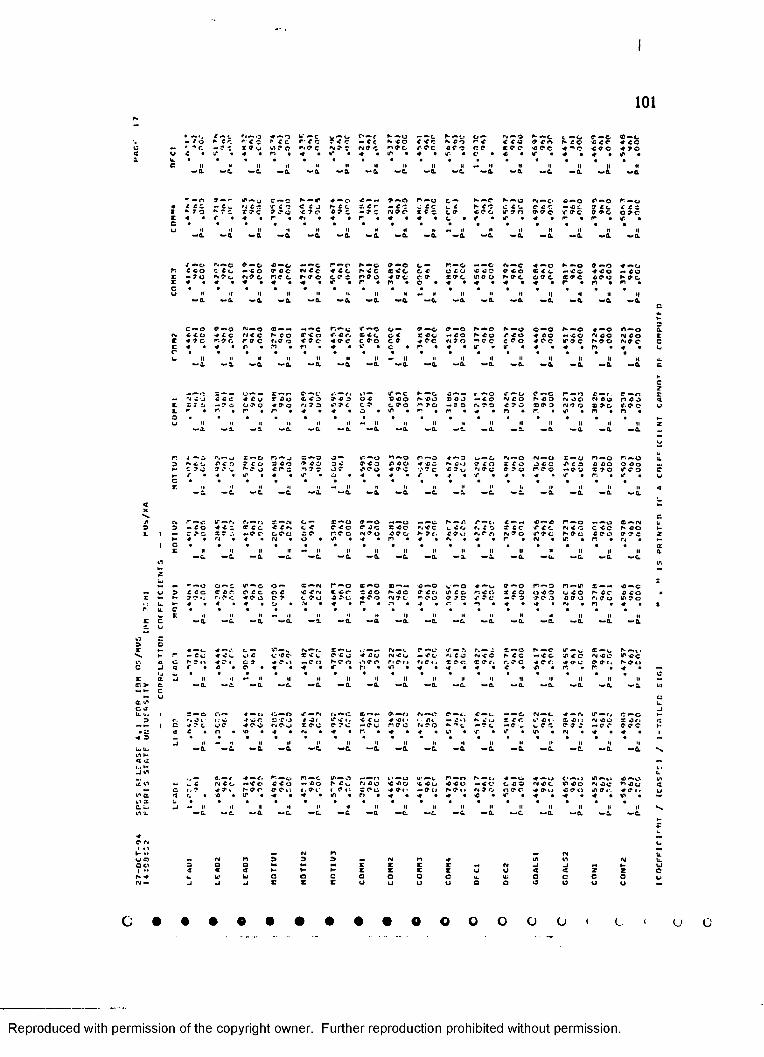
101
f —» f-c Pi —O 4 — o y —c V -* I- r» —<►. n —u «--»c u — Pi —O ► — c. C —> O X —c- f o ► c o *“•< c f *c r /C ? < C - N’tO C <C n co r>c c c c O C<% n c c «<c 4 C O* *c. — * c t ? u V*. 9 c n o C N O f NffC n 0 C < > e c c o o C P i c e c o o ♦ ** c c o o 4 9 0
o c • »* • 4 • n • 4 • M* • 4 i f • « ■ «*• • C • c • I f • 4 • ♦ • if •a • • • « •c tl ii ii ii ii II II ii ii ii — H ii It <1 II II—a —c. —a —a — O, — a. —a —a. —a — a — a w C . ~ a — a — &
•* — Cl o — - C - y c — © n — c 4 — © © — o r — o c — N — C N — O n — © c — o i f — o n - o4 C C O - c W f i t - If C *3 C C N C C. S C ^ - c -t C C C I. c h- C O c c a f i r . — c c 9 C O i f cX k J O K • - * O C 9 9 0 ‘t J o C 7 Z - ? « N O © I C S o O < 9 0 w o o o* o © 9 9 0 o occ 4 • «r ’i 4 • r • IS • 4 • r • ♦ • 4 • c • IT • w • « • n • r • w •c • • • • • • • • • • • • • • • •u II •i II ii II •1 ii II It — ll II •i it II II ii
— a — a w & — a — a ~ a . • • a . — a. — 0. * - a * - a — & — a — a — a * - a
/ — c» <s—c 9 — 0 c—o — —c r — p c a — o c — r — o - — o N — c 4 —C N — O 0 — o 4 —9n fi Co c t v - t o o«c 44 C C 4 f t f*fc S i t c c Ut'J C C O 0 C O S i t — C O 4 CO - COs - ? o NfV o rt c c hPO CPC r» o o 4 9 C c o tP t I f 0 o N O c O O c C P C COO N O Cz 4 • « • 4 • c • ■4 • IT • r * n • o • 4 • 4 • 4 • 4 • r • n • n •c • • • • • • • • •u II II •1 ii ll li n ii M II II ll II II ii ii il
— a ••a —a —a **a —a —a —a —a —a ~a —a —a —a *-a •-acu.
c —o e —o M —o a—— — — c r.—o \t — o o — o —o 0—0 N —O N —O 0—0 N— o 4—0 If — oN9a
r» iiO 4fC n< C 0- CO <t < a <f- Cr. S i t O 9 c Co — CO NCO f CO 4 CO — CO NCO NCO cc 4 9 C f. r ff c ti o c <PC 4PC c ffo c o* 4 PC PiO o ICC C 9 O 4 O C if oc NO© no o cc « 4 • ip • n • f) • 4 • Ii* • c • r* • 4 • If • If • 4 • 4 • r> • 4 • ur • • • •a n II ii ii tl II II - II ii ll ll II II II ii II u.
—a —a —a —a —a —a —a —a to-a —a —a •-a «-a -a —a c►
X — X — r* 9 —C /."ft If —c K —C. c——f —o f — o c —e r —n C —r. o — «c2
» ** ̂j 2 « c « tu T CO a c o * C 9 o c SCO N CO see -CO NCO N C 9 is oc* NOO nco «t S3 ^ «• ? -a 0 9 0 400 rt 9 9 fOC C 9 tPO POO -9 0 N 9 9 COO 00 9 NP O SPG tf-OO uL r • r. • r • r • 4 • 4 • O • If • P • m • 4 • m • r. • C • n • n •G • ■ • • • • • • • « • • • • • •Vi II ■i ii ii II II <*« || II II ii II ii it II ■I n zto*3 Ml — a «*a —a — a ->a —a —a wa «-a to-a —a to-a to-a
VJ
r 4 - i r«—o x —o r»—j C—9 o — if —o fl — o r — o — e v- —a N —O <s—o r — u n— o « —o a9 N<i« PCD 9 CO s to 9 CO 9 9 PiO If CO 4 cc NCO o c o X C o O C O f C 3 C CO O COc ? o J f *. Nf o <oc n ? - OP ^c-o 4 9 C '.'PC i?w Pi o c PPO n o o — 09 xoo PPO cf • 4 • If • 4 • if • o • 4 • 4 • if • 4 • 4* • 4 • 4 • if • r. • If • uC • • • • • • •K II •1 •1 II — II II II 1. II ii 4
— a — a " - a — a —a —a M-a <•& a —a —a —a •-a —a <»a <-ac -"s. Cf n» tf — r. P. —n X — N c — x—o <0— 0 — — O N —if t . c —— c—c n —o — —o X — N b9 9 - Co 4 C Z « -CC c cis a < PiO roc X Co p.cc c c P. C 9 X cc / i t P* c c c Cc N CO HL I X ? J. -PC oou 9 O' nco nPo coo N »C- f»u P4 o p. is o o if PC NPo coo O OC 2H 4 • ti • 4 • rj • O • tf> • 4 • n • 4 • p. • 4 • r • P4 • IT • n • Pi •
I C • • az II II II it — II n II n II II II n II II ii II a— a — a — a — a — a — a ~ a — a t o - a - » a —a *-a t o - a *-a —aVi <f
Z— - —o Cl — c IT — o o— « — PS r —o «—o ®—— o—o w — o 4 —a 0—0 r — 9 n —if. x —- c—c *
M o 9 f t c cor o tc o c C ■£ IM C CP SCO P* cc o cc> if C G nco X CO a co u CO N CC c co -X y*i; r.O i; 4^0 c > a 0*o c c*o 4 C O NPC POO PPO i?C -O 9 P O .9 coo P. 0 O if* oo
a *• * 4 • 4 • o * -N • 4 • r • n • 4 • r. • n • 4 • 4 • IS • n • 4 Xr. a C • • • • • • • • • • • • • • • •z • 1 ll II »• 11 ll • I it ii II ii n II II II it II
£ cu
—a —a — a -•a «-a —a o»a —a •-a —a *-a —a •-a to-a *-a —a
V1} z9 Cr 4—C- 4. — tf—u r, —f. x—u CS — V r — c if — r. x—o N—c if — to.- e—̂ N —* iv. N r - Co «i'v C c -o c- *<v p fc 4 Co 44 CO - cc Pi c o NiC N CC -c c if c c N CC If cc<s a s r *■> « r < C 9 ip .i -On Sfo .*> 9 P PiPl* Pi c«. X PC SPr, r.PC 4 c r. 4 C* C PPl. NPuc J 4 r • c • O • 4 • 4 • If • n • If • 4 • 4 • 4 • C • <f • r. • r • 4 • —
lu • • • oz a ii ii — ll II •1 II ii II II II U II ii ii it IIa > e —a — a M.Q, -~a —a *»a —a —a. —a to-a —a •-a --a •-.a —a •-a VI— n cM u ua o ac a _ia u. i x — e r.— 4 —Ci 0 — 0 If— PS ^ —4 J pi—p o —t. c —c — — o PJ —c 4 —fS if—<. c —o
9 1*. '.Ol 1 ; O •# tot rr a -co 4 91- If c ». ■C iu 4 -C« • • - £ i — £ O ^ iii IiC v* c * ■ X Ci: NCO r onl C 4 7 c W*C 400 P4 C-to» to c c* ? c -PV r e c P4 0 0 -P t -C w i.PC 0 0 9 — OP 0 O C N
• •! a £ • o • <0 • 4 • Pi • 4 • r. • 4 • 4 • if • if • u* • If • IS « 4 • 4 • 14 9 • • • « •
o ii » n il II II II •I II II II ll ii II II •1 ■ 1Im Ut — a — a — a — a — a — a — a to-a — a — a ~ a — a ~ a t o - a • - a — a N*If Nc c -to
t ,-Ilf It
—r 4«(. m—c. m—o lf<— o «*— t P—o N—t. 4 — O 4 — 0 <•—*1 if—*« C—O Ifu. o mm w c ntc. — •£ ci f i o - CO ^ iv Pi CO C CO i i t C CO — CO C C 9 N it if CO Pi cc nco 4
C <# 9 4 p- 9 r OPu 4 . 9 C I P «: X PC 4 0*1 -Oc> NO*. « Jit OOP. 4 O O coo if o «•. 4 O I * uc/» q» n c. • 0 • if • 4 • 4 • tn • pi • 4 • 4 • 4 • c • IT • 4 • 4 • 4 • If •vi 3 V •a u* -j •• II II ■I II H ii ii it II II II <1 II II II II N.l/l IL —a — a to»a — a —a *«a —a — a —a •-a to-a —a t o - a --a - * a — a
N
4 VO f * 1 *1
Vi—t- . . mm 44 n mm is au © <s n 9 9 9 rs p> 4 If if N a
GO a o o c z c C N -1 ml t- ai •• 4 4 4 t» V- H c z z c u O < 2 2 on 4 a U.' Uj O o C G o o o it. Ui o c C O CiN — ml ml -J c z C o u u o o a o o U u
o L < U O
Reproduced with permission of the copyright owner. Further reproduction prohibited without permission.
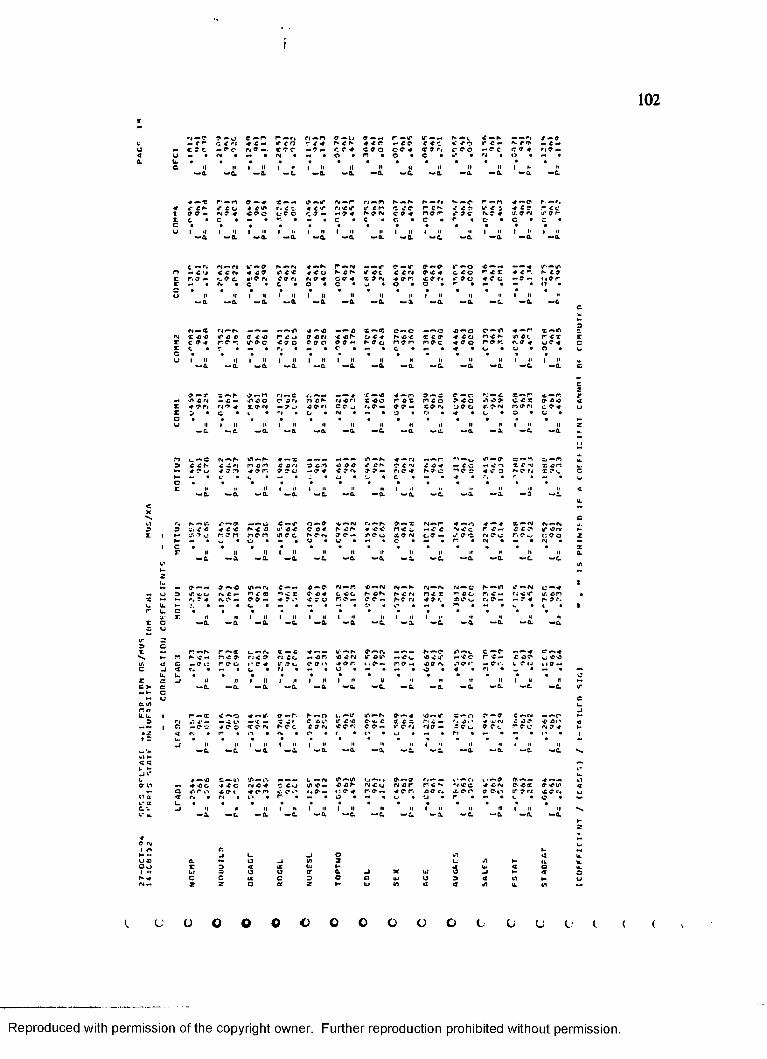
i
102T
<N —9 o — o « — n n —ri ri — n 0 — U 9 —— r — ir If mm K — v 4 — ► M A T —9u - r r 4 c — r 4 4 ► <i* <<r - 99 C < 1 V 9 0 ?< • IN P 9 m tmo — X 9 ft - o c ft 9 ••9 m r.f< COO 0 9 4 T 9 t, c?e -9 C C 9 4 H9«4 u m • IN • — • IN • m • o • n • O • C • *• • fi • O • m •a. u. • • • • • • • •
c II II 1 1< 1 » 1 t< 11 m II ll it ii 1 I* li—a — 0. —a. — ft —a. *•0. *0. -ft — ft —ft — ft — ft — ft
4 —« r* —n 0 — 4 X —- 9 —9 Pi —r ri —n p. — P. f* — Pi **. —o r — rv 4 —9 P- — P.4 tf 4 9 if to Pi 4 t < < if fix »f if Cl" CC? n 4 *» **4 9 V* 4 S 4 4 0 rccI 9 9- Pi 9 4 coc c*o o c o - f- 9 Pi C 9 4 n 9 r* / ? C IN 7 4 If. 9 Pi ir 9 rI. C • e • — • n • — • C • C • C • e • r • e • O • c •C • • • • • • • •
1 it i >1 1 <1 l •• 1 II 1 il M 1 H i ii ii i ii 1 »' i H—a — a. —a. —a. —a. —a —0. — 0- — ft — ft — ft — a —ft
C —IN V — 9 ̂—IN 4 —K r — Pi — — y 9 — ir 9 — 9 y — o 4 —— — — 4 IP. — Ifrt -CM < 4 N 4 4 9 4 4 4 440 N 4 S If 4 C 4 4 Pi 94 4 ft 40 r* 4 x 4 4 r. 9 t 9c r. a - U> 9 t* CO IN IN 9 4 09 4 X 9 Pi 4 9 9. 4 9 Pi 4 9 0 4 O C -9 - n 9 rK — • IN • C • C • O • C • 4 • O ■ O • r • «• • “ • a •C • • « • • • %u ii It 1 il 1 il 1 11 11 II Ii I H •I ll 1 I* h
**0. -•CL —a —a —ft — ft — ft — ft — ft — ft — ft —0C
Pi — X —f* — — 4 4 —4 - —4 *—« e—e ——a 4 — 0 o— 4— n X—UI 3IN X 4 0 «r 4 o 0 4 4 r 4 <j 9 4 Pi 4 <4 0 4 4 9 44 X 4 9 4 40 n 4 9 4 41 rex cr C 9 4 r c *■». lf?C 4 9 0 9 9 0 9 9 - p* 9 a no 9 noc 4 9 0 n 9 r. P. 9 4 U?4 cc C • • IN • r • — « c • 4 • c • C • o • V#c • • • • • •u 1 M ■1 1 tl 1 II 1 H l ii II II ii II ii 1 II 1 "
—a. — a. —a — 3. — ft —ft —ft — ft — ft — ft — 0. — ft —ft e
9 —r X —9 9—n p< —e — — 4 4—4 4 —n 0 —C Pi — 4 « —r x —r.c22iflCN — 4 •* 4 4 0 Oflfi PI £N Pi 4 pi S 40 r o t nco 9 4 0 4 4 9 CCS 9 44 a
■: 4 or. rt 9 4 X 9 <N — 9^ 4 9 PI C 9 «> P«9 — 9 9 - X 9 Pi uo o if 9 Pi n 9 ri C 04 uc il * C • 1 • “1 • O • N • — * O « f.» • 4 • ft • o • C •o « • • • •o II I II It 1 ll II 11 II II il II ll 1 II II z
wC. — e. ~a. —a. — ft — ft — ft — ft — ft — ft — ft —ft —ft
n <n —r* U1 —N 4 —S — If! —IN 4 —Pi ——r 4 — 9 c — n it—n9 C£h CCri rt 4 n 4 0 ti x cm 4 44 4 4 N 9 4 Pi 4 4 4 — 4 C — 4 r» X 4 PI son— 4 9 O 4 9 n 4 9 r. 9 9 0 — 9 4 4 9 p. 9 0 — Pi O 4 99 c nOO 4 0 0 P* 9 Pi :? '. sn (.■ • N • ̂ • o • V • C • 4 «C • • • • •c Ii ii II 1 ll II 1 I it ■ I <
—a — a. wO. — ft —ft —ft — ft — ft — ft — ft — a —ft<X -•N, a
r« k —irt 4 — 9 4—4 0—9 -V — ry P.—fN 9—X ri—n 4—0 4 — 4 pj pn—Pi9 9 • < < 4 4 4 4 r* <4 U* 4 4 C 04 9 49 4 44 H4 c -4 4 Pi 4 C r 4 — 4 49 tf <4P/ ►c 1 — * 9 C r 9 n n 9 m 4 0 C P* 9<N 9 0 — P?v *9 Pi 09 - -*9 0 fi 9 vi r. Oo <: 9 o zn w • o • — • y • w • e • r • Pi • pi ■
1 C • • Xr II ll ii 1 11 ii II 11 ii ll it ii il n ft
—a -•a —a —ft —ft — ft — ft — ft — ft — ft — ft —ftVi If]►-2
ll 9 — ~ 9 —4 tf> —<N 4 —- 4—9 pi—m 4 —Pi Pi —9 M —p. ri—o 9—m 4—Pi *W 9 fVb IN 4 *• rt 4 « 04 * 9 44 C 4 C P* 49 9 4 Pi n 4 x n 4 o r. c — Pi 4 If if,«n
X — — i. ?4 IN 9 m 9 9 — 4 9.' 4 9 0 r. o — 9 0 - 9 0 Pi 49C »v' o Pi 9 - — 9 4 9 Of.c u. ►- C • O • n • v • C • Ir u. C •
U' r It II 1 ll 1 ll 1 ll 1 >i II 1 il 1 l> ■t ll MC a <-0. — 0. — a. — CL —ft — ft — ft — ft — ft — ft —ft — ft —ftX u
CT —3 O£ r — r» r <— c — fN a —4 4 —— v* — r* 9—9 9—9 4—v C —9 — — 4 C—4**. ►- n N c- n 4 9 rt4 9 Pi OC - 4r, 4 4 Pi 0 4 0 — Ov «0f -4C r c - 4 .4 9 ^ -4 <49. <2 c .? c r 9 o • *9 4 IP .9C 9 9 t> 4 9 r. i.O — no — 40 P. .te r -or. V OfJ itO-c -1 « r. • C • Pi • — • u • — • O • 4 • PI • •
U. • • • • ct a -J il it 1 II f >• 1 II 1 ii II •i ll It II 1 II lle> e -C —a — u —ft —ft — ft — ft — ft — ft —ft —ft —ft 9— H o
u cavi L.n n Jftft i r —« 4—0 4—If. o—r. 9 —O C. —If V*. —p. 9—4 4 — 4 X —1-> 9—9 4 —Pi — — r
9 rj 4' — U — 4 — C 4V' If 4 4 9 N. 4 * 4 X r. c — r. 4«» 4 -v ri 4 49 * j,. ei C — 9 'i 4 9 0 « 9 IN r* 9 c e 9 p< 4 9 p; 0 9 - If O Pi Pi 9 — :? v 9 9*. re c Pi 9 4
• Z <2 « • rt • •N • N • r* • r • «» • Vi • n • lt - u> • ■ • • •
J ll 11 1 II 1 H 1 ii il il ■ i 1 " •I it i n ■1— L. — C. —a — d —ft — ft — ft — ft — ft — ft —ft —ft —ft V.VI ►-< a —c *- oji* u.u ♦ —4 X — Ll •ii — r. V —Pi |ft— ui 9 — 9 f 1 — — !•— <• » • — 9 9— — 4 — VI9 H 4 4C 4 4C IN 4 4 c co ift 4 - 4 49 Pi 4 U pi 4 r rc** Pi 4 C 4 4 Pi COS 9 >4 IP 4Q 4 9 1 4 «• r» C 9 «' (« 9 — • 19 4 r- 9 — 4 o r. OC r* X. 90 9 Oil tr o pi COIN w11 u <X n • tl • o • r • p* • O • — • c- • y • r • — • v • c •v* a ft • • • • • •ftL -J ii II il i ii 1 ll 1 II n ii I ii it II t ii 11 •s.«.* u. —» CL — a wQ. — ft — ft — ft —ft — ft —ft — ft —ft —ft
►-
4 I9 IN wi n r. t- —h •• u L. -i O W1 < u.o e 0. o J (ft 3 L; 4 a. u.Oo c 9 4 uc (ii V* a Ui « o u.i •• Ll 3 O o fif ft •i X Lt O .J ►* 4 oN 4 C C VC C 3 o a Ui o 3 a VI oIN — z z a Of Z Li </) a « «n (L (A
u V o u c
Reproduced with permission of the copyright owner. Further reproduction prohibited without permission.
i
103
c / — w c—** ir—r* — r o —in •M •*»< —— o •" — IN u —r. 9 — 0 «—p. 9 — — o — o ' —* IN —Cu 3 OOP* C C IN c 0 C ► op* •c «« 1*1 0 Pi cor* P> 0 P* pto* r* o p* 9 0* *r * c * ftri ♦ 09 C«<o « er r 9 — ? ? - O 9 « coo e ? - ~9 ♦ N9r ri 9 ♦ 9 90 r» c (.»«< 0. c • c • c • #■ a o • c • n a G • c • c • c • Cl • c • •• a M • G «& c • • • • • • • • • •
K 1 II ii i ii I ii n II II 1 II II i «i II n I ii II It 1 <•— ft —a — ft —a. —g —ft. —ft. — ft -ft — ft —ft -ft —ft —ft — ft — ft
J ft — *N ► — o < —9 0 —9 — — — o — - ♦ — ’0 ♦ — f t 9 —Ifl f t—n r — n n ♦ —9 ft—9 f t — ftc> <* C - 9 0 ft - f i r Ci ft ♦ r o r r ft** 9 ft ft ♦ ft C ♦ fttr c ft ♦ ft ft ft ft ft r ft ftft f t f t 9 ♦ o nIi. Pi 9 — 0 9 Ci 9 9 0 •ft 9 O h. 9 N - 9 * <£ 9 f t 9 9 C f t 9 ♦ C 9 — - 9 - ♦ 9 f t ♦ 9 C — 9 m C 9 - * 9 0a M • o • mm • — • C • c • C • — • C • — • « • • c. • mm • m • L • m m~ • • • • • • • • • • • • • • • «2 1 I* 1 H 1 II 1 H il I ii II 1 ii 1 II 1 •« 1 H 1 II 1 H II ri 1 II
— ft — ft — ft — ft — ft —ft — ft — ft — ft — ft — ft —ft — ft — ft — f t — f t
— —— 9 —r. T — f t f t — - ft—ft ♦ — ® IN — O - — f t f* — IN C — — r — in C — 9 r» — m 9 — IN N —ft ft—omt r ft c * O f t f t ft O r ft* f t ft ft ft ft IN C ft IN n ft e f t f t f t IN f t O IT f t c c o n P i O — ft ftft * f tn f t ftOa. C 9 O f t 9 0 * 9 0 ♦ 9 0 ft- 9 0 9 9 0 — 9 0 ft 9 G ft 9 Pi t ’JC 9. 9 0 C 9 0 Pi 9 0 f t 9 O * 9 0 f t 9 Ou r • f t • ft • — ■ — • — • tt • P» « C • n • ru • — • IN • — a — • n •o • • a • • • a • •a l ii 1 H 1 II 1 >1 1 " 1 II 1 II 1 « 1 ll l ii 1 it 1 ll 1 H t II 1 II l ii
— ft — f t — f t — f t — f t — f t — f t — f t - f t — f t — ft — a — f t — f t — f t — f t
u. ft —o ♦ - i n c — IN ft — IN — — a f t — N o —n — — f t — 9 9 — ♦ * —n n — in 9 — n f t — ft P* — O O —ftu IN f t ♦ - f t — t i ft 9 n f t ® P* 0 * n o n f t f t G 9 f t f t ♦ f t 9 ♦ Oft ♦ o - e O in ♦ O f t f t 0 9 P* 0 9 n ft ft« ♦ c r, S 9 t i C 9 ♦ 9 9 - r » 9 r ♦ o n r o i N f t C o f t O IN f t O O r « 9 — IN 9 ♦ - 9 f t n 9 o n 9 g 0 9 0o t • O • C • o • Cl • & « o • — • f t • — • — a o • C • — • — • — aa • • • • • • •c ii 1 II 1 >1 1 II ii ii ii t II 1 II 1 II 1 Ii l n 1 ll ii II ll
— f t — f t — f t — f t — f t — f t — f t — f t — f t — f t — ft — f t — f t — f t — f t — f t
j C — f t < — o n — s 9 — 0 f t — 9 P | — K s — P* p i — p. P»— Pt r * — n 9 — 0 p* — n 0 — 9 s — p. p . — ft. p* — Pt♦ o o — o o n c 9 .N C - ♦ O O O O IN m C m f t o O O O Pi f t o o O O Pi s o n P i O O P* O O 9 ® O f t o o
3 0 9 0 « 9 0 n 9 o fN 9 — l*> 9 n ♦ 9 n * N 9 * n o n C 9 O P i 9 ♦ - 9 G ® 9 c f t 9 0 Pi 9 — 0 9 9 Pi 9 ♦a N • r • — • — • f t • G • G • c • f i • G • P i • mm a ■a a — a O • o •c • • a a a a a a az II ii ii ll il •I 1 il il 1 ll ll <1 II II ll <1
— 1. — f t — f t — f t — f t — f t — f t — (V — f t — f t — f t — f t — f t — f t — f t — f t
♦ - 0 * rr — tm. 9 — mm — ft. G — » 9 — ® IN — ® C — IN ♦ — * P i — 9 ft. — ♦ f t — 9 9 — ♦ — — P* P* — 9a . ♦ -C f t f t o — tm C — f t 0 O f t 0 o O O P * f t O P« X o o - ♦ C l f t OP* — o n n o c n o r * P« O O * 0 9 n o oc 9 C - 9 & - 9 3 p . 9 ♦ f t 9 C ♦ 9 e ♦ 9 n 0 9 ♦ n o — 9 9 - * 9 vj S 9 0 * 9 0 P* 9 C * 9 - 0 9 Piu. r j • P* • P . • c ■ 3 • c ♦ P. a N a c •o a a • • a a a a a a a2 tl tl ll ll ti n tt 1 •• il 1 ii II ll il ■1 II II
— a. — f t — f t — f t — f t — f t — f t — f t — f t — f t — f t — f t — f t — f t — f t — f t
•**.f t 0 — 0 C — O — c 0 — 0 * — #N r > — o 9 — r> f t — t . ♦ — Ci r — n E — G N — r . p i — a r — o S — O3 IN S C O f t O c C O O f* O O o o c p . c e p< o e m < C c o o ♦ o c 9 O C c o o N o o ♦ 9 O c os 1 f t ♦ 9 0 9 9 c» h« 9 C f t 9 G 9 9 0 i T f c f t 9 c CNO u . P * 9 C c f : ♦ 9 o P* 9 O O 9 C — 9 l*s ♦ 9 0 e 9
z f t • ♦ • ♦ • ♦ • t i • f t • r . • ♦ • r • f t a f t a ♦ a ♦ a ♦ a f t a o •I c a a a a a
U II <1 II II II H II ll ii Ii II II II ll - II
f t—
— f t — f t — f t — f t — f t — f t — f t — f t — f t — f t — f t — f t — f t — f t — f t — f t
*■
f t — O f t — G * — C « — _ . r — o 0 — 0 * 9 — 0 f t — o 9 — G f t — C c — ♦ — C O — * — ClCl p . o u ♦N C O p< c o N O C L C C . •o O C5 P J C C n c n ♦ C O 9 0 0 C O O ♦ o o 9 O C c o o n o ♦ O U
f t O c — 9 0 9 9 0 P i 9 9 0 9 0 C 9 c S 9 C P * 9 f> 0 9 0 9 9 0 •0 9 O - 9 C - ? c C 9 C O 9 ♦ 9 3c \L 2 ♦ • ♦ • r* • r» • P • n • r - a n a r a P* a ♦ a ♦ a r a n a r a f t ar f t o • • a a a a a
f t o II II •i ii II ii ll II il II il - II IIz c — f t — f t — f t — f t — f t — f t — f t — f t — f t — f t — f t — f t — f t — f t — f t — f tc f t
f t 23 cr f j c — c ♦ — P» f t — o r — f t r — c : * — c - r — i . P — t P — w. 0 — c i « — f ■ f t .— O s — 1 ♦ — G
*C f t f t v ^ o a S O U f t o u c* O c (N O c f t O C N C C — O c - o c — c c P* O O P» O C f t o c I c S O U p» o of t a _J o r e . C* 9 » i f f c 0 9 0 h » n — 9 r N ? P « . 9 r * 9 C f t 9 o ♦ 9 G — 9 r . O 9 v _ r . 9 c 9 r» — O rc - j « ♦ • t i • r • P i • f t • f t • f t • ♦ n a r t a ♦ a ♦ a r* a c - • n • ♦ •
c • • • a a a a£ a f t ii II n II ll ii 11 ii ll ii II ll ll — II II ii© > a . — f t — f t — c . — f t — f t — f t — f t — f t — f t — f t — f t — f t — f t — f t — f t — f t— H a
f ta o« i rU. lAl i ♦ — o p< — r» N — C. n — i . 0 - 0 r i — n 9 — t t o ♦ — r P i — C P» — »J p . — C C — O C — — r t — e
o f t p . 0 *- f t O r . i C t - f t o o < C f t - a rm ♦ o « 9 0 f 9 O O f t 0 r . O f t C O c o r * O f tt mi ♦ 9 c . : c c t 9 p. 9 9 C f t 9 C r r c . S O f t ♦ 9 C J C c 9 9 C <0 P C Pi 9 c ‘ o 9 •0 9 C - > c 0 9 0
• 2 <t ♦ • t o • f t • ♦ • P i a ♦ • n • ♦ • ♦ a ♦ • f t a P* a i*i a r . a n a ♦ af t 3 f t • • a a
c II ll II M il ii ii II II II II •1 — <1 II II llU - J — f t — f t — f t — f t — f t — f t — f t — f t — f t — f t — f t — f t — f t — f t — f t — f t
a . ♦ — t — — r t s — o 9 — r* t i — t j — C N — «.* n . — r ' r * — u f t n i < I ’ — r» f t — i t f t — o N - Ua f t C O c x O o r* O c * O o s e c 0 0 3 f i O o f t - O f t 9 O o r - O O i i n r o u O c P* X u ♦ O C 9 0 0
M r i »* e t • — 9 t • G 9 * 1 — 9 P . P . 9 r . 9 9 r . •O 9 1 0 9 0 P » 9 r f t 9 « > 0 9 i ' « t 9 P t 9 r * — 9 c m C O N 9 nu cr u f t a f t a •O a ♦ a r . a ♦ a P . a ft a ♦ a f t a 0 a c • P* a ♦ a ♦ a ♦ •f t mL u a a af t U1 ft II ll II II ll • 1 II II *• 11 li II II ilV U. — ft — ft — ft — ft —a. — f t — ft — ft — ft — ft — & — f t — f t — ft — ft — f t
o o r c c
Reproduced with permission of the copyright owner. Further reproduction prohibited without permission.
IllldU
lO
.U J. U
MNO
3
IN
II
Jl.-
nilJ
V
Jl U
.lNlH
d
S1
>. *
. (U
li O
IT
IO
j-l
/ (
U1
9J
1 /
1N
-1
JI d
J J(l
3 )
I
104ce*
o r. —e £ —ft 4 "L U. — U 0 —0 •J — £ —3 o —® £ —£ V * - 3 ——f k — y £ —u a ~ O C O 0 - r e c rv £ r* r 0 r> 0 — - £ 1" £ £ k o c W £ £ r o re ft K 3 C - ? C K e t . f f f C £ 3 C U 9 -.*• c r 9 c c f - - 9 - K3C If. 9 0 £ 9 c4 ft £ • fi a r • — a X • C • ri a M • — a M « r • — a r •a C • • a « « • • •
ft ll— ft
•1—a. — ft
ll— ft
II—ft.
— ll — 0.
II—a
II- f t
II— ft
1 I' —e.
it—ft
II—ft
ii— ft
-1 -r — o ar — e K — c £ —a s' — %* — C 9 — £ X — 9 fi — ft x — m 0 — O £ ~ r n - cif. 4 £ f J - 0- r. 0 r £ f C c f ft 0 9 £ £ C 4 £ X 9 e - r o o - OC ft £ C fi 0OUJ ? C o IS 7 - n 9 f £ 3 O C 9 £ ? C f t * - Mf 'J £ 3 9 N J O f f f y £ 9 C - J c* r • — • r • £ a <_ • C • — • — • O • 1*. • r • r< • £ •9 a • • • • • • ■2 ll •1 ii II — H ll ll II II 1 'I h ■1 II
•>0. w l — a — ft. — ft — ft — ft — ft — ft — ft — ft — ft — ft
r . — - £ * * t - — X c —• £ — C c — c < — K x — « K — £ X — o — — — O — £ r — oj £ £ if) r £ n r £ c f t £ £ £ C r , £ r . — £ - S £ N £ O V. O O C - O K r i o — O O r ia C C - £ 3 f i ^ 3 t ft 3 £ 3 0 3 3 0 r i O £ - 3 £ 0 3 0 O 3 C I f 3 t i r j 3 £ - 9 -o — • c • — • C • £ • — • O • C ■ — • r • — • O • — ac a • • • • a aa II 1 II II — tl II II II II 1 •> i ii II ll II
— f t — f t — f t — ft — f t — f t — f t — f t — f t — f t — f t — f t — f ta
u> — — o f t — — — ® r * — o £ — O n — n K — ® ft —— - — i f k — o tf. —K - — o
f t
f to I f £ O - £ N O £ r £ 3 IS o c C O O r t o k K O O 3 £ £ 3 O O c o c f t O O 3 0 » » E4 n o c* r t e f i C 3 r 3 c f f o K 3 C O O r t ( S 3 — K 3 C C* 3 £ — 3 t i I f C c C 3 C CC £ • w • ft • — • rt • r * • c • M • — • O • £ • IS • £ a u3 • • aC II II — II ii li it l H II II 1 » II II tl
— 0. — f t — f t — f t — 0. — f t — f t — f t — f t — f t — f t — f t — f t s
cc
J D — O t l — 3 — C £ — O 3 — 3 £ — K r i — r r — r i K — (S r i — £ i — r . f t — cj£ £ © O £ — O K m O K - O — O C - K O # < K O O K O f i £ o n £ O C sJ 0 3 0 0 9 4
2 £ 3 0 O 3 r t e n O 2 <M r i 3 — - 3 ' j r t 3 a £ 3 C« £ 3 n £ 3 n O 3 c 3 3 - r 3 e us £ • a • o • St 1 — • r« • r i • — • c . • c • i f • C • n aC • • • • a a aZ II — ii II 1 It n li ll II II ii ll tl II z
— f t — f t — f t — f t — f t — f t — f t — f t — f t — f t — f t
o — n — g — — f t n — - ® — a S - i i o — <s ■0 — <J t f — — K — r i - • ' j £ — 3 X — wItf t
f t C £ £ O f t i f O O £ O f £ o o - C O K O O £ £ O K £ n n *>k K O O ® o a £ O Oe O £ £ 3 0 r* 3 - J 0 3 — 3 3 C K 3 O t o a £ 3 3 c o s * n o n £ 3 0 n o c - 3 f t cL. £ • — • r . • £ • r . • r* • r i • w • — a 0 a uc • • • * • a7 ■■ il II ll It ii •1 ■1 ti Ii tl 4
— f t — f t — f t — f t — f t — f t — f t — f t — f t — f t — f t — f t — f t
4X•s .I f f — o f s — t . £ — £ X — o r i — o r t — X K — I f K — tf- 3 — K O — w C — r i i* — — P«—*r i9 n r . £ £ If- O O f 0 31 V' o c £ o n X < £ S O S £ o n - £ C £ 0 4- 3 O K . . >C t* C O K f t£ 1 © 3 0 ru 3 £ £ 3 C f 3 c X 3 O C 3 £ * i 3 r i K 3 r t 3 3 - K 3 C £ 3 s . <S 3 — i f 3 c . z
z C. • 1- • r . • mm • C • • i • C • £ «| c • • • • • • f t
u II II II i it 1 " i I' ll 1 H ll II II II II f t— f t — f t — f t — f t — f t — f t — f t — f t — f t — f t — f t — f t — f t
V) VIf tz
— — — K n — if K - f t <S— I f r i — 3 — o £ — 3 r i — — n — - I f — — 3 — - £ — £ 0 « * f tu r o e 3 £ • £ K £ 3 v o n K o 3 £ £ 3 £ 0 3 Cl £ 3 t f o n - O l . K O £ ? < ♦ K O i l a
X — * ? i* t . 3 £ m 3 c * 3 0 1 3 - r > o r# 3 f t 3 3 - £ o r» r i 3 f t K 3 C . J P - ■0 3 9Ik 2 c • u • e? • i • r • — a »
r u. C • • au l . ii •1 <1 1 il il ii ii ti li
c c — f t — f t — f t — f t — f t — f t — f t — f t — f t — f t — f t — f t - f tX
if.
u
9 cs r . e — £ k — r - O — 3 e — r t £ — 3 3 — 0 - — 3 «■ — i f r — i r X — — X — IS r i — £ If. — O*N f t in « £ V f s o o £ 0 3 o £ tf» £ £ IS f t O O r o r . C O I f - £ < S £ O C 3 0 - r , O K £ 0 01* 0 j f* e «• r j 3 — r . e t < £ 3 - t O - e c a K 3 r t r o r 1 3 t r . 3 c r . 3 t i O 3 IS I f 3 0o • J a n • — • — • u ■ c • IS • r • N a _• a
• • • • • • a a Cc cr o ll ll n 1 II ll il H 1 M II ii tl II •1 —C V a — f t — f t — f t — f t — f t — t — f t — f t — f t — f t — f t — f t — f t VI— f t c
o aLL V) ur 1 r _jli. U< i y s — C £ — 3 3 — n K — X- t f — r> > — — K — Tj (S — If r . — © o — < 3 — « £ — 3
9 ? • £ . . % r< 0 ' s £ £ £ f t -*j — r t o X • f w « . £ ' £ O £ X 3. w — O O I f O K £ O *» - o r . 41 C if. 3 •-* — 3 £ f l 3- ft* £ 3 0 r i 3 £ £ 3 u o c ; r i 3 £ f 3 C £ 3 * . r o r . K 3 r« f t
• 2 c — • f * * «S • ?» • — • i. ' • I f • ( . a o a 1£ 9 c • • • • a
c II li 1 II 1 II 1 II t H ii tl II 1 >1 itU. «. — f t — f t — t — f t — f t — f t — f t — f t — f t — f t — f t — f t — f tVI f t4 4 ^7
L i t- . u .l u V*. — £ N — r . r . — f* x — 1> n — n C — N — — £ r t — i f 3 — £ I f-— Cl N — — r> — — v*.3 V*) r £ • . e o r u £ r i o o n p y ^ K 3 C « I S O C £ 0 £ ( S O ® S i c X O c I O O - O K 4
M r« r » e » . C t 3 « . «u 3 £ r o * o S3 3 IS i s c * n K 3 l . K O I 0 3 — « 3 c •0 e n - C £ i f - 0 f t UVI t i U T4 • — • O • i , • r i • — • I* • u • r i aX > 4 • • • af t t . C II H 1 H i n I II ii II II II II tl 1 II ll V ,Ci U. — f t — f t — f t — f t — f t — f t — f t — f t — f t — f t — f t — f t — f t
yu
£ —3 f« u1 »> n f tft •• o — . 1 o I f 4 f tU X f t o I/I 1 f t I f f t fT f tC l * E 3 4 a UI K u til 4 a f t1 «• U e O O a f t mi X iu o J ft 4 c
f t £ a a u a 3 c f t U.' c 9 4 VI f t U<i — z z a a Z t* U. i f 4 4 I f h. o —
Reproduced with permission of the copyright owner. Further reproduction prohibited without permission.
CO
PULA
TIO
N
COf
FF
I C IF
NT
105
a 4 —— — —tf. * —4 c — 4 Pi — O# s —n c —r. <t —IT V-—V* P» —ri t — 9 r. —— 4 —C A— « £ —- r. — Paor > oa c c o c o x mon A a} Pi so n C 0 o n o s N X > n oo — O — -OP* p'on 4 0 0 N O A O O N£ O O PJ n« 4 m N>N ooc SCO O ? 4 r 9 4 NCn V ? n p. C — A C 3 P* CPa A ? C- oco A C O
ij * o • — • X • N • •a • c • O • c • C • — • — • X • — • — • — •k • • • • « • • • • • •(A ll II II II ll II II 1 H II 1 II II tl II II II II
— X «—£ w(L — a. — X »» X • X •»x — A «-x — X «>a. —a — X ~x
3—- C —N — —4 O —PI s — *v « —n s —n 4 —n — — 4 4 —C— —
Pa —— P. —4 4 — 4 A — —k J i t •OX? N O A 00 7 SON c o s *r o 'j 4 0-. 4 OC •I o c I# o C 4 O P* P. ON C O 4 »> O N<t A 3 N r f c A ? P. - c X »l0y nc r« non IN C 4 - c - A C p« ; f 4 — C 4 n c n A 7 Pa o ? - p« ? —k 0 • — • c • u • c • — • *. • C: • •a •V! • • •L. 1 i n 1 II it ii i ii i ii 1 II 1 ll i n 1 <l l -i tl
— X — X — X — X — X — X — X — X — X — X — X — X — X — X <—X — X
rt —C 3 —3 v. —O N — 4 — 4 A — o N— X r» — V. 0 —— n —n 0 —P* U* —4 c —s A — Pa 3 —— c — ttVI 4 4 r. 4 o r« p:o — r e — n o — — XU IA OC Pi ON r o s IT o c A < — s o c A ON C O — N 04 C ON
O 3* O O i. -CO raC - p« c tj 400 V* 9 N nor 4 C w N O 4 — CO o C* '» 4 CO Pa C t* N 9 O 4 C t*-J — • — • Pi • — • tt • P4 • C • c • t- • p. • p. I — • tt • — •
• • • • • • • • « •V) ll II ll ll II II ii II II 1 II II II II II II II
— X — X ~X — X — X — X ~a. — x —X — X — X — X — X —x —X — X
A u — c * —c N —3 4 — 0 r — u c —o O-U v? —u f- —w n —o u*— o 0—0 t —— A —— C — Uk. pj Jr. <N Ok — OX n o c ti o U — oo 9 O C 4 or O O w* o oo O 0 C5 rt 0 O — Oo 4 00 - or. 4 0 0X s o c C ?••> If.ft r f o v o o r c o n c c’i 4 ? O If 9 C' /0O -* c — r. cc nco t c o NCU NCOij ir • f • 4 • n • P: • 4 • 4 • 4 • P* • r • -.•} • A • A • n • r. • 4 «d • • • • • •<s II n II II il ii II ii ii II
—x —CL. —a — X — X —X WX — X —X — X — X — X — X —X •-X — X
f *?«*• n —c r« —r- — r c —e —— >1 c —c p. —p. A — — C —4 r. —x r —a p* —— 3 —Nn on X 0 A -OS — o 0 0 4 fiv ; SO? C 04 n o k 4«v I. CC -O - - Or. A on — o©<& 3 ti r. ff — <3 O N 4 0 0 , .c « P-C la c r pj r c»- O C r« n e p r c pi c c - P.0 4 t C f. 4 c n c c —
tu a • — • c • u • u • U • *4 • c • c •c • • • • • •X i " 1 •• II 1 II n II ii ii 1 >1 1 it ii II II II ii II
—x —X —x — X ->x ~x • X —x *-x — X -X —X •-X •-X — x
O—C i*— 4 P4—r* o —s 4<—N 4 —n t*—fi c — n—p» r*— a. P.*—A Pi—A A —A ___ N—A.r- c r* r a r — 0 ». NO** r x v. « * 4 N p* 0 T k 0 o OOP. . O 9 4 0 4 4'filf X 0 A f' 0 c 4 on4 on V. 9 ti n — N ~ Pi IC 'f P.O 4 f e rp r , 4 c “ ■2 9 4 r* Cc £ C O TCP* c c — N 9 t4
X n • f • in • I i • o • it • fl • I* •U • • • • •V ii ii n 1 II ll 1 II ll ii ■i 1 It ii it II I ll •1 1 H
«-X —c. — 0. —x — X ~X —u — X — X — X — X — X —X —X — X — X
A —N o —n £ - 4 rsi ̂ S ir «.n 0—0 X — *0 — — V n—n o — — — — 4 N —IJ 4 —C N —Ar,«c 9 X £ A O A NON 40 0 if.Sk C Ola 0X4 IT O c o on 4 0 C P. OU 4 OO p on o o? SOSn p f O f - .* 3 — C 4 — AC .■> cc* — IN C — r»o»* £ C P» k C Pi i. c r p*co 4 Ci • N C P. rt 9 n AON
-J — • u • — • (• • — • »J • — • — • I'- • p. • n • p i • — • t • I- • *a • • • • • • •L. 11 II II II ll ll II it •1 n ii •t II II II II
a-L. —a — X wX — x — X wO. —X — X •-a — X —X —X wQ. — x
<v n Par< n S a o N n 4 Cl rt
Q a ei M s: C c c N J -I k4 4 4 k k k r r c c u U a 9 z ZX y. u o c O o o a a w b a O o X.J _l _l c c c u u u o a O o O u u
C o u o (J
Reproduced with permission of the copyright owner. Further reproduction prohibited without permission.
ico
rrn
cit
NT
/
ico
sr'.l
/ i-
ta
ilfu
sig
i ••
. »
is
pq
int
m*
if a
co»
ff
ich
nt
ca
nn
ot
i»f
co
mpu
te
106
tf *—o rt—O pm pm r. —o r — « tf —O pi — r p.—rt If — f. c —— r — c« C —rt ct-at tf tf O O tf u tf tf pj «i o o rt tf o tf tf n pi tf m 9 tf tf O tf tf tf tfc 9 tf O ri tfa «ec c tf* tl — OpMPM 9 U tf 9 o SfO tf 9 o /If O - f j r. tf 9tf « t n • tf • PM * tf • n • pM • — • PM • PM • s • S • u •rt • • • • • • • •Vl ii it II It ii it II H II II ii ll — II
•■a. — tt «a — a. —a. — tt — tt — tt -a — tt — tt — tt
tf — 9 tf—rt tf— tf tf — a s —m u— tf o —rt tf — tf Pi —o tf — u o — X—ort ® tf x 0 * 9 r. c c Pi tf PM S tf o tf tf tf Pi tf Pm Pi tf tf X tf J PM tf Pi PM tf u O tf 9 tf Otf r tf c* 99«m tf 9 C pm tf tf tf 9 3 utc o 0 9 fi *»o n H9 — Pi 9 — tf 9 O C 9 0 9 0rt PM • ? • P. • C • ri • tf • •a • r • t* • X •tf • • • • • • • • •u. || ll II ii ii 1 ii t ii ii ll ii — II II
—tt — tt —a. —a — tt — A. — tt — tt — tt — tt —tt — tt —ttsXV.in p. —O O—CJ Pi —C. O' —c PM—O pm—o PM —P. X —O' u — If — o rt—r#D « r» tf g tf tfo o tf c -tf p* — tf <: Pm tf W P*tf o Otf U ^ tf PM tf tf tn c tf -CC tf tf <3c 1 UI tf o a tf 9 c PM 91*. if ff C 9 9 O rtOO XO tt 9 9 0 Pi 7 — tf O P. rt 0 i f C — 9 u
-I s • IT • tf • PM # n • r • r • Pi « PM • o • c • r • X •1 tf • • • • •
tf II II II II it it ii II II II PM II it lll"lrt
- a —0. •*0. — c. — 0. — tt — tt —tt —tt —tt — tt
p.—rt IM—tf PM—tf « —u x —rt If.—o 0 — 9 9 — tf *' — tf c — *— 9 Pi —o 9 —PMu r» <£ rt tf tf r. tf* tf tf Otf n n tf o tf tf Pi tf tf Pm p* tf <n tf tf tf O tf tf tf If pm tf Pi rt tf tf
s C£ r.c r tf on O 9 tf tf tf c fa 0* tl - 9 - 9 9 -M Mptf -M f* tf C 0 tf 3 fi Pi 9 — •M r —u. O *3 • e» • u • i** • Pi • — • c ■ f 1 • ̂ • rt • PM •
n lb > • • • • « • • • • • • • •u* tf ll ii 1 II i ii 1 It i H m 1 II 1 It — II il II ii
L C — tt —tt —a. — tt — t — a. — tt — tt — tt —tt —tt — tt —a.c. U
in zD cc If —— rt — fi rt —tf p<—r* tf —tf X — 9 tn —rt tf —tf X —— £ —tfN» rt rt tf rt rt tf m tf b tf tf tf 9* 0-tf PM9tf tf tf tf rt r* tf tf c tf tf tf tf tf tf PM Ctf rt 9 tf tft. tf 1. 0 Cl tf OM rt 3 f. tf tf .1 tf 1* P. < . 1? PM 9 9 pm <» 9 — C tf l i fp fiC — iflCrc J u rj • tf • PM • v. • U • C • rt • PM • PM «
o • ■ • • • •X z tf li II II 1 »l ■1 II 1 ■! p. I| 1 " II 11 IIa v a —a. —a —tt — a. — A. —c. — tt —tt — tt —tt MPPQ. — tt — tt— v* o
ua inO frli. u. 1 o —o 11 —»fM rt —X «—• • —C tf — &r rt— ® o — ci—rt tf PM —N C —Pt PM —rt
D <« tf .-i rt T If rt *J . • & tf *i « tf a* —tf n tf % w .1 £ r* tftf PM £tf C* tf . • U C-4 <itf IfI tf e c tf CC* PJC -• p-e tf n<*c I f w tf cu C 9 tf c •- — C* tf C C rt f*Cfi tf Ow
X n • *i'» * PM • Pi • C- • rt • Pi • V# •tf D lb • 't • • •
VI il It il II ii II ■ I — II ii 1 il II 1 II IIt- W —a. wfl. —a. — tt —t — tt — tt — tt — tt —tt — tt —tt —tt
rt t f —Pi pi—r . r .—n tf — rt C — t f t f — 9 i I — r t — X X —9 a —o — — «.i u — tf li — m« m r t tf o r t tf PM fi tf rt PMtf p. c t f tf <N tf — O tf tf t f i. tf tf rt t f £ r t r t tfo ti t f r t t f t f n
a t O f Pi O f tf 9 rt r . 9 tf 0 9 pm — 9 *J rt 9 t f 9 0 9 9 pm 9 9 pm X o » » tf 9 r t T. r tf .tf Pi • Pi • rt • c • PM • Pi ■ Ci • Pi • b • t • • r • C. • PM •
rt x C • • •0 - Ui II II 1 it il It II — II II 1 II II ii 1 II ■1rt U — tt —tt — tt . —tt — tt — tt —1_ — tt — tt — U — tt — tt — A
h •• Jus ttCr , C DI •• ui erttf c c
Reproduced with permission of the copyright owner. Further reproduction prohibited without permission.
(C
UE
FF
ICIT
NT
/
IZA
SV
.t
/ l-
TA
ILft
) E
IG|
" .
° IS
PR
IM
TF
p IF
a
C Q
EF-

PREC
EDIN
G
TASK
R
'quI
= (D
.17
SECO
NDS
CPU
TIN
T;
.71
SI
CONDI
rLA
PSFP
107
Uo4a
U • 'ic .i rcU. a. **}•
W* 3 k l * w. u w> L. 2 U i ^ 3 4 • • - K N-0. J C • J U . U k C
C.tf ^a o «*■“ ; v ' z n c L «l C h 2 2 C 1 C 2 0 0 K t f U U U Ooa<xu.uj2W> O vj (_»
o c c o c; C
Reproduced with permission of the copyright owner. Further reproduction prohibited without permission.
BIBLIOGRAPHY
Anderson, M. E. (1988). The management team. Patterns for success. Eugene, OR: University of Oregon School Study Council.
Bamhard, N. (1980). Human factors in library administration. Medical Library Association (Courses for Continuing Education). Chicago, IL.
Beehr, T. A. & Gupta, N. (1982). Managerial styles and employee responses. Paper presented at the Annual Meeting of the Midwestern Psychological Association (54th), Minneapolis, MN.
Bradford, D. L. & Cohen, A. R. (1984). Managing for excellence: the guide to developing high performance in contemporary organizations. New York:John Wiley & Sons.
Bruner, J. S. (1957). On going beyond the information given presented. InContemporary Approaches to Cognition. Cambridge, MA: Harvard Univers ity Press.
Drewes, D. W. (1982). Working for America: a work-centered approach toproductivity improvement. Viewpoints. (Available from Conserva, Inc., 401 Oberlin Road, Raleigh, NC 27605).
Dun & Bradstreet. (1991). 1991 Million Dollar Directory series. Bethlehem, PA: Author.
Elvins, J. P. (1985). Communication in quality circles: members' perceptions of their participation and its effects on related organizational communication variables. Paper presented at the Annual Meeting of the International Communication Association (35th). Honolulu, HI.
Fish, M. & Adams, R.C. (1985, November). Personnel Characteristics, job satis faction, and organizational styles of television program directors over market ranks and station sizes. Paper presented at the Annual Meeting of the Speech Communication Association (71st), Denver, CO.
Flood, D. E. (1985). I am a leader! The idiots won't follow! Paper presented at the Annual Meeting of the National Association of Elementary School prin cipals.
Frost, C. F., Wakely, J. H., & Ruh, R. A. (1974). The Scanlon plan for organi zation development: identity, participation, and equity. Lansing, MI: Michi gan State University Press.
Games, P. A. & Klare, G. E. (1967). Elementary statistics - data analysis for the behavioral sciences. New York: McGraw-Hill Book Company.
108
Reproduced with permission of the copyright owner. Further reproduction prohibited without permission.
109
Gaziano, C. & Coulson, D. C. (1987). Effect of newsroom management styles on journalists: a case study of two newspapers. Paper presented at the Annual Meeting of the Association for Education in Journalism and Mass Communi cation (70thl. San Antonio, TX.
Glaser, E. M. (1973). Improving the quality of worldife....and in the process, improving productivity; a summary o f concepts, procedures and problems, with case histories. Los Angles, CA: Human Interaction Research Institute.
Greeno, J. G. (1978). A study of problem solving. In R. Glaser (ed.) Instructional Psychology. Hillsdale, NJ: Lawrence Erlbaum Associates.
Harris, T. E. (1986). Organizational communication: focusing on leadership behaviors and change management. Paper presented at the Annual Meeting of the Speech Association (72ndl. Chicago, IL.
Harris, T. E. (1987). Leading and managing: a study of style and perception.Paper presented at the Annual Meeting of Western Speech Communication Association. Salt Lake City, UT.
Hellweg, S. A. & Freiberg, K. L. (1984). Corporate quality circles: theoretical and pragmatic extensions. Paper presented at the Annual Meeting of the Inter national Communication Association (34th!. San Francisco, CA.
Heppner, P. P. (1978). A review of problem solving literature and its relationship to the counseling process. Journal of Counseling Psychology. 25, No. 5, 366-375.
Hinkle, D. E., Wiersma, W. & Jurs, S. G. (1988). Applied statistics for the behavioral sciences. Boston: Houghton Mifflin Company.
Hopkins, K. D. & Glass, G. V. (1978). Basic statistics for the behavioral scienc £§. Englewood Cliffs, NJ: Prentice-Hall Inc.
Huitema, B. E. (1980). The analysis of covariance and alternatives. New York:John Wiley & Sons, Inc.
Isenhart, M. W. (1986). Participative management in a theological institution.Paper presented at the Annual Meeting of the Speech Association (72 nd!. Chicago, IL.
Kerlinger, F. N. (1986). Foundations of behavioral research. New York: Holt, Rinehart and Winston.
Lawler, E. E. Ill (1982). Education, management style, and organizational effec tiveness. National Institute of Education, Washington, DC.
Likert, R. (1967). The human organization: its management and value. New York: McGraw.
Reproduced with permission of the copyright owner. Further reproduction prohibited without permission.

110
Likert, R. A. & Likert, J. G. (1976). New ways of managing conflict. New York: McGraw.
Lloyd, R. F. & Rehg, V. R. (1983). Quality circles: applications in vocational education. Information Series No. 249. Columbus, OH: Ohio State Universi ty National Center for Vocational Education.
McCabe, D. M. (1984). The labor-management communication process: current developments in labor-management cooperation. Proceedings of the Ameri can Business Communication Association Southwest Convention (31st) fpp 193-198), Hammond, LA.
Milutinovich, J. S., Gluskinos, U. M., & Viola, R. H. (1971). A stepwise dis criminat analysis of job satisfaction and group cohesiveness of biracial blue and white collar workers. Paper presented at the Annual Meeting of the Eastern Psychological Association (42nd). New York, NY.
Moeser, E. L. & Golen, L. L. (1987). Participative management: a labor man agement process that works for kids. Paper presented at the Annual Meeting of the National School Boards Association. San Francisco, CA.
Moore, B. E. & Ross, T. L. (1987). The Scanlon way to improved productivity: a practical guide. New York, NY: John Wiley & Sons, Inc.
Moretz, H. L. (1983). Quality circles: involvement, problem-solving, and recog nition. Innovative Abstracts. 5, No. 12, 1-2.
Nash, D. A. (1985). A profile of organizational characteristics of colleges of dentistry. Journal of Dental Education. 42, No. 3, 140-144.
New Mexico Research and Study Council. (1983). Increasing personal and organi zational effectiveness. (Treatise No. 3).
Nilsson, W. P. (1984). Management development at Hewlett-Packard. Making Our Schools More Effective: Proceedings of Three State Conferences fpp 241-2481. Washington, D.C.: U.S. Department of Education.
Owens, R. G. (1987). Organizational Behavior in Education. Englewood Cliffs,NJ: Prentice-Hall.
Pejovich, S. (1984). Industrial democracy: conflict or cooperation? Series on Public Issues NO. 12. College Station, TX: Texas A&M University Center for Free Enterprise.
Phillips, D. D. (1977). A systematic study of communication at the corporate level of two television group owners. Paper presented at the Annual Meeting of Western Speech Communication Association. Phoenix, AZ.
Reproduced with permission of the copyright owner. Further reproduction prohibited without permission.
Ill
Pratzner, F. C. & Russell, J. F. (1984). The changing workplace: implications of quality of work life developments for vocational education. Research and Development Series No. 249. Columbus, OH: Ohio State University Nation al Center for Vocational Education.
Robinsson, N. (1985). Productivity: an overview. Connecticut State Department of Education, Bureau of Vocational-Technical Schools, Hartford, CT.
Satterwhite, F. J. O. (1982). Managing quality circles effectively. Educational Quality Circle Consortium Monograph. Redwood, CA: San Mateo County Office of Education.
Savage, G. T. (1984). Decision making as negotiation: a comparison of two labor- management committees. Paper presented at the Annual Meeting of the Inter national Communication Association (34th). San Francisco, CA.
Savage, R. T. & Romano, R. (1983). Equality in the workplace: quality circles or quality of working life programs in the US. Paper presented at the Annual Meeting of the Eastern Communication Association. Ocean City, MD.
Schuster, M. H. (1982). Union-management cooperation, structure, process and impact. W.E. Upjohn Institute of Employment Research, Kalamazoo, MI.
Semlak, W. D., Cragan, J. & Cuffe, M. (1986, April). Corporate culture in a university setting: an analysis of theory "X". theory "Y". and theory ”Z" cultures within departments. Paper presented at the Annual Meeting of the Central States Speech Association, Cincinnati, OH.
Small, S. E. (1987). Educational needs and wants: identification and acquisition through participative management structures. Quality circles. Paper present ed at the Annual Conference of the National Council of States of Inservice Education (12thl. San Diego, CA.
Steve, M. (1984). Problem solving and decision making: a review of the litera ture. In A. H. Areson & J.J Decaro (Eds.), Learning and development:Volume 1. (pp. 319-369).
Thylor, W. L. & Cangemi, J. P. (1983). Participative management and the Scan Ion plan - a perspective on its philosophy and psychology. Psychology. A Quarterly Journal of Human Behavior. 2Q, No. 1, 42-46.
U.S. General Accounting Office. (1981). Productivity sharing programs: can they contribute to productivity improvement? U.S. General Accounting Office, Document Handling and Information Services Facility, Gaithersburg, MD.
U.S. General Accounting Office. (1988). Employee involvement. Issues for agencies to consider in designing and implementing programs (Report GAO/ggd-88-82). Washington, DC: U.S. General Accounting Office.
Vough, C. F. & Asbell, B. (1975). Ihpping the human resource - a strategy for productivity. New York:American Management Association.
Reproduced with permission of the copyright owner. Further reproduction prohibited without permission.
112
Wheeless, T. A., Wheelas, L. R., & Howard, R. D. (1982). An analysis of the contribution of participative decision-making and communication with super visors as predictors o f job satisfaction. Paper presented at the Annual Forum of the Association for Institutional Research (22nd). Denver, CO.
Wongruangwisam, P. (1980). Managerial leadership stvle and organizational effectiveness in large manufacturing organizations in Bangkok. Unpublished doctoral dissertation, University of Oklahoma, Norman, OK.
Zwerdling, D. (1980). Workplace democracy: a guide to workplace ownership, participation & self-management experiments in the United States & Europe. New York, NY: Harper Colophon Books.
Reproduced with permission of the copyright owner. Further reproduction prohibited without permission.