partial resistance to clubroot in arabidopsis is based on
TRANSCRIPT

ORIGINAL PAPER
Partial resistance to clubroot in Arabidopsis is basedon changes in the host primary metabolism and targeted celldivision and expansion capacity
Mélanie Jubault & Christine Lariagon &
Ludivine Taconnat & Jean-Pierre Renou &
Antoine Gravot & Régine Delourme &
Maria J. Manzanares-Dauleux
Received: 18 July 2012 /Revised: 21 January 2013 /Accepted: 4 February 2013 /Published online: 19 February 2013# The Author(s) 2013. This article is published with open access at Springerlink.com
Abstract To date, studies of the molecular basis of diseaseresistance mainly focused on qualitative resistance. However,deciphering mechanisms underlying quantitative resistancecould lead to insights into the relationship between qualitativeand quantitative resistance and guide the utilization of thesetwo types of resistance to produce durably resistant cultivars.A functional genomics approach, using the CATMA whole-genome microarray, was used to detect changes in gene ex-pression associated with partial quantitative resistance in the
Arabidopsis thaliana–Plasmodiophora brassicae pathosys-tem. The time course of transcript abundance during partialclubroot resistance response was monitored at the whole plantlevel, and direct comparisons between partial resistance andsusceptibility responses were made using the same host geno-type. An increasingly complex host response was revealed, aswas the differential influence of P. brassicae infection on thetranscription of Arabidopsis genes according to the isolateused. We observed, at the transcriptomic level, that metabolicdiversion by the pathogen was reduced or delayed, classicalplant defense responses were induced earlier and/or morestrongly, and cell enlargement and proliferation were activelyinhibited in the partial quantitative resistance response com-pared to the susceptible one.
Keywords Clubroot . Quantitative resistance . Arabidopsis .
Plasmodiophora brassicae . Microarray
Introduction
Clubroot, caused by the obligate biotrophic protistPlasmodiophora brassicaeWoron., is one of the most impor-tant diseases of Brassica crops, causing annual losses of 10–15 % worldwide (Dixon 2009). The life cycle of this soil-borne pathogen can be divided into two phases: a primaryphase in which events are confined to the root hairs and asecondary phase that occurs in the cortex and the stele of thehypocotyl and roots of the infected plants. During the secondphase, multinucleate plasmodia cause the hypertrophy (abnor-mal cell enlargement) and hyperplasia (uncontrolled cell divi-sion) of infected roots into characteristic clubs (Ingram andTommerup 1972). These obstruct nutrient and water transport,stunt the growth of the plant, and consequently reduce crop
Electronic supplementary material The online version of this article(doi:10.1007/s10142-013-0312-9) contains supplementary material,which is available to authorized users.
M. Jubault :M. J. Manzanares-DauleuxAgrocampus Ouest, UMR1349 IGEPP, 35000 Rennes, France
M. Jubault :A. Gravot :M. J. Manzanares-DauleuxUniversité Européenne de Bretagne, Rennes, France
C. Lariagon :R. DelourmeINRA, UMR1349 IGEPP, 35653 Le Rheu, France
L. Taconnat : J.-P. RenouUMR INRA 1165–CNRS 8114–UEVE, Unité de Recherche enGénomique Végétale, Université d’Evry-Val-d’Essone, CP 5708,91057 Evry Cedex, France
A. GravotUniversité Rennes 1, UMR1349 IGEPP, 35000 Rennes, France
M. J. Manzanares-Dauleux (*)UMR 1349 IGEPP INRA, Agrocampus Ouest Rennes,Université Rennes 1, BP35327, 35653 Le Rheu Cedex, Francee-mail: [email protected]
Present Address:J.-P. RenouUMR IRHS, 42 rue Georges Morel,49071 Beaucouzé Cedex, France
Funct Integr Genomics (2013) 13:191–205DOI 10.1007/s10142-013-0312-9
brought to you by COREView metadata, citation and similar papers at core.ac.uk
provided by Springer - Publisher Connector

yield and quality. Since the pathogen survives in the soil asresting spores readily transmittable and potentially viable forup to 15 years (Wallenhammar 1996), successful managementof clubroot requires integrated control. The combination ofadapted cropping practices as well as chemical and biologicalcontrol methods is now a feasible strategy for the managementof clubroot in Brassica (reviewed in Donald and Porter 2009);however, plant resistance is still the most powerful tool forcombating clubroot disease (Diederichsen et al. 2009). Bothqualitative and quantitative clubroot resistances were identi-fied in different Brassicaceae species, including the three mosteconomically important Brassica species: Brassica napus,Brassica rapa, and Brassica oleracea (reviewed in Piao etal. 2009). However, the commercial resistant cultivars fromthese species received primarily a single, dominant, and race-specific resistance gene, and several examples have nowdemonstrated the rapid adaptation of P. brassicae to wide-spread mono- or oligogenic clubroot resistance sources(Diederichsen et al. 2009). Although defined as a compatiblehost–pathogen interaction, partial resistance does limit theextent of the disease, either by rate-limiting pathogen multi-plication or by reducing symptom severity. This form ofresistance, frequently under polygenic control, is importantfor crop improvement and can be selected, often constitutingan additional layer of resistance in the absence of R-mediatedresistance and leading to high levels of phenotypic resistance(Poland et al. 2009). Furthermore, because it is controlled bymultiple genes with small effects (leading to lower selectionpressure on the pathogen) and/or is presumed to have abroader specificity, quantitative resistance should be over-come more slowly by the pathogen and appears to be analternative for the development of durable host plant resis-tance (Boyd 2006; Brun et al. 2010; Palloix et al. 2009).
Up until now, the identification of components requiredfor quantitative partial clubroot resistance was mainly basedon quantitative trait loci mapping, both in cultivated species(Piao et al. 2009; Manzanares-Dauleux et al. 2000a, 2003;Rocherieux et al. 2004) and the model plant Arabidopsisthaliana (Jubault et al. 2008b). Functional studies on club-root have mainly been conducted on the physiopathologicalmechanisms involved in the infection of susceptible hostsby P. brassicae (reviewed in Ludwig-Muller et al. 2009), butonly a few studies, done on Arabidopsis, have focused onthe mechanisms controlling quantitative resistance. Jubaultet al. (2008a) reported strikingly different arginine catabo-lism signatures between susceptible and partially resistantplants. In particular, susceptible plants were characterizedby a massive induction of arginase during the later stages ofdisease. This huge arginase induction actually constitutes abasal defense mechanism by reducing hormone-triggeredcellular proliferation (Gravot et al. 2012). The lower induc-tion of arginase in the partially resistant plants during P.brassicae infection reflects the attenuation or the delay of
the pathogen influence on host metabolism in partially re-sistant plants compared to the situation in susceptible plants(Jubault et al. 2008a) and is more likely the result of partialclubroot resistance than its cause. Moreover, Gravot et al.(2011) showed that, although partial resistance to clubroot isnot directly based on trehalose catabolism capacity, it is tosome extent related to the tolerance to trehalose accumula-tion in the partially resistant accession Bur-0. However, themechanisms underlying clubroot partial resistance currentlyremain largely unknown.
To gain further insight into this resistance type, a comple-mentary approach is to identify candidate genes whose ex-pression changes are in association with partial resistance,suggesting functional involvement. Using microarray technol-ogy, genome-wide information about patterns of gene expres-sion during interactions between Arabidopsis or cultivatedspecies and a variety of different pathogens was previouslyobtained. Analysis of host gene expression using microarraysprovided significant insight into the transcriptional responsestriggered during either R-mediated resistance (complete resis-tance) or basal defense (susceptibility; Tao et al. 2003;Marathe et al. 2004; Siemens et al. 2006; Jammes et al.2005; Huibers et al. 2009; Radwan et al. 2011; AbuQamar etal. 2006; Swarbrick et al. 2008; Thilmony et al. 2006; Ditt etal. 2006; Agarwal et al. 2011; Mazarei et al. 2011).Microarrayanalyses were previously carried out to study A. thaliana–P.brassicae interactions; however, these were only done ondisease development in the susceptible accession Columbia(Siemens et al. 2006; Agarwal et al. 2011).
Here, we report a large-scale gene expression profiling studyof partial clubroot resistance in A. thaliana using the completeArabidopsis transcriptomemicroarray (CATMA) chips (Croweet al. 2003; Hilson et al. 2004). The Bur-0 accession is partiallyresistant to the isolate eH; however, it is fully susceptible to theisolate e2. This finding can thus be exploited to investigate,using the same host genotype, the transcriptional changesassociated with these two levels of compatible interaction anddetermine specific molecular patterns associated with a partialresistance response compared to a susceptible one. At the tran-scriptomic level, the partial resistance response is associatedwith (1) a reduced or delayed host metabolic diversion by thepathogen, (2) an earlier and/or stronger induction of usual plantdefense responses, and (3) a reduced expression of genesinvolved in cell enlargement and proliferation.
Materials and methods
Pathogen
The selection isolates eH and e2 (Fähling et al. 2003) belongto the P. brassicae pathotype P1, according to the hostdifferential set established by Somé et al. (1996). They were
192 Funct Integr Genomics (2013) 13:191–205

kindly provided by J. Siemens (University of Dresden,Germany).
Plant materials
Seeds from Arabidopsis accession Bur-0 (172AV) wereobtained from the Versailles Resource Centre. This acces-sion is partially resistant to the eH isolate (Alix et al. 2007)and susceptible to the e2 isolate, respectively. B. napus ssp.oleifera cv. “Nevin” (ECD6), B. napus ssp. rapifera cv.“Wilhelmsburger” (ECD10), and B. napus ssp. oleifera(Brutor), which constitute the host differential set estab-lished by Somé et al. (1996), and the highly clubroot sus-ceptible B. rapa ssp. pekiniensis cv. “Granaat” (ECD5) wereincluded as controls in each clubroot test.
Experimental design and clubroot tests
Two independent studies were performed (Fig. 1). In thefirst study, comparisons were made between control plantsand plants inoculated with the eH isolate (comparisons 1–3).Inoculated and control plants were harvested at three timepoints: 1, 2, and 7 days post-inoculation (dpi; respectivelystages 1.04 and 1.08; Boyes et al. 2001). The second studywas performed only at 7 dpi, and comparisons were madebetween plants inoculated with either the eH or the e2 isolate(comparison 6). Each experiment was repeated twice.
Arabidopsis seeds were placed on wet blotting paper inPetri dishes at 4 °C for 3 days to synchronize germination;then, seeds were individually sown in 4-cm diameter potscontaining a two thirds compost/one third vermiculite mixsterilized by autoclaving. Arabidopsis plants were grownunder controlled environmental conditions (16-h light at22 °C and 8-h dark at 19 °C) and inoculated 7 days after
germination (stage 1.04; Boyes et al. 2001). The inoculumwas prepared according to Manzanares-Dauleux et al.(2000a), and inoculation was performed by applying 1 mLof resting spore suspension (107spores per milliliter) to thecrown of each seedling. The resting spore suspension wasreplaced by distilled water for the control plants. Thirtyindividual plants were collected per analysis point. Plantswere thoroughly rinsed in different baths of water, frozen inliquid nitrogen, and stored at −80 °C until RNA isolation.To check that the inoculation was successful, clubroot sus-ceptibility was evaluated in each test from 21 dpi (fromstage 3.90 to 6.50; Boyes et al. 2001) and symptoms wererecorded using the scale previously described for B. olera-cea (Manzanares-Dauleux et al. 2000b): 0—no visibleswelling; 1—very slight swelling usually confined to lateralroots; 2—moderate swelling on lateral roots and taproot; 2+—severe clubs on all roots, but some roots remain; 3—no rootleft, only one big gall. A disease index (DI) was calculated asdescribed by Manzanares-Dauleux et al. (2000b): DI ¼n1 � 25þ n2 � 50þ n2þ � 75þ n3 � 100ð Þ=N, where ni isthe number of plants in the symptom class i and N the totalnumber of plants tested. A line with a DI of zero is completelyresistant and develops no clubroot symptoms, while a line witha DI of 100 is highly susceptible. Susceptibility to clubroot wasalso quantified by evaluation of the Ga/La pathological index[the ratio between gall area (Ga, in square centimeters) androsette leaf area (roughly evaluated by the square of the longestleaf length—La, in square centimeters)] using image analysis,as previously described in Gravot et al. (2011).
RNA isolation
For each analysis point, total RNA was extracted fromapproximately 30 mg of 30 pooled plants using the SV
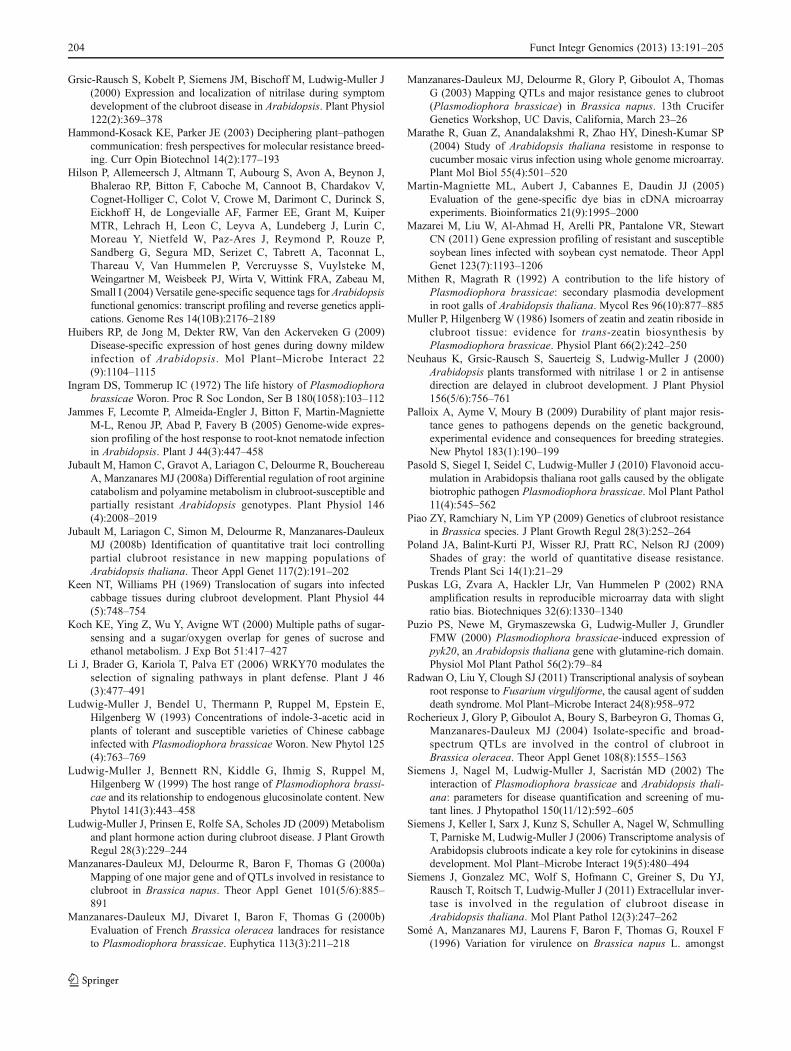
a bFig. 1 Typical symptomsduring partial resistance andsusceptibility responses toP. brassicae in Arabidopsis. aTiny clubs are mainly confinedto the secondary root system inthe eH-inoculated plants (partialresistance), whereas the mainand secondary root systemsare replaced by a big clubin the e2-inoculated plants(susceptible response) (b)
Funct Integr Genomics (2013) 13:191–205 193

Total RNA Isolation kit (Promega, Madison, WI). Anyremaining genomic DNA was removed by digestion withDNase I (DNA-freeTM, Ambion®, Austin, TX). RNA integ-rity was checked with the Bioanalyzer from Agilent(Waldbroon, Germany).
Microarray analyses
Microarray analyses were performed with the A. thalianaCATMA array containing 24,576 nuclear gene-specific tags(GST) corresponding to 22,089 nuclear genes, including21,612 AGI-predicted genes and 477 Eugene-predicted genes(Allemeersch et al. 2005; Hilson et al. 2004). The GST (whichare between 150 and 500 bp in length and show no more than70 % identity with any other sequence in the genome) werespotted on UltraGAPS slides (Corning, NY) using aBioRobotics Microgrid II TAS spotter (Genomic Solution,Huntingdon, UK). Detailed information about CATMA anddatabase access can be found online (Crowe et al. 2003).
Six comparisons were performed during the time courseanalysis as described in Fig. 2. The array was hybridizedsimultaneously with cRNA from both samples labeled withCy3 and Cy5 fluorescent dyes, respectively. For each com-parison, a repeat was carried out using a second set ofsamples and a dye swap experiment to avoid dye bias andgene-specific dye bias (Martin-Magniette et al. 2005).Therefore, a total of 24 arrays were hybridized.
The complete microarray procedure has been fully de-scribed before (de Jong et al. 2006). Briefly, for each con-dition, mRNA from isolated RNA was amplified with theMessageAmp aRNA kit (Ambion, Austin, TX). Then, am-plified mRNAwas used as a template to synthesize modifiedcDNA with SuperScript II (Invitrogen, Carlsbad, CA) andrandom nonamers (Gene Link, Westchester County, NY)with the incorporation of cy3-dUTP and cy5-dUTP (NEN,Boston, MA; Puskas et al. 2002). Samples were combined,purified, and concentrated with YM30 Microcon columns(Millipore, Bedford, MA). The probes were hybridizedovernight on CATMA arrays which were then scannedusing a GenePix 4000A scanner (Axon Instruments, FosterCity, CA). Spot intensities of the scans were determined byGenePix Pro 3.0 software (Axon Instruments).
Statistical analysis of microarray data
Analysis of spot intensities from the CATMA arrays andapplied statistics were performed as described previously(de Jong et al. 2006). Differentially expressed genes wereselected based on a Bonferroni p value<5 %.
Microarray data
Microarray data from this article were deposited at Array-Express (http://www.ebi.ac.uk/arrayexpress/; accession E-MEXP-363) and CATdb (http://urgv.evry.inra.fr/CATdb/;Project RA03-05_Clubroot**) according to the “MinimumInformation About a Microarray Experiment” standards.Functional categories of differentially expressed genes werebased on the Functional Catalogue (FunCat) scheme fromthe MatDB database (MIPS A. thaliana Database; http://mips.gsf.de/proj/funcatDB). Major metabolic pathwayswere analyzed using the MAPMAN software (Thimm etal. 2004).
Real-time RT-PCR
First-strand cDNA was synthesized with Superscript™ IIReverse Transcriptase (Invitrogen) and oligo(dT)15(Promega Corp.). For each gene, primers for real-time RT-PCR were designed on GSTs (Hilson et al. 2004) withPrimer Express® v1.5 software (Applied Biosystems) andsynthesized by Eurogentec. The genes, as well as thesequence of their specific oligonucleotides, are presentedin Electronic supplementary material (ESM) Table 1.Duplicate quantitative assays were performed on 3 μLof 1/40 diluted cDNA using the SYBR-Green PCRMaster kit(Applied Biosystems) with the ABI PRISM® 7700 SequenceDetection system (Applied Biosystems). To check theannealing specificity of each oligonucleotide, melting curveanalysis (55–94 °C) was carried out at the end of amplifica-tion. For calculations, a standard curve was determined foreach gene using different dilutions of the cDNA products.The expression levels for each target gene were then quan-tified following normalization to Actin8, the endogenousreference.
eH-inoculated 7 dpi
SUSCEPTIBILITY
6
3
Non-inoculated 1 dpi Non-inoculated 2 dpi Non inoculated 7 dpi
eH-Inoculated 1 dpi eH-inoculated 2 dpi eH-inoculated 7 dpi
e2-inoculated 7 dpi
CONTROL
PARTIAL RESISTANCE
PARTIAL RESISTANCE
1 2
54
Fig. 2 Experimental design forcomplete Arabidopsistranscriptome microarray(CATMA) transcript profilingof partial clubroot resistance
194 Funct Integr Genomics (2013) 13:191–205

Results
Bur-0 is partially resistant to the eH isolate, but susceptibleto the e2 isolate
The behavior of the Bur-0 accession was estimated from21 dpi with P. brassicae isolates. As previously reported(Jubault et al. 2008b; Alix et al. 2007), the Bur-0 accessionhad an intermediate behavior in response to inoculation withthe eH isolate, with a mean DI of 66 at 21 dpi. Bur-0 plantsinfected with this isolate typically showed only tiny clubsconfined mainly to the secondary root systems and well-developed green rosettes (Fig. 1a and Table 1). On thecontrary, Bur-0 was susceptible in response to inoculationwith the e2 isolate, with a mean DI of 90 at 21 dpi. Theplants infected with this isolate exhibited a big club replac-ing the main and secondary root systems and smallerrosettes (Fig. 1b and Table 1). A set of differential hosts,including susceptible and resistant genotypes of differentBrassica species, was also evaluated at 49 dpi to character-ize the isolate’s pathogenicity. This confirmed that bothisolates, eH and e2 (Fähling et al. 2003), used in this studybelong to the P. brassicae pathotype P1 (Somé et al. 1996).
Analysis of global changes in gene expression in partialresistance and susceptibility responses to P. brassicaeinfection
We know relatively little about changes in gene expressionthat occur during partial resistance response to P. brassicaeinfection and their specificity in comparison to the suscep-tible response. Thus, to gain insights into the transcriptionalchanges specifically associated with partial resistance,genome-wide expression analyses were carried out at thewhole-plant level on the Bur-0 accession infected eitherwith water, eH, or e2 isolates. First, to investigate the timingand extent of transcriptional changes associated with partialclubroot resistance response, comparisons were made be-tween the transcript profiles of Bur-0 plants inoculated withthe isolate eH and water-inoculated plants (i.e., control plants)over the time course of infection. To specifically relate host
responses to the pathogen life cycle, comparisons were madeduring the symptomless phase at 1, 2 (corresponding to theprimary phase), and 7 dpi (corresponding to the initiation ofsecondary infection in the cortex; Mithen and Magrath 1992;Puzio et al. 2000; Devos et al. 2006; Fig. 2, comparisons 1–3).Statistical analysis of these comparisons revealed that 822genes were significantly differentially expressed. Thus, 4 %of the 22,089 Arabidopsis genes represented on the CATMAchip displayed changes in mRNA levels in the plants inocu-lated with the eH isolate. Among the 822 differentiallyexpressed genes in partial resistance response to P. brassicae,329 were up-regulated whereas 483 were down-regulated. Inaddition, the expression of ten genes was initially induced, butwas then down-regulated (or vice versa) during the timecourse. AVenn diagram of comparisons 1–3 (Fig. 3) showedthat the pattern of host gene expression in partial resistanceresponse became increasingly complex over the time course,with 66, 174, and 706 genes differentially expressed at 1, 2,and 7 dpi, respectively.
In order to identify specific transcript changes betweenpartial resistance and susceptibility responses, the transcriptprofiles of Bur-0 plants inoculated with either the eH isolate(leading to partial resistance) or with the e2 isolate (leading tocomplete susceptibility) were compared. Comparisons be-tween the non-inoculated and eH-inoculated plants (describedabove) showed that host response at the whole-plant level wasmainly induced at 7 dpi, which corresponds to the initiation ofsecondary infection in the cortex. Thus, we chose this kineticpoint to make comparisons between responses to the eH ande2 isolates (Fig. 2, comparison 6). Statistical analysis of thiscomparison revealed 210 genes displaying significant differ-ential expression at 7 dpi. Thus, only 1 % of the 22,089Arabidopsis genes represented on the CATMA chip displayedchanges in mRNA levels between susceptible and partialresistance responses. Among these, 120 genes were expressed
Table 1 Evaluation of Bur-0 gall and leaf areas during partial resis-tance (inoculated with the eH isolate) and susceptibility (inoculatedwith the e2 isolate) responses to P. brassicae
Isolate Gallarea, Ga
Rosetteleaf area, La
Ga/La pathologicalindex
eH 0.06±0.03 25.6±1.76 13.63±8.41
e2 0.13±0.01 16.8±1.02 49.09±3.2
Means are estimated from 18 plants at 28 dpi. The Ga/La pathologicalindex reflects the ratio between Ga and rosette La. Results are reportedin square centimeters±standard deviation
1 dpi66
2 dpi174
7 dpi706
33
605 78 73
13
1010
Fig. 3 Venn diagram showing the differential distribution with timepoint of differentially expressed genes in eH-inoculated plants (partialresistance). dpi days post-inoculation
Funct Integr Genomics (2013) 13:191–205 195

at a higher level in eH-inoculated plants compared to thee2-inoculated ones, whereas 90 genes were expressed at alower level. Only 94 genes showing differential expressionwere common to both experiments (comparison betweennon-inoculated and eH-inoculated plants and comparisonbetween eH- and e2-inoculated plants).
To investigate which biological processes the differentiallyregulated genes may be involved in, we classified genesaccording to the functional categories defined by theFunctional Catalogue (FunCat) in the MatDB database(MIPS A. thaliana Database; Fig. 4). This functional catego-rization carried out on all the genes identified in the timecourse comparisons between Bur-0 eH-inoculated and controlplants showed that genes belonging to all functional groupswere affected during the increasing host response to P. brassi-cae infection in the partial resistance response. Furthermore,for almost all biological processes, genes were more oftenseen to be repressed than induced, with the exception of genesinvolved in cellular rescue, defense, and cellular communica-tion which were induced. Functional categorization carriedout on the genes identified in comparisons between eH- ande2-inoculated plants showed that most of these genes areinvolved in cellular rescue and defense, metabolism, andtranscription-related processes (Fig. 4). A similar number ofgenes were expressed at a higher or lower level in almost allcategories, except for cellular communication and hormonemetabolism for which genes were predominantly up- anddown-regulated, respectively.
Differential expression in microarrays was confirmedby quantitative RT-PCR
In order to validate the microarray data, a number of genesdifferentially expressed in at least one of the two studies
were selected from different functional categories and theirexpression measured in control and infected tissues us-ing quantitative RT-PCR. The RT-PCR profiles of thesegenes revealed that they exhibited the same temporalpatterns and direction changes (up- or down-regulated)in gene expression as observed in the microarray experiments(Fig. 5).
The molecular basis of clubroot partial resistance response
We then analyzed the role played by metabolic pathwaysusing the MAPMAN software (Thimm et al. 2004; Fig. 6).MAPMAN is a user-driven tool that displays large datasets, such as gene expression data from Arabidopsismicroarrays, onto diagrams of metabolic pathways or otherprocesses in order to highlight general trends. Detailednumeric data are also presented in ESM Tables S2-Bto S2-E.
Host’s primary metabolism regulation in responseto eH infection
Major transcriptional changes in photosynthetic light reac-tions and carbohydrate metabolism occurred in the partial
01020304050607080
Number of genes
Cell wall
Development
Cellular transport
Protein
Transcription
Energy
Hormone metabolism
Metabolism
0 10 20 30 40 50 60 70 80
Number of genes
Repressed biological processes Induced biological processes
Cellular communication
Cellular rescue, defense
Cell cycle, cell fate and DNA processing
IeH/NI 1dpi
IeH/NI 2dpi
IeH/NI 7dpi
IeH/Ie2 7dpi
Fig. 4 Distribution of thedifferentially expressed genesclassified into functionalcategories. Genes wereassigned to functionalcategories based on theFunctional Catalogue (FunCat)scheme in the MatDB database(MIPS Arabidopsis thalianaDatabase). Genes of unknownfunction are not shown. Thenumber of genes identified bythe Functional Catalogue isindicated on the x-axis
Fig. 5 Validation of microarray data by quantitative RT-PCR. Micro-array (gray) and quantitative RT-PCR (black) results are expressed in alog2 ratio obtained for comparisons between eH-inoculated (eH-I) andnon-inoculated (NI) plants at 1, 2, and 7 dpi for the first experiment andbetween eH-inoculated (eH-I) and e2-inoculated (e2-I) plants at 7 dpifor the second one. A positive ratio indicates that the gene is signifi-cantly induced in eH-inoculated plants in comparison to non-inoculat-ed or e2-inoculated plants; a negative ratio means that the gene issignificantly repressed in eH-inoculated plants in comparison to non-inoculated or e2-inoculated plants. dpi days post-inoculation
�
196 Funct Integr Genomics (2013) 13:191–205

-3.0
-2.0
-1.0
0.01 dpi 2 dpi 7 dpi 7dpi
eH-I / NIeH-I /e2-I
Lo
g2
(rat
io)
At2g39330 (JAL23)-2.0
-1.0
0.0
1.0
2.01 dpi 2 dpi 7 dpi 7dpi
eH-I / NIeH-I /e2-I
Lo
g2
(rat
io)
At2g42530 (Cor15b)-1.0
-0.5
0.0
0.51 dpi 2 dpi 7 dpi 7dpi
eH-I / NIeH-I /e2-I
Lo
g2
(rat
io)
At5g54160 (OMT1)
0.0
1.0
2.0
3.0
4.01 dpi 2 dpi 7 dpi 7dpi
eH-I / NIeH-I /e2-I
Lo
g2
(rat
io)
At3g57240 (BG3) -1.5
-0.5
0.5
1.5
2.51 dpi 2 dpi 7 dpi 7dpi
eH-I / NIeH-I /e2-I
Lo
g2
(rat
io)
At1g14880 (PCR1)-1.0
0.0
1.0
2.01 dpi 2 dpi 7 dpi 7dpi
eH-I / NIeH-I /e2-I
Lo
g2
(rat
io)
At2g33830
-2.0
-1.0
0.0
1.0
1 dpi 2 dpi 7 dpi 7dpi
eH-I / NIeH-I /e2-I
Lo
g2
(rat
io)
At3g56400 (WRKY70) -1.5
-0.5
0.5
1 dpi 2 dpi 7 dpi 7dpi
eH-I / NIeH-I /e2-I
Lo
g2
(rat
io)
At2g28950 (EXP6)-1.0
0.0
1.0
2.0
3.0
4.01 dpi 2 dpi 7 dpi 7dpi
eH-I / NIeH-I /e2-I
Lo
g2
(rat
io)
At1g75040 (PR5)
0.0
1.0
2.0
1 dpi 2 dpi 7 dpi 7dpi
eH-I / NIeH-I /e2-I
Lo
g2
(rat
io)
At5g63660 (PDF2.5) -1.0
0.0
1.0
2.0
3.01 dpi 2 dpi 7 dpi 7dpi
eH-I / NIeH-I /e2-I
Lo
g2
(rat
io)
At1g07050 -1.0
0.0
1.0
2.01 dpi 2 dpi 7 dpi 7dpi
eH-I / NIeH-I /e2-I
Lo
g2
(rat
io)
At5g15950 (SAMDC2)
Funct Integr Genomics (2013) 13:191–205 197

resistance response. Indeed, 22 % of all genes differentiallyexpressed in the Bur-0 plants inoculated with the eH isolatewere primary metabolism-related genes. The transcript lev-els of 18 genes involved in tetrapyrrole synthesis and pho-tosynthesis (both the photochemical process and the Calvincycle) were down-regulated mainly at 7 dpi (Fig. 6 and ESMTable S2-B). Probably linked to this decrease in photosyn-thesis, the transcript levels of seven genes involved in starchand sucrose synthesis and in the pentose phosphate pathwaywere also repressed at 7 dpi. In contrast, we found that genescoding starch-degrading enzymes, including BAM3(At4g20270) and PWD (At5g26570), and sucrose-degradingenzymes involved in the biosynthesis of hexose sugars andseveral sugar transporters were induced in infected plants at7 dpi. In addition, the expression of genes involved in energyproduction was also altered. Several genes involved in thetricarboxylic acid cycle and in the respiratory chain wererepressed. On the contrary, fermentation and production of
ethanol appeared to be enhanced as genes encoding pyruvatedecarboxylase PDC1 (At5g54960) and PDC2 (At4g33070)were up-regulated.
Transcription factor regulation in response to eH infection
The expression of many transcription factors and signalingcomponents was altered in response to P. brassicae inocula-tion. Of the overall genes, 13 % were putative transcriptionfactors differentially expressed mainly at 7 dpi. These tran-scription factors belong to several major families, includingWRKY, MYB, Basic-Helix-Loop-Helix, Homeobox, andzinc-finger family proteins (Fig. 6 and ESM Table S2-C).Overall, the expression of transcription factors was down-regulated, with the exception of the WRKY class which wasup-regulated in eH-inoculated plants. The fact that the tran-scription factors represent a wide distribution of gene familiesand that different expression profiles were observed may
(K)
(L)
(M)
(N)
(O) (P) (Q) (R)
(S)
(U)(T)
(A)(B)
(D) (E)
(F)
(G)
(H)
(I)
(C)
(J)
C
M
Fig. 6 Schematic representation of the gene expression profiles ofmetabolic and defense pathways in eH-inoculated plants (partial resis-tance) at 7 days post-inoculation. Differential gene expression in tet-rapyrrole synthesis (A), light reaction enzymes (B), Calvin cycleenzymes (C), starch and sucrose synthesis (D), starch and sucrosedegradation (E), sugar transporters (F), glycolysis enzymes (G), fer-mentation enzymes (H), tricarboxylic acid cycle (I), electron transportenzymes (J), redox status regulation (K), signaling pathways (L),WRKY transcription factors (M), PR proteins (N), isoprenoid metabo-lism (O), lignin metabolism (P), wax metabolism (Q), flavonoid
metabolism (R), cell adhesion (S), cell wall modification (T), and cellwall degradation (U). Each square symbolizes a differentiallyexpressed gene. Numbers +2 to −2 on the color scale represent log2of the fold change between the inoculated and non-inoculated plants. Apositive ratio (red square) indicates that the gene is induced in eH-inoculated plants in comparison to non-inoculated plants; a negativeratio (green square) means that the gene is repressed in eH-inoculatedplants in comparison to non-inoculated plants. C chloroplast, M mito-chondrion, Pb Plasmodiophora brassicae
198 Funct Integr Genomics (2013) 13:191–205

suggest that these are involved in controlling different pro-cesses and/or different phases of the response.
Host defense responses to eH infection
Further analysis showed that most of the 822 clubroot-induced Arabidopsis genes are potentially involved in hostdefense responses. In addition to WRKY transcription fac-tors, some other signaling components, such as the calciumsignaling pathway, were differentially expressed (Fig. 6 andESM Table S2-D). Whereas two genes encoding calmodu-lins and calcium-binding proteins were down-regulated atthe first two time points, seven were up-regulated at 7 dpi.Lastly, genes known or predicted to encode kinases wereparticularly abundant among the clubroot-induced genes.Numerous known or putative kinases were induced by P.brassicae inoculation at the end of the time course analysis.Of particular interest were 12 leucin-rich repeat (LRR)-con-taining receptor-like kinases. In contrast, four genes encod-ing G-proteins were down-regulated at 7 dpi.
The third largest functional class (12 %) contained genesinvolved in cell rescue and defense. Two thirds of thesegenes were up-regulated. At the first two time points post-inoculation, the defense-related group mainly includedgenes that were previously shown to be induced duringabiotic stress, such as heat shock proteins or dehydrins. Incontrast, at the later time point, the defense-related groupwas predominantly composed of genes encoding proteinsfrequently described during plant–pathogen interactions,such as enzymes involved in the removal of reactive oxygenspecies (ascorbate peroxidases, glutathione peroxidase, per-oxidases, superoxide dismutase, glutathione-S-transferases)or pathogenesis-related (PR) proteins such as β-1,3-gluca-nases, chitinases, thaumatin, and defensins.
The transcript levels of some genes involved in second-ary metabolism were also modulated in the partial resistanceresponse. Two branches of the phenylpropanoid pathwaywere altered upon eH inoculation. In the flavonoid biosyn-thesis pathway, flavonol production appeared to have beenfavored since the gene encoding the flavonol synthase(At5g08640) was slightly up-regulated from 2 dpi. Onthe contrary, a gene encoding dihydroflavonol-4-reductase (At4g27250), which drives the same substrate(dihydroflavonol) into another pathway leading to antho-cyanins and tannins, was down-regulated at 7 dpi. Among theflavonoid-related gene subset, DMR6 (At5g24530) exhibitedthe highest induction level at 7 dpi. This gene, encoding anenzyme whose exact substrate is suspected to be a flavonoid,is known to be induced by the salicylic acid analogue BTHtreatments and was reported to be involved in resistance toHyaloperonospora parasitica (van Damme et al. 2008).Flavonoid accumulation was also reported in Arabidopsisroots following P. brassicae infection and was associated with
the modulation of auxin efflux (Pasold et al. 2010). The ligninbiosynthesis pathway was also affected; however, becausegenes involved in the same biosynthesis step showedconflicting differential regulations, the physiological impactof this pathway is unclear. Lastly, the expression ofgenes involved in isoprenoid and wax biosyntheses weredown-regulated.
Analysis of the data also indicated that P. brassicae chal-lenge significantly targeted several plant hormone signalingand stress response pathways. The down-regulation of genesencoding proteins involved in jasmonic acid (JA) biosynthe-sis, such as the lipoxygenase LOX2 (At3g45140), in the JAsignaling pathway, such as the desaturase SSI2 (At2g43710),or jasmonate-inducible genes such as beta-glucosidase BG1(At1g52400), jacalin lectin proteins (At3g16450, At3g16470), hydroperoxide lyase HPL1 (At4g15440), and the GH3 fam-ily member JAR1 (At2g46370) suggested a down-regulationof the JA pathway at 2 and 7 dpi. The gene encodingWRKY70(At3g56400), a transcription factor which is well known tosuppress jasmonic acid responses (Li et al. 2006), was up-regulated at 7 dpi. Interestingly, in contrast, three ethylene(ET)-related genes involved in either synthesis, such as 1-aminocyclopropane-1-carboxylic acid (ACC) synthase(At1g03400) and ACC oxidase (At5g43440), or responsewere up-regulated at 7 dpi.
Several genes related to the acid salicylic (SA) pathwaywere also induced, such as the isochorismate synthase ICS1(At1g74710) involved in SA biosynthesis and the lipase-likeprotein PAD4 (At3g52430) and two NPR1-interacting pro-teins—NIMIN1 (At1g02450) and NIMIN2 (At3g25882)—components of this defense signaling pathway. Furthermore,the genes SSI2 (At2g43710) and JAR1 (At2g46370), previ-ously shown to negatively interact with the SA pathway(Thatcher et al. 2005), were down-regulated.
Cell division and expansion regulation in responseto eH infection
Several genes involved in growth and cell cycle control,including cellular organization and cell division, were alsodifferentially expressed, mainly at 7 dpi (Fig. 6 and ESMTable S2-E). Furthermore, three members of fasciclin-likearabinogalactan proteins, involved in cell adhesion, werealso repressed at 7 dpi. Numerous genes involved in cellwall modification were differentially expressed in the plantsinoculated with the isolate eH, such as expansins and xylo-glucan endotransglycosylases, which were down-regulatedfrom 2 dpi. Pectinesterases were mainly up-regulated at7 dpi. Genes involved in cell wall degradation such as β-1,4-endoglucanase, glycosyl hydrolases, polygalacturonase,and pectate lyase were also differentially expressed.
P. brassicae inoculation modulated the stress hormoneresponse pathway (JA, ET, SA), but plant host physiology
Funct Integr Genomics (2013) 13:191–205 199

also experienced specific shifts in auxin and cytokininresponses as well. Twelve auxin-related genes were differ-entially expressed following infection by P. brassicae iso-late eH. Several auxin-related genes were differentiallyexpressed at 1 dpi, and their number increased with theinfection. These include genes involved in auxin synthesis,such as nitrilase NIT1 (At3g44310) and myrosinase-bindingproteins (At2g39310, At2g39330), as well as auxin trans-port and response, and these were mostly down-regulated.Only three auxin-related genes were up-regulated at 7 dpi.Two genes involved in cytokinin metabolism were repressedat 7 dpi: the isopentenyltransferase IPT9 (At5g20040), in-volved in cytokinin biosynthesis, and the response regulatorARR4 (At1g10470).
What are the differences between partial clubroot resistanceand susceptibility responses?
Host’s primary metabolism regulation
Thirteen percent of all the genes that are differentiallyexpressed between eH and e2 responses are predicted tofunction in primary metabolism. Almost all of them werefound to be e2-specific or e2-enhanced regulations (ESMTable S2-B). As reported above, several genes involved inphotosynthesis were repressed by eH at 7 dpi. Among those,the gene GUN4 (At3g59400) involved in tetrapyrrole bio-synthesis was found to be more repressed by e2 than by eH,and four other genes (At5g24120, At5g13630, At1g58290,and At2g21330) involved in tetrapyrrole biosynthesis, pho-tosynthesis regulation, and Calvin cycle were specificallyrepressed by e2. Similarly, the e2-specific induction of DPE(At2g40840) and the e2-enhanced induction of PWD(At5g26570), both involved in starch degradation, may sug-gest that e2 infection could result in an enhanced starchdegradation process. The level of induction of the geneencoding the pyruvate decarboxylase PDC1 (At5g54960)was lower in the eH response, suggesting that the metabolicshift from aerobic to anaerobic fermentation associated withP. brassicae inoculation reported in the first microarraycomparisons was also less pronounced in the partial resistantresponse than in the susceptible one.
Transcription factor regulation
Several putative transcription factors, representing almost11 % of the differentially expressed genes, showed differ-ential expression depending on response type. Seven tran-scription factors belonging to the WRKY, MYB, bZIP, andzinc finger families were specifically repressed by e2 infec-tion, and two were specifically induced by eH infection(WRK46 and At5g10380 coding a C3HC4-type RINGfinger protein).
Host defense responses
Compared to the gene expression patterns observed in re-sponse to eH, defense responses upon inoculation with themore aggressive isolate e2 were lower. Six percent of the geneswhich were differentially expressed between eH- and e2-inoc-ulated plants are involved in signal transduction. Three genescoding kinases and three genes coding calmodulin-bindingproteins were repressed specifically by infection with the iso-late e2. Two genes coding protein kinase were also inducedspecifically by e2. One gene coding a calmodulin, one DUFreceptor kinase, and one LRR-containing receptor kinase werespecifically induced by eH. The second largest functional class(15 %) contained genes involved in cell rescue and defense.Approximately half of these genes were previously shown tobe induced during abiotic stress and were mainly induced inthe e2-inoculated plants. The others have been frequently de-scribed during plant–pathogen interactions, such as genes in-volved in the removal of reactive oxygen species (glutathioneperoxidase, peroxidase, catalases, and glutathione-S-transferase) or genes encoding pathogenesis-related proteins(thaumatin and defensin). Few genes involved in secondarymetabolism such as the phenylpropanoid and the isoprenoidbiosynthesis pathways were differentially expressed betweeneH and e2 responses. Two genes involved in the phenylpropa-noid pathway displayed e2-specific or e2-enhanced induction.The transcript levels of the genes At1g06570 and At4g32770encoding 4-hydroxyphenylpyruvate dioxygenase and tocoph-erol cyclase, respectively, were specifically repressed in re-sponse to e2, suggesting that this regulation might beinvolved in susceptibility. Lastly, the repression of the CER1gene (At1g022050) involved in wax biosynthesis was en-hanced in response to eH, suggesting that this regulation couldbe involved in partial resistance.
At 7 dpi, several JA-related genes were found to be specif-ically induced by e2 (ESM Table S2-D and Fig. S3), such asthe JA biosynthetic genes LOX2 (At3g45140), encoding lip-oxygenase, and AOS (At5g46250), encoding allene oxidesynthase, and the JA-inducible genes BG1 (At1g52400)encoding a beta-glucosidase and CYP81D1 (At3g28740).The induction of the SA pathway appeared to be enhancedin eH response as the lipase-like protein PAD4 (At3g52430)and the NPR1-interacting protein NIMIN2 (At3g25882)inductions were found to be clearly specific or enhanced inresponse to eH. e2-specific repression, at the transcriptionallevel of few ethylene-related genes in at least one replicate(At5g25190, At5g61590, At5g47220, and At2g27050) maysuggest also an enhanced ET pathway in eH response.
Cell division and expansion regulation
Four genes involved in cell growth and cycle control displaye2-specific or e2-enhanced induction: the annexin ANN4
200 Funct Integr Genomics (2013) 13:191–205

(At2g38750), the expansin EXP16 (At3g55500), acaldesmon-related protein (At1g52410), and a nodulinmtN3 family protein (At5g23660). The genes At4g02330encoding a putative pectinesterase and FLA9 (At1g03870)encoding a fasciclin-like arabinogalactan protein were spe-cifically repressed in the e2 response. The gene SEN4(At4g30270) encoding an endo-xyloglucan endo1,4-β glu-canase was more repressed by e2 than by eH.
Lastly, several auxin-related genes were differentiallyaffected by eH and e2 isolates in at least one replicate.These include genes involved in auxin biosynthesis, suchas nitrilase NIT1 (At3g44310) and myrosinase-binding pro-teins (At1g52000, At2g39330), which were more repressedin response to eH than to e2. Genes involved in auxinresponse (At1g16510, At2g33830) were also repressed inresponse to the eH isolate. In particular, the gene At2g33830encoding a dormancy/auxin-associated protein, previouslyreported as induced by eH inoculation, showed lower ex-pression in response to eH than to e2.
Discussion
The identification of genes regulated in partial clubroot resis-tance responses represents a major challenge for understand-ing the basis of partial quantitative resistance. Genome-widecomparative transcriptional analyses revealed here major dif-ferential gene expressions including a reduced or delayedmetabolic diversion by the pathogen, an earlier and/or stron-ger induction of classical defense responses, and an activeinhibition of cell enlargement and proliferation in the clubrootpartial resistance response compared to the susceptible one.
A relatively small proportion of genes displayed signifi-cant changes in expression during the partial resistanceresponse to the P. brassicae isolate eH. This result is inagreement with the earlier transcriptomics or proteomicsworks carried out at the early stages of host–pathogen inter-action on fully susceptible Brassicaceae accessions(Agarwal et al. 2011; Devos et al. 2006; Cao et al. 2008)and contrasts with the results of Siemens et al. (2006) whoreported high numbers of differentially expressed genes atgreater fold change during the second stage of the disease.Together, these results suggest that during the asymptomaticphase of the P. brassicae life cycle, fewer morphologicaland physiological changes occur in the host compared withthe secondary stage, when the host roots exhibit growinggalls. Expression pattern comparisons between non-inoculated and eH-inoculated plants revealed an initial hostresponse from 1 dpi that became increasingly complex.Relatively few genes were differentially expressed at 1 and2 dpi, during the first contact between primary zoosporesand root hairs and the development of primary plasmodia,and most were components of a general stress response.
Most of the metabolic changes and defense systems specificto pathogen response were only triggered at 7 dpi, whensecondary infection in the cortex is initiated. This increasingresponse pattern sharply contrasts with the decreasing hostresponse to infection by P. brassicae observed in a suscep-tible Arabidopsis accession by Agarwal et al. (2011) and,thus, could be a key component of partial resistance.
The pathogenesis process leads to reprogrammingof the host’s primary metabolism
First, this study showed that upon inoculation with P. bras-sicae, the host’s primary metabolism underwent majorreprogramming (Fig. 6), in particular with the repressionof genes involved in the photochemical processes of photo-synthesis and the Calvin cycle in infected plants, suggestinga low de novo carbohydrate production in leaves. This israther coherent with the model proposed by Devos et al.(2006) where a leaf growth decrease coincides with thebeginning of secondary infection. Together with the con-comitant repression of genes involved in starch biosynthesisand the induction of genes involved in starch degradationand sugar transport (Fig. 6), those data are consistent withthe accepted model where leaf carbon assimilates are real-located to the infected root sink (Keen and Williams 1969;Evans and Scholes 1995). This flow toward the productionof glucose was previously suggested in the proteome andtranscriptome analyses of the susceptible ecotype Col-0upon P. brassicae infection (Devos et al. 2006; Siemens etal. 2006). Furthermore, the suppression of invertase activity,which hydrolyzes sucrose into hexose monomers, usingtransgenic Arabidopsis lines leads to clearly reduced club-root symptoms (Siemens et al. 2011).
Energy production mechanisms were also altered upon P.brassicae inoculation with the repression of cellular respi-ration processes and the induction of glycolysis and ethanolfermentation (Fig. 6). The infection appears to have induceda metabolic shift at 7 dpi from aerobic to anaerobic fermen-tation. This switch was also observed in the A. thaliana–Agrobacterium tumefasciens interaction (Deeken et al.2006). As a result of diffusional limitations due to gallformation, cells in the infected tissues may easily becomehypoxic and switch to fermentative energy metabolism. Asecond hypothesis was suggested by Koch et al. (2000) whoshowed that alcohol dehydrogenase ADH1, a main regula-tory enzyme of ethanol fermentation, responds to sugars atphysiological concentrations in fully oxygenated maize roottips. The accumulation of sugars at the infection sites mightthus induce a hypoxia-like response and consequently forceplant cells to switch to fermentative energy metabolism.
These metabolic changes occurred in both susceptibleand partial resistance responses. However, several generegulations related to photosynthesis and starch degradation
Funct Integr Genomics (2013) 13:191–205 201

suggest that the consequences on host primary metabolismwere more dramatic in the susceptible response than in thepartial resistance one. Consistent with these observations,Wagner et al. (2012) showed in B. napus that the primarymetabolism of resistant genotypes was not much affectedcompared to susceptible ones in response to P. brassicaeinfection. Hence, the partial resistance response may beassociated with a reduced or delayed metabolic diversionby the pathogen. However, we cannot conclude yet whetherthis regulation constitutes the cause, by retarding plasmodiagrowth in host cells, or the result of partial clubrootresistance.
Defense responses were induced earlier or at increasedlevels during the partial resistance response
The identification of genes differentially expressed in thepartial resistance response to P. brassicae demonstrated theactivation of defense responses common to the basal de-fense and R-mediated resistance responses (Hammond-Kosack and Parker 2003; Fig. 6). Moreover, a comparisonof eH and e2 responses at 7 dpi showed that several genesinvolved in defense mechanisms specific to the pathogeninfection response were activated or induced at a higherlevel in response to eH (i.e., partial resistance response). Inresponse to the e2 isolate (i.e., susceptibility response), theywere either not induced at all or induced at significantlylower levels. Instead, response to e2 included a specific orenhanced activation of the components of the general stressresponse, such as those observed in eH-inoculated plants at1 and 2 dpi. In agreement with these results, both Agarwal etal. (2011) and Siemens et al. (2006) reported that during theinfection of a susceptible Arabidopsis accession by P. bras-sicae, few defense and disease resistance responses wereactivated or were even strongly down-regulated. It is con-sequently tempting to speculate, by analogy to the proposedhypothesis for incompatible interactions, that stronger orearlier signaling events enable eH-inoculated plants to delayand/or attenuate the effects of virulence factors (Tao et al.2003; Poland et al. 2009).
Following pathogen attack, early defense signalingevents are amplified through the generation of secondarysignaling molecules, such as SA, JA, and ET, which activatedefenses both locally, at the site of infection, and systemat-ically in non-infected tissues. We found here that both theSA and ET pathways were induced during the partial resis-tance response, whereas the JA pathway was repressed(Fig. 6). The involvement of the SA, JA, or the ET pathwayin the Brassicaceae–P. brassicae pathosystem has been pre-viously described. In Chinese cabbage, a highly susceptiblehost. JA levels increased during club development and maybe involved in the up-regulation of nitrilase, myrosinase,and tryptophan oxidase, enzymes involved in IAA synthesis
(Grsic et al. 1999). Variations in the concentration of ACC,the direct precursor of ET, were observed in infectedChinese cabbage roots during the initiation of secondaryinfection (Devos et al. 2005). Further evidence for theinvolvement of the ET and JA pathways in gall formationwas also provided by mutant analyses (Siemens et al. 2002,2006; Devos et al. 2006). In addition, transcriptomic analy-ses on the Arabidopsis susceptible accession Col-0 at theearlier and later stages of the infection showed the inductionof the JA pathway and the repression of the SA and ETpathways (Siemens et al. 2006; Agarwal et al. 2011).Pretreatment of Arabidopsis plants with salicylic acid wasable to reduce the susceptibility to P. brassicae (Agarwal etal. 2011). This is consistent with our results where repres-sion of the JA pathway and induction of the ET and SApathways were associated with a reduction in symptomseverity.
Partial resistance is associated with an inhibitionof cell division and expansion
Lastly, we identified several genes which could be involved inclubroot-induced uncontrolled cell division and expansion,such as genes controlling cytoskeleton dynamics, cell adhe-sion, and cell wall modifications (Fig. 6). As expected, mostof these genes were differentially expressed at 7 dpi, whensecondary infection in the cortex is initiated. Furthermore,most expansins were also down-regulated at 7 dpi, whichwould consequently lead to reduced galls.
The intrinsic characteristics of clubroot disease point toan involvement of the plant hormones cytokinin and auxin.A role for cytokinins (Dekhuijzen and Overeem 1971;Devos et al. 2005; Muller and Hilgenberg 1986; Siemenset al. 2006) and auxins was established in gall development(Grsic et al. 1999; Ludwig-Muller et al. 1993, 1999, 2009;Neuhaus et al. 2000) as well as in the early stage of infection(Devos et al. 2006; Agarwal et al. 2011). The current studyalso supports a possible role for cytokinins in early infectionevents with the repression of cytokinin biosynthesis upon P.brassicae infection. Furthermore, consistent with our micro-array results carried out on partial resistance response, trans-genic plants with lower cytokinin levels were found to bemore tolerant to clubroot (Siemens et al. 2006). Host auxinmetabolism is redirected toward the synthesis of more auxinthrough the nitrilase pathway (Grsic-Rausch et al. 2000) asclubroot plasmodia act as a strong sink for auxins. Siemenset al. (2006) reported the expression induction of the genesencoding nitrilases 1 and 2 during club development in thesusceptible accession Col-0. Moreover, Devos et al. (2006)showed, at the proteome level, the upregulation of myrosi-nase and myrosinase-binding protein at 4 dpi in the suscep-tible accession Col-0. In B. rapa, the level of expression ofmyrosinase increased in infected roots compared with
202 Funct Integr Genomics (2013) 13:191–205

controls (Grsic et al. 1999). In our microarray analysis, nu-merous genes involved in host auxin biosynthesis as well asauxin transport and response were down-regulated in eH-inoculated plants (Fig. 6). The down-regulation of this path-way is consistent with the reduced gall formation in the partialresistant response. In agreement with this result, a nitrilase 1mutant nit1 was shown to have reduced root gall size andlower free IAA content in clubs (Grsic-Rausch et al. 2000;Neuhaus et al. 2000), and transgenic plants reduced in nitrilase2 showed slower development of root galls (Neuhaus et al.2000). Consequently, differential regulation of metabolicpathways related to the development of clubroot symptomsin eH-inoculated plants is consistent with reduced gall forma-tion and suggests the existence of an as yet unknown mech-anism associated with the reduction of cell enlargement andproliferation in the partial resistance response.
Further work on these pathways, such as their geneticmanipulation in A. thaliana transgenic plants or quantifica-tion of gene expression in a range of Arabidopsis andBrassicas, showing extreme and intermediate levels of re-sistance to clubroot, will provide insights into the mecha-nisms involved in partial clubroot resistance.
Acknowledgments We acknowledge our colleagues of OUEST-Génopole® for technical assistance. This work was supported by theFrench National Institute for Agronomic Research (INRA). MélanieJubault was a PhD student funded by the French Ministry of Research.
Open Access This article is distributed under the terms of the CreativeCommons Attribution License which permits any use, distribution, andreproduction in any medium, provided the original author(s) and thesource are credited.
References
AbuQamar S, Chen X, Dhawan R, Bluhm B, Salmeron J, Lam S,Dietrich RA, Mengiste T (2006) Expression profiling andmutant analysis reveals complex regulatory networks in-volved in Arabidopsis response to Botrytis infection. Plant J48(1):28–44
Agarwal A, Kaul V, Faggian R, Rookes JE, Ludwig-Muller J, CahillDM (2011) Analysis of global host gene expression during theprimary phase of the Arabidopsis thaliana–Plasmodiophora bras-sicae interaction. Funct Plant Biol 38(6):462–478
Alix K, Lariagon C, Delourme R, Manzanares-Dauleux MJ (2007)Exploiting natural genetic diversity and mutant resources ofArabidopsis thaliana to study the A. thaliana–Plasmodiophorabrassicae interaction. Plant Breed 126(2):218–221
Allemeersch J, Durinck S, Vanderhaeghen R, Alard P, Maes R, SeeuwsK, Bogaert T, Coddens K, Deschouwer K, Van Hummelen P,Vuylsteke M, Moreau Y, Kwekkeboom J, Wijfjes AHM, May S,Beynon J, Hilson P, Kuiper MTR (2005) Benchmarking theCATMA microarray. A novel tool for Arabidopsis transcriptomeanalysis. Plant Physiol 137(2):588–601
Boyd LA (2006) Can the durability of resistance be predicted? J SciFood Agric 86(15):2523–2526
Boyes DC, Zayed AM, Ascenzi R, McCaskill AJ, Hoffman NE, DavisKR, Gorlach J (2001) Growth stage-based phenotypic analysis of
Arabidopsis: a model for high throughput functional genomics inplants. Plant Cell 13(7):1499–1510
Brun H, Chevre AM, Fitt BDL, Powers S, Besnard AL, Ermel M,Huteau V, Marquer B, Eber F, Renard M, Andrivon D (2010)Quantitative resistance increases the durability of qualitative re-sistance to Leptosphaeria maculans in Brassica napus. NewPhytol 185(1):285–299
Cao T, Srivastava S, Rahman MH, Kav NNV, Hotte N, Deyholos MK,Strelkov SE (2008) Proteome-level changes in the roots ofBrassica napus as a result of Plasmodiophora brassicae infection.Plant Sci 174(1):97–115
Crowe ML, Serizet C, Thareau V, Aubourg S, Rouze P, Hilson P,Beynon J, Weisbeek P, Hummelen P, Reymond P, Paz-Ares J,Nietfeld W, Trick M (2003) CATMA: a complete ArabidopsisGST database. Nucleic Acids Res 31(1):156–158
de Jong M, van Breukelen B, Wittink FR, Menke FLH, Weisbeek PJ,Van den Ackerveken G (2006) Membrane-associated transcriptsin Arabidopsis; their isolation and characterization by DNAmicroarray analysis and bioinformatics. Plant J 46(4):708–721
Deeken R, Engelmann JC, Efetova M, Czirjak T, Muller T, KaiserWM, Tietz O, Krischke M, Mueller MJ, Palme K, Dandekar T,Hedrich R (2006) An integrated view of gene expression andsolute profiles of Arabidopsis tumors: a genome-wide approach.Plant Cell 18(12):3617–3634
Dekhuijzen HM, Overeem JC (1971) The role of cytokinins in clubrootformation. Physiol Plant Pathol 1:151–161
Devos S, Vissenberg K, Verbelen JP, Prinsen E (2005) Infection ofChinese cabbage by Plasmodiophora brassicae leads to a stimu-lation of plant growth: impacts on cell wall metabolism andhormone balance. New Phytol 166(1):241–250
Devos S, Laukens K, Deckers P, Straeten DV, Beeckman T, Inze D,Onckelen H, Witters E, Prinsen E (2006) A hormone and pro-teome approach to picturing the initial metabolic events duringPlasmodiophora brassicae infection on Arabidopsis. Mol PlantMicrobe Interact 19(12):1431–1443
Diederichsen E, Frauen M, Linders EGA, Hatakeyama K, HiraiM (2009) Status and perspectives of clubroot resistancebreeding in Crucifer crops. J Plant Growth Regul 28(3):265–281
Ditt RF, Kerr KF, Figueiredo P, Delrow J, Comai L, Nester EW (2006) TheArabidopsis thaliana transcriptome in response to Agrobacteriumtumefaciens. Mol Plant Microbe Interact 19(6):665–681
Dixon GR (2009) The occurrence and economic impact ofPlasmodiophora brassicae and clubroot disease. J Plant GrowthRegul 28(3):194–202
Donald C, Porter I (2009) Integrated control of clubroot. J PlantGrowth Regul 28(3):289–303
Evans JL, Scholes JD (1995) How does clubroot alter the regulation ofcarbon metabolism in its host? Asp Appl Biol 42:125–132
Fähling M, Graf H, Siemens J (2003) Pathotype separation ofPlasmodiophora brassicae by the host plant. J PhytopatholPhytopathol Z 151(7–8):425–430
Gravot A, Grillet L, Wagner G, Jubault M, Lariagon C, Baron C, DeleuC, Delourme R, Bouchereau A, Manzanares-Dauleux MJ (2011)Genetic and physiological analysis of the relationship betweenpartial resistance to clubroot and tolerance to trehalose inArabidopsis thaliana. New Phytol 191(4):1083–1094
Gravot A, Deleu C, Wagner G, Lariagon C, Lugan R, Todd C,Wendehenne D, Delourme R, Bouchereau A, Manzanares-Dauleux MJ (2012) Arginase induction represses gall develop-ment during clubroot infection in Arabidopsis. Plant Cell Physiol53(3):901–911
Grsic S, Kirchheim B, Pieper K, Fritsch M, Hilgenberg W, Ludwig-Muller J (1999) Induction of auxin biosynthetic enzymes byjasmonic acid and in clubroot diseased Chinese cabbage plants.Physiol Plant 105(3):521–531
Funct Integr Genomics (2013) 13:191–205 203
Grsic-Rausch S, Kobelt P, Siemens JM, Bischoff M, Ludwig-Muller J(2000) Expression and localization of nitrilase during symptomdevelopment of the clubroot disease in Arabidopsis. Plant Physiol122(2):369–378
Hammond-Kosack KE, Parker JE (2003) Deciphering plant–pathogencommunication: fresh perspectives for molecular resistance breed-ing. Curr Opin Biotechnol 14(2):177–193
Hilson P, Allemeersch J, Altmann T, Aubourg S, Avon A, Beynon J,Bhalerao RP, Bitton F, Caboche M, Cannoot B, Chardakov V,Cognet-Holliger C, Colot V, Crowe M, Darimont C, Durinck S,Eickhoff H, de Longevialle AF, Farmer EE, Grant M, KuiperMTR, Lehrach H, Leon C, Leyva A, Lundeberg J, Lurin C,Moreau Y, Nietfeld W, Paz-Ares J, Reymond P, Rouze P,Sandberg G, Segura MD, Serizet C, Tabrett A, Taconnat L,Thareau V, Van Hummelen P, Vercruysse S, Vuylsteke M,Weingartner M, Weisbeek PJ, Wirta V, Wittink FRA, Zabeau M,Small I (2004) Versatile gene-specific sequence tags for Arabidopsisfunctional genomics: transcript profiling and reverse genetics appli-cations. Genome Res 14(10B):2176–2189
Huibers RP, de Jong M, Dekter RW, Van den Ackerveken G (2009)Disease-specific expression of host genes during downy mildewinfection of Arabidopsis. Mol Plant–Microbe Interact 22(9):1104–1115
Ingram DS, Tommerup IC (1972) The life history of Plasmodiophorabrassicae Woron. Proc R Soc London, Ser B 180(1058):103–112
Jammes F, Lecomte P, Almeida-Engler J, Bitton F, Martin-MagnietteM-L, Renou JP, Abad P, Favery B (2005) Genome-wide expres-sion profiling of the host response to root-knot nematode infectionin Arabidopsis. Plant J 44(3):447–458
Jubault M, Hamon C, Gravot A, Lariagon C, Delourme R, BouchereauA, Manzanares MJ (2008a) Differential regulation of root argininecatabolism and polyamine metabolism in clubroot-susceptible andpartially resistant Arabidopsis genotypes. Plant Physiol 146(4):2008–2019
Jubault M, Lariagon C, Simon M, Delourme R, Manzanares-DauleuxMJ (2008b) Identification of quantitative trait loci controllingpartial clubroot resistance in new mapping populations ofArabidopsis thaliana. Theor Appl Genet 117(2):191–202
Keen NT, Williams PH (1969) Translocation of sugars into infectedcabbage tissues during clubroot development. Plant Physiol 44(5):748–754
Koch KE, Ying Z, Wu Y, Avigne WT (2000) Multiple paths of sugar-sensing and a sugar/oxygen overlap for genes of sucrose andethanol metabolism. J Exp Bot 51:417–427
Li J, Brader G, Kariola T, Palva ET (2006) WRKY70 modulates theselection of signaling pathways in plant defense. Plant J 46(3):477–491
Ludwig-Muller J, Bendel U, Thermann P, Ruppel M, Epstein E,Hilgenberg W (1993) Concentrations of indole-3-acetic acid inplants of tolerant and susceptible varieties of Chinese cabbageinfected with Plasmodiophora brassicae Woron. New Phytol 125(4):763–769
Ludwig-Muller J, Bennett RN, Kiddle G, Ihmig S, Ruppel M,Hilgenberg W (1999) The host range of Plasmodiophora brassi-cae and its relationship to endogenous glucosinolate content. NewPhytol 141(3):443–458
Ludwig-Muller J, Prinsen E, Rolfe SA, Scholes JD (2009) Metabolismand plant hormone action during clubroot disease. J Plant GrowthRegul 28(3):229–244
Manzanares-Dauleux MJ, Delourme R, Baron F, Thomas G (2000a)Mapping of one major gene and of QTLs involved in resistance toclubroot in Brassica napus. Theor Appl Genet 101(5/6):885–891
Manzanares-Dauleux MJ, Divaret I, Baron F, Thomas G (2000b)Evaluation of French Brassica oleracea landraces for resistanceto Plasmodiophora brassicae. Euphytica 113(3):211–218
Manzanares-Dauleux MJ, Delourme R, Glory P, Giboulot A, ThomasG (2003) Mapping QTLs and major resistance genes to clubroot(Plasmodiophora brassicae) in Brassica napus. 13th CruciferGenetics Workshop, UC Davis, California, March 23–26
Marathe R, Guan Z, Anandalakshmi R, Zhao HY, Dinesh-Kumar SP(2004) Study of Arabidopsis thaliana resistome in response tocucumber mosaic virus infection using whole genome microarray.Plant Mol Biol 55(4):501–520
Martin-Magniette ML, Aubert J, Cabannes E, Daudin JJ (2005)Evaluation of the gene-specific dye bias in cDNA microarrayexperiments. Bioinformatics 21(9):1995–2000
Mazarei M, Liu W, Al-Ahmad H, Arelli PR, Pantalone VR, StewartCN (2011) Gene expression profiling of resistant and susceptiblesoybean lines infected with soybean cyst nematode. Theor ApplGenet 123(7):1193–1206
Mithen R, Magrath R (1992) A contribution to the life history ofPlasmodiophora brassicae: secondary plasmodia developmentin root galls of Arabidopsis thaliana. Mycol Res 96(10):877–885
Muller P, Hilgenberg W (1986) Isomers of zeatin and zeatin riboside inclubroot tissue: evidence for trans-zeatin biosynthesis byPlasmodiophora brassicae. Physiol Plant 66(2):242–250
Neuhaus K, Grsic-Rausch S, Sauerteig S, Ludwig-Muller J (2000)Arabidopsis plants transformed with nitrilase 1 or 2 in antisensedirection are delayed in clubroot development. J Plant Physiol156(5/6):756–761
Palloix A, Ayme V, Moury B (2009) Durability of plant major resis-tance genes to pathogens depends on the genetic background,experimental evidence and consequences for breeding strategies.New Phytol 183(1):190–199
Pasold S, Siegel I, Seidel C, Ludwig-Muller J (2010) Flavonoid accu-mulation in Arabidopsis thaliana root galls caused by the obligatebiotrophic pathogen Plasmodiophora brassicae. Mol Plant Pathol11(4):545–562
Piao ZY, Ramchiary N, Lim YP (2009) Genetics of clubroot resistancein Brassica species. J Plant Growth Regul 28(3):252–264
Poland JA, Balint-Kurti PJ, Wisser RJ, Pratt RC, Nelson RJ (2009)Shades of gray: the world of quantitative disease resistance.Trends Plant Sci 14(1):21–29
Puskas LG, Zvara A, Hackler LJr, Van Hummelen P (2002) RNAamplification results in reproducible microarray data with slightratio bias. Biotechniques 32(6):1330–1340
Puzio PS, Newe M, Grymaszewska G, Ludwig-Muller J, GrundlerFMW (2000) Plasmodiophora brassicae-induced expression ofpyk20, an Arabidopsis thaliana gene with glutamine-rich domain.Physiol Mol Plant Pathol 56(2):79–84
Radwan O, Liu Y, Clough SJ (2011) Transcriptional analysis of soybeanroot response to Fusarium virguliforme, the causal agent of suddendeath syndrome. Mol Plant–Microbe Interact 24(8):958–972
Rocherieux J, Glory P, Giboulot A, Boury S, Barbeyron G, Thomas G,Manzanares-Dauleux MJ (2004) Isolate-specific and broad-spectrum QTLs are involved in the control of clubroot inBrassica oleracea. Theor Appl Genet 108(8):1555–1563
Siemens J, Nagel M, Ludwig-Muller J, Sacristán MD (2002) Theinteraction of Plasmodiophora brassicae and Arabidopsis thali-ana: parameters for disease quantification and screening of mu-tant lines. J Phytopathol 150(11/12):592–605
Siemens J, Keller I, Sarx J, Kunz S, Schuller A, Nagel W, SchmullingT, Parniske M, Ludwig-Muller J (2006) Transcriptome analysis ofArabidopsis clubroots indicate a key role for cytokinins in diseasedevelopment. Mol Plant–Microbe Interact 19(5):480–494
Siemens J, Gonzalez MC, Wolf S, Hofmann C, Greiner S, Du YJ,Rausch T, Roitsch T, Ludwig-Muller J (2011) Extracellular inver-tase is involved in the regulation of clubroot disease inArabidopsis thaliana. Mol Plant Pathol 12(3):247–262
Somé A, Manzanares MJ, Laurens F, Baron F, Thomas G, Rouxel F(1996) Variation for virulence on Brassica napus L. amongst
204 Funct Integr Genomics (2013) 13:191–205

Plasmodiophora brassicae collections from France and derivedsingle-spore isolates. Plant Pathol 45(3):432–439
Swarbrick PJ, Huang K, Liu G, Slate J, Press MC, Scholes JD (2008)Global patterns of gene expression in rice cultivars undergoing asusceptible or resistant interaction with the parasitic plant Strigahermonthica. New Phytol 179(2):515–529
Tao Y, Xie ZY, Chen WQ, Glazebrook J, Chang HS, Han B, Zhu T,Zou GZ, Katagiri F (2003) Quantitative nature of Arabidopsisresponses during compatible and incompatible interactions withthe bacterial pathogen Pseudomonas syringae. Plant Cell 15(2):317–330
Thatcher LF, Anderson JP, Singh KB (2005) Plant defence responses:what have we learnt from Arabidopsis? Funct Plant Biol 32(1):1–19
Thilmony R, UnderwoodW, He SY (2006) Genome-wide transcriptionalanalysis of the Arabidopsis thaliana interaction with the plant path-ogen Pseudomonas syringae pv. tomato DC3000 and the humanpathogen Escherichia coli O157:H7. Plant J 46(1):34–53
Thimm O, Blasing O, Gibon Y, Nagel A, Meyer S, Kruger P, Selbig J,Muller LA, Rhee SY, Stitt M (2004) MAPMAN: a user-driventool to display genomics data sets onto diagrams of metabolicpathways and other biological processes. Plant J 37(6):914–939
van Damme M, Huibers RP, Elberse J, Van den Ackerveken G (2008)Arabidopsis DMR6 encodes a putative 2OG-Fe(II) oxygenase thatis defense-associated but required for susceptibility to downymildew. Plant J 54(5):785–793
Wagner G, Charton S, Lariagon C, Laperche A, Lugan R, Hopkins J,Frendo P, Bouchereau A, Delourme R, Gravot A, Manzanares-Dauleux MJ (2012) Metabotyping: a new approach to investigaterapeseed (Brassica napus L.) genetic diversity in the metabolicresponse to clubroot infection. Mol Plant–Microbe Interact 25(11):1478–1491
Wallenhammar AC (1996) Prevalence of Plasmodiophora brassicae ina spring oilseed rape growing area in central Sweden and factorsinfluencing soil infestation levels. Plant Pathol 45(4):710–719
Funct Integr Genomics (2013) 13:191–205 205