part vii: searchlight reports: seeing cost trends and ... · pdf filedouble this volume of...
TRANSCRIPT

Copyright © 2016
All rights reserved
Part VII: SearchLight Reports: Seeing Cost Trends And
Quality Outcomes More Clearly

Copyright © 2016
All rights reserved
VII - 1
Preface
The online SearchLight Reporting capability that is made available to Panels on a 24/7 basis places an immense treasure
trove of data at their fingertips.
The principle source of data is claims data from three different CareFirst claims processing platforms. All such data is
entered into the CareFirst data warehouse that supports the SearchLight Reporting process on a post adjudication basis–
meaning it has been scrubbed, corrected, checked and cross checked against industry standard coding norms as well as
demographic information on individual Members. It is as “correct” to a 99 percent+ accuracy standard.
It is useful to know just how much data is available. CareFirst receives 36 million claims a year for all Members with an
average of two to four claim lines per claim. These claims show all services rendered to all Members anywhere by any
provider. At least three years of claims data is kept online before being archived in a way that makes older claims data still
easy to retrieve.
In addition, non-claims data is stored in the CareFirst data warehouse (called CBI for CareFirst Business Intelligence). This
includes LCC and Complex Case Manager notes and data from the Care Plans of Members as well as information from
CareFirst select vendor partners in pharmacy review, behavioral health and other ancillary areas. Notes and data from other
providers contained in entries made by LCCs and Complex Case Managers in the development and implementation of Care
Plans is also included.
In all, CareFirst currently has approximately 3,000 Terabytes of data in the CBI data warehouse. This is the equivalent of
300 times the entire printed collection of the Library of Congress or three million copies of the Encyclopedia Britannica.
A typical online inquiry from a PCP or NP who is part of a Panel would be to seek out one or more of the structured views
that are provided in the SearchLight Report and be able to drill down to the Member level to see the Member Health
Record that underlies the view(s). The response time to do this varies from sub-second to five seconds depending on the
inquiry. Member specific, disease specific and episode specific views are typically derived from larger patterns shown in
the reports as well as comparative views with other Panels. The system gathers and presents the views sought – whether
highly specific or sweeping in their scope – swiftly, accurately and reliably.
The navigation to any of the hundreds of views in the SearchLight Reporting package is made easy and swift by the
organization of the views into a Table of Contents that can be easily searched enabling the PCP or NP to go straight to the
view sought in a few clicks of the mouse.
All data in the SearchLight Report is governed from the point of acquisition at its source though various layers of industry
standard Audit, Balance and Control processes overseen by a full time team of data governance analysts who perform
constant checks. This activity is, in turn, overseen by a Data Stewardship Committee that is consulted when data anomalies
arise.
The underlying software used to generate SearchLight Reports is an amalgam of CareFirst developed software and third
party developed software in order to calculate all the data constructs needed to perform such functions as Member
attribution, determination of Illness Burden Scores, consolidation of all claims data for individual Members in order to
build this up from the PCP to Panel and Program wide levels. This constellation of software – nearly 20 software packages
in total – facilitates the calculation of Quality Profile Scores and the myriad of other tasks necessary to support the PCMH
and TCCI Programs, not the least of which is to calculate OIAs.
Additionally, CareFirst annually conducts internal and external audits on the validity of the processes used to calculate
OIAs – building this up from the sources of all data through all processes followed to reach the correct conclusion for each
Panel. This extensive audit review tests the validity of the data contained in CBI and how it is used to feed the calculations
that undergird the PCMH and TCCI Programs as well as the accuracy of the calculations themselves.
Finally, all CareFirst sensitive information, including SearchLight Reports, is transmitted over the web using industry
standard encryption protocols and secured connections. Access to each SearchLight Report is strictly controlled and
enforced via role based security which ensures that an individual user can see only those reports for which permission has
to assist Panels with accessing, understanding and using the data contained in SearchLight views, CareFirst has assigned a

Copyright © 2016
All rights reserved
VII - 2
trained Program Consultant to each Panel whose role is to guide and assist each Panel in their attempts to effectively use
the data and views made available to them in SearchLight. These trained professional analysts become expert in the patterns
of cost, use of service, quality of care and demographic characteristics of the Panels to whom they are assigned. Their sole
purpose is to help Panels improve their performance by command of the data they gain access to through the SearchLight
Reports.
A full SearchLight Report for a Panel is shown in the pages that follow. The data displayed is real but Member identity is
masked in order to maintain confidentiality of patient specific data.

PCMH SearchLight Report
Medical Panel ABC
Virtual Panel Composed of:
Provider Group A
Provider Group B
Provider Group C
Bonnie Beige, NP Gary Green, MD
Bob Blue, MD Theodore Lavender, MD
Ronald Brown, MD Fletch Orange, MD
S. Cornflower-Blue, MD Ray Purple, MD
Shastine Gold, MD Samuel Yellow, MD
CareFirst BlueCross BlueShield is the shared business name of CareFirst of Maryland, Inc. and Group Hospitalization and Medical Services, Inc. whichare independent licensees of the Blue Cross and Blue Shield Association. ® Registered trademark of the Blue Cross and Blue Shield Association.
®’ Registered trademark of CareFirst of Maryland, Inc. Copyright ©2016 CareFirst BlueCross BlueShield
VII - 3
Copyright © 2016
All rights reserved

Purpose and Overview of SearchLight Report
The data views that follow present the facts underlying the performance of the PCMH Medical Care Panel that is
the subject of this SearchLight Report. These various views are meant, as their name implies, to provide insight
into the patterns that matter the most - indeed, to shine a "searchlight" on these patterns so that the Panel can
increase its understanding of its own cost and quality results and maximize its chance of earning an Outcome
Incentive Award.
The report is organized into 10 distinct sections each displaying a different aspect of Panel Performance. A Panel
"HealthCheck" summary is also provided up front which serves as a dashboard that is intended to focus Panel
attention on the actionable steps it could take to improve its performance.
It is useful to keep in mind that an average PCMH Panel of 8-10 primary care provders with between 2,000 and
3,000 CareFirst attributed Members can be expected to experience total care costs for these Members in excess of
$10 million per year. These Members can be expected to have over 50,000 service encounters and produce over
double this volume of claim lines for all claims filed on their behalf. These Members can also be expected to run
the gamut of Members from those in great health to those that are seriously ill. The challenge, therefore, is to make
sense of the sheer mass of data that is available – almost all of which is based on detailed claim information that is
submitted in an ever more accurate, detailed and timely way through electronic means. For Members in case
management and care plans, clinical information is often gathered to supplement the available claims data.
Many sections of SearchLight present information on services that are part of CareFirst's Total Care and Cost
Improvement (TCCI) program. TCCI is a broad collection of services, elements of which surround and support the
PCMH program, often outside of the PCPs view. The report thus acts as a mechanism to connect the Panel with
the full experience of Panel Members and to assist PCPs in finding the most appropriate services for its Members.
All data is updated monthly by the 15th day of the month following each completed month. It is critical to
understand that a 3 month lag is built into certain claim information to allow for a sufficient run out of claims to
provide a complete and accurate picture of results. Other information is available more promptly at the end of
each month. These different timings are noted throughout the report.
It goes without saying, therefore, that when considering and understanding patterns, time becomes an important
dimension. The patterns and facts that this SearchLight Report displays are only available with the passage of
time. Hence, it is critical to understand that SearchLight is not a clinical support tool, but rather, a way to see a
longitudinal emerging picture of a whole population of Members – and then, to enable the reviewer to peer down
into sub patterns that help explain what is going on. SearchLight is not intended to serve as an Electronic Medical
Record system for tracking the care of individual Members; its purpose is to highlight patterns that an EMR system
would not reveal.
Certain comparisons are available that allow the Panel to view its own performance over time and in relation to
the performance of other Panels – including peers and all Panels in the PCMH Program. Bettering past
performance is the essence of quality improvement, if one could only see and understand past performance in its
totality and particularity. And, comparing one’s performance to others is also instructive, particularly when data is
displayed in a way that assures a "like with like" picture to the extent possible.
Central to the purposes of the various data views is the display of data that shows aggregate performance in all
settings for all Members over time. In effect, every service rendered by any provider at any time in any setting is
maintained in the database that supports the views in this report. It is, therefore, designed to show a
comprehensive, longitudinal picture of Member treatment patterns well beyond the services rendered by the
primary care providers in the Panel. This longitudinal picture of performance helps give perspective on what
patterns matter the most and where focus is most important to improve results from both a quality and cost
standpoint.
Many data views in the report have a drill down feature that permits a more detailed understanding – down to the
Member level – of patterns that may be of particular interest or significance.
In short, the report makes available data typically never seen by providers. All data is available over the web on a
virtually 24/7 basis. In this way, the report is meant to be what its name conveys - a "searchlight" that can be
shined on patterns and facts that most help the Panel manage a diverse and complex Member population over time
toward a better overall outcome that could not otherwise be so well achieved without the benefits of this
penetrating set of views.
While extensive when taken as a whole, this SearchLight Report can be easily and quickly navigated by going
directly to the section and view that is of greatest interest after reference to the Table of Contents that follows.
VII - 4
Copyright © 2016
All rights reserved

Table of Contents
I. HealthCheck Profile of Panel Performance ............................................................................................... 8
A. Effectiveness of Referral Patterns ............................................................................................................................................ 10
B Extent of Engagement in Care Coordination ............................................................................................................................ 10
C. Effectiveness of Medication Management................................................................................................................................ 10
D. Gaps in Care and Quality Deficits .............................................................................................................................................. 10
E. Consistency of Performance Within the Panel.......................................................................................................................... 10
II. Profile of Members in Panel ........................................................................................................................... 12A. Attributed Members ................................................................................................................................................................. 14
B. Average Member Age by Illness Band vs. Peers ........................................................................................................................ 14
C. Number of Members by Illness Band ........................................................................................................................................ 14
D. Percentage of Members by Illness Band ................................................................................................................................... 14
E. Member Gender by Illness Band ............................................................................................................................................... 15
F. Member Movement Across Illness Bands ................................................................................................................................. 15
G. Change YTD in Average Member Illness Burden Scores ........................................................................................................... 15
H. Members by Illness Band vs. Peers ........................................................................................................................................... 16
I. Average Member Illness Burden Scores vs. Peers .................................................................................................................... 16
J. Member Illness Band Distribution by Provider ......................................................................................................................... 16
K. Member Geographic Distribution by Zip Code ......................................................................................................................... 17
L. Profile of Band 1 - Advanced/Critical Illness - Three Key Categories ........................................................................................ 18
M. Profile of Band 2 - Multiple Chronic Illnesses - Two Key Categories ......................................................................................... 18
N. Profile of Band 3 - At Risk - Two Key Categories ....................................................................................................................... 18
O. Member Wellness - Risk Category vs. Illness Band ................................................................................................................... 19
P. Member Wellness - Movement Across Risk Categories ............................................................................................................ 20
Q. Member Wellness - by Risk Category and TCCI Program........................................................................................................... 21
R. Member Wellness - Members by Health Condition Track......................................................................................................... 22
III. Profile of Episodes of Care ............................................................................................................................. 233A. Dominant Episodes of Care - All Bands - Based on Gross Debit Dollars .................................................................................... 24
B. Dominant Episodes of Care - All Bands - Based on Gross Debits expressed as PMPM ............................................................. 25
C. Dominant Episodes of Care - Preventive/Administrative Health Encounters ........................................................................... 25
D. Dominant Episodes of Care for Band 1 - Advanced/Critical Illness ........................................................................................... 26
E. Dominant Episodes of Care for Band 2 - Multiple Chronic Illnesses ......................................................................................... 27
F. Dominant Episodes of Care for Band 3 - At Risk ....................................................................................................................... 28
IV. Key Use Patterns ................................................................................................................................................ 293A. Admissions, Readmissions and ER Visits by Hospital ................................................................................................................ 30
B. ER and Outpatient Visits and Gross Debits by Hospital ............................................................................................................ 31
C. Hospital Admissions/Readmissions by Month .......................................................................................................................... 32
D. Hospital Admission Gross Debits by Month .............................................................................................................................. 32
E. ER Visits by Month .................................................................................................................................................................... 32
F. ER Gross Debits by Month ........................................................................................................................................................ 32
G. Hospital Admissions/Readmissions by Provider........................................................................................................................ 33
H. Members with Admissions/Readmissions - All Bands ............................................................................................................... 33
I. Members with ER Visits - All Bands ........................................................................................................................................... 34
J. Top 10 Procedures in Both ASC and Outpatient Hospital Settings ........................................................................................... 34
K. Use of Urgent Care Backup (UCB) - Weekend/Weekday Visits by Illness Band ........................................................................ 35
VII - 5
Copyright © 2016
All rights reserved

Table of Contents
IV. Key Use Patterns (Cont.).....................................................................................................................................L. Use of Urgent Care Backup (UCB) - Weekend/Weekday Visits Listed by Provider ...................................................................... 35
M. Debits for Prescription Drugs by Source and Type ....................................................................................................................... 36
N. Generic Dispensing Rate for Mail/Retail Pharmacy Drugs ........................................................................................................... 36
O. Generic Dispensing Rate - Max Potential Savings ........................................................................................................................ 36
P. Generic Fill Rate for Mail/Retail Pharmacy Drugs - Provider Detail ............................................................................................. 37
Q. Generic Cost Ratios for Mail/Retail Pharmacy Drugs - Provider Detail ........................................................................................ 37
R. Mail Order Dispensing Rate for Mail/Retail Pharmacy Drugs ...................................................................................................... 38
S. Mail Order Dispensing Rate - Calculated Potential Savings ......................................................................................................... 38
T. Costliest Brand Drugs ................................................................................................................................................................... 39
U. Members with Multiple Drugs ..................................................................................................................................................... 40
V. Members with Multiple Maintenance Drugs ............................................................................................................................... 41
W. Costliest Specialty Drugs .............................................................................................................................................................. 42
V. Top 10 to 50 Lists of High Cost/High Risk/Highly Unstable Members ............................................... 433A. High Cost/High Risk Members with Multiple Indicators .............................................................................................................. 44
B. Overall PMPM $ ........................................................................................................................................................................... 45
C. Pharmacy PMPM $ ...................................................................................................................................................................... 45
D. Drug Volatility Score .................................................................................................................................................................... 46
E. Specialty Drug PMPM $ ............................................................................................................................................................... 47
F. High Rx Utilization ........................................................................................................................................................................ 47
G. Hospital Use ................................................................................................................................................................................. 48
H. Multiple Comorbidities ................................................................................................................................................................ 49
I. Gaps in Care ................................................................................................................................................................................. 50
J. Disease Instability ........................................................................................................................................................................ 51
K. Members with Adverse/High Risk Health Assessment Results..................................................................................................... 52
VI. Use of TCCI Programs.......................................................................................................................................... 533A. Profile of Members in Hospital Transition of Care (HTC) - Admissions Members and Costs ....................................................... 55
B. Profile of Members in Hospital Transition of Care (HTC) - Follow Up Care for High Risk Admissions.......................................... 55
C. Profile of Members in Complex Case Management (CCM) ......................................................................................................... 56
D. Members in Complex Case Management (CCM) - Key Measures / Outcomes ............................................................................ 56
E. CCM Members Engaged in Other TCCI Programs ....................................................................................................................... 57
F. Profile of Members in Chronic Care Coordination (CCC) ............................................................................................................. 58
G. Members in Chronic Care Coordination (CCC) - Key Measures / Outcomes................................................................................. 58
H. CCC Members Engaged in Other TCCI Programs ......................................................................................................................... 59
I. Profile of Members in Home Based Services (HBS)....................................................................................................................... 60
J. Members in Home Based Services (HBS) - Key Measures / Outcomes........................................................................................ 60
K. Profile of Members in Enhanced Monitoring Plans (EMP)........................................................................................................... 61
L. Members in Enhanced Monitoring Plans (EMP) - Key Measures / Outcomes ........................................................................... 61
M. Profile of Members in Comprehensive Medication Review (CMR) ............................................................................................ 62
N. Members in Comprehensive Medication Review (CMR) - Key Measures / Outcomes ................................................................ 62
O. Profile of Members in Community Based Programs (CBP)........................................................................................................... 63
P. Members in Community Based Programs (CBP) / Key Measures / Outcomes ........................................................................... 63
Q. Profile of Members in Pharmacy Coordination Program (RxP) .................................................................................................... 64
R. Profile of Members by Pharmacy Coordination Category............................................................................................................ 64
S. Profile of Members Using Expert Consult Program (ECP)............................................................................................................. 65
T. Profile of Members Using Centers of Distinction Program (CDP) ............................................................................................... 65
U. Summary of Care Coordination Costs for Members in TCCI Programs ........................................................................................ 65
VII - 6
Copyright © 2016
All rights reserved

Table of Contents
VII. Key Referral Patterns ...................................................................................................................................... 663A. Profile of Medical Specialist Referrals ....................................................................................................................................... 67
B. Profile of Medical Specialist Referrals by Provider.................................................................................................................... 67
C. Profile of Medical Specialist Referrals by Specialty................................................................................................................... 67
D. Profile of Procedural Specialist Referrals .................................................................................................................................. 68
E. Profile of Procedural Specialist Referrals by Provider ............................................................................................................... 68
F. Profile of Procedural Specialist Referrals by Specialty .............................................................................................................. 68
VIII. Overall Quality Score ....................................................................................................................................... 693A. Overall Panel Quality Score vs. Provider Peers ......................................................................................................................... 70
B. Degree of Panel Engagement.................................................................................................................................................... 71
C. Degree of PCP Engagement - within Panel................................................................................................................................ 72
D. Preventable Admissions and ER Visits Summary for Panel ....................................................................................................... 72
E. Diagnostics, Imaging, and Antibiotics Summary for Panel ........................................................................................................ 73
F. Chronic Care Effectiveness Summary for Panel ........................................................................................................................ 74
G. Population Health Effectiveness Summary for Panel ................................................................................................................ 75
IX. Status of Patient Care Account (PCA) .......................................................................................................... 763A. Outcome Incentive Award by Performance Year....................................................................................................................... 77
B. Outcome Incentive Awards - Summary of Performance Year................................................................................................... 79
C. Outcome Incentive Awards - Detail of Performance Year......................................................................................................... 81
D. Outcome Incentive Awards - Detail of Base Year...................................................................................................................... 83
E. Outcome Incentive Award - Savings Impact Performance Year ................................................................................................ 83
X. Ranking of Overall Performance .................................................................................................................. 843A. Panel Size Compared to Panel Peers ......................................................................................................................................... 85
B. Medical Efficiency Index ........................................................................................................................................................... 85
C. Ranking Summary by Key Measures.......................................................................................................................................... 85
D. Quality Score Ranking Summary................................................................................................................................................ 86
E. Panel Performance Metrics By Year .......................................................................................................................................... 86
F. Year over Year Measures That Matter - Key Metrics and Comparisons ................................................................................... 87
G. Measures That Matter - Key Metrics and Comparisons............................................................................................................ 88
VII - 7
Copyright © 2016
All rights reserved

I. HealthCheck Profile of Panel Performance
YTD reporting for the current Performance Year will be available on a 3 month lag. The Cumulative Quartile Performance
Ranking is calculated only when the Panel has at least three consecutive years of experience. The ranking is based on average
risk adjusted PMPM cost and quality scores across the longitudinal experience of the Panel.
The Panel HealthCheck Profile provides PCMH Panels with an overview of how they are doing in the current Performance Year.
An emphasis is placed on actionable information that is pulled from the detailed data views found within the SearchLight Report. In
this way, the data presented in the HealthCheck Profile is intended to assist Panels in identifying practical and specific areas of
focus for decreasing costs and/or improving quality.
The HealthCheck Profile concentrates on five key areas that most influence cost and quality:
• Effectiveness of Referral Patterns (weighted 35%)
• Extent of Engagement in Care Coordination (weighted 20%)
• Effectiveness of Medication Management (weighted 20%)
• Gaps in Care and Quality Deficits (weighted 10%)
• Consistency of Performance Within the Panel - % of PCPs (weighted 15%)
In so doing, the HealthCheck Profile draws upon underlying data presented in various views throughout the SearchLight Report by
pulling forward into the Profile the most relevant data that shows where action is most likely to be effective.
In effect, the Panel HealthCheck Profile is meant to be the equivalent of a periodic check up by revealing how a Panel is performing
against what is possible, as well as against other Panels. Since the goal of the PCMH Program is to help as many Panels "win" as
possible, the HealthCheck Profile is intended as an aid to this end by drawing attention to those things that if done better, could
have a beneficial impact on Panel performance. In the process, it is expected that Member care outcomes will be improved.
HealthCheck is updated monthly and typically shows data on a trailing 12 month basis.
The HealthCheck Profile is composed of five parts that add to an overall score for the Panel as a whole on a 100 point scale. This
score is compared to other Panels and to the historical pattern of the Panel. This is meant to give a quick understanding of how the
Panel is actually doing relative to its potential to better control cost and improve quality.
A drill down view is provided to show how consistent or inconsistent performance is among the Members of the Panel in
furtherance of a key goal of the PCMH/TCCI program, which is to encourage/enable Panels to attain and improve their internal
consistency of performance and to act as a coherent, high performing unit/team in the service of Member centric population health
management.
Changes over time in the Panel HealthCheck Profile are monitored by dedicated Program Consultants assigned to each sub-region
and Panel. Periodic meetings with Panels are conducted in an effort to better assure the fullest possible attention to the patterns
highlighted in the HealthCheck Profile and to the underlying views shown throughout the entire monthly Searchlight Report.
Snapshot views of Panel performance, including rankings against peers, Outcome Incentive Award metrics for the most recently
completed performance year, and performance over time are shown below. Panels are ranked from largest to smallest for Panel
Measure Panel
Panel Type
Peers (169)
Rank
Provider Type
Peers (173)
Rank
PCMH
All (281)
Rank
Provider Type
Peers (173)
Quartile
PCMH
All (281)
Quartile
Average Members 7,538 4th 75th 108th 1st 1st
Medical PMPM $588.74 144th 250th 387th 4th 4th
Average Illness Burden Score 1.88 137th 244th 381st 4th 4th
Quality Score 56.7 45th 127th 155th 2nd 2nd
Illness Burden Adjusted PMPM $297.20 55th 108th 120th 2nd 2nd
Year # 1
(2011)
Year #2
(2012)
Year #3
(2013)
Year #4
(2014)
Year #5
(2015
YTD)
Enrollment 1,739 1,742 1,632 1,636 1,323
Illness Burden Score (Raw) 2.57 3.01 3.05 3.08 3.04
Illness Burden Score (Normalized) 1.63 1.55 1.73 1.76 1.78
Total Credit $ $3,255,860 $8,065,821 $9,683,095 $9,148,262 $1,747,558
Total Debit $ $3,290,317 $7,146,176 $9,026,769 $9,932,882 $2,090,355
Savings Percentage -1.1% 11.4% -0.7% 8.6% NA
Overall Medical Trend 7.5% 6.5% 5.5% 3.5% 3.5%
Engagement Score NA 23.9/30.0 11.2/30.0 28.5/35.0 19.1/35.0
Overall Quality Score 39.0/70.0 38.8/70.0 51.0/100.0 68.4/100.0 43.2/100.0
Final OIA Percentage Point Award 0 51 38 62 55
PCP/NP Turnover 0.0% 25.0% 60.1% 0.0% 0.0%
IB Adjusted PMPM (Medical) $406.67 $466.88 $521.11 $432.55 $401.91
Cumulative Performance Tier (3 yrs) NA NA NA High Mid
Metrics
Performance Year Results
VII - 8
Copyright © 2016
All rights reserved

I. HealthCheck Profile of Panel Performance (Cont.)
Quality Score
PanelProvider PeersPCMH All
Medical Efficiency Adjusted PMPM
PanelProvider PeersPCMH All
02,0004,0006,0008,000
10,00012,000
2010 2011 2012 2013 2014 2015 YTD
Average Members by Year
Panel
Provider Peers
PCMH All
$200
$300
$400
$500
$600
2010 2011 2012 2013 2014 2015 YTD
Medical PMPM
Panel
Provider Peers
PCMH All
0.5
1.0
1.5
2.0
2.5
2010 2011 2012 2013 2014 2015 YTD
Average Illness Burden Score
Panel
Provider Peers
PCMH All
50
55
60
65
70
75
2011 2012 2013 2014 2015 YTD
Quality Score
Panel
Provider Peers
PCMH All
150
200
250
300
350
2010 2011 2012 2013 2014 2015 YTD
Illness Burden Adjusted PMPM
Panel
Provider Peers
PCMH All
VII - 9
Copyright © 2016
All rights reserved

I. HealthCheck Profile of Panel Performance
Click on any underlined field below to see additional information.
Panel
Actual*
Peer
Group
Average
Best in
Peer
Group
Best in
Program
A. 35% - Effectiveness of Referral Patterns 75.9% 73.6% 88.5% 88.5%
1. Percent of referrals to cost efficient medical specialists 86.9% 81.6% 92.3% 93.5%
2. Percent of referrals to cost efficient procedural specialists 86.0% 80.7% 96.8% 96.8%
3. Percent of Admissions and Outpatient services at cost efficient hospitals 65.8% 69.1% 98.0% 98.0%
4. Percent of procedures in ASC vs. hospital settings 52.6% 49.4% 80.8% 80.8%
5. Percent of office and urgent care center vs. ER use 88.1% 87.1% 94.0% 95.7%
B. 20% - Extent of Engagement in Care Coordination 25.6% 29.5% 56.9% 56.9%
1. Total Engagement Quality Points vs. Possible 74.5% 60.6% 90.4% 90.4%
2. Percent of high hospital use Members in care plans 17.6% 11.4% 69.2% 69.2%
3. Percent of Members with multiple High Risk Indicators in care plans 10.2% 9.4% 28.6% 28.6%
4. Reduction in admits and ER visits for care plan Members 0.0% 36.6% 100.0% 100.0%
5. Establishment of targeted cost efficient specialist list 54.0% 56.0% 77.0% 58.0%
C. 20% - Effectiveness of Medication Management 13.5% 13.6% 22.1% 25.4%
1.Percent of high Drug Volatility Score (DVS 8-10) Members with
Comprehensive Medication Review1.4% 1.9% 11.1% 16.7%
2.Percent of polypharmacy (12 or more over the past year) Members with
Comprehensive Medication Review1.3% 2.0% 14.3% 14.3%
3.Percent of top 50 specialty Rx Members in Pharmacy Coordination
Program0.0% 30.0% 3.3% 4.1%
4. Percent generic drug substitution vs. potential 83.8% 82.0% 93.1% 93.1%
5. Percent mail order drug vs. potential 2.2% 1.7% 5.6% 20.8%
D. 10% - Gaps in Care and Quality Deficits 69.3% 66.7% 80.1% 83.7%
1. Percent avoidance of preventable admissions, readmissions, and ER use 98.8% 99.0% 99.8% 99.8%
2. Percent of Members without gaps in care - chronic care measures 58.0% 52.1% 76.7% 76.7%
3. Percent of Members without gaps in care - population health screenings 58.5% 52.8% 69.6% 74.6%
4. Percent of maximum in patient access and structural capabilities 62.0% 63.0% 100.0% 100.0%
5. Percent of Members in Health Risk Tracks reviewed and acted upon 45.0% 52.0% 79.0% 87.0%
E. 15% - Consistency of Performance Within the Panel - % of PCPs 49.4% 47.3% 66.9% 66.9%
1. Consistency in effectiveness of referral patterns 55.0% 73.9% 100.0% 100.0%
2. Consistency in extent of engagement 55.0% 29.5% 85.4% 85.4%
3. Consistency in effectiveness of medication management 42.0% 17.6% 77.0% 77.0%
4. Consistency in minimizing gaps in care and quality deficits 45.6% 68.0% 73.0% 76.6%
100% - Overall Performance 48.7% 48.0% 58.9% 58.9%
*Panel Actual shows the percentage of possible points achieved by the Panel.
This chart displays the Panel HealthCheck profile as of July, 2015.
Sample Drill Through on Following Page
VII - 10
Copyright © 2016
All rights reserved

I. HealthCheck Profile of Panel Performance
E. Detail of Consistency Within the Panel - % of PCPs
Panel
Actual
Peer
Group
Average
% of
PCPs Over
Peer Average
Highest Scored
PCP in Panel*
Lowest Scored
PCP in Panel*
Effectiveness of Referral Patterns 55.0%
1. Percent of referrals to cost efficient medical specialists 86.9% 81.6% 78.0% 54.0% MULTIPLE PCPS 25.0% GARY GREEN
2.Percent of referrals to cost efficient procedural
specialists86.0% 80.7% 57.5% 88.0% FLETCH ORANGE 48.0% ACE EMERALD
3.Percent of Admissions and Outpatient services at cost
efficient hospitals65.8% 69.1% 65.8% 79.0% FLETCH ORANGE 58.0% GARY GREEN
4. Percent of procedures in ASC vs. hospital settings 52.6% 49.4% 52.6% 75.0% FLETCH ORANGE 52.0% GARY GREEN
5. Percent of office and urgent care center vs. ER use 88.1% 87.1% 88.1% 46.4% FLETCH ORANGE 18.5% ACE EMERALD
Extent of Engagement in Care Coordination 55.0%
1. Total Engagement Quality Points vs. Possible 74.5% 60.6% 74.5% 100.0% BONNIE BEIGE 20.0% GARY GREEN
2. Percent of high hospital use Members in care plans 17.6% 11.4% 76.5% 85.0% MULTIPLE PCPS 20.0% GARY GREEN
3.Percent of Members with multiple High Risk
Indicators in care plans10.2% 9.4% 70.8% 91.5% BONNIE BEIGE 47.9% GARY GREEN
4.Reduction in admits and ER visits for care plan
Members0.0% 36.6% 53.5% 89.2% BONNIE BEIGE 23.7% GARY GREEN
5. Establishment of targeted cost efficient specialist list 54.0% 56.0% 54.0% 79.0% FLETCH ORANGE 58.0% GARY GREEN
Effectiveness of Medication Management 42.0%
1.Percent of high Drug Volatility Score (DVS 8-10)
Members with Comprehensive Medication Review1.4% 1.9% 35.5% 82.0% BONNIE BEIGE 15.0% GARY GREEN
2.
Percent of polypharmacy (12 or more over the past
year) Members with Comprehensive Medication
Review
1.3% 2.0% 59.0% 99.0% BONNIE BEIGE 52.0% GARY GREEN
3.Percent of top 50 specialty Rx Members in Pharmacy
Coordination Program0.0% 30.0% 29.0% 100.0% GARY GREEN 96.2% RAY PURPLE
4. Percent generic drug substitution vs. potential 83.8% 82.0% 55.0% 98.3% MICHAEL MAUVE 94.7% ACE EMERALD
5. Percent mail order drug vs. potential 2.2% 1.7% 16.0% 1.8% MICHAEL MAUVE 0.9% ACE EMERALD
Gaps in Care and Quality Deficits 45.6%
1.Percent avoidance of preventable admissions,
readmissions, and ER use98.8% 99.0% 55.4% 100.0% GARY GREEN 96.2% RAY PURPLE
2.Percent of Members without gaps in care - chronic
care measures58.0% 52.1% 69.5% 72.9% BONNIE BEIGE 42.2% RAY PURPLE
3.Percent of Members without gaps in care - population
health screenings58.5% 52.8% 66.0% 52.9% BONNIE BEIGE 30.6% FLETCH ORANGE
4.Percent of Members in Health Risk Tracks reviewed
and acted upon62.0% 63.0% 42.0% 91.5% BONNIE BEIGE 47.9% GARY GREEN
Overall Performance 58.6% 72.3% BONNIE BEIGE 36.7% ACE EMERALD
*Highest and Lowest Ranked PCPs in Panel only include PCPs meeting category thresholds.
This chart displays the Panel HealthCheck profile as of July, 2015.
Sample Drill Through from Prior Page
VII - 11
Copyright © 2016
All rights reserved

II. Profile of Members in Panel
CareFirst Member attribution is run monthly for each Panel. This shows which Members use a primary care provider (PCP) in
each Medical Care Panel. Attribution is achieved in one of three ways:
• Member selected PCP in the most recent 6 months.
• Practice/PCP seen most often during the most recent 24 months of claims filed with CareFirst
• Member selected PCP during open enrollment if no claims experience is available
Typically, there is considerable stability in a Panel's attributed Members, but the monthly review shows changes and keeps Panel
membership current. Data on each Panel's CareFirst attributed Members is shown in a series of "views." Where appropriate,
these include comparisons with other PCMH Panels.
PCMH Panel comparisons are shown for three categories:
• Panel Type Peers - These are Panels in one of four categories:
o Virtual Panel
o Independent Group Practice Panel
o Multi-Panel Independent Group Practice
o Multi-Panel Health System
• Provider Type Peers - These are Panels in one of three categories:
o Adult
o Pediatric
o Mixed
• PCMH All - All active Panels in the PCMH program.
To gain a deeper understanding of Member health and/or illness status, all Members in the Panel are assigned to one of five
illness bands and may be referenced in the SearchLight Report by band number or name:
• Band 1 - Advanced/Critical Illness
• Band 2 - Multiple Chronic Illnesses
• Band 3 - At Risk for serious illness
• Band 4 - Stable
• Band 5 - Healthy
This information not only reveals the illness characteristics of a Panel's whole Member population, it also shows where costs are
concentrated and/or distributed. Among other things, it is used to identify Members that may benefit from care plans or enhanced
monitoring.
Members are assigned to an illness band using a diagnostic and risk assessment grouping methodology widely considered the
industry standard. This methodology assigns an Illness Burden Score to each Member based on the trailing 12 months of claims
data inclusive of diagnosis codes from inpatient, outpatient, and professional services. While the methodology does not consider
cost in making an Illness Band assignment, the results place "like" illness burdens together in a reasonably reliable way - thus
causing Members to be grouped in ways that correlate well with their actual medical costs. See Appendix G for more on this
methodology (DxCG).
Those Members who have taken Health Assessments are assigned Well Being Scores, which incorporate self-reported data such
as age, gender, smoking status, and current clinical conditions, as well as clinical data such as lab results, blood pressure
readings, and Body Mass Index (BMI). Well Being Scores are classified into one of three Risk Categories that are based on a 100
point scale as follows:
• Full Expression: These Members have the full expression of one or more diseases and therefore are assigned to
either a more intensive TCCI Program or telephonic Disease Management Coaching. These are generally Members
with Well Being Scores from 0-49.
• High Risk: Members are at elevated risk for preventable disease and targeted for telephonic or online Lifestyle
Health Coaching. These are generally Members with Well Being Scores from 50 -74.
• Low Risk: Members are generally healthy or exhibit low risk. These Members are not automatically referred for
coaching, but have online and telephonic Health Coaching available to them if they seek it. These are generally
Members with Well Being Scores from 75-100.
VII - 12
Copyright © 2016
All rights reserved

II. Profile of Members in Panel (Cont.)
CareFirst - Overall PCMH Program
% of % of Average
Members Cost IB Score
3.5% 31.8% 10.13
10.4% 27.9% 2.99
15.5% 18.6% 1.42
32.6% 16.2% 0.56
38.0% 5.5% 0.09
Panel Specific Profile% of % of Average
Members Cost IB Score
7.0% 49.0% 11.06
18.5% 27.9% 3.04
21.4% 14.2% 1.44
31.0% 7.9% 0.58
22.1% 1.1% 0.09
Illness Burden (0 - 0.24)
Generally healthy, often not using health
system.
The figure below shows the Illness Burden pattern of the CareFirst population of PCMH Members. Each band is bounded by an illness burden
score range. Panel specific patterns vary, so the overall profile of CareFirst PCMH population is shown for reference purposes. The average
illness burden score for the entire PCMH population is set to 1.00 in order to establish a normalization rate. See Appendix G for more on this
methodology (DxCG). Cost is based on full 2014 claims data after allowing 3 months (through 3/31/15) run out of claims payments. This run out
yields a 98% or greater completion of all claims payments.
The figure below shows the distribution of Members and cost for the specific Panel that is the subject of this report showing the distribution of all
attributed Members, by illness band. Cost is based over the trailing 12 months of claims data after allowing 3 months of run out of claims
payments.
Illness Burden (5.00 and Above)
Extremely heavy health care users with
significant advanced / critical illness.
Illness Burden (2.00 - 4.99)
Heavy users of health care system, mostly for
more than one chronic disease.
Illness Burden (1.00 - 1.99)
Fairly heavy users of health care system who
are at risk of becoming more ill.
Illness Burden (0.25 - 0.99)
Generally healthy, with light use of health
care services.
Illness Burden (0 - 0.24)
Generally healthy, often not using health
system.
Advanced / Critical Illness
BAND 1 Multiple Chronic Illnesses
BAND 2
At Risk
BAND 3
Stable
BAND 4
Healthy
BAND 5
Advanced / Critical Illness
BAND 1 Multiple Chronic Illnesses
BAND 2
At Risk
BAND 3
Stable
BAND 4
Healthy
BAND 5
VII - 13
Copyright © 2016
All rights reserved

II. Profile of Members in Panel
A. Attributed Members
Jan-15 Feb-15 Mar-15 Apr-15 May-15 Jun-15 Jul-15 Aug-15 Sep-15 Oct-15 Nov-15 Dec-15
Deletes 167 211 196 163 202 486
Adds 179 188 203 163 193 461
Total Attributed 7,726 7,738 7,715 7,722 7,722 7,713 7,688
B. Average Member Age by Illness Band vs. Peers
C. Number of Members by Illness Band
Illness Band Jan-15 Feb-15 Mar-15 Apr-15 May-15 Jun-15 Jul-15 Aug-15 Sep-15 Oct-15 Nov-15 Dec-15
Advanced/Critical Illness 521 536 544 546 546 546 549
Multiple Chronic Illnesses 1,408 1,408 1,391 1,392 1,426 1,435 1,453
At Risk 1,755 1,769 1,774 1,767 1,744 1,743 1,673
Stable 2,393 2,405 2,387 2,405 2,396 2,370 2,359
Healthy 1,649 1,620 1,619 1,612 1,610 1,619 1,654
Total 7,726 7,738 7,715 7,722 7,722 7,713 7,688
D. Percentage of Members by Illness Band
Illness Band Jan-15 Feb-15 Mar-15 Apr-15 May-15 Jun-15 Jul-15 Aug-15 Sep-15 Oct-15 Nov-15 Dec-15
Advanced/Critical Illness 6.7% 6.9% 7.1% 7.1% 7.1% 7.1% 7.1%
Multiple Chronic Illnesses 18.2% 18.2% 18.0% 18.0% 18.5% 18.6% 18.9%
At Risk 22.7% 22.9% 23.0% 22.9% 22.6% 22.6% 21.8%
Stable 31.0% 31.1% 30.9% 31.1% 31.0% 30.7% 30.7%
Healthy 21.3% 20.9% 21.0% 20.9% 20.8% 21.0% 21.5%
Total 100% 100% 100% 100% 100% 100% 100%
This chart shows the percentage of the Panel's Member population in each illness band.
This chart shows the number of CareFirst Members attributed to the Panel each month, including adds and deletes of attributed Members. Deletes may be due to
disenrollment from CareFirst or attribution to another Panel.
This chart shows the average age of Members as of the most recent month's data by illness band, as well as a comparison with other Panels in the program. The
illness burden assignment of Members is based on the band ranges shown in the introduction to this section.
This chart displays the number of Members in each illness band and offers some insight into the extent of Member illness or health for the Panel as a whole.
Average Age
PanelPanel Type
Peers (169)
Provider Type
Peers (173)
PCMH
All (281)
Advanced/Critical Illness 57 41 53 42
Multiple Chronic Illnesses 52 40 49 41
At Risk 49 38 47 38
Stable 46 33 42 34
Healthy 39 28 35 28
Overall Average 49 36 45 37
Illness Band
VII - 14
Copyright © 2016
All rights reserved

II. Profile of Members in Panel
E. Member Gender by Illness Band
Members % Members % Male Female
Advanced/Critical Illness 227 6.5% 283 7.5% 44.5% 55.5%
Multiple Chronic Illnesses 531 15.3% 807 21.5% 39.7% 60.3%
At Risk 639 18.4% 910 24.2% 41.3% 58.7%
Stable 1,133 32.6% 1,110 29.5% 50.5% 49.5%
Healthy 950 27.3% 650 17.3% 59.4% 40.6%
Total 3,480 100.0% 3,760 100.0% 48.1% 51.9%
F. Member Movement Across Illness Bands
Jan-15 Jul-15
MembersLeft
Panel
New
To Panel- + Members
Advanced/Critical Illness 521 154 91 197 249 510
Multiple Chronic Illnesses 1,408 358 215 568 641 1,338
At Risk 1,755 438 298 867 801 1,549
Stable 2,393 562 494 968 886 2,243
Healthy 1,649 476 404 549 572 1,600
Total 7,726 1,988 1,502 7,240
G. Change YTD in Average Member Illness Burden Scores
Jan-15
%
Members
Average IB
Score
%
Members
Average IB
Score
Advanced/Critical Illness 6.7% 11.43 6.1% 11.19 -2.1%
Multiple Chronic Illnesses 18.2% 3.03 14.3% 3.04 0.2%
At Risk 22.7% 1.43 19.8% 1.44 0.2%
Stable 31.0% 0.60 32.9% 0.58 -2.8%
Healthy 21.3% 0.08 26.9% 0.08 0.0%
Overall Average 100% 1.86 100% 1.88 0.7%
This chart shows the number and percentage of Members as of the most recent month's data that fall into each illness band by gender.
Illness Band
Gender SplitIllness Band
Male Female
This chart shows Panel Membership/Member composition over time (within the current year) from the start of the year to the latest month. It
displays the movement across bands as well as additions and losses to the overall Panel population.
This chart shows changes in average illness band score within bands from the start of the current year to the most recent available month.
%
Change
Jul-15
Change in Enrollment Change in Band
Illness Band
VII - 15
Copyright © 2016
All rights reserved

II. Profile of Members in Panel
H. Members by Illness Band vs. Peers
I. Average Member Illness Burden Scores vs. Peers
Advanced/Critical Illness 11.19 10.28 10.26 10.25
Multiple Chronic Illnesses 3.04 2.98 2.97 2.98
At Risk 1.44 1.42 1.42 1.42
Stable 0.58 0.55 0.57 0.55
Healthy 0.08 0.08 0.09 0.08
Average 1.88 1.08 1.29 1.08
*No specific Primary Care Provider identified due to lack of specific rendering provider ID on claims.
This chart compares the Panel's illness distribution as of the most recent month's data with peer groups for benchmarking purposes.
PCMH
All (281)Illness Band
Panel Type
Peers (169)
Provider Type
Peers (173)Panel
This chart displays Member attribution by provider within the Panel as of the most recent month's data. This allows Primary Care Providers (PCPs) in the Panel
to view a profile of their individual Member populations. The percentages under the Illness bands show the distribution of Members across bands for each
provider (i.e., each row adds to 100%), while the % of Panel Total columns on the right show the distribution of Members and debits across providers within the
Panel.
This chart compares the Panel's average illness burden score within each band as of the most recent month's data to that of various peer groups.
J. Member Illness Band Distribution by Provider
PanelPanel Type
Peers (169)
Provider Type
Peers (173)
PCMH
All (281)
Members % % % %
Advanced/Critical Illness 510 7.0% 3.5% 4.0% 3.4%
Multiple Chronic Illnesses 1,338 18.5% 10.3% 13.0% 10.3%
At Risk 1,549 21.4% 15.0% 18.8% 15.2%
Stable 2,243 31.0% 30.7% 33.4% 31.5%
Healthy 1,600 22.1% 40.5% 30.8% 39.6%
Total 7,240 100.0% 100.0% 100.0% 100.0%
Illness Band
Provider
Advanced/
Critical
Illness
Multiple
Chronic
Illnesses
At Risk Stable Healthy
Provider
Total
Members
% of
Panel Total
Members
Provider
Total
Debits
% of
Panel Total
Debits
Donald Daisy 42 5.5% 112 14.6% 147 19.1% 281 36.6% 186 24.2% 768 9.7% $4,229,313 9.4%
Bob Blue 17 2.4% 76 10.6% 137 19.1% 224 31.2% 265 36.9% 719 9.1% $3,816,692 8.5%
Ray Purple 51 8.4% 97 16.0% 122 20.2% 213 35.2% 122 20.2% 605 7.6% $3,019,636 6.7%
Robin Red 57 9.8% 121 20.7% 135 23.1% 156 26.7% 115 19.7% 584 7.4% $2,706,840 6.0%
Gary Green 33 7.3% 45 10.0% 79 17.5% 171 37.9% 123 27.3% 451 5.7% $3,145,580 7.0%
Irene Indigo 65 15.2% 89 20.8% 87 20.3% 131 30.6% 56 13.1% 428 5.4% $2,040,531 4.5%
Fletch Orange 25 5.9% 60 14.3% 75 17.8% 145 34.4% 116 27.6% 421 5.3% $1,708,208 3.8%
Attributed to Panel* 46 21.4% 38 17.7% 35 16.3% 66 30.7% 30 14.0% 215 2.7% $366,187 0.8%
Total 510 7.0% 1,338 18.5% 1,549 21.4% 2,243 31.0% 1,600 22.1% 7,240 100.0% $45,192,559 100.0%
VII - 16
Copyright © 2016
All rights reserved

II. Profile of Members in Panel
K. Member Geographic Distribution by Zip Code
City State* Zip Members %
PASADENA MD 21122 594 8.2%
GLEN BURNIE MD 21061 493 6.8%
GLEN BURNIE MD 21060 338 4.7%
BALTIMORE MD 21234 261 3.6%
BALTIMORE MD 21222 229 3.2%
BALTIMORE MD 21220 202 2.8%
SEVERN MD 21144 199 2.7%
BALTIMORE MD 21221 189 2.6%
MILLERSVILLE MD 21108 177 2.4%
BALTIMORE MD 21236 174 2.4%
Other in State 4,282 59.1%
Out of State 103 1.4%
Total 7,240 100.0%
*The state shown indicates the state with the largest distribution of attributed Members
This chart shows the top 10 zip codes having the largest geographic distribution of attributed Members as of the most recent month's data. The
geographic distribution is based on attributed Members' home address zip code.
VII - 17
Copyright © 2016
All rights reserved

II. Profile of Members in Panel
L. Profile of Band 1 - Advanced/Critical Illness - Three Key Categories
Members %
19 3.7% 31.14 $6,059.95
171 33.5% 15.02 $3,425.70
320 62.7% 6.86 $1,702.03
Total 510 100.0% 10.49 $2,446.14
Catastrophic / End Stage - Illness burden scores 25.00 and above
Acute - Return to Chronic - Illness burden scores ranging between 10.00 - 24.99
Acute with Likely Recovery - Illness burden scores ranging between 5.00 and 9.99
Note: The average Illness burden score for the CareFirst non-Medicare primary population is 1.00
M. Profile of Band 2 - Multiple Chronic Illnesses - Two Key Categories
Members %
400 29.9% 4.16 $1,085.71
938 70.1% 2.62 $784.37
Total 1,338 100.0% 3.07 $874.55
Upper - More Extensive Illness - Members at or above the midpoint for the illness band range (3.50)
Lower - Less Extensive Illness - Members below the midpoint for the illness band range (3.50)
Note: The average Illness burden score for the CareFirst non-Medicare primary population is 1.00
N. Profile of Band 3 - At Risk - Two Key Categories
Members %
632 40.8% 1.73 $523.43
917 59.2% 1.23 $397.61
Total 1,549 100.0% 1.43 $449.08
Upper - Elevated Risk - Members at or above the midpoint for the illness band range (1.50)
Lower - Moderate Risk - Members below the midpoint for the illness band range (1.50)
Note: The average Illness burden score for the CareFirst non-Medicare primary population is 1.00
Average Illness
Burden Score
Gross Debit
PMPM $
This chart displays a further breakdown of Members in the advanced/critical band (Band 1) into three sub-bands shown, based upon their illness burden
scores as of the most recent month's data. Gross Debit PMPM $ is for the trailing 12 months as of July, 2015.
Sub-BandJul-15
This chart separates Members in band 2 into two sub-bands based on the extent of their illnesses, providing an indication of those Members who may be more
likely to move into more advanced stages of illness as of the most recent month's data. Gross Debit PMPM $ is for the trailing 12 months as of July, 2015.
Catastrophic / End Stage
Acute - Return to Chronic
Acute with Likely Recovery
This chart separates Members in band 3 into two sub-bands based on the extent of their illnesses, as an assist in finding Members who could benefit from
enhanced monitoring as of the most recent month's data. Gross Debit PMPM $ is for the trailing 12 months as of July, 2015.
Upper - Elevated Risk
Lower - Moderate Risk
Upper - More Extensive Illness
Lower - Less Extensive Illness
Sub-BandJul-15 Average Illness
Burden Score
Gross Debit
PMPM $
Sub-BandJul-15 Gross Debit
PMPM $
Average Illness
Burden Score
VII - 18
Copyright © 2016
All rights reserved

II. Profile of Members in Panel
O. Member Wellness - Risk Category vs. Illness Band
Illness Band
Advanced/
Critical
Illness
Multiple
Chronic
Illnesses
At Risk Stable Healthy Total
Full Expression (0-49) 20 37 42 11 1 111
High Risk (50-74) 12 13 29 22 14 90
Low Risk (75-100) 4 19 76 91 97 287
Total Members w/ Well Being Score 36 69 147 124 112 488
All Panel Members 510 1,338 1,549 2,243 1,600 7,240
% of Members w/ Well Being Score 7.1% 5.2% 9.5% 5.5% 7.0% 6.7%
O. Detail of Member Wellness - Risk Category vs. Illness Band
Risk Category: High Risk
Illness Band: Healthy
This chart compares Member Wellness Risk Categories with claims-based Illness Bands over the trailing 12 months. A Full Expression or High
Risk Category can be an early predictor of potential advancement in Illness Band if current unhealthy lifestyle behaviors are left unchecked.
Please note that relatively few Members complete a Well Being Assessment. See Appendix N for more on how Well Being scores are determined
and how Risk Categories are assigned. Click on any underlined field below to see additional information.
This drill down shows information at the Member level, comparing the overall Well Being score to the Illness Burden Score for each Member for
the bands selected. The data shows the Member name, date of birth, attributed PCP, and total gross and PMPM debits, and dominant episode (if
evident) over the trailing 12 months. See Appendix N for more on how Well Being scores are determined and how Risk Categories are assigned.
This data is included in the MHR. The Member Health Record (MHR) for each Member can be accessed by clicking on the Member’s name below.
Risk
Category
(100 Point Scale)
Sample Drill Through
#Member
NameDOB Provider
Well
Being
Score
Illness
Burden
Score
Total
Debit $
$
PMPMDominant Episode
1 Chester Red 12/7/63 Irene Indigo 64 0.05 $0 $0.00 Non Established
2 Virginia Orange 11/23/64 Gary Green 72 0.10 $0 $0.00 Non Established
3 Stephanie Red 1/22/56 Peter Black 51 0.21 $80 $8.00 Prevent/Admin Hlth Encounters
14 Marion Eggplant 4/24/71 Samuel Yellow 58 0.23 $0 $0.00 Non Established
VII - 19
Copyright © 2016
All rights reserved

II. Profile of Members in Panel
P. Member Wellness - Movement Across Risk Categories
P. Detail of Member Wellness - Movement Across Risk Categories
Risk Category: Full Expression
Selection: Current Members
This chart shows Member movement among Risk Categories from the start of the year to the latest month. The chart depicts the Members who
have or have not completed assessments in the current year, as well as the movement into and out of each category. Please note that relatively
few Members complete a Well Being Assessment. See Appendix N for more on how Well Being scores are determined and how Risk Categories
are assigned. Click on any underlined field below to see additional information.
This drill down shows information at the Member level, comparing the Well Being score, Illness Burden Score, Total Debit Dollars and PMPM
debits over the trailing 12 months as of July, 2015 for each listed Member at the start of the year and for the current month. The data also
shows the Member name, date of birth, and attributed PCP. See Appendix N for more on how Well Being scores are determined and how Risk
Categories are assigned. This data is included in the MHR. The Member Health Record (MHR) for each Member can be accessed by clicking
on the Member’s name below.
Sample Drill Through
Jan-14 2014 Assessment Change in Category Jan-15
Members
Not
Done Done New- +
Current
Members
Full Expression (0-49) 101 3 98 8 17 22 111
High Risk (50-74) 82 13 69 23 8 6 90
Low Risk (75-100) 271 35 236 54 51 48 287
Total 454 51 403 85 76 76 488
Risk
Category
#Member
NameDOB Provider
Jan-14
Well
Being
Score
Jan-15
Well
Being
Score
Jan-14
Illness
Burden
Score
Jan-15
Illness
Burden
Score
Jan-14
Total
Debit $
Jan-15
Total
Debit $
Jan-14
$
PMPM
Jan-15
$
PMPM
1 Bianca Blue 6/9/63 Irene Indigo 26 28 0.88 0.85 $2,260 $2,100 $188 $185
2 Johnny Green 11/23/64 Gary Green 37 38 1.33 1.00 $13,444 $12,999 $1,120 $1,015
3 Matthew Mauve 1/12/56 Peter Black 39 49 0.21 0.20 $80 $69 $7 $6
110 Geoffrey Green 8/4/51 Michael Mauve 68 36 0.05 0.05 $160 $130 $13 $9
111 Marion Eggplant 5/24/71 Samuel Yellow 68 22 1.20 1.10 $1,136 $1,005 $95 $91
VII - 20
Copyright © 2016
All rights reserved

II. Profile of Members in Panel
Q. Member Wellness - by Risk Category and TCCI Program
Risk
CategoryMembers
Well
Being
Score
HTC CCM CCC RxP
Other
TCCI
Programs
Total in
TCCI
Programs
Full Expression (0-49) 111 37.2 5 3 2 5 2 17
High Risk (50-74) 90 58.8 4 4 1 1 1 11
Low Risk (75-100) 287 73.1 1 1 0 0 1 3
Score Not Available 6,752 NA 54 87 46 15 12 214
Total 7,240 NA 64 95 49 21 16 245
Q. Detail of Member Wellness - by Risk Category and TCCI ProgramRisk Category: High Risk
TCCI Program: All
This chart displays Member engagement in TCCI care coordination programs by Risk Category over the trailing 12 months. See Appendix N for more
on how Well Being scores are determined and how Risk Categories are assigned. Click on any underlined number to see Member specific information.
This drill down shows information at the Member level, including Member name, date of birth, Well Being score, care coordination programs, PCP, and
total debit $ over the trailing 12 months. See Appendix N for the more on how Well Being Scores are determined and how Risk Categories are assigned.
The Member Health Record (MHR) for each Member can be accessed by clicking on the Member’s name below.
Sample Drill Through
#Member
NameDOB Provider
Well Being
Score
Care
Coordination
Program/Status
Total
Debit $
1 Chester Red 12/7/63 Irene Indigo 55 CCM (A) $10,196
2 Virginia Orange 11/23/64 Gary Green 58 HTC (1C), CCM (A) $3,330
3 Stephanie Red 1/22/56 Peter Black 60 HTC (1B), CCM (C) $6,658
11 Marion Eggplant 4/24/71 Samuel Yellow 63 RxP (A) $13,972
VII - 21
Copyright © 2016
All rights reserved

II. Profile of Members in Panel
R. Member Wellness - Members by Health Condition Track
R. Detail of Member Wellness - Members by Health Condition Track
Risk Category: Full Expression
Health Condition Track: Diabetes
#Member
NameDOB Provider
Well
Being
Score
Illness
Burden
Score
# of Health
Risk Factors
Care
Coordination
Program/Status
Program
Referred To
Consent
Yes/No
1 Virginia Orange 11/23/64 Gary Green 26 0.54 5 CCM (A)Disease
ManagementYes
2 Emily Red 12/7/63 Sarah Cobalt 37 0.21 3 CCM (A) CCC Yes
This chart displays Members, their Risk Categories, and their Health Condition Tracks as identified from their Health Assessments as well as the
subsequent actions relating to these Members. Debits PMPM is for the Trailing 12 months as of July, 2015. See Appendix N for more information on
Health Condition Tracks. Click on any underlined number to see Member specific information.
This drill down shows information at the Member level, including Member name, date of birth, Well Being Score, Illness Burden Score and Program
Referred to over the trailing 12 months as of July, 2015 and is sorted by Well Being Score. See Appendix N for more information on Health Condition
Tracks. The Member Health Record (MHR) for each Member can be accessed by clicking on the Member’s name below.
Sample Drill Through
Risk Category
Full
Expression
(0-49)
High
Risk
(50-74)
Behavioral Health 3 3.4% 1 0 45 8.50 $766.00
Cancer 5 5.6% 1 1 60 10.89 $2,472.87
Cardiovascular Disease 8 9.0% 3 2 7 3.01 $962.13
COPD 5 5.6% 1 1 90 3.05 $1,951.65
Diabetes 8 9.0% 2 4 44 5.22 $3,703.00
Hypertension 21 23.6% 3 5 75 8.12 $129.95
Kidney Disease 4 4.5% 1 0 21 15.20 $551.57
Metabolic Cluster 1 1.1% 0 0 99 18.90 $989.06
Musculoskeletal Cluster 6 6.7% 3 1 87 14.80 $184.78
Obesity 28 31.5% 6 2 54 8.80 $5,034.63
Total 89 100.0% 21 21 NA 9.65 $16,745.64
Well
Being
Score
Average
Illness
Burden
Score
Debits
PMPM
Health Condition
TrackMembers
% of
Members
VII - 22
Copyright © 2016
All rights reserved

III. Profile of Episodes of Care
This section of the SearchLight Report gathers every Member's claim information from multiple providers of treatment in all
settings and then groups this information into similar, clinically relevant episodes. A medical episode is composed of all
related but independent services used to treat a Member's condition or illness within a predetermined time period. This allows
for the identification and grouping of services together that otherwise might appear unrelated, particularly when they are for
services rendered by different providers in different settings at different points in time.
Thus, episodes of care are defined as a series of sequential health services that are related to the treatment of a given illness
or in response to a Member request for healthcare. These series of related events, as seen in claims data, each have a
beginning date and an end date which define the episode boundaries.
To identify episodes, claims information from all inpatient, outpatient, professional, and pharmacy providers for all services
received by a Member are included in episodes of care. In total, episodes can be established for well over 95% of all medical
claims paid for by CareFirst on behalf of Panel Members. The methodology used to calculate and display episode data is
explained further in Appendix I.
This SearchLight Report uses nearly 200 distinct Episode Summary Groups. Further detailed breakdowns are available, but
are not used since they can make overall pattern recognition difficult. The hierarchy of episodes is as follows:
• Episode Summary Group - Summarizes condition-related Episode Groups. An example would be 'Diabetes'.
• Episode Group - Provides more granular condition-related information. An example would be 'Diabetes Mellitus
Type 1 Maintenance'.
• Episode Subgroup - This is the most granular level of an episode. It includes disease staging and co-morbidities.
An example would be 'Diabetes Mellitus type 1 with renal failure'.
• Disease Stage - Severity of an episode is shown on a 4 point scale. The above Episode Subgroup example
(Diabetes Mellitus type 1 with renal failure) could have a disease stage of 3.01. The higher the score on the 4
point scale, the more severe the illness, with "4" typically being end stage.
The greater the granularity of an Episode Group, the more difficult it is to review the pattern of illnesses and conditions
across a whole population. Episode Summary Groups combine condition related episode groups, thus allowing the PCP an
overview of the Members within their Panel with "like" conditions. Disease staging within episodes enables an understanding
of disease progression. Each episode is assigned a disease stage that enhances basic cost comparisons with condition and
severity-mix adjustment.
This SearchLight Report uses the concept of "Dominant" Episodes. These are identified for Members based on the Episode
Summary Group responsible for the largest spending over the trailing 12 month period for a particular Member. Through
analysis of dominant episodes, a Panel can gain a view of the contrasting landscape of Members’ conditions, whether acute or
chronic, thereby providing information helpful in enabling more focus on where effective care management is most important.
It also enables greater Primary Care Provider attention on certain Members with higher risk and/or greater likelihood of
disease progression and future high costs.
VII - 23
Copyright © 2016
All rights reserved

III. Profile of Episodes of Care
A. Dominant Episodes of Care - All Bands - Based on Gross Debit Dollars
Subtotal
This chart displays the top 50% of all gross debits charged to the Panel by dominant episode summary group. This includes debits for Members attributed to
the Panel for the trailing 12 month period, including the number of Members who have these episodes. Gross debits are shown at CareFirst "allowed"
payment levels with no application of Individual Stop Loss limits on very high cost Members. Additionally, this chart shows the dominant episode gross debits
broken out by institutional claims, professional claims, and standard drug claims (Rx).
The ranking below shows the dominant episodes related to illnesses among Panel Members and excludes Preventative and Administrative Health episodes,
even though these encounters are often one of the highest volume episode categories.
*Gross Debit $ shows only debits associated with the dominant episode. Total Members Gross Debit $ reflect all paid claims before the application of the
Individual Stop Loss limit of $75,000.
** Rx Gross Debit $ represents only pharmacy claims for those Members with a CareFirst pharmacy benefit. As a result, the dollar figure may be lower than
the Member's actual pharmacy expense.
# Dominant Episode Members% of Total
Members
Gross
Debit $*
Institutional
Gross
Debit $*
Professional
Gross
Debit $*
Rx
Gross
Debit $**
Total Members
Gross
Debit $*
% of Total
Gross
Debit $
1 Osteoarthritis 303 4.2% 2,747,641 1,903,806 791,743 52,092 3,780,856 8.7%
2 Cancer - Breast 38 0.5% 1,125,155 864,549 219,711 40,896 1,302,038 3.0%
3 Coronary Artery Disease 85 1.2% 974,634 819,690 147,842 7,101 1,259,445 2.9%
4 Cerebrovascular Disease 40 0.6% 927,032 806,335 119,712 985 1,330,982 3.1%
5 Renal Function Failure 21 0.3% 833,294 790,185 42,645 464 1,105,750 2.6%
6 Hypertension, Essential 537 7.5% 817,914 451,126 301,465 65,323 1,791,670 4.1%
7 Spinal/Back Disorders, Excl. Low 110 1.5% 723,654 522,818 198,678 2,158 1,046,854 2.4%
8 Cardiac Arrhythmias 59 0.8% 676,514 568,489 107,770 255 904,990 2.1%
9 Diabetes 313 4.4% 675,383 236,115 277,528 161,740 1,397,664 3.2%
10 Fracture/Disloc - Hip/Fem Head 11 0.2% 664,571 563,296 101,156 119 685,288 1.6%
11 Spinal/Back Disorders, Lower Back 199 2.8% 616,811 322,171 281,957 12,684 1,008,826 2.3%
12 Tumors - Central Nervous Sys 8 0.1% 590,514 492,118 97,955 441 686,469 1.6%
13 Pregnancy w Vaginal Delivery 49 0.7% 557,924 393,834 163,850 239 678,984 1.6%
14 Hernia/Reflux Esophagitis 103 1.4% 550,963 385,728 159,655 5,579 920,782 2.1%
15 ENT Disorders, NEC 87 1.2% 504,662 415,877 84,637 4,148 723,314 1.7%
16 Cancer - Prostate 29 0.4% 493,809 202,427 287,976 3,406 618,109 1.4%
17 Cancer - Pancreas 3 0.0% 471,061 425,421 43,838 1,801 631,897 1.5%
18 Urinary Tract Calculus 63 0.9% 419,957 302,935 116,687 335 593,959 1.4%
19 Myasthenia Gravis 3 0.0% 417,594 311,750 105,188 656 445,406 1.0%
20 Infections - Body Sites, NEC 16 0.2% 389,886 343,688 43,361 2,837 698,562 1.6%
Subtotal 2,077 28.7% 15,178,972 11,122,358 3,693,354 363,260 21,611,843 50.0%
VII - 24
Copyright © 2016
All rights reserved

III. Profile of Episodes of Care
B. Dominant Episodes of Care - All Bands - Based on Gross Debits expressed as PMPM
Subtotal
C. Dominant Episodes of Care - Preventive/Administrative Health Encounters Preventative and Administrative Health episodes typically account for a substantial percentage of all debits, but are spread over many Members. Preventive
services generally include recommended immunizations and screenings (such as colonoscopies and mammograms), as well as those identified by "history of"
diagnoses (such as family history of colon cancer, risk of a fall, and amputation). Administrative services may include those related to historical injury (such
as prosthetic supplies and physical/occupational therapy).
The distribution of Members with Preventive/Administrative Health Encounters as their dominant episode is displayed by Illness Band below over the trailing
12 months as of July, 2015. Of all Panel Members, 11.6% have Dominant Episodes of Preventive/Administrative Health Encounters, while the total debits
associated with these Members account for 3.3% of the Panel's total gross debits.
This chart displays the top dominant episode summary group gross debits per Member per month (PMPM). Gross debits are all claim costs for Members at
CareFirst "allowed" payment levels with no application of Individual Stop Loss limits on very high cost Members over the trailing 12 months as of July,
2015. Additionally, this chart shows the dominant episode gross debits broken out by institutional claims, professional claims, and standard drug claims
(Rx).
The ranking below shows the dominant episodes related to illnesses among Panel Members and excludes Preventative and Administrative Health episodes,
even though these encounters are often one of the highest volume episode categories. The volume and cost for Preventive and Administrative Health
Episodes are shown separately in the successive view.
** Rx Gross Debit $ represents only pharmacy claims for those Members with a CareFirst pharmacy benefit. As a result, the dollar figure may be lower than
the Member's actual pharmacy expense.
*Gross Debit $ shows only debits associated with the dominant episode. Total Members Gross Debit $ reflect all paid claims before the application of the
Individual Stop Loss limit of $75,000.
# Dominant Episode Members% of Total
Members
Gross
Debit $*
Gross
Debit PMPM
Institutional
Gross
Debit PMPM
Professional
Gross
Debit PMPM
Rx
Gross
Debit PMPM**
1 Osteoarthritis 303 4.2% $2,747,641 $766.00 $530.75 $220.73 $14.52
2 Cancer - Breast 38 0.5% $1,125,155 $2,472.87 $1,900.11 $482.88 $89.88
3 Coronary Artery Disease 85 1.2% $974,634 $962.13 $809.17 $145.94 $7.01
4 Cerebrovascular Disease 40 0.6% $927,032 $1,951.65 $1,697.55 $252.03 $2.07
5 Renal Function Failure 21 0.3% $833,294 $3,703.53 $3,511.93 $189.53 $2.06
6 Hypertension, Essential 537 7.4% $817,914 $129.95 $71.68 $47.90 $10.38
7 Spinal/Back Disorders, Excl. Low 110 1.5% $723,654 $551.57 $398.49 $151.43 $1.65
8 Cardiac Arrhythmias 59 0.8% $676,514 $989.06 $831.12 $157.56 $0.37
9 Diabetes 313 4.3% $675,383 $184.78 $64.60 $75.93 $44.25
10 Fracture/Disloc - Hip/Fem Head 11 0.2% $664,571 $5,034.63 $4,267.39 $766.33 $0.91
11 Spinal/Back Disorders, Lower Back 199 2.7% $616,811 $264.84 $138.33 $121.06 $5.45
12 Tumors - Central Nervous Sys 8 0.1% $590,514 $6,947.22 $5,789.62 $1,152.41 $5.19
13 Pregnancy w Vaginal Delivery 49 0.7% $557,924 $961.94 $679.02 $282.50 $0.41
14 Hernia/Reflux Esophagitis 103 1.4% $550,963 $460.67 $322.52 $133.49 $4.66
15 ENT Disorders, NEC 87 1.2% $504,662 $504.16 $415.46 $84.55 $4.14
16 Cancer - Prostate 29 0.4% $493,809 $1,448.12 $593.63 $844.50 $9.99
17 Cancer - Pancreas 3 0.0% $471,061 $13,085.01 $11,817.26 $1,217.73 $50.02
18 Urinary Tract Calculus 63 0.9% $419,957 $562.19 $405.54 $156.21 $0.45
19 Myasthenia Gravis 3 0.0% $417,594 $11,599.83 $8,659.73 $2,921.89 $18.21
20 Infections - Body Sites, NEC 16 0.2% $389,886 $2,052.03 $1,808.88 $228.22 $14.93
Subtotal 2,077 28.7% $15,178,972 $622.78 $456.34 $151.53 $14.90
Debit $
Debit
PMPM
Average
Cost per
Service
Services
per
Member
Advanced/Critical Illness 3 0.0% $16,956 $471.01 $4,877 $135 $135 12.0
Multiple Chronic Illnesses 31 0.4% $143,780 $386.51 $55,095 $148 $186 9.5
At Risk 129 1.8% $314,089 $207.05 $121,188 $80 $108 8.7
Stable 365 5.0% $485,567 $112.61 $205,059 $48 $87 6.5
Healthy 416 5.7% $215,393 $45.32 $105,679 $22 $52 4.9
Total 944 13.0% $1,175,786 $106.99 $491,898 $45 $84 6.2
Total
Member
Debit $
Total
Member
PMPM
Preventive/Admin Encounters
Illness Band Members
% of
Total
Members
VII - 25
Copyright © 2016
All rights reserved

III. Profile of Episodes of Care
Subtotal
Dominant Episode: Coronary Artery Disease
# Dominant Comorbid Episode Members% of Total
Members
Gross
Debit $*
Institutional
Gross
Debit $*
Professional
Gross
Debit $*
Rx
Gross
Debit $*
Total Member
Gross
Debit $
1 Hypertension, Essential 25 3.6% $29,016 $9,533 $10,561 $8,922 $1,046,636
2 Cerebrovascular Disease 12 1.7% $41,882 $33,750 $6,673 $1,459 $800,666
3 Diabetes 25 3.6% $25,022 $1,928 $9,879 $13,214 $751,702
4 Cardiac Arrhythmias 17 2.5% $32,388 $24,048 $8,340 $0 $687,981
5 Congestive Heart Failure 7 1.0% $20,440 $13,700 $5,503 $1,237 $621,271
6 Osteoarthritis 11 1.6% $11,482 $6,483 $3,890 $1,110 $359,311
7 Vascular Disorders, Arterial 7 1.0% $11,064 $5,457 $4,613 $994 $294,945
8 Renal Function Failure 7 1.0% $30,659 $22,833 $7,510 $316 $254,827
9 Prostatic Disorders 4 0.6% $12,548 $9,313 $3,234 $0 $108,580
10 Chronic Obstruc Pulm Dis(COPD) 4 0.6% $12,582 $11,321 $1,262 $0 $47,827
Dominant Episode: Coronary Artery Disease
Dominant Comorbid Episode: Cardiac Arrhythmias
D. Dominant Episodes of Care for Band 1 - Advanced/Critical Illness
D. Detail of Dominant Episodes of Care for Band 1
D. Detail of Dominant Episodes of Care for Band 1
This chart displays the most expensive dominant episodes for Members in Band 1. It shows gross debits in the trailing 12 months as of July, 2015 for Members with a
primary dominant episode, as well as gross debits for other episodes related to the dominant episode. Click on any underlined field below to see additional
information.
This chart displays other episodes Members have in conjunction with the dominant episode over the trailing 12 months as July, 2015. This provides additional details
on the cost of comorbid episodes. Click on any underlined field below to see additional information.
This chart provides Member level information for dominant and related comorbid episodes over the trailing 12 months as of July, 2015. The Member Health Record
(MHR) for each Member can be accessed by clicking on the Member’s name below.
* Dominant Episode Gross Debit $ shows only debits associated with the dominant episode.
* Dominant Comorbid Episode Gross Debit $ shows only debits associated with the dominant comorbid episode.
Sample Drill Through
Sample Drill Through
# Dominant Episode Members
% of Total
Members
in Band 1
Gross
Debit $*
Institutional
Gross
Debit $*
Professional
Gross
Debit $*
Rx
Gross
Debit $*
Total Member
Gross
Debit $
% of Total
Gross
Debit $ in Band 1
1 Cerebrovascular Disease 14 2.7% $733,901 $660,707 $72,209 $985 $1,070,268 6.5%
2 Renal Function Failure 14 2.7% $748,780 $711,344 $37,376 $61 $1,014,804 6.2%
3 Osteoarthritis 18 3.5% $693,530 $569,084 $122,642 $1,804 $893,849 5.4%
4 Cancer - Breast 13 2.5% $768,084 $600,293 $127,351 $40,440 $844,258 5.1%
5 Hypertension, Essential 11 2.2% $336,410 $302,969 $32,354 $1,087 $779,335 4.7%
6 Coronary Artery Disease 17 3.3% $659,440 $584,746 $74,521 $174 $770,846 4.7%
7 Fracture/Disloc - Hip/Fem Head 3 0.6% $655,676 $559,372 $96,198 $106 $667,719 4.1%
8 Tumors - Central Nervous Sys 4 0.8% $577,777 $483,367 $93,968 $441 $664,711 4.0%
9 Infections - Body Sites, NEC 2 0.4% $372,994 $334,280 $38,714 $0 $658,724 4.0%
10 Cancer - Pancreas 3 0.6% $471,061 $425,421 $43,838 $1,801 $631,897 3.8%
Subtotal 99 19.4% $6,978,285 $5,850,445 $1,078,339 $49,501 $9,400,843 56.0%
#Member
NameDOB Provider
Total Member
Gross Debit $
in Band 1
1 John White 11/23/1964 Bonnie Beige $101,732
2 Sam Green 12/07/1963 Irene Indigo $96,524
17 JaGross Black 3/3/1961 Robin Red $9,295
VII - 26
Copyright © 2016
All rights reserved

III. Profile of Episodes of Care
Subtotal
Dominant Episode: Osteoarthritis
# Dominant Comorbid Episode Members% of Total
Members
Gross
Debit $*
Institutional
Gross
Debit $*
Professional
Gross
Debit $*
Rx
Gross
Debit $*
Total Member
Gross
Debit $
1 Hypertension, Essential 61 5.0% $24,289 $4,773 $15,700 $3,816 $1,064,028
2 Prevent/Admin Hlth Encounters 56 4.5% $18,555 $1,873 $11,974 $4,708 $768,596
3 Diabetes 22 1.8% $10,639 $915 $8,858 $866 $311,659
4 Arthropathies/Joint Disord NEC 13 1.1% $10,215 $2,308 $7,219 $687 $221,420
5 Spinal/Back Disorders, NEC 20 1.6% $14,115 $3,799 $9,132 $1,184 $209,582
6 Headache, Migraine/Muscle Tens 10 0.8% $7,069 $1,874 $3,763 $1,432 $187,239
7 Hernia/Reflux Esophagitis 16 1.3% $7,107 $2,750 $3,603 $755 $187,062
8 Vascular Disorders, Arterial 7 0.6% $39,496 $31,678 $5,615 $2,203 $125,503
9 Injury - Knee 5 0.4% $20,418 $12,513 $7,904 $2 $91,761
10 Neurological Disorders, NEC 9 0.7% $7,191 $2,251 $4,037 $903 $48,800
Dominant Episode: Osteoarthritis
Dominant Comorbid Episode: Diabetes
* Dominant Episode Gross Debit $ shows only debits associated with the dominant episode.
* Dominant Comorbid Episode Gross Debit $ shows only debits associated with the dominant comorbid episode.
This chart displays other episodes Members have in conjunction with the dominant episode over the trailing 12 months as of July, 2015. This provides additional details on
the cost of comorbid episodes. Click on any underlined field below to see additional information.
E. Dominant Episodes of Care for Band 2 - Multiple Chronic Illnesses
E. Detail of Dominant Episodes of Care for Band 2
E. Detail of Dominant Episodes of Care for Band 2
This chart displays the most expensive dominant episodes for Members in Band 2. It shows gross debits in the trailing 12 months as of July, 2015 for Members with a
primary dominant episode, as well as gross debits for other episodes related to the dominant episode. Click on any underlined field below to see additional information.
This chart provides Member level information for dominant and related comorbid episodes over the trailing 12 months as of July, 2015. The Member Health Record
(MHR) for each Member can be accessed by clicking on the Member’s name below.
Sample Drill Through
Sample Drill Through
# Member Name DOB Provider
Total Member
Gross Debit $
in Band 2
1 Shelly White 11/23/1964 Peter Black $24,758
2 Evan Gray 12/07/1963 Donald Daisy $15,623
22 Susan Brown 3/3/1961 Ray Purple $2,998
# Dominant Episode Members
% of Total
Members
in Band 2
Gross
Debit $*
Institutional
Gross
Debit $*
Professional
Gross
Debit $*
Rx
Gross
Debit $*
Total Member
Gross
Debit $
% of Total
Gross
Debit $ in Band 2
1 Osteoarthritis 82 6.1% $1,282,428 $943,383 $319,091 $19,954 $1,746,894 14.6%
2 Diabetes 51 3.8% $181,293 $41,835 $80,976 $58,482 $428,313 3.6%
3 Cancer - Breast 9 0.7% $333,351 $256,411 $76,814 $127 $414,727 3.5%
4 Coronary Artery Disease 30 2.2% $261,925 $208,160 $50,301 $3,464 $388,563 3.2%
5 Myasthenia Gravis 2 0.1% $308,581 $206,810 $101,116 $656 $335,720 2.8%
6 Hypertension, Essential 55 4.1% $133,580 $57,578 $63,471 $12,531 $312,670 2.6%
7 Spinal/Back Disorders, Excl. Low 16 1.2% $199,840 $139,262 $60,524 $54 $282,983 2.4%
8 Spinal/Back Disorders, Lower Back 21 1.6% $166,458 $86,973 $77,817 $1,668 $275,587 2.3%
9 Cancer - Prostate 6 0.4% $229,165 $136,389 $90,656 $2,119 $272,647 2.3%
10 Pregnancy w Vaginal Delivery 13 1.0% $198,523 $143,188 $55,249 $86 $264,459 2.2%
Subtotal 285 21.3% $3,295,145 $2,219,989 $976,015 $99,141 $4,722,562 39.5%
VII - 27
Copyright © 2016
All rights reserved

III. Profile of Episodes of Care
Subtotal
Dominant Episode: Osteoarthritis
# Dominant Comorbid Episode Members% of Total
Members
Gross
Debit $*
Institutional
Gross
Debit $*
Professional
Gross
Debit $*
Rx
Gross
Debit $*
Total Member
Gross
Debit $1 Prevent/Admin Hlth Encounters 64 4.0% $18,971 $3,682 $11,844 $3,445 $480,185
2 Hypertension, Essential 57 3.5% $11,242 $0 $8,848 $2,394 $345,433
3 Spinal/Back Disorders, Excl. Low 14 0.9% $11,733 $810 $10,923 $0 $183,914
4 Spinal/Back Disorders, NEC 13 0.8% $12,502 $3,198 $9,304 $0 $156,355
5 Arthropathies/Joint Disord NEC 14 0.9% $6,095 $169 $5,453 $473 $120,148
6 Diabetes 24 1.5% $9,780 $260 $7,498 $2,022 $99,656
7 Eye Disorders, NEC 8 0.5% $9,177 $6,211 $2,823 $142 $85,061
8 Gastritis/Gastroenteritis 8 0.5% $7,216 $1,783 $4,717 $715 $48,405
9 Gastroint Disord, NEC 10 0.6% $6,074 $2,286 $3,780 $8 $46,457
10 Hallux Deformities 2 0.1% $7,087 $4,412 $2,676 $0 $39,671
Dominant Episode: Osteoarthritis
Dominant Comorbid Episode: DiabetesThis chart provides Member level information for dominant and related comorbid episodes over the trailing 12 months as of July, 2015. The Member Health Record (MHR) for
each Member can be accessed by clicking on the Member’s name below.
* Dominant Episode Gross Debit $ shows only debits associated with the dominant episode.
* Dominant Comorbid Episode Gross Debit $ shows only debits associated with the dominant comorbid episode.
F. Dominant Episodes of Care for Band 3 - At Risk
F. Detail of Dominant Episodes of Care for Band 3
F. Detail of Dominant Episodes of Care for Band 3
This chart displays the most expensive dominant episodes for Members in Band 3. It shows gross debits in the trailing 12 months as of July, 2015 for Members with a primary
dominant episode, as well as gross debits for other episodes related to the dominant episode. Click on any underlined field below to see additional information.
This chart displays other episodes Members have in conjunction with the dominant episode over the trailing 12 months as of July, 2015. This provides additional details on the
cost of comorbid episodes. Click on any underlined field below to see additional information.
Sample Drill Through
Sample Drill Through
#Member
NameDOB Provider
Total Member
Gross Debit $
in Band 3
1 Laura Black 11/23/1964 Samuel Yellow $17,529
2 Harry Rose 12/07/1963 Ace Emerald $7,632
24 Cynthia Blue 3/3/1961 Ronald Brown $1,159
# Dominant Episode Members
% of Total
Members
in Band 3
Gross
Debit $*
Institutional
Gross
Debit $*
Professional
Gross
Debit $*
Rx
Gross
Debit $*
Total Member
Gross
Debit $
% of Total
Gross
Debit $ in Band 3
1 Osteoarthritis 102 6.6% $600,242 $339,544 $238,644 $22,054 $848,198 10.1%
2 Diabetes 87 5.6% $220,085 $66,622 $86,223 $67,241 $430,524 5.2%
3 Rheumatoid Arthritis 18 1.2% $255,696 $61 $215,854 $39,781 $355,433 4.3%
4 Spinal/Back Disorders, Lower Back 56 3.6% $198,214 $106,947 $90,631 $636 $355,267 4.3%
5 Pregnancy w Vaginal Delivery 25 1.6% $286,449 $196,911 $89,386 $153 $318,460 3.8%
6 Hypertension, Essential 100 6.5% $128,255 $44,852 $71,824 $11,579 $277,381 3.3%
7 Tumors - Gynecological, Benign 19 1.2% $151,460 $103,428 $47,983 $49 $270,310 3.2%
8 Fracture/Disloc - Upper Extrem 25 1.6% $134,228 $85,591 $48,597 $41 $227,772 2.7%
9 Multiple Sclerosis 8 0.5% $117,286 $867 $10,644 $105,775 $222,699 2.7%
10 Spinal/Back Disorders, Excl. Low 23 1.5% $132,278 $84,499 $47,738 $41 $199,949 2.4%
Subtotal 463 29.9% $2,224,194 $1,029,321 $947,523 $247,350 $3,505,992 41.9%
VII - 28
Copyright © 2016
All rights reserved

IV. Key Use Patterns
This section of the SearchLight Report displays admission, readmission, ER visit, and prescription drug patterns for Members
in the Panel. These patterns are essential to see and understand in any attempt to control health care costs and achieve better
outcomes for the Members involved. Readmissions are defined as the occurrence of a Member admission to a hospital within
30 days of a prior hospitalization discharge date. Hospital based services are not only the most expensive of all services, but
are indicators of serious illness in many cases. For these reasons, they are separately reported and displayed to focus attention
on Members who have had these services.
The extent and use of prescription drugs is also a key indicator of Member illness status. Drug spending now approximates
inpatient hospital spending as a percentage of overall medical costs. Drug treatment is the most common form of therapeutic
intervention in medicine and is most often taken at home where compliance/adherence to protocols is often most difficult to
monitor. It is not uncommon to see Members who are taking a dozen or more prescription drugs prescribed by different
providers at different times, often without the knowledge of the Primary Care Provider (or Nurse Practitioner). Hence, gaining
a comprehensive view of the medications a Member is taking is critical to avoiding progression in disease and avoiding
breakdowns causing ER visits and/or admissions/readmissions.
Prescription drug data presented in the following section is grouped into three categories:
• Mail/Retail Pharmacy Drugs - include drugs that are paid under a Member's separate pharmacy benefit. These
are generally prescriptions for brand and/or generic drugs that Members obtain from their local pharmacy or by
mail order through a Pharmacy Benefit Manager (PBM). For reporting purposes, specialty drugs are excluded
from all Mail/Retail Pharmacy Drug calculations and are reported separately.
• Medical Drugs - include drugs that are paid under a Member's medical benefit and are filed as part of a medical
claim. Medical drugs typically include drugs such as vaccinations and birth control drugs/devices, as well as
chemotherapy drugs. For reporting purposes, specialty drugs are excluded from all Medical Drug calculations
and are reported separately.
• Specialty Drugs - include drugs that generally require special storage and/or handling and close monitoring of
the Member's drug therapy. Specialty drugs are typically injected or infused. These can be paid under either the
pharmacy or medical benefit.
Hospital data is broken down into three categories: High, Mid, and Low Cost hospitals as measured by Inpatient Cost per
Admission, Emergency Room Visit Cost and Cost per Outpatient Visit.
VII - 29
Copyright © 2016
All rights reserved

IV. Key Use Patterns
Red General Hospital
Yellow County General
Lavender Hospital Ctr
Gold Medical Ctr
Cornflower-Blue Medical Ctr
Other Hospitals
Total
Admission and Readmission Gross Debits by Hospital This chart shows the top ten most frequently used hospitals for Members attributed to the Panel for the trailing 12 months as of July, 2015. It includes the gross debits of
admissions and readmissions by hospital. The hospital Cost Tier (High, Mid, Low), a measure of total hospital based cost, is shown for each hospital used in the CareFirst
service area. Note that a single Member may have multiple admissions or readmissions displayed. Readmissions and associated rates include all Member admissions for
any reason within 30, 60 or 90 days of a previous discharge. Readmissions are cumulative, so the 60 and 90 day figures will include counts from preceding columns.
A. Admissions and Readmissions and Gross Debits by Hospital
Admissions and Readmissions by Hospital This chart shows the top ten most frequently used hospitals for Members attributed to the Panel for the trailing 12 months as of July, 2015. It includes the number of
admissions, readmissions, and associated percentages by hospital. The hospital Cost Tier (High, Mid, Low), a measure of total hospital based cost, is shown for each
hospital used in the CareFirst service area. Note that a single Member may have multiple admissions or readmissions displayed. Readmissions and associated rates include
all Member admissions for any reason within 30, 60 or 90 days of a previous discharge. Readmissions are cumulative, so the 60 and 90 day figures will include counts from
preceding columns.
30 Day
Readmissions
60 Day
Readmissions
90 Day
Readmissions
Count % Count% of
AdmissionsCount
% of
AdmissionsCount
% of
Admissions
Brown Hospital Cntr High 23 6.2% 5 7.7% 6 6.8% 7 6.9%
Beige Memorial High 20 5.4% 4 6.2% 5 5.7% 7 6.9%
Blue Hospital High 16 4.3% 2 3.1% 4 4.5% 5 4.9%
Green Medical Ctr Mid 73 19.7% 21 32.3% 31 35.2% 35 34.3%
Purple Agnes Hospital Mid 34 9.2% 2 3.1% 3 3.4% 3 2.9%
Red General Hospital Mid 24 6.5% 4 6.2% 6 6.8% 7 6.9%
Yellow County General Mid 23 6.2% 1 1.5% 1 1.1% 1 1.0%
Lavender Hospital Ctr Low 85 22.9% 5 7.7% 7 8.0% 9 8.8%
Gold Medical Ctr Low 39 10.5% 9 13.8% 11 12.5% 12 11.8%
Cornflower-Blue Medical Ctr Low 32 8.6% 12 18.5% 13 14.8% 15 14.7%
Other Hospitals 2 0.5% 0 0.0% 1 1.1% 1 1.0%
Total 371 100.0% 65 100.0% 88 100.0% 102 100.0%
Total
AdmissionsHospital
Cost
Tier
Gross
Debit $
Gross Debit $
per
Admission
Gross
Debit $
Gross Debit $
per
Readmission
Gross
Debit $
Gross Debit $
per
Readmission
Gross
Debit $
Gross Debit $
per
Readmission
Brown Hospital Cntr High $1,828,985 $52,270 $183,726 $25,854 $144,544 $105,075 $146,731 $89,091
Beige Memorial High $1,585,579 $42,921 $509,294 $45,318 $619,088 $39,721 $647,696 $36,599
Blue Hospital High $867,443 $25,420 $149,915 $72,537 $170,315 $41,141 $174,408 $57,275
Green Medical Ctr Mid $396,160 $5,427 $113,964 $6,756 $22,596 $42,596 $22,596 $22,596
Purple Agnes Hospital Mid $972,086 $13,299 $18,278 $28,278 $8,278 $18,278 $8,278 $10,278
Red General Hospital Mid $518,975 $36,234 $1,732 $17,732 $1,732 $11,732 $1,732 $11,732
Yellow County General Mid $1,800,233 $16,539 $49,258 $19,362 $61,699 $17,575 $70,881 $15,840
Lavender Hospital Ctr Low $385,815 $13,974 $78,968 $19,742 $78,968 $19,742 $78,968 $19,742
Gold Medical Ctr Low $415,875 $10,378 $36,479 $11,076 $63,529 $14,910 $69,338 $20,719
Cornflower-Blue Medical Ctr Low $9,687 $12,456 $17,837 $12,837 $17,837 $17,837 $17,837 $17,837
Other Hospitals $18,986 $9,493 $9,387 $9,387 $9,200 $9,200
Total $8,799,824 $23,719 $1,159,451 $25,949 $1,197,971 $30,727 $1,247,664 $28,264
30 Day Readmissions 60 Day Readmissions 90 Day Readmissions
HospitalCost
Tier
Total Admissions
VII - 30
Copyright © 2016
All rights reserved

IV. Key Use Patterns
0.3
0.25
0.3
B. ER and Outpatient Visits and Gross Debits by Hospital
ER and Outpatient Gross Debits by Hospital This chart shows the top ten most frequently used hospitals for Members attributed to the Panel for the trailing 12 months as of July, 2015. It includes the gross debits of observation stays, ER and outpatient
visits by hospital. The hospital Cost Tier (High, Mid, Low), a measure of total hospital based cost is shown for each hospital used in the CareFirst service area. Note that a single Member may have multiple
visits displayed.
ER and Outpatient Visits by HospitalThis chart shows the top ten most frequently used hospitals for Members attributed to the Panel for the trailing 12 months as of July, 2015. It includes the number of observation stays, ER and outpatient visits
and associated percentages by hospital. The hospital Cost Tier (High, Mid, Low), a measure of total hospital based cost, is shown for each hospital used in the CareFirst service area. Note that a single
Member may have multiple visits displayed.
Gross
Debit $
Gross Debit $
per Visit
Gross
Debit $
Gross Debit $
per Visit
Gross
Debit $
Gross Debit $
per Visit
Gross
Debit $
Gross Debit $
per Visit
Gross
Debit $
Gross Debit $
per Visit
Gross
Debit $
Gross Debit $
per Visit
Gross
Debit $
Gross Debit $
per Visit
Yellow County General High $602,734 $4,305 $88,324 $11,041 $77,923 $19,481 $43,000 $1,000 $218,946 $3,084 $107,214 $11,913 $67,328 $13,466
Gold Medical Ctr High $477,265 $1,356 $67,542 $2,702 $54,992 $27,496 $45,500 $500 $187,837 $1,055 $97,226 $2,778 $24,168 $1,151
Cornflower-Blue Medical Ctr High $250,811 $2,200 $32,834 $2,345 $44,823 $8,965 $28,543 $1,297 $95,549 $1,837 $16,137 $1,345 $32,925 $3,658
Beige Memorial Mid $304,179 $1,878 $57,992 $11,598 $93,234 $15,539 $36,487 $793 $86,832 $868 $17,677 $5,892 $11,957 $5,978
Green Medical Ctr Mid $239,408 $1,946 $83,947 $41,974 $43,653 $6,236 $14,862 $991 $83,304 $1,157 $10,029 $669 $3,613 $301
Red General Hospital Mid $278,150 $619 $21,343 $328 $25,393 $1,693 $18,765 $123 $186,602 $910 $10,066 $1,438 $15,981 $3,995
Lavender Hospital Ctr Mid $234,775 $5,460 $66,784 $16,696 $92,473 $30,824 $15,864 $3,173 $43,053 $2,266 $11,049 $1,578 $5,553 $1,111
Brown Hospital Cntr Low $196,711 $1,948 $78,892 $5,635 $35,734 $2,978 $29,652 $2,281 $46,552 $776 $3,496 $3,496 $2,386 $2,386
Blue Hospital Low $212,973 $2,218 $47,325 $910 $53,934 $3,596 $25,352 $4,225 $57,535 $4,795 $24,652 $3,522 $4,175 $1,044
Purple Agnes Hospital Low $122,485 $1,856 $73,234 $2,034 $25,962 $1,442 $0 $0 $9,882 $1,976 $11,982 $2,396 $1,425 $713
Other Hospitals $521,741 $1,991 $24,850 $2,761 $6,150 $683 $67,989 $7,554 $395,366 $13,633 $8,405 $467 $18,980 $101
Total $3,441,232 $1,804 $643,067 $2,522 $554,271 $3,976 $326,014 $2,499 $1,411,458 $2,499 $317,932 $2,097 $188,490 $290
Hospital
Cost
Tier
Total Outpatient
ER Visits Outpatient Visits
w/Surgery w/o Surgery w/Surgery w/o Surgery w/Surgery w/o Surgery
Observation Stays
#
% of
Total#
% of
Total#
% of
Total#
% of
Total#
% of
Total#
% of
Total#
% of
Total
Yellow County General High 140 7.3% 4 4.2% 8 3.4% 43 10.7% 71 8.8% 5 2.0% 9 7.6%
Gold Medical Ctr High 352 18.4% 2 2.1% 25 10.7% 91 22.6% 178 22.2% 21 8.3% 35 29.4%
Cornflower-Blue Medical Ctr High 114 6.0% 5 5.2% 14 6.0% 22 5.5% 52 6.5% 9 3.6% 12 10.1%
Beige Memorial Mid 162 8.5% 6 6.3% 5 2.1% 46 11.4% 100 12.5% 2 0.8% 3 2.5%
Green Medical Ctr Mid 123 6.4% 7 7.3% 2 0.9% 15 3.7% 72 9.0% 12 4.7% 15 12.6%
Red General Hospital Mid 449 23.5% 15 15.6% 65 27.8% 153 38.0% 205 25.5% 4 1.6% 7 5.9%
Lavender Hospital Ctr Mid 43 2.3% 3 3.1% 4 1.7% 5 1.2% 19 2.4% 5 2.0% 7 5.9%
Brown Hospital Cntr Low 101 5.3% 12 12.5% 14 6.0% 13 3.2% 60 7.5% 1 0.4% 1 0.8%
Blue Hospital Low 96 5.0% 15 15.6% 52 22.2% 6 1.5% 12 1.5% 4 1.6% 7 5.9%
Purple Agnes Hospital Low 66 3.5% 18 18.8% 36 15.4% 0 0.0% 5 0.6% 2 0.8% 5 4.2%
Other Hospitals 262 13.7% 9 9.4% 9 3.8% 9 2.2% 29 3.6% 188 74.3% 18 15.1%
Total 1,908 100.0% 96 100.0% 234 100.0% 403 100.0% 803 100.0% 253 100.0% 119 100.0%
w/o Surgery
Hospital
Cost
Tier
Total Outpatient
Observation Stays ER Visits Outpatient Visits
w/Surgery w/o Surgery w/Surgery w/o Surgery w/Surgery
VII - 31
Copyright © 2016
All rights reserved

IV. Key Use Patterns
C. Hospital Admissions/Readmissions by Month
D. Hospital Admission/Readmissions Gross Debits by Month
E. ER Visits by Month
F. ER Visits Gross Debits by Month
This chart shows the number of hospital admissions/readmissions of Members by month and illness band for the trailing 12 months as of July, 2015.
This chart shows gross debits incurred for hospital admission/readmissions of Members by month and illness band for the trailing 12 months as of July, 2015.
This chart shows the number of ER visits of Members by month and illness band for the trailing 12 months as of July, 2015.
This chart shows gross debits incurred for ER visits of Members by month and illness band for the trailing 12 months as of July, 2015.
Illness Band Jan-15 Feb-15 Mar-15 Apr-15 May-15 Jun-15 Jul-15 Aug-15 Sep-15 Oct-15 Nov-15 Dec-15 Total
Advanced/Critical Illness 27 40 37 35 32 40 21 232
Multiple Chronic Illnesses 19 14 19 12 8 17 13 102
At Risk 1 6 3 3 6 1 9 29
Stable 1 2 1 3 7
Healthy 1 1
Total 47 60 60 50 48 59 47 371
Illness Band Jan-15 Feb-15 Mar-15 Apr-15 May-15 Jun-15 Jul-15 Aug-15 Sep-15 Oct-15 Nov-15 Dec-15 Total
Advanced/Critical Illness $1,019,515 $826,824 $1,109,572 $957,177 $1,123,536 $869,452 $849,523 $6,755,600
Multiple Chronic Illnesses $319,446 $223,326 $104,617 $314,649 $244,395 $269,922 $167,170 $1,643,526
At Risk $47,742 $70,639 $57,691 $33,897 $43,976 $11,531 $60,045 $325,520
Stable $9,660 $16,985 $9,687 $30,125 $66,457
Healthy $8,722 $8,722
Total $1,386,703 $1,120,789 $1,281,540 $1,305,723 $1,411,907 $1,150,905 $1,076,738 $8,799,824
Illness Band Jan-15 Feb-15 Mar-15 Apr-15 May-15 Jun-15 Jul-15 Aug-15 Sep-15 Oct-15 Nov-15 Dec-15 Total
Advanced/Critical Illness 66 50 66 67 65 56 57 427
Multiple Chronic Illnesses 58 57 66 61 58 66 58 424
At Risk 33 27 32 26 26 38 41 223
Stable 30 17 29 31 15 26 23 171
Healthy 3 2 2 3 6 4 6 26
Total 190 153 195 188 170 190 185 1,271
Illness Band Jan-15 Feb-15 Mar-15 Apr-15 May-15 Jun-15 Jul-15 Aug-15 Sep-15 Oct-15 Nov-15 Dec-15 Total
Advanced/Critical Illness $39,776 $28,913 $41,444 $38,771 $41,077 $38,289 $35,278 $263,548
Multiple Chronic Illnesses $27,088 $26,905 $36,561 $31,502 $30,581 $36,257 $27,710 $216,603
At Risk $14,929 $12,170 $15,725 $9,842 $11,445 $17,257 $17,772 $99,141
Stable $12,462 $7,565 $11,822 $14,742 $7,018 $13,276 $12,648 $79,533
Healthy $1,485 $680 $687 $1,173 $2,590 $1,480 $2,335 $10,429
Total $95,739 $76,233 $106,238 $96,030 $92,711 $106,559 $95,743 $669,253
VII - 32
Copyright © 2016
All rights reserved

IV. Key Use Patterns
*No specific Primary Care Provider identified due to lack of specific rendering provider ID on claims.
Members% of
BandMembers
% of
BandMembers
% of
Band
Advanced/Critical Illness 549 120 21.9% 8 1.5% 4 0.7%
Multiple Chronic Illnesses 1,453 111 7.6% 2 0.1% 6 0.4%
At Risk 1,673 27 1.6% 1 0.1% 2 0.1%
Stable 2,359 8 0.3% 0 0.0% 0 0.0%
Healthy 1,654 3 0.2% 0 0.0% 0 0.0%
Total 7,688 269 3.5% 18 0.2% 12 0.2%
3+ Admissions
Illness Band: Advanced Critical
This chart displays detailed admission information at the Member level. Care Management Programs include Hospital Transition of Care (HTC), Complex Case
Management (CCM), Chronic Care Coordination (CCC), Home Based Services (HBS), Enhanced Monitoring Program (EMP), Comprehensive Medication
Review (CMR), Community Based Programs (CBP), Pharmacy Coordination Program (RxP), Expert Consult Program (ECP), and Health Assessment over the
trailing 12 months as of July, 2015. The Member's status in these programs is indicated as follows: Active (A), Closed (C), Member Refused (R), or PCP
Declined (D). The Member Health Record (MHR) for each Member can be accessed by clicking on the Member’s name below.
H. Members with Admissions/Readmissions - All Bands
*Additional information on Member care coordination activities can be viewed through the care plan links on the Member roster.
Illness BandTotal
Members
1 Admission 2 Admissions 3+ Admissions
H. Detail of Members with Admissions/Readmissions
G. Hospital Admissions/Readmissions by ProviderThis chart shows hospital admissions and readmissions and associated debits by provider over the trailing 12 months as of July, 2015. Admissions are also
broken out into two types: Planned (direct admissions) and Unplanned (immediately preceded by an Emergency Room Visit).
This chart shows hospital admissions and readmissions for Members by illness band over the trailing 12 months as of July, 2015. This chart also shows counts for
unique Members rather than counts for each admission event. Click on any underlined field below to see additional information.
Sample Drill Through
Member
NameDOB Provider
Admission
DateEpisode Hospital Name Admissions
Gross
Debit $ Per
Admission
Care Coordination
Program/Status*
Anthony Lavender 11/23/1964 Bob Blue 10/29/2013 Osteoarthritis Franklin Square Hospital 1 $31,941 CCM (C), CCC (A), HTC
Gary White 12/07/1963 Ray Purple 11/4/2013 Condition Rel to Tx - Med/Surg Franklin Square Hospital 1 $19,965 CCM (C), CCC (A), HTC
Penelope Peach 09/18/1935 Robin Red 3/12/2013 Infec/Inflam - Skin/Subcu Tiss Northwest Hospital Center 1 $3,708 CCM (C), CCC (R), HTC
Black White 03/03/1961 Gary Green 3/18/2013 Infec/Inflam - Skin/Subcu Tiss Northwest Hospital Center 1 $5,390 CCM (C), CCC (R), HTC
Eddie Fusie 10/12/1931Fletch Orange 4/10/2013 Pneumonia, Bacterial Franklin Square Hospital 1 $7,332 CCC (C)
Sally Yellow 08/09/1999Ronald Brown 6/5/2013 Pneumonia, Bacterial Franklin Square Hospital 1 $12,406 CCC (C)
Admissions Admission Debits
Total
Count
Planned
Count
Unplanned
Count
Planned
%
Unplanned
%
Total
$
Planned
$
Unplanned
$
Average
$
Average
Planned $
Average
Unplanned
Bob Blue 54 56 42 14 75.0% 25.0% $1,334,457 $400,337 $934,120 $23,830 $9,531.84 $66,722.85
Ray Purple 46 50 32 18 64.0% 36.0% $948,857 $379,543 $569,314 $18,977 $11,861 $31,629
Robin Red 42 51 30 21 58.8% 41.2% $839,416 $419,708 $419,708 $16,459 $13,990 $19,986
Gary Green 38 38 25 13 65.8% 34.2% $656,760 $295,542 $361,218 $17,283 $11,822 $27,786
Irene Indigo 33 36 30 6 83.3% 16.7% $429,597 $128,879 $300,718 $11,933 $4,296 $50,120
Fletch Orange 21 25 15 10 60.0% 40.0% $488,696 $201,343 $287,353 $19,548 $13,423 $28,735
Ronald Brown 19 40 30 10 75.0% 25.0% $537,923 $188,273 $349,650 $13,448 $6,276 $34,965
Bonnie Beige 9 11 9 2 81.8% 18.2% $329,153 $82,288 $246,865 $29,923 $9,143 $123,432
S. Cornflower-Blue 5 14 5 9 38.0% 62.0% $175,699 $79,064 $96,634 $12,550 $14,862 $11,133
Peter Black 3 10 9 1 90.0% 10.0% $334,994 $122,273 $212,721 $33,499 $13,586 $212,721
Attributed to Panel* 1 1 1 100.0% 0.0% $48,661 $48,661 $48,661 $48,661
Total 299 371 228 143 61.5% 38.5% $8,799,824 $6,283,028 $2,516,796 $23,719 $27,519 $17,639
Provider
Members
with
Admission
VII - 33
Copyright © 2016
All rights reserved

IV. Key Use Patterns
Members% of
BandMembers
% of
BandMembers
% of
Band
Advanced/Critical Illness 549 231 42.1% 68 12.4% 17 3.1%
Multiple Chronic Illnesses 1,453 396 27.3% 55 3.8% 7 0.5%
At Risk 1,673 289 17.3% 19 1.1% 2 0.1%
Stable 2,359 244 10.3% 6 0.3% 0 0.0%
Healthy 1,654 46 2.8% 0 0.0% 0 0.0%
Total 7,688 1,206 15.7% 148 1.9% 26 0.3%
ER Visits: 6+
Illness Band: Advanced Critical
I. Members with ER Visits - All Bands
I. Detail of Members with ER Visits
J. Top 10 Procedures in Both ASC and Outpatient Hospital Settings The chart below shows the Panel's top 10 procedures - based on total Outpatient use routinely performed in both the Ambulatory Surgery Center (ASC) and
Outpatient Hospital settings - along with frequency and average costs for the trailing 12 months as of July, 2015. Data is sorted by Outpatient Hospital
use.
This chart shows unique Members with multiple ER visits by illness band over the trailing 12 months as of July, 2015. Click on any underlined field below to see
additional information.
This chart displays detailed ER visit information at the Member level. Care Management Programs include Hospital Transition of Care (HTC), Complex Case
Management (CCM), Chronic Care Coordination (CCC), Home Based Services (HBS), Enhanced Monitoring Program (EMP), Comprehensive Medication Review
(CMR), Community Based Programs (CBP), Pharmacy Coordination Program (RxP), Expert Consult Program (ECP), and Health Assessment over the trailing 12
months as of July, 2015. The Member's status in these programs is indicated as follows: Active (A), Closed (C), Member Refused (R), or PCP Declined (D). The
Member Health Record (MHR) for each Member can be accessed by clicking on the Member’s name below.
*Additional information on Member care coordination activities can be viewed through the care plan links on the Member roster.
Illness BandTotal
Members
3-5 Visits 6+ Visits1-2 Visits
Sample Drill Through
Member
NameDOB Provider
Service
DateDiagnosis Hospital Name ER Visits
ER Visit
Debit $
Care Coordination
Program Status*
Eddie Fusie 11/23/1964 Bob Blue 7/5/2014 Other Pulmonary Embolism And Infarction Good Samaritan Hospital 1 $837 CCM (A), HTC
Anthony Lavender 12/07/1963 Ray Purple 6/18/2014 Constipation , Unspecified University Of Maryland Medical 1 $786 CCM (A), HTC
Gary White 09/18/1935 Robin Red 5/22/2014 Other Pulmonary Embolism And Infarction Johns Hopkins Hospital 1 $1,692 CCM (A), HTC
Penelope Peach 03/03/1961 Gary Green 5/19/2014 Venous Embolism And Thrombosis Of Deep Vessels Good Samaritan Hospital 1 $629 CCM (A), HTC
Black White 05/09/1992 Ronald Brown 5/10/2014 Deep Vein Thrombosis Nos Dvt Nos Good Samaritan Hospital 1 $831 CCM (A), HTC
Sally Yellow 10/12/1931 Fletch Orange 5/2/2014 Venous Embolism And Thrombosis Of Deep Vessels University Of Maryland Medical 1 $1,242 CCM (A), HTC
Outpatient Hospital ASC
#
Panel
%
PCMH
Average Cost
per Procedure #
Panel
%
PCMH
Average Cost
per Procedure
PCMH
%
76942 Echo Guide For Biopsy 87 62 71.3% $260 25 28.7% $78 75.1%
43239 Upper GI Endoscopy Biopsy 219 52 23.7% $605 167 76.3% $388 76.1%
45378 Diagnostic Colonoscopy 192 45 23.4% $715 147 76.6% $495 77.6%
45380 Colonoscopy and Biopsy 115 37 32.2% $646 78 67.8% $504 72.5%
58558 Hysteroscopy Biopsy 27 24 88.9% $1,182 3 11.1% $735 23.5%
29881 Knee Arthroscopy/Surgery 41 23 56.1% $1,717 18 43.9% $1,714 24.7%
52000 Cystoscopy 81 21 25.9% $557 60 74.1% $280 64.4%
29826 Shoulder Arthroscopy/Surgery 24 19 79.2% $1,167 5 20.8% $1,072 38.2%
45385 Lesion Removal Colonoscopy 81 19 23.5% $671 62 76.5% $532 28.2%
29827 Arthroscopy Rotator Cuff Repair 17 12 70.6% $3,066 5 29.4% $1,790 74.5%
Other 611 258 42.2% $1,003 353 57.8% $643 52.5%
Total 1,495 572 38.3% $845 923 61.7% $541 62.8%
Procedure
Total
#
VII - 34
Copyright © 2016
All rights reserved

IV. Key Use Patterns
ER vs. Urgent Care Center, Convenience Care, and Office Settings - Weekend Visits
Average
Debit $
Panel
%
PCMH
%
Average
Debit $
Panel
%
PCMH
%
Average
Debit $
Panel
%
PCMH
%
Average
Debit $
Panel
%
PCMH
%
Advanced/Critical Illness 169 $632 82.3% 17.6% $134 10.5% 4.3% $134 10.5% 4.3% $115 10.8% 4.3%
Multiple Chronic Illnesses 322 $517 50.5% 24.7% $125 30.1% 13.7% $125 30.1% 13.7% $96 19.4% 9.7%
At Risk 201 $495 46.8% 21.0% $116 37.6% 18.6% $116 37.6% 18.6% $122 23.5% 13.7%
Stable 207 $442 34.0% 26.8% $118 43.2% 36.7% $118 43.2% 36.7% $99 34.1% 35.8%
Healthy 65 $510 13.9% 9.9% $103 73.9% 26.7% $103 73.9% 26.7% $106 18.3% 36.5%
Total 964 $537 42.5% 40.6% $118 37.2% 28.9% $118 37.2% 28.9% $104 20.2% 30.5%
ER vs. Urgent Care Center, Convenience Care, and Office Settings - Weekday Visits
Average
Debit $
Panel
%
PCMH
%
Average
Debit $
Panel
%
PCMH
%
Average
Debit $
Panel
%
PCMH
%
Average
Debit $
Panel
%
PCMH
%
Advanced/Critical Illness 1,285 $629 34.7% 19.9% $127 4.2% 4.1% $127 4.2% 4.1% $122 61.1% 6.5%
Multiple Chronic Illnesses 2,560 $554 17.7% 26.6% $116 9.0% 14.0% $116 9.0% 14.0% $112 73.3% 15.4%
At Risk 2,183 $472 12.4% 20.9% $117 10.6% 19.7% $117 10.6% 19.7% $107 77.1% 19.3%
Stable 2,412 $507 7.9% 24.2% $112 11.4% 37.6% $112 11.4% 37.6% $108 80.6% 34.5%
Healthy 585 $413 5.9% 8.4% $115 22.7% 24.6% $115 22.7% 24.6% $100 71.4% 24.4%
Total 9,025 $555 15.7% 8.5% $115 11.6% 85.0% $115 11.6% 85.0% $110 72.7% 6.5%
ER vs. Urgent Care Center, Convenience Care, and Office Settings - Weekend Visits
Average
Debit $
PCP
%
PCMH
%
Average
Debit $
PCP
%
PCMH
%
Average
Debit $
PCP
%
PCMH
%
Average
Debit $
PCP
%
PCMH
%
Peter Black 114 $542 21.9% 40.6% $123 21.1% 30.5% $123 21.1% 30.5% $100 57.0% 28.9%
Fer Brick-Red 95 $540 52.6% 40.6% $105 47.4% 30.5% $105 47.4% 30.5% $0 0.0% 28.9%
Attributed to Panel 2 $884 50.0% 40.6% $206 50.0% 30.5% $206 50.0% 30.5% $0 0.0% 28.9%
Sarah Cobalt 1 $0 0.0% 40.6% $0 0.0% 30.5% $0 0.0% 30.5% $202 100.0% 28.9%
Total 964 $537 42.5% 40.6% $118 37.2% 28.9% $118 37.2% 28.9% $104 20.2% 30.5%
ER vs. Urgent Care Center, Convenience Care, and Office Settings - Weekday Visits
Average
Debit $
PCP
%
PCMH
%
Average
Debit $
PCP
%
PCMH
%
Average
Debit $
PCP
%
PCMH
%
Average
Debit $
PCP
%
PCMH
%
Peter Black 1,025 $625 11.8% 8.5% $116 14.8% 6.5% $116 14.8% 6.5% $103 73.4% 85.0%
Fer Brick-Red 920 $513 12.7% 8.5% $111 5.5% 6.5% $111 5.5% 6.5% $99 81.7% 85.0%
Attributed to Panel 24 $263 8.3% 8.5% $120 12.5% 6.5% $120 12.5% 6.5% $89 79.2% 85.0%
Sarah Cobalt 16 $1,280 6.3% 8.5% $71 6.3% 6.5% $71 6.3% 6.5% $356 87.5% 85.0%
Total 9,025 $555 15.7% 8.5% $115 11.6% 85.0% $115 11.6% 85.0% $110 72.7% 6.5%
ProviderTotal
Visits
ER Urgent Care Convenience Care PCP Office
L. Use of Urgent Care Backup (UCB) - Weekend/Weekday Visits by Provider The chart below shows the percent of visits taking place in an Emergency Room (ER), Urgent Care Center, Convenience Care, or Primary Care Provider (PCP) Office setting by
provider over the trailing 12 months as of July, 2015.
ProviderTotal
Visits
ER Urgent Care Convenience Care PCP Office
PCP Office
K. Use of Urgent Care Backup (UCB) - Weekend/Weekday Visits by Illness Band The charts below show the percent of visits taking place in an Emergency Room (ER), Urgent Care Center, Convenience Care, or Primary Care Provider (PCP) Office setting for
weekends and weekdays by illness band over the trailing 12 months as of July, 2015.
Illness BandTotal
Visits
ER Urgent Care Convenience Care PCP Office
Illness BandTotal
Visits
ER Urgent Care Convenience Care
VII - 35
Copyright © 2016
All rights reserved

IV. Key Use Patterns
M. Debits for Prescription Drugs by Source and Type
Total Drug Spend
# %
Advanced/Critical Illness 549 149 27.1% $815,553 $63,421 $108,610 $271,997 $1,259,581
Multiple Chronic Illnesses 1,453 488 33.6% $1,726,878 $77,313 $73,022 $289,553 $2,166,766
At Risk 1,673 561 33.5% $774,315 $34,858 $22,198 $90,091 $921,462
Stable 2,359 939 39.8% $619,167 $22,769 $16,637 $1,527 $660,101
Healthy 1,654 858 51.9% $173,086 $2,728 $37,164 $686 $213,664
Total 7,688 2,995 39.0% $4,108,999 $201,089 $257,632 $653,854 $5,221,574
N. Generic Dispensing Rate for Mail/Retail Pharmacy Drugs
O. Generic Dispensing Rate - Max Potential Savings
This chart shows all pharmacy debits for the Panel to the extent that they are made available to CareFirst by the various Pharmacy Benefit Managers (PBMs) that
serve CareFirst Members. The totals provided are for the trailing 12 month period as of July, 2015 for Members attributed to the Panel.
This chart shows the number of fills for brand drugs with a generic substitute available and the maximum potential savings that could be achieved if all such fills
were converted to generic over the trailing 12 months as of July, 2015. The data includes all prescriptions for the Panel's Members regardless of the prescriber
(providers both in and out of the Panel). The potential savings is an aggregation of the difference between the brand and typical generic cost for each of these fills.
Drug
Supplies
Debit $
Mail / Retail
Pharmacy
Debit $
Illness BandTotal
Members
Members with
CareFirst
Pharmacy Benefit
Medical
Drug
Debit $
Specialty
Drug
Debit $
Total
Drug
Debit $
This chart shows the brand and generic dollar spend and fill rates by illness band over the trailing 12 months as of July, 2015. The fill counts and debits include
only the drugs that are classified as generic or brand and do not include drugs such as diabetic supplies or bulk chemicals used for compounds.
74%
26%
Brand vs. Generic Debit $
Brand Generic
20% 80%
Brand vs. Generic Fills
Brand Generic
Illness BandBrand # of
Fills
# of Brand
Fills With
Generic
Equivalent
% of Brand Fills
With Generic
Equivalent
Max Potential
Generic Cost
Savings
Advanced/Critical Illness 1,289 170 13.2% $10,945
Multiple Chronic Illnesses 2,442 312 12.8% $11,122
At Risk 1,743 279 16.0% $5,749
Stable 1,475 289 19.6% $5,698
Healthy 433 70 16.2% $1,530
Total 7,382 1,120 15.2% $35,045
Total Brand Total Generic
# of
Fills
% of Total
FillsDebit $
% of Total
Debit $
# of
Fills
% of
Total FillsDebit $
% of Total
Debit $
Advanced/Critical Illness 6,056 $815,553 1,289 21.3% $706,362 80.3% 4,767 78.7% $173,156 19.7%
Multiple Chronic Illnesses 11,519 $1,726,878 2,442 21.2% $1,327,163 80.2% 9,077 78.8% $327,993 19.8%
At Risk 8,891 $774,315 1,743 19.6% $539,305 69.0% 7,148 80.4% $242,475 31.0%
Stable 8,468 $619,167 1,475 17.4% $390,907 63.1% 6,993 82.6% $228,342 36.9%
Healthy 2,465 $173,086 433 17.6% $97,347 56.2% 2,032 82.4% $75,949 43.8%
Total 37,399 $4,108,999 7,382 19.7% $3,061,084 74.5% 30,017 80.3% $1,047,915 25.5%
Illness Band
Mail/Retail
Pharmacy
# of Fills
Mail/Retail
Pharmacy
Debit $
VII - 36
Copyright © 2016
All rights reserved

IV. Key Use Patterns
Fill Rates for In-Panel Prescribing Providers
Fill Rates for Specialists and Other Non-Panel Prescribing Providers caring for Panel Members
Cost Ratios for In-Panel Prescribing Providers
Cost Ratios for Specialists and Other Non-Panel Prescribing Providers caring for Panel Members
3,000
2,500
1,540
650
300
These views show brand and generic fill rates over the trailing 12 months as of July, 2015 for drugs that were either filled by mail order or a retail pharmacy. The charts to
the left are overall for the Panel and the tables to the right show the top 10 prescribing providers, sorted to show the providers with the highest brand fill rates in
descending order. The top views show the in-Panel providers, while the bottom views show specialists and other providers out of Panel caring for Panel Members. Only
drugs classified as generic or brand are included. Drugs such as diabetic supplies or bulk chemicals used for compounds are excluded.
These views show percent of cost spent on brand vs. generic drugs over the trailing 12 months as of July, 2015 for drugs that were either filled by mail order or a retail
pharmacy. The charts to the left are overall for the Panel and the tables to the right show the top 10 prescribing providers, sorted to show the providers with the highest
brand cost ratios in descending order. The top views show in-Panel providers, while the bottom views show specialists and other providers out of Panel caring for Panel
Members. Only drugs classified as generic or brand are included. Drugs such as diabetic supplies or bulk chemicals used for compounds are excluded.
P. Generic Fill Rates for Mail/Retail Pharmacy Drugs - Provider Detail
Q. Generic Cost Ratios for Mail/Retail Pharmacy Drugs - Provider Detail
15%
85%
(1,500)
(8,500)
15%
15%
15%
14%
14%
14%
14%
13%
13%
11%
85%
85%
85%
86%
86%
86%
86%
87%
87%
89%
Albert Zen
Bernard York
Conrad Xavier
Donald Walters
Edward Venton
Frank Underwood
George Tendler
Harold Smith
Irving Rogers
Jacob Quincy
30%
70%
(10,500)
(8,500)
19%
16%
15%
15%
15%
15%
14%
14%
14%
14%
81% 84% 85% 85% 85% 85% 86% 86% 86% 86%
PostonOverton
LongfellowButler
LangleyIverson
HemingwayGeorgesonTrumpston
YeatsBrand Generic
85%
15%
($1.6 Mil)
($282,353)
72%
28%
($1.07 Mil)
($2.75 Mil)
87%
87%
86%
79%
79%
77%
76%
76%
75%
74%
13%
13%
14%
21%
21%
23%
24%
24%
25%
26%
Albert Zen
Bernard York
Conrad Xavier
Frank Underwood
Edward Venton
Donald Walters
George Tendler
Harold Smith
Irving Rogers
Jacob Quincy
89%
87%
87%
86%
86%
86%
86%
84%
83%
80%
11%
13%
13%
14%
14%
14%
14%
16%
17%
20%
OvertonPoston
LongfellowButler
LangleyIverson
HemingwayGeorgesonTrumpston
Yeats
Brand Generic
Brand Generic
Brand Generic
# of Fills
2,700
2,500
1,500
1,100
740
650
300
250
140
120
# of Fills
2,700
2,500
1,500
650
740
1,100
300
250
140
120
# of Fills
4,500
6,000
3,000
2,500
1,540
650
300
250
140
120
# of Fills
6,000
4,500
3,000
2,500
1,540
650
300
250
140
120
VII - 37
Copyright © 2016
All rights reserved

IV. Key Use Patterns
R. Mail Order Dispensing Rate for Mail/Retail Pharmacy Drugs
Mail/Retail
# of Fills
Order
# of Fills
Order
Fill Rate
Jacob Quincy 2 2 100.0%
Edward Venton 8 3 37.5%
Conrad Xavier 10 2 20.0%
Bernard York 15 1 6.7%
Albert Zen 30 1 3.3%
Donald Walters 9 0 0.0%
Frank Underwood 8 0 0.0%
George Tendler 6 0 0.0%
Harold Smith 5 0 0.0%
Irving Rogers 5 0 0.0%
<< Previous Next 10 >>
Mail/Retail
# of Fills
Order
# of Fills
Order Fill
Rate
Trumpston 3 3 100.0%
Iverson 7 3 42.9%
Poston 20 4 20.0%
Georgeson 5 1 20.0%
Longfellow 12 2 16.7%
Langley 8 1 12.5%
Butler 10 1 10.0%
Overton 15 1 6.7%
Hemingway 6 0 0.0%
Yeats 2 0 0.0%
<< Previous Next 10 >>
S. Mail Order Dispensing Rate - Calculated Potential Savings
Providers In Panel
This view shows the retail and mail order cost and fill rates by illness band over the trailing 12 months as of July, 2015. Overall rates are charted beneath, as well as a
detailed view of Panel providers and all other providers with the highest Mail Order rates.
This chart shows the retail dispensing rate (regardless of brand or generic status) over the trailing 12 months as of July, 2015, with an estimated potential for cost savings if
mail order rates were increased by 5% or to maximum potential. Mail Order rates are available at a lower cost due to lower ingredient costs and reduced dispensing fees.
Specialists and Other Out of Panel
Providers
Page 1 2 3….
Page 1 2 3….
97.7%
2.3%
Retail Order vs. Mail Order Fills
Retail Mail Order
98.8%
1.2%
Retail Order vs. Mail Order Fills
Retail Mail Order
# of
Fills
% of
Total FillsDebit $
% of
Total Debit $
# of
Fills
% of
Total FillsDebit $
% of
Total Debit $
Advanced/Critical Illness 6,056 $815,553 6,027 99.5% $874,156 99.4% 29 0.5% $5,357 0.6%
Multiple Chronic Illnesses 11,519 $1,726,878 11,415 99.1% $1,620,063 97.9% 104 0.9% $35,080 2.1%
At Risk 8,891 $774,315 8,821 99.2% $777,625 99.5% 70 0.8% $4,151 0.5%
Stable 8,468 $619,167 8,380 99.0% $604,336 97.6% 88 1.0% $14,898 2.4%
Healthy 2,465 $173,086 2,455 99.6% $172,969 99.8% 10 0.4% $326 0.2%
Total 37,399 $4,108,999 37,098 99.2% $4,049,150 98.5% 301 0.8% $59,812 1.5%
Illness Band
Mail/Retail
Pharmacy
# of Fills
Mail/Retail
Pharmacy
Debit $
Total Retail Total Mail Order
# of Retail
Fills
Retail
Debit $
Current Mail
Order Fill Rate
Current
Cost Savings
Mail Order
Fill Rate If
Increased by 5%
Potential Cost
Savings For Every
5% Increase
Maximum
Potential
Cost Savings
Total 37,098 $4,049,150 0.8% $9,657 5.8% $95,352 $1,892,153
VII - 38
Copyright © 2016
All rights reserved

IV. Key Use Patterns
T. Costliest Brand Drugs
Drug NameFormulary
Tier
Generic
Equivalent
Available*
Generic
Alternative
Available*
Therapeutic Class Members Debit $Average
Debit $
CYMBALTA 3 No Yes Central Nervous System Agents 50 $99,490 $1,990
GLEEVEC 2 No No Antineoplastics 1 $79,843 $79,843
CRESTOR 3 No Yes Cardiovascular Therapy Agents 42 $37,555 $894
REBIF 2 No No Multiple Sclerosis 2 $58,293 $29,147
GILENYA 3 No No Multiple Sclerosis 1 $57,082 $57,082
BETASERON 3 No No Multiple Sclerosis 1 $51,626 $51,626
ATRIPLA 2 No No Antineoplastics 1 $79,843 $79,843
OXYCONTIN 3 No No Analgesic, Anti-Inflammatory or Antipyretic 10 $43,019 $4,302
VICTRELIS 3 No No Anti-Infective Agents 2 $42,042 $21,021
HUMIRA 2 No Yes Analgesic, Anti-Inflammatory or Antipyretic 3 $41,896 $13,965
Total 113 $590,689 $5,227
T. Detail of Costliest Brand Drugs Therapeutic Class: Cardiovascular Therapy Agents
Drug Name: CRESTOR Generic Equivalent (GE): No
Generic Alternative (GA): Atorvastatin
T. Detail of Members with Costliest Brand Drugs Therapeutic Class: Cardiovascular Therapy Agents
Prescriber: Specialists and Other Providers Generic Equivalent (GE): No
Drug Name: Crestor Generic Alternative (GA): Atorvastatin
This chart displays detailed drug information at the Member level, with the PCMH Provider, Prescribing Provider, and the debits associated with the selected Brand Drug
over the trailing 12 months as of July, 2015. A list of generic equivalents and generic therapeutic alternatives for the brand drug listed are made available. Debit dollars
are associated with the Brand Drug selected. The potential savings reflect savings that could be achieved if all fills for the selected brand drug were switched to either their
generic equivalent or alternative. Potential savings is obtained by replacing the brand per unit cost with the average per unit cost for generic equivalents/alternatives. The
Member Health Record (MHR) for each Member can be accessed by clicking on the Member’s name below.
This chart lists the Panel's costliest brand prescription drugs used by Members in the Panel, ranked by cost for the trailing 12 months as of July, 2015. It also shows the
formulary tier of the drug and if a generic equivalent or alternative is available. The formulary tier of the drug (as determined by CareFirst) is an indicator of the estimated
out-of-pocket cost level to the Member (through copayments/coinsurance). Members pay the lowest copay for generic drugs (Tier 1), a higher copay for brand name drugs
on CareFirst's preferred drug or formulary list (Tier 2), and the highest copay for brand name drugs not on the formulary list (Tier 3). Click on any underlined field below
to see additional information.
This chart displays savings information at the aggregate level over the trailing 12 months as of July, 2015, grouped by Panel providers and by specialists and other
prescribers caring for Panel Members. A list of generic equivalents and generic therapeutic alternatives for the brand drug listed are made available. The potential savings
reflect savings that could be achieved if all fills for the selected brand drug were switched to either their generic equivalent or alternative. Potential savings is obtained by
replacing the brand per unit cost with the average per unit cost for generic equivalents/alternatives.
*Generic Equivalent drugs contain active ingredients that are identical in chemical composition to the brand drug. Generic Alternative drugs are in the same therapeutic class
as the brand drug but are not identical in chemical composition. For example, certain statins (cholesterol-lowering medicines) are better for a Member depending on the
individual circumstances such as LDL level of the Member and history of heart disease or heart attacks. The brand drug Lipitor (Atorvastatin) has no generic equivalent and is
used in the instance of highly elevated LDL and heart attack history. Generic alternative statin drugs include: Lovastatin or Pravastatin (if LDL levels need to be lowered by
less than 30 percent) and simvastatin (LDL reduction of 30 percent or more is needed and/or presence of heart disease, diabetes, or heart attack is known or acute coronary
syndrome is known and the Member's LDL level is not highly elevated).
Sample Drill Through
Sample Drill Through
Member
NameDOB
Prescribing
Provider
PCMH
Provider
Rx
Debit $
Potential Savings
(switch to GE)
Potential Savings
(switch to GA)
Edna Black 5/9/1962 Bob Blue Edna Black $1,555 None $96
Ray Purple 3/3/1969 Peter Black Tom Turquoise $1,270 None $74
John Blue 7/11/1979 Ace Emerald Bonnie Beige $1,237 None $74
Rita Yellow 9/18/1988 Irene Indigo Margaret Orange $1,110 None $64
Prescriber # of Fills Members Debit $Average Debit $
Per Member
Potential Savings
(switch to GE)
Potential Savings
(switch to GA)
Providers in Panel 75 27 $23,862 $884 None $1,413
Specialists and Other Providers 33 16 $13,693 $856 None $818
VII - 39
Copyright © 2016
All rights reserved

IV. Key Use Patterns
#% of
BandMembers
% of Rx
MembersMembers
% of Rx
MembersMembers
% of Rx
Members
Advanced/Critical Illness 549 149 27.1% 15 10.1% 46 30.9% 81 54.4%
Multiple Chronic Illnesses 1,453 488 33.6% 135 27.7% 158 32.4% 136 27.9%
At Risk 1,673 561 33.5% 217 38.7% 167 29.8% 63 11.2%
Stable 2,359 939 39.8% 406 43.2% 146 15.5% 21 2.2%
Healthy 1,654 858 51.9% 160 18.6% 22 2.6% 2 0.2%
Total 7,688 2,995 39.0% 933 31.2% 539 18.0% 303 10.1%
Multiple Drugs: 12+ Drugs
Illness Band: Advanced Critical Illness
Member: Edna Black
Dominant Episode: Injury - Abdomen/Trunk
U. Members with Multiple Drugs
U. Detail of Members with Multiple Drugs
U. Detail of Members with Multiple Drugs
This chart shows Member details for those Members in the selected multiple drug range over the trailing 12 months as of July, 2015. Click on any underlined
field below to see additional information.
3 - 6 Drugs
This chart shows increased Member specific detail on drugs taken by Members, along with their therapeutic class, frequency of fills, and the total cost
relating to each drug over the trailing 12 months as of July, 2015. The Member Health Record (MHR) for each Member can be accessed by clicking on the
Member’s name above.
This chart identifies multiple drug usage for Panel Members with available pharmacy benefit information. The chart lists Members assigned to each illness
band and the number of different drugs (counted by drug name) these Members are taking. The totals provided are for the trailing 12 month period as of July,
2015 for Members attributed to the Panel. All Drug Sources and Types are included. Click on any underlined field below to see additional information.
Illness BandTotal
Members
Members with
Pharmacy Benefit7 - 11 Drugs 12+ Drugs
Sample Drill Through
Sample Drill Through
# Drug Name Therapeutic Class# of
FillsDebit $ Maintenance
1 VICTRELIS Hepatitis Agents 4 $24,824 No
2 PEGASYS PROLICK Hepatitis Agents 4 $12,175 No
3 PROCRIT Hematopoietic Agents - Hematopoietic Growth Factors 1 $3,232 Yes
4 RIBAPAK Hepatitis Agents 4 $3,137 No
5 CIALIS Other 8 $1,029 No
6 LEVEMIR FLEXPEN Injectable Antidiabetic Agents 3 $898 Yes
7 BD ULTRA-FINE PEN NEEDLE Medical Supplies & DME 4 $126 Yes
8 OXYCODONE HCL Analgesic Narcotic Agonists and Cominations 4 $108 No
15 PROPRANOLOL HCL Beta Blockers Non-Cardiac Selective, All 1 $3 Yes
Total $45,653
# Member Name DOB Provider Illness Band Dominant Episode# of
DrugsDebit $
1 Edna Black 11/1/1999 Bob Blue Band 2 Injury - Abdomen/Trunk 15 $45,653
2 Kathleen Green 12/11/1986 Tom Turquoise Band 2 Multiple Sclerosis 14 $39,220
79 Barbara Brown 4/18/1960 Gary Green Band 4 Mental Hlth - Neuroses, NEC 14 $632
80 Carolyn Amber 8/10/1959 Bonnie Beige Band 4 Coronary Artery Disease 12 $513
81 Juan Blue 5/9/1962 Margaret Orange Band 4 Choleysitis/Cholelithiasis 15 $174
VII - 40
Copyright © 2016
All rights reserved

IV. Key Use Patterns
3 - 6 Drugs
#% of
BandMembers
% of Rx
MembersMembers
% of Rx
MembersMembers
% of Rx
Members
Advanced/Critical Illness 549 149 27.1% 44 29.5% 50 33.6% 33 22.1%
Multiple Chronic Illnesses 1,453 488 33.6% 193 39.5% 114 23.4% 19 3.9%
At Risk 1,673 561 33.5% 222 39.6% 72 12.8% 9 1.6%
Stable 2,359 939 39.8% 295 31.4% 31 3.3% 3 0.3%
Healthy 1,654 858 51.9% 54 6.3% 4 0.5% 1 0.1%
Total 7,688 2,995 39.0% 808 27.0% 271 9.0% 65 2.2%
Maintenance Drugs: 12+ Drugs
Illness Band: Advanced Critical Illness
Member: Elizabeth Orange
Dominant Episode: Diabetes
V. Members with Multiple Maintenance Drugs
V. Detail of Members with Maintenance Drugs
V. Detail of Members with Maintenance Drugs
This chart shows Member specific information for all maintenance drugs taken by each Member over the trailing 12 months as of July, 2015. The Member Health
Record (MHR) for each Member can be accessed by clicking on the Member’s name above.
This chart shows Member details for those Members in the selected multiple drug range over the trailing 12 months as of July, 2015. Click on any underlined field
below to see additional information.
This chart identifies multiple maintenance drug usage for Panel Members with available pharmacy benefit information. The chart lists Members assigned to each
Illness band and the number of different maintenance drugs (counted by drug name) these Members are taking. The totals provided are for the trailing 12 month
period as of July, 2015 for Members attributed to the Panel. Click on any underlined field below to see additional information.
Illness BandTotal
Members
Members with
Pharmacy Benefit7 - 11 Drugs 12+ Drugs
Sample Drill Through
Sample Drill Through
# Drug Name Therapeutic Class# of
FillsDebit $
1 DIVALPROEX SODIUM ER Anticonvulsant - Carboxylic Acid Derivatives 3 $3,009
2 RANEXA Antianginal and Anti-ischemic Agents 4 $2,912
3 XARELTO Factor Xa Inhibitors 2 $1,589
4 CYMBALTA Antidepressant - Serotonin-Norepinephrine Reuptake Inhibitors 5 $1,134
5 TAMOXIFEN CITRATE Antineoplastic - Selective Estrogen Receptor Mudulators 3 $106
6 ATROVASTATIN CALCIUM Antihyperlipidemix - HMG CoA Reductase Inhibitors 4 $76
7 KLOR-CON M20 Minerals & Electrolytes - Potassium & Combinations 2 $63
8 OMEPRAZOLE GI Acid Secretion Reducing Agents - Antisecretory Agents 3 $55
14 AMLODIPINE BESYLATE Calcium Channel Blockers 3 $7
15 FUROSEMIDE Diuretic - Loop and Combinations 2 $5
Total $9,048
#Member
NameDOB Provider Illness Band Dominant Episode
# of
DrugsDebit $
1 Elizabeth Orange 11/1/1999 Gary Green Band 1 Diabetes 15 $9,048
2 Kimberly Mauve 12/11/1986 Bonnie Beige Band 1 Spinal/Back Disorders, Lower Back 15 $6,611
3 Linda Tan 4/18/1960 Michael Mauve Band 1 Cerebrovascular Disease 12 $6,024
32 George Yellow 8/10/1959 Sarah Cobalt Band 3 Injury - Head/Spinal Cord 12 $1,884
33 Georgia Pink 5/9/1962 Ace Emerald Band 2 Hypertension, Essential 13 $1,281
VII - 41
Copyright © 2016
All rights reserved

IV. Key Use Patterns
Drug Name: ALOXI Specialty Category: Cancer - Antiemetic
*Additional information on Member care coordination activities can be viewed through the care plan links on the Member roster.
This chart displays detailed drug information at the Member level, including Member Name, Illness Burden Score, PCP, and Dominant Episode over
the trailing 12 months as of June, 2015. Care coordination Programs include Hospital Transition of Care (HTC), Complex Case Management (CCM),
Chronic Care Coordination (CCC), Home Based Services (HBS), Enhanced Monitoring Program (EMP), Comprehensive Medication Review (CMR),
Community Based Programs (CBP), Pharmacy Coordination Program (RxP), and Expert Consult Program (ECP). The Member's status in these
programs is indicated as follows: Active (A), Closed (C), Member Refused (R), or PCP Declined (D). For Members engaged with CMR, the date of the
last consult is included. The Member Health Record (MHR) for each Member can be accessed by clicking on the Member's name below.
*A Maintenance Drug indication of "Yes/No" indicates that the drug referenced can be used as either a maintenance drug or used
independently of the targeted condition the drug is used to treat.
This chart lists the highest cost specialty drugs used by Members in the Panel ranked by largest gross debits for the trailing 12 months as of July,
2015. Specifically, it shows the number of Members using high cost specialty drugs and the average cost attributed to each individual Member per
month. Click on any underlined field below to see additional information.
W. Costliest Specialty Drugs
W. Detail of Members with Costliest Specialty Drugs
Sample Drill Through
# Member Name DOBIB
ScoreProvider
Dominant
Episode
Care
Coordination
Program/Status*
Last CMR
Consult
1 Mark Silver 5/9/1962 8.58 Ray Purple Cancer - Breast 3/1/2015
2 Dalia Red 12/11/1986 10.89 Samuel Yellow Cancer - Colon CCC (C) 4/14/2015
3 Gary Fuchsia 6/16/1999 9.89 Gary Green Cancer - Breast CCM (R), HTC 3/1/2015
11 Catherine Red 4/18/1960 22.34 Fer Brick-Red Cancer - Lung CCM (C), HTC 12/1/2014
Drug Name Specialty Category MembersMaintenance
Drug*Debit $
Average
Debit $
REMICADE Rheumatoid Arthritis 19 Yes $414,467 $21,814
NEULASTA Neutropenia 7 No $186,502 $26,643
OCTAGAM Intravenous Immunoglobulin Deficiency 1 Yes $88,822 $88,822
RITUXIMAB Cancer, Rheumatoid Arthritis 3 Yes $68,873 $22,958
LUCENTIS Macular Degeneration 9 No $63,433 $7,048
XOLAIR Asthma 3 Yes $54,598 $18,199
AVASTIN Cancer 11 Yes $37,290 $3,390
ZOMETA Osteoporosis 5 Yes $353,334 $70,667
TYSABRI Multiple Sclerosis 1 Yes $20,616 $20,616
ALOXI Cancer - Antiemetic 11 No $18,540 $1,685
Total 70 $1,306,475 $18,664
VII - 42
Copyright © 2016
All rights reserved

V. Top 10 to 50 Lists of High Cost/High Risk/Highly Unstable Members
This section of the SearchLight Report presents views of the top Members who have the highest costs, highest utilization, or
show other patterns of progressive disease or instability that places them at High Risk. These Members typically experience
unplanned hospital events related to chronic conditions, multiple gaps in care, repeat admissions and emergency room visits,
or are on a large number of prescriptions. An intense focus on these sensitive Member populations is a vital component in a
Panel’s approach toward managing future quality and cost outcomes.
This section is organized into categories of "top 10" Member lists - all with the intent of drawing the attention of the Panel
and its PCPs to focus on those Members most in need of their attention. In each category, drill downs to the individual
Member level are provided. The extent and nature of actions taken to date with these Members is also shown.
Progressive "top 10" lists are shown in each category. For example, a second "top 10" (11-20) and third "top 10" (21-30) list
is shown in each category to provide a continuous picture of High Cost/High Use/High Risk Members. These tiered lists
extend to the top 50 Members in each category.
"Top 10" Members are identified in the 10 different categories below:
1. Overall PMPM $ - Members with an overall PMPM at least 5 times greater than that
of the Panel's average.
2. Pharmacy PMPM $ - Members with a pharmacy PMPM at least 5 times greater than
that of the Panel's average.
3. Drug Volatility Score (DVS) - Members with a DVS greater than 7, indicating the use
of medications that are recognized as having severe side effects or extreme sensitivity
to variations in dosage.
4. Specialty Drug PMPM $ - Members with a specialty drug PMPM at least 5 times
greater than that of the Panel's average.
5. High Rx Utilization - Members with 12 or more different drugs utilized.
6. Hospital Use - Members with 4+ hospital admissions, 2+ readmissions (within a 30-
day time span), hospital lengths of stay exceeding 30 days, or 3+ ER visits.
7. Multiple Comorbidities - Members with 4 or more chronic conditions.
8. Gaps in Care - Members with the highest rates of non-compliance with recommended
chronic care or population health screenings and treatments or without a recent PCP
visit dependent on Member age.
9. Disease Instability - Members with rapid progression in disease stage or those at
unstable disease stages associated with a chronic condition.
10. Health Assessments - Members with the lowest Health Assessment Wellness Scores and
the highest number of potential risk factors as identified from completed Health
Assessments, indicating high potential for disease progression or breakdown.
VII - 43
Copyright © 2016
All rights reserved

V. Top 10 to 50 Lists of High Cost/High Risk/Highly Unstable Members
A. High Cost/High Risk Members with Multiple Indicators
*Additional information on Member care coordination activities can be viewed through the care plan links on the Member roster.
The chart below displays the list of Members identified as high cost/high use/high risk along with their most recent TCCI Care Coordination Program
status. Care Coordination Programs include Hospital Transition of Care (HTC), Complex Case Management (CCM), Chronic Care Coordination
(CCC), Home Based Services (HBS), Enhanced Monitoring Program (EMP), Comprehensive Medication Review (CMR), Community Based Programs
(CBP), Pharmacy Coordination Program (RxP), and Expert Consult Program (ECP). The Member's status in these programs is indicated as follows:
Active (A), Closed (C), Member Refused (R), or PCP Declined (D).
The chart is sorted to show Members with the most checked categories at the top. Check marks indicate potential High Cost/High Risk based on the
following categories within the trailing 12 months as of July, 2015:
1. Overall PMPM $ - Members with an overall PMPM at least 5 times greater than that of the Panel's average.
2. Pharmacy PMPM $ - Members with a pharmacy PMPM at least 5 times greater than that of the Panel's average.
3. Drug Volatility Score (DVS) - Members with a DVS greater than 7, indicating the use of medications that are recognized as having severe side
effects or extreme sensitivity to variations in dosage.
4. Specialty Drug PMPM $ - Members with a specialty drug PMPM at least 5 times greater than that of the Panel's average.
5. High Rx Utilization - Members with 12 or more different drugs utilized.
6. Hospital Use - Members with 4+ hospital admissions, 2+ readmissions (within a 30-day time span), hospital lengths of stay exceeding 30 days, or
3+ ER visits.
7. Multiple Comorbidities - Members with 4 or more chronic conditions.
8. Gaps in Care - Members with the highest rates of non-compliance with recommended chronic care or population health screenings and
treatments or without a recent PCP visit dependent on Member age.
9. Disease Instability - Members with rapid progression in disease stage or those at unstable disease stages associated with a chronic condition.
10. Health Assessments - Members with a Very Poor, Poor, or Fair Wellness Band and/or with 2 or more indicated potential risks based on Member
responses to specific lifestyle and biometric questions on completed Health Assessments.
This view is a summarization of the Top 10 to 50 lists that follow. By default, the view shows the top 50 Members identified based on the total number
of High Cost/High Risk categories in which they fall. These are checked below. Members can be displayed in groups of 10 (up to 50). Options to
filter on Members attributed to an individual provider and to filter by All Members or just those who are Care Plan Eligible are provided as well.
Names of Members without active CCM or CCC care plans are highlighted. The Member Health Record (MHR) for each Member can be accessed by
clicking on the Member’s name below.
Filter By: Members 1-10 All Providers Care Plan Eligible
#Member
NameDOB
IB
ScoreProvider Dominant Episode
Overall
PMPM $
Pharmacy
PMPM $
Drug
Volatility
Score
Specialty
Drug
PMPM $
High Rx
Utilization
Hospital
Use
Multiple
Comorbidities
Gaps
in Care
Disease
Instability
Health
Assess
Care
Coordination
Program/Status*
1 Mark Silver 02/07/61 22.97 Ray Purple Headache, Migraine/Muscle Tens HTC
2 Gary Fuchsia 08/16/52 35.01 Gary Green Renal Function Failure CCM (R), CCC (A), HTC
3 Michael Fuschia 09/01/44 16.53 Bonnie Beige Diabetes CCM (R), HTC
4 Roberta Green 08/08/79 22.92 Peter Black Functional Digest Disord, NEC CCM (C), HTC
5 Dalia Red 06/12/82 20.88 Samuel Yellow Osteoarthritis
6 William Orange 02/02/68 15.74 Irene Indigo Mental Hlth - Bipolar Disorder CCC (R)
7 Debora Eggplant 05/09/62 11.23 Fletch Orange Cerebrovascular Disease CCM (R), HTC
8 Charles Canary 04/18/60 14.54 Fletch Orange Osteoarthritis HTC
9 Paul Blue 09/18/61 26.65 Theodore Lavender Renal Function Failure CCM (R), HTC
10 Rita Orange 11/05/59 4.65 Bob Blue Cerebrovascular Disease CCM (C), HTC
VII - 44
Copyright © 2016
All rights reserved

V. Top 10 to 50 Lists of High Cost/High Risk/Highly Unstable Members
*Additional information on Member care coordination activities can be viewed through the care plan links on the Member roster.
*Additional information on Member care coordination activities can be viewed through the care plan links on the Member roster.
B. Overall PMPM $The chart below displays a list of Members with an overall PMPM at least 5 times greater than that of the Panel's average costs over the trailing 12 months as of July, 2015.
Care Coordination Programs include Hospital Transition of Care (HTC), Complex Case Management (CCM), Chronic Care Coordination (CCC), Home Based Services
(HBS), Enhanced Monitoring Program (EMP), Comprehensive Medication Review (CMR), Community Based Programs (CBP), Pharmacy Coordination Program (RxP),
and Expert Consult Program (ECP). The Member's status in these programs is indicated as follows: Active (A), Closed (C), Member Refused (R), or PCP Declined (D). By
default the clip shows the top 50 Members. Members can be displayed in groups of 10 (up to 50). Options to filter on Members attributed to an individual provider and to
filter by All Members or just those who are Care Plan Eligible are provided as well. Member Rx Debit % will show zero for Members without Pharmacy data available.
Names of Members without active CCM or CCC care plans are highlighted. The Member Health Record (MHR) for each Member can be accessed by clicking on the
Member’s name below.
C. Pharmacy PMPM $The chart below displays a list of Members with an overall PMPM at least 5 times greater than that of Panel's average costs over the trailing 12 months as of August, 2015.
Care Coordination Programs include Hospital Transition of Care (HTC), Complex Case Management (CCM), Chronic Care Coordination (CCC), Home Based Services
(HBS), Enhanced Monitoring Program(EMP), Comprehensive Medication Review (CMR), Community Based Programs (CBP), Pharmacy Coordination Program (RxP),
and Expert Consult Program (ECP). The Member's status in these programs is indicated as follows: Active (A), Closed (C), Member Refused (R), or PCP Declined (D). By
default the clip shows the top 50 Members. Members can be displayed in groups of 10 (up to 50). Options to filter on Members attributed to an individual provider and to
filter by All Members or just those who are Care Plan Eligible are provided as well. Member Rx Debit % will show zero for Members without Pharmacy data available.
Names of Members without active CCM or CCC care plans are highlighted. The Member Health Record (MHR) for each Member can be accessed by clicking on the
Member's name below.
Filter By: Members 1-10 All Providers Care Plan Eligible
Filter By: Members 1-10 All Providers Care Plan Eligible
#Member
NameDOB
IB
ScoreProvider Dominant Episode
Overall
Debit $
Overall
PMPM $
Average
PMPM $
for Band
Member
Institutional
Debit %
Member
Professional
Debit %
Member
Rx
Debit %
Care
Coordination
Program/Status*
1 Mark Silver 02/07/61 22.97 Ray Purple Fracture/Disloc - Hip/Fem Head $517,301 $43,108 $3,451.58 85.7% 14.2% 0.1% CCM (C), HTC
2 Dalia Red 08/16/52 20.88 Samuel Yellow Cancer - Gastroint Ex Colon $321,846 $26,821 $3,451.58 83.8% 16.2% 0.0% CCM (A), HTC
3 Gary Fuchsia 09/01/44 35.01 Gary Green Cerebrovascular Disease $246,975 $20,581 $3,451.58 90.4% 9.4% 0.2% CCM (R), HTC
4 Brittany Electric 08/08/79 4.27 Ace Emerald Infections - Body Sites, NEC $237,701 $19,808 $3,543.72 87.7% 12.3% 0.0% CCM (C), CCC (A), HTC
5 Catherine Red 06/12/82 11.05 Fer Brick-Red Renal Function Failure $170,150 $18,906 $3,451.58 92.7% 7.3% 0.0% CCM (C), HTC
6 Kathleen Eggplant 02/02/68 11.49 Ronald Brown Cardiac Arrhythmias $225,375 $18,781 $2,444.23 90.2% 6.5% 3.3% CCC (A), HTC
7 Kimberly Electric 05/09/62 25.01 Shastine Gold Tumors - Central Nervous Sys $223,417 $18,618 $3,543.72 85.3% 13.7% 1.0% CCM (A), HTC
8 Charles Canary 04/18/60 14.54 Fletch Orange Skin Burns $220,363 $18,364 $3,543.72 91.1% 8.6% 0.3% CCM (C), CCC (R), HTC
9 Paul Blue 11/05/59 26.65 Theodore Lavender Cerebrovascular Disease $199,947 $16,662 $3,543.72 87.3% 12.7% 0.0% CCC (C), HTC
#Member
NameDOB
IB
ScoreProvider
Overall
Debit $
Pharmacy
Debit $
Pharmacy
Debit %
vs. Overall
Pharmacy
PMPM $Dominant Drug Therapeutic Class
Dominant
Drug $
Care
Coordination
Program/Status*
Last
CMR
Consult
1 Raymond Fuchsia 02/07/61 4.29 Bob Blue $79,230 $75,000 94.7% $6,249.97 GLEEVEC Antineoplastics $71,714 3/1/2015
2 Diana Electric 08/16/52 4.31 Ace Emerald $64,650 $61,313 94.8% $5,109.39 GILENYA Multiple Sclerosis Agents $57,803 4/14/2015
3 Hans Brick 09/01/44 1.97 Sarah Cobalt $81,188 $54,887 67.6% $4,989.71 VICTRELIS Anti-Infective Agents $30,471 CCC (C) 1/13/2015
4 Kathleen Orange 08/08/79 4.11 Gary Green $29,701 $29,701 100.0% $4,950.23 FLUTICASONE PROPIONATE Chemicals-Pharmaceutical Adjuvants $20,941 7/5/2014
5 Brenda Blue 06/12/82 3.20 Tom Turquoise $61,801 $57,187 92.5% $4,765.62 REBIF REBIDOSE Multiple Sclerosis Agents $56,740 CCC (A) 12/12/2014
6 Edna Fuchsia 02/02/68 3.81 Samuel Yellow $59,907 $54,906 91.7% $4,575.46 PREZISTA Anti-Infective Agents $14,968 11/19/2014
7 Wendy Red 05/09/62 4.41 Peter Black $52,301 $48,703 93.1% $4,058.60 FLUTICASONE PROPIONATE Chemicals-Pharmaceutical Adjuvants $41,119 12/1/2014
8 Margaret Canary 04/18/60 1.50 Robin Red $48,590 $46,447 95.6% $3,870.56 COPAXONE Multiple Sclerosis Agents $42,808 2/23/2015
9 Michelle Silver 09/18/61 2.77 Bonnie Beige $43,717 $42,575 97.4% $3,547.95 ZENPEP Gastrointestinal Therapy Agents $16,969 12/1/2014
10 Patricia Red 11/05/59 3.27 Fletch Orange $107,699 $40,412 37.5% $3,367.65 KETAMINE HYDROCHLORIDE Chemicals-Pharmaceutical Adjuvants $17,045 CCM (R), HTC 5/9/2015
VII - 45
Copyright © 2016
All rights reserved

V. Top 10 to 50 Lists of High Cost/High Risk/Highly Unstable Members
*Additional information on Member care coordination activities can be viewed through the care plan links on the Member roster.
D. Drug Volatility ScoreThe chart below displays a list of Members with a DVS greater than 7 over the trailing 12 months as of July, 2015. Care Coordination Programs include Hospital Transition
of Care (HTC), Complex Case Management (CCM), Chronic Care Coordination (CCC), Home Based Services (HBS), Enhanced Monitoring Program (EMP),
Comprehensive Medication Review (CMR), Community Based Programs (CBP), Pharmacy Coordination Program (RxP), and Expert Consult Program (ECP). The
Member's status in these programs is indicated as follows: Active (A), Closed (C), Member Refused (R), or PCP Declined (D). For Members engaged with CMR, the date of
the last consult is included. By default the clip shows the top 50 Members. Members can be displayed in groups of 10 (up to 50). Options to filter on Members attributed to
an individual provider and to filter by All Members or just those who are Care Plan Eligible are provided as well. Names of Members without active CCM or CCC care
plans are highlighted. See Appendix K - Drug Volatility Score Methodology for more details. The Member Health Record (MHR) for each Member can be accessed by
clicking on the Member’s name below.
Filter By: Members 1-10 All Providers Care Plan Eligible
#Member
NameDOB
IB
ScoreProvider Dominant Episode
Total
Debit $
Total
Pharmacy
Debit $
Total
Pharmacy
Debit %
DVS# of
Drugs
# of
Fills
Care
Coordination
Program/Status*
Last
CMR
Consult
1 Chester Red 02/07/61 2.44 Irene Indigo Fracture/Disloc - Hip/Fem Head $517,301 $281 0% 9 8 12 CCM (C), HTC 3/1/15
2 Virginia Orange 08/16/52 1.12 Gary Green Cerebrovascular Disease $246,975 $373 0% 9 15 52 CCM (R), HTC 4/14/15
3 Stephanie Red 09/01/44 0.81 Peter Black Diabetes $41,355 $4,866 12% 9 14 23 CCM (R), HTC 1/13/15
4 Ruth Blue 08/08/79 38.02 Sarah Cobalt Gastroint Disord, NEC $22,777 $4,205 18% 9 15 79 CCC (C), HTC 7/5/14
5 Terri Canary 06/12/82 2.61 Donald Daisy Cancer - Breast $21,668 $256 1% 9 10 29 12/12/14
6 Robert Red 02/02/68 11.70 Ronald Brown Cancer - Breast $126,635 $444 0% 9 11 19 CCM (C), HTC 11/19/14
7 Joyce Red 05/09/62 4.29 Robin Red Cerebrovascular Disease $16,634 $1,625 10% 9 16 18 CCM (R), HTC 12/1/14
8 Carole Fuchsia 04/18/60 25.29 Ace Emerald Cancer - Colon $29,369 $2,257 8% 9 18 50 CCC (C) 2/23/15
9 Theresa Canary 09/18/61 12.56 Michael Mauve Cerebrovascular Disease $14,429 $6,151 43% 9 13 51 CCM (R), HTC 12/1/14
10 Marion Eggplant 11/05/59 6.24 Samuel Yellow Signs/Symptoms/Oth Cond, NEC $27,480 $21,408 78% 9 12 41 4/7/15
VII - 46
Copyright © 2016
All rights reserved

V. Top 10 to 50 Lists of High Cost/High Risk/Highly Unstable Members
*Additional information on Member care coordination activities can be viewed through the care plan links on the Member roster.
*Additional information on Member care coordination activities can be viewed through the care plan links on the Member roster.
Member Name: Debora Eggplant
Number of Drugs: 37 Age: 53
This chart shows a detailed list of drugs filled by the Member over the trailing 12 months as of July, 2015. The Member Health Record (MHR) for the Member can be accessed by
clicking on the Member’s name above.
E. Specialty Drug PMPM $The chart below displays a list of Members flagged as having the highest specialty drug costs per Member per month (PMPM) over the trailing 12 months as of July, 2015. Care
Coordination Programs include Hospital Transition of Care (HTC), Complex Case Management (CCM), Chronic Care Coordination (CCC), Home Based Services (HBS),
Enhanced Monitoring Program (EMP), Comprehensive Medication Review (CMR), Community Based Programs (CBP), Pharmacy Coordination Program (RxP), and Expert
Consult Program (ECP). The Member's status in these programs is indicated as follows: Active (A), Closed (C), Member Refused (R), or PCP Declined (D). For Members
engaged with CMR, the date of the last consult is included. By default the clip shows the top 50 Members. Members can be displayed in groups of 10 (up to 50). Options to filter
on Members attributed to an individual provider and to filter by All Members or just those who are Care Plan Eligible are provided as well. Names of Members without active
CCM or CCC care plans are highlighted. The Member Health Record (MHR) for each Member can be accessed by clicking on the Member’s name below.
F. High Rx UtilizationThe chart below displays a list of Members with 12 or more different drugs utilized over the trailing 12 months as of July, 2015. Care Coordination Programs include Hospital
Transition of Care (HTC), Complex Case Management (CCM), Chronic Care Coordination (CCC), Home Based Services (HBS), Enhanced Monitoring Program (EMP),
Comprehensive Medication Review (CMR), Community Based Programs (CBP), Pharmacy Coordination Program (RxP), and Expert Consult Program (ECP). The Member's
status in these programs is indicated as follows: Active (A), Closed (C), Member Refused (R), or PCP Declined (D). For Members engaged with CMR, the date of the last consult
is included. By default the clip shows the top 50 Members. Members can be displayed in groups of 10 (up to 50). Options to filter on Members attributed to an individual provider
and to filter by All Members or just those who are Care Plan Eligible are provided as well. Names of Members without active CCM or CCC care plans are highlighted. Click on
any underlined field below to see additional information.
F. Detail of High Rx Utilization Sample Drill Through
Filter By: Members 1-10 All Providers Care Plan Eligible
Filter By: Members 1-10 All Providers Care Plan Eligible
#Member
NameDOB
IB
ScoreProvider Dominant Drug Specialty Category
Total
Debit $
Specialty
Drug
Debit $
% of
Total
Debit $
Specialty
PMPM $
Care
Coordination
Program/Status*
Last
CMR
Consult
1 Diana Electric 02/07/61 3.59 Ace Emerald ABRAXANE Cancer $173,699 $75,569 43.5% $6,297.42 CCM (C), HTC 03/01/2015
2 Brenda Blue 08/16/52 0.99 Tom Turquoise ELOXATIN Cancer $140,570 $54,903 39.1% $6,100.32 CCM (R), HTC 04/14/2015
3 Hans Black 09/01/44 3.40 Sarah Cobalt REMICADE Rheumatoid Arthritis $44,599 $37,399 83.9% $3,116.57 01/13/2015
4 Kathleen Orange 08/08/79 2.32 Gary Green REMICADE Rheumatoid Arthritis $45,232 $35,827 79.2% $3,256.96 07/05/2014
5 Wendy Red 06/12/82 4.46 Peter Black ADRIAMYCIN Cancer $126,635 $35,685 28.2% $2,973.75 CCM (C), HTC 12/12/2014
6 Margaret Canary 02/02/68 1.76 Robin Red REMICADE Rheumatoid Arthritis $59,230 $34,401 58.1% $2,866.75 11/19/2014
7 Edna Fuchsia 05/09/62 2.08 Samuel Yellow REMICADE Rheumatoid Arthritis $34,373 $30,057 87.4% $3,757.16 12/01/2014
8 Nikki Orange 04/18/60 1.57 Ronald Brown AVASTIN Cancer $223,417 $29,774 13.3% $2,481.16 CCM (A), CCC (A), HTC 02/23/2015
9 Patricia Red 09/18/61 0.93 Fletch Orange RITUXIMAB Cancer, Rheumatoid $33,363 $27,970 83.8% $2,330.82 12/01/2014
10 Patricia Blush 11/05/59 1.85 Ray Purple HERCEPTIN Cancer $29,036 $26,285 90.5% $4,380.80 04/07/2015
#Member
NameDOB
IB
ScoreProvider Dominant Episode
Total
Rx
Debit $
# of
Drugs
# of
Maint.
Drugs
Rx
PMPM $
Total #
Prescribing
Providers
Care
Coordination
Program/Status*
Last
CMR
Consult
1 Debora Eggplant 02/07/61 11.23 Fletch Orange Headache, Migraine/Muscle Tens $2,234 37 14 $186.14 77
2 Richard Orange 08/16/52 10.74 Ray Purple Diabetes $13,554 36 15 $1,129.48 43 CCC (C)
3 Marilyn Eggplant 09/01/44 6.51 Gary Green Spinal/Back Disorders, Lower Back $21,152 35 25 $1,762.66 45
4 Glenda Fuchsia 08/08/79 3.00 Irene Indigo Renal Function Failure $12,611 34 24 $1,050.93 40 CCM (R), CCC (A), HTC
5 Janice Orange 06/12/82 4.50 Fer Brick-Red Diabetes $15,795 33 19 $1,316.28 47
6 Ruth Blue 02/02/68 38.02 Sarah Cobalt Asthma $11,227 30 18 $935.62 49 CCC (R)
7 Donna Orange 05/09/62 4.01 Shastine Gold Osteoarthritis $5,231 29 11 $435.92 37 CCM (R), HTC
8 Robert Red 04/18/60 2.62 Ronald Brown Infec/Inflam - Skin/Subcu Tiss $15,479 29 13 $1,289.90 50 CCM (C), CCC (R), HTC
9 Kimberly Fuchsia 09/18/61 1.23 Bonnie Beige Fracture/Disloc - Ankle/Foot $4,144 28 12 $345.36 34
10 Doreen Orange 11/05/59 5.41 Bob Blue Vascular Disorders, Venous $2,213 28 10 $184.46 47
Drug Name Therapeutic Class MaintenanceLast Date
Filled
# of
Fills
(Last Fill)
Days
Supplied
(Last Fill)
Prescribing
ProviderPractice Name
# of
Fills
Rx
Debit $
TRAZODONE HCL Central Nervous System Agents Y 05/27/14 1 30 John Blue Doctors and Associates 3 $6
LISINOPRIL Cardiovascular Therapy Agents Y 03/24/14 1 30 Mark Grey Doctors and Associates 5 $14
PHENAZOPYRIDINE HCL Genitourinary Therapy N 11/09/13 1 3 Mark Grey Doctors and Associates 1 $3
TRAMADOL HCL Analgesic, Anti-inflammatory or Antipyretic N 04/07/14 1 30 Smith Red Medical Providers Practice 2 $15
ORACEA Dermatological N 11/11/13 1 30 Mark Grey Doctors and Associates 1 $435
METOCLOPRAMIDE HCL Gastrointestinal Therapy Agents N 5/18/2011 1 4Mary
MagentaMedical Providers Practice 1 $3
VII - 47
Copyright © 2016
All rights reserved

V. Top 10 to 50 Lists of High Cost/High Risk/Highly Unstable Members
*Additional information on Member care coordination activities can be viewed through the care plan links on the Member roster.
Member Name: Neil Red
Number of Admissions/Visits: 10 Age: 56
Type of
Hospital Service
Service
Begin Date
Length of
Stay
Hospital
Service $Primary Procedure Primary Diagnosis
Admission 10/17/13 6 $24,577 PARTIAL NEPHRECTOMYMALIGNANT NEOPLASM OF KIDNEY,
EXCEPT PELVIS
Admission 03/31/14 2 $20,362 TOTAL KNEE REPLACEMENTOSTEOARTHROSIS, LOCALIZED, PRIMARY,
INVOLVING LOWER LEG
ER Visit 09/02/13 0 $619 Unknown ProcOBSTRUCTIVE CHRONIC BRONCHITIS
WITH ACUTE EXACERBATION
Admission 09/02/13 4 $8,590 ROUTINE CHEST X-RAY, SO DESCRIBEDOBSTRUCTIVE CHRONIC BRONCHITIS
WITH ACUTE EXACERBATION
ER Visit 08/21/13 0 $622 ER E&M HI SEVER IMMED SIGNIF THREAT UNSPECIFIED CHEST PAIN
ER Visit 09/14/13 0 $467 ER VISIT E&M HI SEVER URGENT EVAL ABDOMINAL PAIN UNSPECIFIED SITE
ER Visit 11/14/13 0 $234 ER DEPT VISIT E&M MODERATE SEVERITY ABDOMINAL PAIN OTHER SPECIFIED SITE
ER Visit 04/21/14 0 $432 ER VISIT E&M HI SEVER URGENT EVAL EFFUSION OF LOWER LEG JOINT
ER Visit 09/21/13 0 $622 ER E&M HI SEVER IMMED SIGNIF THREAT LUMBAGO
ER Visit 10/03/13 0 $467 ER VISIT E&M HI SEVER URGENT EVALCHRONIC AIRWAY OBSTRUCTION, NOT
ELSEWHERE CLASSIFIED
Total 12 $56,992
G. Hospital Use
The chart below displays a list of Members with the highest number of hospital admissions or ER visits: Members with 4+ admissions, 2+ readmissions (within a 30-day
time span), 3+ ER visits, or lengths of stay exceeding 30 days over the trailing 12 months as of July, 2015. Care Coordination Programs include Hospital Transition of Care
(HTC), Complex Case Management (CCM), Chronic Care Coordination (CCC), Home Based Services (HBS), Enhanced Monitoring Program (EMP), Comprehensive
Medication Review (CMR), Community Based Programs (CBP), Pharmacy Coordination Program (RxP), and Expert Consult Program (ECP). The Member's status in these
programs is indicated as follows: Active (A), Closed (C), Member Refused (R), or PCP Declined (D). By default the clip shows the top 50 Members. Members can be
displayed in groups of 10 (up to 50). Options to filter on Members attributed to an individual provider and to filter by All Members or just those who are Care Plan Eligible
are provided as well. Names of Members without active CCM or CCC care plans are highlighted. Click on any underlined field below to see additional information.
G. Detail of Hospital Use
This chart shows detailed hospital/ER Encounters for identified Members over the trailing 12 months as of July, 2015. The Member Health Record (MHR) for the Member
can be accessed by clicking on the Member’s name above.
Sample Drill Through
Filter By: Members 1-10 All Providers Care Plan Eligible
# Member Name DOBIB
ScoreProvider Dominant Episode
# of
Admits
# of
Readmits
# of
ER
Visits
Total
Admits/
Visits
Max
Length
of Stay
Care
Coordination
Program/Status*
1 Kimberly Electric 02/07/61 25.01 Bonnie Beige Functional Digest Disord, NEC 3 2 48 53 5 CCM (C), HTC
2 Patricia Electric 08/16/52 32.12 Shastine Gold Infec/Inflam - Skin/Subcu Tiss 0 0 21 21 0
3 Marjorie Cornflower-Blue 09/01/44 43.47 Ray Purple Mental Hlth - Substance Abuse 3 3 10 16 6 HTC
4 Daniel Electric 08/08/79 26.14 Robin Red Mental Hlth - Substance Abuse 3 0 10 13 22 CCM (R), HTC
5 Angelia Electric 06/12/82 21.13 Bob Blue Renal Function Failure 5 2 5 12 6 CCM (R), CCC (A), HTC
6 Mark Silver 02/02/68 22.97 Ronald Brown Cancer - Gastroint Ex Colon 4 0 7 11 8 CCM (R), CCC (A), HTC
7 James Electric 05/09/62 20.99 Irene Indigo Tumors - Central Nervous Sys 4 1 6 11 12 CCM (A), HTC
8 Gary Fuchsia 04/18/60 35.01 Gary Green Renal Function Failure 5 1 5 11 23 CCC (C)
9 Carville Electric 09/18/61 23.10 Sarah Cobalt Myasthenia Gravis 1 0 9 10 1 CCC (R), HTC
10 Neil Red 11/05/59 30.16 Samuel Yellow Cancer - Renal/Urinary 3 0 7 10 6 CCM (R), HTC
VII - 48
Copyright © 2016
All rights reserved

V. Top 10 to 50 Lists of High Cost/High Risk/Highly Unstable Members
#Member
NameDOB
IB
ScoreProvider Dominant Episode
# of
Comorbidities
Total
Debit $
Care
Coordination
Program/Status*
1 Hallam Sepia 02/07/61 25.43 Ray Purple Hepatitis, Viral 10 $39,033 HTC
2 Marjorie Cornflower-Blue 08/16/52 43.47 Bonnie Beige Immunodeficiency Disorders 9 $15,894 CCC (A)
3 Patricia Electric 09/01/44 32.12 Gary Green Renal Function Failure 9 $62,962 CCC (A), HTC
4 Angelina Orange 08/08/79 33.53 Peter Black Diabetes 8 $9,632 CCC (C)
5 Ruth Blue 06/12/82 38.02 Sara Cobalt Cancer - Prostate 8 $7,946
6 Mary Red 02/02/68 26.57 Bob Blue Cancer - Lymphoma 8 $8,708
7 Carl Canary 05/09/62 23.74 Shastine Gold Osteoarthritis 8 $47,613 HTC
8 Charles Red 04/18/60 8.84 Irene Indigo Mental Hlth - Bipolar Disorder 8 $5,205
9 Ann Electric 09/18/61 35.79 Fletch Orange Diabetes 8 $20,930 CCC (C)
10 Frances Fuchsia 11/05/59 24.04 Robin Red Asthma 8 $32,270 CCC (R)
Member Name: Charles Red
Number of Comorbidities: 8 Age: 62
04/17/14
11/12/13
The chart below displays a list of Members with 4 or more comorbidities over the trailing 12 months as of July, 2015. Comorbidities include chronic conditions or acute conditions
with advanced disease staging of 2 or higher. Care Coordination Programs include Hospital Transition of Care (HTC), Complex Case Management (CCM), Chronic Care
Coordination (CCC), Home Based Services (HBS), Enhanced Monitoring Program (EMP), Comprehensive Medication Review (CMR), Community Based Programs (CBP), Pharmacy
Coordination Program (RxP), and Expert Consult Program (ECP). The Member's status in these programs is indicated as follows: Active (A), Closed (C), Member Refused (R), or
PCP Declined (D). By default the clip shows the top 50 Members. Members can be displayed in groups of 10 (up to 50). Options to filter on Members attributed to an individual
provider and to filter by All Members or just those who are Care Plan Eligible are provided as well. Names of Members without active CCM or CCC care plans are highlighted. Click
on any underlined field below to see additional information.
*Additional information on Member care coordination activities can be viewed through the care plan links on the Member roster.
This chart shows the detail for Members with multiple comorbidities over the trailing 12 months as of July, 2015. The Member Health Record (MHR) for the Member can be accessed
by clicking on the Member’s name above.
H. Multiple Comorbidities
H. Detail of Multiple Comorbidities Sample Drill Through
Filter By: Members 1-10 All Providers Care Plan Eligible
Last Claim Date
Related to Chronic
Disease
Chronic Disease Current Disease Stage Episode $
06/05/14 Asthma Asymptomatic bronchial asthma $2,600
06/05/14 Immunodeficiency Disorders Other immunodeficient disorders $1,767
01/07/14Chronic Obstruc Pulm Dis
(COPD)Chronic bronchitis $288
04/17/14 Hypertension, Essential Hypertension, minimal $204
04/03/14 Cancer - SkinBowens disease, actinic/arsenic keratosis, squamous
cell CIS, leukoplakia$174
01/06/14 Osteoarthritis Osteoarthritis of the lumbar spine $157
04/17/14 Thyroid Disorders Symptomatic hypothyroidism $11
11/12/13 Lipid AbnormalitiesHyperlipid, hypercholesterol, lipid deficiencies, other
lipid disorders.$4
VII - 49
Copyright © 2016
All rights reserved

V. Top 10 to 50 Lists of High Cost/High Risk/Highly Unstable Members
I. Gaps in Care
I. Member Detail of Care Gaps
Member Name: Mark Silver
Number of Care Gaps: 7 Age: 55
*Additional information on Member care coordination activities can be viewed through the care plan links on the Member roster.
The chart below displays a list of Members with identified gaps in care. Gaps in Care are categorized into three types of care gaps: chronic care gaps, population health
gaps, and PCP visit gaps. Criteria for chronic care measures, population health measures, and PCP visit gaps vary for each measure by person, age, and illness condition.
More information on chronic care measures and population health measures can be found in the Quality Scorecard. Members age 45 and older and 21 and younger are
considered to have a PCP visit gap if they have not had a visit in 1 year. Members ages 22-44 are included if they have not had a visit in 2 years. Care Coordination
Programs include Hospital Transition of Care (HTC), Complex Case Management (CCM), Chronic Care Coordination (CCC), Home Based Services (HBS), Enhanced
Monitoring Program (EMP), Comprehensive Medication Review (CMR), Community Based Programs (CBP), Pharmacy Coordination Program (RxP), and Expert Consult
Program (ECP). The Member's status in these programs is indicated as follows: Active (A), Closed (C), Member Refused (R), or PCP Declined (D). By default the clip
shows the top 50 Members. Members can be displayed in groups of 10 (up to 50). Options to filter on Members attributed to an individual provider and to filter by All
Members or just those who are Care Plan Eligible are provided as well. The information is sorted by total gaps, then number of chronic care gaps. Click on any
underlined field below to see additional information.
This chart shows the detail of care gap measures that the member has not completed within the measurement year. The Member Health Record (MHR) for the Member can
be accessed by clicking on the Member’s name above.
Filter By: Members 1-10 All Providers Care Plan Eligible
Sample Drill Through
Care Gap Type of Gap
Diabetes - HbA1c Chronic Care
Diabetes - Retinal Exam Chronic Care
Diabetes - Medical Attention for Nephropathy Chronic Care
CAD - Lipid Test Chronic Care
CAD - BETA-Blocker Treatment Chronic Care
Colon Care Screening Population Health
Needs Recent PCP Visit PCP Visit
#Member
NameDOB
IB
ScoreProvider
# of
Chronic
Care Gaps
# of
Population
Health Gaps
PCP Visit
Gaps
Total
Gaps
Last
PCP
Visit
Care
Coordination
Program/Status*
1 Mark Silver 02/07/61 22.97 Ray Purple 5 1 1 7 03/05/12 HTC, CCM (A)
4 Roberta Green 08/08/93 22.92 Peter Black 4 3 1 8 03/04/13
2 Michael Fuchsia 08/16/52 16.53 Bonnie Beige 4 1 1 6 04/13/13
3 Gary Fuchsia 09/01/44 35.01 Gary Green 4 1 1 6 05/04/13 HTC, CCM (R)
6 Rita Orange 02/02/90 4.65 Bob Blue 3 2 1 6 05/09/10
5 Ogden Fuchsia 06/12/94 9.11 Sara Cobalt 3 2 1 6 05/06/12
8 Louis Electric 04/18/60 3.44 Irene Indigo 2 1 1 4 09/04/10 CCC (C)
9 Thomas Canary 09/08/94 2.77 Fletch Orange 2 1 1 4 03/05/12 CCC(A)
7 Harry Eggplant 05/09/62 4.21 Ronald Brown 2 0 0 2 07/05/13
10 Kimberley Electric 11/05/59 38.02 Shastine Gold 1 2 1 4 08/03/11
VII - 50
Copyright © 2016
All rights reserved

V. Top 10 to 50 Lists of High Cost/High Risk/Highly Unstable Members
#Member
NameDOB
IB
ScoreProvider Dominant Episode
# of Chronic
Condition
Flare Ups
Disease Stage
Progression
Care
Coordination
Program/Status*
1 Thomas Maroon 02/07/61 1.49 Bonnie Beige Asthma 5 No
2 Norman Electric 08/16/52 1.25 Ray Purple Asthma 4 No
3 Margaret Orange 09/01/44 7.25 Fletch Orange Cerebrovascular Disease 3 No CCC (C), HTC
4 Paula Orange 08/08/79 5.68 Sarah Colbalt Infections - Respiratory, NEC 3 No
5 Charles Orange 06/12/82 1.50 Donald Daisy Cerebrovascular Disease 4 No
6 William Orange 02/02/68 0.86 Irene Indigo Cerebrovascular Disease 3 Yes
7 Diana Red 05/09/62 46.40 Shastine Gold Renal Function Failure 2 No CCC (C)
8 Judith Electric 04/18/60 42.07 Ace Emerald Coronary Artery Disease 2 No CCM (C), HTC
9 Lillian Canary 09/18/61 33.31 Theodore Lavender Diabetes 2 Yes CCM (R), HTC
10 Laurie Green 11/05/59 28.11 S. Cornflower-Blue Cerebrovascular Disease 2 No CCM (C), HTC
Member Name: Charles Orange
Chronic Condition Flare Ups: 4 Age: 57
Member Name: William Orange
Disease Stage Progression: Yes Age: 64
*Additional information on Member care coordination activities can be viewed through the care plan links on the Member roster.
The chart below displays a list of Members with unstable chronic conditions, as indicated by frequent flare ups, or disease stage progression over the trailing 12 months as of
July, 2015. Chronic flare ups occur when a condition is not well controlled, often resulting in high cost events such as emergency room visits and/or hospital admissions.
Chronic Condition Flare Ups and Disease Progression are identified by the medical episode grouper. For additional information see Appendix I - Episodes of Care.
Care Coordination Programs include Hospital Transition of Care (HTC), Complex Case Management (CCM), Chronic Care Coordination (CCC), Home Based Services
(HBS), Enhanced Monitoring Program (EMP), Comprehensive Medication Review (CMR), Community Based Programs (CBP), Pharmacy Coordination Program (RxP), and
Expert Consult Program (ECP). The Member's status in these programs is indicated as follows: Active (A), Closed (C), Member Refused (R), or PCP Declined (D). By default
the clip shows the top 50 Members. Members can be displayed in groups of 10 (up to 50). Options to filter on Members attributed to an individual provider and to filter by All
Members or just those who are Care Plan Eligible are provided as well. Names of Members without active CCM or CCC care plans are highlighted. Click on any underlined
field below to see additional information.
This chart shows the detailed chronic condition flare up profile of the Member over the trailing 12 months as of July, 2015. The Member Health Record (MHR) for the Member
can be accessed by clicking on the Member’s name above.
This chart shows the detailed disease stage progression of the Member over the trailing 12 months as of July, 2015. The Member Health Record (MHR) for the Member can be
accessed by clicking on the Member’s name above.
J. Disease Instability
J. Detail of Disease Instability
J. Detail of Disease Instability
Sample Drill Through
Filter By: Members 1-10 All Providers Care Plan Eligible
Start Date
of Episode
End Date
of EpisodeCondition Flare Up Description
4/19/2014 05/30/14 Cerebrovascular Dis with Stroke Cerebrovascular accident with respiratory
failure
7/16/2013 07/16/13 Cerebrovascular Dis with TIA Transient ischemic attack or occlusion or
stenosis of precerebral arteries
Disease Stage in State of
ProgressionDate Stage Description
Infections - Urinary Tract 09/05/13 1.01 Urinary tract infection
Infections - Urinary Tract 05/15/14 3.01 Urinary tract infections with
renal failure
VII - 51
Copyright © 2016
All rights reserved

V. Top 10 to 50 Lists of High Cost/High Risk/Highly Unstable Members
K. Members with Adverse / High Risk Health Assessment Results
# of
Metrics
# with
Adverse
Metrics
1 Debora Eggplant 02/07/61 11.23 Fletch Orange Gynecological Disord, NEC Full Expression 5 4 CMR (R)
2 Richard Orange 08/16/52 10.74 Ray Purple Spinal/Back Disorders, NEC Full Expression 5 4
3 Marilyn Eggplant 09/01/44 6.51 Gary Green Cancer - Breast Full Expression 5 4 CCM (A), RxP (A)
4 Glenda Fuchsia 08/08/79 3.00 Irene Indigo Diabetes High Risk 5 3 CCC (A)
5 Janice Orange 06/12/82 4.50 Fer Brick-Red Gastritis/Gastroenteritis Full Expression 5 3 CMR (C)
6 Ruth Blue 02/02/68 38.02 Sarah Cobalt Injury - Head/Spinal Cord Full Expression 5 3
7 Donna Orange 05/09/62 4.01 Shastine Gold Diabetes Full Expression 5 3 CMR (C)
8 Robert Red 04/18/60 2.62 Ronald Brown Coronary Artery Disease High Risk 5 3 CCM (A), RxP (A)
9 Kimberly Fuchsia 09/18/61 1.23 Bonnie Beige Diabetes High Risk 5 3 CCC (R)
10 Doreen Orange 11/05/59 5.41 Bob Blue Mental Hlth - Substance Abuse Full Expression 5 3
*Additional information on Member care coordination activities can be viewed through the care plan links on the Member roster.
K. Detail of Health Assessment ResultsMember Name: Debora Eggplant
Number of Adverse Metrics: 4 Age: 53
This chart shows the detailed Health Assessment risk factor flag profile of the Member over the trailing 12 months as of July, 2015. The Member Health Record (MHR) for
the Member can be accessed by clicking on the Member’s name above
#
Care
Coordination
Program/Status*
Risk
CategoryDOB
The chart below displays a list of Members with a completed Health Assessment with adverse screening results indicating a high risk for a decline in health. These
assessments are based on biometric screening results such as blood pressure and cholesterol results, and Member responses to specific lifestyle questions such as smoking
status and level of physical activity. Members on this chart have a Risk Category of Full Expression or High Risk and/or 2 or more adverse metrics on biometric
screenings. Care Coordination Programs include Hospital Transition of Care (HTC), Complex Case Management (CCM), Chronic Care Coordination (CCC), Home
Based Services (HBS), Enhanced Monitoring Program (EMP), Comprehensive Medication Review (CMR), Community Based Programs (CBP), Pharmacy Coordination
Program (RxP), and Expert Consult Program (ECP). The Member's status in these programs is indicated as follows: Active (A), Closed (C), Member Refused (R), or PCP
Declined (D). By default the clip shows the top 50 Members. Members can be displayed in groups of 10 (up to 50). Options to filter on Members attributed to an
individual provider and to filter by All Members or just those who are Care Plan Eligible are provided as well. Click on any underlined field below to see additional
information.
Member
Name
IB
Score
Biometric
Screenings
Provider Dominant Episode
Sample Drill Through
Filter By: Members 1-10 All Providers Care Plan Eligible
Date of
Health Assessment
Health Assessment
Category
Biometric Screening
with Adverse Results
Biometric Screening
with Adverse Results
12/22/13 Biometric Screening BMI 40
Biometric Screening Blood Pressure 210/105
Biometric Screening Total Cholesterol 425 mg/dL
Biometric Screening LDL-C 205 LDL
VII - 52
Copyright © 2016
All rights reserved

VI. Use of TCCI Programs
This section shows the degree to which Members in the Panel are receiving various care coordination services that are suited to the nature and extent
of their illness, condition or risk status. All fifteen distinct TCCI Programs are aimed at helping PCPs and Panels find, manage, and care for
Members at high risk or at stages in their illnesses where coordination is critical to avoiding breakdown. A brief summary of each TCCI Program is
listed below for quick reference. See the Program Description and Guidelines for more complete information on each element.
Continuous Tracking of TCCI Programs
All Programs used in support of a specific Member or all Members in a particular Panel are tracked and shown in the PCMH SearchLight Report.
Included in this tracking is a pre and post view of the Member’s claims experience in order to assess the degree to which the Program Element(s) is
working to improve care to the Member and reduce breakdowns that may involve expensive hospital based services.
It should be noted that care coordination fees in the form of Debits are charged to each Panel’s Patient Care Account for TCCI care coordination
programs However, these programs are only relevant for the small percentage of high-cost Members who need the services provided in the TCCI
Program portfolio. The reduction in care costs resulting from these programs far outweighs any Debits. See Appendix L for a more complete
understanding of how these fees are included as Debits in the Patient Care Accounts of Panels for TCCI Programs.
Health Promotion, Wellness and Disease Management Program (WDM) consists of lifestyle and Disease Management coaching by
licensed professional coaches who are experts in motivating people toward healthier lifestyles and reducing risk if they are headed towards
or already have certain common chronic diseases. Also included in this program is a Health Assessment - with and without biometric
screening - that reveals one's overall health and wellbeing as well as the changes in this over time - not only for each indivdual, but for an
employer group as a whole. A broad arry of supporting program elements on fitness, smoking cessation and other health promotion
activities is available as is a rich online set of resources and information to Members that support their wellness and Disease Management
efforts.
Hospital Transition of Care Program (HTC) monitors admissions of CareFirst Members to hospitals anywhere in the country. Locally, it
relies on specially trained nurses who are stationed in hospitals throughout the CareFirst region. The HTC program assesses Member need
upon admission and during a hospital stay with a focus on post discharge needs. It begins the Care Plan process for Members who will be
placed in the CCM or CCC program. The HTC process also categorizes Members based on the level of their severity of need and the nature
of their illness or condition so that they can be placed in the best possible "track" for follow-up care coordination services and flags cases
that will likely result in high cost to ensure they receive the attention they need.
Complex Case Management Program (CCM) offers Care Plans for Members with advanced or critical illnesses. These Members are
typically being cared for by specialists/super specialists. CareFirst Specialty Case Managers provide care coordination services in concert
with the various specialists involved. Case management services most often follow a hospitalization. The Hospital Transition of Care
Program is typically the entry point for Members into Case Management which begins prior to discharge. All Specialty Case Managers are
registered nurses with substantial experience in their respective specialties.
Chronic Care Coordination Program (CCC) offers Care Plans to targeted Members that are developed under the direction of the PCP or
NP. This program provides coordination of care for Members with multiple chronic illnesses. While Care Plans often result from a case
management episode, they can result from a review of the trailing 12 months of healthcare use by an attributed member who is identified as
likely to benefit from a Care Plan. Care coordination for these Members is carried out through the Local Care Coordinator (LCC) who is
assigned to each provider/practice within a Panel. The LCC, who is a Registered Nurse, assists the PCP or NP in coordinating all elements
of the Member's healthcare and ensures all action steps in the plan are followed up and carried out.
Behavioral Health and Substance Abuse Program (BHSA) includes a range of services that deal with the behavioral health needs of
Members (such as depression and various forms of psychosis and other disorders) that often accompany physical illnesses or that may stand
alone. Included in this TCCI Program Category are substance abuse services as well as psycho-social services.
Home Based Services Program (HBS) serves Members in CCM or CCC who often need considerable support at home, sometimes on a
prolonged basis. These services can include home health aide, psycho-social services and other behavioral health services as well as
medication management and support in activities of daily living. If such services are needed, they are provided following an assessment of
the home situation by an RN Home Care Coordinator (HCC) and become part of the overall plan of care maintained by the LCC or Case
Manager responsible for the Member. Home based services are often critical to avoiding the cycle of breakdown (admission, readmission)
that commonly occurs with Members who have multiple chronic diseases. Only Members specifically referred to the Home Based Care
Coordination Program by a Case Manager or an LCC are eligible for full assessment and integrated home-based services pursuant to a
Care Plan. A select list of home care agencies are used in the provision of home care services.
Enhanced Monitoring Program (EMP) focuses on those Members at high risk for disease progression to more advanced or serious illness.
The Enhanced Monitoring Program uses prescription drug and other data to identify members in each Panel that have patterns of illness
that suggest incipient high risk for progression or have chronic conditions already that need active monitoring to ensure member stability.
EMP services are provided at home or in the work setting using mobile and digital capabilities that send a stream of data to a central
monitoring station staffed by highly qualified nurses. Special alerts are sent to PCPs or NPs as necessary
.
VII - 53
Copyright © 2016
All rights reserved

VI. Use of TCCI Programs (Cont.)
Comprehensive Medication Review Program (CMR) is offered to Members where there are indications of high potential for drug
interaction, overdosing, side effects, etc. The review is performed by a local pharmacist who consults with prescribers. High Rx use, high
cost and high DVS Members are flagged for a comprehensive Rx review by a local pharmacist or specialty pharmacist to assure a Member's
drug profile is optimal and to resolve any issues with it. In addition, other cases are identified from data mining for review to reduce
problems resulting from dosage or drug interactions, etc.
Community Based Program (CBP) is a compendium of local programs that have been reviewed and selected in advance by CareFirst to be
made available to Members with identified needs who could benefit from such programs. The Service Request Hub connects members to
specific community based services such as diabetes, congestive heart failure and palliative care/hospice programs.
Pharmacy Coordination Program (RxP) is available for Members with pharmacy benefits as part of their coverage plan. This includes
management of retail and wholesale pharmacy benefits, including formulary management as well as specialty pharmacy benefits for certain
disease states (such as hepatitis C, rheumatoid arthritis, and multiple sclerosis) that require high-cost pharmaceuticals that must be
administered according to rigorous treatment plans. The Specialty Pharmacy Coordination Program not only delivers cost savings, but also
optimizes Member treatment outcomes through a compliance program that includes refill reminders and side effect management.
Management of drugs associated with transplants is included in this category.
Expert Consult Program (ECP) allows network physicians, Members or CareFirst to seek an outside expert opinion from leading,
recognized experts when needed for highly complex treatment plans. Through this program, CareFirst has access to the top physicians in
each specialty and sub-specialty category, organized by disease state.
Urgent Care and Convenience Access Program (UCA) offers, where available, organized back up to panels as an off hours support for
members with urgent care needs that might otherwise go to a hospital based emergency department or outpatient facility. Generally the costs
are one-third of what they otherwise would have been.
Centers of Distinction Program (CDP) includes highly specialized, high cost categories of care that are accessed by targeted referrals to
centers throughout the country that have been prescreened and certified by the BlueCross BlueShield Association as being the best in their
designated categories.
Preauthorization Programs (PRE) obtains a review of certain proposed services to Members that are usually infrequent but that are high
cost and where evidence of medical need must be established before approval for payment is given. Examples include high cost specialty
drugs and certain durable medical equipment.
Telemedicine Program (TMP) offers the integration of voice, data and image to create a virtual visit to a provider for a Member. The
program also enables a specialty consult for a Member or PCP in certain cases where this is more responsive than an in-person visit. TMP
also applies in cases where an off hours visit to a Member's PCP is not readily available.
Dental-Medical Health Program (DMH) recognizes dental care is an important part of overall health. This Program Element is designed to
enable and encourage appropriate dental care as determined by the Member’s treating dentist and to integrate the Member’s dental health
into their overall health profile.
VII - 54
Copyright © 2016
All rights reserved

VI. Use of TCCI Programs
*Self Management, Palliative Care, Death, Alternative Institution.
Category: 1C - Multi-Morbid Chronic Conditions
Follow Up Care Coordination: CCM
A. Profile of Members in Hospital Transition of Care (HTC) - Admissions and Costs This chart shows Member admissions by Illness Band and HTC assigned admission Category, with PMPM debit dollars for each over the trailing 12
months as of July, 2015. Category 1 Members are more acutely ill and are often targeted for TCCI Program services. Category 2 Members are less
acutely ill or have admissions for more routine care and usually need little if any care coordination services. Category 3 admissions are not triaged by
HTC due to 1-day, evening or weekend admissions that are too brief to allow an assessment.
This chart shows a more detailed breakdown of Members identified through the HTC program for Category 1 and their subsequent transitions to other
programs, if any, including Complex Case Management (CCM), Chronic Care Coordination (CCC), or alternative engagement at home through Self
Management. Click on an underlined number to see Member specific information.
This drill down shows HTC program activity at the Member level showing Member name, date of birth, dominant episode, provider, discharge date,
program referral, current program status, total gross debits, and debits PMPM for the trailing 12 months as of July, 2015. The Member Health Record
(MHR) for each Member can be accessed by clicking on the Member’s name below.
B. Profile of Members in Hospital Transition of Care (HTC) - Follow Up Care for High Risk Admissions
B. Detail of Members in Hospital Transition of Care (HTC) - Follow Up Care for High Risk Admissions
Sample Drill Through
Illness BandTotal
Admits
HTC
Category 1
Admits
%
Category 1
Admits
Category 1
PMPM
HTC
Category 2
Admits
%
Category 2
Admits
Category 2
PMPM
HTC
Category 3
Admits
%
Category 3
Admits
Category 3
PMPM
Advanced/Critical Illness 314 210 66.9% $7,612.36 82 26.1% $5,276.33 22 7.0% $3,190.99
Multiple Chronic Illnesses 177 57 32.2% $3,298.69 113 63.8% $2,363.58 7 4.0% $1,210.56
At Risk 56 13 23.2% $1,490.44 38 67.9% $1,415.00 5 8.9% $613.38
Stable 15 7 46.7% $3,978.85 8 53.3% $3,998.68 0 0.0% $198.59
Healthy 7 5 71.4% $3,824.49 2 28.6% $1,882.77 0 0.0% $83.28
Total 569 292 51.3% $6,474.36 251 44.1% $2,503.48 34 6.0% $1,688.74
Follow Up Care Coordination
CCM CCC Self Mgt.Refused
CCM or CCCOther*
1A - Advanced Illness/Palliative 25 4 5 9 5 2 12
1B - Catastrophic Events 131 92 7 23 4 5 36
1C - Multi-Morbid Chronic Conditions 219 115 96 7 1 0 12
1D - NICU Babies 36 33 3 0 0 0 0
1E - Special Needs Pediatrics 28 23 5 0 0 0 0
1F - Complex Infections/Immunological Conditions 5 1 0 2 1 1 5
1G - Transplant 3 3 0 0 0 0 3
1H - End Stage Renal Disease 2 0 1 0 1 0 2
1I - Other 5 3 1 0 1 0 3
Total 454 274 118 41 13 8 73
High Cost
Cases
Breakdown of
Admission Category 1Members
# Member Name DOB ProviderHigh
Cost Case
Dominant
Episode
Discharge
Date
Total
Debit $
Debits
PMPM
Care Coordination
Program Status
1 Paul Purple 09/09/60 Samuel Yellow Y Infec/Inflam - Skin Tissue 5/28/13 $125,644 $10,470.40 CCC (A), HTC
2 Cynthia Mauve 04/09/49 Fletch Orange N Cardiac Arrhythmias 12/5/13 $79,360 $6,613.38 CCM (R), CCC (A), HTC
3 Mike Orange 11/05/66 Irene Indigo Y Pnemonia, Bacterial 2/28/13 $65,915 $5,492.99 CCC (A), HTC
115 Katie Black 05/14/56 Peter Black Y Infections - Urinary Tract 2/4/14 $9,721 $810.11 CCC (C), HTC
VII - 55
Copyright © 2016
All rights reserved

VI. Use of TCCI Programs
HTC Other
Advanced/Critical Illness 93 15.57 74 19 3 49 42
Multiple Chronic Illnesses 41 3.55 28 13 0 19 22
At Risk 6 1.57 4 2 0 3 3
Stable 2 0.33 0 2 0 1 1
Healthy 0 0.00 0 0 0 0 0
Total 142 11.29 106 36 3 72 68
Illness Band: Advanced/Critical Illness
Status: Active
C. Profile of Members in Complex Case Management (CCM)
C. Detail of Members in Complex Case Management (CCM)
This chart shows Panel Members who are or have been in CCM and key statistics on a pre and post active basis that show the use and cost patterns
applicable to each Member. The Member Health Record (MHR) for each Member can be accessed by clicking on the Member’s name below.
This drill down shows CCM Member level information, including Member name, date of birth provider, dominant episode, active dates, closed dates,
and program participation duration over the trailing 12 months as of July, 2015. The Member Health Record (MHR) for each Member can be
accessed by clicking on the Member’s name below.
This chart shows total Panel Members by band who have been identified for engagement in CCM, their current average illness burden scores, referral
source (HTC or Other for active and closed Care Plans), and current program status: active, closed or Member refused over the trailing 12 months as
of July, 2015. Click on any underlined number to see Member specific information.
SourceIllness Band
Identified
CCM
Members
Average
IB ScoreActive Closed
Member
Refused
D. Members in Complex Case Management (CCM) - Key Measures / Outcomes
Sample Drill Through
#Member
NameDOB Provider
Dominant
Episode
Active
Date
Closed
Date
Duration
(Days)
1 Nick Brown 09/05/56 Gary Green Tumors- Gastroint, Benign 7/14/13 74
2 Ray Purple 10/14/53 Donald Daisey Osteoarthritis 7/18/13 70
3 Fey Rose 12/14/57 Peter Black Diabetes 6/27/13 91
#Member
NameDOB Provider
Program
Status
Active
Date
Pre-IB Score
(At Active)
Post-IB Score
(Current)
Pre-Active
PMPM
Post-Active
PMPM
Pre-Active
Admits/ER
Post-Active
Admits/ER
1 Paul Purple 12/05/69 Sarah Cobalt Closed 4/18/13 1.94 1.94 $1,198.99 $234.48 2 0
2 Mike Orange 10/31/50 Ray Purple Closed 5/1/13 3.25 2.14 $2,903.32 $1,726.66 1 0
3 Cindy Blue 09/10/45 Gary Green Closed 11/9/13 29.66 22.86 $4,801.34 $3,848.95 2 0
75 Bonnie Pink 10/18/51 Ace Emerald Active 2/22/13 4.69 4.69 $2,742.09 $0.00 1 0
VII - 56
Copyright © 2016
All rights reserved

VI. Use of TCCI Programs
TCCI Program
and
Activation Date
#
Members
Pre-IB
Score
(At Active)
Post-IB
Score
(Current)
Pre-Active
PMPM
Post-Active
PMPM
Pre-Active
Admits/ER
Post-Active
Admits/ER
HBS Total 17 4.55 3.85 $836.68 $781.76 15 4
0 to <3 Months 5 2.55 0.07 $578.25 $516.00 3 0
3 to <6 Months 5 0.70 0.66 $621.89 $546.99 2 0
6 to <9 Months 4 1.54 1.50 $744.54 $722.66 6 0
9 to <12 Months 2 3.72 3.25 $781.75 $744.59 2 2
12+ Months 1 14.25 13.78 $1,456.97 $1,378.54 2 2
EMP Total 94 22.85 24.67 $4,827.74 $9,966.20 18 2
0 to <3 Months 15 35.11 37.78 $10,507.34 $2,377.88 4 0
3 to <6 Months 22 19.99 24.61 $906.08 $703.82 3 0
6 to <9 Months 38 19.03 23.68 $7,552.16 $870.51 6 1
9 to <12 Months 14 33.10 19.80 $3,751.44 $20,632.95 2 0
12+ Months 5 7.04 17.50 $1,421.67 $25,245.86 3 1
CMR Total 21 1.36 1.24 $741.34 $521.67 22 16
0 to <3 Months 4 0.05 0.40 $272.03 $611.42 3 1
3 to <6 Months 2 1.13 0.81 $353.48 $1,105.55 2 0
6 to <9 Months 6 1.14 1.14 $1,060.80 $0.00 4 1
9 to <12 Months 4 1.79 1.16 $1,074.53 $783.60 4 9
12+ Months 5 2.69 2.69 $945.88 $107.80 9 5
CBP Total 32 13.12 8.98 $3,372.47 $1,844.23 28 13
0 to <3 Months 5 36.63 19.80 $11,039.17 $4,093.22 11 5
3 to <6 Months 8 7.48 9.73 $2,098.00 $797.56 6 3
6 to <9 Months 7 11.52 7.05 $2,768.37 $3,319.09 4 4
9 to <12 Months 9 5.02 4.21 $473.95 $661.28 5 1
12+ Months 3 4.93 4.10 $482.87 $350.00 2 0
SBH Total 26 2.27 1.41 $393.23 $1,090.17 1 3
0 to <3 Months 7 0.43 0.43 $22.08 $350.00 0 0
3 to <6 Months 1 1.24 0.86 $1,130.71 $1,849.89 0 1
6 to <9 Months 8 5.54 1.45 $213.87 $1,623.90 1 0
9 to <12 Months 9 1.68 1.57 $51.61 $1,021.00 0 2
12+ Months 1 2.47 2.74 $547.88 $606.05 0 0
RxP Total 73 16.60 23.91 $7,781.65 $23,180.86 25 27
0 to <3 Months 11 33.59 63.63 $24,688.92 $99,904.15 4 6
3 to <6 Months 18 12.63 22.87 $777.69 $7,144.10 1 3
6 to <9 Months 26 28.19 21.83 $11,242.50 $5,165.10 7 4
9 to <12 Months 17 8.53 10.81 $1,927.13 $3,079.53 4 9
12+ Months 1 0.05 0.40 $272.03 $611.42 9 5
E. CCM Members Engaged in Other TCCI ProgramsThis chart shows Panel Members who are or have been in CCM and have also been engaged in an additional TCCI Program (HBS, EMP,
CMR, CBP, SBH, CDP, or RxP). Key statistics on a pre and post active basis are also included to show the use and cost patterns applicable
to each Program. Members are broken out into "vintage" groups based on the activation date of the program. Pre and post figures are only
shown after three months of run out and thus are not displayed for the most recent three months.
VII - 57
Copyright © 2016
All rights reserved

VI. Use of TCCI Programs
HTC Other
Advanced/Critical Illness 432 11.05 302 130 21 13 49 1
Multiple Chronic Illnesses 347 3.72 225 122 27 16 79 5
At Risk 75 1.54 45 30 1 11 28 5
Stable 34 0.70 27 7 4 6 19 0
Healthy 5 0.07 3 2 0 1 3 0
Total 893 3.42 602 291 53 47 178 11
Illness Band: Multiple Chronic Illnesses
Status: Active
F. Profile of Members in Chronic Care Coordination (CCC)
F. Detail of Members in Chronic Care Coordination (CCC)
PCP
Declined
Source
This chart shows the total Panel Members by band, who have been identified for engagement in CCC, their current average illness burden scores, and
current program status: active, closed, Member refused or PCP Declined over the trailing 12 months as of July, 2015. "Potential" Members are those
with Illness Burden Scores of 4.0 or higher or who have been identified by an LCC or CCM.
This drill down shows CCC Member level information, including Member name, date of birth, provider, dominant episode, active dates, closed dates,
and program participation duration over the trailing 12 months as of July, 2015. This report is sorted by descending duration days, and then active date
in order of oldest to newest. The Member Health Record (MHR) for each Member can be accessed by clicking on the Member's name below.
This chart shows Panel Members who are or have been in CCC and key statistics on a pre and post active basis that show the use and cost patterns
applicable to each Member. The Member Health Record (MHR) for each Member can be accessed by clicking on the Member’s name below.
Illness Band
Potential
CCC
Members
Average
IB ScoreActive Closed
Member
Refused
G. Members in Chronic Care Coordination (CCC) - Key Measures / Outcomes
Sample Drill Through
#Member
NameDOB Provider
Program
Status
Active
Date
Pre-IB
Score (At
Active)
Post-IB
Score
(Current)
Pre-Active
PMPM
Post-Active
PMPM
Pre-Active
Admits/ER
Post-Active
Admits/ER
1 Shelly White 11/18/47 Irene Indigo Active 5/6/13 15.85 27.98 $4,402.85 $34,258.24 4 2
2 Evan Gray 10/29/56 Bob Blue Active 8/12/13 43.86 25.09 $6,780.30 $264.97 0 0
3 Harry Black 06/09/51 Ronald Brown Closed 3/11/13 22.47 22.48 $3,359.53 $0.00 5 0
100 John Blue 05/30/60 Gary Green Active 5/10/13 5.55 20.38 $7,341.68 $28,625.75 6 4
#Member
NameDOB Provider
Dominant
Episode
Active
Date
Closed
Date
Duration
(Days)
1 John White 10/29/56 Bonnie Beige Cardiac Arrhythmias 4/26/13 172
2 Cindy Blue 07/14/57 Bob Blue Fracture/Disloc - Ankle/Foot 4/28/13 108
3 Gandolf Grey 05/30/60 Theodore Lavender Cancer - Prostate 5/9/13 220
4 Lee Purple 09/09/61 Ace Emerald Cancer - Lung 12/24/13 241
27 Bonnie Pink 05/28/42 Tom Turquoise Cancer - Lung 5/6/13 89
VII - 58
Copyright © 2016
All rights reserved

VI. Use of TCCI Programs
TCCI Program
and
Activation Date
#
Members
Pre-IB Score
(At Active)
Post-IB
Score
(Current)
Pre-Active
PMPM
Post-Active
PMPM
Pre-Active
Admits/ER
Post-Active
Admits/ER
HBS Total 30 11.13 10.78 $878.70 $780.43 18 7
0 to <3 Months 17 19.79 18.02 $514.58 $481.21 4 0
3 to <6 Months 4 17.02 16.56 $642.89 $537.84 3 0
6 to <9 Months 6 10.03 9.02 $801.45 $712.46 5 1
9 to <12 Months 2 3.70 3.71 $776.89 $742.14 3 3
12+ Months 1 5.10 5.00 $1,571.56 $1,389.87 3 3
EMP Total 92 1.96 2.00 $4,815.41 $9,785.15 20 5
0 to <3 Months 12 1.02 0.98 $10,404.51 $2,751.56 5 0
3 to <6 Months 20 2.32 2.35 $942.15 $801.41 3 1
6 to <9 Months 40 0.90 0.94 $7,612.04 $951.41 5 2
9 to <12 Months 16 3.10 3.20 $3,814.01 $21,014.14 3 0
12+ Months 4 2.46 3.00 $1,423.54 $24,145.87 4 2
CMR Total 27 3.08 3.10 $844.20 $831.53 22 21
0 to <3 Months 6 6.20 7.00 $281.41 $711.45 3 2
3 to <6 Months 3 3.20 3.21 $341.45 $1,102.54 2 1
6 to <9 Months 8 1.14 1.14 $1,044.58 $21.41 4 2
9 to <12 Months 4 2.10 2.11 $1,401.41 $831.51 4 10
12+ Months 6 2.75 2.76 $951.15 $104.85 9 6
CBP Total 33 4.01 4.02 $3,549.48 $6,306.56 37 19
0 to <3 Months 7 7.26 7.24 $11,082.56 $15,002.87 12 9
3 to <6 Months 11 4.20 4.00 $2,106.05 $7,945.41 7 2
6 to <9 Months 6 1.26 1.26 $2,598.88 $3,219.54 6 5
9 to <12 Months 7 5.05 5.03 $473.95 $661.28 9 2
12+ Months 2 2.30 2.34 $481.41 $694.84 3 1
SBH Total 35 1.65 1.99 $406.08 $1,059.71 3 6
0 to <3 Months 9 0.31 0.38 $25.57 $250.45 0 0
3 to <6 Months 1 1.24 0.86 $1,154.56 $1,794.54 1 2
6 to <9 Months 9 3.57 4.24 $212.90 $1,731.85 2 0
9 to <12 Months 12 1.81 1.58 $49.41 $1,015.15 0 3
12+ Months 4 1.34 2.89 $548.15 $506.54 0 1
RxP Total 82 3.35 4.05 $8,928.58 $22,726.42 30 33
0 to <3 Months 15 5.90 6.00 $26,549.51 $97,215.51 5 7
3 to <6 Months 21 4.23 4.65 $981.56 $8,145.45 2 5
6 to <9 Months 26 3.12 3.20 $12,621.50 $5,041.14 9 5
9 to <12 Months 16 1.03 1.00 $1,841.51 $2,584.54 3 10
12+ Months 4 2.48 5.00 $281.41 $645.45 11 6
H. CCC Members Engaged in Other TCCI ProgramsThis chart shows Panel Members who are or have been in CCC and have also been engaged in an additional TCCI Program (HBS, EMP,
CMR, CBP, SBH, CDP, or RxP). Key statistics on a pre and post active basis are also included to show the use and cost patterns applicable
to each Program. Members are broken out into "vintage" groups based on the activation date of the program. Pre and post figures are only
shown after three months of run out and thus are not displayed for the most recent three months.
VII - 59
Copyright © 2016
All rights reserved

VI. Use of TCCI Programs
I. Profile of Members in Home Based Services (HBS)
I. Detail of Members in Home Based Services (HBS)Illness Band: Advanced/Critical Illness
Status: Active
J. Members in Home Based Services (HBS) - Key Measures / OutcomesThis chart shows Panel Members who are or have been in HBS and key statistics on a pre and post active basis that show the use and cost patterns
applicable to each Member. The Member Health Record (MHR) for each Member can be accessed by clicking on the Member’s name below.
This chart shows total Panel Members by band who have been engaged in HBS, their current average illness burden scores, and referral source
(CCM, CCC or Other) over the trailing 12 months as of July, 2015. Click on any underlined number to see Member specific information.
This drill down shows HBS Member level information, including Member name, date of birth, provider, dominant episode, active dates, closed dates,
and program participation duration over the trailing 12 months as of July, 2015. The Member Health Record (MHR) for each Member can be
accessed by clicking on the Member’s name below.
Sample Drill Through
# Member Name DOB ProviderIB
Score
Source
(CCM, CCC,
Other)
Dominant
Episode
Active
Date
Closed
Date
Duration
(Days)
1 Lee Purple 09/09/61 Ace Emerald 19.17 CCC Cancer - Lung 12/24/13 8/22/14 241
2 Gandolf Grey 05/30/60 Theodore Lavender 34.00 CCM Cancer - Prostate 5/9/13 12/15/13 220
3 John White 10/29/56 Bonnie Beige 7.70 CCM Cardiac Arrhythmias 4/26/13 10/15/13 172
CCM CCC Other
Advanced/Critical Illness 24 19.79 15 10 1 3 10 112
Multiple Chronic Illnesses 5 3.66 2 3 0 1 3 75
At Risk 1 1.07 0 1 0 0 0 0
Stable 0 0.00 0 0 0 0 0 0
Healthy 0 0.00 0 0 0 0 0 0
Total 30 8.17 17 14 1 3 13 94
Illness BandHBS
Members
Average
IB Score
SourceActive Closed
Average
Duration
#Member
NameDOB Provider
Program
Status
Pre-IB Score
(At Active)
Post-IB Score
(Current)
Pre-Active
PMPM
Post-Active
PMPM
Pre-Active
Admits/ER
Post-Active
Admits/ER
1 John White 10/29/56 Bonnie Beige Active 15.85 27.98 $3,266.72 $2,443.28 9 9
2 Cindy Blue 07/14/57 Bob Blue Closed 43.86 25.09 $3,073.74 $2,991.36 6 5
3 Gandolf Grey 05/30/60Theodore Lavender Closed 22.47 22.48 $1,157.39 $739.09 7 7
4 Lee Purple 09/09/61 Ace Emerald Active 13.33 13.58 $2,385.33 $1,842.25 8 6
16 Bonnie Pink 05/28/42 Tom Turquoise Closed 5.55 20.38 $836.10 $614.08 5 4
VII - 60
Copyright © 2016
All rights reserved

VI. Use of TCCI Programs
K. Profile of Members in Enhanced Monitoring Program (EMP)
CCM CCC Other
Advanced/Critical Illness 10 12.97 2 8 0 4 4 92
Multiple Chronic Illnesses 3 3.65 0 3 0 1 1 84
At Risk 1 1.59 0 0 1 0 0 0
Stable 0 0.00 0 0 0 0 0 0
Healthy 0 0.00 0 0 0 0 0 0
Total 14 10.16 2 11 1 5 5 176
K. Detail of Members in Enhanced Monitoring Program (EMP)Illness Band: Advanced/Critical Illness
Status: Active
L. Members in Enhanced Monitoring Program (EMP) - Key Measures / Outcomes
This drill down shows EMP Member level information, including Member name, date of birth, provider, Illness Burden Score, referral source (CCM,
CCC, or Other), dominant episode, active dates, closed dates, and program participation duration over the trailing 12 months as of July, 2015. The
Member Health Record (MHR) for each Member can be accessed by clicking on the Member’s name below.
This chart shows Panel Members who are or have been in EMP and key statistics on a pre and post active basis that show the use and cost patterns
applicable to each Member. The Member Health Record (MHR) for each Member can be accessed by clicking on the Member’s name below.
Active ClosedAverage
Duration
This chart shows total Panel Members by band who have been identified for engagement in EMP, their current average illness burden scores and current
program status: active or closed over the trailing 12 months as of July, 2015. Members are identified for the enhanced monitoring program through
either the Complex Case Management (CCM) or Chronic Care Coordination (CCC) programs. Click on any underlined number to see Member specific
information.
Illness BandEMP
Members
Average
IB Score
Source
Sample Drill Through
# Member Name DOB ProviderIB
Score
Source
(CCM, CCC,
Other)
Dominant
Episode
Active
Date
Closed
Date
Duration
(Days)
1 John White 10/29/56 Bonnie Beige 7.70 CCM Cardiac Arrhythmias 4/26/13 10/15/13 172
2 Cindy Blue 07/14/57 Bob Blue 91.80 CCC Fracture/Disloc - Ankle/Foot 4/28/13 8/14/13 108
3 Gandolf Grey 05/30/60 Theodore Lavender 34.00 CCM Cancer - Prostate 5/9/13 12/15/13 220
4 Lee Purple 09/09/61 Ace Emerald 19.17 CCC Cancer - Lung 12/24/13 8/22/14 241
#Member
NameDOB Provider
Program
Status
Pre-IB Score
(At Active)
Post-IB
Score
(Current)
Pre-Active
PMPM
Post-Active
PMPM
Pre-Active
Admits/ER
Post-Active
Admits/ER
1 John White 10/29/56 Bonnie Beige Active 15.85 27.98 $3,266.72 $2,443.28 9 9
2 Cindy Blue 07/14/57 Bob Blue Closed 43.86 25.09 $3,073.74 $2,991.36 6 5
3 Gandolf Grey 05/30/60 Theodore Lavender Closed 22.47 22.48 $1,157.39 $739.09 7 7
4 Lee Purple 09/09/61 Ace Emerald Active 13.33 13.58 $2,385.33 $1,842.25 8 6
10 Bonnie Pink 05/28/42 Tom Turquoise Closed 5.55 20.38 $836.10 $614.08 5 4
VII - 61
Copyright © 2016
All rights reserved

VI. Use of TCCI Programs
M. Profile of Members in Comprehensive Medication Review (CMR)
Illness Band
Referred
CMR
Members
Average
IB Score
Completed
CMR
Member
Refused
Advanced/Critical Illness 24 10.22 7 5
Multiple Chronic Illnesses 87 3.85 16 16
At Risk 119 1.88 16 22
Stable 174 0.61 25 25
Healthy 53 0.19 12 3
Total 457 2.01 76 71
M. Detail of Members in Comprehensive Medication Review (CMR)Illness Band: Advanced/Critical Illness
Status: Completed
This chart shows the total Panel Members with a pharmacy benefit who were referred for CMR services and the number completing a review.
Members are identified for CMR through referral by a Local Care Coordinator (LCC) or Complex Case Manager (CCM), as well as an
automatic iCentric "trigger" that calls for a review. Click on any underlined number to see Member specific information.
This drill down shows CMR Member level information, including Member name, date of birth, provider, top 50 list, referral date, completed
date, $ savings, and script changes (adds and deletes) as a result of the CMR over the trailing 12 months as of June, 2015. The Member Health
Record (MHR) for each Member can be accessed by clicking on the Member’s name below.
N. Members in Comprehensive Medication Review (CMR) - Key Measures / OutcomesThis chart shows Panel Members who are or have been in CMR and key statistics on a pre and post active basis that show the pharmacy use and
cost patterns applicable to each Member. The Member Health Record (MHR) for each Member can be accessed by clicking on the Member’s
name below.
Sample Drill Through
#Member
NameDOB Provider
Program
Status
Active
Date
Pre-Active
# Drugs
Post-Active
# Drugs
Pre-DVS
(At Active)
Post-DVS
(Current)
Pre-Active
Rx PMPM
Post-Active
Rx PMPM
1 Paul Purple 02/04/69 Sarah Cobalt Closed 4/18/13 4 0 9 9 $3,266.72 $2,443.28
2 Mike Orange 05/08/74 Ray Purple Closed 5/1/13 1 2 6 5 $3,073.74 $2,991.36
3 Cindy Blue 08/02/54 Gary Green Closed 11/9/13 4 1 7 7 $1,157.39 $739.09
76 Bonnie Pink 09/01/60 Ace Emerald Closed 2/22/13 3 2 5 4 $836.10 $614.08
Adds Deletes
1 Richard Rouge 02/24/59 Jonathan MoodsonHigh Rx $,
High # Rx12/5/13 12/9/13 Yes Yes No
2 Dale Denim 04/22/57 Catherine Cloggerty High # Rx 3/9/13 3/13/13 Yes No No
3 Lady Pink 06/02/57 Timothy Block High DVS 3/6/13 3/12/13 No Yes No
4 Mary Maroon 08/08/50 Uri Lipidinsky High Rx $ 3/10/13 3/14/13 Yes Yes Yes
5 Rita Rose 03/02/55N/A (Advisory Initiated
by Pharmacist)High DVS 1/28/13 1/31/13 No Yes No
6 Marianne Mulberry 11/19/54 Arthur Corazone High # Rx 12/19/13 12/23/13 No No Yes
7 Gwendolyn Grey 02/23/49 Samuel Bloodworth High Rx $ 9/7/13 9/11/13 Yes Yes No
Referral
Date
Completed
Date
$
Savings
Scripts#
Member
NameDOB Provider
Top 50
List
VII - 62
Copyright © 2016
All rights reserved

VI. Use of TCCI Programs
O. Profile of Members in Community Based Programs (CBP)
CCM CCC Other
Advanced/Critical Illness 52 22.28 27 0 26 2 12 48
Multiple Chronic Illnesses 9 3.84 1 0 8 1 2 92
At Risk 0 0.00 0 0 0 0 0 0
Stable 0 0.00 0 0 0 0 0 0
Healthy 0 0.00 0 0 0 0 0 0
Total 61 13.06 28 0 34 3 14 70
O. Detail of Profile of Members in Community Based Programs (CBP)Illness Band: Advanced/Critical Illness
Status: Accepted
P. Members in Community Based Programs (CBP) / Key Measures / Outcomes
17
This chart shows total Panel Members by band who have been referred to CBP services, their current average illness burden scores, referral source
(CCM, CCC) and those who have accepted the services. Members are identified for CBP through referral from a Local Care Coordinator (LCC) or
Complex Case Manager (CCM). Click on any underlined number to see Member specific information.
This drill down shows Member level information, including Member name, date of birth, provider, dominant episode, referral source (CCM or CCC),
CBP program, active dates, closed dates, and program participation duration over the trailing 12 months as of July, 2015. The Member Health Record
(MHR) for each Member can be accessed by clicking on the Member’s name below.
This chart shows Panel Members who are or have been in CBP and key statistics on a pre and post active basis that show the use and cost patterns
applicable to each Member. The Member Health Record (MHR) for each Member can be accessed by clicking on the Member’s name below.
Illness BandCBP
Members
Average
IB ScoreActive
Average
Duration
SourceClosed
Sample Drill Through
# Member Name DOB ProviderIB
Score
Source
(CCM,
CCC,
Other)
Dominant
Episode
CBP
Program
Active
Date
Closed
Date
Duration
(Days)
1 John White 10/29/56 Bonnie Beige 7.70 CCM Cardiac Arrhythmias 4/26/13 10/15/13 80
2 Cindy Blue 7/14/57 Bob Blue 91.80 CCC Fracture/Disloc - Ankle/Foot 4/28/13 8/14/13 16
#Member
NameDOB Provider
Program
Status
Pre-IB Score
(At Active)
Post-IB Score
(Current)
Pre-Active
PMPM
Post-Active
PMPM
Pre-Active
Admits/ER
Post-Active
Admits/ER
1 John White 10/29/56 Bonnie Beige Active 15.85 27.98 $3,266.72 $2,443.28 9 9
2 Cindy Blue 07/14/57 Bob Blue Closed 43.86 25.09 $3,073.74 $2,991.36 6 5
3 Gandolf Grey 05/30/60 Theodore Lavender Closed 22.47 22.48 $1,157.39 $739.09 7 7
4 Lee Purple 09/09/61 Ace Emerald Active 13.33 13.58 $2,385.33 $1,842.25 8 6
17 Bonnie Pink 05/28/42 Tom Turquoise Closed 5.55 20.38 $836.10 $614.08 5 4
VII - 63
Copyright © 2016
All rights reserved

VI. Use of TCCI Programs
Q. Profile of Members in Pharmacy Coordination Program (RxP)
Illness Band
Referred
RxP
Members
Average
IB ScoreActive Closed
Member
Refused
Advanced/Critical Illness 82 14.66 28 4 3
Multiple Chronic Illnesses 42 2.73 15 2 2
At Risk 17 1.71 9 1 0
Stable 9 0.55 10 0 1
Healthy 0 0.00 0 0 0
Total 150 8.89 62 7 6
Q. Detail of Members in Pharmacy Coordination Program (RxP)Illness Band: Advanced/Critical Illness
Status: Active
R. Profile of Members by Specialty Pharmacy Category
R. Detail of Profile of Members by Specialty Pharmacy CategoryPharmacy Coordination Category: Hemophilia
Status: Referred RxP Members
This drill down shows RxP Member level information, including Member name, date of birth, provider, specialty category, dominant episode, active dates, closed dates,
and program participation duration over the trailing 12 months as of July, 2015. The RxP program applies only to Members taking specialty drugs. The Member Health
Record (MHR) for each Member can be accessed by clicking on the Member’s name below.
This chart shows total Panel Members by band who have been referred to the RxP Program, their current average illness burden scores, and current program status:
active, closed or Member refused over the trailing 12 months as of July, 2015. The RxP program applies only to Members taking specialty drugs. Click on any underlined
number to see Member specific information.
This chart identifies referred, active, and closed RxP Members by Specialty Pharmacy Category (conditions treated) and debits PMPM over the trailing 12 months as of
July, 2015 for active and closed Members. The RxP program applies only to Members taking specialty drugs. Click on any underlined number to see Member specific
information.
This drill down shows RxP Member level information, including Member name, date of birth, provider, specialty category, dominant episode, active dates, closed dates,
program participation duration, and PMPM over the trailing 12 months as of July, 2015. The RxP program applies only to Members taking specialty drugs. The Member
Health Record (MHR) for each Member can be accessed by clicking on the Member’s name below.
Sample Drill Through
Sample Drill Through
#Member
NameDOB Provider
Specialty Pharmacy
Category
Dominant
Episode
Active
Date
Closed
Date
Duration
(Days)
PMPM
Rx $
PMPM
Total $
1 Paul Purple 02/04/69 Sarah Cobalt Hepatitis C Hepatitis C with bleeding 04/26/13 10/15/13 172 $2,051.54 $3,622.21
2 Mike Orange 05/08/74 Ray Purple Rheumatoid Arthritis Rheumatoid arthritis with anemia 04/28/13 08/14/13 108 $1,544.12 $2,632.21
3 Cindy Blue 08/02/54 Gary Green Multiple Sclerosis Multiple sclerosis with sepsis 05/09/13 12/15/13 220 $2,051.54 $3,622.21
#Member
NameDOB Provider
Pharmacy
Coordination
Category
Dominant
Episode
Active
Date
Closed
Date
Duration
(Days)
1 John White 10/29/56 Bonnie Beige Hepatitis C with bleeding Hepatitis C with bleeding 4/26/13 5/1/13 5
28 Gandolf Grey 5/30/60 Theodore Lavender Multiple sclerosis with sepsis Multiple sclerosis with sepsis 5/9/13 7/1/13 53
Specialty Pharmacy
Category
Referred
RxP
Members
Active ClosedActive & Closed
PMPM
Hemophilia 3 2 1 $3,266.72
Hepatitis C 2 0 1 $3,073.74
Multiple Sclerosis 16 5 2 $1,157.39
HIV 21 6 0 $4,533.25
Hepatitis C 41 7 0 $4,755.33
Cancer 8 1 0 $4,255.74
RSV 2 0 0 $2,531.22
Crohn's/Ulcerative Colitis 4 1 0 $1,566.45
Fertility 5 0 0 $6,541.22
Rheumatoid Arthritis 8 7 1 $922.48
Transplant 1 1 0 $24,588.00
Other 37 32 0 $1,425.94
VII - 64
Copyright © 2016
All rights reserved

VI. Use of TCCI Programs
S. Profile of Members Using Expert Consult Program (ECP)
# Member Name DOB ProviderIB
ScoreDominant Episode
Referred
Date
Report
Date
Total
Debit $
Pre-
Active
PMPM
Post-
Active
PMPM
1 Thomas Maroon 5/11/1962 Bonnie Beige 23.69 Cerebrovascular Disease 1/15/13 1/19/13 $29,962 $166.25 $141.58
2 Norman Electric 9/18/1944 Ray Purple 10.33 Dementia, Primary Degenerative 8/9/13 8/16/13 $18,718 $189.54 $187.49
3 Margaret Orange 7/6/1964 Fletch Orange 4.40 Cerebrovascular Disease 1/28/13 2/2/13 $45,891 $477.64 $469.25
4 Lillian Canary 10/12/1931 Theodore Lavender 16.87 Arthropathies/Joint Disord NEC 4/23/13 4/28/13 $32,307 $338.71 $324.25
T. Profile of Members Using Centers of Distinction Program (CDP)
U. Summary of Care Coordination Costs for Members in TCCI Programs
This chart shows Members for whom the Expert Consult Program was used, along with illness burden score, provider, dominant episode, referral and report dates, total gross debits,
and debits PMPM over the trailing 12 months as of July, 2015. The Member Health Record (MHR) for each Member can be accessed by clicking on the Member’s name below.
This chart shows Members receiving treatments covered by the Centers of Distinction Program (CDP). It includes Member name, date of birth, provider, illness burden score,
dominant procedural episode, center of distinction name, service date, total gross debits, and debits PMPM over the trailing 12 months as of July, 2015. The Member Health Record
(MHR) for each Member can be accessed by clicking on the Member’s name below.
This chart shows the number of Members engaged in Total Care and Cost Improvement (TCCI) Programs and the associated Care Coordination costs for each of these programs
posted as debits to the Patient Care Account of the Panel, along with debits PMPM (up to 12 months) before and after starting each program.
#Member
NameDOB Provider
IB
Score
Dominant
Procedural Episode
Center of
Distinction
Service
Date
Total
Debit $
Debits
PMPM
1 Paul Purple 09/09/60 Samuel Yellow 23.69 Infec/Inflam - Skin Tissue 5/28/13 $125,644 $10,470.40
2 Cynthia Mauve 04/09/49 Fletch Orange 10.33 Cardiac Arrhythmias 12/5/13 $79,360 $6,613.38
3 Mike Orange 11/05/66 Irene Indigo 4.40 Pnemonia, Bacterial 2/28/13 $65,915 $5,492.99
4 Katie Black 05/14/56 Peter Black 16.87 Infections - Urinary Tract 2/4/14 $9,721 $810.11
$
% of
Total Debits
Hospital Transition of Care (HTC) 15 $3,359.20 $24,688.92 $99,904 75.1%
Complex Case Management (CCM) 8 $1,263.52 $777.69 $7,144 5.4%
Chronic Care Coordination (CCC) 9 $1,258.56 $11,242.50 $5,165 3.9%
Home Based Services (HBS) 15 $2,165.33 $1,927.13 $3,080 2.3%
Enhanced Monitoring Program (EMP) 12 $3,085.47 $2,962.44 $777 0.6%
Comprehensive Medication Review (CMR) 16 $5,155.69 $3,916.70 $9,075 6.8%
Community Based Programs (CBP) 8 $2,587.41 $2,686.09 $2,477 1.9%
Pharmacy Coordination Program (RxP) 6 $4,048.99 $3,979.07 $3,177 2.4%
Expert Consult Program (ECP) 7 $2,468.25 $1,401.70 $1,467 1.1%
Centers of Distinction Program (CDP) 27 $407.34 $268.96 $679 0.5%
Total 123 $25,799.76 $53,851.20 $132,945 100.0%
TCCI
Program
Debits for
Coordination ServicesMembers
Pre Active
Care Costs
PMPM
Post Active
Care Costs
PMPM
VII - 65
Copyright © 2016
All rights reserved

VII. Key Referral Patterns
Primary care services rendered directly by PCPs account for approximately 6 percent of all health care spending for
CareFirst Members. The balance results from services and decisions by specialists, hospitals and other ancillary providers.
The PCP, however, often starts the process by making a referral to a specialist. The cumulative impact of these "when to refer"
and "where to refer" decisions by PCPs greatly influences both cost and quality. Often PCPs lack valuable cost information to
make informed decisions when referring to specialty providers.
Before the advent of the PCMH Program, PCPs had no economic interest in the downstream cost implications of their referral
decisions. In the PCMH Program, they do. Information in this section is intended to help PCPs in making referral choices by
providing cost information regarding referrals to specialists. Costs are shown by episode inclusive of the cost of all services
encompassed in each episode, not just provider fees.
Specialists are reviewed by CareFirst on an episode basis and given an overall cost rating in one of three categories: Low,
Mid or High. This rating is calculated for procedure based specialties (typically surgeons, orthopedists, neurologists, etc.)
using a complex algorithm that calculates the cost of each episode surrounding a particular procedure or cluster of
procedures. These are called Procedure Episode Groups (PEGs). They are inclusive of all relevant costs in the episode, not
just specialists' fee levels. For medical episodes, a similar process is followed using Medical Episode Groups (MEGs). These
two methodologies are explained fully in Appendix I of the PCMH Program Guidelines. In general:
• A "Low" rating is given to those specialists whose actual total episode costs are significantly lower than the
average costs for the same episodes performed by the same category of specialists in the entire CareFirst Network.
• A "Mid" rating is given to those specialists whose actual total episode costs do not differ significantly from the
average costs for the same episodes performed by the same category of specialists in the entire CareFirst Network.
• A "High" rating is given to those specialists with actual total episode costs significantly higher than the average
costs for the same episodes performed by the same category of specialists in the entire CareFirst Network.
As noted, all costs are included in determining these rankings. In other words, the costs of the services that make up an episode
- the specialist's fees, the hospital's costs where the specialist admits, and all the other components of cost that are integral to
an episode are taken into consideration.
In addition to the Low/Mid/High ratings of specialists, ratings are also available at the episode, specialty provider group, and
hospital level.
It must be stressed, that the picture that emerges from the data on cost per episode does not reflect on the quality or outcome of
services. Indeed, CareFirst and other payers have found that correlations between cost and quality are weak. That is, high cost
episodes do not equate to "high quality" and low cost episodes do not equate to "low quality." It is up to the PCP to make
judgments about quality. The data in this section is intended only to inform PCPs in the Panel about the cost implications of
their referral decisions.
Further, it should be noted that the costs in any and all episodes vary greatly across a broad range, with variation within any
episode from high to low cost of 100 to 200 percent (and occasionally higher).
See Appendix J for more information on the methodology supporting these ratings.
VII - 66
Copyright © 2016
All rights reserved

VII. Key Referral Patterns
A. Profile of Medical Specialist Referrals
B. Profile of Medical Specialist Referrals by Provider
Click on any underlined field below to see additional information.
Specialty: Dermatology
Solo or Group Practice: Group
Cost Ranking: High
This drill down shows the specialist names, cost ranking, the specialists group, and the number of episodes managed in the trailing 12 months as of July, 2015.
This chart shows Members with medical episodes involving specialists by Provider over the trailing 12 months as of July, 2015. Episodes are grouped into 3 types: those with an unplanned
admission through the ER; those with one or more admissions not through the ER; and those referrals not resulting in an admission. A Member with different episode types will be included in
multiple rows but will only be counted once in the grand total of distinct Members. The count of referrals to specialists (one per episode) is grouped into Low, Mid, and High cost categories. Some
specialists are not ranked by CareFirst due to insufficient data at the time of ranking, which includes newer providers or providers changing identifiers. See Appendix J for more on this
methodology.
C. Profile of Medical Specialist Referrals by SpecialtyThis chart shows Members with medical episodes involving specialists over the trailing 12 months as of July, 2015, grouped by provider specialty. A selection box allows the chart to be filtered for
4 episode types: those with an unplanned admission through the ER; those with one or more admissions not through the ER; those without an admission, and all episode types. The count of
referrals to specialists (one per episode) is grouped into Low, Mid, and High cost categories. Expected debit $ per episode is determined by looking at the case-mix of the Panel's episodes in
comparison to average costs for like episodes for all CareFirst episodes involving specialists. Some specialists are not ranked by CareFirst due to insufficient data at the time of ranking, which
includes newer providers or providers changing identifiers. See Appendix J for more on this methodology.
C. Detail for Profile of Medical Specialist Referrals by Specialty
This chart shows Members with medical episodes involving specialists over the trailing 12 months as of July, 2015. Episodes are grouped into 3 types: those with an unplanned admission through
the ER; those with one or more admissions not through the ER; and those referrals not resulting in an admission. A Member with different episode types will be included in multiple rows but will
only be counted once in the grand total of distinct Members. The count of referrals to specialists (one per episode) is grouped into Low, Mid, and High cost categories. Some specialists are not
ranked by CareFirst due to insufficient data at the time of ranking, which includes newer providers or providers changing identifiers. See Appendix J for more on this methodology.
Episode Type: All Episode Types
With an Unplanned Admission
With a Planned Admission
Without an Admission
Specialist Referrals
#
Total
#
Low
#
Mid
#
High
# Not
Ranked
%
Low
%
Mid
%
High
% Not
Ranked
% Cost
Efficient
William White 345 567 1.3% $158,625 $1,525 858 27 58 88 52 32.0% 30.0% 20.0% 23.0% 78.0%
Hatem Agate 456 222 1.7% $552,866 $3,582 222 25 42 64 28 30.4% 28.5% 18.9% 22.1% 75.7%
Mohamad Aquamarine 285 428 1.7% $445,225 $2,582 286 88 64 58 68 30.4% 28.5% 18.9% 22.1% 72.4%
Shastine Aqua 153 179 4.2% $232,305 $1,298 179 39 30 33 77 21.8% 16.8% 18.4% 43.0% 67.6%
John Blue 216 229 3.2% $630,465 $2,753 187 18 61 51 57 9.6% 32.6% 27.3% 30.5% 60.8%
Total 2,041 2,844 100.0% $3,437,180 $1,209 2,844 645 1,382 371 446 22.7% 48.6% 13.0% 15.7% 84.5%
ProviderDistinct
MembersEpisodes
% of
Episodes
Gross
Debit $
Debit $ per
Episode
Specialist Referrals
#
Total
#
Low
#
Mid
#
High
# Not
Ranked
%
Low
%
Mid
%
High
% Not
Ranked
% Cost
Efficient
With an Unplanned Admission 26 26 0.9% $289,425 $11,132 26 1 7 5 13 3.8% 26.9% 19.2% 50.0% 61.5%
With a Planned Admission 49 51 1.8% $685,246 $13,436 51 5 18 9 19 9.8% 35.3% 17.6% 37.3% 71.9%
Without an Admission 1,998 2,767 97.3% $2,462,508 $890 2,767 639 1,357 357 414 23.1% 49.0% 12.9% 15.0% 84.8%
Total 2,073 2,844 100.0% $3,437,180 $1,209 2,844 645 1,382 371 446 22.7% 48.6% 13.0% 15.7% 84.5%
% of Total Panel 44.3% 52.2%
Gross
Debit $
Debit $ per
EpisodeEpisode Type
Distinct
MembersEpisodes
% of
Episodes
Solo Specialists Group Specialists
#
Total
#
Low
#
Mid
#
High
# Not
Ranked
#
Total
#
Low
#
Mid
#
High
# Not
Ranked
Dermatology 322 389 $205,385 $132 $141 198 57 7 40 8 2 130 14 70 43 3
Ob-Gynecology 400 476 $372,931 $360 $389 277 20 7 10 2 1 120 26 69 21 4
Ophthalmology 389 455 $201,754 $209 $226 352 82 9 45 19 9 147 43 82 14 8
Gastroenterology 300 489 $360,139 $440 $466 162 13 7 4 2 0 130 41 43 36 10
Cardiovascular Disease 344 541 $159,005 $181 $193 163 75 20 34 18 3 85 12 33 25 15
Psychiatry 167 205 $74,254 $362 $363 94 1 0 0 0 1 31 2 7 1 21
Other 96 113 $41,368 $366 $378 69 5 0 2 0 3 64 4 26 9 25
Total 2,041 2,844 $3,437,180 $1,209 $582 1,182 1,000 52 86 29 24 1,000 202 482 172 144
Expected
Debit $
per
Episode
SpecialistsSpecialty Members EpisodesGross
Debit $
Actual
Debit $
per
Episode
# SpecialistCost
RankingGroup
# of
Episodes
1 Shastine Aqua HIGH Provider Associates 12
2 John Blue HIGH Endocrinology Assoc of VA 11
3 James Yellow HIGH Provider Associates 9
4 Mohamad Aquamarine HIGH NA 6
43 Pavanjit S Lavender HIGH Lavender and White 5
VII - 67
Copyright © 2016
All rights reserved

VII. Key Referral Patterns
Click on any underlined field below to see additional information.
Specialty: Dermatology
Solo or Group Practice: Group
Cost Ranking: High
F. Profile of Procedural Specialist Referrals by SpecialtyThis chart shows Members with procedural episodes involving specialists over the trailing 12 months as of July, 2015, grouped by provider specialty. A selection box allows the chart to
be filtered for 4 episode types: those with an unplanned admission through the ER; those with one or more admissions not through the ER; those without an admission, and all episode
types. The count of referrals to specialists (one per episode) is grouped into Low, Mid, and High cost categories. Expected debit $ per episode is determined by looking at the case-mix of
the Panel's episodes in comparison to average costs for like episodes for all CareFirst episodes involving specialists. Some specialists are not ranked by CareFirst due to insufficient
data at the time of ranking, which includes newer providers or providers changing identifiers. See Appendix J for more on this methodology.
E. Profile of Procedural Specialist Referrals by ProviderThis chart shows Members with procedural episodes involving specialists over the trailing 12 months as of July, 2015. Episodes are grouped into 3 types: those with an unplanned
admission through the ER; those with one or more admissions not through the ER; and those referrals not resulting in an admission. A Member with different episode types will be
included in multiple rows but will only be counted once in the grand total of distinct Members. The count of referrals to specialists (one per episode) is grouped into Low, Mid, and High
cost categories. Some specialists are not ranked by CareFirst due to insufficient data at the time of ranking, which includes newer providers or providers changing identifiers. See
Appendix J for more on this methodology.
F. Detail for Profile of Procedural Specialist Referrals by Specialty
This drill down shows the specialist names, cost ranking, the specialists group, and the number of episodes managed in the trailing 12 months as of July, 2015.
D. Profile of Procedural Specialist ReferralsThis chart shows Members with procedural episodes involving specialists over the trailing 12 months as of July, 2015. Episodes are grouped into 3 types: those with an unplanned
admission through the ER; those with one or more admissions not through the ER; and those referrals not resulting in an admission. A Member with different episode types will be
included in multiple rows but will only be counted once in the grand total of distinct Members. The count of referrals to specialists (one per episode) is grouped into Low, Mid, and High
cost categories. Some specialists are not ranked by CareFirst due to insufficient data at the time of ranking, which includes newer providers or providers changing identifiers. See
Appendix J for more on this methodology.
Episode Type: All Episode Types
With an Unplanned Admission
With a Planned Admission
Without an Admission
Specialist Referrals
#
Total
#
Low
#
Mid
#
High
# Not
Ranked
%
Low
%
Mid
%
High
% Not
Ranked
% Cost
Efficient
With an Unplanned Admission 153 179 1.3% $232,305 $1,298 179 39 30 33 77 21.8% 16.8% 18.4% 43.0% 67.6%
With a Planned Admission 216 229 1.7% $630,465 $2,753 187 18 61 51 57 9.6% 32.6% 27.3% 30.5% 60.8%
Without an Admission 4,398 12,935 96.9% $5,666,587 $438 4,053 1,231 1,157 768 897 30.4% 28.5% 18.9% 22.1% 75.7%
Total 4,767 13,343 100.0% $6,529,357 $489 4,419 1,288 1,248 852 1,031 29.1% 28.2% 19.3% 23.3% 74.9%
% of Total Panel 60.2% 26.7%
Debit $
per
Episode
Episode TypeDistinct
MembersEpisodes
% of
Episodes
Gross
Debit $
Specialist Referrals
#
Total
#
Low
#
Mid
#
High
# Not
Ranked
%
Low
%
Mid
%
High
% Not
Ranked
% Cost
Efficient
William White 26 33 23.4% $87,519 $2,652 33 4 16 9 4 12.1% 48.5% 27.3% 12.1% 69.0%
Hatem Agate 22 23 16.2% $104,742 $4,554 23 7 11 1 4 30.4% 47.8% 4.3% 17.4% 94.7%
Mohamad Aquamarine 12 14 9.9% $54,500 $3,893 14 1 9 2 2 7.1% 64.3% 14.3% 14.3% 83.3%
John Blue 2 2 1.4% $9,756 $4,876 2 0 2 0 0 0.0% 100.0% 0.0% 0.0% 100.0%
Total 130 13,343 100.0% $6,529,357 $489 141 29 73 15 24 20.6% 51.8% 10.6% 17.0% 87.2%
Debit $
per
Episode
ProviderDistinct
MembersEpisodes
% of
Episodes
Gross
Debit $
Solo Specialists Group Specialists
#
Total
#
Low
#
Mid
#
High
# Not
Ranked
#
Total
#
Low
#
Mid
#
High
# Not
Ranked
Dermatology 40 40 $66,258 $1,656 $1,152 25 2 1 0 0 1 23 3 16 2 2
Ob-Gynecology 13 13 $51,483 $3,960 $2,828 13 2 0 1 1 0 2 1 0 1 0
Ophthalmology 12 20 $50,722 $2,536 $2,525 13 2 1 1 0 0 9 1 6 1 1
Gastroenterology 11 11 $55,970 $5,088 $9,575 10 0 0 0 0 0 22 1 0 9 12
Cardiovascular Disease 1 1 $10,077 $10,277 $8,478 1 0 0 0 0 0 1 0 0 0 1
Psychiatry 2 3 $45,255 $2,515 $2,214 14 1 0 0 0 1 14 2 7 1 4
Other 13 13 $51,483 $3,960 $2,828 13 3 0 2 1 0 2 1 0 1 0
Total 130 13,343 $6,529,357 $3,312 $3,566 115 12 5 5 1 1 100 16 57 10 20
SpecialistsSpecialty Members EpisodesGross
Debit $
Actual
Debit $
per Episode
Expected
Debit $
per Episode
# SpecialistCost
RankingGroup
# of
Episodes
1 Shastine Aqua HIGH Provider Associates 71
2 John Blue HIGH Endocrinology Assoc of VA 28
VII - 68
Copyright © 2016
All rights reserved

VIII. Overall Quality Score
A central objective of the PCMH program is improvement in the quality of services rendered to PCMH participants as measured
by outcomes achieved for the whole population of the Panel. In effect, the better the quality of care for a Panel's whole Member
population - with particular focus and attention on those whose needs and health risks are the highest - the greater the likelihood
that gaps in care, missed red flags, and fragmentary discontinuity of services may be overcome. The results sought are better
outcomes for the Members in the Panel and lower overall cost for their care. This is precisely what the PCMH Outcome Incentive
Award is designed to reward.
The overall Quality Score measures how the Panel is doing on various measures of quality. This score is a critical component of
each Panel's Outcome Incentive Award.
For the most part, the quality measures used in the PCMH program are derived from well recognized Standards Organizations
such as: the Agency for Healthcare Research and Quality (AHRQ), the National Committee for Quality Assurance (NCQA), and
the National Quality Forum (NQF), since these are widely seen as credible. This is described fully in Part III of the Program
Guidelines.
The quality score is based on a 100 point scale and is reported each quarter and then averaged for the entire year to produce a
cumulative score. The PCMH program measures quality in 5 components, each of which carries a relative weight as shown in
this chart:
Category Possible Points
• Degree of PCP-Member Engagement 35 points
• Appropriate Use of Services 20 points
• Effectiveness of Care 20 points
• Patient Access 15 points
• Structural Capabilities 10 points
The single most important category is the degree of PCP-LCC-Member Engagement. This category measures the extent to which
Panel PCPs engage in the development and maintenance of care plans, carry out the purposes of the PCMH Program, use data
for decision making that is contained in SearchLight reports, adhere to the administrative requirements of the PCMH Program,
and receive responses from Members that indicate they believe their PCMH care plan experience is effectively contributing to
their care and improved well-being. A minimum of half the possible points in this category (i.e., 20 points out of 35 possible
points) is needed to qualify for an Outcome Incentive Award.
The data used in the other four categories in the quality assessment program are largely derived from claims data in accordance
with the standards/methodologies established by the standards organizations referenced above. The higher the overall quality
score of a Panel, the higher the Outcome Incentive Award (assuming the Panel has produced savings during the performance
year).
For Performance Year #1 (2011), the Degree of Engagement was not counted since the Program was just getting underway and
the volume of care plans undertaken was too small to determine a reliable score for this category. So, the quality score earned by
a Panel was based on points attained in all other categories and the calculation was based on 70 possible points.
For Performance Year #2 (2012) and #3 (2013), Panels with an average of more than one chronic care plan activated per PCP
in the Panel during the Performance Year received an Engagement Score on a 100 point scale, while those with less than this
number of care plans were rated using the same approach as in 2011
In 2014, all Panels will be rated as a 100 point scale and are required to average at least two Care Plans per PCP in the Panel
with at least 60 percent or more PCPs in the Panel contributing to this average in order to qualify for a score in the Engagement
Category.
VII - 69
Copyright © 2016
All rights reserved

VIII. Overall Quality Score
Quality Score MeasuresPossible
Points
Panel
Rate
Panel
Points
Panel
Type Peers
(169)
Provider
Type Peers
(173)
PCMH
All
(281)
PCP and NP Engagement with the PCMH Program 7.50 80.9% 6.14 2.88 3.00 2.94
PCP or NP Engagement with Care Plans 7.50 76.0% 5.78 5.66 5.43 5.46
Member Satisfaction Survey 7.50 0.0% 7.50 5.51 6.10 5.30
Program Consultant Assessment 10.00 85.2% 3.51 4.20 4.50 4.00
PCMH Program Representative Assessment 2.50 86.7% 1.92 4.30 4.20 4.20
Preventable Admissions 4.00 100.0% 4.00 3.90 3.99 3.99
Potentially Preventable Readmissions 4.00 25.0% 1.00 3.70 3.80 3.90
Potentially Preventable Emergency Room Use 4.00 96.7% 3.87 3.60 3.80 3.77
Ambulatory Services, Diagnostic Imaging, and Antibiotics 8.00 65.0% 5.20 7.38 7.60 7.22
Chronic Care Effectiveness 10.00 65.7% 6.57 5.50 6.40 5.30
Population Health Effectiveness 10.00 64.0% 6.40 6.10 6.30 6.40
Access Patient Access 15.00 40.0% 8.00 8.30 9.70 10.10
Structure Structural Capabilities 10.00 52.0% 5.20 4.80 6.20 5.70
Overall Panel Composite 100.00 65.1% 65.09 65.83 71.01 68.29
A. Overall Panel Quality Score vs. Provider Peers
Effectiveness
of Care
This chart shows the Panel's quality score for the current Performance Year in comparison to other PCMH Panels in the program. For each high-level measure, the Panel
Rate shows the percentage of goal met. Actual Panel Points are calculated by multiplying the Panel Rate times the Possible Points for each measure. More detailed measure
descriptions and criteria are available by viewing the Quality Scorecard.
Appropriate Use
of Services
PCP
Engagement
VII - 70
Copyright © 2016
All rights reserved

VIII. Overall Quality Score
B. Degree of Panel Engagement
PCP Engagement MeasurePotential
Score
Actual
Score
Panel
Rate
Possible
Points
Panel
Points
Provider
Peer
Average
PCP and NP Engagement with the PCMH Program 81.8% 7.50 6.14 4.50
1.PCP or NP helps create an environment in his/her practice that is conducive to
conducting the PCMH program and instructs his/her staff to this end. 5 4.23 84.6% 1.50 1.27 0.90
2.PCP or NP actively seeks to work with the LCC to identify and schedule Members
appropriate for Care Plans. 5 4.00 80.0% 1.50 1.20 0.90
3.PCP or NP clearly and effectively explains, to Care Plan eligible Members, the benefits
of Care Plans and obtains the Member “Election to Participate.” 5 4.00 80.0% 1.50 1.20 0.90
4.PCP or NP facilitates and guides other PCPs in their practice towards PCMH Program
goals. 5 4.23 84.6% 1.50 1.27 0.90
5.Overall, PCP or NP is an active, willing, constructive partner in achieving PCMH
program goals and facilitating cohesive Panel performance towards these goals. 5 4.00 80.0% 1.50 1.20 0.90
PCP or NP Engagement with the Care Plan Process 77.1% 7.50 5.78 3.00
1.PCP or NP carefully reviews Care Plan documentation and next steps developed by the
LCC to assure correctness and completeness. 5 3.66 73.2% 1.50 1.10 0.60
2.PCP or NP is responsive to requests of LCC when consultation about a Member is
needed. 5 3.76 75.2% 1.50 1.13 0.60
3.PCP or NP takes due care to review the Member's medication list and cooperates with
the LCC and pharmacist to review as necessary. 5 3.76 86.7% 1.50 1.30 0.60
4.
PCP or NP ensures their LCC gained access to needed clinical information to identify
that a Member is appropriate for a Care Plan and collaborates with the LCC to complete
the Care Plan on a timely basis. 5 3.76 75.2% 1.50 1.13 0.60
5.Overall, PCP or NP facilitates, evaluates and works towards a high quality, timely and
accurate Care Plan for the Member. 5 3.76 75.2% 1.50 1.13 0.60
Member Satisfaction Survey 100.0% 7.50 7.50 1.50
1.Do you understand your care coordination plan, including the actions you are supposed
to take? 5 5.00 100.0% 1.50 1.50 1.50
2.Is your care coordination nurse and care coordination team helpful in coordinating your
care coordination plan? 5 5.00 100.0% 1.50 1.50 1.50
3.Does your doctor or nurse practitioner spend enough time with you and explain things
to you? 5 5.00 100.0% 1.50 1.50 1.50
4.After starting your care coordination plan, do you have access to information that you
need to understand and manage your health better? 5 5.00 100.0% 1.50 1.50 1.50
5.Finally, overall, has your health care improved as a result of your care coordination plan
and are you satisfied with the support you have been receiving in the PCMH Program? 5 5.00 100.0% 1.50 1.50 1.50
Program Consultant Assessment 77.9% 10.00 3.51 1.50
1. Presence at PCMH Panel Meeting 5 1.00 81.7% 1.00 0.74 0.30
2. Evidence of logging into PCMH SearchLight Reports using username and password 5 0.70 80.5% 1.00 0.72 0.30
3. Active participation (i.e. Asking questions, providing feedback, etc.) in Panel meeting 5 1.00 77.3% 1.00 0.70 0.30
4. Follow up with Program Consultants between Panel meetings 5 1.00 65.1% 1.00 0.59 0.30
5.Evidence of ongoing use of SearchLight reports and plan to follow up on SearchLight
patterns 5 0.90 85.1% 1.00 0.77 0.30
6. Overall Comprehension of the PCMH Program 5 1.90 38.0% 5.00 1.90 0.40
PCMH Program Representative Assessment 64.0% 2.50 1.92 2.50
1. Participates in current webinars, monthly seminars and training opportunities 5 4.00 80.0% 0.50 0.48 0.50
2. Agrees to scheduled meetings with the Program Representative 5 3.00 60.0% 0.50 0.36 0.50
3.Has active Portal access for all PCPs and NPs in the Panel, including current DPR and
Portal Administrator 5 3.00 60.0% 0.50 0.36 0.50
4.
Demonstrates engagement in the PCMH Program by maintaining current and updated
provider information on file and is in receipt, and knowledgeable of PCMH and
CareFirst emails and publications as evidenced by questions, comments and actions5 2.00 40.0% 0.50 0.24 0.50
5. Files claims and appeals in accordance with PCMH and CareFirst guidelines 5 4.00 80.0% 0.50 0.48 0.50
Average Overall PCP Engagement 82.8% 35.00 24.85 13.00
This chart shows details of the PCP Engagement measures during the Performance Year. Points are assigned for each statement or question by averaging the assessment scores for
each PCP across all Panel PCPs. The score average is then multiplied by the total possible points for that question. The points for each question are summed to arrive at the Panel
total points. The average rate for all provider peers is shown for comparison. More detailed measure descriptions and criteria are available by viewing the Quality Scorecard.
VII - 71
Copyright © 2016
All rights reserved

VIII. Overall Quality Score
C. Degree of PCP Engagement - By Provider within Panel
Admissions/ER Measure: Potentially Preventable Readmissions
Success Rate: 93.5%
This chart shows details of the PCP Engagement measure components by Provider within the Panel. Included is the average rating for those assessments
during the current Performance Year #5 (2015 year to date through July, 2015). Points are not applied at the PCP level but instead are based on total
Panel experience. The average achievement rate for all Panel peers with the same provider type is shown for comparison. A more complete description for
each quality component is available by viewing the Quality Scorecard.
This chart shows details of the potentially preventable hospital admission, readmission, and ER visit measures in the "Appropriate Use of Services" quality
score section. Included are the number of admits or visits applicable to the measure and the number that were considered potentially preventable during the
current Performance Year. Points are based on combined measurement results and cannot be shown for individual measures. The average achievement rate
for all Panel peers of the same provider type is shown for comparison. More detailed measure descriptions and criteria are available by viewing the Quality
Scorecard.
This drill down shows by PCP / NP the number of admits or visits applicable to the measure and the number and percent that were considered potentially
preventable. Points are based on total Panel experience and cannot be shown for individual PCPs. More detailed measure descriptions and criteria are
available iby viewing the Quality Scorecard.
D. Preventable Admissions and ER Visits Summary for Panel
D. PCP Detail of Preventable Admissions and ER Visits Summary for Panel
Sample Drill Through
Admissions/ER MeasureEligible
Encounters
Potentially
Preventable
Encounters
Panel
Rate
Panel
Success
Rate
Peer Panel
Success
Rate
Preventable Admissions (AHRQ) 29,682 0 0.0% 100.0% 100.0%
Potentially Preventable Readmissions 966 63 6.5% 93.5% 95.0%
Potentially Preventable Emergency Room 2,288 112 4.9% 95.1% 95.2%
Combined 32,936 175 0.5% 99.5% 99.6%
#PCP / NP
Name
Engagement
w/ PCMH
Program Rating
(7.5 Points)
Engagement
w/ Care Plans
Rating
(7.5 Points)
Member
Survey
Rating
(7.5 Points)
Program
Consultant
Assessment
Rating
(10 Points)
PCMH Program
Representative
Assessment
(2.5 Points)
Overall
Engagement
Rating
(35 Points)
#
Care
Plans
1 Bonnie Beige 66.6% 52.1% 38.9% 47.8% 79.1% 77.2% 15
2 Fletch Orange 91.2% 89.4% 88.5% 98.5% 88.5% 87.5% 18
9 Michael Mauve 87.2% 78.5% 88.2% 79.3% 73.9% 75.6% 23
10 Fletch Orange 97.6% 67.9% 98.7% 76.2% 71.8% 69.8% 25
#PCP / NP
Name
Eligible
Encounters
Potentially
Preventable
Encounters
Success
Rate
1 Fer Brick-Red 177 12 93.4%
2 Peter Black 184 12 93.6%
3 Theodore Lavender 14 7 50.0%
4 Bonnie Beige 34 2 92.8%
5 Donald Daisy 12 2 94.9%
9 Gary Green 12 1 91.8%
10 Michael Mauve 28 0 100.0%
966 63 93.5%Total
VII - 72
Copyright © 2016
All rights reserved

VIII. Overall Quality Score
Diagnostics, Imaging, and Antibiotics Measure: CT Scans
Panel Rate: 94.6%
This chart shows details of the ambulatory diagnostics, imaging, and antibiotics measures in the "Appropriate Use of Services" quality score section. Included are
the number of eligible Members and those who met goal during the Performance Year. Points are based on combined measurement results and cannot be shown
for individual measures. The average achievement rate for all Panel peers of the same provider type is shown for comparison. More detailed measure descriptions
and criteria are available by viewing the Quality Scorecard.
E. Diagnostics, Imaging, and Antibiotics Summary for Panel
E. PCP Detail of Diagnostics, Imaging, and Antibiotics Summary for Panel
This chart shows details by provider for the ambulatory diagnostics, imaging, and antibiotics measures in the "Appropriate Use of Services" quality score section.
Included are the number of eligible Encounters and percent compliant during the current Performance Year. Points are based on total Panel experience and
cannot be shown for individual PCPs. More detailed measure descriptions and criteria are available by viewing the Quality Scorecard.
Sample Drill Through
#PCP
Name
Eligible
Encounters
Met
Goal
Did Not
Meet GoalRate
1 Fer Brick-Red 12 10 2 83.3%
2 Gary Green 9 7 2 77.8%
3 Michael Mauve 2 1 1 50.0%
10 Ray Purple 1 0 1 0.0%
514 486 28 94.6%Total
Diagnostics, Imaging, and
Antibiotics Measure
Eligible
Encounters
Met
Goal
Panel
Rate
Peer Panel
Rate
Colonoscopy 492 492 100.0% 99.6%
CT Scans 514 486 94.6% 94.0%
MRI 858 838 97.7% 98.5%
Low Back Pain 132 86 65.2% 71.4%
Viral Upper Respiratory Infections 0 0 NA 74.3%
Pharyngitis 0 0 NA 82.6%
Total 1,996 1,902 95.3% 95.3%
VII - 73
Copyright © 2016
All rights reserved

VIII. Overall Quality Score
Chronic Care Measure: Diabetes - HbA1c Measure
Panel Rate: 31.4%
This chart shows details of the chronic care measures in the "Effectiveness of Care" quality score section. These scores are based on industry-standard (HEDIS-
PM or NQF) measures that reflect the frequency with which Members diagnosed with the particular condition shown are compliant with various treatments, or
have received the appropriate treatment from the provider. Included are the number of eligible Members and number compliant (meeting goal) for each measured
condition during the Performance Year. Points are based on combined measurement results and cannot be shown for individual measures. The average
achievement rate for all Panel peers of the same provider type is shown for comparison. More detailed measure descriptions and criteria are available by viewing
the Quality Scorecard.
F. PCP Detail of Chronic Care Effectiveness Summary for Panel
This chart shows details by PCP / NP for the chronic care measures in the "Effectiveness of Care" quality score section for each Provider in the Panel. These
scores are based on industry-standard (HEDIS-PM or NQF) measures that reflect the frequency with which Members diagnosed with a particular condition are
compliant with various treatments or have received the appropriate treatment from the provider. Included are the number of eligible Members and percent
compliant (meeting goal) for each measured condition during the current Performance Year. Points are based on total Panel experience and cannot be shown for
individual PCPs. More detailed measure descriptions and criteria are available by viewing the Quality Scorecard.
F. Chronic Care Effectiveness Summary for Panel
Sample Drill Through
Chronic Care MeasureEligible
Members
Met
Goal
Panel
Rate
Peer Panel
Rate
Diabetes - HbA1c 928 291 31.4% 68.6%
Diabetes - Retinal Exam 928 79 8.5% 91.5%
Diabetes - Medical Attention for Nephropathy 928 239 25.8% 74.2%
Asthma 21 18 85.7% 14.3%
ADHD Initiation Phase 11 9 81.8% 27.4%
ADHD Continuation and Maintenance Phase 2 2 100.0% 17.9%
CAD - BETA-Blocker Treatment 3 3 100.0% 22.1%
CAD - BETA-Blocker Therapy w Previous MI 4 4 100.0% 11.0%
Depression - Effective Acute Phase Treatment 24 17 70.8% 29.2%
Depression - Effective Continuation Phase 24 11 45.8% 54.2%
Multiple Antipsychotics in Children and Adolescents 796 250 14.6% 59.0%
Metabolic Monitoring and Antipsychotics 238 29 2.6% 21.0%
Total 3,907 952 24.4% 43.4%
#PCP / NP
Name
Eligible
Members
Met
Goal
Did Not
Meet GoalRate
1 Ronald Brown 200 117 83 58.5%
2 Ace Emerald 64 33 31 51.6%
3 S. Cornflower-Blue 112 102 10 91.1%
10 Ray Purple 4 0 4 0.0%
928 291 637 31.4%Total
VII - 74
Copyright © 2016
All rights reserved

VIII. Overall Quality Score
Population Health Measure: Colon Cancer Screening
Panel Rate: 43.3%
This chart shows details of the chronic care measures in the "Effectiveness of Care" quality score section. These scores are based on industry-standard (HEDIS-
PM or NQF) measures that reflect the frequency with which Members diagnosed with the particular condition shown are compliant with various treatments, or
have received the appropriate treatment from the provider. Included are the number of eligible Members and number compliant (meeting goal) for each measured
condition during the Performance Year. Points are based on combined measurement results and cannot be shown for individual measures. The average
achievement rate for all Panel peers of the same provider type is shown for comparison. More detailed measure descriptions and criteria are available by viewing
the Quality Scorecard.
This chart shows details by provider for the population health measures in the "Effectiveness of Care" quality score section. These scores are based on industry-
standard (HEDIS-PM or NQF) measures that reflect the frequency with which eligible Members receive recommended screening tests. Included are the number of
eligible Members and percent compliant (meeting goal) for each measure during the current Performance Year. Points are based on total Panel experience and
cannot be shown for individual PCPs. More detailed measure descriptions and criteria are available by viewing the Quality Scorecard.
G. Population Health Effectiveness Summary for Panel
G. PCP Detail of Population Health Effectiveness Summary for Panel
Sample Drill Through
#PCP
Name
Eligible
Members
Met
Goal
Did Not
Meet GoalRate
1 Shastine Gold 61 8 53 63.4%
2 Theodore Lavender 133 92 41 60.7%
3 Bob Blue 87 54 33 57.9%
4 Robin Red 94 72 22 56.4%
5 Samuel Yellow 126 118 8 54.1%
9 Ray Purple 6 0 6 12.0%
10 Tom Turquoise 48 44 4 10.0%
2,675 1,159 1,516 43.3%Total
Population Health MeasureEligible
Members
Met
Goal
Panel
Rate
Peer Panel
Rate
Colon Cancer Screening 2,675 1,159 43.3% 46.9%
Chlamydia Screening 120 65 54.2% 48.9%
Cervical Cancer Screening 2,292 1,533 66.9% 71.8%
Breast Cancer Screening 2,044 1,483 72.6% 72.6%
Well-Child Exams Ages 0-15mo. 27 1 3.7% 16.0%
Well-Child Exams Ages 3-6yrs. 65 4 6.2% 19.1%
Well-Child Exams Ages 12-21yrs. 152 7 4.6% 6.4%
Annual Dental Exam 3,001 352 11.7% 12.3%
Childhood Immunizations 92 5 5.4% 19.8%
Adolescent Immunizations 152 7 4.6% 11.5%
HPV Vaccination 7,261 3,481 47.9% 45.6%
Total 17,881 8,097 45.3% 30.7%
VII - 75
Copyright © 2016
All rights reserved

IX. Status of Patient Care Account (PCA)
This section of the SearchLight Report shows the status of the Patient Care Account (PCA) for the Panel that is the subject of this
report. This section presents views of 2011, 2012, 2013, and 2014 results (Performance Years #1 - #4). It also shows monthly
updates of the PCA reflecting Panel performance in Performance Year #5 (2015).
The Patient-Centered Medical Home Program Guidelines describe how a PCA is established for each Medical Care Panel in the
Program (see Part III Program Element #4: Establishing Global Expected Care Costs For Each Panel).
A box score is presented showing the Outcome Incentive Award (if any) that the Panel was entitled to for Performance Years #1 -
#4. Accompanying the box score is the step by step methodology used to calculate the award in accordance with the PCMH
Program Guidelines. It should be noted that each lettered step in the methodology that is underscored has additional drill down
data views showing the underlying calculations used.
Also of note, the quality score for the Panel is calculated reflecting the various measures of quality as outlined in the Program
Guidelines (see Part III Program Element #8: Measuring Quality of Care – The Single Most Essential Ingredient). Because 2011
was the first performance year of the Program, one category of performance measurement – the degree of engagement – was not
calculated because of the lack of sufficient data for many Panels. All other measures were included. The remaining 70 possible
points were reset to a 100 point scale in determining degree of quality achievement for this first Performance Year (2011).
In Performance Year #2 and #3, the Engagement category was counted for Panels that have an average of at least one Chronic
Care Coordination (CCC) plan for each PCP/NP in the Panel.
In Performance Year #4 (2014), Panels had to achieve at least 20 out of 35 possible points in the Engagement Category and have
at least two or more Care Plans activated per PCP, on average, within the Panel with at least 60 percent of the PCPs in the
Panel contributing to this average. In 2015, (Performance Year #5), Panels must score at least 22 points on the Quality Score
Card and attain an average of three Care Plans per PCP/NP with at least 80 percent of all PCPs/NPs in the Panel contributing
to these areas.
The explanation for how the annual settlement and calculation of the OIA is made is provided under Part IIII Program Element
#9: Reward for Strong Performance - Calculating Outcome Incentive Awards (OIA) in the Program Guidelines.
The results of each current performance year are updated monthly. Credits appear monthly as each month's enrollment is
updated. However, debits do not appear for any month until there has been three months of claims run out. This protects against
the display of incomplete information that could lead to erroneous judgments and results. Quality of care data is shown monthly
as it occurs. Hence, the PCA is meant to be viewed as a running scorecard of Panel performance. Note that all figures for the
current performance year are subject to change and are not final until the settlement of the Patient Care Account is completed by
June 1 after the end of the Performance Year.
The HealthCheck Summary at the front of this SearchLight Report is meant to give insight into emerging results in the current
Performance Year and show where actionable steps could be taken to improve results during the course of each Performance
Year in order to maximize the potential OIA of the Panel.
VII - 76
Copyright © 2016
All rights reserved

IX. Status of Patient Care Account (PCA)
A. Outcome Incentive Award Performance Year #4 (2014 Year to Date)
Result
$15,689,133
$15,326,311
11.5%
73.40
17.00
3.1 / 75%
100%
>= 3,000
66
3
89
Result
5.3%
65.7
100%
>= 3,000
77
100
3
Yes
2
90
This chart summarizes the key elements of the Panel's Outcome Incentive Award (OIA) during the Performance Year #4 (2014). This Outcome Incentive Award is
calculated in accordance with the PCMH Program Guidelines. Outcome Incentive Awards are subject to a maximum yearly award of 100%. Any Outcome Incentive
Award that is in excess of 100% is limited to 100% and any award below 100% is fully recognized. This is meant to deal with data anomalies or volatility in a Panel's
population that always contains some degree of randomness and volatility. If a Panel "wins" two or more years consecutively, the application of a persistency award
as called for in the Guidelines is applied either to the actual award or to the 100% maximum.
Outcome Incentive Award Metric
2014 Total Credit $
2014 Net Debit $
Savings Percentage
Overall Quality Score
Engagement Score (20 out of 35 needed)
Incidence of Care Plans (2 / PCP, 60% PCPs contributing)
Portion of Performance Year
A. Outcome Incentive Award Performance Year #3 (2013)
Panel Size (Members) Category
Final OIA Percentage Point Award*
OIA Adjustment from Prior Years
Final OIA Percentage Point Fee Increase
This chart summarizes the key elements of the Panel's Outcome Incentive Award (OIA) for Performance Year #3 (2013).
Qualifying Persistency
OIA Percentage Point Award
Consecutive "Win" Years
Panel Size (Members) Category
OIA Percentage Point Award
Maximum Award
Consecutive "Win" Years
Outcome Incentive Award Metric
Savings Percentage
Quality Score
Portion of Performance Year
Report Period: 2014
VII - 77
Copyright © 2016
All rights reserved

IX. Status of Patient Care Account (PCA)
Result
3.9%
68.6
100%
> 3,000
22
100
2
Yes
25
NA
Result
4.2%
30.5
100%
>3,000
17
NA
A. Outcome Incentive Award Performance Year #2 (2012)
A. Outcome Incentive Award Performance Year #1 (2011)
This chart summarizes the key elements of the Panel's Outcome Incentive Award (OIA) during the Performance Year #2 (2012).
Outcome Incentive Award Metric
Savings Percentage
Quality Score
Portion of Performance Year
Panel Size (Members) Category
OIA Percentage Point Award
Maximum Award
Consecutive "Win" Years
Final OIA Percentage Point Fee Increase
Overall Quartile Performance Ranking (3 yrs)
Qualifying Persistency
Overall Quartile Performance Ranking (3 yrs)
OIA Percentage Point Award
This chart summarizes the key elements of the Panel's Outcome Incentive Award (OIA) for performance year #1 (2011).
Outcome Incentive Award Metric
Savings Percentage
Quality Score
Portion of Performance Year
Panel Size (Members) Category
VII - 78
Copyright © 2016
All rights reserved

IX. Status of Patient Care Account (PCA)
B. Outcome Incentive Awards - Summary of Performance Year #4 (2014)
Calculation of Performance Year #4 Credits (2014) Medical Pharmacy PMPM $ Total
a. Base Net Debit $ $37,543,344 $5,560,721 $43,104,065 (a)
b. Base Member Months 128,570 60,938 80,447
c. Base Net PMPM Debit $ (a ÷ b) $292.01 $91.25
d. Base to Current Overall Medical Trend (OMT) 20.8% 20.8%
e. 2014 PMPM Credit $ (c + (c x d)) $352.74 $110.23
f. Base Average Illness Burden Score 1.57 1.31
g. 2014 Average Illness Burden Score 1.81 1.41
h. 2014 Average Illness Burden Adjustment (g ÷ f) 115.3% 107.1%
i. 2014 Illness Burden Adjusted PMPM Credit $ (e x h) $406.67 $118.07 $350.92
j. 2014 Member Months 72,400 48,259 99,872
k. 2014 Total Credit $ (i x j) $29,442,707 $5,697,763 $35,140,470 (k)
Performance Year #4 Debits (2014) PMPM $ Total
l. $34,069,344
m. $806,726
n. $33,262,618 $1,877,852 (n)
o. 72,400
p. $459.43 $459.43
Performance Year #4 Financial Results (2014)
q. $1,877,852 (q)
r. 5.3% (r)
$ Difference (k - n)
% Difference (q ÷ k)
This section shows the steps used in calculating each Panel's Outcome Incentive Award (OIA) including net debits, Member months, and all other data essential to
the calculation. Pharmacy costs are listed separately since the number of Members with pharmacy benefits can vary from year to year. The step by step process
presented below follows the requirements of the PCMH Program Guidelines. Underlined section headers show where further detail is available via a drill down
report.
2014 Net PMPM Debit $ (n ÷ o)
2014 Gross Debit $
2014 Individual Stop Loss $ Reduction
2014 Net Debit $ (l - m)
2014 Member Months
VII - 79
Copyright © 2016
All rights reserved

IX. Status of Patient Care Account (PCA)
B. Outcome Incentive Awards - Summary of Performance Year #3 (2013)
Calculation of Performance Year #3 Credits (2013) Medical Pharmacy PMPM $ Total
a. Base Net Debit $ $37,543,344 $5,560,721 $43,104,065 (a)
b. Base Member Months 128,570 60,938 80,447
c. Base Net PMPM Debit $ (a ÷ b) $292.01 $91.25
d. Base to Current Overall Medical Trend (OMT) 20.8% 20.8%
e. 2013 PMPM Credit $ (c + (c x d)) $352.74 $110.23
f. Base Average Illness Burden Score 1.57 1.31
g. 2013 Average Illness Burden Score 1.81 1.41
h. 2013 Average Illness Burden Adjustment (g ÷ f) 115.3% 107.1%
i. 2013 Illness Burden Adjusted PMPM Credit $ (e x h) $406.67 $118.07 $350.92
j. 2013 Member Months 72,400 48,259 99,872
k. 2013 Total Credit $ (i x j) $29,442,707 $5,697,763 $35,140,470 (k)
Performance Year #3 Debits (2013) PMPM $ Total
l. $34,069,344
m. $806,726
n. $33,262,618 $1,877,852 (n)
o. 72,400
p. $459.43 $459.43
Performance Year #3 Financial Results (2013)
q. $1,877,852 (q)
r. 5.3% (r)
Performance Year #3 Outcome Incentive Award (2013)
s. 5.3%
t. 65.7
u. 100%
v. >= 3,000
w. OIA Percentage Point Award 77
x. Maximum Award 100
y. 3
z. OIA Percentage Point Fee Increase 11
aa. OIA Adjustment from Prior Years 2
ab. Final OIA Percentage Point Fee Increase 90
Panel Size (Members) Category
Consecutive "Win" Years
$ Difference (k - n)
% Difference (q ÷ k)
This chart summarizes the key elements of the Panel's Outcome Incentive Award (OIA) for Performance Year #3 (2013). This Outcome Incentive Award is
calculated in accordance with the PCMH Program Guidelines. Outcome Incentive Awards are subject to a maximum yearly award of 100%. Any Outcome
Incentive Award that is in excess of 100% is limited to 100% and any award below 100% is fully recognized. This is meant to deal with data anomalies or volatility
in a Panel's population that always contains some degree of randomness and volatility. If a Panel "wins" two or more years consecutively, the application of a
persistency award as called for in the Guidelines is applied either to the actual award or to the 100% maximum.
Savings Percentage (from r)
Quality Score
Portion of Performance Year
2013 Net PMPM Debit $ (n ÷ o)
This section shows the steps used in calculating each Panel's Outcome Incentive Award (OIA) including net debits, Member months, and all other data essential to
the calculation. Pharmacy costs are listed separately since the number of Members with pharmacy benefits can vary from year to year. The step by step process
presented below follows the requirements of the PCMH Program Guidelines. Underlined section headers show where further detail is available via a drill down
report.
2013 Gross Debit $
2013 Individual Stop Loss $ Reduction
2013 Net Debit $ (l - m)
2013 Member Months
VII - 80
Copyright © 2016
All rights reserved

IX. Status of Patient Care Account (PCA)
C. Outcome Incentive Awards - Detail of Performance Year #4 (2014) - YTD Metrics
Metric Jan-14 Feb-14 Mar-14 Apr-14 May-14 Jun-14
Gross Debit $ $723,215 $805,221 $903,461 $637,856 $757,494 $634,855
ISL $ $36,113 $143,472 $97,447 $44,992 $44,400 $7,319
Net Debit $ $687,103 $661,748 $806,015 $592,864 $713,094 $627,537
Total Credit $ $664,258 $660,533 $673,167 $656,969 $670,575 $676,568
Member Months 2,675 2,654 2,692 2,611 2,654 2,671
Net PMPM Debit $ $25,686.00 $24,934.00 $29,941.00 $22,706.00 $26,869.00 $23,494.00
Average Illness Burden Score 0.85 0.87 0.89 0.84 0.83 0.83
Metric Jul-14 Aug-14 Sep-14 Oct-14 Nov-14 Dec-14 2014
Gross Debit $ $584,742 $651,946 $694,232 $661,365 $763,983 $692,851 $8,511,221
ISL $ $20,175 $11,290 $13,824 $28,925 $41,085 $34,436 $523,478
Net Debit $ $564,567 $640,657 $680,408 $632,440 $722,898 $658,412 $7,987,743
Total Credit $ $680,456 $681,590 $682,561 $684,019 $685,963 $685,316 $8,101,975
Member Months 2,679 2,685 2,686 2,689 2,698 2,700 32,094
Net PMPM Debit $ $21,074.00 $238.61 $253.32 $235.20 $267.94 $243.86 $248.89
Average Illness Burden Score 0.84 0.82 0.81 0.80 0.80 0.82 0.83
C. Outcome Incentive Awards - Detail of Performance Year #3 (2013) Metrics
Metric Jan-13 Feb-13 Mar-13 Apr-13 May-13 Jun-13
Gross Debit $ $3,109,159 $2,803,184 $2,624,685 $2,826,061 $2,933,221 $2,681,279
ISL $ $92,074 $109,534 $31,228 $69,185 $41,617 $6,667
Net Debit $ $3,017,085 $2,693,650 $2,593,457 $2,756,876 $2,891,604 $2,674,612
Total Credit $ $2,995,913 $2,985,674 $2,941,922 $2,886,891 $2,872,887 $2,896,495
Member Months 6,167 6,134 6,023 5,875 5,819 5,864
Net PMPM Debit $ $489.27 $439.14 $430.61 $469.27 $496.93 $456.14
Average Illness Burden Score 1.86 1.86 1.85 1.85 1.84 1.82
Metric Jul-13 Aug-13 Sep-13 Oct-13 Nov-13 Dec-13 2013
Gross Debit $ $2,714,156 $2,827,679 $2,769,726 $3,041,836 $2,917,319 $2,821,039 $35,205,058
ISL $ $95,382 $67,867 $138,948 $61,436 $48,865 $43,922 $2,829,000
Net Debit $ $2,618,774 $2,759,812 $2,630,778 $2,980,400 $2,868,454 $2,777,117 $33,262,618
Total Credit $ $2,900,683 $2,889,103 $2,870,757 $3,038,103 $3,016,443 $2,845,601 $35,140,470
Member Months 5,875 5,859 5,824 6,380 6,337 6,245 72,400
Net PMPM Debit $ $445.76 $471.07 $451.72 $467.13 $452.64 $444.69 $459.43
Average Illness Burden Score 1.85 1.85 1.83 1.81 1.82 1.81 1.81
This chart shows selected 2013 metrics from the Outcome Incentive Award Summary by month.
This chart shows selected 2014 metrics from the Outcome Incentive Award Summary by month.
These sections Drill Through from Section B
VII - 81
Copyright © 2016
All rights reserved
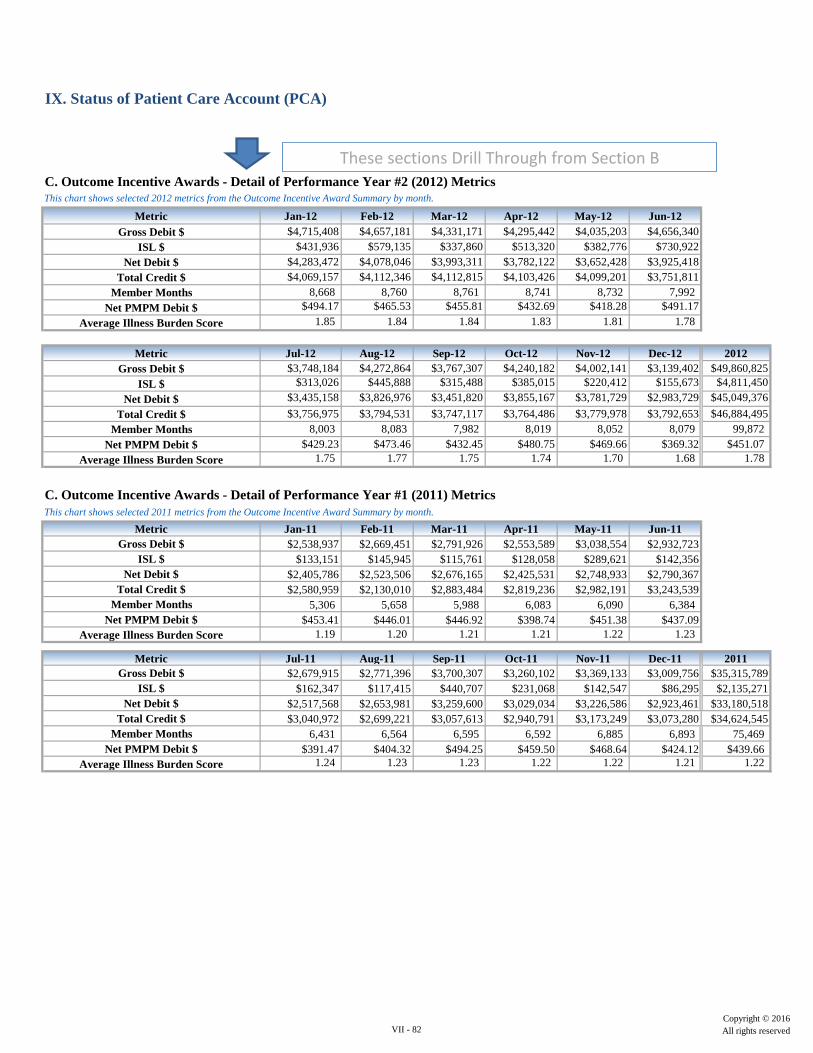
IX. Status of Patient Care Account (PCA)
C. Outcome Incentive Awards - Detail of Performance Year #2 (2012) Metrics
Metric Jan-12 Feb-12 Mar-12 Apr-12 May-12 Jun-12
Gross Debit $ $4,715,408 $4,657,181 $4,331,171 $4,295,442 $4,035,203 $4,656,340
ISL $ $431,936 $579,135 $337,860 $513,320 $382,776 $730,922
Net Debit $ $4,283,472 $4,078,046 $3,993,311 $3,782,122 $3,652,428 $3,925,418
Total Credit $ $4,069,157 $4,112,346 $4,112,815 $4,103,426 $4,099,201 $3,751,811
Member Months 8,668 8,760 8,761 8,741 8,732 7,992
Net PMPM Debit $ $494.17 $465.53 $455.81 $432.69 $418.28 $491.17
Average Illness Burden Score 1.85 1.84 1.84 1.83 1.81 1.78
Metric Jul-12 Aug-12 Sep-12 Oct-12 Nov-12 Dec-12 2012
Gross Debit $ $3,748,184 $4,272,864 $3,767,307 $4,240,182 $4,002,141 $3,139,402 $49,860,825
ISL $ $313,026 $445,888 $315,488 $385,015 $220,412 $155,673 $4,811,450
Net Debit $ $3,435,158 $3,826,976 $3,451,820 $3,855,167 $3,781,729 $2,983,729 $45,049,376
Total Credit $ $3,756,975 $3,794,531 $3,747,117 $3,764,486 $3,779,978 $3,792,653 $46,884,495
Member Months 8,003 8,083 7,982 8,019 8,052 8,079 99,872
Net PMPM Debit $ $429.23 $473.46 $432.45 $480.75 $469.66 $369.32 $451.07
Average Illness Burden Score 1.75 1.77 1.75 1.74 1.70 1.68 1.78
C. Outcome Incentive Awards - Detail of Performance Year #1 (2011) Metrics
Metric Jan-11 Feb-11 Mar-11 Apr-11 May-11 Jun-11
Gross Debit $ $2,538,937 $2,669,451 $2,791,926 $2,553,589 $3,038,554 $2,932,723
ISL $ $133,151 $145,945 $115,761 $128,058 $289,621 $142,356
Net Debit $ $2,405,786 $2,523,506 $2,676,165 $2,425,531 $2,748,933 $2,790,367
Total Credit $ $2,580,959 $2,130,010 $2,883,484 $2,819,236 $2,982,191 $3,243,539
Member Months 5,306 5,658 5,988 6,083 6,090 6,384
Net PMPM Debit $ $453.41 $446.01 $446.92 $398.74 $451.38 $437.09
Average Illness Burden Score 1.19 1.20 1.21 1.21 1.22 1.23
Metric Jul-11 Aug-11 Sep-11 Oct-11 Nov-11 Dec-11 2011
Gross Debit $ $2,679,915 $2,771,396 $3,700,307 $3,260,102 $3,369,133 $3,009,756 $35,315,789
ISL $ $162,347 $117,415 $440,707 $231,068 $142,547 $86,295 $2,135,271
Net Debit $ $2,517,568 $2,653,981 $3,259,600 $3,029,034 $3,226,586 $2,923,461 $33,180,518
Total Credit $ $3,040,972 $2,699,221 $3,057,613 $2,940,791 $3,173,249 $3,073,280 $34,624,545
Member Months 6,431 6,564 6,595 6,592 6,885 6,893 75,469
Net PMPM Debit $ $391.47 $404.32 $494.25 $459.50 $468.64 $424.12 $439.66
Average Illness Burden Score 1.24 1.23 1.23 1.22 1.22 1.21 1.22
This chart shows selected 2011 metrics from the Outcome Incentive Award Summary by month.
This chart shows selected 2012 metrics from the Outcome Incentive Award Summary by month.
These sections Drill Through from Section B
VII - 82
Copyright © 2016
All rights reserved

IX. Status of Patient Care Account (PCA)
Metric Jan-10 Feb-10 Mar-10 Apr-10 May-10 Jun-10
Gross Debit $ $3,087,159 $2,416,395 $3,148,925 $2,965,996 $3,145,204 $3,098,908
ISL $ $154,373 $147,091 $227,550 $141,044 $203,427 $113,114
Net Debit $ $2,932,786 $2,269,304 $2,921,375 $2,824,952 $2,941,777 $2,985,794
Member Months 6,854 6,821 6,865 6,850 6,779 6,793
Net PMPM Debit $ $427.89 $332.69 $425.55 $412.40 $433.95 $439.54
Average Illness Burden Score 1.13 1.14 1.15 1.15 1.16 1.15
Metric Jul-10 Aug-10 Sep-10 Oct-10 Nov-10 Dec-10 2010
Gross Debit $ $2,874,305 $2,453,349 $2,675,087 $2,551,005 $2,526,595 $2,403,763 $33,346,692
ISL $ $138,659 $93,850 $26,093 $49,811 $30,018 -$16,500 $1,308,530
Net Debit $ $2,735,646 $2,359,499 $2,648,994 $2,501,194 $2,496,577 $2,420,262 $32,038,161
Member Months 6,721 6,713 6,698 6,617 6,547 6,466 80,724
Net PMPM Debit $ $407.03 $351.48 $395.49 $378.00 $381.33 $374.31 $396.89
Average Illness Burden Score 1.14 1.13 1.13 1.11 1.09 1.09 1.13
Patient Care Account SavingsSavings
Percentage
OIA
Percentage
Point
Potential
Panel Fee $
Potential
Panel Fee $
Increase
Potential
Panel Fee $
Per PCP
Potential
Panel Fee $
Increase
Per PCP
Panel Actual Results - 2014 5.6% 26 $118,789 $0 $10,799 $0
If Savings percentage increased by 1% 6.6% 31 $141,633 $22,844 $12,876 $2,077
If Savings percentage increased by 5% 10.6% 50 $228,440 $86,807 $20,767 $7,892
If Savings percentage increased by 10% 15.6% 73 $333,522 $105,082 $30,320 $9,553
D. Outcome Incentive Awards - Detail of Base Year (2010) Metrics
This chart shows selected 2010 metrics from the Outcome Incentive Award Summary by month.
E. Outcome Incentive Award - Savings Impact Performance Year #4 (2014) This chart illustrates potential panel fee increase incentives at the panel and pcp level when savings percentages are increased by 1%, 5%, and 10%.
Potential Fee $ are illustrative and assume that 6% of the Panel’s Total Net Debit dollars are from claims submitted by the Panel.
These sections Drill Through from Section B
VII - 83
Copyright © 2016
All rights reserved

X. Ranking of Overall Performance
This section compares the Panel's Member population with other PCMH Panels in five different ways:
• Size - Average Members in Panel is the average number of attributed members in the panel for the measurement
period. Member Months is the sum of months each Member has contributed to their respective panels for the
measurement period. This allows the Panel to see how it compares in size with other Panels. The "sweet" spot in
maximizing rewards is shown by a cut off line in the rankings. This is usually attained when average Panel size is 10-15
PCPs and/or 2,500+ Members.
• Debits Per Member Per Month (Debit PMPM $) - cost based on the sum of debits divided by Member months. This
ranking allows a Panel to see how costly their Members are when compared to other PCMH Panels on an unadjusted
basis (for Illness Burden Score).
• Average Illness Burden Score - based on the overall average Illness Burden Score for the Panel's entire Member
population compared to the average Illness Burden Scores for all Panels. These scores are then ranked, allowing a
Panel to see how 'sick' their Members are when compared to other PCMH Panels.
• Total Quality Score - this shows the cumulative point score of each Panel for the trailing 12 months relative to all
other Panel quality scores.
• Medical Efficiency Index (MEI) - adjusts the PMPM Average Debit of the Panel by the overall average Illness Burden
among its Members. To do this the MEI starts with a Panel's costs (Debit PMPM $) and divides this by the Panel's
average Illness Burden Score. The result is expressed on a Per Member Per Month basis. In effect, MEI
reveals/answers the question: for the Illness Burden the Panel was faced with managing, how did its costs look when
compared with other Panels using the same methodology? This is the most instructive of the rankings.
• Overall Quartile Cumulative Performance Ranking (3 yrs) - Shows how Panels compare on overall performance
based on their cost and quality results combined over the trailing 36 months. This ranking will begin in 2015 for
Panels with three full Performance Years of experience.
In addition, an overall assessment of Panel performance is provided in a separate "Measures that Matter " section that graphically
displays key comparisons of utilization and costs metrics for medical and drug claims, admissions, readmissions, emergency room,
and outpatient hospitals (OP Hospital) vs. ambulatory surgery centers (ASCs).
VII - 84
Copyright © 2016
All rights reserved

X. Ranking of Overall Performance
Average Members in Panel 7,538 2,677 2,478 3,172
Cumulative Member Months 90,445 5,171,790 11,771,761 16,176,472
B. Medical Efficiency Index
A. Panel Size Compared to Panel Peers This chart shows the average Panel Membership and cumulative Member months as of July, 2015 compared to PCMH Panel peers.
Measure PanelPanel Type
Peers (169)
Provider Type
Peers (173)
PCMH
All (281)
The Medical Efficiency Index (MEI) shows the ratio of a Panel's costs (Medical PMPM) divided by the Panel's Average Illness Burden Score Per Member
Per Month as of July, 2015.
C. Ranking Summary by Key Measures
This chart shows the Panel how their scores on these indexes rank against their PCMH peer groups as of July, 2015. All rankings are from best to worst.
PanelProvider Type
Peers
PCMH
All
Medical PMPM $558.74 $342.78 $384.66
÷ ÷ ÷
Average Illness Burden Score 1.88 0.97 1.09
Illness Burden Adjusted PMPM $297.20 $353.38 $352.90
Average Members 7,538 4th 75th 108th 4th 1st
Medical PMPM $588.74 144th 250th 387th 4th 4th
Average Illness Burden Score 1.88 137th 244th 381st 2nd 4th
Quality Score 56.7 45th 127th 155th 2nd 2nd
Illness Burden Adjusted PMPM $297.20 55th 108th 120th 2nd 2nd
Provider Type
Peers Rank
(173)
PCMH
All Rank
(281)
PCMH
All Quartile
(281)
Provider Type
Peers (173)
Quartile
Measure Panel
Panel Type
Peers Rank
(169)
VII - 85
Copyright © 2016
All rights reserved

X. Ranking of Overall Performance
D. Quality Score Ranking Summary
MeasurePossible
Points
Actual
Points
Panel Type
Peers (169)
Rank
Provider Type
Peers(173)
Rank
PCMH
All (281)
Rank
PCMH
All (281)
Quartile
Degree of PCP Engagement 30.00 19.90 1st 35th 36th 1st
Appropriate Use of Services 20.00 12.60 137th 156th 167th 4th
Effectiveness of Care 20.00 12.90 50th 132nd 182nd 2nd
Patient Access 20.00 6.00 132nd 140th 200th 4th
Structural Capabilities 10.00 5.30 86th 121st 129th 3rd
Overall Panel Composite 100.00 56.70 45th 127th 154th 2nd
E. Panel Performance Metrics By Year
* Panel was rebased
This chart shows the Panel how their quality scores for each component rank against their PCMH peer groups. All rankings are from best to worst.
The chart shows key cost and quality metrics of the Panel for each Performance year as of July, 2015. The Cumulative Performance Tier combines 3
consecutive years of experience and is based on the IB Adjusted PMPM and Overall Quality Score.
Year # 1
(2011)
Year #2
(2012)
Year #3
(2013)
Year #4
(2014)
Year #5
(2015 YTD)
Enrollment 1,739 1,742 1,632 1,636 1,323
Illness Burden Score (Raw) 2.57 3.01 3.05 3.08 3.04
Illness Burden Score (Normalized) 1.63 1.55 1.73 1.76 1.78
Total Credit $ $3,255,860 $8,065,821 $9,683,095 $9,148,262 $1,747,558
Total Debit $ $3,290,317 $7,146,176 $9,026,769 $9,932,882 $2,090,355
Savings Percentage -1.1% 11.4% -0.7% 8.6% NA
Overall Medical Trend 7.5% 6.5% 5.5% 3.5% 3.5%
Engagement Score NA 23.9/30.0 11.2/30.0 28.5/35.0 19.1/35.0
Overall Quality Score 39.0/70.0 38.8/70.0 51.0/100.0 68.4/100.0 43.2/100.0
Final OIA Percentage Point Award 0 51 38* 62 55
PCP/NP Turnover 0.0% 25.0% 60.1% 0.0% 0.0%
IB Adjusted PMPM (Medical) $406.67 $466.88 $521.11 $432.55 $401.91
Cumulative Performance Tier (3 yrs) NA NA NA High Mid
Metrics
Performance Year Results
VII - 86
Copyright © 2016
All rights reserved

X. Ranking of Overall Performance
F. Year Over Year Measures That Matter - Key Metrics and Comparisons
Provider
Type Peers
Metrics 2012 2013 20143 Year
Weighted
2015
YTD
2015
YTD
2012-
2013
2013-
2014
2014-
2015 YTD
1. Medical Member Months 20,207 20,241 19,662 19,945 5,191 20,037 0.2% -2.7% 2.8%
2. Average Members 1,684 1,687 1,639 1,662 1,298 1,670 0.2% -2.7% -22.9%
3. Average IB Score 1.77 1.71 1.78 1.76 1.77 1.75 -3.3% 0.7% 0.3%#DIV/0!
4. Total PMPM $424.48 $445.96 $505.18 $471.28 $527.14 $458.54 5.1% 19.0% 24.2%
5. Medical PMPM $378.89 $392.98 $450.11 $418.73 $463.17 $407.33 3.7% 18.8% 22.2%
6. IB Risk Adjusted PMPM $214.26 $229.86 $252.83 $238.23 $261.03 $232.32 7.3% 18.0% 21.8%
7. Pharmacy PMPM $45.60 $52.98 $55.07 $52.55 $63.97 $51.22 16.2% 20.8% 15.2%
8. Pharmacy PMPM w Rx Benefit $141.01 $145.57 $137.90 $140.82 $142.58 $141.49 3.2% -2.2% 1.1%#DIV/0!
9. Inpatient Admissions per 1,000 117.6 117.4 109.9 113.7 131.8 114.9 -0.2% -6.6% 12.1%
10. ALOS 7.2 6.2 6.3 6.5 6.7 6.6 -15.1% -12.7% -7.8%
11. Inpatient Days per 1,000 852.2 722.1 695.1 734.6 880.8 756.5 -15.3% -18.4% 3.4%
12. Cost per Admission $14,620 $12,289 $15,035 $14,128 $14,059 $13,982 -15.9% 2.8% -3.8%
13. Admission PMPM $143.26 $120.22 $137.64 $133.54 $154.38 $133.71 -16.1% -3.9% 7.8%#DIV/0!
14. 30 Day Readmission Rate 11.6% 6.6% 10.0% 9.3% 5.3% 9.4% -43.5% -13.9% -54.7%
15. Cost per 30 Day Readmission $11,262 $11,769 $11,969 $11,768 $33,937 $11,667 4.5% 6.3% 201.3%#DIV/0!
16. ER Visits per 1,000 311.8 352.7 349.7 343.0 416.1 338.1 13.1% 12.2% 33.5%
17. Cost per ER Visit $1,126 $947 $990 $1,004 $416 $1,021 -15.9% -12.0% -63.0%
18. ER PMPM $29.24 $27.84 $28.85 $28.63 $35.39 $28.64 -4.8% -1.3% 21.0%#DIV/0!
19. Outpatient Visits per 1,000 1,154.5 1,258.6 1,335.4 1,276.2 1,278.4 1,249.5 9.0% 15.7% 10.7%
20. Cost per Outpatient Visit $837 $922 $1,056 $972 $1,170 $938 10.1% 26.1% 39.8%
21. Outpatient Visits PMPM $80.55 $96.72 $117.51 $103.88 $124.68 $98.26 20.1% 45.9% 54.8%#DIV/0!
22. ASC Visits per 1,000 131.8 145.2 145.9 142.9 120.2 141.0 10.2% 10.6% -8.8%
23. Cost per ASC Visit $1,022 $1,027 $998 $1,011 $928 $1,015 0.5% -2.3% -9.2%
24. ASC Visits PMPM $11.22 $12.43 $12.13 $12.04 $9.29 $11.93 10.7% 8.1% -17.2%#DIV/0!
25. Office Visits per 1,000 7,684.5 7,630.7 7,921.3 7,786.7 7,231.0 7,745.5 -0.7% 3.1% -5.9%
26. Cost per Office Visit $138 $170 $185 $171 $193 $164 23.4% 34.0% 39.7%
27. Office Visits PMPM $88.36 $108.31 $122.02 $111.18 $116.16 $106.23 22.6% 38.1% 31.5%#DIV/0!
28. Other PMPM $26.25 $27.47 $31.95 $29.47 $23.27 $28.56 4.6% 21.7% -11.4%
The chart below illustrates year over year key comparisons of utilization and cost metrics for medical and drug debits, admissions, readmissions, emergency room, outpatient
hospital, Ambulatory Surgical Centers (ASC), and office visits. Figures are then weighted: 2012 at 20%, 2013 at 50%, and 2014 at 50%. Current year Provider Type Peers, and
Panel year over year metrics are shown as well.
Panel Panel % Change
VII - 87
Copyright © 2016
All rights reserved

X. Ranking of Overall Performance
G. Measures That Matter - Key Metrics and Comparisons
The graph below illustrates the distribution of percent savings across all PCMH Panels. The average savings is the average of the percent
savings for all Panels receiving, or not receiving an Outcome Incentive Award (OIA). The Panel's savings are shown in the black bar below.
The graph below illustrates the comparison of average illness burden score for the Panel to the Provider Type Peer group and PCMH as a
whole.
0
0.2
0.4
0.6
0.8
1
1.2
1.4
1.6
1.8
2
Jan-14 Feb-14 Mar-14 Apr-14 May-14 Jun-14 Jul-14 Aug-14 Sep-14 Oct-14 Nov-14 Dec-14
PCMH 1.09 1.09 1.10 1.10 1.10 1.11 1.10 1.10 1.10 1.10 1.10 1.10
Provider Type Peer 1.85 1.88 1.88 1.88 1.90 1.90 1.90 1.89 1.88 1.88 1.90 1.88
Panel 1.47 1.48 1.49 1.49 1.50 1.51 1.50 1.50 1.49 1.49 1.50 1.49
Average Illness Burden Score
0
5
10
15
20
25
< -2
0%
-19
%
-18
%
-17
%
-16
%
-15
%
-14
%
-13
%
-12
%
-11
%
-10
%
-9%
-8%
-7%
-6%
-5%
-4%
-3%
-2%
-1%
0%
1%
2%
3%
4%
5%
6%
7%
8%
9%
10
%
11
%
12
%
13
%
14
%
15
%
16
%
17
%
18
%
19
%
> 2
0%
# o
f P
ane
ls
Percent Savings Distribution Performance Year #4 (2014)
Participating Panels: 252 Panels with OIA: 149 Panels (59%) - Combined Savings 4.2% Panels not receiving OIA: 103 Panels (41%) - Combined Savings -3.9.0%
Participating Panels: 417 Panels with Savings: 347 Panels (83%) - Combined Savings 9.3% Panels without Savings: 70 Panels (17%) - Combined Savings -11.9%
VII - 88
Copyright © 2016
All rights reserved

X. Ranking of Overall Performance
G. Measures That Matter - Key Metrics and Comparisons (Cont'd)The graph below illustrates the comparison of spend per Member per month (PMPM) for the Panel to the Provider Type Peer group and PCMH as a
whole.
The graph below illustrates the comparison of spend per Member per month (PMPM) for the Panel to the Provider Type Peer group and PCMH as
a whole, for Members with CareFirst's pharmacy benefit.
$0
$20
$40
$60
$80
$100
$120
$140
$160
Jan-14 Feb-14 Mar-14 Apr-14 May-14 Jun-14 Jul-14 Aug-14 Sep-14 Oct-14 Nov-14 Dec-14
PCMH $85.23 $85.51 $85.62 $85.73 $85.83 $87.19 $86.03 $86.70 $87.76 $89.04 $89.24 $91.37
Provider Type Peer $138.75 $135.82 $132.82 $131.80 $131.99 $133.29 $132.06 $134.89 $135.55 $138.48 $136.41 $131.01
Panel $111.99 $110.67 $109.22 $108.77 $108.91 $110.24 $109.05 $110.80 $111.66 $113.76 $112.82 $111.19
Pharmacy PMPM
$0
$100
$200
$300
$400
$500
$600
Jan-14 Feb-14 Mar-14 Apr-14 May-14 Jun-14 Jul-14 Aug-14 Sep-14 Oct-14 Nov-14 Dec-14
PCMH $345.68 $345.56 $345.87 $348.10 $349.76 $352.99 $350.35 $352.43 $354.11 $357.05 $356.23 $358.54
Provider Type Peer $520.96 $509.59 $503.72 $512.93 $526.25 $527.92 $523.92 $522.35 $516.58 $527.52 $522.31 $522.12
Panel $433.32 $427.57 $424.80 $430.52 $438.01 $440.46 $437.14 $437.39 $435.34 $442.29 $439.27 $440.33
Overall PMPM
VII - 89
Copyright © 2016
All rights reserved

X. Ranking of Overall Performance
G. Measures That Matter - Key Metrics and Comparisons (Cont'd)
Apr-14
May-14
Jun-14
Jul-14
Aug-14
Sep-14
Oct-14
Nov-14
Dec-14
The graph below illustrates the comparison of Inpatient Admission spend per Member per month (PMPM) for the Panel as paid under the medical benefi to the
Provider Type Peer group and PCMH as a whole.
The graph below illustrates the comparison of annualized inpatient number of admissions per 1000 Members for the Panel to the Provider Type Peer group and PCMH
as a whole.
$0
$20
$40
$60
$80
$100
$120
$140
$160
$180
$200
Jan-14 Feb-14 Mar-14 Apr-14 May-14 Jun-14 Jul-14 Aug-14 Sep-14 Oct-14 Nov-14 Dec-14
PCMH $88.38 $88.18 $88.41 $88.97 $89.72 $90.60 $89.41 $89.97 $90.79 $90.91 $90.23 $90.47
Provider Type Peer $182.80 $182.01 $175.34 $180.64 $189.75 $188.17 $186.83 $186.76 $179.68 $175.25 $173.01 $173.88
Panel $135.59 $135.10 $131.87 $134.80 $139.73 $139.38 $138.12 $138.37 $135.23 $133.08 $131.62 $132.17
Admission Cost PMPM
0
20
40
60
80
100
120
140
Jan-14 Feb-14 Mar-14 Apr-14 May-14 Jun-14 Jul-14 Aug-14 Sep-14 Oct-14 Nov-14 Dec-14
PCMH 62 62 61 61 61 62 61 61 61 60 60 60
Provider Type Peer 108 111 113 113 118 112 110 107 105 100 98 97
Panel 85 87 87 87 90 87 85 84 83 80 79 79
Inpatient Admissions per 1,000
VII - 90
Copyright © 2016
All rights reserved

X. Ranking of Overall Performance
G. Measures That Matter - Key Metrics and Comparisons (Cont'd)The graph below illustrates the comparison of annualized Inpatient number of average length of stay (days) per admission for the Panel to the Provider Type Peer
group and PCMH as a whole.
The graph below illustrates the comparison of annualized Inpatient number of admission days per 1000 Members for the Panel to the Provider Type Peer group
and PCMH as a whole.
0
1
2
3
4
5
6
7
Jan-14 Feb-14 Mar-14 Apr-14 May-14 Jun-14 Jul-14 Aug-14 Sep-14 Oct-14 Nov-14 Dec-14
PCMH 5.0 5.0 5.0 5.0 5.0 5.0 5.0 5.0 5.0 5.0 5.0 5.0
Provider Type Peer 6.0 6.0 5.7 6.0 5.7 6.3 6.3 6.3 6.0 6.3 5.7 5.7
Panel 5.5 5.5 5.3 5.5 5.3 5.7 5.7 5.7 5.5 5.7 5.3 5.3
Average Length of Stay
0
50
100
150
200
250
300
350
400
450
Jan-14 Feb-14 Mar-14 Apr-14 May-14 Jun-14 Jul-14 Aug-14 Sep-14 Oct-14 Nov-14 Dec-14
PCMH 288 286 285 283 285 289 285 284 285 283 280 279
Provider Type Peer 372 375 372 373 383 388 384 384 286 369 358 351
Panel 330 330 329 328 334 338 334 334 286 326 319 315
Inpatient Days per 1,000
VII - 91
Copyright © 2016
All rights reserved

X. Ranking of Overall Performance
G. Measures That Matter - Key Metrics and Comparisons (Cont'd)The graph below illustrates the comparison of 30 day all cause readmission rates for the Panel to the Provider Type Peer group and PCMH as a whole. Readmissions
are defined as any admission occurring within 30 days of a previous discharge.
The graph below illustrates the comparison of annualized emergency room (ER) utilization per 1000 Members for the Panel to the Provider Type Peer group and
PCMH as a whole.
0%
2%
4%
6%
8%
10%
12%
14%
16%
18%
Jan-14 Feb-14 Mar-14 Apr-14 May-14 Jun-14 Jul-14 Aug-14 Sep-14 Oct-14 Nov-14 Dec-14
PCMH 8.6% 8.6% 8.5% 8.4% 8.6% 8.7% 8.7% 8.7% 8.8% 8.7% 8.7% 8.7%
Provider Type Peer 12.4% 13.2% 13.4% 13.9% 15.6% 12.7% 12.7% 12.0% 12.1% 11.8% 10.9% 10.9%
Panel 10.5% 10.9% 10.9% 11.2% 12.1% 10.7% 10.7% 10.4% 10.5% 10.3% 9.8% 9.8%
30 Day Readmission Rates
0
50
100
150
200
250
300
350
400
Jan-14 Feb-14 Mar-14 Apr-14 May-14 Jun-14 Jul-14 Aug-14 Sep-14 Oct-14 Nov-14 Dec-14
PCMH 253 251 251 250 249 248 246 245 244 242 241 239
Provider Type Peer 344 343 344 343 344 334 330 322 325 324 327 320
Panel 298 297 297 296 297 291 288 283 285 283 284 280
ER Visits per 1,000
VII - 92
Copyright © 2016
All rights reserved

X. Ranking of Overall Performance
G. Measures That Matter - Key Metrics and Comparisons (Cont'd)The graph below illustrates the comparison of Ambulatory Surgical Center (ASC) Utilization for procedures that are performed routinely in both ASC and
Outpatient Hospital settings. Panel data as paid under the medical benefit is compared to the Provider Type Peer group and PCMH as a whole.
The graph below illustrates the distribution of quality points among the PCMH Panels. Your Panel score is shown in the black shaded bar.
59%
60%
61%
62%
63%
64%
65%
66%
Jan-14 Feb-14 Mar-14 Apr-14 May-14 Jun-14 Jul-14 Aug-14 Sep-14 Oct-14 Nov-14 Dec-14
PCMH 62.9% 62.8% 61.9% 61.7% 61.5% 63.0% 63.1% 63.5% 62.5% 62.7% 62.6% 62.3%
Provider Type Peer 64.5% 65.0% 62.7% 62.8% 61.9% 63.7% 64.1% 64.4% 64.8% 65.3% 63.6% 63.6%
Panel 63.7% 63.9% 62.3% 62.2% 61.7% 63.4% 63.6% 64.0% 63.7% 64.0% 63.1% 63.0%
Ambulatory Surgical Center Utilization %
0
20
40
60
80
0-5 6-10 11-15 26-30 31-35 36-40 41-45 46-50 51-55 56-60 61-65 66-70 71-75 76-80 81-85 86-90 91-95 96-100
# o
f P
ane
ls
Distribution of Overall Quality Scores Performance Year #4 (2014)
VII - 93
Copyright © 2016
All rights reserved