part iii: westrack database - transportation...
TRANSCRIPT
PART III:WESTRACK DATABASE

431 PART III: WESTRACK DATABASE
435 CHAPTER 1 INTRODUCTION1.1 Background, 4351.2 Objectives, 4351.3 Scope of Data Included in the Database, 4351.4 Scope of This Document, 436
437 CHAPTER 2 KEY FEATURES OF THE WESTRACK DATABASE
438 CHAPTER 3 DATA ELEMENTS3.1 Performance Data, 4383.2 Materials Data, 4383.3 Seasonal Data, 4383.4 Weather Data, 4393.5 Quality Control/Quality Assurance Checks, 439
440 CHAPTER 4 SOFTWARE4.1 Overview, 4404.2 Standard Reports, 4404.3 Custom Reports, 4404.4 Exporting Data, 440
443 CHAPTER 5 HARDWARE REQUIREMENTS
444 CHAPTER 6 CONCLUSIONS AND RECOMMENDATIONS6.1 Conclusions, 4446.2 Recommendations, 444
445 ABBREVIATIONS
446 REFERENCES
447 APPENDIX A WesTrack Database Beta Version Release User’s Guide
CONTENTS

435
CHAPTER 1
INTRODUCTION
WesTrack (1,2,3) was a hot-mix asphalt (HMA) acceler-ated pavement test (APT) facility located in the State ofNevada approximately 100 km (60 mi) southwest of Reno,Nevada. The pavement test facility was designed, constructed,and operated by a team of private companies and universi-ties (WesTrack team) under contract to the Federal High-way Administration (FHWA) and the National CooperativeHighway Research Program (NCHRP) from September 1994through September 2000. The original contract for the researchproject was awarded in September 1994. The test track wasdesigned and constructed during the period between Octo-ber 1994 and October 1995 and was subjected to traffic fromMarch 1996 through February 1999.
Track maintenance activities including surface patching,digging out and replacing patches, and milling and filling withHMA have taken place during the life of the facility. Ten of the26 test sections on the 3-km (1.8-mi) oval track were replacedin June 1997. Approximately 5 million 80-kN (18,000-lb)equivalent single-axle loads (ESALs) were applied to the track.
The project had two primary objectives:
• Continue the development of performance-related spec-ifications (PRS) for HMA pavements by evaluating theimpact on performance of deviations in materials andconstruction properties (asphalt binder content, aggregategradation, aggregate type, and in-place air void content)from design target values.
• Provide an early field verification of the SHRP Super-pave HMA volumetric design method.
A substantial amount of data was collected and analyzedthroughout the project to achieve these two primary objectives.Typically, these data resided with the individual research orga-nizations and were not necessarily contained in a centralizeddatabase. This document provides details regarding the devel-opment of the WesTrack database (also referred to as the data-base) which now houses the majority of the data collectedduring the project and includes a Microsoft® Windows-basedprogram for obtaining reports from the database.
1.1 BACKGROUND
Throughout the WesTrack project, a substantial amount ofdata was collected, summarized, and stored in electronic for-
mat in organized directories and files. More specifically, datawere typically entered into Excel and Quattro Pro spreadsheetfiles, summarized using the features of these spreadsheet pro-grams, and stored in directories delineated by the type of data/information contained in the spreadsheet files. In essence,this formed a database of information, but one that was some-what decentralized, that is, housed in various locations and,thus, required significant knowledge of the format and loca-tion of the information to extract useful information from thedatabase.
Although the data were being stored in an organized man-ner throughout the project, it was also realized that an effortshould be made to (1) organize the data in a consistent for-mat, (2) house the data in a centralized location, and (3) pro-vide a means for extracting the data without having signifi-cant knowledge of the format and location of the data.
With these objectives in mind, it was decided to developa single database to serve as a data warehouse for the WesTrack data as well as a graphical user interface (GUI)(i.e., a Windows program) to allow for easy data extraction(i.e., reporting). Together, these form the WesTrack database.
1.2 OBJECTIVES
The following were the objectives for developing the WesTrack database:
• Gather the data collected during the project in a central-ized location.
• Format the data in a consistent manner.• Perform quality assurance checks on the data.• Develop an easy-to-use data extraction and reporting
tool in the form of a Windows-based program.
1.3 SCOPE OF DATA INCLUDED IN THEDATABASE
It is important to emphasize that, for a number of reasons,not all data collected during the WesTrack project have beenincluded in the database. In general, the types of data that areincluded consist of information pertaining to the performanceof the pavement. For example, pavement distress data, mate-rials properties, weather, and seasonal data are types of data

included in the database. The database does not include infor-mation gathered for privately sponsored research (i.e., pro-prietary data). For example, information regarding dieselengine performance, fuel consumption, and truck tire perfor-mance are not included in the database. There is also a wealthof truck data, vehicle dynamics, operating costs, and so forththat have been collected but have not been included in thedatabase.
1.4 SCOPE OF THIS DOCUMENT
The scope of this document is to provide the reader withinformation regarding the following:
436
• The key features of the WesTrack database.• An overview of the data elements contained in the data-
base.• A brief overview of the software (Windows program).• The basic requirements of computer systems on which
the software and database can be used.• A user’s guide for use of the software.
Chapter 2 of this document describes the key elements of theWesTrack database, Chapter 3 provides details regarding thedata elements, and Chapter 4 contains information regardingthe software that serves as the GUI to the database.
437
CHAPTER 2
KEY FEATURES OF THE WESTRACK DATABASE
The WesTrack database consists of a Windows-based pro-gram and a database. The Windows-based program is a GUIthat serves as a “front-end” to the database (data warehouse)“back-end.” The following paragraphs describe the key fea-tures of the WesTrack database.
The GUI consists of a number of features that allows theuser to extract data from the database in an intuitive manner.The features within the program include forms, menus, com-mand buttons, list boxes, grids, and so forth that are commonto most Windows-based programs. In addition, the program
was designed with ease-of-use as a key requirement. Theobjective was to keep it simple but not to unduly constrainthe user to what could be extracted from the database.
The database consists of a data warehouse for the WesTrackdata. It consists of numerous tables, each of which containnumerous “fields” that categorize the data. Also within eachtable are numerous “records” that represent the actual data.For example, a weather table might contain Date, Time, andAverage Temperature as fields and records indicating theactual average temperature for each date and time recorded.

438
CHAPTER 3
DATA ELEMENTS
The data elements in the database (data warehouse) includethe following:
• Performance data.• Materials data.• Seasonal data.• Weather data.
These are further described in the following paragraphs.
3.1 PERFORMANCE DATA
Throughout, the WesTrack project performance data werecollected at regular intervals and more frequently when cer-tain circumstances warranted. In total, performance data werecollected on 49 occasions during the project. In general, thefollowing data were collected for each section during theseoccasions:
• Severity and extent of fatigue cracking.• Severity and extent of raveling.• Severity and extent of bleeding.• Magnitude of rut depth, both maximum rut depth (peak
to valley) and downward rut depth (baseline to valley).• Magnitude of roughness (smoothness).
All performance data collected have been summarized andincluded within the database.
3.2 MATERIALS DATA
Materials data include information regarding aggregateproperties, binder properties, and mixture properties. Thesedata were collected at various stages throughout the project.Following is a list of the types of materials data collected andstored in the database:
The following aggregate properties are included in thedatabase:
• Stockpile gradations.• Cold feed gradations.• Quality control/quality assurance (QC/QA) gradations.
• Specific gravity and absorption.• Angularity.• Sand equivalent value.• Flat/elongated particles.• Soundness.• Los Angeles abrasion.• Deleterious materials.
The following binder properties are included in the data-base:
• Bending beam rheometry.• Dynamic shear rheometry.• Capillary viscosity.• Rotational viscosity.• Penetration. • Flashpoint.
The following mixture properties are included in thedatabase:
• Repeated simple shear at constant height (RSST-CH) test.• Beam fatigue.• Thermal stress restrained specimen test (TSRST).• Moisture sensitivity of the HMA mixture.• Resilient modulus of the HMA mixture.• Resilient modulus of the base course.• Resilient modulus of the engineered fill.• Wheel tracking Laboratoires des Ponts et Chausées
(LCPC), Hamburg, Asphalt Pavement Analyzer, and Pur-due devices.
• Indirect tensile test.• In-place air voids and thickness.
3.3 SEASONAL DATA
Seasonal data include information regarding the depth ofthe groundwater table and the subgrade soil moisture content.This information was collected at approximately the sameintervals as the performance data.
The groundwater depth was measured using piezometerslocated adjacent to sections 12 and 25. The measurementsobtained from the piezometers were translated (adjusted) to

439
represent the depth of the water table below the centerline ofthe test lane at the test track.
Time-domain reflectometry measurements were obtainedfrom probes located adjacent to sections 12 and 25. These datawere then reduced using the protocol established for and usedwithin the Long-Term Pavement Performance (LTPP) pro-gram to estimate the moisture content within the subgrade soil.
3.4 WEATHER DATA
Weather data was collected on a continuous basis from anon-site weather station throughout the duration of the project.The following data were collected and are included in thedatabase:
• Air temperature.• Humidity.• Wind speed and direction.
• Precipitation.• Solar radiation.• Pavement temperature.
3.5 QUALITY CONTROL/QUALITYASSURANCE CHECKS
Throughout the data gathering and data entry (databasepopulation) process, a substantial effort was afforded to QAchecks of the data. This was accomplished by personneltrained in pavement engineering and knowledgeable of thetypes of data collected, methods of data collection (e.g., dis-tress surveys, mixture tests, and expected values/ranges). QAchecks typically involved checking the data for proper unitsof measure, checking summary data against raw data, inves-tigating apparent anomalies, filling in missing data, and soforth. As a result of this effort, the data contained in the data-base can be considered extremely “clean” and accurate.

440
CHAPTER 4
SOFTWARE
4.1 OVERVIEW
The WesTrack database includes a Windows-based pro-gram that serves as a GUI to obtain reports (extract data) fromthe database in an intuitive manner. A user’s guide for thesoftware is provided in Appendix A of Part III. The programhas been designed to allow data to be extracted (reported)from the database in two ways:
• Standard reports.• Custom reports.
Data obtained through either method is displayed in a tab-ular format that can be printed or saved to disk in variousformats.
4.2 STANDARD REPORTS
Standard reports are a set of pre-defined queries that gener-ate tables of commonly requested data and are intended to pro-vide quick access to the data. An example of a typical standardreport might be “Percent Fatigue Cracking vs. ESALs (percentof left wheelpath).” In addition, a number of reports pertainingto performance data (e.g., fatigue cracking and rut depth) haveassociated charts that can be viewed. It should be noted, how-ever, that standard reports do not provide for all possiblereports that can be obtained from the database. Table 1 liststhe standard reports that have been developed and includedin the WesTrack database.
The user does not require knowledge of Structured QueryLanguage (SQL) to obtain standard reports from the data-base. Standard reports are obtained through a simple selec-tion process using built-in features of the GUI.
4.3 CUSTOM REPORTS
Custom reports allow the user to obtain data through user-defined SELECT queries that generate tables of data. Notethat SELECT queries are used to extract data from a database.Note also that all data in the database are available throughcustom reports whereas only limited data are available throughstandard reports.
Obtaining custom reports from the database requires a lim-ited knowledge of SQL. However, the custom report toolwithin the GUI has been designed to allow very complexqueries for those users who are highly knowledgeable of SQL.
4.4 EXPORTING DATA
Once data have been obtained from the database usingeither the standard report tool or the custom report tool, theycan be exported (saved to disk) in three different ways:
• Text file (*.txt)—this option saves the data as an ASCIItext file.
• Comma separated value (*.csv)—this option saves thedata as an ASCII text file with values separated by com-mas. This is the preferred format to use for data thatwill be imported into a spreadsheet such as Excel orQuattro Pro.
• Web page (*.html)—this option saves the data in webpage format.
The ability to export data in one of the above formats allowsthe data to be imported into other programs such as spread-sheets for further analysis and manipulation.

TABLE 1 Standard reports included in the WesTrack database
Data Category Data Type Standard Report NamePerformance Fatigue Cracking Fatigue Cracking vs. ESALs (Percent of Left Wheelpath)
Fatigue Cracking vs. ESALs (Percent of Right Wheelpath)Rutting Maximum Rut Depth vs. ESALs (Left Wheelpath)
Down Rut Depth vs. ESALs (Right Wheelpath)Maximum Rut Depth vs. ESALs (Right Wheelpath)
Raveling Raveling vs. ESALs (Percent of Left Wheelpath)Raveling vs. ESALs (Percent of Right Wheelpath)
Roughness Left Wheelpath IRI vs. ESALsRight Wheelpath IRI vs. ESALs
Bleeding Bleeding vs. ESALs (Percent of Left Wheelpath)Bleeding vs. ESALs (Percent of Right Wheelpath)
Falling Weight Deflectometer FWD Deflections, Within/Adjacent to Wheelpath (U.S.)FWD Deflections, Within/Adjacent to Wheelpath (S.I.)FWD Deflections, Between Wheelpaths (U.S.)FWD Deflections, Between Wheelpaths (S.I.)
Materials Aggregates Stockpile Gradations (Original Sections)Stockpile Gradations (Reconstructed Sections)Cold Feed Gradations (Reconstructed Sections)QC/QA Gradations (Original Sections)QC/QA Gradations (Reconstructed Sections)Specific Gravities and Absorption (Original Sections)Specific Gravities and Absorption (Reconstructed Sections)Aggregate Angularity (Original Sections)Aggregate Angularity (Reconstructed Sections)Sand Equivalent (Original Sections)Sand Equivalent (Reconstructed Sections)Flat/Elongated Particles (Original Sections)Flat/Elongated Particles (Reconstructed Sections)Soundness (Original Sections)LA Abrasion (Original Sections)Deleterious Materials (Original Sections)Deleterious Materials (Reconstructed Sections)
Binders Bending Beam Rheometry (Original Sections)Bending Beam Rheometry (Reconstructed Sections − FHWA)Bending Beam Rheometry (Reconstructed Sections − UNR)Dynamic Shear Rheometry (Original Sections)Dynamic Shear Rheometry (Reconstructed Sections − FHWA)Dynamic Shear Rheometry (Reconstructed Sections − UNR)Capillary Viscosity (Original Sections)Capillary Viscosity (Reconstructed Sections)Rotational Viscosity (Original Sections)Rotational Viscosity (Reconstructed Sections)Penetration (Original Sections)Penetration (Reconstructed Sections)Flashpoint (Original Sections)Flashpoint (Reconstructed Sections)
Mixtures Repeated Simple Shear at Constant Height (Coarse Mixtures, UCB)Repeated Simple Shear at Constant Height (Fine Mixtures, UCB)Repeated Simple Shear at Constant Height (Fine Plus Mixtures, UCB)Repeated Simple Shear at Constant Height (All Mixtures, UCB)Repeated Simple Shear at Constant Height (FHWA)Beam Fatigue (Coarse Mixtures)Beam Fatigue (Fine Mixtures)Beam Fatigue (Fine Plus Mixtures)TSRST (Field-Mixed/Field-Compacted Samples) Before LoadingTSRST (Field-Mixed/Field-Compacted Samples) After LoadingTSRST (Field-Mixed/Lab-Compacted Samples)TSRST (Lab-Mixed/Lab-Compacted Samples) Short-Term Oven AgedTSRST (Lab-Mixed/Lab-Compacted Samples) Long-Term Oven AgedMoisture Sensitivity of Field-Mixed/Field-Compacted Samples Before Loading (OSU)Moisture Sensitivity of Field-Mixed/Field-Compacted Samples After Loading (OSU)Moisture Sensitivity of Field-Mixed/Lab-Compacted Samples (OSU)Moisture Sensitivity of Lab-Mixed/Lab-Compacted Samples (OSU)Moisture Sensitivity of Field-Mixed/Field-Compacted Samples Before Loading (UNR)Moisture Sensitivity of Field-Mixed/Field-Compacted Samples After Loading (UNR)HMA Resilient Modulus (Original Sections) Following ConstructionHMA Resilient Modulus (Original Sections) Before Loading (approx. 6 months afterconstruction)HMA Resilient Modulus (Original Sections) After 12 Months of LoadingHMA Resilient Modulus (Original Sections) Post MortemHMA Resilient Modulus (Reconstructed Sections) Before LoadingHMA Resilient Modulus (Reconstructed Sections) Post MortemBase Resilient ModulusEngineered Fill Resilient ModulusWheel Tracking (Original Sections)Wheel Tracking (Reconstructed Sections)
(continued on next page)
442
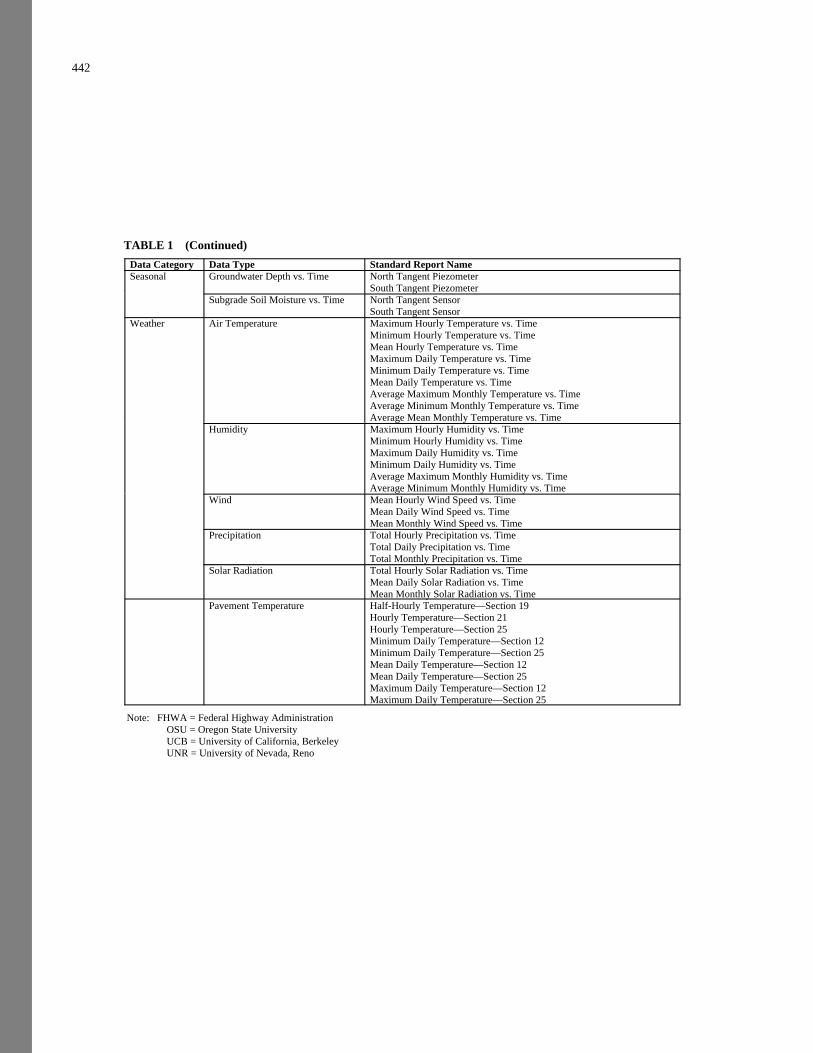
TABLE 1 (Continued)
Data Category Data Type Standard Report NameSeasonal Groundwater Depth vs. Time North Tangent Piezometer
South Tangent PiezometerSubgrade Soil Moisture vs. Time North Tangent Sensor
South Tangent SensorWeather Air Temperature Maximum Hourly Temperature vs. Time
Minimum Hourly Temperature vs. TimeMean Hourly Temperature vs. TimeMaximum Daily Temperature vs. TimeMinimum Daily Temperature vs. TimeMean Daily Temperature vs. TimeAverage Maximum Monthly Temperature vs. TimeAverage Minimum Monthly Temperature vs. TimeAverage Mean Monthly Temperature vs. Time
Humidity Maximum Hourly Humidity vs. TimeMinimum Hourly Humidity vs. TimeMaximum Daily Humidity vs. TimeMinimum Daily Humidity vs. TimeAverage Maximum Monthly Humidity vs. TimeAverage Minimum Monthly Humidity vs. Time
Wind Mean Hourly Wind Speed vs. TimeMean Daily Wind Speed vs. TimeMean Monthly Wind Speed vs. Time
Precipitation Total Hourly Precipitation vs. TimeTotal Daily Precipitation vs. TimeTotal Monthly Precipitation vs. Time
Solar Radiation Total Hourly Solar Radiation vs. TimeMean Daily Solar Radiation vs. TimeMean Monthly Solar Radiation vs. Time
Pavement Temperature Half-Hourly Temperature—Section 19Hourly Temperature—Section 21Hourly Temperature—Section 25Minimum Daily Temperature—Section 12Minimum Daily Temperature—Section 25Mean Daily Temperature—Section 12Mean Daily Temperature—Section 25Maximum Daily Temperature—Section 12Maximum Daily Temperature—Section 25
Note: FHWA = Federal Highway Administration OSU = Oregon State University UCB = University of California, Berkeley UNR = University of Nevada, Reno

443
CHAPTER 5
HARDWARE REQUIREMENTS
The GUI and database were both developed for a system with the following minimum requirements:
• CPU: Pentium or higher.• Operating system: Windows 95/98/NT 4.0.• Disk space: 165 megabytes minimum free space.• Memory: 32 megabytes minimum.• Monitor: VGA with 800 × 600 resolution and 16 colors or more.

444
CHAPTER 6
CONCLUSIONS AND RECOMMENDATIONS
6.1 CONCLUSIONS
A substantial amount of data was collected during theWesTrack project by a variety of organizations. The datapertaining to the performance of the pavement (e.g., dis-tress data, traffic data, weather data, and material properties)have been gathered in a centralized location and housed in adata warehouse (Microsoft Access database). All data housedin the database have been thoroughly checked to ensureaccuracy.
A GUI (Windows-based program) has been developed toprovide tools for extracting data from the database in anintuitive manner (see Appendix A of Part III). Two meth-ods of data extraction (reporting) have been provided: stan-dard reports and custom reports. Standard reports are a setof pre-defined queries that generate tables of commonlyrequested data and are intended to provide quick access to the data. Custom reports allow the user to obtain datathrough user-defined SELECT queries that generate tablesof data. All data extracted using these methods can beprinted or exported (saved to disk) for further analysis andmanipulation.
6.2 RECOMMENDATIONS
As mentioned previously, the WesTrack database containsonly the data that pertains to pavement performance and assuch does not contain all data collected during the WesTrackproject. It is recommended that an effort be undertaken toidentify and evaluate additional data elements not already con-tained in the database for possible inclusion in the WesTrackdatabase. Examples of such data include the following:
• Narratives of the events that occurred during the proj-ect (e.g., brief descriptions of the project, constructionprocess, driverless vehicles, data collection processes,post mortem evaluations, and mixture testing).
• Photo log of various aspects of the project (e.g., con-struction, trucks, rut measurements, and site, etc).
• Any other nonproprietary data not already included (e.g.,vehicle dynamics, and vehicle operating costs).
• Trench data.
Such an effort would, in essence, archive the data in acentralized location and significantly enhance the currentWesTrack database.

445
ABBREVIATIONS
APT Accelerated Pavement TestESAL Equivalent Single-Axle LoadFHWA Federal Highway AdministrationFWD Falling Weight DeflectometerGUI Graphical User InterfaceHMA Hot-Mix AsphaltIRI International Roughness IndexLCPC Laboratories des Ponts et ChauséesLTPP Long-Term Pavement PerformanceNCHRP National Cooperative Highway Research
Program
OSU Oregon State UniversityQA Quality AssuranceQC/QA Quality Control/Quality AssuranceRSST-CH Repeated Simple Shear Test at Constant
HeightSQL Structured Query LanguageTSRST Thermal Stress Restrained Specimen TestUCB University of California, BerkeleyUNR University of Nevada, Reno
446
REFERENCES
1. Epps, J., Monismith, C., Seeds, S., Alavi, S., Ashmore, C.,Leahy, R., and Mitchell, T., “WesTrack Performance—InterimFindings,” Journal of the Association of Asphalt Paving Tech-nologists, Vol. 67, 1998.
2. Epps, J., Monismith, C., Seeds, S., Alavi, S., Ashmore, C., andMitchell, T., “WesTrack Full-Scale Test Track: Interim Find-
ings,” Proc., Eighth International Conference on Asphalt Pave-ments, Vol. III, August 10–14, 1997, Seattle, Wash.
3. “Accelerated Field Test of Performance-Related Specifi-cations for Hot-Mix Asphalt Construction,” Task G InterimReport, Final Draft, prepared by WesTrack team, March1996.

447
APPENDIX A
WESTRACK DATABASE BETA VERSION RELEASE USER’S GUIDE
A.1 INTRODUCTION
This document describes how to install and use the betaversion* release of the WesTrack database and GUI. It isimportant to understand that the GUI is a beta version mean-ing that it has been rigorously tested and is in the final designphase prior to release as Version 1.0. The data contained inthe database have been thoroughly checked as well and canbe considered very clean.
A.2 INSTALLATION
Installation of the database and GUI will require a Win-dows 95/98/NT operating system and about 165 megabytesof free space on the computer’s hard disk. To install the data-base and GUI, perform the following steps:
1. Insert the WesTrack database CD in the CD drive.2. Click on the Windows Start menu and select Run.3. Select Browse . . . and when the Browse dialog box
opens, navigate to the CD drive.4. Double-click on the Setup.exe file (or highlight the file
and click on Open).5. Click on the OK button on the Run form.6. Follow the instructions given in the Setup Wizard.
A.2.1 Important Note
The Setup Wizard may warn you that it is attempting tocopy older versions of certain files and ask you if you want tokeep the newer version. Answer Yes to keep the newer ver-sion in all cases. Also, the wizard may warn you that it can-not copy certain files because they are presently in use. Clickon the Ignore button to ignore these errors. Confirm that youwant to ignore the error by clicking on the Yes button on theform asking you if you are sure.
A.3 USING THE GRAPHICAL USERINTERFACE
A.3.1 Overview
The GUI has been designed to allow data to be extracted(reported) from the database in two ways: (1) standard reportsor (2) custom reports.
Standard reports are a set of pre-defined queries that gen-erate tables and charts of commonly requested data and areintended to provide quick access to the data. An example ofa typical standard report might be “Percent Fatigue Crackingvs. Equivalent Single-Axle Loads (ESALs) (percent of leftwheelpath).” It should be noted, however, that the reportingcapability of the database goes beyond the standard reportsprovided.
Custom reports allow the user to obtain data through user-defined queries that generate tables of data. All data in thedatabase are available through custom reports.
The following paragraphs describe how to use the GUIand how to obtain data from the WesTrack database.
A.3.2 Executing the GUI
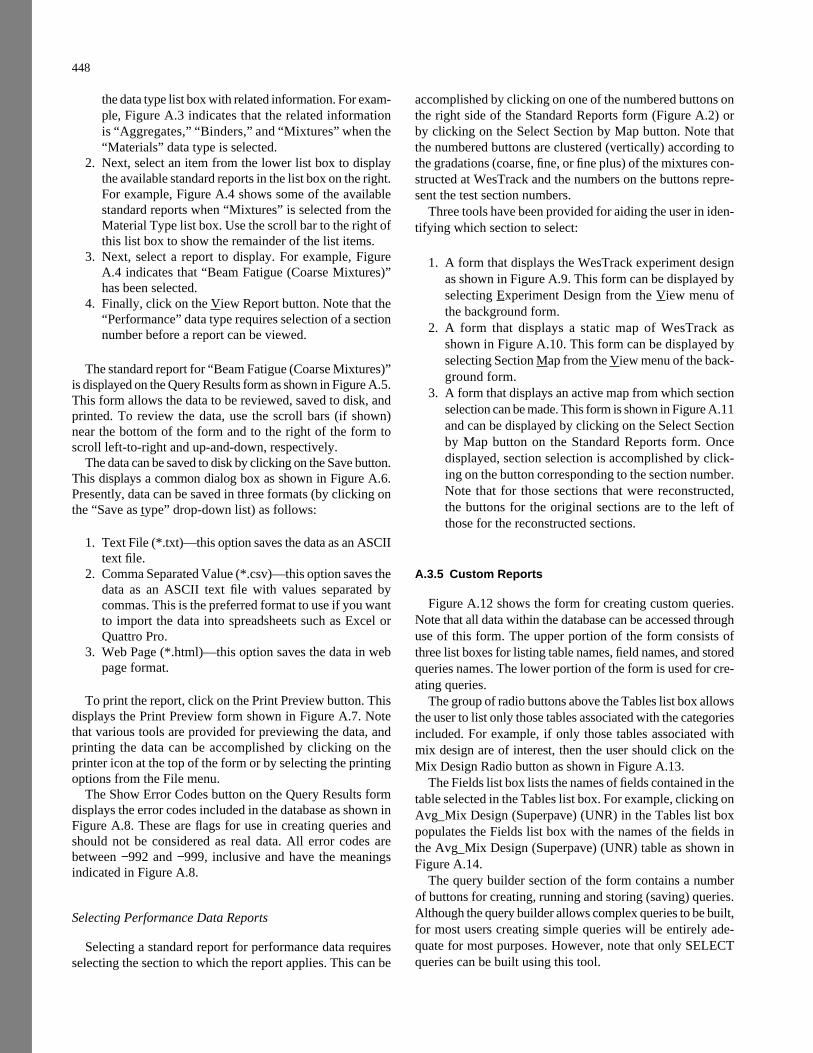
The GUI can be executed (run) by selecting the WindowsStart menu, then selecting the WesTrack database folder, andfinally selecting the WesTrack database icon. Note that theuser can also create a shortcut to reside on the desktop forquicker access to the GUI. On execution of the GUI, the dia-log shown in Figure A.1 will appear. The dialog can be hid-den and not shown again by clicking on the little box (calleda check box) next to the words “Do not show this dialogagain.” Note that you can re-show the dialog by selectingoptions from the file menu.
A.3.3 Choosing a Query Type
The dialog shown in Figure A.1 allows the user to selectwhether to use standard reports or custom reports for dataextraction. To select the query type, click on the little circle(called a radio button) immediately to the left of the querytool to be used. Note that clicking on the words has the sameeffect. Figure A.1 indicates that standard reports has beenselected.
A.3.4 Standard Reports
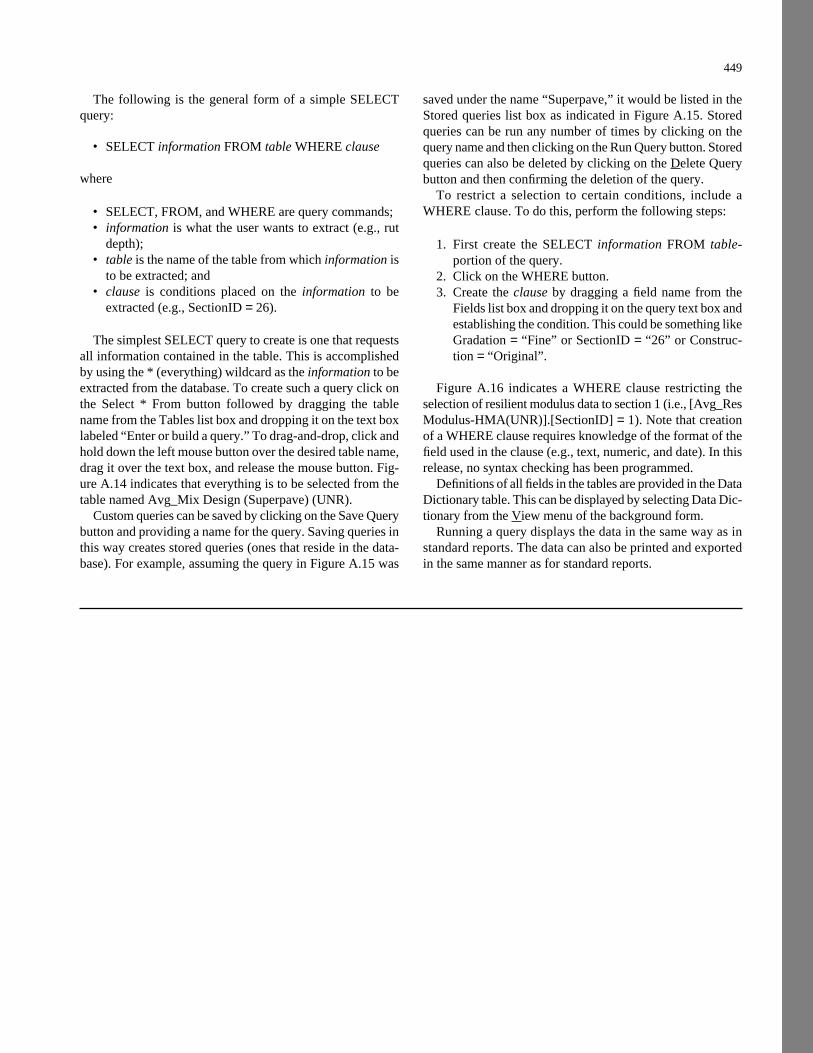
Figure A.2 shows the form for selecting a standard report.To use this form, follow these steps:
1. First select a data type from the list box in the upper leftcorner. This will populate the list box immediately below
* A “beta version” release is one that has been rigorously tested and corrected for all“bugs” encountered during testing.
the data type list box with related information. For exam-ple, Figure A.3 indicates that the related information is “Aggregates,” “Binders,” and “Mixtures” when the“Materials” data type is selected.
2. Next, select an item from the lower list box to displaythe available standard reports in the list box on the right.For example, Figure A.4 shows some of the availablestandard reports when “Mixtures” is selected from theMaterial Type list box. Use the scroll bar to the right ofthis list box to show the remainder of the list items.
3. Next, select a report to display. For example, FigureA.4 indicates that “Beam Fatigue (Coarse Mixtures)”has been selected.
4. Finally, click on the View Report button. Note that the“Performance” data type requires selection of a sectionnumber before a report can be viewed.
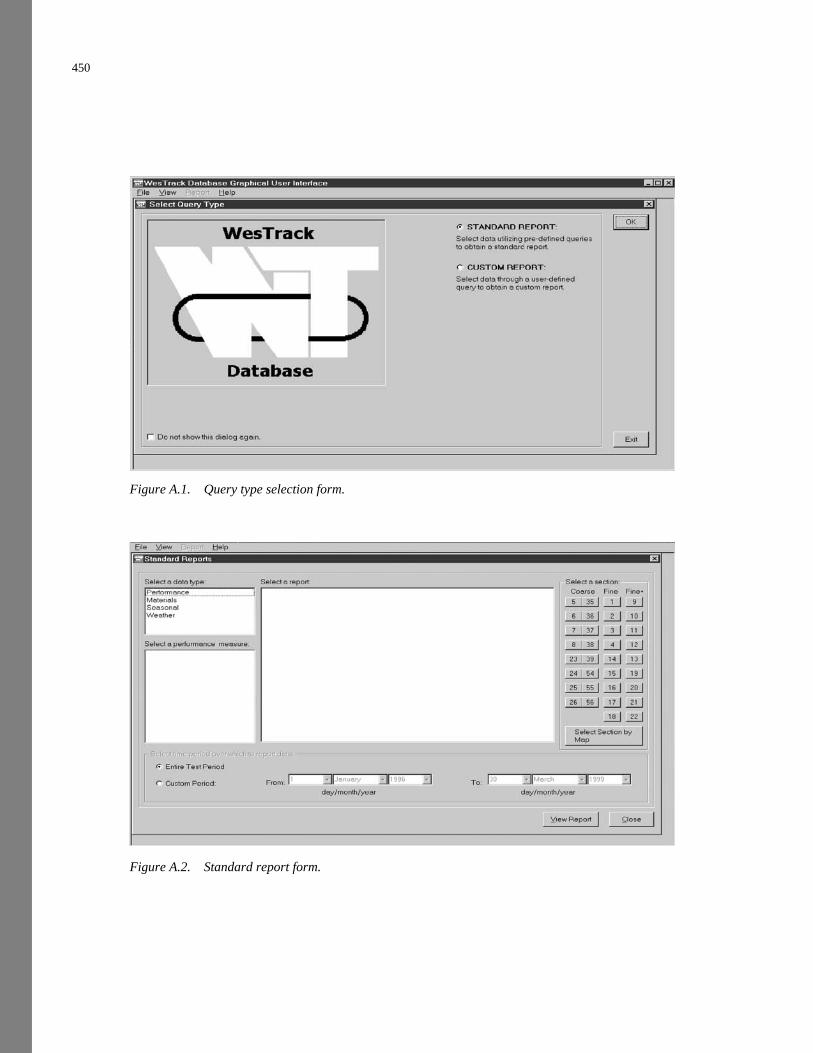
The standard report for “Beam Fatigue (Coarse Mixtures)”is displayed on the Query Results form as shown in Figure A.5.This form allows the data to be reviewed, saved to disk, andprinted. To review the data, use the scroll bars (if shown)near the bottom of the form and to the right of the form toscroll left-to-right and up-and-down, respectively.
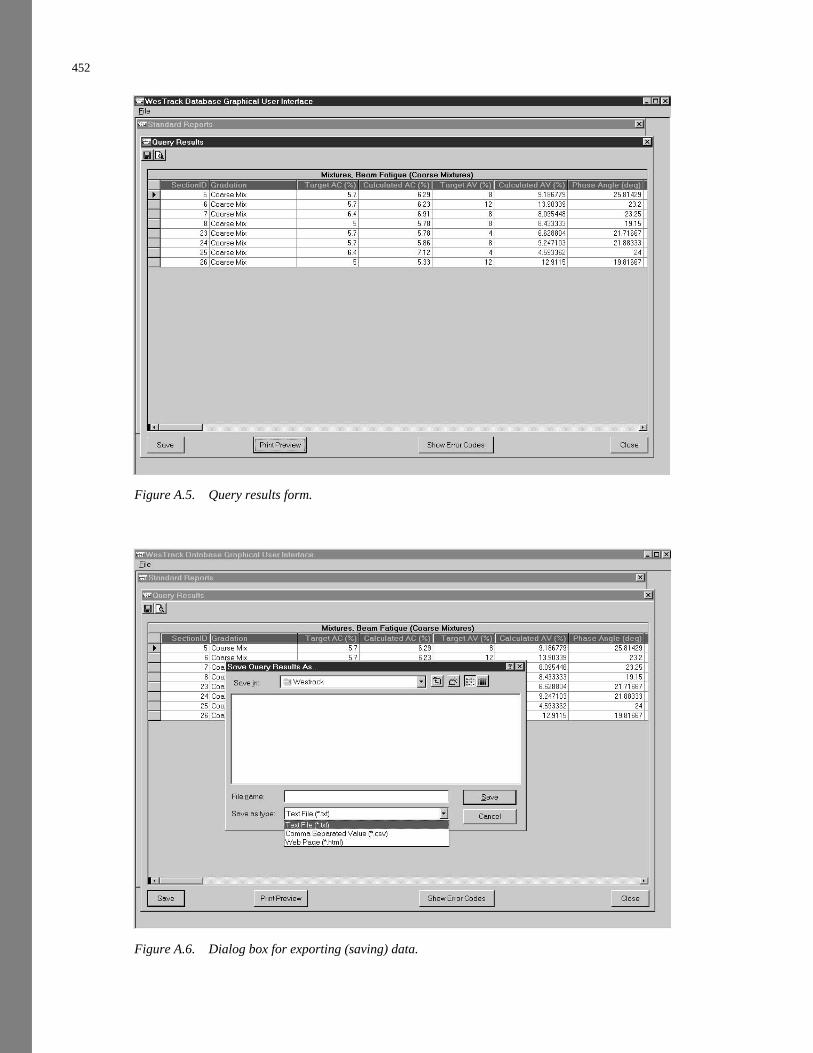
The data can be saved to disk by clicking on the Save button.This displays a common dialog box as shown in Figure A.6.Presently, data can be saved in three formats (by clicking onthe “Save as type” drop-down list) as follows:
1. Text File (*.txt)—this option saves the data as an ASCIItext file.
2. Comma Separated Value (*.csv)—this option saves thedata as an ASCII text file with values separated bycommas. This is the preferred format to use if you wantto import the data into spreadsheets such as Excel orQuattro Pro.
3. Web Page (*.html)—this option saves the data in webpage format.
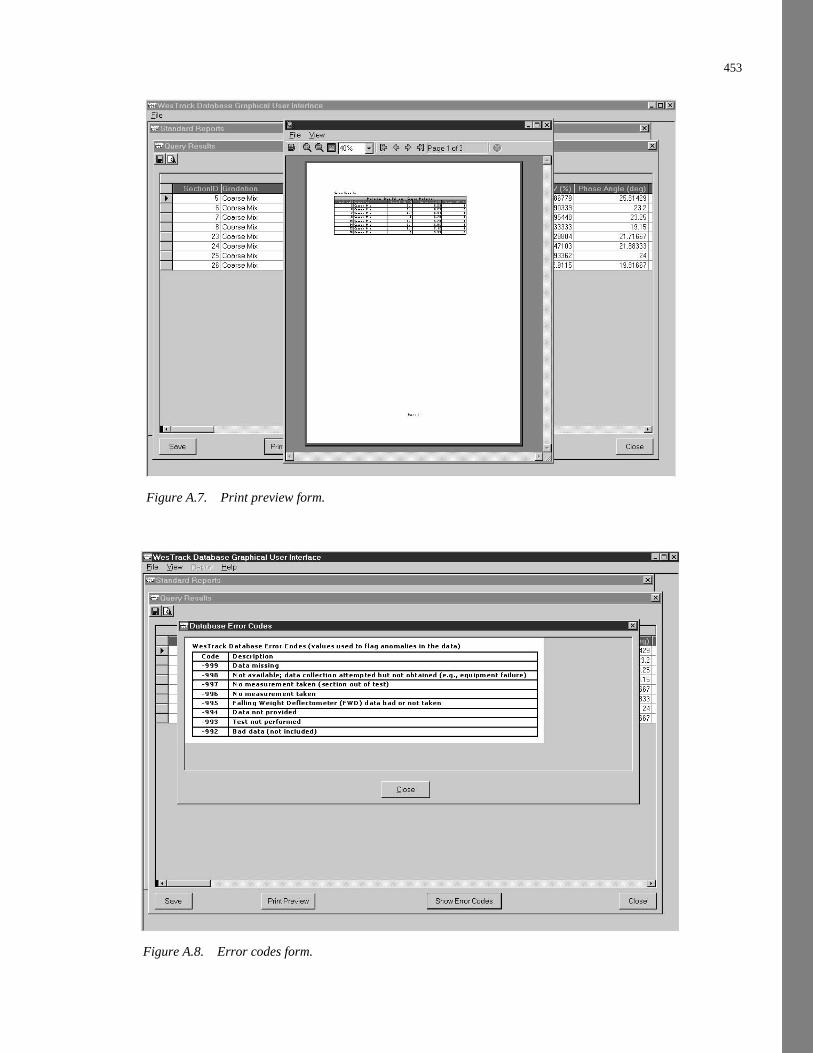
To print the report, click on the Print Preview button. Thisdisplays the Print Preview form shown in Figure A.7. Notethat various tools are provided for previewing the data, andprinting the data can be accomplished by clicking on theprinter icon at the top of the form or by selecting the printingoptions from the File menu.
The Show Error Codes button on the Query Results formdisplays the error codes included in the database as shown inFigure A.8. These are flags for use in creating queries andshould not be considered as real data. All error codes arebetween −992 and −999, inclusive and have the meaningsindicated in Figure A.8.
Selecting Performance Data Reports
Selecting a standard report for performance data requiresselecting the section to which the report applies. This can be
448
accomplished by clicking on one of the numbered buttons onthe right side of the Standard Reports form (Figure A.2) orby clicking on the Select Section by Map button. Note thatthe numbered buttons are clustered (vertically) according tothe gradations (coarse, fine, or fine plus) of the mixtures con-structed at WesTrack and the numbers on the buttons repre-sent the test section numbers.
Three tools have been provided for aiding the user in iden-tifying which section to select:
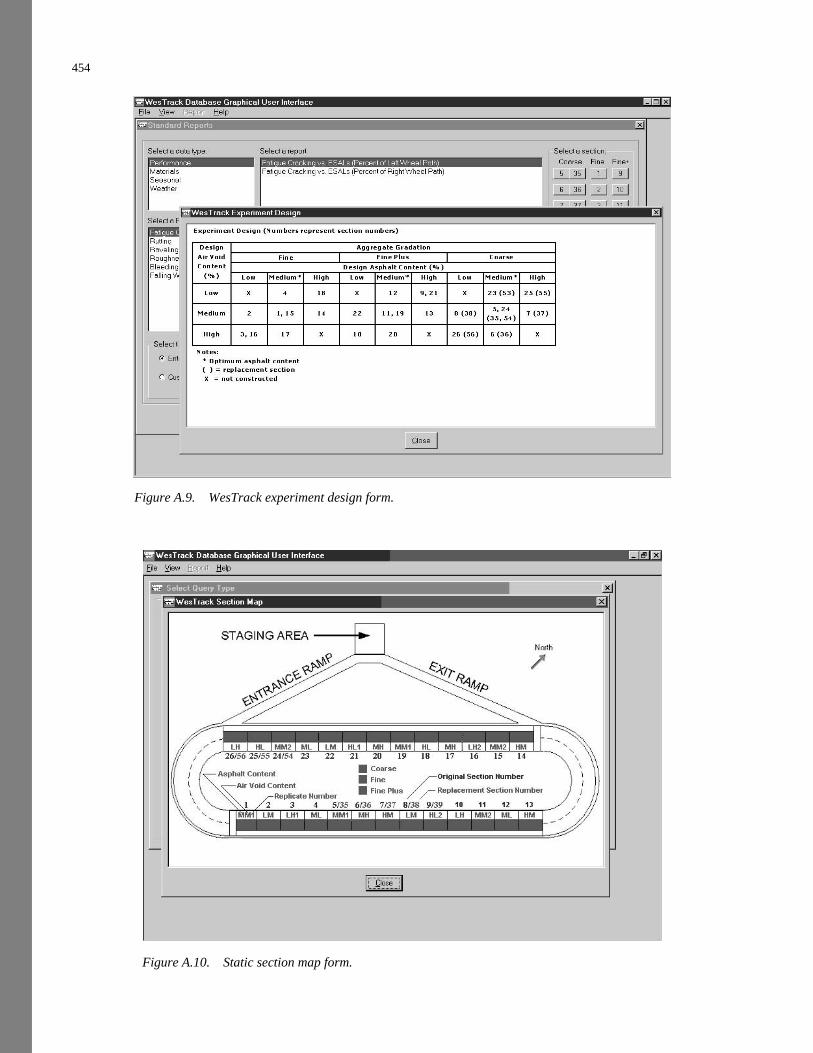
1. A form that displays the WesTrack experiment designas shown in Figure A.9. This form can be displayed byselecting Experiment Design from the View menu ofthe background form.
2. A form that displays a static map of WesTrack asshown in Figure A.10. This form can be displayed byselecting Section Map from the View menu of the back-ground form.
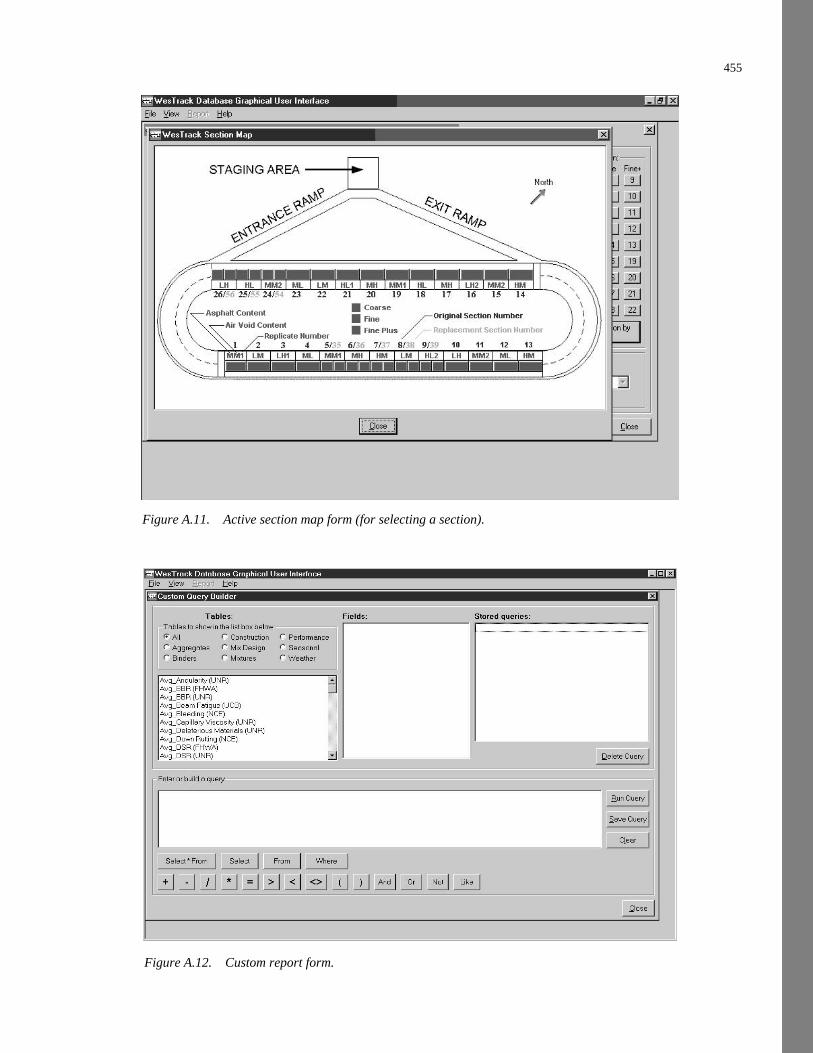
3. A form that displays an active map from which sectionselection can be made. This form is shown in Figure A.11and can be displayed by clicking on the Select Sectionby Map button on the Standard Reports form. Oncedisplayed, section selection is accomplished by click-ing on the button corresponding to the section number.Note that for those sections that were reconstructed,the buttons for the original sections are to the left ofthose for the reconstructed sections.
A.3.5 Custom Reports
Figure A.12 shows the form for creating custom queries.Note that all data within the database can be accessed throughuse of this form. The upper portion of the form consists ofthree list boxes for listing table names, field names, and storedqueries names. The lower portion of the form is used for cre-ating queries.
The group of radio buttons above the Tables list box allowsthe user to list only those tables associated with the categoriesincluded. For example, if only those tables associated withmix design are of interest, then the user should click on theMix Design Radio button as shown in Figure A.13.
The Fields list box lists the names of fields contained in thetable selected in the Tables list box. For example, clicking onAvg_Mix Design (Superpave) (UNR) in the Tables list boxpopulates the Fields list box with the names of the fields inthe Avg_Mix Design (Superpave) (UNR) table as shown inFigure A.14.
The query builder section of the form contains a numberof buttons for creating, running and storing (saving) queries.Although the query builder allows complex queries to be built,for most users creating simple queries will be entirely ade-quate for most purposes. However, note that only SELECTqueries can be built using this tool.
The following is the general form of a simple SELECTquery:
• SELECT information FROM table WHERE clause
where
• SELECT, FROM, and WHERE are query commands;• information is what the user wants to extract (e.g., rut
depth);• table is the name of the table from which information is
to be extracted; and• clause is conditions placed on the information to be
extracted (e.g., SectionID = 26).
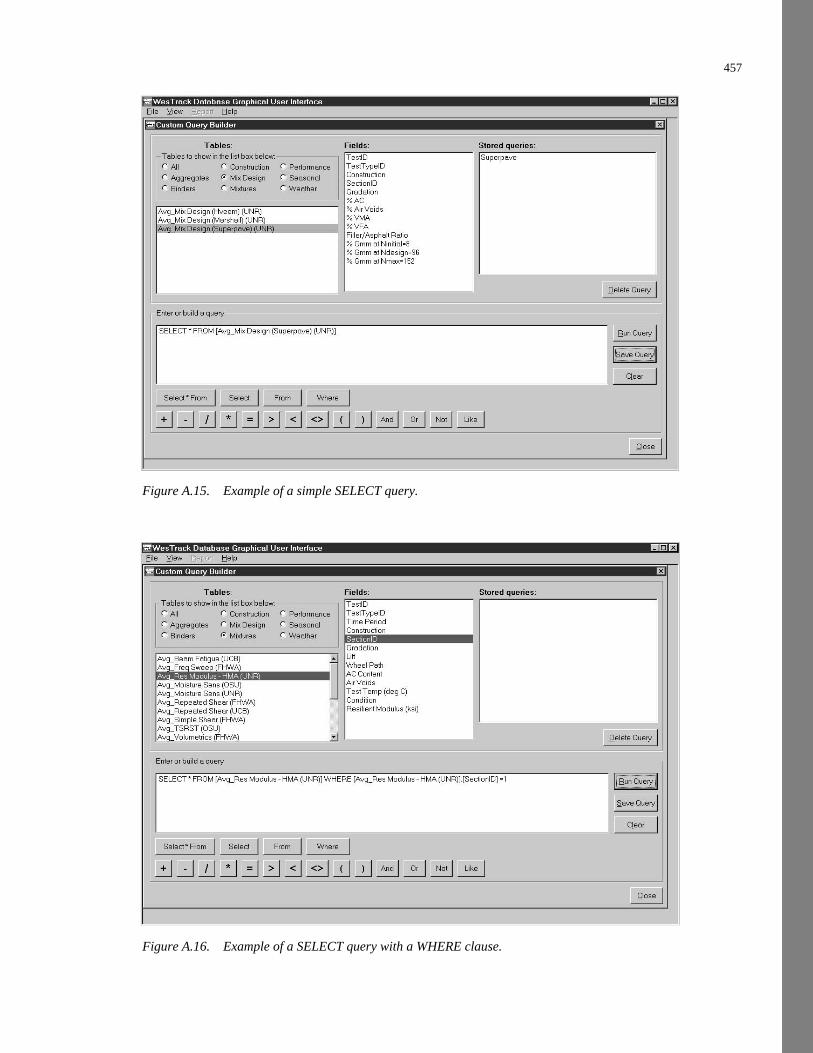
The simplest SELECT query to create is one that requestsall information contained in the table. This is accomplishedby using the * (everything) wildcard as the information to beextracted from the database. To create such a query click onthe Select * From button followed by dragging the tablename from the Tables list box and dropping it on the text boxlabeled “Enter or build a query.” To drag-and-drop, click andhold down the left mouse button over the desired table name,drag it over the text box, and release the mouse button. Fig-ure A.14 indicates that everything is to be selected from thetable named Avg_Mix Design (Superpave) (UNR).
Custom queries can be saved by clicking on the Save Querybutton and providing a name for the query. Saving queries inthis way creates stored queries (ones that reside in the data-base). For example, assuming the query in Figure A.15 was
449
saved under the name “Superpave,” it would be listed in theStored queries list box as indicated in Figure A.15. Storedqueries can be run any number of times by clicking on thequery name and then clicking on the Run Query button. Storedqueries can also be deleted by clicking on the Delete Querybutton and then confirming the deletion of the query.
To restrict a selection to certain conditions, include aWHERE clause. To do this, perform the following steps:
1. First create the SELECT information FROM table-portion of the query.
2. Click on the WHERE button.3. Create the clause by dragging a field name from the
Fields list box and dropping it on the query text box andestablishing the condition. This could be something likeGradation = “Fine” or SectionID = “26” or Construc-tion = “Original”.
Figure A.16 indicates a WHERE clause restricting theselection of resilient modulus data to section 1 (i.e., [Avg_ResModulus-HMA(UNR)].[SectionID] = 1). Note that creationof a WHERE clause requires knowledge of the format of thefield used in the clause (e.g., text, numeric, and date). In thisrelease, no syntax checking has been programmed.
Definitions of all fields in the tables are provided in the DataDictionary table. This can be displayed by selecting Data Dic-tionary from the View menu of the background form.
Running a query displays the data in the same way as instandard reports. The data can also be printed and exportedin the same manner as for standard reports.
450
Figure A.1. Query type selection form.
Figure A.2. Standard report form.

451
Figure A.3. Selection of a data type.
Figure A.4. Standard reports for Mixtures data type.
452
Figure A.6. Dialog box for exporting (saving) data.
Figure A.5. Query results form.
453
Figure A.8. Error codes form.
Figure A.7. Print preview form.
454
Figure A.10. Static section map form.
Figure A.9. WesTrack experiment design form.
455
Figure A.12. Custom report form.
Figure A.11. Active section map form (for selecting a section).

456
Figure A.14. Field names in selected table.
Figure A.13. Viewing list of tables by category.
457
Figure A.16. Example of a SELECT query with a WHERE clause.
Figure A.15. Example of a simple SELECT query.