part i: sti product description/67531/metadc... · • 8000va inverter bank consisting of 2 trace...
TRANSCRIPT

DOE F 241.3 OMB Control No. (2-01) p. 1 of 4 1910-1400
ANNOUNCEMENT
UNITED STATES DEPARTMENT OF ENERGY (DOE) Scientific and Technical Information (STI) For Financial Assistance Recipients and Non-M&O/M&I Contractors
PART I: STI PRODUCT DESCRIPTION (To be completed by Recipient/Contractor)
A. STI Product Identifiers H. Sponsoring DOE Program Office 1. REPORT/PRODUCT NUMBER(s) DOE’s Tribal Energy Program None 2. DOE AWARD/CONTRACT
NUMBER(s) I. Subject Categories (list primary one first)
DE-FC36-99R810677 Wind/Solar Hybrid Power System 3. OTHER IDENTIFYING NUMBER(s)
B. Recipient/Contractor Manzanita Band of the Kumeyaay Nation
J. Description/Abstract: The Manzanita Hybrid Power System Project Project was funded under the U.S. Department of Energy's Tribal Energy Program, from September 30, 1999 to March 31, 2005, The provides a demonstration of a solar wind energy hybrid power-generating project on Manzanita Tribal land.
C. STI Product Title
Manzanita Hybrid Power System Project Final Report K. Intellectual Property/Distribution
Limitations
D. Author(s) (must select at least one; if uncertain contact your
Frank, Trisha Contracting Officer (CO))
X 1.
UNLIMITED ANNOUNCEMENT (available to
E-mail Address(es): U.S. and non-U.S. public; the Government
[email protected] assumes no liability for disclosure of such data)
2.
COPYRIGHTED MATERIAL: Are there any
restrictions based on copyright? Yes No
If yes list the restrictionsE. STI Product Issue Date/Date of Publication
3. PATENTABLE MATERIAL: THERE IS
03/31/05 (mm/dd/yyyy) PATENTABLE MATERIAL IN THE DOCUMENT
INVENTION DISLOSURE SUBMITTED TO DOE:
F. STI Product Type (Select only one) DOE Docket Number: S-

X 1. TECHNICAL REPORT (Sections are marked as restricted distribution
X Final Other (specify) pursuant to 35 USC 205)
2. CONFERENCE PAPER/PROCEEDINGS
4. PROTECTED DATA: CRADA Other
Conference Information (title, location, dates) If other, specify
Release date (mm/dd/yyyy)
5.
SMALL BUSINESS INNOVATION RESEARCH
(SBIR) DATA
3. JOURNAL ARTICLE Release date (Required, (No more than 4 years from date listed in part 1.E above)
a. TYPE: Announcement Citation Only
6. SMALL BUSINESS TRANSFER (STTR) DATA
Preprint Postprint Release date (Required,
b. JOURNAL NAME No more than 4 years from date listed in part 1.E above)
7.
OFFICE OF NUCLEAR ENERGY APPLIED
c. VOLUME d.
ISSUE TECHNOLOGY
e. SERIAL IDENTIFIER (e.g. ISSN or CODEN) L. Recipient/Contractor Point of
Contact Contact
OTHER, SPECIFY
for additional information (contact or organization name to be included in published citations and who would receive any external questions about the content of the STI Product or the research contained therein)
Leroy J. Elliott/Tribal Chairman Name and/or Position G. STI Product Reporting Period (mm/dd/yyyy) ----
619-766-4930
E-mail Phone
10/01/1999 Thru 03/31/2005 Manzanita Band of the Kumeyaay Nation
Organization

DOE F 241.3 OMB Control No. (2-01) p. 2 of 4 1910-1400
ANNOUNCEMENT
UNITED STATES DEPARTMENT OF ENERGY (DOE) Scientific and Technical Information (STI) For Financial Assistance Recipients and Non-M&O/M&I Contractors
PART II: STI PRODUCT MEDIA/FORMAT and PART III: STI PRODUCT
REVIEW/RELEASE LOCATION/TRANSMISSION INFORMATION
(To be completed by Recipient/Contractor) (To be completed by DOE)
A. Media/Format Information: A. STI Product Reporting Requirement Review:
1. MEDIUM OF STI PRODUCT IS: 1.
THIS DELIVERABLE COMPLETES ALL
x Electronic Document Computer medium REQUIRED DELIVERABLES FOR
THIS AWARD
Audiovisual material Paper No full-text
2. THIS DELIVERABLE FULFILLS A
2. SIZE OF STI PRODUCT 1 MB TECHNICAL REPORTING
REQUIREMENT,
3. SPECIFY FILE FORMAT OF ELECTRONIC BUT SHOULD NOT BE
DISSEMINATED
DOCUMENT BEING TRANSMITTED, INDICATE: BEYOND DOE.
SGML HTML XML x PDF Normal PDF Image
WP-Indicate Version (5.0 or greater) B. DOE Releasing Official
Platform/operating system
1. I VERIFY THAT ALL NECESSARY
MS-Indicate Version (5.0 or greater) REVIEWS HAVE BEEN
COMPLETED AS
Platform/operating system DESCRIBED IN DOE G 241.1-1A,
PART II,
Postscript SECTION 3.0 AND THAT THE STI
4. IF COMPUTER MEDIUM OR AUDIOVISUAL PRODUCT SHOULD BE
RELEASED IN
a. Quantity/type (specify) ACCORDANCE WITH THE
INTELLECTUAL
b. Machine compatibility (specify) PROPERTY/DISTRIBUTION
LIMITATION
c. Other information about product format a user ABOVE.
needs to

know:
B. Transmission Information: Released by (name)
STI PRODUCT IS BEING TRANSMITTED:
x 1. Electronic via Elink Date
2. Via mail or shipment to address indicated (mm/dd/yyyy)
in award document (Paper products,
CD-ROM, diskettes, videocassettes, et.) E-
2a. Information product file name Phone (of transmitted electronic format)
Manzanita Hybrid Power System Project.doc

Final Report Title Page
Project Title: Manzanita Hybrid Power System Project
DOE Award Number: DE-FC36-99R810677
Period Covered by Report: September 30, 1999 to March 31, 2005
Document Title: Manzanita Hybrid Power System Project - Final Report
Recipient Organization: Manzanita Band of the Kumeyaay Nation
Angela Santos, Tribal Council
P.O. Box 1302, Boulevard, CA 91905
(619) 766 4930; fax (619) 766 4957

EXECUTIVE SUMMARY
The Manzanita Hybrid System Project was funded under the U.S. Department of
Energy's Tribal Energy Program to provide electricity to one of the tribal community
buildings. The project began September 30, 1999 and was completed March 31, 2005.
The hybrid renewable energy system was designed and the equipment supplied by
Northern Power Systems, Inc, an engineering company with expertise in hybrid system
design and development. Personnel of the National Renewable Energy Laboratory
provided technical assistance in system design, and continued to provide technical
assistance in system monitoring.
This final project report provides a technical accounting of the activities performed, and
a description of the results achieved, including lessons learned from the Manzanita
Hybrid System Project. This report contains the following sections:
• Executive Summary
• Project Overview
• Objectives
• Description of Activities Performed
• Conclusions, Recommendations, and Lessons Learned
• Appendix
Project Overview
The Manzanita Indian Reservation is located in southeastern San Diego County,
California. The Tribe has long recognized that the Reservation has an abundant wind
resource that could be commercially utilized to its benefit, and in 1995 the Tribe
established the Manzanita Renewable Energy Office. Through the U.S. Department of
Energy's Tribal Energy Program the Band received funds to install a hybrid renewable
power system to provide electricity to one of the tribal community buildings, the
Manzanita Activities Center (MAC building).

The project began September 30, 1999 and was completed March 31, 2005. The
system was designed and the equipment supplied by Northern Power Systems, Inc, an
engineering company with expertise in renewable hybrid system design and
development. Personnel of the National Renewable Energy Laboratory provided
technical assistance in system design, and continued to provide technical assistance in
system monitoring.
The grid-connected renewable hybrid wind/photovoltaic system provides a
demonstration of a solar/wind energy hybrid power-generating project on Manzanita
Tribal land. During the system design phase, the National Renewable Energy Lab
estimated that the wind turbine is expected to produce 10,000-kilowatt hours per year
and the solar array 2,000-kilowatt hours per year. The hybrid system was designed to
provide approximately 80 percent of the electricity used annually in the MAC building.
The project proposed to demonstrate that this kind of a system design would provide
highly reliable renewable power for community uses.
- System Description
The grid-connected renewable energy system is a 10 kW Bergey wind turbine and a 1.2
kW Siemens photovoltaic array, which provides electricity to the MAC building. Although
the power system can be configured for stand-alone operation, the best use of it on the
Manzanita Reservation is in a grid-connected mode. For stand-alone applications at
other sites, the design of this hybrid power system will allow a standby generator to be
added to provide on-demand power in periods of diminished renewable resources or
increased electrical loads.
The hybrid system is centrally located for monitoring and visibility, and provides power
for established community needs. The overall system rating is 10kW, allowing it to meet
the criteria for net metering requirements that existed in California when the system was
proposed in 1999. See Figure 1. for a Schematic of the hybrid system.
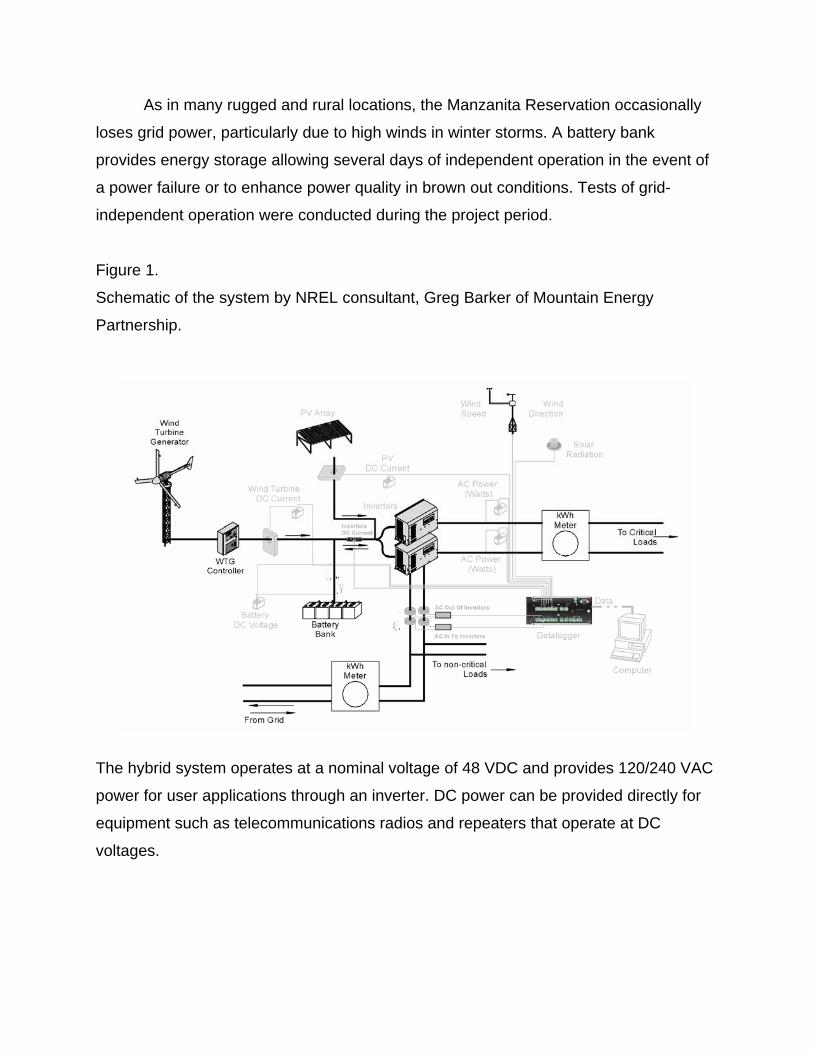
As in many rugged and rural locations, the Manzanita Reservation occasionally
loses grid power, particularly due to high winds in winter storms. A battery bank
provides energy storage allowing several days of independent operation in the event of
a power failure or to enhance power quality in brown out conditions. Tests of grid-
independent operation were conducted during the project period.
Figure 1.
Schematic of the system by NREL consultant, Greg Barker of Mountain Energy
Partnership.
The hybrid system operates at a nominal voltage of 48 VDC and provides 120/240 VAC
power for user applications through an inverter. DC power can be provided directly for
equipment such as telecommunications radios and repeaters that operate at DC
voltages.

The major components of the hybrid system include:
• 7.5kW Bergey wind turbine with 80-ft guyed-tower. Includes turbine charge
controller.
• 1.2 Siemens PV array consisting of sixteen 75W panels, 4 panels per string.
• 875 AH Deka Unigy II deep discharge, maintenance-free, battery modules.
• 8000VA Inverter bank consisting of 2 Trace SW4048 modules.
• DC power center.
• NRG anemometer
• Support frame for PV array. Adjustable array angle.
• All system wiring and protective devices including turbine disconnect and utility
interconnect panel.
Project Objectives
The primary objectives of this project were to design, install, maintain, and
monitor a renewable hybrid power system, with the intention of demonstrating that a
system of this type can be used to provide highly reliable renewable power for
community uses.
The modular system was to be designed to be versatile, in that it could be adapted for
either stand-alone power applications or connected to the utility grid. Designated
Manzanita tribal technicians were to carry out the service and maintenance functions. In
addition, ongoing education was to be held for tribal members seeking to increase their
technical knowledge related to the wind and solar energy industries.


Description of Activities Performed
The Manzanita Hybrid System project began September 30, 1999 and was
completed March 31, 2005. The activities consisted of project design, installation,
monitoring, maintenance, and education/outreach, as follows:
- System Design
The system was designed and equipment supplied by Northern Power Systems, Inc.
(NPS), an engineering-oriented company that specializes in hybrid design solutions
integrating renewable and conventional energy resources. In addition, personnel of the
National Renewable Energy Laboratory provided technical assistance in system design.
While NPS was involved in the design phase, Manzanita project staff changed out the
old lighting fixtures in to Manzanita Activities Center building since lighting is the single
largest end use for electricity; installed in all rooms were the more energy-efficient
fluorescent fixtures to ensure that building would make the best use of the electricity to
be produced by the renewable hybrid system.
- System Installation
After the design work had been completed by Northern Power Systems, the project was
ready for installation. The site on the hill above the MAC building had been selected as
the best location for the Bergey wind turbine. The hill was well-exposed ground without
trees and located approximately 450 feet uphill from the MAC building.
Mike Bergey of Bergey WindPower, Inc. recommended an installation contractor located
in southern California. In late April of 2000, the concrete pads for the wind tower were
formed up and the cement was poured. The work crew consisted of five to six people,
the Tribal work crew, the contractor Joe Guasti, and his assistant. The site was cleared
of brush and leveled with a small bulldozer. 450 feet of trenching downhill to the
Manzanita Activities Center building was accomplished using a trench-digging machine.

In late May, the crew installed the turbine. There was a crane on-site for one-half day to
lift the turbine into place on top of the guyed-tower. During this week, the crew also
mounted and connected the solar system on the roof of the MAC building. Batteries and
other balance of system components were installed in a room in the MAC building
designated as “The Battery Room.”
During the week of August 20th, the crew spent two days installing the project
anemometer using a guyed tower. This was accomplished using a gin pole, without
heavy equipment. The turbine and anemometer guyed-tower pads comprise
approximately one acre.
- System Monitoring
Personnel of the National Renewable Energy Laboratory provided technical assistance
in system design, and continued to provide technical assistance in system monitoring.
On an ongoing basis, the designated technician, Tribal member David Thompson,
collected the chips from the NRG met tower and sent them to NREL for processing.
In 2002 and 2003 we had discussions with NREL and it was determined that we needed
more detailed performance records. We decided that what was missing from the data
acquisition system was a direct measurement of the amount of energy delivered by the
renewable energy systems (PV and Wind). Also missing was a fail-safe method of data
collection and storage.
In early 2004 NREL sent Greg Barker of Mountain Energy Partnership to consult on
these issues. He installed two pulse-initiating kilowatt-hour meters on the AC lines
connecting the electrical grid to the inverters. With these new measurements and the
existing measurements, the total energy delivered by the renewable energy systems
could be directly measured. David Thompson worked with Greg Barker to collect the
data. Barker filed monthly reports with NREL.

In addition, NREL used the project data to validate the potential performance of a hybrid
project. See the Appendix for the NREL report, “Annual Performance Prediction,” by
NREL consultant, Greg Barker of Mountain Energy Partnership.
- System Maintenance
Northern Power Systems designed the hybrid system so that maintenance requirements
would be very limited. David Thompson, the project’s technicians performed the
maintenance functions. The batteries were the primary maintenance concern and
maintenance was relatively straightforward, involving checking battery terminals for
corrosion, checking the water level in the batteries with a hydrometer, and equalizing
the batteries when necessary. Thompson also cleaned the PV array on an ongoing
basis. In addition, Thompson maintained an record of the local utility meter readings.
- Education and Outreach
The Manzanita Renewable Energy Office project staff coordinated education and
outreach during the project period. The official dedication of the hybrid system in
December of 2000 was an opportunity for all Manzanita Tribal members, other
local Tribes, and surrounding community members to see the system and learn
about renewable energy. Representatives from DOE and local agencies also
attended the event.
Through the project period, the Manzanita Renewables Committee (MRC) met to
discuss project issues. The MRC and other Manzanita Tribal members met with
technical consultants from NREL, Charles Newcomb and Greg Barker, when
they visited Manzanita. When Pieter Huebner from Bergey WindPower, came to
trouble-shoot the system, project staff organized training sessions for the MRC
and other Manzanita Tribal members to review and discuss project operations
and maintenance.
There were numerous other visits by interested local people, including
schoolchildren and Kiwanis Club members, to see the hybrid system. Children of

neighboring Kumeyaay Tribes and other Tribes visited the site, to increase their
knowledge of, and appreciation for, renewable energy as a clean alternative to
fossil-generated electricity.
Conclusions, Recommendations, and Lessons Learned Throughout the Manzanita Hybrid Power System Project, there was an opportunity to
gain first hand experience with a Tribal resource that could benefit the community. The
project has also provided a significant learning experience in community project
development.
- System Design
As mentioned above, the system was designed and equipment supplied by Northern
Power Systems, Inc. (NPS), an engineering-oriented company that specializes in hybrid
design solutions integrating renewable and conventional energy resources.
The lesson learned was that even thought NPS was a highly skilled and reliable
organization; they were located too far away to interact successfully with Manzanita.
The key is to work with local consultants if at all possible, or at least consultants that are
accessible, who can provide local services without high travel expenses.
- System Installation
Utilizing the installation contractor recommended by Bergey, the Manzanita work crew
cleared and leveled the site with a small bulldozer; formed and poured the concrete
pads for the wind tower; trenched 450 feet of downhill for the wiring using a trench-
digging machine; installed the turbine, working with a crane-operator; mounted and
connected the solar system; and installed the batteries and other balance of system
components.

The lessons learned during this process were gleaned from the hands-on experiences
of installing the hybrid system; tribal members not only gained an awareness of factors
related to the use of wind and sun to produce power, but also the practical training
needed to install and operate a small hybrid system of this type.
- System Monitoring
As mentioned, Personnel of the National Renewable Energy Laboratory provided
technical assistance in system design, and continued to provide technical assistance in
system monitoring. By working with personnel of the National Renewable Energy
Laboratory, project technician David Thompson received the benefit of technical training
in resource documentation.
In addition, NREL used the project data to validate the potential performance of a
community renewable energy project, which may be a useful model for other Tribes to
replicate, who are considering wind as a community development strategy. See the
Appendix for the NREL report, “Annual Performance Prediction,” by NREL consultant,
Greg Barker of Mountain Energy Partnership.
- System Maintenance
As mentioned, Northern Power Systems designed the hybrid system so that
maintenance requirements would ideally be very limited. David Thompson, the project’s
technician performed the maintenance functions, which were relatively straightforward
and primarily involved checking and maintaining the batteries on a regular basis.
However, we encountered several technical system problems that required calling in
either an NREL technical consultant or a representative from Bergey WindPower, the
turbine manufacturer. Although a great deal was learned from these visits by technical
consultants, regarding system trouble-shooting and maintenance, the basic situation
remains the same. The Tribe has no on-site staff trained in the complexities of the
system. If something fails, project staff is trained in basic safety procedures to shutdown
the system and switch to grid-power; but from that point outside technical expertise

needs to be utilized to diagnose and fix the system. The uncertainly of the cost to
maintain the system after the grant period and into the future poses a dilemma for the
Tribe. The MAC building is used for multiple activities nearly every day. The hybrid
system is hard-wired into this building and when there is a problem, it affects everyone.
We would like to say that the system is working as designed and providing 80 percent of the
building electrical needs as originally projected by NREL, but whenever there is a problem, the
system is down, and it takes some time to diagnose and fix the problem. When the system is
working as designed and the winter winds are high, the renewable hybrid system provides
nearly all of the power used by the Manzanita Activities Center building.

APPENDIX Annual Performance Prediction
Manzanita Tribe Activities Center Hybrid System Boulevard, California
April 14, 2005
Submitted as Deliverable for
Subcontract # ACX-4-44403-01
Prime Contract # DE-AC36-99GO10337
Greg Barker Mountai nership
under
n Energy Part

1. Introduction Although the performance of PV-Wind hybrid system at the Manzanita Activities Center has been monitored for about a year, its performance does not necessarily represent the performance over a typical year, as weather patterns during the monitoring period were not necessarily typical. It is desirable, therefore, to predict what the performance of the system would be under typical weather conditions. We have made this prediction by using a computer simulation model driven by TMY (Typical Meteorological Year) weather data for a site close to the actual site. In this case the TMY site closest in location and altitude is for Dagget, CA. 2. Comparison of Daggett, CA (TMY site) to Boulevard, CA (actual site) The three weather components which significantly affect the hybrid system are dry bulb ambient temperature (influences PV temperature), solar radiation (influences PV temperature and PV output), and wind speed (influences PV temperature and wind turbine output). In Figures 1, 2, and 3 these quantities are compared on a monthly and annual basis. In Table 1 are shown the geographic location statistics. Table 1. Geographic Location Statistics Boulevard, CA
(actual location) Daggett, CA (TMY site)
Latitude (deg) 32.75 34.87 Longitude (deg) 116.36 116.78 Elevation (m) 1280 588 Climate Type High Desert High Desert From Figure 1 we can see that the dry bulb temperature at Dagget follows a similar trend as the measured dry bulb temperature at Boulevard, but is on an annual averaged basis 5.3 oC higher than Boulevard. Since Boulevard is at an elevation 692 m higher than Dagget, this offset is to be expected. Applying the rule-of-thumb of 6.5 oC temperature drop per 1000 m elevation rise (1), the Dagget dry bulb temperatures can be decreased by 6.5 X 692/1000 = 4.5 oC to account for the difference in elevation. There is no particular reason to think that the solar radiation in Boulevard is significantly different from that at Dagget, and Figure 2 seems to imply that the measured period was not far from typical insolation levels. The seasonal wind patterns shown in Figure 3 are quite different between our measured period in Boulevard and the typical patterns in Dagget, although the annual average wind speeds are similar. Since wind patterns can be a fairly localized effect, we have opted to use the measured wind speeds rather than the typical wind speeds at Dagget for our analysis. Ambient Temperature
20
25
30
35
s C
TMY
TMY, correctedfor elevation
Measured
19.7
14.4
Annual Average
15.2
Collector-Plane Irradiance
0
100
200
300
400
500
600
700
800
900
1000
Jan Feb Mar Apr May Jun Jul Aug Sep Oct Nov Dec
kJ/m
2 per
mon
th
TMY
Measured
8136
7808
Annual Total
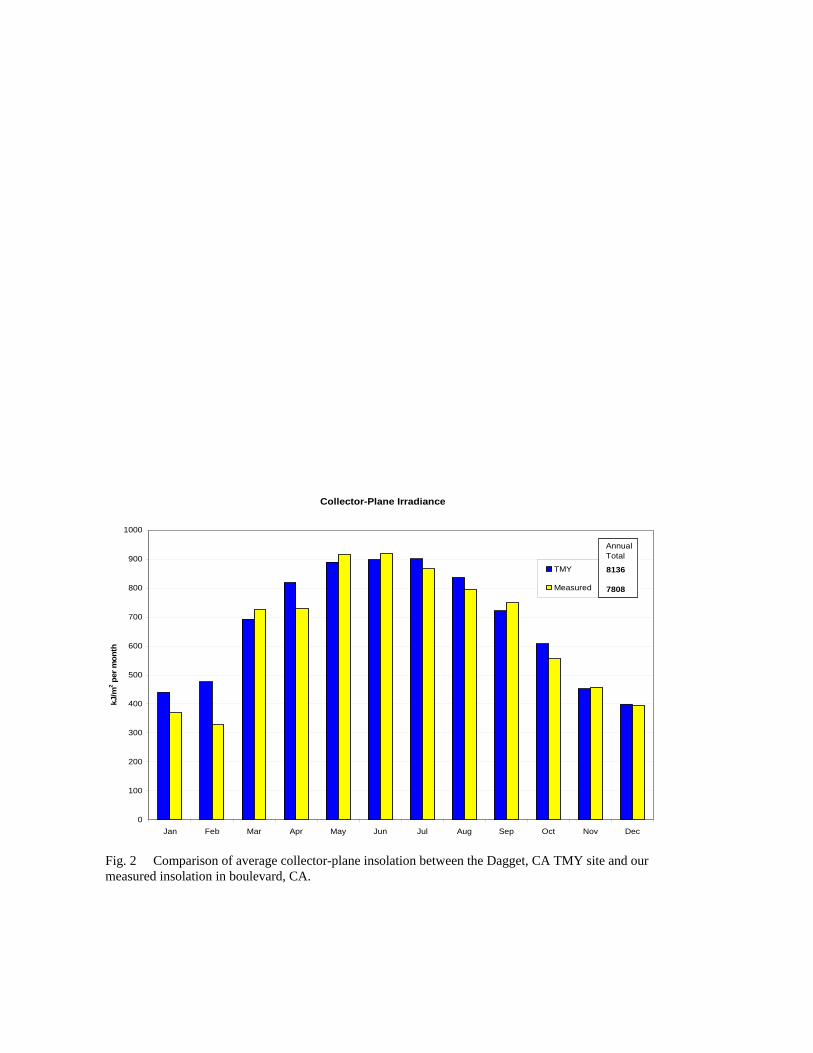
Fig. 2 Comparison of average collector-plane insolation between the Dagget, CA TMY site and our measured insolation in boulevard, CA.

Wind Speed
0
1
2
3
4
5
6
7
8
Jan Feb Mar Apr May Jun Jul Aug Sep Oct Nov Dec
m/s
ec
TMY
Measured
4.9
5.0
Annual Average
Fig. 3 Comparison of monthly average wind speeds for the Dagget, CA TMY site and the measured wind speeds at the Boulevard, CA site. Monthly distribution is quite different, but annual average is very similar.
3. Prediction of Annual Performance of PV Array As noted throughout the monitoring period, the PV array has consistently generated almost a factor of two less energy than should be expected. Lacking further information, we have made the assumption the array will continue to perform as it has for the last year. A model was developed to estimate efficiency as a function of the driving weather parameters Tamb (ambient dry-bulb temperature), Ic (collector-plane insolation), and W (wind speed), with a few basic assumptions: hw=c0+c1W (Eq. 1) where: hw = heat transfer coefficient due to wind c0 = empirical constant c1 = empirical constant η = η0(1+β(Tc-Tc0)) (Eq. 2) where: η = array efficiency η0 = array efficiency at STC (constant) β = temperature coefficient of efficiency (constant)
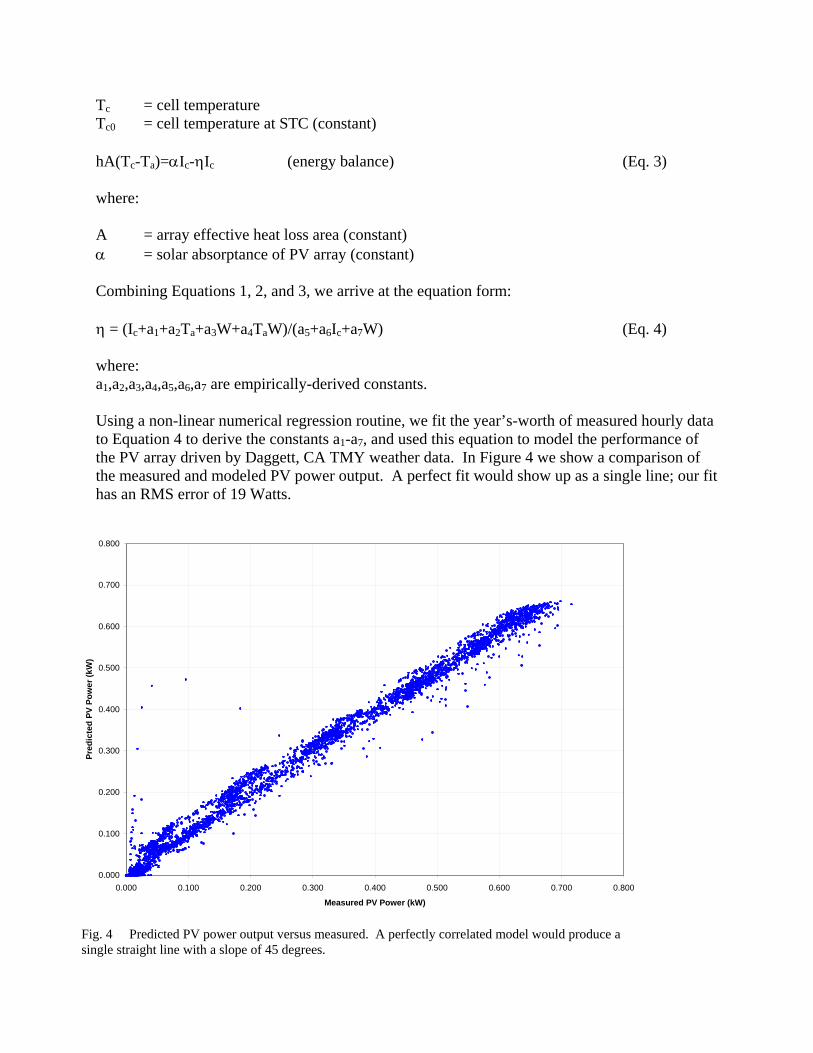
Tc = cell temperature Tc0 = cell temperature at STC (constant) hA(Tc-Ta)=αIc-ηIc (energy balance) (Eq. 3) where: A = array effective heat loss area (constant) α = solar absorptance of PV array (constant) Combining Equations 1, 2, and 3, we arrive at the equation form: η = (Ic+a1+a2Ta+a3W+a4TaW)/(a5+a6Ic+a7W) (Eq. 4) where: a1,a2,a3,a4,a5,a6,a7 are empirically-derived constants. Using a non-linear numerical regression routine, we fit the year’s-worth of measured hourly data to Equation 4 to derive the constants a1-a7, and used this equation to model the performance of the PV array driven by Daggett, CA TMY weather data. In Figure 4 we show a comparison of the measured and modeled PV power output. A perfect fit would show up as a single line; our fit has an RMS error of 19 Watts.
0.000
0.100
0.200
0.300
0.400
0.500
0.600
0.700
0.800
0.000 0.100 0.200 0.300 0.400 0.500 0.600 0.700 0.800
Measured PV Power (kW)
Pred
icte
d PV
Pow
er (k
W)
Fig. 4 Predicted PV power output versus measured. A perfectly correlated model would produce a single straight line with a slope of 45 degrees.

The wind turbine, as noted in previous reports, appears to have undergone some sort of drop in efficiency after October 18, 2004. Figure 5 shows the power output as a function of hourly-averaged wind speed, with the two periods before and after Oct. 18 showing up as two distinctly different curves. Recently it was discovered that the wind turbine had been damaged by vandalism, and it is expected that the wind turbine will be repaired so that it operates as it had
A fourth-order polyn
before October 18.
wt = b1W+b2W +b3W +b4W (Eq. 5)
here:
4
Figure 6 the goodness-of-fit of Equation 5 is shown. The fit has an RMS error of 455 watts.
0.000
1.000
2.000
3.000
4.000
5.000
6.000
7.000
8.000
0.0 2.0 4.0 6.0 8.0 10.0 12.0 14.0 16.0 18.0 20.0
Wind Sped (m/sec)
Pow
er fr
om W
ind
turb
ine
(kW
)
Before Oct 18 2004After Oct 18 2004
Fig. 5 Wind turbine power output versus hourly-averaged wind speed. Vandalism to the wind turbine appears to be the cause of the drop in efficiency after about October 18, 2004.
omial fit was made to the data before Oct. 18 of the form:
2 3 4P wPwt = power output of wind turbine b1-b = constants In

Measured vs Model(before Oct. 18, 2004)
0.0
1.0
2.0
3.0
4.0
5.0
6.0
7.0
8.0
0.0 1.0 2.0 3.0 4.0 5.0 6.0 7.0 8
Measured Wind Turbine Power (kW)
Pred
icte
d W
ind
Turb
ine
Pow
er (k
W)
.0
0
500
1000
1500
2000
2500
Jan Feb Mar Apr May Jun Jul Aug Sep Oct Nov Dec
kWh
Wind TurbinePhotovoltaics
Fig. 6 Comparison of model versus measurement for the wind turbine power output before Oct. 18, 2004, when the turbine was damaged due to vandalism.
Fig. 7 Monthly DC energy production predicted for a typical year.
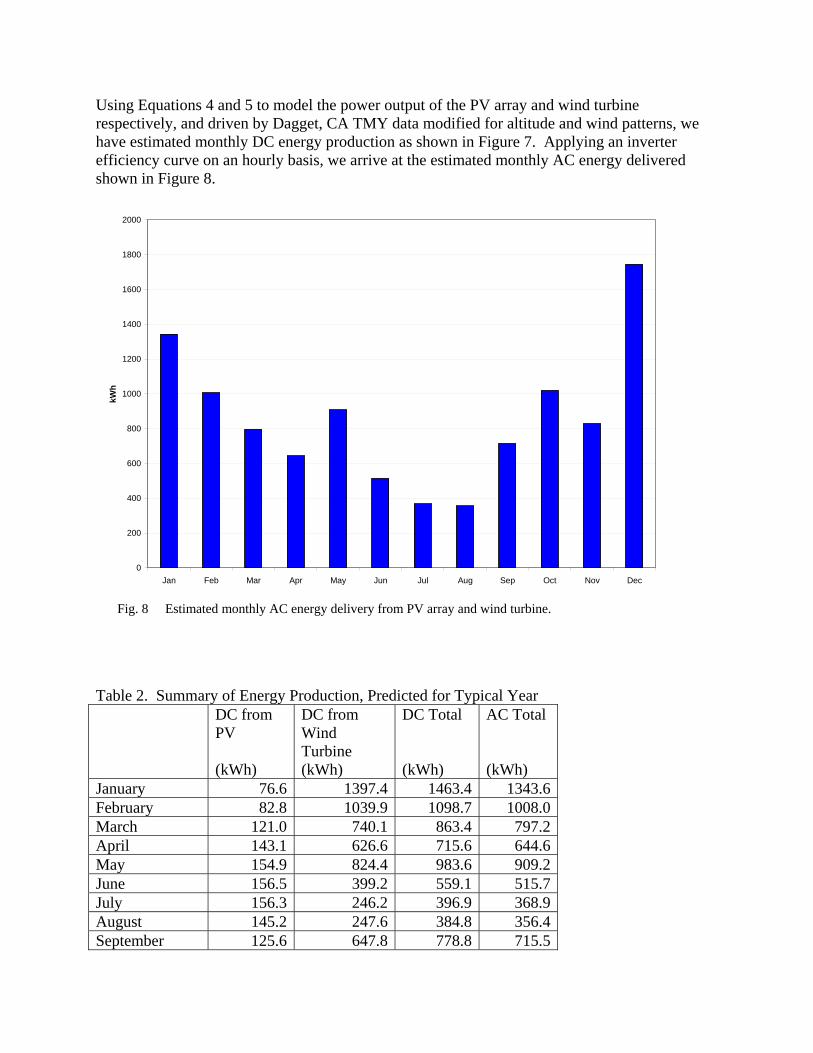
Using Equations 4 and 5 to model the power output of the PV array and wind turbine respectively, and driven by Dagget, CA TMY data modified for altitude and wind patterns, we have estimated monthly DC energy production as shown in Figure 7. Applying an inverter efficiency curve on an hourly basis, we arrive at the estimated monthly AC energy delivered shown in Figure 8.
0
200
400
600
800
1000
1200
1400
1600
1800
2000
Jan Feb Mar Apr May Jun Jul Aug Sep Oct Nov Dec
kWh
Fig. 8 Estimated monthly AC energy delivery from PV array and wind turbine.
Table 2. Summary of Energy Production, Predicted for Typical Year DC from
PV (kWh)
DC from Wind Turbine (kWh)
DC Total (kWh)
AC Total (kWh)
January 76.6 1397.4 1463.4 1343.6February 82.8 1039.9 1098.7 1008.0March 121.0 740.1 863.4 797.2April 143.1 626.6 715.6 644.6May 154.9 824.4 983.6 909.2June 156.5 399.2 559.1 515.7July 156.3 246.2 396.9 368.9August 145.2 247.6 384.8 356.4September 125.6 647.8 778.8 715.5

October 105.6 1018.0 1116.1 1020.5November 78.9 832.9 913.9 830.3December 70.0 1852.6 1926.0 1745.5 Year 1416.5 9872.8 11200.2 10255.4 4. Conclusions In a typical year, assuming that the wind turbine is repaired, the total AC energy delivered by the hybrid PV/wind system is predicted to be about 10,255 kWh. Output from the wind turbine accounts for about 87% of this total. If the PV array is found to be faulty and is repaired, the output from the PV is expected to rise by about 70%, bringing the total annual output of the hybrid system to about 12,420 kWh.

References (1) ASHRAE Handbook of Fundamentals, 1981, page 5.1, Table 1.