part d: what it means for your community - - the … seq... · 4 270 000 brisbane city council is...
TRANSCRIPT

Part D: What it means for your community
PART D - What it means for your community 73
Transport and Main Roads, Connecting SEQ 2031 – An Integrated Regional Transport Plan for South East Queensland, 2010
DRAF
T

9. 2031 transport networks for the cities of SEQ
The cities of SEQ include the local government areas of Brisbane City Council, Moreton Bay Regional Council, Logan City Council, Redland City Council, Ipswich City Council, Gold Coast City Council and Sunshine Coast Regional Council. While there are many rural communities within the region, more than 90% of SEQ residents live and work in urban areas.
The SEQ Regional Plan seeks to contain urban sprawl and concentrate the vast majority of population and employment growth over the next two decades into these urban local government areas.
Solutions for the 2031 transport networks need to be tailored at a local level. The draft Connecting SEQ 2031 establishes transport planning policies and actions for each urban local government based on:
• key local challenges
• transport and land use integration issues
• 2031 transport network
• transport projects.
Some high level strategic active transport corridors are shown on the maps. These represent priorities for investment established through the Connecting SEQ 2031 process. However the SEQ Principal Cycle Network Plan (2007) remains the main source document for establishing and delivering the region's active transport spines.
Population in 2006: 2.8 million
Forecast population in 2031: 4.4 million
Dwellings in 2006: 1.05 million
Forecast additional dwellings in 2031: 690 000
Daily trips by residents in 2006: 9.8 million
Daily trips by residents in 2031: 14.3 million
Walk/Cycle, 10.2%
Vehicle driver, 58.4%
Vehicle passenger, 24.3%
Public transport, 7.1%
Figure 9.1 – SEQ 2008 daily mode share
Note: These are the population forecasts contained in the SEQ Regional Plan. They do not take into account the commitment from the Queensland Growth Management Summit to review population forecasts in consultation with local governments. Any changes to population forecasts will require transport infrastructure projects and delivery timeframes to be revised.
Source: Department of Transport and Main Roads 2008 Household Travel Survey
74 Draft Connecting SEQ 2031
Transport and Main Roads, Connecting SEQ 2031 – An Integrated Regional Transport Plan for South East Queensland, 2010
DRAF
T

Brisbane City Council
Population in 2006: 991 000
Indicative planning population in 2031: 1 270 000
Dwellings in 2006: 397 000
Forecast additional dwellings in 2031: 156 000
Daily trips by residents in 2006: 3 470 000
Daily trips by residents in 2031: 4 270 000
Brisbane City Council is the region’s commercial and administrative core. It contains economic drivers of regional, state and national importance, including the CBD and adjacent city frame employment areas and the region’s main air and sea ports in the Australia TradeCoast. Employment growth is also occurring in centres like Chermside and Upper Mt Gravatt, and industrial growth in areas around Wacol, Acacia Ridge and Australia TradeCoast. Although it has only 38% of the region’s population, Brisbane city has more than 50% of the jobs.
The population of Brisbane city is forecast to increase by 28% from 991 000 in 2006 to 1 270 000 in 203143. Opportunities for new urban development are almost exhausted within the Brisbane city area and almost 90% of population growth will be accommodated in existing urban areas, focused around public transport stations and corridors. The rate of population growth in Brisbane is forecast to slow considerably from an annual average of more than 16 000 people in 2006 to an annual average of 5200 after 2016.
Although policies are being enacted through the SEQ Regional Plan to locate jobs closer to where residential growth is occurring, business and industry interdependencies mean Brisbane will continue to dominate employment growth, with an extra 320 000 jobs by 2031. This will place ongoing pressure on transport infrastructure with residents from across the region travelling to jobs located within the Brisbane city limits.
Inner Brisbane will remain the dominant employment centre, with around 20% of all the region’s jobs located in the inner 17 suburbs. There will be significant job growth in the CBD, South Brisbane, Bowen Hills and Woolloongabba.
Australia TradeCoast will be the region’s second largest employment location, with jobs increasing from 43 000 in 2006 to 111 000 in 202644.
Significant job growth is also planned for activity centres such as Chermside, Upper Mt Gravatt, Toowong, Indooroopilly and Mitchelton.
Quick transport facts on Brisbane city
• over 90% of journey to work trips start and finish within the city limits
• only 9% of households do not have a private vehicle while 31% of residents do not have a licence
• highest public transport use in the region with 10.3% of all trips by public transport and 18.1% of trips to work by public transport
• 55% of journey to work trips are less than 10 kilometres – the highest in the region
• the average journey to work trip length is 11.3 kilometres
• 78.1% of all trips are by private cars
• 25% of Brisbane residents live within one kilometre of a high-frequency public transport service (15 minutes or better all day)
• high public transport use for trips to the Brisbane CBD (48%).
Figure 9.2 – 2008 journey to work trip length
SEQ<3km <5km <10km <20km <30km >30km
13% 23% 46% 75% 89% 11%
Brisbane<3km <5km <10km <20km <30km >30km
15% 26% 55% 88% 96% 4%
Walk/Cycle, 11.6%
Vehicle driver, 56%
Vehicle passenger, 22.1%
Public transport, 10.3%
1981
3%
39%
58%
1986
2%
44%
54%
1991
3%
40%
57%
1996
3%
40%
57%
2001
4%
44%
52%
2006
7%
48%
45%
Active transport Public transport Private vehicle
Figure 9.3 – CBD as destination51
Figure 9.4 – current mode share
43 Australian Bureau of Statistics 2006 Census of Population and Housing44 Australia TradeCoast 2008 Economic Assessment & Forecast Study
PART D - What it means for your community 75
Transport and Main Roads, Connecting SEQ 2031 – An Integrated Regional Transport Plan for South East Queensland, 2010
DRAF
T

Transport issues and challenges for Brisbane to 2031
• trips made by Brisbane residents will grow by 23% from 3.47 million in 2006 to 4.27 million in 2031
• significant job growth in the CBD, South Brisbane, Woolloongabba and Bowen Hills will require public transport infrastructure to take passengers close to where they work
• lack of an orbital road network results in many trips passing through inner suburbs, compounding congestion on the radial road network and also reducing amenity in inner suburbs
• the Brisbane Urban Corridor from Ipswich Motorway (Rocklea) to Gateway Motorway (Wishart) has limited potential to expand traffic capacity due to incompatible land uses and a constrained corridor
• congestion on the road network is adversely impacting travel times and reliability for all vehicles using the road network
• ability to improve rail services is increasingly constrained by inner-city rail capacity
• lack of direct cross-town public transport services to provide access to activity centres outside the CBD
• around 50% of forecast job growth is expected to be outside activity centres, spread between low density industrial or logistics hubs, office parks, smaller activity centres and home-based offices. This type of development can be more difficult to service with public transport, which will place increasing pressure on congested roads
• significant job growth in the Australia TradeCoast will increase travel demand to the area. The type of employment, 24-hour nature of some industries and the large scale of land use will present challenges for servicing this area with public transport. Roads servicing the area are likely to experience significant traffic growth
• congestion is affecting access to the Port, which impacts on economic growth capabilities
• road network constraints limit opportunity to expand development at Acacia Ridge and alternative locations for industry are needed
• lack of continuous, direct active transport facilities to the CBD and centres in Brisbane city
• The National Land Transport Network passing through the south and east of the city gets congested with commuters during peaks – this slows down inter- and intra-state freight traffic.
Public Transport Walking Cycling Car
2006 Actual
2031 Target
2006 Actual
2031 Target
2006 Actual
2031 Target
2006 Actual
2031 Target
All trips 10.3% 20% 10.6% 13% 1.0% 11% 78.1% 56%
Work trips 18.1% 35%
Targets
Brisbane has significant potential to increase the share of trips by public and active transport. The strong focus on denser urban development through urban infill will support a shift to more sustainable transport modes. Achieving the transport targets of Connecting SEQ 2031 would result in:
• increasing in the share of trips by public transport from 10.3% to 20% taking daily trips from 360 000 in 2006 to 860 000 in 2031
• increasing in the share of trips by walking from 10.6% to 13%
• increasing in the share of trips by cycling from 1.0% to 11%.
This would see the share of trips by private car reduced to 56%, with private car trips made by Brisbane residents reducing from 2.7 million in 2006 to 2.4 million in 2031. However, with high levels of population growth in all the local governments adjacent to Brisbane City Council, coupled with strong jobs growth, the number of car trips made on the road network within the city limits will still increase.
Figure 9.5 – average composition of 25 trips made per person each week for Brisbane city
20063 trips
2.5 trips
19.5 trips
2031target 6 trips 5 trips 14 trips
To achieve these targets, the weekly travel patterns of the average Brisbane resident would need to change only incrementally.
Brisbane City Council
76 Draft Connecting SEQ 2031
Transport and Main Roads, Connecting SEQ 2031 – An Integrated Regional Transport Plan for South East Queensland, 2010
DRAF
T

Transport and land use integration in Brisbane city
Centres access hierarchy
The Brisbane CBD and city frame is the primary activity centre and public transport hub for SEQ. By 2031 the inner city will need several new rail stations. With many more trips to the CBD and inner city, through traffic will need to be minimised and much more space provided for pedestrians, cyclists and public transport.
Bowen Hills and Boggo Road/Park Road/Buranda will be sub-regional hubs for the inner city with multiple high-frequency ‘turn up and go’ public transport services converging at these locations. They will be major interchange locations in the network, allowing passengers to transfer to access multiple destinations across the inner city and greater Brisbane.
Upper Mount Gravatt, Indooroopilly and Chermside are designated as sub-regional hubs due to the existing momentum of development, mixed use and employment in those locations and the convergence of several high-frequency priority public transport corridors. These sub-regional hubs should be the focus for encouraging clustering of public transport contestable employment outside the inner city.
Increasing densities along transit corridors
The policy for urban redevelopment in Brisbane relies on high-frequency public transport services linking multiple precincts of higher density residential areas, major employment locations, major hospitals and universities.
Some areas along rail lines and busways contain character housing or other important cultural heritage features making them unsuitable for redevelopment.
However, there are many parts of the city where regeneration can occur in tandem with increased investment in the UrbanLink services, busways and high-frequency bus corridors.
'Priority transit corridors' have been identified in inner Brisbane to connect a large number of specialist and general employment precincts and other major destinations such as universities and hospitals.
These priority transit corridors are where land use planning is significantly advanced and building stock is predominantly of redevelopment age, enabling land use change in the short term.
In later years of Connecting SEQ 2031, land use mix and densification is also strongly advocated along:
• the Eastern Busway corridor to Carindale
• Northern Busway corridor to Chermside
• along the rail corridor between Carseldine and Strathpine
Implementation will be subject to further detailed land use planning in partnership with local government.
The proposed additional rail corridor from Alderley to Strathpine will provide opportunities to increase densities and develop a priority transit corridor near stations.
The centres access hierarchy and transit corridors for focusing higher density residential development are illustrated in Map 9.1.
Accessible business and industry areas
The SEQ Regional Plan establishes accessible enterprise precincts at Australia TradeCoast, South West Industrial Gateway, Rochedale and the Northern Industrial Region. These areas will be the focus for business and industry that needs good access to the priority freight network. Industry expansion at Acacia Ridge will be minimised due to the need to protect the inter-modal freight terminal from local congestion, and the limited opportunity to expand the traffic capacity of the Brisbane Urban Corridor.
Brisbane City Council
PART D - What it means for your community 77
Transport and Main Roads, Connecting SEQ 2031 – An Integrated Regional Transport Plan for South East Queensland, 2010
DRAF
T

South West Industrial Gateway
Meadowbrook Uni/TAFE/Hospital
Darra
Logan City Council
Redland City Council
Moreton Bay Regional Council
Logan City Council
Gri�th University
Yeerongpilly
Stones Corner
Woolloongabba
Newstead
SouthbankSouth Bne
Herston / Kelvin Grove
Bowen Hills
Port of Brisbane
Alderley
Albion
Brisbane AirportNorthern Industrial Gateway
Carseldine
Brendale
Petrie
UQ
Boggo Rd /Buranda
Ferny Grove
The Gap
Ipswich City Council
Moreton Bay Regional Council
Shorncli�e
Carindale
Capalaba
Eight Mile Plains / Rochedale
Logan Central
Upper Mt Gravatt
Springwood
Browns Plains
Logan Hyperdome
Indooroopilly
Kenmore
Toowong
Mitchelton
Toombul / Nundah
Wynnum Central
Strathpine
North Lakes
Redclie
Chermside
CBD
5%
75%
10%
10%
2006 2031 Targets
3.5 million trips/day
4.3 million trips/day
Modeshare
56%
20%
13%
11%
78%
10.3%
1.1%10.6%
2031 Brisbane CBD journey to work targets
KEYMotorway
Major road
Railway
Existing and committed busway
Future busway or on-road bus priority
Urban footprint
Principal activity centre
Major activity centre
Accessible business & industry area
Regional hub
Sub-regional hub
District hub
Priority transit corridor
Transit corridor (post 2021)
Map not to scale
Fitzgibbon
Map 9.1 – 2031 transport and land use integration in Brisbane city
78 Draft Connecting SEQ 2031
Transport and Main Roads, Connecting SEQ 2031 – An Integrated Regional Transport Plan for South East Queensland, 2010
DRAF
T

2031 transport network
Public transport
With significant investment in rail as the backbone of the public transport network, Brisbane’s urban rail network will be separated into two networks:
• a high-frequency UrbanLink network using higher capacity trains that carry more passengers and have more doors to allow faster boarding/exiting
• an ExpressLink network with services connecting the principal activity centres of Cleveland, Caboolture, Beenleigh and Ipswich as well as other rail termini including Ripley, Kippa-Ring, Ormeau and Flagstone. These services will run all stops to a change point where they meet the UrbanLink network, and then run express to give passengers a rapid connection to Brisbane CBD.
Delivery of Cross River Rail will allow services to be increased across the entire SEQ rail network as well as providing new inner city rail stations, enabling rail passengers to get closer to their destination. The addition of a rail corridor from Alderley to Strathpine will provide communities in the north-west of the city with a high quality public transport service and support urban regeneration where appropriate.
To support high levels of population and employment growth in inner Brisbane, a new subway is proposed from Toowong to Newstead.
The Brisbane subway will be separate to the existing rail network with the ability to operate at steeper grades and tighter turning circles making it easier to implement in the dense urban fabric of Brisbane city. A new Toowong to West End green bridge will be used for public and active transport.
An extension of Doomben rail line to Hamilton North Shore should be preserved as an option for future transport solutions.
The extension of the Northern Busway to Kedron and the Eastern busway to Coorparoo are under way. Planning is underway to extend the Northern Busway to Bracken Ridge and the Eastern Busway to Capalaba. Interim bus priority treatments will also be considered.
TransLink will continue to roll out high-frequency ‘turn up and go’ UrbanLink bus services on radial and cross-town routes. These routes will be packaged with improvements to bus stops and bus priority on the road network where needed to provide faster and more reliable bus travel times.
Green bridges will also be used to provide river crossings for public transport, cyclists and pedestrians.
Ferry services
The current network of ferry services including the CityCat and cross river ferry network are operated and managed by Brisbane City Council.
Ferry services play a relatively minor role in the total transportation task for SEQ. The ferry network does strongly enhance the livability and connectivity of the inner Brisbane transport network by providing access to many areas which are challenging to access by other forms of public transport.
Active transport
Active transport infrastructure will be provided to the inner-city and centres, supported with end-of-trip facilities to encourage significant growth in commuter cycling.
Linking active transport to ‘healthy and active’ messages to combat growing health problems presents significant potential to deliver broader benefits to the community, while also addressing oil dependence, congestion and environmental issues.
New green bridges will provide additional river crossings for cyclists and pedestrians.
Roads
Significant employment growth coupled with commercial and residential development in inner city Brisbane means governments will need to work together to remove traffic from inner city suburbs and increase the space for pedestrians, cyclists and public transport.
Part of the solution will be completing the orbital road network for Brisbane, providing motorists with alternative routes that do not require them to pass through inner city suburbs.
Brisbane City Council will also continue development of its strategic TransApex program of road tunnels to reduce traffic passing through the Brisbane CBD, and upgrading Kingsford Smith Drive arterial road to improve freight access to the northern sector of the Australia Trade Coast.
This will provide strong support for the policy of ‘trucks off suburban roads’ which seeks to remove a high proportion of the 340 000 large truck movements made in the metropolitan area each day on suburban roads.
Maps 9.2 and 9.3 show the 2031 strategic projects for Brisbane city.
Partnering with Brisbane City Council
• updating planning policies and regulations to allow increased densities in priority transit corridors located along urban rail and busway corridors
• supporting the high public transport targets to the CBD and frame through traffic management, land use planning and parking policies
• providing western bus priority from Kenmore to CBD in parallel with delivery of Northern Link tunnel
• delivering community boulevards along older arterials when through traffic is moved to a new major road
• providing more facilities for pedestrians, cyclists and buses in the CBD and city frame
• providing safe cycle routes on the north side of Brisbane and to the CBD.
Brisbane City Council
PART D - What it means for your community 79
Transport and Main Roads, Connecting SEQ 2031 – An Integrated Regional Transport Plan for South East Queensland, 2010
DRAF
T

25
22
11
16
3
8
11
11
4
9
27
39
18
18
16
16
23
11
11
14
11
12
11
11
11
11
29
6
24
23
15
11
5
33
21
20
19
1617
23
35
1
7
12
2
1116
36
30
30
31
13
30
26
3640
10
38
28
24
38
23
43
41
42
23
South West Industrial Gateway
Meadowbrook Uni/TAFE/Hospital
Darra
Gri�th University
Yeerongpilly
Stones Corner
Newstead
Herston / Kelvin Grove
Port of Brisbane
Alderley
Albion
Brisbane Airport
Northern Industrial Gateway
Carseldine
Brendale
Petrie
UQ
Ferny Grove
The Gap
Newmarket
Fitzgibbon
Bulimba
Acacia RidgeRichlands
Centenary Highway: managed motorways corridor (bus priority on motorway ramps)
Mt Ommaney
Chandler
Tingalpa
Northgate
Nudgee
Fair�eld
22
11
16
3
4
16
11
11
11
11
33
32
161734
7
2
1116
36
30
13 38
Yeerongpilly
Stones Corner
Newstead
Herston / Kelvin Grove
Alderley
Albion
UQ
Newmarket
Bulimba
Fair�eld
Indooroopilly
Toowong
MitcheltonToombul / Nundah
CBD
8
44Bowen Hills
11
Carindale
Capalaba
Eight Mile Plains / Rochedale
Logan Central
Upper Mt Gravatt
Springwood
Logan Hyperdome
Indooroopilly
MitcheltonToombul / Nundah
Wynnum Central
Strathpine
North Lakes
Redcli e
Chermside
Browns Plains
Map not to scale
Existing motorway
Existing major road
Existing rail
Existing busway
Proposed strategic road corridor
Proposed strategic railway
Proposed strategic bus corridor
Proposed strategic active transport corridor
Proposed strategic freight corridor
Enhanced existing corridor
Transport network investigation
Key long term opportunity (post 2031)
Major park ‘n’ ride
Principal activity centre
Major activity centre
Regional hub
Sub-regional hub
District hub
KEY
See Map 9.3
Gateway & Logan Motorways: managed motorways corridor (freight priority on motorway ramps)
Moreton Bay Regional Council
Logan City Council
Ipswich City Council
Logan City Council
Redland City Council
Map 9.2 – 2031 strategic projects Brisbane city
80 Draft Connecting SEQ 2031
Transport and Main Roads, Connecting SEQ 2031 – An Integrated Regional Transport Plan for South East Queensland, 2010
DRAF
T

Map 9.3 - 2031 strategic projects inner city Brisbane
32
3
11
4
16
17
11
11
11
11
11
11
16
16
16
2234
11
8
40
16
161634
35
12
2
35
7
7
30
30
13
44
1137
36
26
16
28
Albion
Bowen Hills
Alderley
Toombul / Nundah
Herston / Kelvin Grove
Newstead
Toowong
Southbank
CBD
Woolloongabba
Boggo Rd /Buranda
UQStones Corner
Yeerongpilly
Indooroopilly
Mitchelton
Newmarket
Bulimba
Morningside
West End
Coorparoo
Fair�eld
Existing motorway
Existing major road
Existing rail line
Existing busway
Proposed strategic road corridor
Proposed strategic railway
Proposed strategic bus corridor
Proposed strategic active transport corridor
Proposed strategic freight corridor
Enhanced existing corridor
Transport network investigation
Major park ‘n’ ride
KEY
Summary list of projects
B1 North-west motorway from Everton Park to Bruce Highway to complete the orbital motorway network (potentially in tunnel)
B2 Airport Link from Kedron to Brisbane Airport (in tunnel)
B3 Western Orbital Motorway from Toowong to Everton Park (in tunnel)
B4 Northern Link from Toowong to Kelvin Grove (in tunnel)
B5 Tilley Road extension from Lindum to Mt Gravatt-Capalaba
B6 Kenmore bypass from Centenary Motorway to Moggill Road
B7 Cross River Rail
B8 North-west rail corridor from Strathpine to Alderley and possible connection to Cross River Rail (in tunnel)
B9 Darra to Springfield rail line
B10 Passenger rail service on interstate rail corridor Salisbury to Flagstone
B11 Strategic bus/HOV priority corridors packaged with UrbanLink bus services
B12 Busway from Kedron to Bracken Ridge
B13 Victoria Bridge Bus Access improvements
B28 Upgrade Ipswich Motorway from Dinmore to Darra
B29 Upgrade Port of Brisbane Motorway
B30 Rail freight improvements from Acacia Ridge to Port of Brisbane
B31 Enhance Paradise Road corridor for strategic freight movement
B32 Investigate green bridge from Bulimba to Newstead
B33 Investigate Stafford Road as motorway option (in tunnel)
B34 Investigate green bridge from West End to UQ/St Lucia (pedestrian and cycle)
B35 Investigate Brisbane subway from Toowong to Newstead/Bowen Hills via West End and city (potentially in tunnel)
B36 Investigate Brisbane subway from Bowen Hills to Airport village via Hamilton/Northshore (potentially in tunnel)
B37 Investigate green bridge from Kangaroo Point to city
B38 Plan upgrades to Ipswich Motorway from Darra to Rocklea
B39 Upgrades to Pacific Motorway from Gateway Motorway to Logan Motorway
B40 Preserve rail corridor to Hamilton/Northshore
B41 Ferny Grove major park ‘n’ ride
B42 Chandler major park ‘n’ ride
B43 Richlands major park ‘n’ ride
B44 Upgrades to Kingsford Smith Drive
B14 Busway from Coorparoo to Capalaba
B15 Extension of South East Busway to Springwood
B16 Strategic active transport corridors
B17 Investigate green bridge from Toowong to West End Bridge
B18 Upgrade of Gateway Motorway
B19 Urban arterial upgrade from Strathpine to Carseldine
B20 Upgrade to urban arterial from Albany Creek to Aspley
B21 Upgrade to urban arterial from Strathpine to Albany Creek
B22 Upgrade Stafford Road as urban arterial
B23 Passenger rail upgrades; Eagle Junction to Domestic Airport; Manly to Cleveland; Darra to Redbank; Sandgate to Shorncliffe; Kuraby to Beenleigh
B24 Safety upgrades to Brisbane Urban Corridor
B25 Upgrade Redland sub-arterial road
B26 Upgrade Centenary Motorway from Toowong roundabout to Springfield
B27 Upgrade Logan Motorway from Ipswich Motorway to Pacific Motorway
Note: responsibility for delivery of these projects is to be determined
PART D - What it means for your community 81
Transport and Main Roads, Connecting SEQ 2031 – An Integrated Regional Transport Plan for South East Queensland, 2010
DRAF
T

Ipswich City Council
Population in 2006: 142 400
Indicative planning population in 2031: 435 000
Dwellings in 2006: 52 000
Forecast additional dwellings in 2031: 118 000
Daily trips by residents in 2006: 498 000
Daily trips by residents in 2031: 1 520 000
Note: these figures do not include increased population for Ripley identified as part of the Queensland Growth Management Summit
Ipswich City Council is the western gateway to the region and is forecast to experience the fastest rate of growth in SEQ, with population increasing by 206% between 2006 and 2031. This means the population will triple in about two decades. Transport improvements will be central in determining how well growth is accommodated and how employment and industry development occurs locally to support the population growth.
Population growth will be accommodated mainly in new development areas including Springfield, Springfield Lakes, Augustine Heights, Bellbird Park, Redbank Plains, Ripley, Yamanto, Redbank, Riverview, Bundamba, East Ipswich and Wulkuraka.
There will also be some infill development in the corridor from the University of Queensland Ipswich Campus to Brassall.
The city centres of Ipswich and Springfield will be the focus for business and community services, with the emerging town centre of Ripley increased in importance as the population of Ripley grows.
Major employment growth areas include Ebenezer/Willowbank, Swanbank, New Chum, Bundamba, and Wulkuraka industrial area, Carole Park, the Royal Australia Air Force Base Amberley and the Amberley Aerospace and Defence Support centre and the Ipswich Motorsport Precinct.
Quick transport facts on Ipswich city
• low public transport mode share with 6.5% of daily trips and 10.2% of work trips by public transport
• high car dependency with 83% of trips by private vehicle
• 8% of households do not have a car
• 36% of residents do not have a driver’s licence
• 64% of residents travel more than 10km to work, with the average commute trip 18 kilometres long.
Figure 9.6 – 2008 journey to work trip length
SEQ<3km <5km <10km <20km <30km >30km
13% 23% 46% 75% 89% 11%
Ipswich<3km <5km <10km <20km <30km >30km
9% 19% 36% 61% 80% 20%
Walk/Cycle, 10.2%
Vehicle driver, 56.9%
Vehicle passenger, 26.4%
Public transport, 6.5%
Figure 9.7 – current mode share
82 Draft Connecting SEQ 2031
Transport and Main Roads, Connecting SEQ 2031 – An Integrated Regional Transport Plan for South East Queensland, 2010
DRAF
T

Transport issues and challenges for the city of Ipswich
• daily trips made by Ipswich residents will triple from 500 000 in 2006 to 1.52 million in 2031
• providing adequate transport infrastructure to keep pace with rapid population growth
• increasing congestion on the road network will impact on freight and commercial vehicle movements
• increasing pressure on road network capacity due to population growth and high car dependency
• supporting growth in local jobs so local employment opportunities are available for residents
• staging of new urban development to manage population growth and allow adequate provision of transport infrastructure and public transport services early in new development areas
• encouraging more trips by public and active transport for travel to Ipswich CBD as it grows in importance as a service and employment centre.
2031 targets
With high levels of population growth forecast for Ipswich, increasing the share of public and active transport will be important to help manage growth in travel demand.
The 2031 transport targets for Ipswich city aim to reduce the share of trips made by private car from 83.3% to 70%. This will consist of an:
• increase in the share of trips by public transport from 6.5% to 12%, taking daily trips from 33 000 in 2006 to 185 000 in 2031 (460% increase)
• increase in the share of trips by walking from 9.5% to 11%
• increase in the share of trips by cycling from 0.7% to 7%.
This would still see the number of daily private car trips increase by 165%, from 415 000 in 2006 to 1.1 million in 2031.
Transport and land use integration
Centres access hierarchy
Ipswich CBD is the regional hub for the western corridor and provides an interchange point between rail and bus services. Ipswich CBD is a focus of the SEQ Regional Plan as an alternative major business location to the Brisbane CBD.
Springfield is designated as the sub-regional hub and will develop into a major retail, tertiary education and employment centre. It will be linked to destinations in Brisbane city by the frequent UrbanLink services. There will also be frequent bus services linking Springfield to Ipswich, Goodna and Ripley.
Ripley, Amberley and Goodna are designated as district hubs. Ripley town centre will ultimately accommodate a large number of jobs and will be upgraded to a sub-regional hub, when population and employment numbers increase.
Increasing employment density around transit corridors
The priority transit corridor for Ipswich is between the University of Queensland Ipswich Campus and Brassall via the Ipswich CBD and Riverlink shopping centre. A high-frequency public transport service will be provided all day, seven days a week to link multiple destinations along this corridor.
The new rail line to Springfield will be completed by 2013. To support the new rail corridor from Ripley to Ipswich after 2021, Ripley will be master planned to ensure land use mix and densification occurs around the future rail stations. In the longer term a transit corridor may be established along the existing rail line between Ipswich and Goodna.
Land use density and mix should also be generally supported within 400-800 metres of public transport stations or stops along high-frequency public transport corridors.
Accessible enterprise precincts
Business and industry areas with good access to the priority freight routes are Redbank, Riverview/Bundamba, New Chum, Swanbank, Purga and Ebenezer/Willowbank. Amberley Aerospace Park will be provided with quality road and public transport access as it will have both office jobs and requirement for heavy vehicle access.
Public Transport Walking Cycling Car
2006 Actual
2031 Target
2006 Actual
2031 Target
2006 Actual
2031 Target
2006 Actual
2031 Target
All trips 6.5% 12% 9.5% 11% 0.7% 7% 83.3% 70%
Work trips 8.6% 17%
Figure 9.8 – average composition of 25 trips made per person each week
20062
trips1
trip22 trips
2031 targets 4 trips 2.5 trips 18.5 trips
To achieve these targets, the weekly travel patterns of the average Ipswich resident would only need to change incrementally.
Ipswich City Council
PART D - What it means for your community 83
Transport and Main Roads, Connecting SEQ 2031 – An Integrated Regional Transport Plan for South East Queensland, 2010
DRAF
T

Mar
burg
Eben
ezer
&
Will
owba
nk
Am
berle
y
Purg
aRi
pley
Ipsw
ich
Spri
ng�e
ld
Goo
dna
Swan
bank
Redb
ank
Rive
rvie
w &
Bu
ndam
ba
Rose
woo
d
New
Chu
mCa
role
Par
k
Wul
kura
ka
Dar
ra
Bras
sall
2006
2031
Tar
gets
0.5
mill
ion
trip
s/da
y
1.52
mill
ion
trip
s/da
yM
odes
hare
70%
12%
11%
7%
83.3
%
6.5%
0.7%
9.5%
2031
Ipsw
ich
CBD
Jo
urne
y to
Wor
k Ta
rget
s
66%
25%
7% 2%
KEY
Mot
orw
ay
Maj
or ro
ad
Rail
line
Urb
an fo
otpr
int
Prin
cipa
l act
ivity
cen
tre
Maj
or a
ctiv
ity c
entr
e
Acce
ssib
le b
usin
ess
& in
dust
ry a
rea
Regi
onal
hub
Sub-
regi
onal
hub
Dis
tric
t hub
Prio
rity
tran
sit c
orrid
or
Tran
sit c
orrid
or
Map
Not
to S
cale
2031
Tra
nspo
rt a
nd la
nd u
se in
tegr
atio
n Ip
swic
hMap 9.4 - 2031 Transport and Land use Integration Ipswich
84 Draft Connecting SEQ 2031
Transport and Main Roads, Connecting SEQ 2031 – An Integrated Regional Transport Plan for South East Queensland, 2010
DRAF
T

2031 transport network
An improved rail network is the centrepiece of the future transport network for Ipswich city. A new rail line from Darra to Springfield will link new communities to Brisbane city by 2013.
UrbanLink rail services will operate from Springfield to Brisbane, providing a high-frequency service all day.
The new Ipswich to Ripley line will link the major emerging Ripley community to the principal regional activity centre of Ipswich by 2031. This is consistent with Ipswich City Council planning priorities to ensure development in Ripley that supports employment and government services in Ipswich. This will support local employment growth and reduce overall travel. A rail connection from Ripley to Springfield is a longer term opportunity.
ExpressLink rail services will provide fast travel times between Ipswich CBD and central Brisbane of about 45 minutes, and to Brisbane Airport in just over an hour. This will support growth of Ipswich CBD into a sophisticated employment centre of regional significance.
There will also be high-frequency UrbanLink bus services packaged with bus priority facilities to provide access from the residential communities to the rail stations and activity centres within Ipswich city, supported by an upgraded local bus network.
Substantial revitalisation and employment growth is planned for Ipswich CBD. To support the redevelopment of Ipswich CBD an inner ring road network will be completed, allowing a stronger focus on public and active transport in the city centre.
Much of the population growth in Ipswich city will be in new communities. Creating a quality urban arterial network that caters for active transport, buses and private vehicles will support local travel by sustainable transport modes. Priority for buses will be provided on bus routes where it is needed, to deliver reliable travel times.
Provision of active transport infrastructure within five kilometres of Ipswich CBD, Springfield and Ripley will be prioritised. Key strategic active transport corridors connecting these major centres will also be planned and prioritised.
The Southern Freight Rail corridor will be preserved from Rosewood to the interstate rail line at Kagaru to ensure a future connection can be provided if the inland rail project is progressed. This line would also link the Ebenezer strategic inter-modal freight terminal to the freight rail network.
Map 9.5 shows the 2031 strategic transport network for Ipswich city.
Partnering with Ipswich City Council
• supporting redevelopment along the north–south corridor between Brassall and University of Queensland Ipswich Campus
• supporting redevelopment of Ipswich CBD, an inner ring road and redeveloped rail station complex
• focusing on achieving higher public transport, cycling and walking mode share for travel to Ipswich CBD through supportive land use planning, traffic management and car parking policies
• ensuring the Ipswich city planning scheme requires medium density mixed use development around stations along the future rail corridor between Ripley and Ipswich
• providing active transport facilities within five kilometres of Ipswich, Ripley and Springfield town centres
• ensuring local road upgrades consider bus and active transport needs, particularly on designated high-frequency bus routes
• protecting land around accessible enterprise areas from incompatible land uses (for example residential, retail).
Ipswich City Council
PART D - What it means for your community 85
Transport and Main Roads, Connecting SEQ 2031 – An Integrated Regional Transport Plan for South East Queensland, 2010
DRAF
T

Map 9.5 - 2031 Strategic projects Ipswich
3
11
7
6
4
1
6
6
6
7 7
7
7
8 9
12
10
17
2
15
5
16
13
14
9
18
19
2021
Marburg
Ebenezer & Willowbank
Amberley
Purga Ripley
Ipswich
Spring�eld
Goodna
Swanbank
RedbankRiverview & Bundamba
Rosewood
New ChumCarole Park
Wulkuraka
Darra
Brassall
Keidges Rd
DinmoreRichlands
Walloon
Map Not to Scale
Existing motorway
Existing major road
Existing rail
Proposed strategic road corridor
Proposed strategic railway corridor
Proposed strategic bus corridor
Proposed strategic active transport corridor
Enhanced existing corridor
Transport network investigation
KEYPreserve corridor for long-term opportunity
Major park ‘n’ ride
Principal activity centre
Major activity centre
Regional hub
Sub-regional hub
District hub
Summary list of projects
I 1 Western Ipswich Bypass
I 2 Ring road around Ipswich CBD including upgrading existing roads and extension of Norman Street to provide an additional crossing of Bremer River
I 3 Cunningham Highway to Warrego Highway connection
I 4 Ipswich to Ripley rail line
I 5 Darra to Springfield rail line
I 6 Strategic bus/HOV priority corridors packaged with UrbanLink bus services
I 7 Strategic active transport corridors
I 8 Upgrade of Warrego Highway and Brisbane Valley Highway interchange
I 9 Upgrade Warrego Highway between Ipswich and Gatton
I 10 Upgrade Ipswich Motorway from Dinmore to Darra
I 11 Upgrade of Cunningham Highway from Ripley Road to Ebenezer
I 12 Upgrade Centenary Highway Toowong to Ipswich Motorway (M5)
I 13 Upgrade Centenary Highway Logan Motorway to Springfield (M5)
I 14 Upgrade Centenary Highway from Springfield to Cunningham Highway
I 15 Upgrade to urban arterial from Springfield to Greenbank
I 16 Ripley to Springfield passenger rail, preserve corridor
I 17 Preserve Southern Freight Rail Corridor from Rosewood to Kagaru
I 18 Keidges Road major park ‘n’ ride
I 19 Dinmore Road major park ‘n’ ride
I 20 Walloon Road major park ‘n’ ride
I 21 New Ipswich rail station
Note: responsibility for delivery of these projects is to be determined
86 Draft Connecting SEQ 2031
Transport and Main Roads, Connecting SEQ 2031 – An Integrated Regional Transport Plan for South East Queensland, 2010
DRAF
T

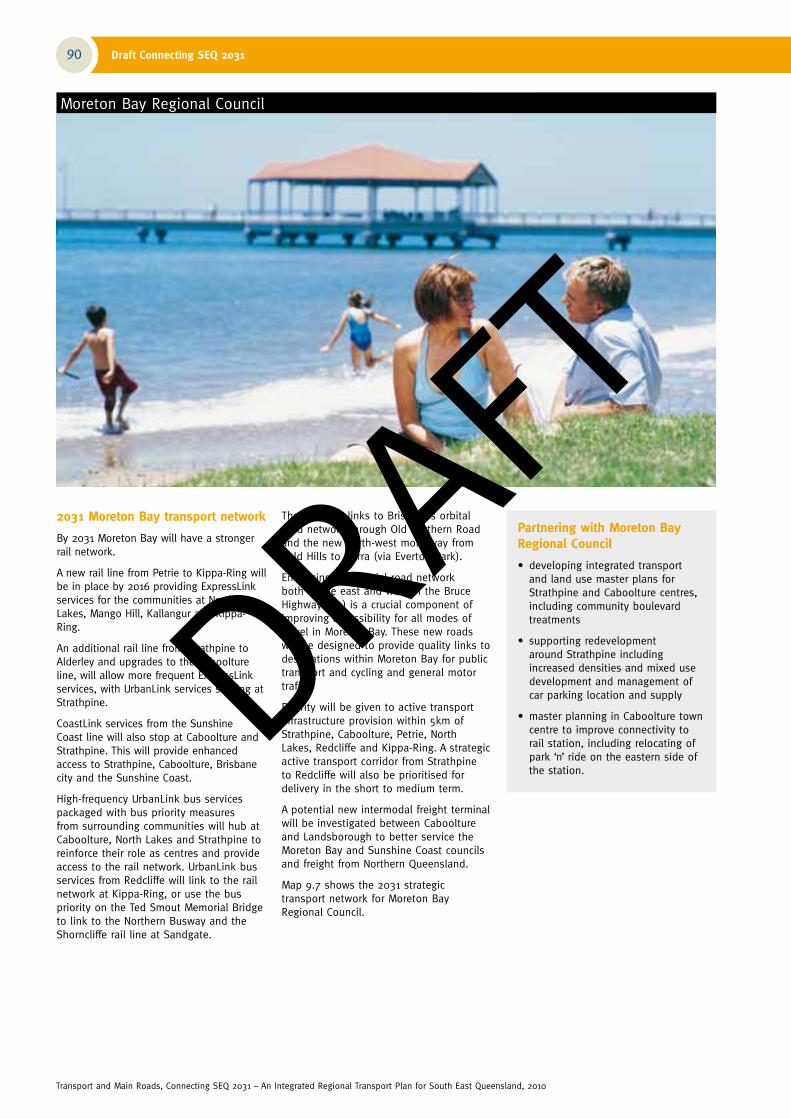
Moreton Bay Regional Council
Population in 2006: 333 000
Indicative planning population in 2031: 513 000
Dwellings in 2006: 123 900
Forecast additional dwellings in 2031: 84 000
Daily trips by residents in 2006: 1 165 000
Daily trips by residents in 2031: 1 830 000
The population of Moreton Bay Regional Council will increase from 333 000 in 2006 to 513 000 in 2031 – an increase of 54%. Most of the population growth will be in new development areas, particularly around Mango Hill, North Lakes, Griffin and Narangba.
Caboolture and Strathpine will be the focus for business and employment. North Lakes and Redcliffe will also develop as major activity centres.
Further industrial employment growth will occur through expansion of the existing enterprise areas at Burpengary, Morayfield, Brendale and Caboolture.
Transport improvements to accommodate growth and ensure reliable links to Brisbane will be an important feature of the draft Connecting SEQ 2031 plan.
They will reduce dependence on car transport and expand the local transport network so there is less reliance on the Bruce Highway (M1) for local trips.
Quick transport facts about Moreton Bay Regional Council
• approximately 50% of work destinations are outside the local government area
• low public transport mode share of 6.2%
• long commute distances with 69% of work trips longer than 10km and 21% longer than 30 kilometres
• the average commute trip is 20.3 kilometres long
• 31% of the population do not have a driver’s licence.
Figure 9.9 – 2008 journey to work trip length
SEQ<3km <5km <10km <20km <30km >30km
13% 23% 46% 75% 89% 11%
Moreton Bay
<3km <5km <10km <20km <30km >30km
10% 18% 31% 57% 79% 21%
Walk/Cycle, 10.6%
Vehicle driver, 57.1%
Vehicle passenger, 26.1%
Public transport, 6.2%
Figure 9.10 – current mode share
PART D - What it means for your community 87
Transport and Main Roads, Connecting SEQ 2031 – An Integrated Regional Transport Plan for South East Queensland, 2010
DRAF
T

Transport issues and challenges in Moreton Bay
• daily trips made by Moreton Bay residents will increase by 56% from 1.17 million in 2006 to 1.83 million in 2031
• dispersed land uses and low residential density, together with high car availability and inexpensive parking, encourage private vehicle use
• strong local employment growth is needed to prevent a future shortfall in jobs and offer employment diversity for residents
• poorly connected arterial road network, with heavy reliance on the Bruce Highway (M1) for local trips
• limited crossings of the Pine River reinforce reliance on the Bruce Highway
• lack of transport infrastructure and services for rapidly developing new communities
• current urban form of Caboolture/Morayfield and Strathpine does not encourage active transport or allow easy servicing by public transport
• capacity constraints on the Caboolture rail line, particularly for increasing peak express services to the Brisbane CBD.
2031 targets
The 2031 transport targets aim to reduce the share of trips made by private car from 83.2% to 70%, through an:
• increase in the share of trips by public transport from 6.2% to 11%, taking daily trips from 72 000 in 2006 to 190 000 in 2031
• increase in the share of trips by walking from 8.9% to 11%
• increase in the share of trips by cycling from 1.7% to 8%.
This would still see private car trips increase from 970 000 in 2006 to 1.3 million in 2031.
Transport and land use integration
Strathpine is designated as the sub-regional hub and will be the hub for rail services from Sunshine Coast, Caboolture, Brisbane city and Kippa-Ring. Local bus services will use Strathpine as a hub. Caboolture, Petrie and North Lakes will be district hubs and Caboolture will continue to be the terminus for the ExpressLink rail services.
Caboolture is currently a Principal Activity Centre under the SEQ Regional Plan and will continue to be the focus for health and business services.
Improved centre planning in Caboolture will support a walkable town centre with improved access to the rail station. Moreton Bay Regional Council and the Queensland Government are working in partnership to develop masterplans for Caboolture and Strathpine. Relocation of the park ‘n’ ride facilities to the east of Caboolture rail station will allow for transit supportive redevelopment close to the station.
The car-oriented strip development and ‘big box’ retail at Morayfield is not suited to encouraging a high intensity of employment or supporting public and active transport use and will not be a strong focus for increased public transport services.
Increasing densities along transit corridors
Planning for urban arterial road corridors east of the Bruce Highway and west of Strathpine may provide an opportunity to progressively redevelop Gympie Road through Strathpine to a mixed mode community boulevard for a redeveloped and expanded Strathpine town centre. Implementation will be subject to further detailed land use and transport planning in partnership with local government.
Land use density and mix is generally supported within 400-800 metres of all other public transport stations or stops along high public transport corridors.
Accessible enterprise precincts
Caboolture Airport, Burpengary, Narangba Business Park, Elimbah East and Brendale Industrial Area will have a high standard of access to priority freight routes. Freight movement will be supported by the upgrade and delivery of managed motorways initiatives on the Bruce Highway (M1).
Public Transport Walking Cycling Car
2006 Actual
2031 Target
2006 Actual
2031 Target
2006 Actual
2031 Target
2006 Actual
2031 Target
All trips 6.2% 11% 8.9% 11% 1.7% 8% 83.2% 70%
Work trips 7.10% 22%
Figure 9.11 – average composition of 25 trips made per person each week in Moreton Bay
20062
trips1.5
trips21.5 trips
2031targets 4 trips 2.5 trips 18.5 trips
To achieve the 2031 targets, the weekly travel patterns of the average Moreton Bay resident would need to change only incrementally.
Moreton Bay Regional Council
88 Draft Connecting SEQ 2031
Transport and Main Roads, Connecting SEQ 2031 – An Integrated Regional Transport Plan for South East Queensland, 2010
DRAF
T

Map 9.6 – 2031 transport and land use Integration Moreton Bay
Caboolture Airport
Murrumba Downs
Petrie
Bray Park
Burpengary
Dakabin
Rothwell
Moray�eld
CabooltureWest
Newport
Gri�n
LawntonJoyner
Warner
Mango Hill
Brendale
Carseldine
Northern Industrial Region
Brisbane Airport
Albany Creek
Bribie Island
Kallangur
ScarboroughNarangba
Dayboro
Elimbah East
Strathpine
Chermside
North Lakes Redclie
Caboolture
70%
11%
11%
83.2%
6.2%8%
1.7%8.9%
2006 2031 Targets
1.17 million trips/day
1.83 million trips/day
Modeshare
Sunshine Coast Regional Council
Brisbane City Council
KEYMotorway
Major road
Rail line
Busway or bus priority
Urban footprint
Principal activity centre
Major activity centre
Accessible business & industry area
Regional hub
Sub-regional hub
District hub
Priority transit corridor
Transit corridor (post 2021)
Map not to scale
Moreton
Bay
PART D - What it means for your community 89
Transport and Main Roads, Connecting SEQ 2031 – An Integrated Regional Transport Plan for South East Queensland, 2010
DRAF
T
2031 Moreton Bay transport network
By 2031 Moreton Bay will have a stronger rail network.
A new rail line from Petrie to Kippa-Ring will be in place by 2016 providing ExpressLink services for the communities at North Lakes, Mango Hill, Kallangur and Kippa-Ring.
An additional rail line from Strathpine to Alderley and upgrades to the Caboolture line, will allow more frequent ExpressLink services, with UrbanLink services starting at Strathpine.
CoastLink services from the Sunshine Coast line will also stop at Caboolture and Strathpine. This will provide enhanced access to Strathpine, Caboolture, Brisbane city and the Sunshine Coast.
High-frequency UrbanLink bus services packaged with bus priority measures from surrounding communities will hub at Caboolture, North Lakes and Strathpine to reinforce their role as centres and provide access to the rail network. UrbanLink bus services from Redcliffe will link to the rail network at Kippa-Ring, or use the bus priority on the Ted Smout Memorial Bridge to link to the Northern Busway and the Shorncliffe rail line at Sandgate.
There will be links to Brisbane’s orbital road network through Old Northern Road and the new north-west motorway from Bald Hills to Darra (via Everton Park).
Enhancing the arterial road network both to the east and west of the Bruce Highway (M1) is a crucial component of improving accessibility for all modes of travel in Moreton Bay. These new roads will be designed to provide quality links to destinations within Moreton Bay for public transport and cycling and general motor traffic.
Priority will be given to active transport infrastructure provision within 5km of Strathpine, Caboolture, Petrie, North Lakes, Redcliffe and Kippa-Ring. A strategic active transport corridor from Strathpine to Redcliffe will also be prioritised for delivery in the short to medium term.
A potential new intermodal freight terminal will be investigated between Caboolture and Landsborough to better service the Moreton Bay and Sunshine Coast councils and freight from Northern Queensland.
Map 9.7 shows the 2031 strategic transport network for Moreton Bay Regional Council.
Partnering with Moreton Bay Regional Council
• developing integrated transport and land use master plans for Strathpine and Caboolture centres, including community boulevard treatments
• supporting redevelopment around Strathpine including increased densities and mixed use development and management of car parking location and supply
• master planning in Caboolture town centre to improve connectivity to rail station, including relocating of park ‘n’ ride on the eastern side of the station.
Moreton Bay Regional Council
90 Draft Connecting SEQ 2031
Transport and Main Roads, Connecting SEQ 2031 – An Integrated Regional Transport Plan for South East Queensland, 2010
DRAF
T

Petrie
Burpengary
Dakabin
Rothwell
Morayeld
Caboolture West
Newport
Gri�n
Mango Hill
Brendale
Carseldine
Northern Industrial Region
Brisbane Airport
Albany Creek
Bribie Island
ScarboroughNarangba
Lawnton
Moreton
Bay
Caboolture Airport
Joyner
KippaRing
15
1515
5
16
9
4
17
10
11
12
3
2
8
3
14
4
13
7
6
8
6
33
3
1
12
19
18
Strathpine
Chermside
North LakesRedclie
Caboolture
Map not to scale
Existing motorway
Existing major road
Existing rail
Proposed strategic road corridor
Proposed strategic rail corridor
Proposed strategic bus corridor
Proposed strategic active transport corridor
Enhanced existing corridor
Transport network investigation
Major park ‘n’ ride
Principal activity centre
Major activity centre
Regional hub
Sub-regional hub
District hub
KEY
Brisbane City Council
Sunshine Coast Regional Council
Summary List of Projects
M1 North South Urban Arterial from Bruce Highway to Mango Hill
M2 Rail line from Petrie to Kippa-Ring
M3 Strategic bus/HOV priority corridors packaged with UrbanLink bus services
M4 Strategic active transport corridors
M5 Upgrade of Caboolture West connection (Bellmere Road)
M6 Upgrade Bruce Highway intersection at Pumicestone Road and Boundary Road
M7 Upgrade Caboolture–Bribie Island road
M8 Upgrade Caboolture to Redcliffe corridor to urban arterial
M9 Upgrade urban arterial from Morayfield to Upper Caboolture
M10 Upgrade rail line from Lawnton to Caboolture
M11 Urban arterial connection from West Moreton Bay arterial to Burpengary Road
M12 Upgrade road between Burpengary and Strathpine to urban arterial
M13 Upgrade road from Joyner to Strathpine to urban arterial
M14 Upgrade road from Strathpine to Albany Creek to urban arterial
M15 Investigate need for urban arterial network north of Caboolture
M16 Investigate improved urban connections for local trips in new growth areas
M17 Investigate east Moreton Bay urban arterial from Mango Hill to Caboolture–Bribie Island
M18 Major park 'n' ride at Caboolture North
M19 Major park 'n' ride at Kinsellas Road
Note: responsibility for delivery of these projects is to be determined
Map 9.7 – 2031 strategic projects Moreton Bay Regional Council
PART D - What it means for your community 91
Transport and Main Roads, Connecting SEQ 2031 – An Integrated Regional Transport Plan for South East Queensland, 2010
DRAF
T

Logan City Council
Population in 2006: 260 000
Indicative planning population in 2031: 434 000
Dwellings in 2006: 90 000
Forecast additional dwellings in 2031: 70 000
Daily trips by residents in 2006: 910 000
Daily trips by residents in 2031: 1 490 000
Note: these figures do not include increased population for Flagstone and Yarrabilba identified as part of the Queensland Growth Management Summit
Logan City Council covers a large area and includes the southern suburbs of greater Brisbane and the major growth areas to the north of Beaudesert.
Forecast growth of population from 260 000 in 2006 to 434 000 in 2031 will mean a population increase of 67%. In the short to medium-term population growth is expected to be focused around Park Ridge and Bahrs Scrub, adjacent to existing urban development. Beyond 2021 population growth will occur in the south-west, including new communities at Flagstone, Greenbank and Yarrabilba.
Logan City Council is pursuing employment growth and diversification to prevent a jobs shortfall by 2031. Historically, the Logan economy has comprised retail and manufacturing services. Logan City Council aims to significantly increase commercial and office based employment opportunities at Logan Central, Springwood and Beenleigh. New urban communities at Park Ridge, North Maclean, Flagstone and Yarrabilba will provide significant local employment and will require good access to the major industrial development area at Bromelton, in the neighbouring Scenic Rim Regional Council.
Quick transport facts on Logan City
• low public transport use, with 5.5% of daily and 7.1% of work trips by public transport
• long commute distances, with 44% of work trips longer than 20 kilometres, with the average commute trip 19.4 kilometres
• 7% of households do not have a car
• 34% of the population do not have a driver’s licence.
Figure 9.12 – 2008 journey to work trip length
SEQ<3km <5km <10km <20km <30km >30km
13% 23% 46% 75% 89% 11%
Logan city<3km <5km <10km <20km <30km >30km
9% 15% 29% 56% 80% 20%
Walk/Cycle, 8.7%
Vehicle driver, 58.3%
Vehicle passenger, 27.5%
Public transport, 5.5%
Figure 9.13 – current mode share
92 Draft Connecting SEQ 2031
Transport and Main Roads, Connecting SEQ 2031 – An Integrated Regional Transport Plan for South East Queensland, 2010
DRAF
T

Transport issues and challenges
• new road and public transport corridors will be required to service new communities
• need to improve links to Ipswich
• links need to be provided to major employment and industrial growth area at Bromelton in Scenic Rim Regional Council.
2031 targets
Logan city will experience a significant growth in travel demand with trips made by Logan city residents increasing by 64% from 910 000 trips per day in 2006 to 1.49 million trips per day in 2031.
The 2031 transport targets are to reduce the share of trips by private car from 85.8% to 73%, through an:
• increase in the share of trips by public transport from 5.5% to 10%, taking daily trips from 50 000 in 2006 to 140 000 in 2031
• increase in the share of trips by walking from 8.1% to 10%
• increase in the share of trips by cycling from 0.6% to 7%.
This would still see private car trips increase from 780 000 in 2006 to 1.1 million in 2031.
Public Transport Walking Cycling Car
2006 Actual
2031 Target
2006 Actual
2031 Target
2006 Actual
2031 Target
2006 Actual
2031 Target
All trips 5.5% 10% 8.1% 10% 0.6% 7% 85.8% 73%
Work trips 7.0% 22%
Transport and land use integration
Centres access hierarchy
Logan Central is a sub-regional hub and is the administration centre of the Logan City Council. It is located on the Beenleigh/Gold Coast rail line and has better land use characteristics to support public transport use than other centres in Logan.
Beenleigh, Springwood, Browns Plains and Meadowbrook will be district hubs.
The proposed major greenfield centres of Flagstone and Yarrabilba will be included in the centres access hierarchy as they develop.
Increasing densities around transit corridors
In later years of the plan, land use mix and densification is supported between Logan Central and the Meadowbrook TAFE/University/Hospital precinct. Implementation will be subject to further detailed land use planning in partnership with local government.
Land use density and mix is generally supported within 400-800m of all public transport stations or stops along the other priority public transport corridors.
Accessible enterprise precincts
Heavy industry should be encouraged to locate in Park Ridge as it has good access to the priority freight network.
Figure 9.14 – average composition of 25 trips made per person each week in Logan city
20062.5 trips
1.5 trips
21 trips
2031targets 4.5 trips
2.5 trips
18 trips
To achieve these targets, the weekly travel patterns of the average Logan city resident would need to change only incrementally
Logan City Council
PART D - What it means for your community 93
Transport and Main Roads, Connecting SEQ 2031 – An Integrated Regional Transport Plan for South East Queensland, 2010
DRAF
T

Jim
boom
ba
Yarr
abilb
a
Been
leig
h
Flag
ston
e
Spri
ng�e
ld
Loga
n Ce
ntra
l
Brow
ns P
lain
sH
yper
dom
e
Spri
ngw
ood
Gre
enba
nk
Park
Rid
ge
Mea
dow
broo
k U
ni/T
AFE
/Hos
pita
l
Yata
la
Berr
inba
/ Cr
estm
ead
Ipsw
ich
Bahr
s Sc
rub
Loga
n Vi
llage
2006
2031
Tar
gets
0.91
mill
ion
trip
s/da
y
1.49
mill
ion
trip
s/da
y
Mod
esha
re
73%
10%
10%
7%
85.8
%
5.5%
0.6%
8.1%
KEY
Mot
orw
ay
Maj
or ro
ad
Rail
line
Urb
an fo
otpr
int
Prin
cipa
l act
ivity
cen
tre
Maj
or a
ctiv
ity c
entr
e
Acce
ssib
le b
usin
ess
& in
dust
ry a
rea
Regi
onal
hub
Sub-
regi
onal
hub
Dis
tric
t hub
Prio
rity
tran
sit c
orrid
or
Tran
sit c
orrid
or
Map
not
to s
cale
Ipsw
ich
City
Co
unci
l
Gol
d Co
ast C
ity
Coun
cil
Redl
and
City
Co
unci
l
Scen
ic R
im
Regi
onal
Co
unci
l
Scen
ic R
im
Regi
onal
Co
unci
l
Map 9.8 - 2031 transport and land use integration Logan
94 Draft Connecting SEQ 2031
Transport and Main Roads, Connecting SEQ 2031 – An Integrated Regional Transport Plan for South East Queensland, 2010
DRAF
T

2031 transport network for Logan city
The passenger rail service is expected to extend from Salisbury to Flagstone by 2031 to service existing and new communities and will provide ExpressLink services to Brisbane. The extension of this line to Beaudesert is a longer term opportunity.
UrbanLink bus services will provide quality connections between activity centres at Logan Central, Springwood, Logan Hyperdome and Browns Plains. The extension of the South East Busway to Springwood will also provide benefits to residents travelling to destinations located on the busway network in Brisbane city.
There will also be an UrbanLink bus service from Yarrabilba to Ripley via Flagstone and Springfield. Bus services will link Yarrabilba to the rail network at Beenleigh and Loganlea.
There will also be a focus on improvements to the Logan Motorway and Mt Lindesay Highway to ensure the efficient movement of freight. Delivery of the Southern Freight Rail Corridor between Rosewood and Kagaru in conjunction with the Inland Rail project would enable standard gauge rail connections from western Queensland, the southern states and Ipswich industrial areas to Bromelton, Acacia Ridge and the Port of Brisbane.
New multi-modal arterial road corridors need to be planned and provided to all new population growth areas. Park ‘n’ ride access will also be provided at the edge of urban development to allow the dispersed semi-rural communities access to high standard public transport services.
A southern extension of the Gateway Motorway from the Logan Motorway to the Southern Infrastructure Corridor will provide access to the region's motorway network for new communities. This extension will also enable freight vehicles from the Park Ridge Enterprise Precinct improved access to the Port, Pacific Motorway and Ipswich Motorway. A corridor study will confirm the corridor alignment and timing.
The Southern Infrastructure Corridor is expected to be in place between Flagstone and Yarrabilba, with a corridor preserved from Yarrabilba to the Pacific Motorway.
A long-term road corridor from Flagstone to Bromelton will be preserved.
Improved active transport infrastructure will include a focus on routes within five kilometres of the centres of Logan Central, Springwood, Beenleigh and Browns Plains.
Map 9.9 shows the 2031 strategic transport network for Logan city.
Partnering with Logan City Council
• ensuring the planning scheme supports long-term change towards high density employment and mixed use development between Logan Central and Meadowbrook
• providing road and rail infrastructure to service the major new communities of Flagstone and Yarrabilba
• working to ensure appropriate transport network design and infrastructure charging before approving new development areas
• investigating major infrastructure projects including
– the passenger rail to Beaudesert
– freight rail from Bromelton to Rosewood via Kagaru
– the Southern Infrastructure Road Corridor from Yarrabilba to Ormeau.
Logan City Council
PART D - What it means for your community 95
Transport and Main Roads, Connecting SEQ 2031 – An Integrated Regional Transport Plan for South East Queensland, 2010
DRAF
T

1
7
5
9
5
5
5
6
2
34
13
17
19
14
5
8
5
16
15
2
11
10
12
18
Jimboomba
Yarrabilba
Beenleigh
Flagstone
Spring�eld
Logan Central
Browns Plains
Hyperdome
Springwood
Greenbank
Park Ridge
Meadowbrook Uni/TAFE/Hospital
Yatala
Berrinba/ Crestmead
Ipswich
Bahrs Scrub
Logan Village
Kagaru
Map not to scale
Existing motorway
Existing major road
Existing rail line
Existing busway
Proposed major road corridor
Proposed strategic rail corridor
Proposed strategic bus corridor
Proposed strategic active transport corridor
Proposed strategic freight corridor
Enhanced existing corridor
Transport network investigation
Preserve corridor for long-term opportunity
Major park ‘n’ ride
Principal activity centre
Major activity centre
Regional hub
Sub-regional hub
District hub
KEY
2
2
Ipswich City Council
Redland City Council
Scenic Rim Regional Council
Scenic Rim Regional Council
Map 9.9 – 2031 strategic projects Logan city
Summary List of Projects
L1 Passenger rail service Salisbury to Flagstone
L2 Strategic bus/HOV priority corridors packaged with UrbanLink bus services
L3 Extension of South-East Busway to Springwood
L4 Strategic active transport corridors
L5 Upgrades to urban arterials: Logan Central to Browns Plains; Browns Plains to Flagstone; Springfield to Greenbank; Greenbank to Logan Reserve via Park Ridge; Meadowbrook to Yarrabilla; Yarrabilba to Beenleigh
L6 Upgrade of Pacific Motorway from Gateway Motorway to Loganholme
L7 Upgrade Mt Lindesay Highway
L8 Upgrades to rail line from Beenleigh to Robina
L9 Upgrade Logan Motorway from Ipswich Motorway to Pacific Motorway for freight
L10 Investigate urban arterial from west Mt Lindesay to east of Spring Mountain
L11 Investigate passenger rail from Flagstone to Beaudesert
L12 Investigate Flagstone to Bromelton Road corridor
L13 Extend Gateway Motorway extension from Logan Motorway to Southern Infrastructure Road Corridor
L14 Construct Southern Infrastructure Road Corridor from Flagstone to Beaudesert-Beenleigh Rd
L15 Investigate upgrading arterial connections from Gateway Motorway to Oxenford to improve north-south links for local trips
L16 Investigate urban arterial connection from Logan city to Intra-regional transport corridor
L17 Finalise and preserve Southern Freight Rail Corridor from Rosewood to Kagaru
L18 Hillcrest major park ‘n’ ride
L19 Investigate Southern Infrastructure Corridor to Pacific Motorway Beaudesert-Beenleigh Road
Note: responsibility for delivery of these projects is to be determined
96 Draft Connecting SEQ 2031
Transport and Main Roads, Connecting SEQ 2031 – An Integrated Regional Transport Plan for South East Queensland, 2010
DRAF
T

Redland City Council
Population in 2006: 131 000
Indicative planning population in 2031: 169 000
Dwellings in 2006: 50 000
Forecast additional dwellings in 2031: 21 000
Daily trips by residents in 2006: 460 000
Daily trips by residents in 2031: 660 000
Redland City Council comprises a group of urban, rural, bushland and island communities fringing Moreton Bay on the eastern side of greater Brisbane.
The population of Redland city is forecast to increase by 29% between 2006 and 2031. This increase is modest both in terms of size and growth rate, compared to the rest of the region’s cities. About 70% of the growth will be infill development in existing urban areas.
The importance of the koala population in Redland city is well recognised and influences transport and land use policies. Intensified development of all kinds brings wider roads with more traffic, which increases the potential for injury to the koala population.
Many commuter trips are focused on Brisbane city. There are opportunities to increase local employment in the existing activity centres and the enterprise precincts at Thornlands and Redland Bay. Council has a goal of 60% employment self containment which requires an additional 24 000 jobs within Redland city by 2031.
Urban development is focused around existing centres that are linked though an established road and rail network. Two small development areas in Thornlands will be master planned to ensure public and active transport connections are provided.
The rail network is indirect and limited to the northern parts of the city. There has been an historical reliance on bus services for commuter travel to Brisbane as they provide a more direct service from the southern and eastern suburbs.
Quick transport facts on Redland city
• low public transport use, with 5.7% of daily and 8.4% of work trips by public transport
• two-thirds of work trips are longer than 10 kilometres, with the average commute trip 18km
• 6% of households do not have a car, the lowest in SEQ
• 28% of the population do not have a driver’s licence.
Figure 9.15 – 2008 journey to work trip length
SEQ<3km <5km <10km <20km <30km >30km
13% 23% 46% 75% 89% 11%
Redland city
<3km <5km <10km <20km <30km >30km
10% 19% 34% 55% 86% 14%
Walk/Cycle, 9.5%
Vehicle driver, 61.9%
Vehicle passenger, 22.9%
Public transport, 5.7%
Figure 9.16 – current mode share
PART D - What it means for your community 97
Transport and Main Roads, Connecting SEQ 2031 – An Integrated Regional Transport Plan for South East Queensland, 2010
DRAF
T

Transport issues and challenges
• dispersed settlement is difficult to service with public transport
• even with local employment growth many residents will need to travel to Brisbane, Logan and the Gold Coast for work
• ferry transport and car parking for Moreton Bay islands which could grow from a population of 5200 to more than 24 000, depending on council policies and infrastructure availability
• traffic congestion on some routes affects travel time reliability, particularly Old Cleveland Road, Redland Bay Road and Finucane Road.
2031 targets
The 2031 transport targets aim to reduce the share of trips made by private car from 84.8% to 72%, with an:
• increase in the share of trips by public transport from 5.7% to 10%, taking daily trips from 25 000 in 2006 to 65 000 in 2031
• increase in the share of trips by walking from 8% to 10%
• increase in the share of trips by cycling from 1.5% to 8%.
This would still see private car trips increase from 390 000 in 2006 to 480 000 in 2031.
Transport and land use integration
Centres access hierarchy
Capalaba and Cleveland will be district hubs and the focus for public transport contestable employment growth. The sub-regional hub at Carindale in Brisbane city, will be a hub for many bus services and will be the terminus for the Eastern Busway, with Capalaba linked by bus priority. Planning for Capalaba and Cleveland includes intensified, well-planned residential and commercial development, with provision for eight storey buildings focused around walkable town centres.
Figure 9.17 – average composition of 25 trips made per person each week in Redland city
20062.5 trips 1.5 trips 21 trips
2031targets 4.5 trips 2.5 trips 18 trips
Public Transport Walking Cycling Car
2006 Actual
2031 Target
2006 Actual
2031 Target
2006 Actual
2031 Target
2006 Actual
2031 Target
All trips 5.7% 10% 8% 10% 1.5% 8% 84.8% 72%
Work trips 8.4% 20%
To achieve these targets, the weekly travel patterns of the average Redland city resident would need to change only incrementally.
Redland City Council
98 Draft Connecting SEQ 2031
Transport and Main Roads, Connecting SEQ 2031 – An Integrated Regional Transport Plan for South East Queensland, 2010
DRAF
T

Victoria Point
Thornlands
Redland Bay
Mount Cotton
Wellington Point
Manly
North Stradbroke Island
Birkdale
Thorneside
Alexandra Hills
Ormiston
Redlands Business Park
Dunwich
Cleveland
Capalaba
Wynnum Central
Port of Brisbane
Beenleigh
Hyperdome
2006 2031 Targets
0.46 million trips/day
0.66 million trips/day
Modeshare
72%
10%
10%
8%
84.8%
5.7%
1.5%8%
KEYMotorway
Major road
Rail line
Urban footprint
Principal activity centre
Major activity centre
Accessible business & industry area
Regional hub
Sub-regional hub
District hub
Map not to scale
Brisbane City Council
Logan City Council
Gold Coast City Council
Logan City Council
Map 9.10 – 2031 transport and land use Redland city
PART D - What it means for your community 99
Transport and Main Roads, Connecting SEQ 2031 – An Integrated Regional Transport Plan for South East Queensland, 2010
DRAF
T

2031 transport network for Redland city
The Eastern Busway will be in place from Coorparoo to Capalaba. This will benefit bus services to Brisbane city allowing buses faster and more reliable travel time to Brisbane city.
This is an example of infrastructure being planned in Brisbane city which will provide significant benefits for Redland city residents as many trips will be made to Brisbane and elsewhere in the region.
Duplication of the Cleveland line from Manly to Cleveland will allow more frequent rail services to Brisbane and Brisbane Airport.
ExpressLink services will improve running times between Cleveland and Brisbane, while UrbanLink services will increase capacity and frequency services inbound from Manly.
The removal of open level crossings will improve safety and improve traffic flow.
A strategic transport corridor has been protected for many years as an extension of Moreton Bay Road from Capalaba to Cleveland. This corridor will not be required as a road given the establishment of targets for increased public and active transport mode shares and the restricted population growth in Redland city.
An investigation of the best use for the corridor needs to be undertaken jointly between council and the state government. The corridor could be used for some form of dedicated public transport use to connect the centres of Cleveland and Capalaba. However, it has no potential to support denser public transport oriented urban development and this would reduce its effectiveness. Its best use is likely to be a combination of active transport, recreation and environmental protection uses.
A local road connection from Redland Bay Road across the Logan River would improve connections to employment and other attractions in Logan and Gold Coast City Councils. It would reduce reliance on the single M1 crossing point of the Logan River at Loganholme. This low traffic road would not form any part of a longer corridor between Brisbane and the Gold Coast.
Cleveland will be an active transport precinct, with a focus on improving active transport facilities within a five-kilometre radius of Cleveland centre.
Redland City Council is dealing with a range of issues concerning population growth and provision of infrastructure for Moreton Bay islands. This includes development of local parking and transport policies.
Map 9.11 shows the 2031 strategic transport network f0r Redland city.
Partnering with Redland City Council
• ensuring the planning scheme supports increased densities and managed location and supply of car parking in Capalaba and Cleveland towns
• ensuring appropriate public and active transport network design and infrastructure charging before approving new development areas
• investigating the best use of the Moreton Bay Road extension corridor
• investigating the need for and timing of a local connection across the Logan River to link the cities of Redland and Gold Coast without having to rely on the Pacific Motorway corridor.
Redland City Council
100 Draft Connecting SEQ 2031
Transport and Main Roads, Connecting SEQ 2031 – An Integrated Regional Transport Plan for South East Queensland, 2010
DRAF
T
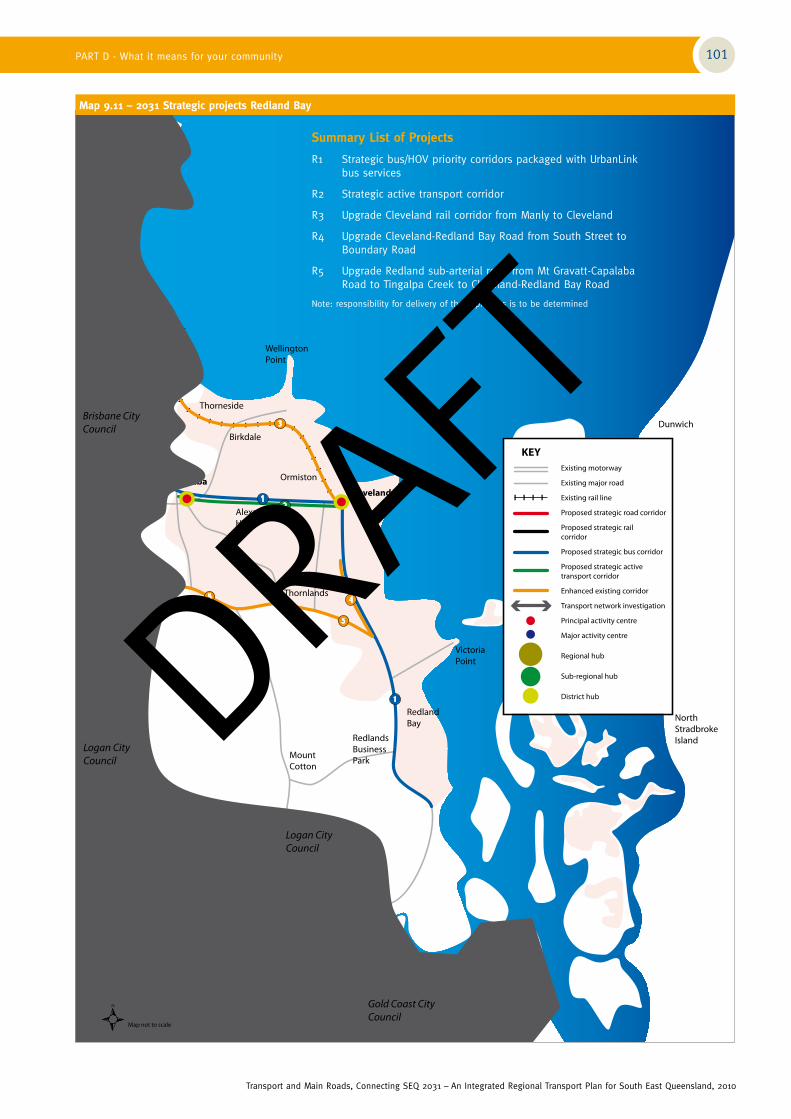
2
3
5
5
4
1
1
Victoria Point
Thornlands
Redland Bay
Mount Cotton
Wellington Point
Manly
North Stradbroke Island
Birkdale
Thorneside
Alexandra Hills
Ormiston
Redlands Business Park
Dunwich
ClevelandCapalaba
Wynnum Central
Port of Brisbane
Beenleigh
Hyperdome
Map not to scale
Existing motorway
Existing major road
Existing rail line
Proposed strategic road corridor
Proposed strategic rail corridor
Proposed strategic bus corridor
Proposed strategic active transport corridor
Enhanced existing corridor
Transport network investigation
Principal activity centre
Major activity centre
Regional hub
Sub-regional hub
District hub
KEY
Brisbane City Council
Logan City Council
Gold Coast City Council
Logan City Council
Summary List of Projects
R1 Strategic bus/HOV priority corridors packaged with UrbanLink bus services
R2 Strategic active transport corridor
R3 Upgrade Cleveland rail corridor from Manly to Cleveland
R4 Upgrade Cleveland-Redland Bay Road from South Street to Boundary Road
R5 Upgrade Redland sub-arterial road from Mt Gravatt-Capalaba Road to Tingalpa Creek to Cleveland-Redland Bay Road
Note: responsibility for delivery of these projects is to be determined
Map 9.11 – 2031 Strategic projects Redland Bay
PART D - What it means for your community 101
Transport and Main Roads, Connecting SEQ 2031 – An Integrated Regional Transport Plan for South East Queensland, 2010
DRAF
T

Gold Coast City Council
Population in 2006: 467 000
Indicative planning population in 2031: 749 000
Dwellings in 2006: 202 500
Forecast additional dwellings in 2031: 143 000
Daily trips by residents in 2006: 1 630 000
Daily trips by residents in 2031: 2 760 000
Although it began as a weekend and holiday destination for Brisbane residents, the Gold Coast has become Queensland’s second largest city, with a range of coastal and hinterland lifestyles and an increasingly diverse and sophisticated range of employment opportunities.
Growth is forecast to continue into the next two decades, with population increasing by 60% from 467 000 in 2006 to 749 000 in 2031. Under the SEQ Regional Plan, over 65% of this growth will be accommodated as infill development within existing urban areas.
Urban development is concentrated in growth centres between Yatala and Coolangatta.
Continuous development extends south of Coolangatta beyond the Queensland border into the Tweed Shire. The urban form consists of medium to high density development along the coastal spine and pockets of canal development, surrounded by larger areas of low density residential housing. Rural residential living areas are located further west.
The highest population density is between Surfers Paradise and Broadbeach, with medium density between Broadbeach and Coolangatta. These suburbs are connected by the spine of the Gold Coast Highway which is the corridor for the proposed Gold Coast light rail project.
Other areas with new or infill medium density development include Southport, Carrara, Tugun, Reedy Creek, Helensvale, Bundall, Robina and Varsity Lakes.
The development of new communities will be focused at Coomera, Hope Island, Pimpama, Ormeau, Maudsland and Reedy Creek.
Substantial employment growth will be required to support forecast population growth to 2031. Employment has traditionally been in the housing and tourism sectors but has diversified in the last decade to include considerable export oriented commerce, education and technology businesses. There are also specialist precincts like the film and media industry cluster at Oxenford and the Gold Coast Marine precinct at Coomera.
Gold Coast city has generally been assumed to have a strong dependence on commuter trips to Brisbane, however about 15 000 workers commute to Brisbane each day, compared to 10 000 greater Brisbane residents who commute to the Gold Coast.
Transport decisions will play an integral role in the ongoing development of the city and in particular, delivering a vision of a much more sustainable, less car dependent community. The Gold Coast light rail project provides an important catalyst to support sustainable urban lifestyles.
Quick transport facts on Gold Coast city
• public transport mode share is 4.4% of all trips
• around half of the population travel less than 10km to work, representing significant potential to increase the number of people cycling to work
• 8% of the Gold Coast workforce is employed in Brisbane
• 29% of the population do not have a driver’s licence
• average distance travelled to work is 15.2 kilometres for all destinations other than the Brisbane CBD
• Gold Coast residents travelling to the Brisbane CBD have an average journey to work trip length of 71.5 kilometres.
Figure 9.18 – 2008 journey to work trip length
SEQ<3km <5km <10km <20km <30km >30km
13% 23% 46% 75% 89% 11%
Gold Coast
<3km <5km <10km <20km <30km >30km
13% 25% 49% 79% 88% 12%
Walk/Cycle, 8.1%
Vehicle driver, 62.9%
Vehicle passenger, 24.6%
Public transport, 4.4%
Figure 9.19 – current mode share
102 Draft Connecting SEQ 2031
Transport and Main Roads, Connecting SEQ 2031 – An Integrated Regional Transport Plan for South East Queensland, 2010
DRAF
T

Figure 9.20 – average composition of 25 trips made per person each week on the Gold Coast
20062.5
trips1.5 trips 21 trips
2031targets 4.5 trips 4 trips 16.5 trips
Public Transport Walking Cycling Car
2006 Actual
2031 Target
2006 Actual
2031 Target
2006 Actual
2031 Target
2006 Actual
2031 Target
All trips 4.4% 15% 6.8% 8% 1.3% 8% 87.5% 69%
Work trips 3.8% 20%
Transport issues and challenges
• significant population and activity growth on the Gold Coast will result in a major increase in trips
• major holiday destination with significant increases in transport activity during peak tourist periods
• public transport, walking and cycling needs to play an increasing role in moving people efficiently, to ensure accessibility is maintained
• increasing capacity on Gold Coast to Brisbane passenger rail services, especially in peak periods
• providing new rail stations on the Gold Coast line to accommodate urban growth while maintaining a rapid journey from Brisbane to Gold Coast
• providing a light rail system to meet demand in the higher density coastal corridor between Southport and Coolangatta to ensure accessibility to activities
• servicing travel demand from the growth area of Coomera to the rest of the Gold Coast and providing alternatives to car travel
• east-west bus services need to be enhanced between heavily populated coastal areas to encourage greater use of the rail line for longer trips to reduce impacts on the Pacific Motorway
• lack of Albert River crossings, resulting in pinch points on the road network
• poor connectivity in many local communities
• an over reliance on the Pacific Motorway for local trips due to lack of urban arterial roads providing connections to centres.
2031 targets
By 2031 the Gold Coast is expected to have a population of almost 800 000 with daily trips growing by 69% from 1.63 million in 2006 to 2.76 million in 2031.
With an estimated 65% of new housing developed through urban infill, the 2031 transport targets aim to reduce the share of trips made by private car from 87.5% to 69%, made up of an:
• increase in the share of trips by public transport from 4.4% to 15%, taking daily trips from 72 000 in 2006 to 400 000 in 2031
• increase in the share of trips by walking from 6.8% to 8%
• increase in the share of trips by cycling from 1.3% to 8%.
This would still see the number of daily private car trips made by Gold Coast residents increase 33%, from 1.43 million in 2006 to 1.91 million in 2031.
Transport and land use integration
Centres access hierarchy
The extended Southport business centre is the regional hub and location for public transport contestable commercial, administrative and educational uses. Southport will accommodate 40 000 extra residents and 25 000 jobs by 2031.
Robina and Helensvale will be the sub-regional hubs on the Gold Coast. Robina is on the rail line and also will have a high-frequency bus connection to the light rail at Broadbeach. Helensvale is at the junction of the light rail and passenger rail and is a suitable location for hubbing bus services.
Coomera is an emerging major centre with potential for transit oriented development and will be the future hub for high-frequency bus services accessing Coomera centre as well as providing a connection to the rail line.
Increasing densities along transit corridors
The priority transit oriented corridor is the Gold Coast light rail corridor from Gold Coast Health and Knowledge Precinct to Broadbeach. Stage one of the light rail will connect multiple destinations including Griffith University, the new Gold Coast Hospital and Southport, as well as high density residential destinations along the coastline including Broadbeach and Surfers Paradise. With multiple destinations, a high-frequency of public transport services will operate along the corridor all day, every day.
Future stages of the light rail will connect from the Gold Coast University Hospital to Helensvale rail station, and from Broadbeach to Coolangatta.
The Broadbeach-Elanora corridor along the Gold Coast Highway should also be a focus for increased densities and mixed use development as the light rail extends south. Implementation will be subject to further detailed land use planning in partnership with local government.
Land use density and mix is supported within 400-800 metres of all other public transport stations or stops along high-frequency public transport routes illustrated in the transport and land use integration map (Map 9.12).
To achieve these targets, the weekly travel patterns of the average Gold Coast resident would need to change only incrementally.
Gold Coast City Council
PART D - What it means for your community 103
Transport and Main Roads, Connecting SEQ 2031 – An Integrated Regional Transport Plan for South East Queensland, 2010
DRAF
T

Queensland New South Wales
Gold Coast Health and Knowledge
Precinct
Coomera Marine Precinct
Yatala
BiggeraWaters
Varsity Lakes
Bundall
Elanora
Gold Coast Airport
Burleigh Heads
Currumbin
Bond University
Hope Island
Pimpama
Ormeau
Maudsland
Reedy Creek
Mermaid Beach
Labrador
Tugun
Palm Beach
Scenic Rim Regional Council
Logan City Council
Redland City Council
Upper Coomera
Coomera
Nerang
Broadbeach
Surfers
Southport
Coolangatta
Helensvale
Paradise
Beenleigh
Robina
2031 Southport Journey to Work Targets
69%
15%
8%
87.5%
4.4%8%
1.3%6.8%
2006 2031 Targets
1.63 million trips/day
2.76 million trips/day
Modeshare
56%
30%
8%
6%
KEYMotorway
Major road
Rail line
Light rail
Urban footprint
Principal activity centre
Major activity centre
Accessible business & industry area
Regional hub
Sub-regional hub
District hub
Priority transit corridor
Transit corridor
Map not to scale
Map 9.12 - 2031 Transport and Land use integration Gold Coast
104 Draft Connecting SEQ 2031
Transport and Main Roads, Connecting SEQ 2031 – An Integrated Regional Transport Plan for South East Queensland, 2010
DRAF
T

2031 transport network for the Gold Coast
The transport network on the Gold Coast will be reoriented away from its present heavy reliance on the Pacific Motorway and Gold Coast Highway spines to be organised around the major public transport spines of the Gold Coast light rail, strategic high-frequency bus corridors and the Gold Coast rail line.
The Gold Coast rail line will extend to Coolangatta. New stations on the existing Gold Coast rail line will be investigated to support industrial and residential communities within the urban footprint.
Services will be layered with CoastLink services to Brisbane city and UrbanLink services between Coomera and Coolangatta.
The pattern of very high density development along the coastal strip makes mass public transport critical for accessibility. The 2031 light rail network will extend from Helensvale to Coolangatta and will provide residents and tourists with a high quality service to access destinations and attractions located on the coastal corridor.
The light rail will be supported by improved public transport links to the rest of the coast, particularly low and medium density communities located between the coast and the Gold Coast rail corridor. This will need to be facilitated by improved high-frequency bus services packaged with bus priority on east-west connecting roads.
The high proportion of work (34%) and daily trips (71%) less than 10 kilometres in length represents significant potential to increase the share of trips made by active transport. Getting the right infrastructure in place will help support growth in active travel, which can help relieve some of the growth pressures on other parts of the transport network.
The strategic active transport corridor will link Helensvale to Robina via Southport, Surfers Paradise and Broadbeach. Provision of active transport infrastructure should be prioritised within five kilometres of Southport, Robina, Broadbeach and Helensvale.
The northern areas of the Gold Coast and urban areas to the west of the Pacific Motorway require urban arterial roads for local trips, bus services, walking and cycling to reduce the potential for car dependence and overuse of the Pacific Motorway for local trips.
The development of urban arterial roads will require more river crossings. The current reliance on the limited crossings of the Albert River means that the Pacific Motorway and its service roads cater for virtually all trips that cross the river. This makes the transport network vulnerable at this point and forces use of the motorway for local trips, reducing its capacity and efficiency for longer distance and freight trips.
An upgraded Pacific Motorway (M1) will cater for inter-regional trips and long distance freight. It will also inevitably perform a western bypass function. Ensuring the Pacific Motorway meets these needs requires development of urban arterial roads in the growth areas to carry local traffic and act as bus and active transport strategic corridors.
Apart from interstate freight transport using the Pacific Motorway, the major Yatala industrial development area requires reliable road freight links to:
• industries in metropolitan Brisbane
• Acacia Ridge inter-modal terminal to the Port of Brisbane
• the future major industrial area at Bromelton.
A long-term corridor should be preserved for the proposed Southern Infrastructure Corridor from Ormeau to Yarrabilba.
Partnering with Gold Coast City Council
• working together to deliver community boulevard treatment on the Gold Coast Highway in conjunction with delivery of light rail
• supporting increased densities and mix of development along the Gold Coast light rail corridor and around existing and future stations on the Gold Coast rail line
• encouraging location of public transport contestable employment in Southport
• investigating the Southern Infrastructure road corridor from Ormeau to Greater Flagstone in Logan city.
Gold Coast City Council
PART D - What it means for your community 105
Transport and Main Roads, Connecting SEQ 2031 – An Integrated Regional Transport Plan for South East Queensland, 2010
DRAF
T

Map 9.13 – 2031 Strategic projects Gold Coast
Coomera Marine Precinct
SteiglitzYatala
BiggeraWaters
Varsity Lakes
Elanora
Burleigh Heads
Currumbin
Hope Island
Gold Coast Health and Knowledge
Precinct
Bond University
Upper Coomera
Oxenford
Carrara
Pimpama
Ormeau
Reedy Creek
Mermaid Beach
Labrador
Tugun
Palm Beach
Tallebudgera Valley
Tallebudgera
44
14
14
13
4
15
4
9
2
10
1
7
3
5
5
12
11
11
2
6
8
17
16
Coomera
Nerang
Surfers
Southport
Coolangatta
Helensvale
Paradise
Beenleigh
Robina
Bundall
Broadbeach
Scenic Rim Regional Council
Refer Logan City CouncilRefer Logan City Council
Redland City Council
BroadbeachExisting motorway
Existing major road
Existing rail
Proposed strategic road corridor
Proposed strategic rail line / light rail corridor
Proposed strategic bus corridor
Proposed strategic active transport corridor
Enhanced existing corridor
Transport network investigation
Major park ‘n’ ride
Principal activity centre
Major activity centre
Regional hub
Sub-regional hub
District hub
KEY
Map not to scale Queensland New South Wales
Gold Coast Airport
Summary List of Projects
G1 Urban arterial Logan to Carrara (Intra Regional Transport corridor)
G2 Light rail from Helensvale to Coolangatta
G3 Extend passenger rail to Coolangatta
G4 Strategic bus/HOV priority corridors packaged with UrbanLink bus services
G5 Strategic active transport corridor
G6 Upgrade passenger rail from Beenleigh to Robina
G7 Upgrade existing and construct additional interchange on Pacific Motorway at Coomera
G8 Upgrade Pacific Motorway
G9 Investige arterial routes to improve north-south links for local trips
G10 Investigate Southern Infrastructure road corridor Flagstone to Pacific Motorway
G11 Investigate strategic bus/HOV priority corridors packaged with UrbanLink bus services
G12 Investigate strategic active transport corridor
G13 Investigate urban arterial to serve local trips west of the Pacific Motorway from Nerang to Reedy Creek
G14 Investigate public transport corridor Robina to Broadbeach and Nerang to Broadbeach (bus or light rail)
G15 Investigate extension of Bermuda Street to Tallebudgera Valley
G16 Ormeau major park ‘n’ ride
G17 Tallebudgera major park ‘n’ ride
Note: responsibility for delivery of these projects is to be determined
106 Draft Connecting SEQ 2031
Transport and Main Roads, Connecting SEQ 2031 – An Integrated Regional Transport Plan for South East Queensland, 2010
DRAF
T

Sunshine Coast Regional Council
Population in 2006: 295 000
Indicative planning population in 2031: 497 000
Dwellings in 2006: 130 000
Forecast additional dwellings in 2031: 98 000
Daily trips by residents in 2006: 1 030 000
Daily trips by residents in 2031: 1 755 000
The Sunshine Coast includes residential areas and centres located along the coast, as well as the major inland towns of Nambour and Beerwah. The Sunshine Coast hinterland also contains small towns including Maleny, Mapleton and Peachester.
Population on the Sunshine Coast is forecast to increase by 68% from 295 000 in 2006 to 497 000 in 2031. Most of the growth will be accommodated in new development areas. There is an important opportunity to achieve a more sustainable form of new urban development by ensuring new communities are designed around public transport and active transport.
A high proportion of urban development is located south of the Maroochy River, with major new development areas of Caloundra South and Palmview.
Maroochydore will be the principal focus for business, community services and employment on the Sunshine Coast.
Major activity centres such as Caloundra will also play an important role for retail, health and community services. Nambour will support employment locally and in its surrounds.
Kawana town centre, located on the proposed Sunshine Coast rail line, is an emerging major centre with the opportunity to develop as a hub for public transport and a location for well designed high density employment uses. Major new employment centres could also emerge at:
• proposed Caloundra South town centre
• Caloundra Regional Business and Industrial Park with forecast employment of nearly 30 000 by 2031
• Sippy Downs with a university, business hub and enterprise areas with forecast employment of 20 000 people and with 15 000 students by 2031
• Sunshine Coast Airport industrial precinct.
Quick transport facts on the Sunshine Coast
• high car dependency with 86% of personal trips in private vehicles
• low public transport use, with only 3.6% of all trips by public transport and 2.5% of journey to work trips on public transport
• 5.4% of journey to work trips are by active transport – the second highest in SEQ after Brisbane city
• 50% of journey to work trips are less than 10 kilometres, but 15% are longer than 30 kilometres
• 28% of the population do not have a driver’s licence
• average distance travelled to work is 17.3 kilometres for all destinations other than the Brisbane CBD
• Sunshine Coast residents travelling to the Brisbane CBD have an average trip length of 96 kilometres.
Figure 9.21 – 2008 journey to work trip length
SEQ<3km <5km <10km <20km <30km >30km
13% 23% 46% 75% 89% 11%
Sunshine Coast
<3km <5km <10km <20km <30km >30km
16% 29% 50% 75% 85% 15%
Walk/cycle, 10.1%
Vehicle driver, 60.8%
Vehicle passenger, 25.5%
Public transport, 3.6%
Figure 9.22 – current mode share
PART D - What it means for your community 107
Transport and Main Roads, Connecting SEQ 2031 – An Integrated Regional Transport Plan for South East Queensland, 2010
DRAF
T

Transport issues and challenges for the Sunshine Coast
Some of the issues for the transport system on the Sunshine Coast include:
• relatively dispersed residential areas and centres located along an extensive coastal spine are difficult to service with public transport, particularly north of the Maroochy River
• major holiday destination with significant increases in transport activity during peak tourist periods
• public transport links between centres and population growth areas need to be enhanced to keep up with population growth
• large gaps between populated areas west of the coastal strip make these areas difficult to service with public transport
• lack of arterial road network to cater for local trips, forcing use of the Bruce Highway for many local trips
• 28% of residents will be aged over 65 by 2031, presenting a major challenge to ensure people can continue to access health care facilities and recreational opportunities, particularly when they are no longer able to drive
• the need for improved public transport connections to major employment destinations in Moreton Bay Regional Council and Brisbane City Council.
2031 targets
Growth on the Sunshine Coast will mean a 71% increase in daily trips from 1.03 million in 2006 to 1.76 million in 2031.
The 2031 transport targets aim to reduce the share of trips made by private car from 86.3% to 72%, made up of an:
• increase in the share of trips by public transport from 3.6% to 10%, increasing daily trips from 40 000 in 2006 to 175 000 in 2031
• increase in the share of trips by walking from 8.4% to 10%
• increase in the share of trips by cycling from 1.7% to 8%.
Meeting the targets would still see the number of daily private car trips made by Sunshine Coast residents increase by 42% from 890 000 in 2006 to 1.26 million in 2031.
Figure 9.23 – average composition of 25 trips made per person each week
20062.5
trips1 trip 21.5 trips
20314.5 trips 2.5 trips 18 trips
Public Transport Walking Cycling Car
2006 Actual
2031 Target
2006 Actual
2031 Target
2006 Actual
2031 Target
2006 Actual
2031 Target
All trips 3.6% 10% 8.4% 10% 1.7% 8% 86.3% 72%
Work trips 2.5% 15%
To achieve these targets, the weekly travel patterns of the average Sunshine Coast resident would need to change only incrementally.
Sunshine Coast Regional Council
108 Draft Connecting SEQ 2031
Transport and Main Roads, Connecting SEQ 2031 – An Integrated Regional Transport Plan for South East Queensland, 2010
DRAF
T

Transport and land use integration
Centres access hierarchy
Maroochydore is the logical regional hub for the Sunshine Coast as it is the principal activity centre and is forecast to accommodate 18 000 employees by 2026. Maroochydore will be the main interchange point between intra-regional and suburban public transport services on the Sunshine Coast. It will contain a high standard multi-modal interchange used as an eventual terminus for the rail line, CoastConnect bus corridor and other suburban bus routes.
Kawana town centre is a sub-regional hub primarily due to the existing momentum of development and employment. The plan proposes a new rail line from Beerwah to Maroochydore. The CoastConnect bus corridor will provide on-road priority for buses between Caloundra and Maroochydore.
Sippy Downs and Caloundra Regional Business and Industrial Park are district hubs. Both are on multi-modal road corridors linking them to sub-regional hubs and both are forecast to be significant future employment precincts. Sippy Downs ITC Business Hub, university and enterprise area together will eventually accommodate 20 000 jobs and 15 000 students.
Caloundra Regional Business and Industrial Park will eventually accommodate 30 000 jobs. While many of these types of jobs may not be public transport contestable, creation of a core of intensive employment density around a future stop or station will support a high-frequency public transport service.
Sunshine Coast Airport at Marcoola and its associated aeronautical support industry and office park is also a district hub in the transit hierarchy. It can be easily connected to the Maroochydore hub and the airport will generate public transport demand.
Increasing densities around transit corridors
The priority transit oriented corridor is the northern section of the CoastConnect bus corridor from Maroochydore to Kawana town centre. It will connect Caloundra
to the new Sunshine Coast Hospital and Kawana town centre with the existing Kawana shopping centre, Mooloolaba coastal centre and the regional hub and principal activity centre of Maroochydore. Because of the multiple destinations, a high-frequency and reliable public transport service can be provided all day every day.
In later years of the plan, land use mix and densification is supported along: the CoastConnect bus corridor between Kawana and Caloundra; the Sunshine Coast rail line between Kawana Town Centre and Caloundra; and along a future high-frequency bus route linking Sippy Downs with Palmview and Caloundra South. Implementation will be subject to further detailed land use planning in partnership with local government.
Land use density and mix is generally supported within 400-800 metres of all other public transport stations or stops along high-frequency public transport routes.
Accessible enterprise areas
Sippy Creek and Kunda Park are enterprise areas identified in the SEQ Regional Plan that have good access to the priority freight network. Business and industry that requires heavy vehicle access should be encouraged to locate in these areas.
2031 transport network for the Sunshine Coast
By 2031 there will be a significant passenger shift to public transport, especially in the urban communities south of the Maroochy River.
The CoastConnect bus corridor will provide frequent fast, efficient and reliable bus services between Maroochydore and Caloundra South.
The Sunshine Coast rail line from Beerwah to Maroochydore will provide a better link to the rest of SEQ for the communities concentrated along the coast. Services will be layered, with a CoastLink service to Brisbane and an all stops UrbanLink services from Beerwah to Maroochydore.
Partnering with Sunshine Coast Regional Council
• encouraging public transport contestable jobs to locate in Maroochydore and Kawana town centres
• supporting increased public transport use to Maroochydore through land use planning, precinct planning, traffic management, car parking supply and pricing
• ensuring land use plans support increasing densities and mixed use in transit corridors
• planning to ensure business and industry uses that depend on heavy vehicle access locate in Sippy Creek or Kunda Park
• Sunshine Coast Regional Council, through its Sunshine Coast sustainable transport strategy has a strong focus on achieving sustainable transport outcomes for the Sunshine Coast region. Connecting SEQ 2031 sets the building blocks for helping council achieve these outcomes.
There will be improvements to the arterial road network including provision of multi-modal corridors between Mooloolaba and Caloundra South and bus and active transport facilities on a new arterial road from Sippy Downs to Caloundra South. A corridor for a longer term local arterial road will be preserved from the Bruce Highway to Beerwah in the event Beerwah East area is developed beyond 2031.
The Bruce Highway and Sunshine Motorway will be upgraded for safety and local capacity improvements to act both as an inter-regional network and an urban bypass system for the Sunshine Coast. No new urban motorway links are proposed, with new major strategic roads within the urban development areas being developed to a multi-modal arterial standard that caters for buses, active transport and local traffic.
High quality active transport facilities will be provided within 5 kilometres of Maroochydore, Sippy Downs, Kawana and Nambour.
Map 9.15 illustrates the 2031 strategic transport network for the Sunshine Coast.
Sunshine Coast Regional Council
PART D - What it means for your community 109
Transport and Main Roads, Connecting SEQ 2031 – An Integrated Regional Transport Plan for South East Queensland, 2010
DRAF
T

Sunshine Coast regional business & industrial park
Nambour
Beerwah
CaloundraSouth
Sippy Downs
Maroochydore
Noosa
Kawana
Cooroy
Eumundi
Yandina
Woombye
Palmwoods
Mooloolah Valley
Landsborough
Peregian Springs
Coolum Beach
Kunda Park
Mooloolaba
Sunshine Coast Airport
Sippy CreekPalmview
Caloundra
Forest Glen
Coolum industrial area
Buderim
2006 2031 Targets
1.03 million trips/day
1.76 million trips/day
Modeshare
72%
10%
10%
8%
86.3%
4.4%
1.7%8.4%
2031 Maroochydore Journey to Work Targets
65%
20%
6%
9%KEYMotorway
Major road
Rail line
Urban footprint
Principal activity centre
Major activity centre
Accessible business & industry area
Regional hub
Sub-regional hub
District hub
Priority transit corridor
Transit corridor
Map not to scale
Map 9.14 – 2031 Transport and Land use integration Sunshine Coast
110 Draft Connecting SEQ 2031
Transport and Main Roads, Connecting SEQ 2031 – An Integrated Regional Transport Plan for South East Queensland, 2010
DRAF
T

12
Sunshine Coast regional business & industrial park
Nambour
Beerwah
CaloundraSouth
Sippy Downs
Maroochydore
Noosa
Kawana
Cooroy
Eumundi
Yandina
Palmwoods
Woombye
Mooloolah Valley
Landsborough
Buderim
Peregian Springs
Coolum Beach
Kunda Park
Mooloolaba
Sunshine Coast Airport
Sippy CreekPalmview
Caloundra
Forest Glen
Beerburrum
9
9
9
5
5
10
5
6
7
7
7
111
24
3
4
8
Map not to scale
Existing motorway
Existing major road
Existing rail line
Proposed strategic road corridor
Proposed strategic rail corridor
Proposed strategic bus corridor
Proposed strategic active transport corridor
Enhanced existing corridor
Transport network investigation
Principal activity centre
Major activity centre
Regional hub
Sub-regional hub
District hub
KEY
Summary List of Projects
S1 Urban arterial from Sippy Downs to Caloundra South
S2 Multi-modal transport corridor from Caloundra Road to Mooloolaba
S3 Bells Creek Connection urban arterial from Caloundra Road to Bruce Highway via Caloundra South
S4 Rail line from Beerwah to Maroochydore
S5 Strategic bus/HOV priority corridors packaged with high-frequency bus services
S6 CoastConnect bus corridor from Maroochydore to Caloundra via Kawana Town Centre
S7 Strategic active transport corridors
S8 Upgrade Bruce Highway from Cooroy to Curra
S9 Upgrade to east-west road links
S10 Upgrade rail line from Beerwah to Nambour
S11 Upgrade Bruce Highway from Bells Creek Road to Sunshine Motorway
S12 Realign and duplicate of rail line from Beerburrum to Landsborough
S13 Investigate extension of Bells Creek Connection from Bruce Highway to Beerwah
Map 9.15 – 2031 Strategic projects Sunshine Coast
Note: responsibility for delivery of these projects is to be determined
PART D - What it means for your community 111
Transport and Main Roads, Connecting SEQ 2031 – An Integrated Regional Transport Plan for South East Queensland, 2010
DRAF
T

10. Rural communities
The Somerset, Lockyer Valley and Scenic Rim Regional Councils cover nearly half of the area of SEQ but in 2006 they contained just 86 000 people, or 3.2% of the region’s population. A similar number of people live in the rural areas of the other more urbanised city and regional councils.
The urban footprint, identified in the SEQ Regional Plan 2009–2031, restricts the incursion of urban development into these rural areas and the spread of existing rural towns into the surrounding countryside.
However, these local government areas are all forecast to experience annual growth rates of more than 2% per year during the next 20 years and by 2031 are expected to have a combined population of 166 000.
Providing transport infrastructure and adequate public transport services to rural communities and the rural towns in the more urbanised coastal councils, presents special challenges and different transport needs. Strategic infrastructure projects are illustrated in the rural communities map 12.1 on p119.
Public transport in rural communities
About 200 000 of the region’s 2.8 million residents live in small towns or rural areas, which have different transport needs to urban communities.
Public transport to rural areas will be provided through partnerships between Transport and Main Roads and local governments. TransLink is responsible for servicing the urban areas of SEQ and cannot extend the service area to rural communities as demands are too low for a TransLink service.
People living in rural communities need a basic form of public transport in cases where they cannot solely rely on private cars.
For smaller towns and villages outside of the Translink contract areas, a range of services is provided by contracts administered by Transport and Main Roads. New rural services can be considered on a case by case basis, subject to evidence of demand and meeting criteria established to ensure efficient use of government resources.
Rural public transport services generally fall into the category of low volume public transport, and will continue to be developed according to local needs (see principles to guide this work in next column).
The hinterland service connecting Nambour to Maleny, developed through a partnership between Transport and Main Roads, TransLink and the Sunshine Coast Regional Council is an excellent example of an initiative that would meet the suggested policy framework for low volume public transport in the rural areas of SEQ.
Principles for public transport services to rural communities
To cater for the growing population outside the designated TransLink urban service area, a new set of arrangements will be made for the planning and delivery of local public transport services. In smaller population centres these will be developed around population and estimated demand thresholds with matching levels of service delivery based on these principles:
• subject to available funding and evidence of demand, consideration will be given to establishing general route services between centres with a population greater than 500 and neighbouring towns with a population greater than 7500 where the distance between the two population centres is 40 kilometres or less
• as a guideline, village-to-town or town-to-town services provide a minimum of one return service per day, Monday to Friday. However, the actual level of service in each instance will be dependent upon the available funding and the existing level of demand
• for population centres where the resident population exceeds 7500, consideration will be given, subject to available funding, to declaring the centre as a service contract area and for the provision of general route services within the population centre itself
• for new contracts in rural communities, the level of service and model of service delivery will be determined by the available resources (existing passenger transport services and infrastructure; new funding sources) and underlying demand. As a general rule, services will not extend beyond daylight hours, Monday to Friday.
112 Draft Connecting SEQ 2031
Transport and Main Roads, Connecting SEQ 2031 – An Integrated Regional Transport Plan for South East Queensland, 2010
DRAF
T

Somerset Regional Council
Population in 2006: 19 600
Indicative planning population in 2031: 32 700
Annual population growth rate: 2.1%
Somerset is the largest local authority in area in SEQ but it has the smallest population. There are five small towns – Fernvale, Lowood, Esk and Toogoolawah in the Brisbane Valley and Kilcoy to the east. The last three towns have a high degree of employment self-containment. However, most future growth will occur in the towns of Lowood and Fernvale because of their proximity to Ipswich.
The Brisbane Valley and D’Aguilar Highways, which form part of the SEQ strategic road network, bisect the council area and are the backbone of the local transport system.
All of the towns except Lowood are located on these roads and only Kilcoy has a partial town bypass. The economy is based on agriculture and forestry which generates local freight traffic and the highways are the main links from SEQ to the South Burnett and northern Darling Downs.
Transport issues and challenges for Somerset
• the need to upgrade the junction of the Brisbane Valley Highway and the Warrego Highway at Blacksoil
• the upgrade and maintenance of the Brisbane Valley and D’Aguilar Highways to cater for the increasing volumes and variety of traffic
• need for town bypasses of Lowood and Fernvale
• need for frequent and direct public transport links between Lowood, Fernvale and Ipswich
• the conflict between freight traffic, other vehicles and pedestrians, especially in the towns
• elderly and isolated residents in the northern parts of the Brisbane Valley.
Partnering with Somerset Regional Council
• continuing to encourage the promotion of community transport services in the townships, especially in the north of the Brisbane Valley
• encouraging active transport in the townships by the provision of walking and cycling paths to and between community facilities.
2031 transport network for Somerset
By 2031 the Brisbane Valley and D’Aguilar Highways will be of a standard to provide safe travel through the Somerset area for freight, tourists and local residents featuring wide lanes and shoulders and a number of passing lanes. A grade separated interchange at Blacksoil will allow safe access to the Brisbane Valley and Warrego Highways.
The towns of Fernvale, Lowood and Kilcoy will have bypasses to separate highway and local traffic. This will allow the development of town centres that are conducive to walking and cycling. Lowood and Fernvale will be linked to Ipswich CBD and the Ipswich rail line by feeder bus services.
PART D - What it means for your community 113
Transport and Main Roads, Connecting SEQ 2031 – An Integrated Regional Transport Plan for South East Queensland, 2010
DRAF
T

Lockyer Valley Regional Council
Population in 2006: 31 900
Indicative planning population in 2031: 57 500
Annual population growth rate: 2.4%
The Lockyer Valley covers the west and south western parts of the SEQ region. The significant population centres are in the north of the Lockyer area, either side of the Warrego Highway which runs from east to west linking Brisbane and Toowoomba. The rail line from Brisbane to Toowoomba also runs through the council area.
The main towns are Gatton and Laidley and there is a significant area of rural residential settlement north of the Highway around Plainlands. There are also a number of rural villages along or near the highway and rail line.
The main industry is agriculture, with some industrial development planned in Gatton and at Plainlands. A new prison is planned north of Gatton. Although there is a high level of employment self containment, there is considerable commuter traffic to Toowoomba and Ipswich.
A new proposed rail line from Grandchester to Gowrie (including a crossing of the Toowoomba range) will be preserved as part of a Commonwealth Government planning study.
The Toowoomba Bypass project identified a 42-kilometre road corridor that connects Lockyer Valley to the north of Toowoomba. The corridor leaves the Warrego Highway
west of the Helidon Spa, crosses the range (includes a tunnel through part of range) south of Mount Kynoch and continues west.
The corridor swings to the south-west to cross the Warrego Highway near Charlton before continuing to join the Gore Highway about 17 kilometres south-west of Toowoomba. This bypass requires funding from the Commonwealth Government and no decision has been made on when work on the bypass might start.
Transport issues and challenges for Lockyer Valley
• the need for heavy vehicle bypasses in Laidley, Gatton and Helidon
• the need for park ‘n’ ride and interchange facilities for bus commuters especially at Plainlands
• the location of villages, especially Withcott, and other development across the Warrego Highway resulting in safety issues due to local traffic needing to cross
• the need to limit access points along the Warrego Highway
• the use of back roads by commuters driving to Ipswich because of highway congestion.
Partnering with Lockyer Valley Regional Council
• encouraging the promotion of community transport services within the townships and between the townships and villages
• encouraging active transport in the townships by the provision of walking and cycling paths to and between community facilities.
2031 transport network for Lockyer Valley
By 2031 a network of local roads caters for the needs of residents to travel within Lockyer Valley with a limited number of grade separated crossings of the Warrego Highway. Heavy vehicles from local industrial areas bypass the townships to access the highway.
Bus services connect to Ipswich rail services with high quality bus stops along the Warrego Highway equipped with park ‘n’ ride and kiss ‘n’ ride facilities.
Local public transport is provided in Gatton and community transport links the villages to the larger towns. A network of bicycle and walking paths allows for safe travel within the towns and villages and, where practical, connecting villages to Gatton or Laidley.
114 Draft Connecting SEQ 2031
Transport and Main Roads, Connecting SEQ 2031 – An Integrated Regional Transport Plan for South East Queensland, 2010
DRAF
T

Scenic Rim Regional Council
Population in 2006: 34 800
Indicative planning population in 2031: 71 000
Annual population growth rate: 2.9%
The Scenic Rim covers the southern area of SEQ between the cities of Logan and Ipswich and the Queensland border. There are two towns – Beaudesert (the Principal Rural Activity Centre) and Boonah. There are also a number of villages, principally in the Fassifern Valley and the mountains along the eastern boundary behind the Gold Coast.
The main transport routes are the Cunningham Highway running to the south west, which links Brisbane to Sydney and the Mt Lindesay Highway running south, which links the area to Brisbane and northern New South Wales. These are identified as Priority One and Priority Two freight routes in the SEQ Regional Plan. The interstate standard gauge rail line also runs south through the area.
The main industries have been agriculture, tourism and forestry but the establishment of the Bromelton State Development Area will see the focus move to industrial and logistics businesses. The eastern half of the council area has always been influenced by the southern spread of the Brisbane and Ipswich urban areas and this will continue into the future with the eventual development of Greater Flagstone over the northern border in Logan city. Bromelton will be an employment destination not only for the residents of Scenic Rim but also Brisbane and Logan Cities, particularly the greenfield areas of Flagstone and Yarrabilba.
Transport issues and challenges for Scenic Rim
• the need for a heavy vehicle bypass of Beaudesert on the Mt Lindesay Highway
• the need to bypass Tamborine Mountain because of traffic and parking issues
• the need to preserve the Beaudesert to Nerang Road corridor
• the need to plan and preserve an east-west corridor in the long term
• the need to plan for road connections between Logan, Bromelton and Beaudesert.
2031 transport network for Scenic Rim
The future transport network needs are dominated by the development of the major Bromelton industrial area and the build up of population growth in the south of Logan City Council.
Bromelton will be a multi-modal freight terminal on the interstate rail line, acting as a logistics hub for southern SEQ. It requires an upgrade of Mt Lindesay Highway and a western bypass of Beaudesert. It may also be linked by rail with the Ebenezer industrial area with the construction of the Southern freight rail line.
Partnering with Scenic Rim Regional Council
• encouraging the promotion of community transport services within the townships and between the townships and villages
• encouraging active transport in the townships by the provision of walking and cycling paths to and between community facilities
• ensuring the planning and preservation of bypass and arterial routes around Beaudesert.
The extension of the Gateway Motorway to Jimboomba will be required to serve Flagstone and Yarrabilba and this will provide the main connection between Bromelton and Brisbane, including the port.
The upgrade of the Mt Lindesay Highway connection to Logan and the extension of passenger rail to Flagstone will ease travel between Brisbane and Beaudesert. The upgrade of the Cunningham Highway will provide faster access to Ipswich for residents in the west of Scenic Rim.
The town of Beaudesert will be serviced by public transport and community transport will service the smaller towns to connect them to the urban area to the north. A network of cycle and walking paths will provide safe access to community facilities in the various towns.
PART D - What it means for your community 115
Transport and Main Roads, Connecting SEQ 2031 – An Integrated Regional Transport Plan for South East Queensland, 2010
DRAF
T

Somerset Regional Council
Sunshine Coast Regional Council
Lockyer Valley Regional Council
Scenic Rim Regional Council
Moreton Bay Regional Council
Brisbane City
Council
Gold Coast City Council
Logan City Council
Redland City
CouncilIpswich City
Council
MORETON
BAY
BeaudesertBoonah
Laidley
Gatton
Kilcoy
Esk
FernvaleLowood
Toowoomba
Toogoolawah
Withcott
Bromelton
Grandchester
Gowrie
12
3
4
6
5
Map not to scale
Principal rural activity centre
Major rural activity centre
Accessible business and industry area
Existing major road
Existing rail line
Proposed strategic road corridor
Proposed strategic rail corridor (subject to Commonwealth planning study)
Enhanced existing corridor
KEY
Strategic Projects
1. Toowoomba bypass Withcott to Toowoomba
2. Preserve rail line from Gowrie to Grandchester
3. Upgrade Gatton–Esk
4. Upgrade Warrego Highway and Brisbane Valley Highway interchange
5. Heavy vehicle bypass of Beaudesert
6. Mt Lindesay Highway upgrade to Gateway Motorway extension
Map 10.1 – 2031 strategic projects rural communities
116 Draft Connecting SEQ 2031
Transport and Main Roads, Connecting SEQ 2031 – An Integrated Regional Transport Plan for South East Queensland, 2010
DRAF
T