part 8: conclusion - college of agriculture & natural ... · part 8: conclusion p lacemaking is...
TRANSCRIPT

understanding the values of, perceptions of and barriers to placemaking
land
pol
icy
inst
itut
e
BASED ON THE RESULTS FROM THE HEDONIC PRICING ANALYSES OF THREE MICHIGAN CITIES, PLACEMAKING FEATURES AFFECT PROPERTIES IN VARIOUS WAYS. THE RESULTS BORNE FROM THESE ANALYSES OUGHT TO BE HELPFUL IN UNDERSTANDING WAYS TO INCREASE HOUSING VALUES THAT, IN TURN, CAN BENEFIT THE COMMUNITY THROUGH AN INCREASED DESIRE TO LIVE AND WORK IN THOSE COMMUNITIES, ALONGSIDE INCREASED TAX REVENUES. HOWEVER, THIS SHOULD REMAIN IN THE CONTEXT OF KEEPING AFFORDABLE WORKFORCE HOUSING SUPPLIES AT LEVELS SOUGHT BY THE LOCAL WORKFORCE.
Part 8: Conclusion
Placemaking is not a new concept. However,
in recent years, several cities and regions
have become increasingly engaged in using
it as an economic development tool, a population
attraction mechanism, and more simply, a brand.
Recognizing that people like nice, vibrant
places with a variety of things to do, many cities,
townships and regions have come to terms with
the fact that economic growth is not automatic
and that place matters. In the case of Michigan,
whose many cities and regions have been built to
efficiently move automobile traffic, it is necessary
to ask if redevelopment and placemaking in the
future will be based on subsidies and incentives; or
will they be based on a cadre of “placemakers” who
care deeply about, and are committed to providing,
a high quality of life and creating a strong sense
of place? Will they have the support, data and
information needed to make it happen?
The real estate development aspect of
placemaking has the ability to attract people and
jobs, but tends to be more expensive to build
and, as a result, more risky to fund. The literature
and a review of some case studies highlight
regulatory barriers (mostly zoning), public
perception problems and avoidance of density,
which has promoted an automobile-friendly built
environment, and past failed public programs
(urban renewal and public housing programs)
Michigan State University campus, East Lansing.
65
full
repo
rt
BUILDING PROSPEROUS PLACES IN MICHIGAN
that have typically prevented placemaking
from blossoming. As the contemporary form of
placemaking has emerged—one that encourages
public space surrounded by increased density,
promotes sense of place and vibrancy and
encourages progressive real estate development—
it has been criticized as being more expensive to
build. Thus, developers sometimes struggle to get
banks and other funding sources to finance them.
Consequently, they seek incentives and subsidies,
often in the form of brownfield tax credits for
redevelopment and other state or locally based
credits for new or other forms of redevelopment.
While placemaking has been elevated to a
position of being a desirable development and
redevelopment platform for leveraging economic
development and attracting knowledge and
talented workers, there are challenges associated
with providing affordable housing to segments
of the workforce that cannot afford some of the
more expensive elements of these developments.
A body of literature exists on the affordability
problems in many of America’s largest cities.
The result is that many workforce population
segments cannot afford to live where they
work. Thus, they live outside of the city where
they can afford housing, but then spend more
on private transportation. Regionally, this
impacts both the quality of life of residents
and the overall congestion and infrastructure
stress placed on local services. However, there
are model programs out there that have been
able to balance placemaking with affordable
and workforce housing. In Appendix F, there is
a list of resources available that detail success
stories. Publications by Smart Growth America
and the Urban Land Institute have led the way
in illustrating the balance between these two
seemingly contrasting objectives.
In some communities developers are able to
incorporate workforce and/or affordable housing
through credits (incentives), or are required to do
so through regulations. Developers can receive
tax credits or other benefits if they designate a
certain percentage of a residential development
as affordable. On the other hand, some local
governments require that multi-family or other
mixed-use developments include a pre-designated
proportion of affordable housing. Based on our
survey results, affordable and/or workforce
housing seems to be important to developers and
local officials, but in practice, it is seldom utilized.
While placemaking has been recognized as being a desirable development and redevelopment platform for leveraging
economic development and attracting knowledge and talented workers, there are challenges associated with providing
affordable housing to segments of the workforce due to the more expensive elements of some of these developments.
66
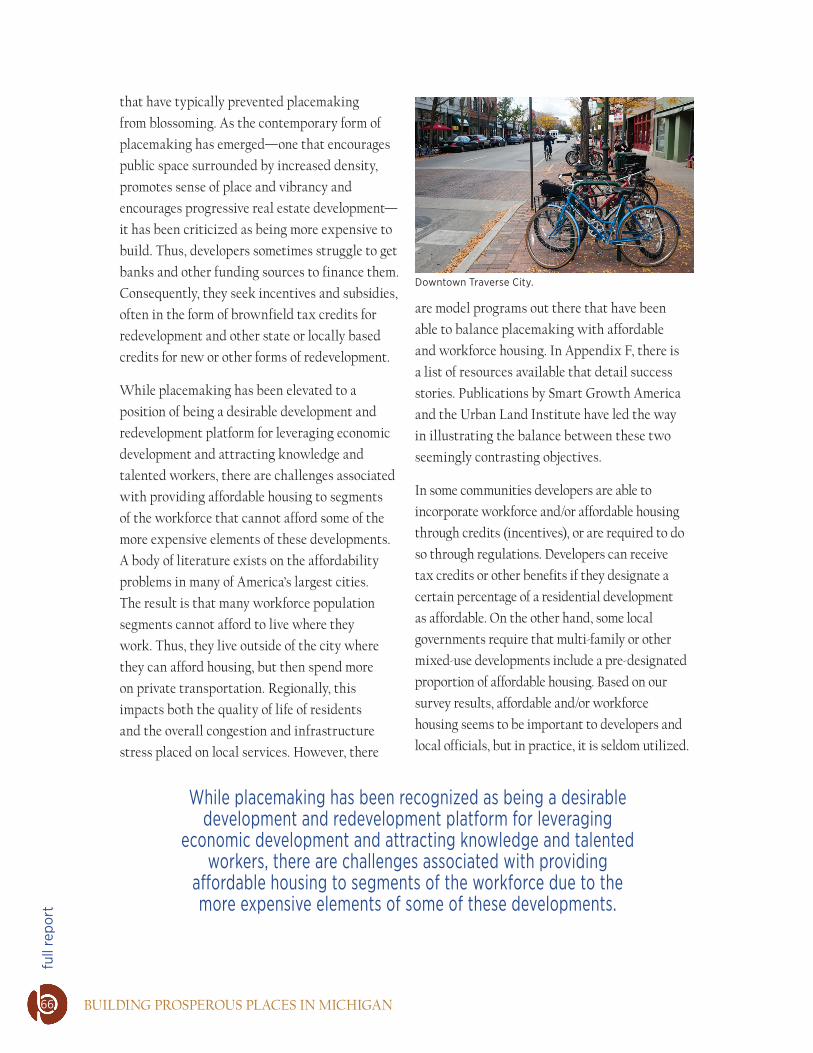
Downtown Traverse City.

understanding the values of, perceptions of and barriers to placemaking
land
pol
icy
inst
itut
e
Based on the results from the hedonic pricing
analyses of three Michigan cities, placemaking
features affect properties in various ways. The
results borne from these analyses ought to be
helpful in understanding ways to increase housing
values that, in turn, can benefit the community
through an increased desire to live and work
in those communities, alongside increased tax
revenues. However, this should remain in the
context of keeping affordable workforce housing
supplies at levels sought by the local workforce. As
mentioned in the Part detailing Recommendations,
it would be beneficial to understand the value
accrual of placemaking features, as measured by
property values or home sale prices.
More importantly, the hedonic pricing method
furnished numerous estimates for the value of
placemaking elements. Schools, parks, stores, green
infrastructure and other important placemaking
features were often found to significantly and
positively affect sale prices in the three case study
cities of Lansing, Traverse City and Royal Oak.
Since each city is different in terms of its economy,
socio-economic indicators, size and other factors,
the results highlight differences between cities
and come close to explaining why these differences
occur. The findings present information that
has not been seen before for these cities. Policy
makers, bankers, residents, academics, real estate
professionals and planners can benefit from the
information garnered in this report.
Finally, it will be possible to explore results for
more cities in the future. Through another grant
made possible by the Michigan State Housing
Development Authority and the Michigan
Association of Realtors, we are extending this
analysis to include three additional Michigan
cities and six Midwest cities outside of the
state. One objective will be to see how the
added Michigan cities fare compared to the in-
state cities presented in this report, as well as
similarly sized cities in other Midwest states.
The data made available by several cities, and the
processing of spatial information using GIS make
this both an interesting
exercise in research,
as well as practice.
Knowing precisely how
placemaking affects
property values and to
what extent, is valuable
information. Refining
the methods, collecting
additional data and
continuing the research
on placemaking value
contributions will help
communities, developers, bankers, citizens and
others better understand the value of placemaking
features. Furthermore, assigning a price of
neighborhood, community and other housing
features on property value can pave the way for
future research and, as a result, could provide
exceptional tools that help communities leverage
their placemaking plans and, thus, continue to
build on their sense of place and placemaking
goals well into the 21st Century.
We are extending this analysis to include three additional Michigan cities and six Midwest cities outside of the state. One objective will be to see how the added Michigan cities fare compared to the in-state cities presented in this report, as well as similarly sized cities in other Midwest states.
67

full
repo
rt
BUILDING PROSPEROUS PLACES IN MICHIGAN68

understanding the values of, perceptions of and barriers to placemaking
land
pol
icy
inst
itut
e
Variable Data Source* Data Calculations
Sale Year 2001 1, 9, 11 –
Sale Year 2002 1, 9, 11 –
Sale Year 2003 1, 9, 11 –
Sale Year 2004 1, 9, 11 –
Sale Year 2005 1, 9, 11 –
Sale Year 2006 1, 9, 11 –
Sale Year 2007 1, 9, 11 –
Sale Year 2008 1, 9, 11 –
Sale Year 2009 1, 9, 11 –
Sale Year 2010 1, 9, 11 –
Property Sales in December, January and February 1, 9, 11 –
Property Sales in March, April and May 1, 9, 11 –
Property Sales in September, October and November 1, 9, 11 –
Property Square Feet 1, 9, 11 –
Age of Property (2010–Year Built) 1, 9, 11 –
# of Bedrooms 1, 9, 11 –
# of Full-Baths 1, 9, 11 –
# of Half-Baths 1, 9, 11 –
Square Footage of the House 1, 9, 11 –
Heating Fuel Type 1, 9, 11 –
House Exterior Type 1, 9, 11 –
Central Air in Home 1, 9, 11 –
Basement Square Footage 1, 9, 11 –
Total Square Footage of Porches and Decks 1, 9, 11 –
Garage Area in Square Feet (Lansing/Traverse City) 1, 11 –
Garage Y/N (Royal Oak) 9 –
Appendix A: Data Sources
Table 5: Data Sources
Part 9: Appendices
*Listing of Data Sources:– No data calculations were performed for this variable.
1. City of Lansing Assessor’s Office, Lansing, MI 2010.2. City of Lansing GIS Department, Lansing, MI, 2010.3. City of Lansing Police Department, Lansing, MI, 2010.4. Environmental Systems Research Institute, StreetMap, USA, 2006.5. U.S. Census Bureau, 2010 Census Data.6. U.S. Census Bureau, American Community Survey, 2005-2009 Five-Year Estimates.7. U.S. Department of Education, Institute of Education Sciences, National Center for Education Statistics.8. Walls and Associates, NETS: National Establishment Time-Series Database, 2007, Oakland, CA.9. City of Royal Oak Assessor’s Office, Royal Oak, MI, 2010.10. City of Royal Oak Police Department, Royal Oak, MI, 2010.11. City of Traverse City Assessor’s Office, Traverse City, MI, 2010.12. City of Traverse City Police Department, Traverse City, MI, 2010.13. Michigan State University, Land Policy Institute, East Lansing, MI, 2011.14. Michigan Geographic Data Library, Lansing, MI, 2011.15. Conservation and Recreation Lands, Great Lakes/Atlantic Regional Office, 2011.
69

full
repo
rt
BUILDING PROSPEROUS PLACES IN MICHIGAN
Variable Data Source* Data Calculations
Pool Size in Square Feet 1, 9, 11 –
# of Fireplaces 1, 9, 11 –
Sale in Active Neighborhood Enterprise Zone 1, 9, 11 –
Renaissance Zone 1, 9, 11 –
Condominiums 1, 9, 11 –
Stories in Home 1, 9, 11 –
# of Property Crimes from 2000–2010 within a ½ Mile of Parcel 3, 10, 12 –
# of Violent Crimes from 2000–2010 within a ½ Mile of Parcel 3, 10, 12 –
Median Household Income within Block Group: 2005–2009 6 –
Income Diversity Index 6 Diversity Index
Racial Diversity Index: 2010 5 Diversity Index
% of Poverty in Census Tract: 2005–2009 6 –
% of Population Age 25 and Older with a High School Degree: 2005–2009 6 –
% of Population Age 25 and Older with a Associate’s Degree: 2005–2009 6 –
% of Population Age 25 and Older with a Bachelor’s Degree: 2005–2009 6 –
% of Population Age 25 and Older with a Graduate or Professional Degree: 2005–2009 6
–
Age Diversity Index 6 Diversity Index
Children Ages 5 to 17 6 –
Distance to Closest Interstate in Feet (Lansing/Royal Oak) 4 Distance Calculated in GIS
Distance to Closest River in Feet 14 Distance Calculated in GIS
Distance to Closest Lake in Feet 14 Distance Calculated in GIS
Distance to Closest Park in Feet 15 Distance Calculated in GIS
Distance to the River Trail in Feet (Lansing) 2 Distance Calculated in GIS
Distance to Lake Michigan in Feet (Traverse City) 13 Distance Calculated in GIS
Distance to Nearest Airport in Feet 4 Distance Calculated in GIS
Distance to Downtown in Feet 13 Distance Calculated in GIS
Distance to Old Town in Feet (Lansing) 13 Distance Calculated in GIS
Distance to the Michigan Ave. Corridor in Feet (Lansing) 13 Distance Calculated in GIS
Distance to Nearest University in Feet 13 Distance Calculated in GIS
Distance to Closest Primary School in Feet 7 Distance Calculated in GIS
Distance to Closest Middle School in Feet 7 Distance Calculated in GIS
Distance to Closest High School in Feet 7 Distance Calculated in GIS
Motor Vehicle and Parts Dealers 8 Prevalence Calculated in GIS
Furniture and Home Furnishing Stores 8 Prevalence Calculated in GIS
Electronics and Appliance Stores 8 Prevalence Calculated in GIS
Building Material/Garden Equipment/Supply Dealers 8 Prevalence Calculated in GIS
Grocery Stores 8 Prevalence Calculated in GIS
Specialty Food Stores 8 Prevalence Calculated in GIS
Table 5: Data Sources (cont.)
70

understanding the values of, perceptions of and barriers to placemaking
land
pol
icy
inst
itut
e
Variable Data Source* Data Calculations
Beer, Wine and Liquor Stores 8 Prevalence Calculated in GIS
Health and Personal Care Stores 8 Prevalence Calculated in GIS
Gasoline Stations 8 Prevalence Calculated in GIS
Clothing and Clothing Accessories Stores 8 Prevalence Calculated in GIS
Sporting Goods, Hobby and Musical Instrument Stores 8 Prevalence Calculated in GIS
Book, Periodical and Music Stores 8 Prevalence Calculated in GIS
General Merchandise Stores 8 Prevalence Calculated in GIS
Miscellaneous Store Retailers 8 Prevalence Calculated in GIS
Performing Arts Companies 8 Prevalence Calculated in GIS
Spectator Sports 8 Prevalence Calculated in GIS
Promoters of Performing Arts, Sports and Similar Events 8 Prevalence Calculated in GIS
Museums, Historical Sites and Similar Institutions 8 Prevalence Calculated in GIS
Gambling Industries 8 Prevalence Calculated in GIS
Amusement Parks and Arcades 8 Prevalence Calculated in GIS
Other Amusement and Recreation Industries 8 Prevalence Calculated in GIS
Full-Service Restaurants 8 Prevalence Calculated in GIS
Limited-Service Eating Places 8 Prevalence Calculated in GIS
Drinking Places (Alcoholic Beverages) 8 Prevalence Calculated in GIS
Religious Organizations 8 Prevalence Calculated in GIS
% Class-Exempt Property within a ½ Mile of Property in Square Feet 8 Proportion Calculated in GIS
% Commercial Property within a ½ Mile of Property in Square Feet 8 Proportion Calculated in GIS
% Residential Property within a ½ Mile of Property in Square Feet 8 Proportion Calculated in GIS
% Class Land Bank Property within a ½ Mile of Property in Square Feet 8 Proportion Calculated in GIS
% of Area within a ½ Mile of the Parcel with Unknown Use 8 Proportion Calculated in GIS
# of Businesses within 1 Mile 8 Prevalence Calculated in GIS
# of Employees within 1 Mile 8 Prevalence Calculated in GIS
Table 5: Data Sources (cont.)
*Listing of Data Sources:– No data calculations were performed for this variable.
1. City of Lansing Assessor’s Office, Lansing, MI 2010.2. City of Lansing GIS Department, Lansing, MI, 2010.3. City of Lansing Police Department, Lansing, MI, 2010.4. Environmental Systems Research Institute, StreetMap, USA, 2006.5. U.S. Census Bureau, 2010 Census Data.6. U.S. Census Bureau, American Community Survey, 2005-2009 Five-Year Estimates.7. U.S. Department of Education, Institute of Education Sciences, National Center for Education Statistics.8. Walls and Associates, NETS: National Establishment Time-Series Database, 2007, Oakland, CA.9. City of Royal Oak Assessor’s Office, Royal Oak, MI, 2010.10. City of Royal Oak Police Department, Royal Oak, MI, 2010.11. City of Traverse City Assessor’s Office, Traverse City, MI, 2010.12. City of Traverse City Police Department, Traverse City, MI, 2010.13. Michigan State University, Land Policy Institute, East Lansing, MI, 2011.14. Michigan Geographic Data Library, Lansing, MI, 2011.15. Conservation and Recreation Lands, Great Lakes/Atlantic Regional Office, 2011.
71

full
repo
rt
BUILDING PROSPEROUS PLACES IN MICHIGAN
Lansing, MI
Description Mean Std. Dev. Min. Max.
Sale Price $93,342.36 $45,916.12 $500.00 $1,188,250.00
Sale Year 2000 0.12 0.32 0 1
Sale Year 2001 0.14 0.35 0 1
Sale Year 2002 0.12 0.33 0 1
Sale Year 2003 0.12 0.32 0 1
Sale Year 2004 0.12 0.33 0 1
Sale Year 2005 0.14 0.35 0 1
Sale Year 2006 0.09 0.28 0 1
Sale Year 2007 0.05 0.21 0 1
Sale Year 2008 0.03 0.18 0 1
Sale Year 2009 0.04 0.21 0 1
Sale Year 2010 0.03 0.18 0 1
Property Sales in December, January and February 0.22 0.42 0 1
Property Sales in March, April and May 0.26 0.44 0 1
Property Sales in September, October and November 0.23 0.42 0 1
Property Square Feet 8,472.18 7,017.09 0 165,266.64
Age of Property (2010–Year Built) 60.76 120.41 1 2,010
# of Bedrooms (Not Reported for All Properties) 2.79 0.84 1 22
# of Full-Baths 1.17 0.46 0 8
# of Half-Baths 0.41 0.55 0 3
Square Footage of the House 1,186.51 463.84 0 9,576
Heating Fuel – Coal 0 0.03 0 1
Heating Fuel – Gas 0.88 0.33 0 1
Heating Fuel – Oil 0.05 0.22 0 1
Heating Fuel – Steam (City Provided) 0 0.05 0 1
House Exterior – Asbestos 0.01 0.10 0 1
House Exterior – Asphalt 0 0.05 0 1
House Exterior – Block 0 0.06 0 1
House Exterior – Brick 0.04 0.20 0 1
House Exterior – Wood 0.21 0.41 0 1
House Exterior – Stucco 0 0.06 0 1
House Exterior – Vinyl 0.01 0.08 0 1
Central Air in Home 0.34 0.47 0 1
Basement Square Footage 694.16 415.79 0 3,807
Total Square Footage of Porches and Decks 131.93 121.30 0 967
Garage Area in Square Feet 262.23 229.97 0 1,435
Pool Size in Square Feet 13.74 92.05 0 800
Table 6: Descriptive Statistics - Lansing, MIAppendix B: Descriptive Statistics
72

understanding the values of, perceptions of and barriers to placemaking
land
pol
icy
inst
itut
e
Lansing, MI
Description Mean Std. Dev. Min. Max.
# of Fireplaces 0.25 0.49 0 6
Neighborhood Enterprise Zone 0.02 0.13 0 1
Renaissance Zone 0 0.03 0 1
Condominiums 0.11 0.32 0 1
Stories in Home 1.34 0.42 1 2.50
# of Property Crimes from 2000–2010 within a ½ Mile of Parcel 3,556.10 2,685.67 177 15,739
# of Violent Crimes from 2000–2010 within a ½ Mile of Parcel 760.76 512.97 23 2,770
Median Household Income within Block Group: 2005–2009 42,592.62 14,033.59 11,172 86,932
Income Diversity Index 0.88 0.03 0.49 0.93
Racial Diversity Index: 2010 0.45 0.17 0 0.78
% of Poverty in Census Tract: 2005–2009 0.23 0.09 0.04 0.51
% of Population Age 25 and Older with a High School Degree: 2005–2009 0.31 0.09 0.07 0.43
% of Population Age 25 and Older with an Associate's Degree: 2005–2009 0.08 0.02 0.03 0.13
% of Population Age 25 and Older with a Bachelor's Degree: 2005–2009 0.13 0.08 0.03 0.32
% of Population Age 25 and Older with a Graduate or Professional Degree: 2005–2009 0.06 0.05 0 0.31
Age Diversity Index 0.73 0 0.70 0.74
Children Age 5 to 17 0.17 0.06 0.02 0.36
Distance to Closest Interstate in Feet 6,851.11 4,029.45 160.14 15,110.37
Distance to Closest River in Feet 4,557.24 2,919.92 123.08 14,278.59
Distance to Closest Lake in Feet 3,331.05 1,795.94 54.62 9,394.47
Distance to Closest Park in Feet 963.36 586.39 6.20 3,441.61
Distance to the River Trail in Feet 9,202.52 5,836.61 115.49 22,689.06
Distance to Lansing Airport in Feet 23,552.85 11,473.28 3,224.31 46,879.50
Distance to Downtown in Feet 14,702.39 6,419.19 1,430.52 29,304.17
Distance to Old Town in Feet 15,575.71 9,352.52 993.11 34,003.38
Distance to the Michigan Ave. Corridor in Feet 13,648.43 7,140.33 168.40 28,768.03
Distance to MSU in Feet 24,585.63 7,722.47 7,791.75 39,908.07
Distance to Closest Primary School in Feet 2,338.66 1,223.70 119.99 6,184.10
Distance to Closest Middle School in Feet 6,014.15 3,138.78 152.28 14,496.15
Distance to Closest High School in Feet 7,806.21 2,948.66 171.16 13,682.47
Motor Vehicle and Parts Dealers within a ¼ Mile 0.47 1.13 0 8
Motor Vehicle and Parts Dealers within a ¼ Mile – a ½ Mile 1.92 2.52 0 15
Motor Vehicle and Parts Dealers within a ½ Mile – 1 Mile 5.96 5.15 0 23
Motor Vehicle and Parts Dealers within 1 Mile – 1 ½ Miles 8.64 6.07 0 32
Furniture and Home Furnishings Stores within a ¼ Mile 0.19 0.45 0 3
Table 6: Descriptive Statistics - Lansing, MI (cont.)
73

full
repo
rt
BUILDING PROSPEROUS PLACES IN MICHIGAN
Lansing, MI
Description Mean Std. Dev. Min. Max.
Furniture and Home Furnishings Stores within a ¼ Mile – a ½ Mile 0.62 0.91 0 5
Furniture and Home Furnishings Stores within a ½ Mile – 1 Mile 2.36 1.79 0 8
Furniture and Home Furnishings Stores within 1 Mile – 1 ½ Miles 4.09 2.33 0 12
Electronics and Appliance Stores within a ¼ Mile 0.20 0.57 0 6
Electronics and Appliance Stores within a ¼ Mile – a ½ Mile 0.85 1.20 0 7
Electronics and Appliance Stores within a ½ Mile – 1 Mile 2.93 2.26 0 14
Electronics and Appliance Stores within 1 Mile – 1 ½ Miles 4.59 3.35 0 16
Building Material/Garden Equipment/Supplies Dealers within a ¼ Mile 0.25 0.57 0 3
Building Material/Garden Equipment/ Supplies Dealers within a ¼ Mile – a ½ Mile 0.91 1.20 0 6
Building Material/Garden Equipment/ Supplies Dealers within a ½ Mile – 1 Mile 3.07 2.44 0 9
Building Material/Garden Equipment/ Supplies Dealers within 1 Mile – 1 ½ Miles 4.55 2.61 0 14
Grocery Stores within a ¼ Mile 0.33 0.69 0 5
Grocery Stores within a ¼ Mile – a ½ Mile 1.10 1.18 0 6
Grocery Stores within a ½ Mile – 1 Mile 4.06 2.94 0 16
Grocery Stores within 1 Mile – 1 ½ Miles 7.17 3.77 0 18
Specialty Food Stores within a ¼ Mile 0.12 0.38 0 4
Specialty Food Stores within a ¼ Mile – a ½ Mile 0.34 0.68 0 4
Specialty Food Stores within a ½ Mile – 1 Mile 1.38 1.84 0 10
Specialty Food Stores within 1 Mile – 1 ½ Miles 2.27 2.13 0 11
Beer, Wine and Liquor Stores within a ¼ Mile 0.08 0.33 0 2
Beer, Wine and Liquor Stores within a ¼ Mile – a ½ Mile 0.23 0.55 0 3
Beer, Wine and Liquor Stores within a ½ Mile – 1 Mile 0.75 1.06 0 6
Beer, Wine and Liquor Stores within 1 Mile – 1 ½ Miles 1.07 1.36 0 7
Health and Personal Care Stores within a ¼ Mile 0.23 0.62 0 5
Health and Personal Care Stores within a ¼ Mile – a ½ Mile 0.95 1.57 0 14
Health and Personal Care Stores within a ½ Mile – 1 Mile 3.07 3.33 0 19
Health and Personal Care Stores within 1 Mile – 1 ½ Miles 5.44 4.39 0 25
Gasoline Stations within a ¼ Mile 0.15 0.40 0 4
Gasoline Stations within a ¼ Mile – a ½ Mile 0.44 0.67 0 4
Gasoline Stations within a ½ Mile – 1 Mile 1.43 1.33 0 8
Gasoline Stations within 1 Mile – 1 ½ Miles 2.44 1.73 0 12
Clothing and Clothing Accessories Stores within a ¼ Mile 0.56 0.78 0 5
Clothing and Clothing Accessories Stores within a ¼ Mile – a ½ Mile 1.76 2.08 0 17
Clothing and Clothing Accessories Stores within a ½ Mile – 1 Mile 6.62 4.60 0 26
Clothing and Clothing Accessories Stores within 1 Mile – 1 ½ Miles 9.61 6.33 1 43
Table 6: Descriptive Statistics - Lansing, MI (cont.)
74
understanding the values of, perceptions of and barriers to placemaking
land
pol
icy
inst
itut
e
Lansing, MI
Description Mean Std. Dev. Min. Max.
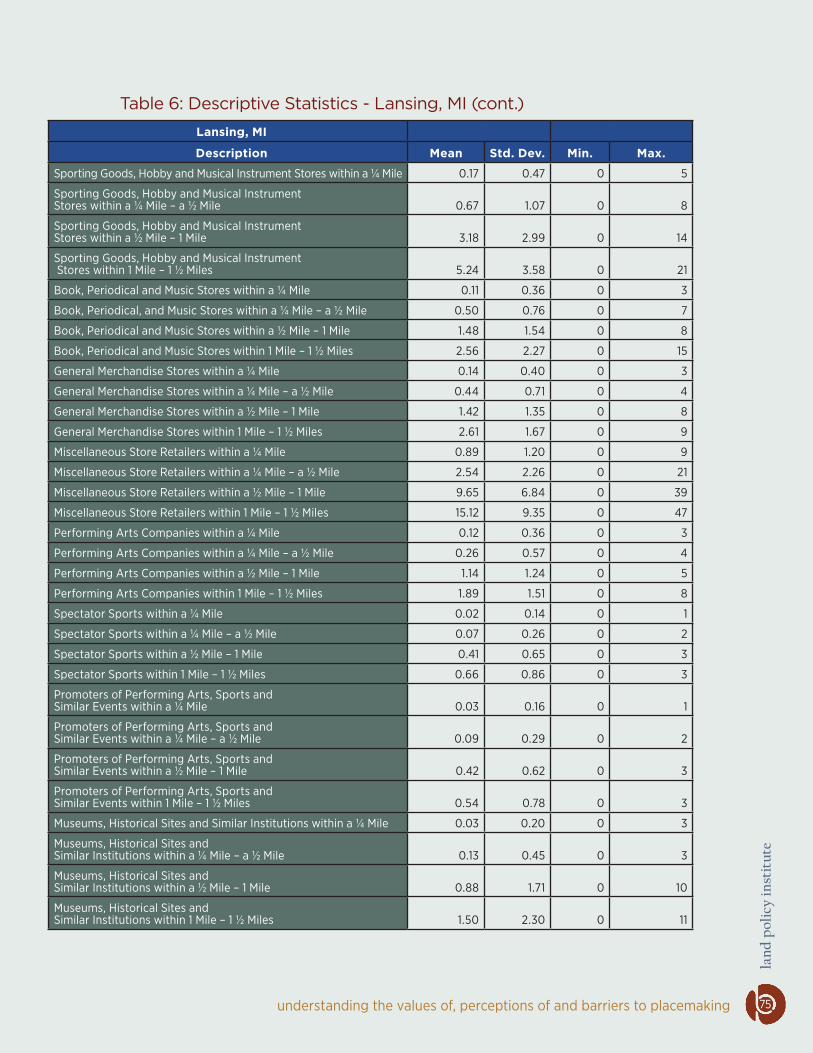
Sporting Goods, Hobby and Musical Instrument Stores within a ¼ Mile 0.17 0.47 0 5
Sporting Goods, Hobby and Musical Instrument Stores within a ¼ Mile – a ½ Mile 0.67 1.07 0 8
Sporting Goods, Hobby and Musical Instrument Stores within a ½ Mile – 1 Mile 3.18 2.99 0 14
Sporting Goods, Hobby and Musical Instrument Stores within 1 Mile – 1 ½ Miles 5.24 3.58 0 21
Book, Periodical and Music Stores within a ¼ Mile 0.11 0.36 0 3
Book, Periodical, and Music Stores within a ¼ Mile – a ½ Mile 0.50 0.76 0 7
Book, Periodical and Music Stores within a ½ Mile – 1 Mile 1.48 1.54 0 8
Book, Periodical and Music Stores within 1 Mile – 1 ½ Miles 2.56 2.27 0 15
General Merchandise Stores within a ¼ Mile 0.14 0.40 0 3
General Merchandise Stores within a ¼ Mile – a ½ Mile 0.44 0.71 0 4
General Merchandise Stores within a ½ Mile – 1 Mile 1.42 1.35 0 8
General Merchandise Stores within 1 Mile – 1 ½ Miles 2.61 1.67 0 9
Miscellaneous Store Retailers within a ¼ Mile 0.89 1.20 0 9
Miscellaneous Store Retailers within a ¼ Mile – a ½ Mile 2.54 2.26 0 21
Miscellaneous Store Retailers within a ½ Mile – 1 Mile 9.65 6.84 0 39
Miscellaneous Store Retailers within 1 Mile – 1 ½ Miles 15.12 9.35 0 47
Performing Arts Companies within a ¼ Mile 0.12 0.36 0 3
Performing Arts Companies within a ¼ Mile – a ½ Mile 0.26 0.57 0 4
Performing Arts Companies within a ½ Mile – 1 Mile 1.14 1.24 0 5
Performing Arts Companies within 1 Mile – 1 ½ Miles 1.89 1.51 0 8
Spectator Sports within a ¼ Mile 0.02 0.14 0 1
Spectator Sports within a ¼ Mile – a ½ Mile 0.07 0.26 0 2
Spectator Sports within a ½ Mile – 1 Mile 0.41 0.65 0 3
Spectator Sports within 1 Mile – 1 ½ Miles 0.66 0.86 0 3
Promoters of Performing Arts, Sports and Similar Events within a ¼ Mile 0.03 0.16 0 1
Promoters of Performing Arts, Sports and Similar Events within a ¼ Mile – a ½ Mile 0.09 0.29 0 2
Promoters of Performing Arts, Sports and Similar Events within a ½ Mile – 1 Mile 0.42 0.62 0 3
Promoters of Performing Arts, Sports and Similar Events within 1 Mile – 1 ½ Miles 0.54 0.78 0 3
Museums, Historical Sites and Similar Institutions within a ¼ Mile 0.03 0.20 0 3
Museums, Historical Sites and Similar Institutions within a ¼ Mile – a ½ Mile 0.13 0.45 0 3
Museums, Historical Sites and Similar Institutions within a ½ Mile – 1 Mile 0.88 1.71 0 10
Museums, Historical Sites and Similar Institutions within 1 Mile – 1 ½ Miles 1.50 2.30 0 11
Table 6: Descriptive Statistics - Lansing, MI (cont.)
75

full
repo
rt
BUILDING PROSPEROUS PLACES IN MICHIGAN
Lansing, MI
Description Mean Std. Dev. Min. Max.
Amusement Parks and Arcades within a ¼ Mile 0.03 0.20 0 3
Amusement Parks and Arcades within a ¼ Mile – a ½ Mile 0.13 0.45 0 3
Amusement Parks and Arcades within a ½ Mile – 1 Mile 0.88 1.71 0 10
Amusement Parks and Arcades within 1 Mile – 1 ½ Miles 1.50 2.30 0 11
Other Amusement and Recreation Industries within a ¼ Mile 0.20 0.49 0 3
Other Amusement and Recreation Industries within a ¼ Mile – a ½ Mile 0.76 1.12 0 7
Other Amusement and Recreation Industries within a ½ Mile – 1 Mile 3.38 2.32 0 15
Other Amusement and Recreation Industries within 1 Mile – 1 ½ Miles 5.22 3.14 0 17
Full-Service Restaurants within a ¼ Mile 0.54 0.99 0 7
Full-Service Restaurants within a ¼ Mile – a ½ Mile 2.18 2.59 0 21
Full-Service Restaurants within a ½ Mile – 1 Mile 8.54 7.15 0 38
Full-Service Restaurants within 1 Mile – 1 ½ Miles 13.18 9.52 0 49
Limited-Service Eating Places within a ¼ Mile 0.19 0.56 0 4
Limited-Service Eating Places within a ¼ Mile – a ½ Mile 1.27 2.12 0 14
Limited-Service Eating Places within a ½ Mile – 1 Mile 3.72 4.14 0 21
Limited-Service Eating Places within 1 Mile – 1 ½ Miles 7.02 6.40 0 34
Drinking Places (Alcoholic Beverages) within a ¼ Mile 0.14 0.40 0 3
Drinking Places (Alcoholic Beverages) within a ¼ Mile – a ½ Mile 0.50 0.81 0 5
Drinking Places (Alcoholic Beverages) within a ½ Mile – 1 Mile 1.79 1.97 0 11
Drinking Places (Alcoholic Beverages) within 1 Mile – 1 ½ Miles 3.21 3.01 0 16
Religious Organizations within a ¼ Mile 1.24 1.37 0 12
Religious Organizations within a ¼ Mile – a ½ Mile 3.52 2.67 0 21
Religious Organizations within a ½ Mile – 1 Mile 11.65 5.87 0 34
Religious Organizations within 1 Mile – 1 ½ Miles 18.84 7.76 4 43
% of Class-Exempt Property within a ½ Mile of Property in Square Feet 0.20 0.10 0 0.63
% of Commercial Property within a ½ Mile of Property in Square Feet 0.12 0.10 0 0.58
% of Residential Property within a ½ Mile of Property in Square Feet 0.39 0.13 0 0.78
% of Class Land Bank Property within a ½ Mile of Property in Square Feet 0 0.01 0 0.04
% of Area within a ½ Mile of the Parcel within Unknown Use 0.23 0.17 0 0.81
# of Businesses within 1 Mile 583.86 318.51 146 1,983
# of Employees within 1 Mile 7,435.65 8,757.19 669 54,554
Table 6: Descriptive Statistics - Lansing, MI (cont.)
76

understanding the values of, perceptions of and barriers to placemaking
land
pol
icy
inst
itut
e
Traverse City, MI
Description Mean Std. Dev. Min. Max.
Sale Price $180,677.66 $132,282.09 $25,000.00 $2,900,000.00
Sale Year 2000 0.06 0.24 0 1
Sale Year 2001 0.07 0.26 0 1
Sale Year 2002 0.07 0.25 0 1
Sale Year 2003 0.09 0.28 0 1
Sale Year 2004 0.11 0.31 0 1
Sale Year 2005 0.09 0.29 0 1
Sale Year 2006 0.11 0.31 0 1
Sale Year 2007 0.11 0.31 0 1
Sale Year 2008 0.09 0.29 0 1
Sale Year 2009 0.08 0.27 0 1
Sale Year 2010 0.12 0.33 0 1
Property Sales in December, January and February 0.15 0.36 0 1
Property Sales in March, April and May 0.24 0.43 0 1
Property Sales in September, October and November 0.30 0.46 0 1
Property Square Feet 21,501.86 37,734.65 0 623,038.68
Age of the Property (2010–Year Built) 14.90 9.54 0 45
# of Bedrooms (Not Reported for All Properties) 2.86 1.16 1 23
# of Full-Baths 1.58 0.66 1 5
# of Half-Baths 0.30 0.48 0 2
Square Footage of the House 1,405.08 584.84 0 4,409
House Exterior – Asbestos 0.03 0.16 0 1
House Exterior – Asphalt 0.01 0.09 0 1
House Exterior – Block 0 0.06 0 1
House Exterior – Brick 0.04 0.19 0 1
House Exterior – Composition 0 0.03 0 1
House Exterior – Lap (Fiber Cement) 0.02 0.13 0 1
House Exterior – Masonite 0 0 0 0
House Exterior – Wood 0.52 0.50 0 1
House Exterior – Stone 0 0.03 0 1
House Exterior – Stucco 0 0.07 0 1
House Exterior – Vinyl 0.21 0.40 0 1
Garage Area in Square Feet 0.77 0.42 0 1
# of Fireplaces 0.38 0.57 0 4
Table 7: Descriptive Statistics - Traverse City, MIAppendix B: Descriptive Statistics (cont.)
77

full
repo
rt
BUILDING PROSPEROUS PLACES IN MICHIGAN
Traverse City, MI
Description Mean Std. Dev. Min. Max.
Condominiums 0.17 0.38 0 1
Stories in Home 1.34 0.43 1 3
Median Household Income within Block Group: 2005–2009 47,674.02 13,624.19 27,250 90,515
Racial Diversity Index: 2010 0.07 0.10 0 0.70
% of Poverty in Census Tract: 2005–2009 0.13 0.05 0.06 0.19
% of Population Age 25 and Older with a High School Degree: 2005–2009 0.23 0.04 0.17 0.36
% of Population Age 25 and Older with an Associate's Degree: 2005–2009 0.08 0.01 0.06 0.09
% of Population Age 25 and Older with a Bachelor's Degree: 2005–2009 0.23 0.04 0.08 0.34
% of Population Age 25 and Older with a Graduate or Professional Degree: 2005–2009 0.11 0.04 0.03 0.22
Children Age 5 to 17 0.13 0.06 0.04 0.23
Distance to Closest River in Feet 4,801.49 2,915.05 108.39 11,292.52
Distance to Closest Lake in Feet 4,950.79 3,352.34 121.03 13,120.49
Distance to Closest Park in Feet 1,702.52 1,504.69 0 7,168.80
Distance to Traverse City Airport in Feet 6,717.15 4,107.44 0 18,349.81
Distance to Northwestern Michigan College in Feet 8,605.72 4,973.52 710.47 20,525.50
Distance to Lake Michigan in Feet 3,079.43 2,089.24 55.88 10,397.60
Distance to Closest Primary School in Feet 2,876.87 1438.94 31.92 9358.77
Distance to Closest High School in Feet 7,584.46 4,161.53 398.10 18,722.40
Motor Vehicle and Parts Dealers within a ¼ Mile 0.29 0.62 0 4
Motor Vehicle and Parts Dealers within a ¼ Mile – a ½ Mile 0.82 1.02 0 5
Motor Vehicle and Parts Dealers within a ½ Mile – 1 Mile 3.41 2.50 0 16
Motor Vehicle and Parts Dealers within 1 Mile – 1 ½ Miles 5.53 3.86 0 18
Furniture and Home Furnishings Stores within a ¼ Mile 0.66 0.99 0 6
Furniture and Home Furnishings Stores within a ¼ Mile – a ½ Mile 1.85 2.12 0 10
Furniture and Home Furnishings Stores within a ½ Mile – 1 Mile 5.87 3.61 0 17
Furniture and Home Furnishings Stores within 1 Mile – 1 ½ Miles 9.18 5.86 0 24
Electronics and Appliance Stores within a ¼ Mile 0.79 1.14 0 5
Electronics and Appliance Stores within a ¼ Mile – a ½ Mile 2.28 2.29 0 9
Electronics and Appliance Stores within a ½ Mile – 1 Mile 7.01 4.61 0 20
Electronics and Appliance Stores within 1 Mile – 1 ½ Miles 8.76 4.63 0 23
Building Material/Garden Equipment/ Supplies Dealers within a ¼ Mile 0.24 0.65 0 4
Table 7: Descriptive Statistics - Traverse City, MI (cont.)
78

understanding the values of, perceptions of and barriers to placemaking
land
pol
icy
inst
itut
e
Traverse City, MI
Description Mean Std. Dev. Min. Max.
Building Material/Garden Equipment/ Supplies Dealers within a ¼ Mile – a ½ Mile 0.76 1.23 0 6
Building Material/Garden Equipment/ Supplies Dealers within a ½ Mile – 1 Mile 3.07 2.3 0 11
Building Material/Garden Equipment/ Supplies Dealers within 1 Mile – 1 ½ Miles 5.57 4.26 0 21
Grocery Stores within a ¼ Mile 0.38 0.72 0 3
Grocery Stores within a ¼ Mile – a ½ Mile 1.43 1.30 0 5
Grocery Stores within a ½ Mile – 1 Mile 3.55 2.32 0 11
Grocery Stores within 1 Mile – 1 ½ Miles 4.44 3.06 0 13
Specialty Food Stores within a ¼ Mile 0.25 0.90 0 7
Specialty Food Stores within a ¼ Mile – a ½ Mile 0.90 1.90 0 10
Specialty Food Stores within a ½ Mile – 1 Mile 3.02 3.66 0 11
Specialty Food Stores within 1 Mile – 1 ½ Miles 2.66 3.44 0 12
Beer, Wine and Liquor Stores within a ¼ Mile 0.19 0.48 0 2
Beer, Wine and Liquor Stores within a ¼ Mile – a ½ Mile 0.71 0.88 0 3
Beer, Wine and Liquor Stores within a ½ Mile – 1 Mile 1.78 1.35 0 5
Beer, Wine and Liquor Stores within 1 Mile – 1 ½ Miles 2.03 1.58 0 7
Health and Personal Care Stores within a ¼ Mile 0.47 0.85 0 5
Health and Personal Care Stores within a ¼ Mile – a ½ Mile 1.67 1.78 0 8
Health and Personal Care Stores within a ½ Mile – 1 Mile 4.99 3.33 0 14
Health and Personal Care Stores within 1 Mile – 1 ½ Miles 7.11 4.73 0 25
Gasoline Stations within a ¼ Mile 0.21 0.43 0 2
Gasoline Stations within a ¼ Mile – a ½ Mile 0.59 0.71 0 3
Gasoline Stations within a ½ Mile – 1 Mile 1.87 1.50 0 6
Gasoline Stations within 1 Mile – 1 ½ Miles 3 1.87 0 9
Clothing and Clothing Accessories Stores within a ¼ Mile 0.94 3.58 0 34
Clothing and Clothing Accessories Stores within a ¼ Mile – a ½ Mile 3.32 8.10 0 37
Clothing and Clothing Accessories Stores within a ½ Mile – 1 Mile 13.63 15.39 0 41
Clothing and Clothing Accessories Stores within 1 Mile – 1 ½ Miles 13.96 17.29 0 85
Sporting Goods, Hobby and Musical Instrument Stores within a ¼ Mile 0.87 1.59 0 11
Sporting Goods, Hobby and Musical Instrument Stores within a ¼ Mile – a ½ Mile 2.37 3.01 0 16
Sporting Goods, Hobby and Musical Instrument Stores within a ½ Mile – 1 Mile 8.87 5.64 0 21
Table 7: Descriptive Statistics - Traverse City, MI (cont.)
79

full
repo
rt
BUILDING PROSPEROUS PLACES IN MICHIGAN
Traverse City, MI
Description Mean Std. Dev. Min. Max.
Sporting Goods, Hobby and Musical Instrument Stores within 1 Mile – 1 ½ Miles 10.10 6.20 1 28
Book, Periodical and Music Stores within a ¼ Mile 0.22 0.59 0 5
Book, Periodical and Music Stores within a ¼ Mile – a ½ Mile 0.64 1.02 0 5
Book, Periodical and Music Stores within a ½ Mile – 1 Mile 2.34 1.98 0 8
Book, Periodical and Music Stores within 1 Mile – 1 ½ Miles 2.76 2.20 0 11
General Merchandise Stores within a ¼ Mile 0.06 0.23 0 1
General Merchandise Stores within a ¼ Mile – a ½ Mile 0.17 0.37 0 1
General Merchandise Stores within a ½ Mile – 1 Mile 0.88 1.45 0 7
General Merchandise Stores within 1 Mile – 1 ½ Miles 1.35 1.89 0 7
Miscellaneous Store Retailers within a ¼ Mile 1.88 3.37 0 30
Miscellaneous Store Retailers within a ¼ Mile – a ½ Mile 5.99 6.98 0 33
Miscellaneous Store Retailers within a ½ Mile – 1 Mile 20.57 14.95 0 53
Miscellaneous Store Retailers within 1 Mile – 1 ½ Miles 24.06 15.08 4 66
Performing Arts Companies within a ¼ Mile 0.22 0.57 0 3
Performing Arts Companies within a ¼ Mile – a ½ Mile 0.43 0.79 0 3
Performing Arts Companies within a ½ Mile – 1 Mile 1.63 1.55 0 6
Performing Arts Companies within 1 Mile – 1 ½ Miles 1.76 1.27 0 5
Promoters of Performing Arts, Sports and Similar Events within a ¼ Mile 0.13 0.34 0 1
Promoters of Performing Arts, Sports and Similar Events within a ¼ Mile – a ½ Mile 0.19 0.39 0 1
Promoters of Performing Arts, Sports and Similar Events within a ½ Mile – 1 Mile 0.78 0.86 0 3
Promoters of Performing Arts, Sports and Similar Events within 1 Mile – 1 ½ Miles 0.89 0.79 0 3
Gambling Industries within a ¼ Mile 0.03 0.16 0 1
Gambling Industries within a ¼ Mile – a ½ Mile 0.12 0.33 0 1
Gambling Industries within a ½ Mile – 1 Mile 0.28 0.45 0 1
Gambling Industries within 1 Mile – 1 ½ Miles 0.38 0.56 0 2
Amusement Parks and Arcades within a ¼ Mile 0.22 0.52 0 5
Table 7: Descriptive Statistics - Traverse City, MI (cont.)
80

understanding the values of, perceptions of and barriers to placemaking
land
pol
icy
inst
itut
e
Traverse City, MI
Description Mean Std. Dev. Min. Max.
Amusement Parks and Arcades within a ¼ Mile – a ½ Mile 0.99 1.44 0 7
Amusement Parks and Arcades within a ½ Mile – 1 Mile 3.24 2.59 0 9
Amusement Parks and Arcades within 1 Mile – 1 ½ Miles 2.96 2.59 0 10
Other Amusement and Recreation Industries within a ¼ Mile 0.73 1.36 0 7
Other Amusement and Recreation Industries within a ¼ Mile – a ½ Mile 1.64 2 0 9
Other Amusement and Recreation Industries within a ½ Mile – 1 Mile 5.97 4.79 0 19
Other Amusement and Recreation Industries within 1 Mile – 1 ½ Miles 8.93 4.53 0 22
Full-Service Restaurants within a ¼ Mile 1.07 1.92 0 15
Full-Service Restaurants within a ¼ Mile – a ½ Mile 3.28 3.78 0 16
Full-Service Restaurants within a ½ Mile – 1 Mile 11.29 7.37 0 31
Full-Service Restaurants within 1 Mile – 1 ½ Miles 13.99 9.3 1 42
Limited-Service Eating Places within a ¼ Mile 0.63 1.16 0 9
Limited-Service Eating Places within a ¼ Mile – a ½ Mile 1.90 1.90 0 11
Limited-Service Eating Places within a ½ Mile – 1 Mile 6.48 4.40 0 16
Limited-Service Eating Places within 1 Mile – 1 ½ Miles 7.38 5 1 24
Drinking Places (Alcoholic Beverages) within a ¼ Mile 0.36 0.82 0 4
Drinking Places (Alcoholic Beverages) within a ¼ Mile – a ½ Mile 0.81 1.22 0 7
Drinking Places (Alcoholic Beverages) within a ½ Mile – 1 Mile 3.03 3.15 0 11
Drinking Places (Alcoholic Beverages) within 1 Mile – 1 ½ Miles 3.25 2.64 0 11
Religious Organizations within a ¼ Mile 1.15 1.72 0 8
Religious Organizations within a ¼ Mile – a ½ Mile 2.87 2.53 0 12
Religious Organizations within a ½ Mile – 1 Mile 8.56 4.56 1 19
Religious Organizations within 1 Mile – 1 ½ Miles 8.91 4.95 1 25
# of Businesses within 1 Mile in 2008 895.57 432.52 115 1,569
# of Employees within 1 Mile in 2008 7,219.62 3,704.62 289 14,060
Table 7: Descriptive Statistics - Traverse City, MI (cont.)
81

full
repo
rt
BUILDING PROSPEROUS PLACES IN MICHIGAN
Royal Oak, MI
Description Mean Std. Dev. Min. Max.
Sale Price $190,850.93 $69,603.39 $20,000.00 $844,120.00
Sale Year 2000 0.01 0.10 0 1
Sale Year 2001 0.02 0.15 0 1
Sale Year 2002 0.06 0.23 0 1
Sale Year 2003 0.07 0.26 0 1
Sale Year 2004 0.09 0.29 0 1
Sale Year 2005 0.26 0.44 0 1
Sale Year 2006 0.22 0.42 0 1
Sale Year 2007 0.07 0.25 0 1
Sale Year 2008 0.05 0.22 0 1
Sale Year 2009 0.05 0.22 0 1
Sale Year 2010 0.06 0.23 0 1
Property Sales in December, January and February 0.17 0.37 0 1
Property Sales in March, April and May 0.27 0.45 0 1
Property Sales in September, October and November 0.25 0.43 0 1
Property Square Feet 7,341.91 7,083.93 1,674 263,247
Age of Property (2010–Year Built) 63.55 29.04 0 2,010
# of Bedrooms (Not Reported for All Properties) 2.93 0.67 0 8
# of Full-Baths 1.39 0.56 0 6
# of Half-Baths 0.33 0.50 0 4
Square Footage of the House 1,247.34 425.84 377 6,936
Garage Y/N 0.85 0.36 0 1
Median Household Income within Block Group: 2005–2009 65,904.08 16,890.02 21,458 128,828
Income Diversity Index 0.88 0.03 0.72 0.92
Racial Diversity Index: 2010 0.12 0.11 0 0.70
% of Poverty in Census Tract: 2005–2009 0.06 0.03 0.02 0.14
% of Population Age 25 and Older with a High School Degree: 2005–2009 0.21 0.05 0.14 0.29
% of Population Age 25 and Older with an Associate's Degree: 2005–2009 0.07 0.02 0.02 0.11
% of Population Age 25 and Older with a Bachelor's Degree: 2005–2009 0.28 0.05 0.19 0.40
% of Population Age 25 and Older with a Graduate or Professional Degree: 2005–2009 0.17 0.04 0.10 0.23
Age Diversity Index 0.73 0.01 0.70 0.74
Table 8: Descriptive Statistics - Royal Oak, MIAppendix B: Descriptive Statistics (cont.)
82

understanding the values of, perceptions of and barriers to placemaking
land
pol
icy
inst
itut
e
Royal Oak, MI
Description Mean Std. Dev. Min. Max.
Children Age 5 to 17 0.11 0.05 0 0.22
Distance to Closest River in Feet 32,428.36 4,659.53 24,991.76 44,831.65
Distance to Closest Lake in Feet 4,135.90 2,108.57 70.62 10,469.98
Distance to Closest Park in Feet 881.80 548.45 0 3,622.51
Distance to Downtown in Feet 9,593.68 5,314.68 230.53 22,833.21
Distance to Closest Interstate in Feet 3,435.31 2,142.18 85.45 9,444.38
Distance to Closest Primary School in Feet 2,451.12 1,082.51 101.74 6,615.67
Distance to Closest High School in Feet 5,774.53 2,466.21 266.31 11,399.25
Motor Vehicle and Parts Dealers within a ¼ Mile 0.27 0.70 0 5
Motor Vehicle and Parts Dealers within a ¼ Mile – a ½ Mile 1.25 1.51 0 9
Motor Vehicle and Parts Dealers within a ½ Mile – 1 Mile 6.21 3.32 0 28
Motor Vehicle and Parts Dealers within 1 Mile – 1 ½ Miles 10.72 5 0 35
Furniture and Home Furnishings Stores within a ¼ Mile 0.60 1.05 0 8
Furniture and Home Furnishings Stores within a ¼ Mile – a ½ Mile 2.12 1.98 0 10
Furniture and Home Furnishings Stores within a ½ Mile – 1 Mile 7.61 3.45 0 21
Furniture and Home Furnishings Stores within 1 Mile – 1 ½ Miles 13.58 5.14 1 32
Electronics and Appliance Stores within a ¼ Mile 0.50 0.87 0 5
Electronics and Appliance Stores within a ¼ Mile – a ½ Mile 1.50 1.65 0 10
Electronics and Appliance Stores within a ½ Mile – 1 Mile 5.33 2.77 0 19
Electronics and Appliance Stores within 1 Mile – 1 ½ Miles 9.65 3.71 1 21
Building Material/Garden Equipment/ Supplies Dealers within a ¼ Mile 0.42 0.63 0 3
Building Material/Garden Equipment/ Supplies Dealers within a ¼ Mile – a ½ Mile 1.34 1.10 0 6
Building Material/Garden Equipment/ Supplies Dealers within a ½ Mile – 1 Mile 5.81 2.35 1 15
Building Material/Garden Equipment/ Supplies Dealers within 1 Mile – 1 ½ Miles 10.12 2.93 3 20
Grocery Stores within a ¼ Mile 0.42 0.65 0 4
Grocery Stores within a ¼ Mile – a ½ Mile 1.57 1.41 0 7
Grocery Stores within a ½ Mile – 1 Mile 6.47 3.23 0 15
Grocery Stores within 1 Mile – 1 ½ Miles 11.62 3.66 2 25
Specialty Food Stores within a ¼ Mile 0.12 0.34 0 2
Specialty Food Stores within a ¼ Mile – a ½ Mile 0.40 0.62 0 3
Table 8: Descriptive Statistics - Royal Oak, MI (cont.)
83

full
repo
rt
BUILDING PROSPEROUS PLACES IN MICHIGAN
Royal Oak, MI
Description Mean Std. Dev. Min. Max.
Specialty Food Stores within a ½ Mile – 1 Mile 2.05 1.39 0 7
Specialty Food Stores within 1 Mile – 1 ½ Miles 3.87 2.02 0 11
Beer, Wine and Liquor Stores within a ¼ Mile 0.26 0.48 0 2
Beer, Wine and Liquor Stores within a ¼ Mile – a ½ Mile 1 0.94 0 5
Beer, Wine and Liquor Stores within a ½ Mile – 1 Mile 4.25 2.04 0 10
Beer, Wine and Liquor Stores within 1 Mile – 1 ½ Miles 6.61 2.87 1 16
Health and Personal Care Stores within a ¼ Mile 0.29 0.65 0 5
Health and Personal Care Stores within a ¼ Mile – a ½ Mile 1.11 1.25 0 7
Health and Personal Care Stores within a ½ Mile – 1 Mile 5.67 2.88 0 16
Health and Personal Care Stores within 1 Mile – 1 ½ Miles 11.41 6.07 0 38
Gasoline Stations within a ¼ Mile 0.32 0.66 0 3
Gasoline Stations within a ¼ Mile – a ½ Mile 1.03 1.03 0 5
Gasoline Stations within a ½ Mile – 1 Mile 4.19 1.89 0 10
Gasoline Stations within 1 Mile – 1 ½ Miles 5.88 2.21 0 13
Clothing and Clothing Accessories Stores within a ¼ Mile 0.66 1.69 0 29
Clothing and Clothing Accessories Stores within a ¼ Mile – a ½ Mile 2.96 5.46 0 36
Clothing and Clothing Accessories Stores within a ½ Mile – 1 Mile 13.87 13.33 1 70
Clothing and Clothing Accessories Stores within 1 Mile – 1 ½ Miles 25.97 18.99 2 86
Sporting Goods, Hobby and Musical Instrument Stores within a ¼ Mile 0.52 0.80 0 5
Sporting Goods, Hobby and Musical Instrument Stores within a ¼ Mile – a ½ Mile 1.76 1.60 0 10
Sporting Goods, Hobby and Musical Instrument Stores within a ½ Mile – 1 Mile 7.40 2.82 0 17
Sporting Goods, Hobby and Musical Instrument Stores within 1 Mile – 1 ½ Miles 12.55 4.27 3 29
Book, Periodical and Music Stores within a ¼ Mile 0.24 0.59 0 6
Book, Periodical and Music Stores within a ¼ Mile – a ½ Mile 0.80 1.22 0 8
Book, Periodical and Music Stores within a ½ Mile – 1 Mile 3.55 2.71 0 11
Book, Periodical and Music Stores within 1 Mile – 1 ½ Miles 6.70 2.86 0 16
General Merchandise Stores within a ¼ Mile 0.08 0.27 0 1
General Merchandise Stores within a ¼ Mile – a ½ Mile 0.35 0.58 0 3
General Merchandise Stores within a ½ Mile – 1 Mile 1.42 1.09 0 5
General Merchandise Stores within 1 Mile – 1 ½ Miles 2.83 1.82 0 10
Miscellaneous Store Retailers within a ¼ Mile 1.63 2.27 0 35
Table 8: Descriptive Statistics - Royal Oak, MI (cont.)
84

understanding the values of, perceptions of and barriers to placemaking
land
pol
icy
inst
itut
e
Royal Oak, MI
Description Mean Std. Dev. Min. Max.
Miscellaneous Store Retailers within a ¼ Mile – a ½ Mile 6.35 6.68 0 42
Miscellaneous Store Retailers within a ½ Mile – 1 Mile 27.16 14.55 9 69
Miscellaneous Store Retailers within 1 Mile – 1 ½ Miles 43.38 14.69 19 84
Performing Arts Companies within a ¼ Mile 0.20 0.47 0 3
Performing Arts Companies within a ¼ Mile – a ½ Mile 0.57 0.78 0 4
Performing Arts Companies within a ½ Mile – 1 Mile 2.28 1.37 0 8
Performing Arts Companies within 1 Mile – 1 ½ Miles 3.30 1.87 0 11
Spectator Sports within a ¼ Mile 0.03 0.18 0 1
Spectator Sports within a ¼ Mile – a ½ Mile 0.16 0.38 0 2
Spectator Sports within a ½ Mile – 1 Mile 0.72 0.65 0 3
Spectator Sports within 1 Mile – 1 ½ Miles 0.94 0.81 0 3
Promoters of Performing Arts, Sports and Similar Events within a ¼ Mile 0.05 0.28 0 2
Promoters of Performing Arts, Sports and Similar Events within a ¼ Mile – a ½ Mile 0.14 0.42 0 2
Promoters of Performing Arts, Sports and Similar Events within a ½ Mile – 1 Mile 0.81 0.77 0 3
Promoters of Performing Arts, Sports and Similar Events within 1 Mile – 1 ½ Miles 1.47 1.16 0 4
Gambling Industries within a ¼ Mile 0 0 0 0
Gambling Industries within a ¼ Mile – a ½ Mile 0 0 0 0
Gambling Industries within a ½ Mile – 1 Mile 0 0 0 0
Gambling Industries within 1 Mile – 1 ½ Miles 0.02 0.15 0 1
Amusement Parks and Arcades within a ¼ Mile 0.04 0.25 0 2
Amusement Parks and Arcades within a ¼ Mile – a ½ Mile 0.11 0.39 0 2
Amusement Parks and Arcades within a ½ Mile – 1 Mile 0.70 1.08 0 5
Amusement Parks and Arcades within 1 Mile – 1 ½ Miles 1.54 1.91 0 12
Other Amusement and Recreation Industries within a ¼ Mile 0.44 0.75 0 5
Other Amusement and Recreation Industries within a ¼ Mile – a ½ Mile 1.40 1.52 0 8
Other Amusement and Recreation Industries within a ½ Mile – 1 Mile 6.19 3.33 0 16
Other Amusement and Recreation Industries within 1 Mile – 1 ½ Miles 10.96 3.97 1 23
Full-Service Restaurants within a ¼ Mile 1.01 1.68 0 27
Full-Service Restaurants within a ¼ Mile – a ½ Mile 4.11 5.09 0 33
Full-Service Restaurants within a ½ Mile – 1 Mile 17.36 10.20 0 45
Table 8: Descriptive Statistics - Royal Oak, MI (cont.)
85

full
repo
rt
BUILDING PROSPEROUS PLACES IN MICHIGAN
Royal Oak, MI
Description Mean Std. Dev. Min. Max.
Full-Service Restaurants within 1 Mile – 1 ½ Miles 30.77 13.25 6 82
Limited-Service Eating Places within a ¼ Mile 0.43 0.93 0 10
Limited-Service Eating Places within a ¼ Mile – a ½ Mile 1.85 2.02 0 12
Limited-Service Eating Places within a ½ Mile – 1 Mile 7.88 4.36 0 19
Limited-Service Eating Places within 1 Mile – 1 ½ Miles 14.42 5.11 1 29
Drinking Places (Alcoholic Beverages) within a ¼ Mile 0.12 0.38 0 6
Drinking Places (Alcoholic Beverages) within a ¼ Mile – a ½ Mile 0.64 1.25 0 7
Drinking Places (Alcoholic Beverages) within a ½ Mile – 1 Mile 3.23 2.45 0 10
Drinking Places (Alcoholic Beverages) within 1 Mile – 1 ½ Miles 5.92 4.74 0 29
Religious Organizations within a ¼ Mile 0.82 1.25 0 7
Religious Organizations within a ¼ Mile – a ½ Mile 2.76 2.29 0 11
Religious Organizations within a ½ Mile – 1 Mile 11.13 5.91 0 29
Religious Organizations within 1 Mile – 1 ½ Miles 17.6 6.75 4 37
# of Businesses within 1 Mile 1,152.21 374.58 641 2,063
# of Employees within 1 Mile 8,406.43 4,361.34 2,157 22,122
Table 8: Descriptive Statistics - Royal Oak, MI (cont.)
86

understanding the values of, perceptions of and barriers to placemaking
land
pol
icy
inst
itut
e
Lansing, MICategory 1 Category 2 Category 3
Coeff.Std.
Coeff. Coeff.Std.
Coeff. Coeff.Std.
Coeff.
Sale Year 2001 $7,211.30*** 0.05 $6,036.21*** 0.06 – –
Sale Year 2002 $16,835.07*** 0.12 $15,309.55*** 0.15 $7,197.70*** 0.13
Sale Year 2003 $22,159.63*** 0.16 $20,489.85*** 0.19 $10,260.49*** 0.17
Sale Year 2004 $29,254.17*** 0.21 $26,755.94*** 0.25 $14,235.77*** 0.23
Sale Year 2005 $33,296.74*** 0.25 $31,344.99*** 0.32 $16,397.65*** 0.29
Sale Year 2006 $33,734.91*** 0.21 $31,333.83*** 0.25 $16,779.50*** 0.20
Sale Year 2007 $27,430.44*** 0.12 $26,919.65*** 0.16 $14,729.26*** 0.14
Sale Year 2008 $20,554.91*** 0.08 $17,533.88*** 0.09 $9,008.25*** 0.07
Sale Year 2009 $12,436.22*** 0.06 $10,418.02*** 0.06 $6,995.89*** 0.08
Sale Year 2010 – – – – – –
Property Sales in December, January and February –$5,175.25*** –0.05 –$3,928.06*** –0.05 – –
Property Sales in March, April and May –$2,026.54* –0.02 – – – –
Property Sales in September, October and November $2,137.72* –0.02 – – – –
Property Square Feet –$0.76*** –0.12 – – – –
Squared $0.00*** 0.38 – – – –
Cubed $0.00*** –0.29 – – – –
Age of Property (2010–Year Built) $24.39*** 0.06 $28.70*** 0.10 $115.14*** 0.18
# of Bedrooms $9,770.71*** 0.18 – – – –
Squared –$1,330.63** –0.30 – – $1,386.73** 0.97
Cubed $41.03* 0.18 – – –$55.78** –0.79
# of Full-Baths $6,730.90** 0.07 $5,732.46** 0.07 – –
Squared – – –$1,224.38** –0.07 – –
# of Half–Baths – – – – –$7,766.57* –0.19
Squared $2,345.69* 0.04 – – $5,951.53* 0.16
Square Footage of the House $45.87*** 0.46 $44.77*** 0.52 $68.76*** 1.36
Squared –$0.01*** –0.77 –$0.01*** –0.51 –$0.04*** –3.24
Cubed $0.00*** 0.70 – – $0.00*** 2.12
Heating Fuel – Coal – – – – –$29,800.14*** –0.05
Heating Fuel – Gas – – – – –$6,785.19*** –0.12
Heating Fuel – Oil – – – – –$5,864.21** –0.07
Heating Fuel – Steam (City Provided) $25,495.83*** 0.03 – – – –
House Exterior – Asbestos –$9,834.97** –0.02 –$9,766.27*** –0.03 –$9,304.36*** –0.06
Table 9: Hedonic Pricing Regression Results - Lansing, MIAppendix C: Hedonic Pricing Regression Results
* Significant at the 0.10 confidence level.** Significant at the 0.05 confidence level.*** Significant at the 0.01 confidence level.– This variable is not significant.
87

full
repo
rt
BUILDING PROSPEROUS PLACES IN MICHIGAN
Lansing, MICategory 1 Category 2 Category 3
Coeff.Std.
Coeff. Coeff.Std.
Coeff. Coeff.Std.
Coeff.
House Exterior – Asphalt –$20,918.25*** –0.03 –$16,292.70*** –0.03 – –
House Exterior – Block – – – – – –
House Exterior – Brick $6,492.86** 0.03 $6,181.08*** 0.03 $12,121.38*** 0.09
House Exterior – Wood – – – – – –
House Exterior – Stucco – – – – – –
House Exterior – Vinyl – – – – – –
Central Air in Home – – $2,174.53** 0.03 $2,492.84* 0.06
Basement Square Footage $11.73*** 0.11 $11.84*** 0.14 $4.27*** 0.09
Total Square Footage of Porches and Decks $10.71*** 0.03 $7.04*** 0.02 $11.40** 0.06
Garage Area in Square Feet $29.76*** 0.15 $23.97*** 0.16 $12.54*** 0.14
Pool Size in Square Feet – – $8.28* 0.02 – –
# of Fireplaces $11,267.57*** 0.12 $7,302.15*** 0.10 $6,237.83 0.09
Neighborhood Enterprise Zone –$18,634.69*** –0.05 –$13,343.56*** –0.05 – –
Renaissance Zone $48,589.82*** 0.03 $41,205.41*** 0.04
Condominiums – – – – – –
Stories in Home – – $3,192.83** 0.04 – –
# of Property Crimes from 2000–2010 within a ½ Mile of Parcel – – – – – –
# of Violent Crimes from 2000–2010 within a ½ Mile of Parcel – – –$12.38** –0.18 –$14.46** –0.37
Median Household Income within Block Group: 2005–2009 $0.16** 0.05 $0.14** 0.06 $0.18*** 0.13
Income Diversity Index $513.76** 0.04 – – – –
Racial Diversity Index: 2010 –$116.55*** –0.04 –$64.54** –0.03 – –
% of Poverty in Census Tract: 2005–2009 – – –$226.26* –0.06 $349.67*** 0.14
% of Population Age 25 and Older with a High School Degree: 2005–2009 $1,358.38** 0.26 $662.70*** 0.17 – –
% of Population Age 25 and Older with an Associate's Degree: 2005–2009 $1,000.43*** 0.05 $648.26*** 0.04 – –
% of Population Age 25 and Older with a Bachelor's Degree: 2005–2009 – – – – – –
% of Population Age 25 and Older with a Bachelor's Degree: 2005–2009 – – – – – –
% of Population Age 25 and Older with a Graduate or Professional Degree: 2005–2009 $1,505.93*** 0.17 $651.70** 0.09 – –
Age Diversity Index – – – – – –
Children Age 5 to 17 – – – – – –
Table 9: Hedonic Pricing Regression Results - Lansing, MI (cont.)
88
* Significant at the 0.10 confidence level.** Significant at the 0.05 confidence level.*** Significant at the 0.01 confidence level.– This variable is not significant.† Negative coefficient translates into positive marginal value. Can be interpreted as: “For each additional foot from an interstate, river, etc., x is associated with $x increase/decrease in sale price.”

understanding the values of, perceptions of and barriers to placemaking
land
pol
icy
inst
itut
e
Table 9: Hedonic Pricing Regression Results - Lansing, MI (cont.)
89
Lansing, MICategory 1 Category 2 Category 3
Coeff.Std.
Coeff. Coeff.Std.
Coeff. Coeff.Std.
Coeff.
Distance to Closest Interstate in Feet† – – $4.28** 0.50 – –
Squared – – – – $0.00* 2.64
Cubed – – – – $0.00 –1.78
Distance to Closest River in Feet† –$8.65*** –0.55 –$5.54** –0.47 – –
Squared $0.00** 0.80 $0.00* 0.80 – –
Cubed – – – – – –
Distance to Closest Lake in Feet † –$7.77** –0.30 – – – –
Squared – – – – – –
Cubed – – – – – –
Distance to Closest Park in Feet† – – – – $11.05* 0.32
Squared – – – – –$0.01* –0.66
Cubed – – – – – –
Distance to River Trail in Feet† – – – – – –
Squared – – – – – –
Cubed – – – – – –
Distance to Lansing Airport in Feet† –$3.60** –0.90 –$3.98*** –1.34 – –
Distance to Downtown in Feet† –$20.59*** –2.88 –$11.87*** –2.23 –$8.23* –2.83
Distance to Old Town in Feet† $9.39*** 1.91 $8.42*** 2.31 – –
Distance to Michigan Ave. Corridor in Feet† $12.63*** 1.96 $7.78*** 1.62 – –
Distance to MSU in Feet† –$5.19*** –0.87 –$5.59*** –1.24 – –
Distance to Closest Primary School in Feet† – – – – – –
Distance to Closest Middle School in Feet† –$1.46* –0.10 –$1.34** –0.12 – –
Distance to Closest High School in Feet† –$1.61** –0.10 – – $2.72*** 0.43
Motor Vehicle and Parts Dealers within a ¼ Mile –$2,136.87*** –0.05 –$1,711.07*** –0.06 – –
Motor Vehicle and Parts Dealers within a ¼ Mile – a ½ Mile – – –$1,036.62** –0.08 – –
Motor Vehicle and Parts Dealers within a ½ Mile – 1 Mile –$990.75** –0.11 –$1,257.37*** –0.19 – –
Motor Vehicle and Parts Dealers within 1 Mile – 1 ½ Miles –$526.87** –0.07 –$718.35*** –0.13 – –
Furniture and Home Furnishings Stores within a ¼ Mile – – – – – –
Furniture and Home Furnishings Stores within a ¼ Mile – a ½ Mile – – – – –$2,770.01** –0.13
Furniture and Home Furnishings Stores within a ½ Mile – 1 Mile – – – – – –

full
repo
rt
BUILDING PROSPEROUS PLACES IN MICHIGAN
Table 9: Hedonic Pricing Regression Results - Lansing, MI (cont.)
90
Lansing, MICategory 1 Category 2 Category 3
Coeff.Std.
Coeff. Coeff.Std.
Coeff. Coeff.Std.
Coeff.
Furniture and Home Furnishings Stores within 1 Mile – 1 ½ Miles – – – – – –
Electronics and Appliance Stores within a ¼ Mile – – – – $3,603.04** 0.11
Electronics and Appliance Stores within a ¼ Mile – a ½ Mile – – – – – –
Electronics and Appliance Stores within a ½ Mile – 1 Mile – – – – $3,419.48*** 0.40
Electronics and Appliance Stores within 1 Mile – 1 ½ Miles – – – – $1,686.06*** 0.30
Building Material/Garden Equipment/ Supply Dealers within a ¼ Mile – – – – – –
Building Material/Garden Equipment/ Supply Dealers within a ¼ Mile – a ½ Mile – – – – $2,892.74*** 0.20
Building Material/Garden Equipment/ Supply Dealers within a ½ Mile – 1 Mile – – – – – –
Building Material/Garden Equipment/ Supply Dealers within 1 Mile – 1 ½ Miles –$1,056.74** –0.06 – – – –
Grocery Stores within a ¼ Mile –$3,125.06** –0.05 –$2,533.50** –0.05 – –
Grocery Stores within a ¼ Mile – a ½ Mile –$2,120.58** –0.06 –$1,934.50** –0.07 – –
Grocery Stores within a ½ Mile – 1 Mile – – – – – –
Grocery Stores within 1 Mile – 1 ½ Miles – – –$761.13** –0.08 –$880.27** –0.18
Specialty Food Stores within a ¼ Mile $5,160.96** 0.04 – – – –
Specialty Food Stores within a ¼ Mile – a ½ Mile – – – – – –
Specialty Food Stores within a ½ Mile – 1 Mile – – – – – –
Specialty Food Stores within 1 Mile – 1 ½ Miles – – – – – –
Beer, Wine and Liquor Stores within a ¼ Mile – – –$6,376.58*** –0.06 –$7,448.22** –0.14
Beer, Wine and Liquor Stores within a ¼ Mile – a ½ Mile – – – – – –
Beer, Wine and Liquor Stores within a ½ Mile – 1 Mile – – – – – –
Beer, Wine and Liquor Stores within 1 Mile – 1 ½ Miles – – – – – –
Health and Personal Care Stores within a ¼ Mile – – – – – –
Health and Personal Care Stores within a ¼ Mile – a ½ Mile – – $2,206.87** 0.10 – –
Health and Personal Care Stores within a ½ Mile – 1 Mile – – – – – –
Health and Personal Care Stores within 1 – 1 ½ Miles – – – – – –
Gasoline Stations within a ¼ Mile – – – – $4,032.99* 0.09
* Significant at the 0.10 confidence level.** Significant at the 0.05 confidence level.*** Significant at the 0.01 confidence level.– This variable is not significant.

understanding the values of, perceptions of and barriers to placemaking
land
pol
icy
inst
itut
e
Table 9: Hedonic Pricing Regression Results - Lansing, MI (cont.)
91
Lansing, MICategory 1 Category 2 Category 3
Coeff.Std.
Coeff. Coeff.Std.
Coeff. Coeff.Std.
Coeff.
Gasoline Stations within a ¼ Mile – a ½ Mile – – – – – –
Gasoline Stations within a ½ Mile – 1 Mile – – – – – –
Gasoline Stations within 1 Mile – 1 ½ Miles – – – – – –
Clothing and Clothing Accessories Stores within a ¼ Mile – – – – – –
Clothing and Clothing Accessories Stores within a ¼ Mile – a ½ Mile – – – – – –
Clothing and Clothing Accessories Stores within a ½ Mile – 1 Mile – – – – – –
Clothing and Clothing Accessories Stores within 1 Mile – 1 ½ Miles – – – – – –
Sporting Goods, Hobby and Musical Instrument Stores within a ¼ Mile – – – – – –
Sporting Goods, Hobby and Musical Instrument Stores within a ¼ Mile – a ½ Mile – – – – – –
Sporting Goods, Hobby and Musical Instrument Stores within a ½ Mile – 1 Mile $2,748.03 0.18 $1,388.58* 0.12 – –
Sporting Goods, Hobby and Musical Instrument Stores within 1 Mile – 1 ½ Miles $1,954.43*** 0.15 $1,120.56** 0.12 $1,031.69* 0.19
Book, Periodical and Music Stores within a ¼ Mile – – – – – –
Book, Periodical and Music Stores within a ¼ Mile – a ½ Mile – – – – – –
Book, Periodical and Music Stores within a ½ Mile – 1 Mile $2,009.02* 0.07 – – – –
Book, Periodical and Music Stores within 1 Mile – 1 ½ Miles –$1,414.84** –0.07 –$1,054.11** –0.07 –$1,279.94** –0.15
General Merchandise Stores within a ¼ Mile – – – – – –
General Merchandise Stores within a ¼ Mile – a ½ Mile – – – – $4,022.27** 0.15
General Merchandise Stores within a ½ Mile – 1 Mile –$2,120.32* –0.06 – – – –
General Merchandise Stores within 1 Mile – 1 ½ Miles – – – – – –
Miscellaneous Store Retailers within a ¼ Mile –$2,095.77** –0.06 – – – –
Miscellaneous Store Retailers within a ¼ Mile – a ½ Mile –$1,247.14** –0.06 –$895.54* –0.06 – –
Miscellaneous Store Retailers within a ½ Mile – 1 Mile –$1,327.34*** –0.20 –$1,071.57*** –0.21 – –
Miscellaneous Store Retailers within 1 Mile – 1 ½ Miles – – – – –$446.61* –0.23
Performing Arts Companies within a ¼ Mile – – – – $6,189.77** 0.12

full
repo
rt
BUILDING PROSPEROUS PLACES IN MICHIGAN
Table 9: Hedonic Pricing Regression Results - Lansing, MI (cont.)
92
Lansing, MICategory 1 Category 2 Category 3
Coeff.Std.
Coeff. Coeff.Std.
Coeff. Coeff.Std.
Coeff.
Performing Arts Companies within a ¼ Mile – a ½ Mile – – – – – –
Performing Arts Companies within a ½ Mile – 1 Mile – – – – – –
Performing Arts Companies within 1 Mile – 1 ½ Miles – – – – – –
Spectator Sports within a ¼ Mile – – – – – –
Spectator Sports within a ¼ Mile – a ½ Mile –$8,687.73** –0.05 –$6,530.89** –0.05 – –
Spectator Sports within a ½ Mile – 1 Mile – – –$3,487.79* –0.06 – –
Spectator Sports within 1 Mile – 1 ½ Miles –$3,306.99** –0.06 –$2,536.42** –0.06 –$3,916.23 –0.17
Promoters of Performing Arts, Sports and Similar Events within a ¼ Mile $12,545.97** 0.04 – – – –
Promoters of Performing Arts, Sports and Similar Events within a ¼ Mile – a ½ Mile $14,379.95*** 0.09 $7,375.79** 0.06 – –
Promoters of Performing Arts, Sports and Similar Events within a ½ Mile – 1 Mile $11,744.21*** 0.16 $6,236.56*** 0.11 – –
Promoters of Performing Arts, Sports and Similar Events within 1 Mile – 1 ½ Miles $3,781.67** 0.06 $3,466.89*** 0.08 – –
Museums, Historical Sites and Similar Institutions within a ¼ Mile – – – – $9,724.52*** 0.11
Museums, Historical Sites and Similar Institutions within a ¼ Mile – a ½ Mile – – – – – –
Museums, Historical Sites and Similar Institutions within a ½ Mile – 1 Mile – – – – – –
Museums, Historical Sites and Similar Institutions within 1 Mile – 1 ½ Miles – – – – – –
Amusement Parks and Arcades within a ¼ Mile – – – – –$10,937.13* –0.06
Amusement Parks and Arcades within a ¼ Mile – a ½ Mile –$14,486.68*** –0.08 –$10,282.14*** –0.08 –$12,068.09*** –0.19
Amusement Parks and Arcades within a ½ Mile – 1 Mile –$16,800.48*** –0.19 –$9,354.67*** –0.14 –$9,902.80*** –0.27
Amusement Parks and Arcades within 1 Mile – 1 ½ Miles –$8,517.80*** –0.12 –$3,305.87** –0.06 –$3,592.50* –0.12
Other Amusement and Recreation Industries within a ¼ Mile $4,780.42*** 0.05 – – – –
Other Amusement and Recreation Industries within a ¼ Mile – a ½ Mile $2,255.21** 0.06 – – – –
Other Amusement and Recreation Industries within a ½ Mile – 1 Mile – – – – $1,482.59* 0.18
Other Amusement and Recreation Industries within 1 Mile – 1 ½ Miles – – – – – –
* Significant at the 0.10 confidence level.** Significant at the 0.05 confidence level.*** Significant at the 0.01 confidence level.- This variable is not significant.
understanding the values of, perceptions of and barriers to placemaking
land
pol
icy
inst
itut
e
93
Table 9: Hedonic Pricing Regression Results - Lansing, MI (cont.)
Lansing, MICategory 1 Category 2 Category 3
Coeff.Std.
Coeff. Coeff.Std.
Coeff. Coeff.Std.
Coeff.
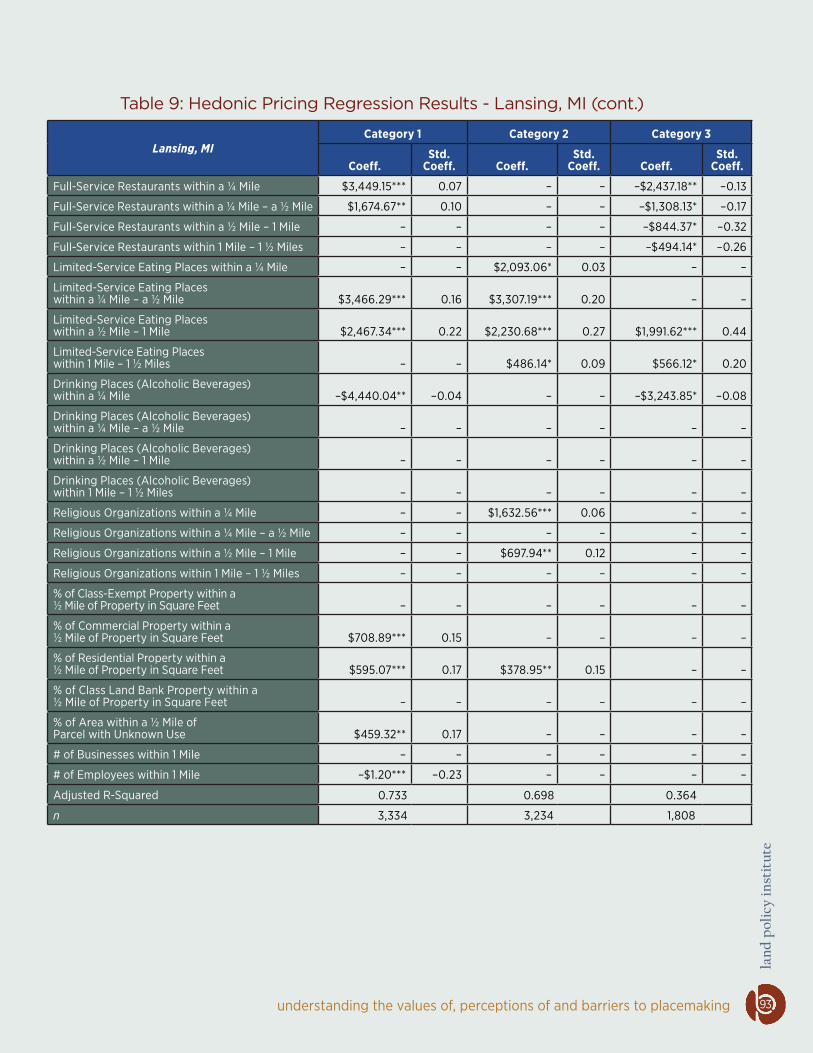
Full-Service Restaurants within a ¼ Mile $3,449.15*** 0.07 – – –$2,437.18** –0.13
Full-Service Restaurants within a ¼ Mile – a ½ Mile $1,674.67** 0.10 – – –$1,308.13* –0.17
Full-Service Restaurants within a ½ Mile – 1 Mile – – – – –$844.37* –0.32
Full-Service Restaurants within 1 Mile – 1 ½ Miles – – – – –$494.14* –0.26
Limited-Service Eating Places within a ¼ Mile – – $2,093.06* 0.03 – –
Limited-Service Eating Places within a ¼ Mile – a ½ Mile $3,466.29*** 0.16 $3,307.19*** 0.20 – –
Limited-Service Eating Places within a ½ Mile – 1 Mile $2,467.34*** 0.22 $2,230.68*** 0.27 $1,991.62*** 0.44
Limited-Service Eating Places within 1 Mile – 1 ½ Miles – – $486.14* 0.09 $566.12* 0.20
Drinking Places (Alcoholic Beverages) within a ¼ Mile –$4,440.04** –0.04 – – –$3,243.85* –0.08
Drinking Places (Alcoholic Beverages) within a ¼ Mile – a ½ Mile – – – – – –
Drinking Places (Alcoholic Beverages) within a ½ Mile – 1 Mile – – – – – –
Drinking Places (Alcoholic Beverages) within 1 Mile – 1 ½ Miles – – – – – –
Religious Organizations within a ¼ Mile – – $1,632.56*** 0.06 – –
Religious Organizations within a ¼ Mile – a ½ Mile – – – – – –
Religious Organizations within a ½ Mile – 1 Mile – – $697.94** 0.12 – –
Religious Organizations within 1 Mile – 1 ½ Miles – – – – – –
% of Class-Exempt Property within a ½ Mile of Property in Square Feet – – – – – –
% of Commercial Property within a ½ Mile of Property in Square Feet $708.89*** 0.15 – – – –
% of Residential Property within a ½ Mile of Property in Square Feet $595.07*** 0.17 $378.95** 0.15 – –
% of Class Land Bank Property within a ½ Mile of Property in Square Feet – – – – – –
% of Area within a ½ Mile of Parcel with Unknown Use $459.32** 0.17 – – – –
# of Businesses within 1 Mile – – – – – –
# of Employees within 1 Mile –$1.20*** –0.23 – – – –
Adjusted R-Squared 0.733 0.698 0.364
n 3,334 3,234 1,808

full
repo
rt
BUILDING PROSPEROUS PLACES IN MICHIGAN
Traverse City, MICategory 1 Category 2 Category 3
Coeff.Std.
Coeff. Coeff.Std.
Coeff. Coeff.Std.
Coeff.
Sale Year 2001 $25,165.56* 0.03 $11,031.63** 0.02 – –
Sale Year 2002 $36,883.00** 0.04 $14,375.42*** 0.03 – –
Sale Year 2003 $40,498.69*** 0.05 $16,569.54*** 0.04 – –
Sale Year 2004 $42,070.53*** 0.06 $27,433.92*** 0.06 – –
Sale Year 2005 $69,002.65*** 0.09 $29,995.61*** 0.06 $13,225.44** 0.04
Sale Year 2006 $67,055.63*** 0.10 $31,115.85*** 0.07 – –
Sale Year 2007 $68,231.34*** 0.10 $29,554.82*** 0.07 – –
Sale Year 2008 $68,655.05*** 0.09 $19,732.61*** 0.04 – –
Sale Year 2009 $40,882.71*** 0.05 $16,816.31*** 0.04 – –
Sale Year 2010 $71,496.89*** 0.11 $22,853.18*** 0.05 – –
Property Sales in December, January and February – – –$4,938.38* –0.01 –$7,121.88** –0.04
Property Sales in March, April and May –$12,784.96* –0.03 – – – –
Property Sales in September, October and November – – –$4,190.11* –0.02 – –
Property Square Feet $2.32*** 0.45 $0.74** 0.20 – –
Squared $0.00*** –0.70 $0.00** –0.54 – –
Cubed $0.00 0.56 $0.00** 0.40 – –
Age of Property (2010–Year Built) –$2,309.87*** –0.18 –$733.01*** –0.10 –$1,029.31*** –0.30
# of Bedrooms $54,784.30*** 0.76 – – –$12,317.96*** –0.43
Squared –$8,898.79*** –0.80 – – – –
Cubed $294.50*** 0.48 – – $22.81*** 0.23
# of Full-Baths – – – – –$34,945.26* –0.54
Squared $12,454.16** 0.22 – – – –
# of Half-Baths – – – – $46,109.70** 0.25
Squared – – – – –$35,300.44** –0.22
Square Footage of the House $127.72** 0.87 $138.90*** 1.28 $53.18*** 0.77
Squared – – –$0.06*** –0.87
Cubed $0.00* 0.32 $0.00** 0.18 $0.00*** –0.20
House Exterior – Asbestos – – – – – –
House Exterior – Asphalt – – – – –$38,181.95* –0.05
House Exterior – Block –$98,141.84** –0.03 – – – –
House Exterior – Brick – – – – –$92,699.74*** –0.36
House Exterior – Composite – – – – – –
House Exterior – Lap (Fiber Cement) – – – – – –
House Exterior – Masonite – – – – – –
House Exterior – Wood – – – – – –
Appendix C: Hedonic Pricing Regression Results (cont.)
94
* Significant at the 0.10 confidence level.** Significant at the 0.05 confidence level.*** Significant at the 0.01 confidence level.- This variable is not significant.
Table 10: Hedonic Pricing Regression Results - Traverse City, MI

understanding the values of, perceptions of and barriers to placemaking
land
pol
icy
inst
itut
e
Table 10: Hedonic Pricing Regression Results - Traverse City, MI (cont.)
95
Traverse City, MICategory 1 Category 2 Category 3
Coeff.Std.
Coeff. Coeff.Std.
Coeff. Coeff.Std.
Coeff.
House Exterior – Stone – – – – – –
House Exterior – Stucco – – – – – –
House Exterior – Vinyl –$40,673.59* –0.08 – – –$76,065.53*** –0.56
Garage Area in Square Feet – – $22.83*** 0.07 – –
# of Fireplaces $22,264.84*** 0.07 $3,693.23* 0.02 – –
Condominiums – – – – – –
Stories in Home – – – – –$77,079.54*** –1.19
Median Household income within Block Group: 2005–2009 $1.77** 0.39 – – $2.18*** 1.15
Racial Diversity Index: 2010 – – – – –$10.97*** –0.19
% of Poverty in Census Tract: 2005–2009 –$162.24*** –0.99 –$30.48* –0.30 $57.91* 1.04
% of Population Age 25 and Older with a High School Degree: 2005–2009 – – – – – –
% of Population Age 25 and Older with an Associate's Degree: 2005–2009 $350.19*** 1.21 – – – –
% of Population Age 25 and Older with a Bachelor's Degree: 2005–2009 $165.43*** 1.71 – – – –
% of Population Age 25 and Older with a Graduate or Professional Degree: 2005–2009 –$141.66*** –0.73 – – –$57.79*** –0.76
Children Age 5 to 17 – – – – –$2,385.04*** –0.39
Distance to Closest River in Feet† – – – – – –
Cubed – – – – – –
Distance to Closest Lake in Feet† – – – – – –
Cubed $0.00*** 0.91 – – – –
Distance to Closest Park in Feet† – – $39.37*** 0.68 – –
Squared – – –$0.01*** –1.03 – –
Cubed $0.00** 0.71 – – $0.00*** 1.36
Distance to Traverse City Airport in Feet† – – $13.39** 0.68 – –
Distance to Northwestern Michigan College in Feet† – – – – – –
Distance to Lake Michigan in Feet† –$24.41** –0.41 $6.31* 0.18 – –
Distance to Closest Primary School in Feet† – – – – – –
Distance to Closest High School in Feet† – – – – – –
Motor Vehicle and Parts Dealers within a ¼ Mile – – – – –$35,503.83*** –0.37
Motor Vehicle and Parts Dealers within a ¼ Mile – a ½ Mile – – $8,270.13** 0.08 –$18,377.83* –0.34
Motor Vehicle and Parts Dealers within a ½ Mile – 1 Mile – – – – –$20,120.04*** –1.21
Motor Vehicle and Parts Dealers within 1 Mile – 1 ½ Miles $6,606.02* 0.20 – – – –
Furniture and Home Furnishings Stores within a ¼ Mile – – – – $27,104.52*** 0.46
† Negative coefficient translates into positive marginal value. Can be interpreted as: “For each additional foot from an interstate, river, etc., x is associated with $x increase/decrease in sale price.”

full
repo
rt
BUILDING PROSPEROUS PLACES IN MICHIGAN96
Table 10: Hedonic Pricing Regression Results - Traverse City, MI (cont.)
Traverse City, MICategory 1 Category 2 Category 3
Coeff.Std.
Coeff. Coeff.Std.
Coeff. Coeff.Std.
Coeff.
Furniture and Home Furnishings Stores within a ¼ Mile – a ½ Mile – – – – – –
Furniture and Home Furnishings Stores within a ½ Mile – 1 Mile $12,438.55* 0.38 – – – –
Furniture and Home Furnishings Stores within 1 Mile – 1 ½ Miles $9,335.06** 0.45 – – – –
Electronics and Appliance Stores within a ¼ Mile – – – – – –
Electronics and Appliance Stores within a ¼ Mile – a ½ Mile –$18,338.00** –0.26 $5,818.07** 0.14 – –
Electronics and Appliance Stores within a ½ Mile – 1 Mile – – – – – –
Electronics and Appliance Stores within 1 Mile – 1 ½ Miles –$9,126.65** –0.40 – – – –
Building Material/Garden Equipment/ Supply Dealers within a ¼ Mile –$31,415.53* –0.10 – – – –
Building Material/Garden Equipment/ Supply Dealers within a ¼ Mile – a ½ Mile –$27,678.93** –0.18 $8,129.48** 0.09 –$43,892.73*** –1.01
Building Material/Garden Equipment/ Supply Dealers within a ½ Mile – 1 Mile –$18,287.25** –0.31 $4,718.63* 0.13 –$29,201.73*** –1.25
Building Material/Garden Equipment/ Supply Dealers within 1 Mile – 1 ½ Miles – – – – – –
Grocery Stores within a ¼ Mile – – – – –$49,436.22*** –0.40
Grocery Stores within a ¼ Mile – a ½ Mile $21,455.66* 0.19 – – – –
Grocery Stores within a ½ Mile – 1 Mile $15,978.36* 0.30 – – – –
Grocery Stores within 1 Mile – 1 ½ Miles – – – – – –
Specialty Food Stores within a ¼ Mile –$43,761.95** –0.18 – – – –
Specialty Food Stores within a ¼ Mile – a ½ Mile – – – – – –
Specialty Food Stores within a ½ Mile – 1 Mile – – – – – –
Specialty Food Stores within 1 Mile – 1 ½ Miles – – – – – –
Beer, Wine and Liquor Stores within a ¼ Mile – – – – – –
Beer, Wine and Liquor Stores within a ¼ Mile – a ½ Mile – – – – – –
Beer, Wine and Liquor Stores within a ½ Mile – 1 Mile – – –$12,645.80*** –0.20 $35,602.97** 0.99
Beer, Wine and Liquor Stores within 1 Mile – 1 ½ Miles – – –$9,941.36*** –0.18 $18,951.77* 0.54
Health and Personal Care Stores within a ¼ Mile $27,211.59** 0.12 – – $46,935.95** 0.62
Health and Personal Care Stores within a ¼ Mile – a ½ Mile – – –$6,639.96** –0.12 – –
Health and Personal Care Stores within a ½ Mile – 1 Mile – – –$5,356.29** –0.23 $9,810.03** 0.64
Health and Personal Care Stores within 1 Mile – 1 ½ Miles – – – – – –
Gasoline Stations within a ¼ Mile – – – – $81,251.53*** 0.44
Gasoline Stations within a ¼ Mile – a ½ Mile – – – – $44,902.54** 0.55
Gasoline Stations within a ½ Mile – 1 Mile – – – – – –
Gasoline Stations within 1 Mile – 1 ½ Miles – – – – – –
* Significant at the 0.10 confidence level.** Significant at the 0.05 confidence level.*** Significant at the 0.01 confidence level.– This variable is not significant.

understanding the values of, perceptions of and barriers to placemaking
land
pol
icy
inst
itut
e
97
Table 10: Hedonic Pricing Regression Results - Traverse City, MI (cont.)
Traverse City, MICategory 1 Category 2 Category 3
Coeff.Std.
Coeff. Coeff.Std.
Coeff. Coeff.Std.
Coeff.
Clothing and Clothing Accessories Stores within a ¼ Mile $12,102.40* 0.20 $8,785.51*** 0.13 – –
Clothing and Clothing Accessories Stores within a ¼ Mile – a ½ Mile – – – – – –
Clothing and Clothing Accessories Stores within a ½ Mile – 1 Mile – – – – – –
Clothing and Clothing Accessories Stores within 1 Mile – 1 ½ Miles – – – – $5,682.49*** 1.47
Sporting Goods, Hobby and Musical Instrument Stores within a ¼ Mile – – – – – –
Sporting Goods, Hobby and Musical Instrument Stores within a ¼ Mile – a ½ Mile – – – – – –
Sporting Goods, Hobby and Musical Instrument Stores within a ½ Mile – 1 Mile – – – – – –
Sporting Goods, Hobby and Musical Instrument Stores within 1 Mile – 1 ½ Miles $7,531.03* 0.40 – – – –
Book, Periodical and Music Stores within a ¼ Mile – – – – –$80,757.86*** –0.69
Book, Periodical and Music Stores within a ¼ Mile – a ½ Mile – – – – – –
Book, Periodical and Music Stores within a ½ Mile – 1 Mile – – – – – –
Book, Periodical and Music Stores within 1 Mile – 1 ½ Miles – – – – – –
General Merchandise Stores within a ¼ Mile – – – – $170,214.09*** 0.43
General Merchandise Stores within a ¼ Mile – a ½ Mile – – –$28,681.08*** –0.09 $175,553.56*** 1.19
General Merchandise Stores within a ½ Mile – 1 Mile – – – – – –
General Merchandise Stores within 1 Mile – 1 ½ Miles $17,012.33** 0.18 – – – –
Miscellaneous Store Retailers within a ¼ Mile $14,405.43* 0.25 – – $14,027.28* 0.58
Miscellaneous Store Retailers within a ¼ Mile – a ½ Mile – – – – – –
Miscellaneous Store Retailers within a ½ Mile – 1 Mile – – –$2,415.19* –0.44 – –
Miscellaneous Store Retailers within 1 Mile – 1 ½ Miles – – –$1,838.30** –0.39 – –
Performing Arts Companies within a ¼ Mile – – –$28,606.20*** –0.12 – –
Performing Arts Companies within a ¼ Mile – a ½ Mile – – –$10,984.86* –0.07 $64,731.26** 0.67
Performing Arts Companies within a ½ Mile – 1 Mile – – – – $50,645.40** 1.15
Performing Arts Companies within 1 Mile – 1 ½ Miles – – – – $47,677.03*** 1.33
Promoters of Performing Arts, Sports and Similar Events within a ¼ Mile –$79,312.67** –0.13 – – – –
Promoters of Performing Arts, Sports and Similar Events within a ¼ Mile – a ½ Mile – – – – – –
Promoters of Performing Arts, Sports and Similar Events within a ½ Mile – 1 Mile – – – – – –
Promoters of Performing Arts, Sports and Similar Events within 1 Mile – 1 ½ Miles – – $8,907.42* 0.08 – –
Amusement Parks and Arcades within a ¼ Mile – – – – $34,297.65* 0.19

full
repo
rt
BUILDING PROSPEROUS PLACES IN MICHIGAN98
Table 10: Hedonic Pricing Regression Results - Traverse City, MI (cont.)
* Significant at the 0.10 confidence level.** Significant at the 0.05 confidence level.*** Significant at the 0.01 confidence level.– This variable is not significant.
Traverse City, MICategory 1 Category 2 Category 3
Coeff.Std.
Coeff. Coeff.Std.
Coeff. Coeff.Std.
Coeff.
Amusement Parks and Arcades within a ¼ Mile – a ½ Mile $25,048.60* 0.20 – – – –
Amusement Parks and Arcades within a ½ Mile – 1 Mile – – – – – –
Amusement Parks and Arcades within 1 Mile –1 ½ Miles $18,843.70*** 0.33 – – – –
Gambling Industries within a ¼ Mile – – – – – –
Gambling Industries within a ¼ Mile – a ½ Mile – – – – – –
Gambling Industries within a ½ Mile – 1 Mile – – – – – –
Gambling Industries within 1 Mile – 1 ½ Miles – – – – – –
Other Amusement and Recreation Industries within a ¼ Mile – – – – –$25,152.47** –0.62
Other Amusement and Recreation Industries within a ¼ Mile – a ½ Mile – – – – – –
Other Amusement and Recreation Industries within a ½ Mile – 1 Mile – – – – –$20,086.98*** –1.68
Other Amusement and Recreation Industries within 1 Mile – 1 ½ Miles – – – – –$12,685.17*** –1.62
Full-Service Restaurants within a ¼ Mile – – – – –$13,705.04* –0.39
Full-Service Restaurants within a ¼ Mile – a ½ Mile – – – – – –
Full-Service Restaurants within a ½ Mile – 1 Mile – – – – – –
Full-Service Restaurants within 1 Mile – 1 ½ Miles – – – – – –
Limited-Service Eating Places within a ¼ Mile – – – – – –
Limited-Service Eating Places within a ¼ Mile – a ½ Mile – – –$6,803.95* –0.13 – –
Limited-Service Eating Places within a ½ Mile – 1 Mile – – –$6,647.37** –0.37 – –
Limited-Service Eating Places within 1 Mile – 1 ½ Miles – – –$3,437.79** –0.23 – –
Drinking Places (Alcoholic Beverages) within a ¼ Mile – – –$14,848.40** –0.08 – –
Drinking Places (Alcoholic Beverages) within a ¼ Mile – a ½ Mile –$28,487.02** –0.19 –$8,442.28* –0.08 –$36,884.01*** –0.70
Drinking Places (Alcoholic Beverages) within a ½ Mile – 1 Mile –$21,761.13** –0.43 –$7,167.48** –0.22 –$13,546.18* –0.58
Drinking Places (Alcoholic Beverages) within 1 Mile – 1 ½ Miles – – – – –$23,947.23*** –1.16
Religious Organizations within a ¼ Mile – – – – – –
Religious Organizations within a ¼ Mile – a ½ Mile –$13,551.40* –0.23 – – $9,770.83** 0.42
Religious Organizations within a ½ Mile – 1 Mile –$10,919.09* –0.47 – – – –
Religious Organizations within 1 Mile – 1 ½ Miles –$7,850.86** –0.36 – – – –
# of Businesses within 1 Mile –$429.83** –1.91 – – – –
# of Employees within 1 Mile $19.62** 0.71 – – – –
Adjusted R-Squared 0.831 0.972 0.987
n 1,212 915 204

understanding the values of, perceptions of and barriers to placemaking
land
pol
icy
inst
itut
e
99
Table 11: Hedonic Pricing Regression Results - Royal Oak, MIAppendix C: Hedonic Pricing Regression Results (cont.)
Royal Oak, MICategory 1 Category 2 Category 3
Coeff.Std.
Coeff. Coeff.Std.
Coeff. Coeff.Std.
Coeff.
Sale Year 2001 $43,697.56*** 0.03 $35,728.51*** 0.03 $19,563.85*** 0.02
Sale Year 2002 $36,525.24*** 0.04 $32,596.32*** 0.04 $18,678.81*** 0.03
Sale Year 2003 $41,659.14*** 0.06 $33,706.97*** 0.05 $19,639.66*** 0.04
Sale Year 2004 $46,496.15*** 0.07 $38,257.43*** 0.06 $19,885.95*** 0.04
Sale Year 2005 $45,475.63*** 0.12 $37,616.48*** 0.11 $20,446.54*** 0.07
Sale Year 2006 $44,558.04*** 0.10 $37,680.79*** 0.10 $20,812.40*** 0.07
Sale Year 2007 $33,649.37*** 0.04 $27,579.43*** 0.04 $14,851.89*** 0.03
Sale Year 2008 $16,549.26*** 0.02 $12,756.20*** 0.02 $12,876.34*** 0.03
Sale Year 2009 – – – – $8,812.71*** 0.03
Sale Year 2010 –$7,641.14** –0.01 –$7,953.36*** –0.01 $3,957.87* 0.01
Property Sales in December, January and February –$6,543.21*** –0.01 –$6,756.24*** –0.02 –$3,563.42*** –0.01
Property Sales in March, April and May – – – – – –
Property Sales in September, October and November –$2,928.52** –0.01 –$2,364.94** –0.01 – –
Property Square Feet $2.94*** 0.15 $1.62*** 0.09 $0.74** 0.06
Squared $0.00*** –0.20 $0.00*** –0.13 $0.00** –0.15
Cubed $0.00*** 0.12 $0.00*** 0.08 $0.00** 0.09
Age of Property (2010–Year Built) –$84.14*** –0.03 – – – –
# of Bedrooms $14,129.26** 0.21 – – – –
Squared – – – – – –
Cubed – – – – $784.70* 0.16
# of Full-Baths $27,636.69*** 0.20 $14,713.02*** 0.12 – –
Squared –$6,592.37*** –0.10 –$2,753.09** –0.04 – –
# of Half-Baths $12,992.75*** 0.04 $3,642.69* 0.01 –$10,535.31** –0.03
Squared –$4,387.41** –0.02 – – – –
Square Footage of the House $44.65*** 0.29 $184.61*** 1.25 $163.28*** 1.37
Squared $0.02*** 0.21 –$0.06*** –0.61 –$0.10*** –1.05
Cubed $0.00*** –0.06 $0.00*** 0.12 $0.00*** 0.33
Garage Yes/No $18,857.06*** 0.09 $15,783.86*** 0.08 $3,818.98*** 0.03
Median Household Income within Block Group: 2005–2009 – – – – – –
Income Diversity $469.76* 0.20 $653.40*** 0.32 $492.14* 0.34
Racial Diversity Index: 2010 –$263.61*** –0.02 –$158.80*** –0.01 – –
% of Poverty in Census Tract: 2005–2009 –$546.45* –0.02 –$890.61*** –0.04 – –
% of Population Age 25 and Older with a High School Degree: 2005–2009 – – – – – –
% of Population Age 25 and Older with an Associate's Degree: 2005–2009 – – $573.85* 0.02 – –

full
repo
rt
BUILDING PROSPEROUS PLACES IN MICHIGAN100
* Significant at the 0.10 confidence level.** Significant at the 0.05 confidence level.*** Significant at the 0.01 confidence level.– This variable is not significant.† Negative coefficient translates into positive marginal value. Can be interpreted as: “For each additional foot from an interstate, river, etc., x is associated with $x increase/decrease in sale price.”
Table 11: Hedonic Pricing Regression Results - Royal Oak, MI (cont.)
Royal Oak, MICategory 1 Category 2 Category 3
Coeff.Std.
Coeff. Coeff.Std.
Coeff. Coeff.Std.
Coeff.
% of Population Age 25 and Older with a Bachelor's Degree: 2005–2009 $883.26*** 0.13 $726.40*** 0.11 – –
% of Population Age 25 and Older with a Graduate or Professional Degree: 2005–2009 $1,341.11*** 0.11 $861.09*** 0.08 – –
Age Diversity – – –$1,982.23*** –0.79 – –
Children Age 5 to 17 –$39,612.94*** –0.02 – – – –
Distance to Closest River in Feet† – – – – – –
Cubed – – $0.00*** 0.13 – –
Distance to Closest Lake in Feet† – – – – – –
Squared – – – – – –
Cubed – – – – – –
Distance to Closest Park in Feet† – – – – – –
Squared – – – – – –
Cubed – – – – – –
Distance to Downtown† – – – – – –
Distance to Nearest Interstate† – – – – – –
Distance to Closest Primary School in Feet† $3.02** 0.04 $3.97*** 0.06 – –
Distance to Closest High School in Feet† – – – – –$2.47* –0.13
Motor Vehicle and Parts Dealers within a ¼ Mile $3,655.14** 0.01 – – – –
Motor Vehicle and Parts Dealers within a ¼ Mile – a ½ Mile – – – – – –
Motor Vehicle and Parts Dealers within a ½ Mile – 1 Mile – – – – – –
Motor Vehicle and Parts Dealers within 1 Mile – 1 ½ Miles – – – – – –
Furniture and Home Furnishings Stores within a ¼ Mile – – $1,589.08* 0.01 – –
Furniture and Home Furnishings Stores within a ¼ Mile – a ½ Mile $2,738.07*** 0.04 $1,937.36*** 0.03 $1,409.44* 0.03
Furniture and Home Furnishings Stores within a ½ Mile – 1 Mile $2,039.04*** 0.08 $1,110.89*** 0.05 – –
Furniture and Home Furnishings Stores within 1 Mile – 1 ½ Miles $812.80** 0.06 – – – –
Electronics and Appliance Stores within a ¼ Mile – – –$1,679.39* –0.01 – –
Electronics and Appliance Stores within a ¼ Mile – a ½ Mile – – – – – –
Electronics and Appliance Stores within a ½ Mile – 1 Mile – – – – – –
Electronics and Appliance Stores within 1 Mile – 1 ½ Miles – – – – – –
Building Material/Garden Equipment/ Supply Dealers within a ¼ Mile –$3,675.11* –0.01 –$2,330.84* –0.01 – –

understanding the values of, perceptions of and barriers to placemaking
land
pol
icy
inst
itut
e
101
Table 11: Hedonic Pricing Regression Results - Royal Oak, MI (cont.)
Royal Oak, MICategory 1 Category 2 Category 3
Coeff.Std.
Coeff. Coeff.Std.
Coeff. Coeff.Std.
Coeff.
Building Material/Garden Equipment/ Supply Dealers within a ¼ Mile – a ½ Mile – – – – – –
Building Material/Garden Equipment/ Supply Dealers within a ½ Mile – 1 Mile – – – – – –
Building Material/Garden Equipment/ Supply Dealers within 1 Mile – 1 ½ Miles –$1,236.53** –0.06 –$797.63** –0.05 – –
Grocery Stores within a ¼ Mile –$3,200.36* –0.01 – – – –
Grocery Stores within a ¼ Mile – a ½ Mile $1,844.81* 0.02 $2,197.30*** 0.03 – –
Grocery Stores within a ½ Mile – 1 Mile – – – – –$1,305.19* –0.08
Grocery Stores within 1 Mile – 1 ½ Miles – – $637.39** 0.04 –$768.54* –0.08
Specialty Food Stores within a ¼ Mile – – – – – –
Specialty Food Stores within a ¼ Mile – a ½ Mile – – $3,531.41** 0.01 – –
Specialty Food Stores within a ½ Mile – 1 Mile – – – – – –
Specialty Food Stores within 1 Mile – 1 ½ Miles –$1,836.23** –0.04 – – – –
Beer, Wine and Liquor Stores within a ¼ Mile – – – – – –
Beer, Wine and Liquor Stores within a ¼ Mile – a ½ Mile $3,676.79** 0.03 $1,938.45* 0.02 $3,109.39** 0.03
Beer, Wine and Liquor Stores within a ½ Mile – 1 Mile $2,455.69** 0.06 $1,705.97** 0.04 $2,476.92** 0.10
Beer, Wine and Liquor Stores within 1 Mile – 1 ½ Miles $1,942.87*** 0.07 $814.02* 0.03 $1,795.80*** 0.11
Health and Personal Care Stores within a ¼ Mile –$4,043.03** –0.01 –$3,831.48*** –0.02 – –
Health and Personal Care Stores within a ¼ Mile – a ½ Mile – – – – – –
Health and Personal Care Stores within a ½ Mile – 1 Mile – – – – – –
Health and Personal Care Stores within 1 Mile – 1 ½ Miles – – – – – –
Gasoline Stations within a ¼ Mile –$6,051.63*** –0.02 –$3,275.58** –0.01 – –
Gasoline Stations within a ¼ Mile – a ½ Mile –$7,288.97*** –0.05 –$3,062.59*** –0.02 – –
Gasoline Stations within a ½ Mile – 1 Mile –$4,574.97*** –0.10 –$2,135.30*** –0.05 – –
Gasoline Stations within 1 Mile – 1 ½ Miles –$1,956.56*** –0.06 –$946.46** –0.03 – –
Clothing and Clothing Accessories Stores within a ¼ Mile $1,462.37* 0.01 – – – –
Clothing and Clothing Accessories Stores within a ¼ Mile – a ½ Mile – – – – – –
Clothing and Clothing Accessories Stores within a ½ Mile – 1 Mile – – – – – –
Clothing and Clothing Accessories Stores within 1 Mile – 1 ½ Miles – – –$142.90* –0.03 – –
Sporting Goods, Hobby and Musical Instrument Stores within a ¼ Mile – – – – – –
Sporting Goods, Hobby and Musical Instrument Stores within a ¼ Mile – ½ Mile $1,875.03** 0.02 $1,184.41* 0.02 – –
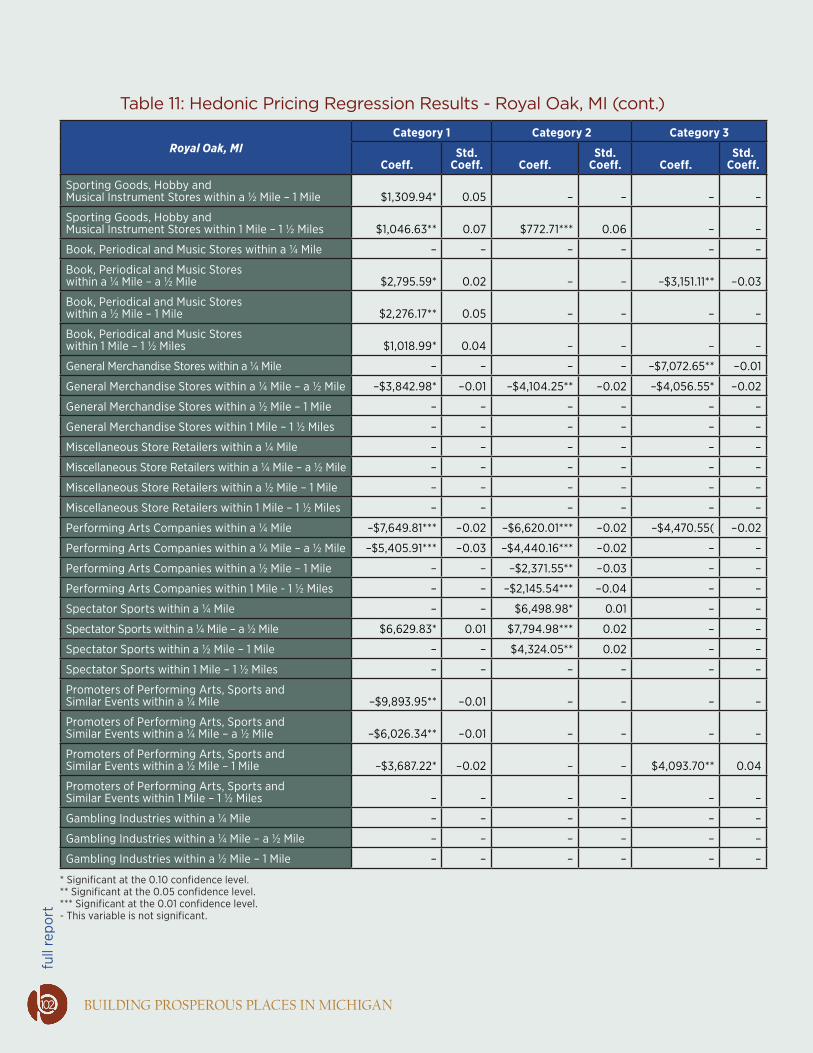
full
repo
rt
BUILDING PROSPEROUS PLACES IN MICHIGAN102
* Significant at the 0.10 confidence level.** Significant at the 0.05 confidence level.*** Significant at the 0.01 confidence level.- This variable is not significant.
Table 11: Hedonic Pricing Regression Results - Royal Oak, MI (cont.)
Royal Oak, MICategory 1 Category 2 Category 3
Coeff.Std.
Coeff. Coeff.Std.
Coeff. Coeff.Std.
Coeff.
Sporting Goods, Hobby and Musical Instrument Stores within a ½ Mile – 1 Mile $1,309.94* 0.05 – – – –
Sporting Goods, Hobby and Musical Instrument Stores within 1 Mile – 1 ½ Miles $1,046.63** 0.07 $772.71*** 0.06 – –
Book, Periodical and Music Stores within a ¼ Mile – – – – – –
Book, Periodical and Music Stores within a ¼ Mile – a ½ Mile $2,795.59* 0.02 – – –$3,151.11** –0.03
Book, Periodical and Music Stores within a ½ Mile – 1 Mile $2,276.17** 0.05 – – – –
Book, Periodical and Music Stores within 1 Mile – 1 ½ Miles $1,018.99* 0.04 – – – –
General Merchandise Stores within a ¼ Mile – – – – –$7,072.65** –0.01
General Merchandise Stores within a ¼ Mile – a ½ Mile –$3,842.98* –0.01 –$4,104.25** –0.02 –$4,056.55* –0.02
General Merchandise Stores within a ½ Mile – 1 Mile – – – – – –
General Merchandise Stores within 1 Mile – 1 ½ Miles – – – – – –
Miscellaneous Store Retailers within a ¼ Mile – – – – – –
Miscellaneous Store Retailers within a ¼ Mile – a ½ Mile – – – – – –
Miscellaneous Store Retailers within a ½ Mile – 1 Mile – – – – – –
Miscellaneous Store Retailers within 1 Mile – 1 ½ Miles – – – – – –
Performing Arts Companies within a ¼ Mile –$7,649.81*** –0.02 –$6,620.01*** –0.02 –$4,470.55( –0.02
Performing Arts Companies within a ¼ Mile – a ½ Mile –$5,405.91*** –0.03 –$4,440.16*** –0.02 – –
Performing Arts Companies within a ½ Mile – 1 Mile – – –$2,371.55** –0.03 – –
Performing Arts Companies within 1 Mile - 1 ½ Miles – – –$2,145.54*** –0.04 – –
Spectator Sports within a ¼ Mile – – $6,498.98* 0.01 – –
Spectator Sports within a ¼ Mile – a ½ Mile $6,629.83* 0.01 $7,794.98*** 0.02 – –
Spectator Sports within a ½ Mile – 1 Mile – – $4,324.05** 0.02 – –
Spectator Sports within 1 Mile – 1 ½ Miles – – – – – –
Promoters of Performing Arts, Sports and Similar Events within a ¼ Mile –$9,893.95** –0.01 – – – –
Promoters of Performing Arts, Sports and Similar Events within a ¼ Mile – a ½ Mile –$6,026.34** –0.01 – – – –
Promoters of Performing Arts, Sports and Similar Events within a ½ Mile – 1 Mile –$3,687.22* –0.02 – – $4,093.70** 0.04
Promoters of Performing Arts, Sports and Similar Events within 1 Mile – 1 ½ Miles – – – – – –
Gambling Industries within a ¼ Mile – – – – – –
Gambling Industries within a ¼ Mile – a ½ Mile – – – – – –
Gambling Industries within a ½ Mile – 1 Mile – – – – – –

understanding the values of, perceptions of and barriers to placemaking
land
pol
icy
inst
itut
e
103
Table 11: Hedonic Pricing Regression Results - Royal Oak, MI (cont.)
Royal Oak, MICategory 1 Category 2 Category 3
Coeff.Std.
Coeff. Coeff.Std.
Coeff. Coeff.Std.
Coeff.
Gambling Industries within 1 Mile – 1 ½ Miles – – – – $22,511.35* 0.03
Amusement Parks and Arcades within a ¼ Mile – – – – – –
Amusement Parks and Arcades within a ¼ Mile – a ½ Mile –$10,855.48*** –0.02 –$6,871.36*** –0.02 – –
Amusement Parks and Arcades within a ½ Mile – 1 Mile –$5,968.09*** –0.04 –$3,898.85*** –0.03 – –
Amusement Parks and Arcades within 1 Mile – 1 ½ Miles – – – – – –
Other Amusement and Recreation Industries within a ¼ Mile – – – – – –
Other Amusement and Recreation Industries within a ¼ Mile – a ½ Mile – – – – – –
Other Amusement and Recreation Industries within a ½ Mile – 1 Mile – – – – – –
Other Amusement and Recreation Industries within 1 Mile – 1 ½ Miles – – – – – –
Full-Service Restaurants within a ¼ Mile – – $2,340.34*** 0.03 – –
Full-Service Restaurants within a ¼ Mile – a ½ Mile $1,018.26* 0.03 $897.26** 0.03 – –
Full-Service Restaurants within a ½ Mile – 1 Mile – – $613.11** 0.07 – –
Full-Service Restaurants within 1 Mile – 1 ½ Miles –$440.84** –0.07 – – – –
Limited-Service Eating Places within a ¼ Mile – – – – – –
Limited-Service Eating Places within a ¼ Mile – a ½ Mile – – – – – –
Limited-Service Eating Places within a ½ Mile – 1 Mile $1,116.71* 0.05 $1,322.94*** 0.07 $1,644.28*** 0.12
Limited-Service Eating Places within 1 Mile – 1 ½ Miles – – $593.49** 0.05 – –
Drinking Places (Alcoholic Beverages) within a ¼ Mile –$7,570.40** –0.02 –$5,392.76** –0.01 – –
Drinking Places (Alcoholic Beverages) within a ¼ Mile – a ½ Mile –$8,207.78*** –0.06 –$3,884.75*** –0.03 – –
Drinking Places (Alcoholic Beverages) within a ½ Mile – 1 Mile –$2,528.46** –0.05 –$1,838.36** –0.04 – –
Drinking Places (Alcoholic Beverages) within 1 Mile – 1 ½ Miles –$1,288.74** –0.05 – – – –
Religious Organizations within a ¼ Mile – – – – – –
Religious Organizations within a ¼ Mile – a ½ Mile – – –$786.34* –0.02 – –
Religious Organizations within a ½ Mile – 1 Mile – – – – – –
Religious Organizations within 1 Mile – 1 ½ Miles – – – – – –
# of Businesses within 1 Mile –$33.93** –0.20 –$29.03** –0.19 – –
# of Employees within 1 Mile – – – – – –
Adjusted R-Squared 0.957 0.974 0.981
n 7,112 6,649 1,572

full
repo
rt
BUILDING PROSPEROUS PLACES IN MICHIGAN
Appendix D: Conceptual Framework
Though not tested, we felt it important to formulate a theory of how placemaking and conventional real estate
differ. We begin our conceptual framework by defining what a “placemaking real estate” project means and
contrasting this to a standard real estate project without placemaking elements. A standard residential building
(SRB) has basic housing features designed to meet the basic housing needs of a consumer or household. These
features may include such things as the lot or L (including size, shape, frontage, slope, and basic landscaping),
built improvements or I (including the number or sizes of bedrooms, bathrooms, living rooms, family rooms,
kitchens, garages, floors, building age, structure, square footage, and basements), and basic community
amenities or CA (including the number, sizes and quality of parks, standard municipal amenities, and roads).
The value of the ith SRB (VHi) is, therefore, the sum of the hedonic values of the SRB’s attributes, which include
the elements of L, I and CA.
(1)
where the Pi’s are the hedonic prices of each Xi attribute, which include L, I and CA attributes. The value per
square foot can therefore be expressed as:
(2)
Similarly, a standard commercial building (SCB) has basic commercial features designed to meet the basic needs
of businesses or other organizations. These features might include such things as the land or N (including such
things as the parking lot, outside lighting, frontage, slope and basic landscaping), built improvements or K
(including the number or sizes of suites, storage space, parking condition, floors, building age, square footage)
and basic community business amenities or BA (including roads and other standard municipal amenities). The
hedonic value of the ith SCB (VBi) is therefore, the sum of the hedonic values of the SCB’s attributes, which
include the elements of N, K and BA.
(3)
where the Pj’s are the hedonic prices of each Xj attribute, which include N, K and BA attributes. The value per
square foot can, therefore, be expressed as:
(4)
A placemaking housing or commercial property is defined, therefore, as one designed to involve non-standard
attributes. This can include mixed-use development, which co-mingles housing and commercial attributes. For
example, the value of a mixed-use property (VR) can be expressed as follows:
(5)
i
m
mii
m
miii
m
iiii
m
iii ACPIPLPXPHV ∑∑∑∑
+=+===
++==3
12
2
11
1
11
104
AACPAIPALPAXPAHV i
m
mii
m
miii
m
iiii
m
iii /)(/)(/)(/)(/
3
12
2
11
1
11∑∑∑∑
+=+===
++== .
AABPAKPANPAXPABV j
w
wjj
w
wjjj
w
jjjj
w
jjj /)(/)(/)(/)(/
3
12
2
11
1
11∑∑∑∑
+=+===
++== .
j
w
wjj
w
wjjj
w
jjji
m
mii
m
miii
m
iiijiji ABPKPNPACPIPLPBVHVRV ∑∑∑∑∑∑
+=+==+=+==
+++++=+=3
12
*2
11
*1
1
*3
12
*2
11
*1
1
***j
w
wjj
w
wjjj
w
jjji
m
mii
m
miii
m
iiijiji ABPKPNPACPIPLPBVHVRV ∑∑∑∑∑∑
+=+==+=+==
+++++=+=3
12
*2
11
*1
1
*3
12
*2
11
*1
1
***.
j
w
wjj
w
wjjj
w
jjjj
w
jjj ABPKPNPXPBV ∑∑∑∑
+=+===
++==3
12
2
11
1
11
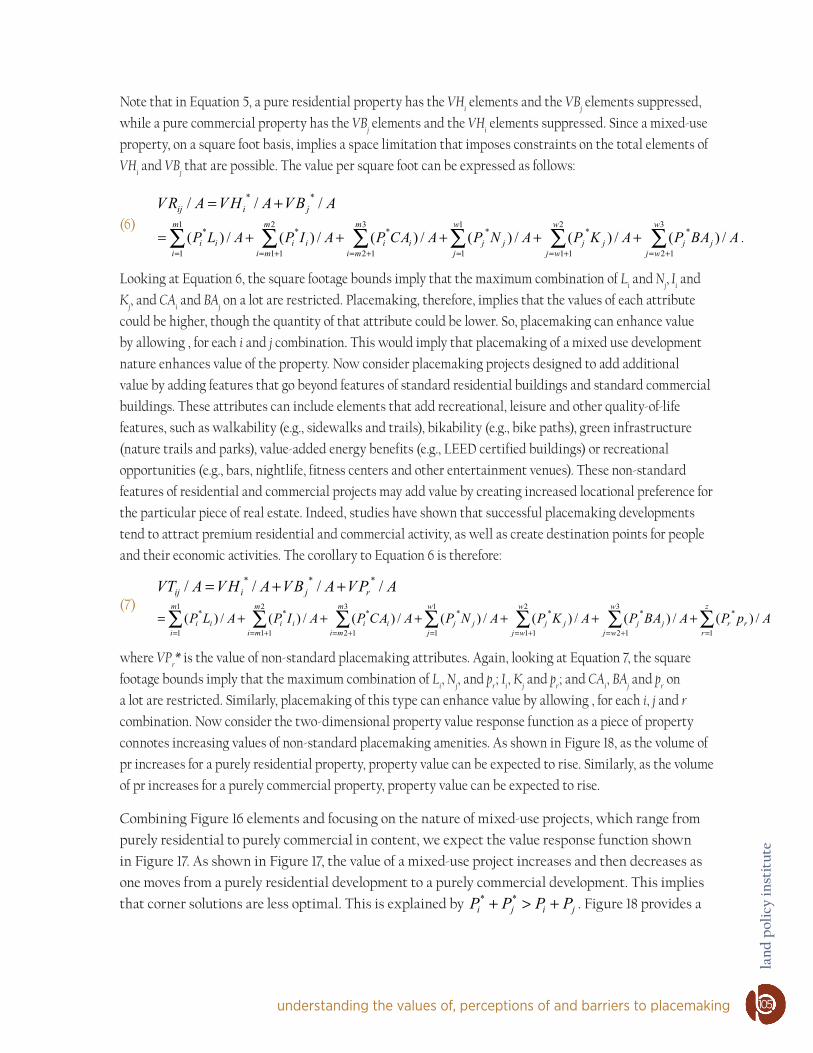
understanding the values of, perceptions of and barriers to placemaking
land
pol
icy
inst
itut
e
∑∑∑∑∑∑∑=+=+==+=+==
++++++=z
rrrj
w
wjj
w
wjjj
w
jjji
m
mii
m
miii
m
iii ApPAABPAKPANPAACPAIPALP
1
*3
12
*2
11
*1
1
*3
12
*2
11
*1
1
* /)(/)(/)(/)(/)(/)(/)(
APVABVAHVATV rjiji //// *** ++= APVABVAHVATV rjiji //// *** ++=
Note that in Equation 5, a pure residential property has the VHi elements and the VBj elements suppressed,
while a pure commercial property has the VBj elements and the VHi elements suppressed. Since a mixed-use
property, on a square foot basis, implies a space limitation that imposes constraints on the total elements of
VHi and VBj that are possible. The value per square foot can be expressed as follows:
(6)
Looking at Equation 6, the square footage bounds imply that the maximum combination of Li and Nj, Ii and
Kj, and CAi and BAj on a lot are restricted. Placemaking, therefore, implies that the values of each attribute
could be higher, though the quantity of that attribute could be lower. So, placemaking can enhance value
by allowing , for each i and j combination. This would imply that placemaking of a mixed use development
nature enhances value of the property. Now consider placemaking projects designed to add additional
value by adding features that go beyond features of standard residential buildings and standard commercial
buildings. These attributes can include elements that add recreational, leisure and other quality-of-life
features, such as walkability (e.g., sidewalks and trails), bikability (e.g., bike paths), green infrastructure
(nature trails and parks), value-added energy benefits (e.g., LEED certified buildings) or recreational
opportunities (e.g., bars, nightlife, fitness centers and other entertainment venues). These non-standard
features of residential and commercial projects may add value by creating increased locational preference for
the particular piece of real estate. Indeed, studies have shown that successful placemaking developments
tend to attract premium residential and commercial activity, as well as create destination points for people
and their economic activities. The corollary to Equation 6 is therefore:
(7)
where VPr* is the value of non-standard placemaking attributes. Again, looking at Equation 7, the square
footage bounds imply that the maximum combination of Li, Nj, and pr; Ii, Kj and pr; and CAi, BAj and pr on
a lot are restricted. Similarly, placemaking of this type can enhance value by allowing , for each i, j and r
combination. Now consider the two-dimensional property value response function as a piece of property
connotes increasing values of non-standard placemaking amenities. As shown in Figure 18, as the volume of
pr increases for a purely residential property, property value can be expected to rise. Similarly, as the volume
of pr increases for a purely commercial property, property value can be expected to rise.
Combining Figure 16 elements and focusing on the nature of mixed-use projects, which range from
purely residential to purely commercial in content, we expect the value response function shown
in Figure 17. As shown in Figure 17, the value of a mixed-use project increases and then decreases as
one moves from a purely residential development to a purely commercial development. This implies
that corner solutions are less optimal. This is explained by . Figure 18 provides a
105
AABPAKPANPAACPAIPALP j
w
wjj
w
wjjj
w
jjji
m
mii
m
miii
m
iii /)(/)(/)(/)(/)(/)(
3
12
*2
11
*1
1
*3
12
*2
11
*1
1
* ∑∑∑∑∑∑+=+==+=+==
+++++=
ABVAHVARV jiji /// ** += ABVAHVARV jiji /// ** +=
.
jiji PPPP +>+ **

full
repo
rt
BUILDING PROSPEROUS PLACES IN MICHIGAN106
Figure 17: Value-Place Response Function
VH VB
p pSource: Figure created by the Land Policy Institute, Michigan State University, 2012.
Figure 18: Value Response Function forMixed-Use Projects
VT
R BSource: Figure created by the Land Policy Institute, Michigan State University, 2012.
three-dimensional value response surface that incorporates non-standard place elements and mixed-use,
which shows an optimal combination of mixed-use and other placemaking elements.
This is explained by .
The hedonic pricing model is used to tease out the values of placemaking features and requires
the specification of a function that leverages data from a continuum of project scenarios, ranging
from purely residential to purely commercial properties, with varying elements of non-standard
placemaking attributes.
rjirji PPPPPP ++>++ ***
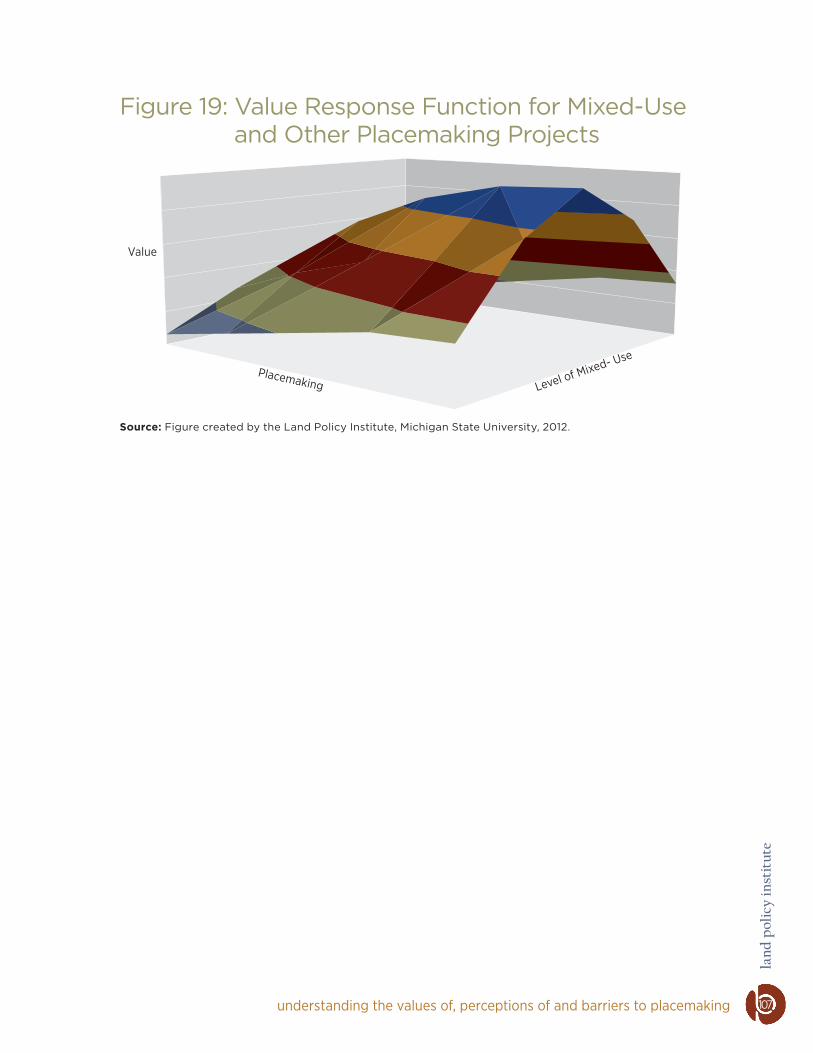
understanding the values of, perceptions of and barriers to placemaking
land
pol
icy
inst
itut
e
Figure 19: Value Response Function for Mixed-Useand Other Placemaking Projects
Value
Placemaking Level of Mixed- Use
Source: Figure created by the Land Policy Institute, Michigan State University, 2012.
107
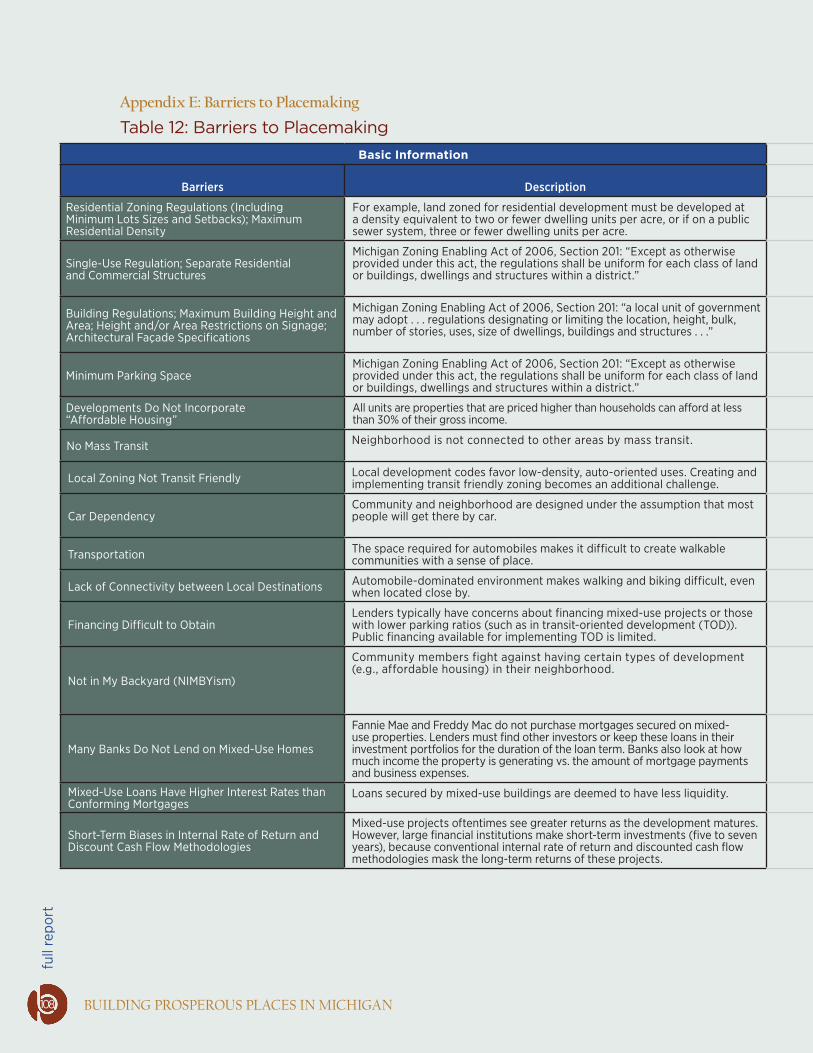
full
repo
rt
BUILDING PROSPEROUS PLACES IN MICHIGAN
Appendix E: Barriers to Placemaking
Table 12: Barriers to PlacemakingBasic Information Barrier For Barrier Can Be Addressed By
Barriers DescriptionPlacemaking
ElementLocal
GovernmentFinancial
Institutions DeveloperCommunity
MembersLocal
GovernmentFinancial
Institutions DeveloperCommunity
Members
Residential Zoning Regulations (Including Minimum Lots Sizes and Setbacks); Maximum Residential Density
For example, land zoned for residential development must be developed at a density equivalent to two or fewer dwelling units per acre, or if on a public sewer system, three or fewer dwelling units per acre.
Mixed-Use; Affordable
Housing X X X
Single-Use Regulation; Separate Residential and Commercial Structures
Michigan Zoning Enabling Act of 2006, Section 201: “Except as otherwise provided under this act, the regulations shall be uniform for each class of land or buildings, dwellings and structures within a district.”
Mixed-Use; Workforce Housing;
WalkabilityX X X
Building Regulations; Maximum Building Height and Area; Height and/or Area Restrictions on Signage; Architectural Façade Specifications
Michigan Zoning Enabling Act of 2006, Section 201: “a local unit of government may adopt . . . regulations designating or limiting the location, height, bulk, number of stories, uses, size of dwellings, buildings and structures . . .”
Placemaking; Mixed-Use; Workforce Housing
X X
Minimum Parking SpaceMichigan Zoning Enabling Act of 2006, Section 201: “Except as otherwise provided under this act, the regulations shall be uniform for each class of land or buildings, dwellings and structures within a district.”
Mixed-Use; Affordable
Housing X XDevelopments Do Not Incorporate “Affordable Housing”
All units are properties that are priced higher than households can afford at less than 30% of their gross income.
Affordable Housing X X X X
No Mass Transit Neighborhood is not connected to other areas by mass transit. Transit Stops/Hubs X X X
Local Zoning Not Transit Friendly Local development codes favor low-density, auto-oriented uses. Creating and implementing transit friendly zoning becomes an additional challenge.
Transit-Oriented Development X X X
Car DependencyCommunity and neighborhood are designed under the assumption that most people will get there by car.
Bike Paths; Transit Stops/
Hubs; Walkability X X X X X XTransportation The space required for automobiles makes it difficult to create walkable
communities with a sense of place.Walkability; Placemaking X X X X X X
Lack of Connectivity between Local Destinations Automobile-dominated environment makes walking and biking difficult, even when located close by. Bikability X X
Financing Difficult to ObtainLenders typically have concerns about financing mixed-use projects or those with lower parking ratios (such as in transit-oriented development (TOD)). Public financing available for implementing TOD is limited.
Transit-Oriented Development X X X
Not in My Backyard (NIMBYism)
Community members fight against having certain types of development (e.g., affordable housing) in their neighborhood.
Affordable Housing; Mixed-Use; Bike Paths;
Workforce Housing
X X X
Many Banks Do Not Lend on Mixed-Use Homes
Fannie Mae and Freddy Mac do not purchase mortgages secured on mixed-use properties. Lenders must find other investors or keep these loans in their investment portfolios for the duration of the loan term. Banks also look at how much income the property is generating vs. the amount of mortgage payments and business expenses.
Mixed-Use X X X
Mixed-Use Loans Have Higher Interest Rates than Conforming Mortgages
Loans secured by mixed-use buildings are deemed to have less liquidity. Mixed-Use X XShort-Term Biases in Internal Rate of Return and Discount Cash Flow Methodologies
Mixed-use projects oftentimes see greater returns as the development matures. However, large financial institutions make short-term investments (five to seven years), because conventional internal rate of return and discounted cash flow methodologies mask the long-term returns of these projects.
Mixed-Use X X
108

understanding the values of, perceptions of and barriers to placemaking
land
pol
icy
inst
itut
e
Basic Information Barrier For Barrier Can Be Addressed By
Barriers DescriptionPlacemaking
ElementLocal
GovernmentFinancial
Institutions DeveloperCommunity
MembersLocal
GovernmentFinancial
Institutions DeveloperCommunity
Members
Residential Zoning Regulations (Including Minimum Lots Sizes and Setbacks); Maximum Residential Density
For example, land zoned for residential development must be developed at a density equivalent to two or fewer dwelling units per acre, or if on a public sewer system, three or fewer dwelling units per acre.
Mixed-Use; Affordable
Housing X X X
Single-Use Regulation; Separate Residential and Commercial Structures
Michigan Zoning Enabling Act of 2006, Section 201: “Except as otherwise provided under this act, the regulations shall be uniform for each class of land or buildings, dwellings and structures within a district.”
Mixed-Use; Workforce Housing;
WalkabilityX X X
Building Regulations; Maximum Building Height and Area; Height and/or Area Restrictions on Signage; Architectural Façade Specifications
Michigan Zoning Enabling Act of 2006, Section 201: “a local unit of government may adopt . . . regulations designating or limiting the location, height, bulk, number of stories, uses, size of dwellings, buildings and structures . . .”
Placemaking; Mixed-Use; Workforce Housing
X X
Minimum Parking SpaceMichigan Zoning Enabling Act of 2006, Section 201: “Except as otherwise provided under this act, the regulations shall be uniform for each class of land or buildings, dwellings and structures within a district.”
Mixed-Use; Affordable
Housing X XDevelopments Do Not Incorporate “Affordable Housing”
All units are properties that are priced higher than households can afford at less than 30% of their gross income.
Affordable Housing X X X X
No Mass Transit Neighborhood is not connected to other areas by mass transit. Transit Stops/Hubs X X X
Local Zoning Not Transit Friendly Local development codes favor low-density, auto-oriented uses. Creating and implementing transit friendly zoning becomes an additional challenge.
Transit-Oriented Development X X X
Car DependencyCommunity and neighborhood are designed under the assumption that most people will get there by car.
Bike Paths; Transit Stops/
Hubs; Walkability X X X X X XTransportation The space required for automobiles makes it difficult to create walkable
communities with a sense of place.Walkability; Placemaking X X X X X X
Lack of Connectivity between Local Destinations Automobile-dominated environment makes walking and biking difficult, even when located close by. Bikability X X
Financing Difficult to ObtainLenders typically have concerns about financing mixed-use projects or those with lower parking ratios (such as in transit-oriented development (TOD)). Public financing available for implementing TOD is limited.
Transit-Oriented Development X X X
Not in My Backyard (NIMBYism)
Community members fight against having certain types of development (e.g., affordable housing) in their neighborhood.
Affordable Housing; Mixed-Use; Bike Paths;
Workforce Housing
X X X
Many Banks Do Not Lend on Mixed-Use Homes
Fannie Mae and Freddy Mac do not purchase mortgages secured on mixed-use properties. Lenders must find other investors or keep these loans in their investment portfolios for the duration of the loan term. Banks also look at how much income the property is generating vs. the amount of mortgage payments and business expenses.
Mixed-Use X X X
Mixed-Use Loans Have Higher Interest Rates than Conforming Mortgages
Loans secured by mixed-use buildings are deemed to have less liquidity. Mixed-Use X XShort-Term Biases in Internal Rate of Return and Discount Cash Flow Methodologies
Mixed-use projects oftentimes see greater returns as the development matures. However, large financial institutions make short-term investments (five to seven years), because conventional internal rate of return and discounted cash flow methodologies mask the long-term returns of these projects.
Mixed-Use X X
109

full
repo
rt
BUILDING PROSPEROUS PLACES IN MICHIGAN110
Table 12: Barriers to Placemaking (cont.)Basic Information Barrier For Barrier Can Be Addressed By
Barriers DescriptionPlacemaking
ElementLocal
GovernmentFinancial
Institutions DeveloperCommunity
MembersLocal
GovernmentFinancial
Institutions DeveloperCommunity
Members
Aversion to Density Many individuals and communities do not accept higher density development. Smart Growth X X X X X XCost of Infill or Brownfield Development It is less expensive for developers to build in greenfield locations. Smart Growth X X X XHome Rule Local land use decisions interfere with solving regional problems,
such as transportation. Smart Growth X X X XSocial Class Desire to sort communities into like economic classes. Smart Growth X X X X X XLack of Training, Education and Information
Developers, local governments and financial institutions are unwilling or unfamiliar with “smart growth” principles; many community master plans that promote “smart growth” have little buy-in from citizens.
Smart Growth X X X X XRisk Financial institutions are reluctant or refuse to provide funding for “smart
growth” projects, due to their perceived risk. Smart Growth X XHigh Land Costs High land costs in urban areas was cited as the biggest site-related barrier to
the construction of workforce housing (Urban Land Institute, 2002).Workforce Housing X X
Deteriorated InfrastructureInfrastructure in many urban areas is in need of repair, enlargement or replacement. The costs to repair such infrastructure add to the overall project costs and can make the production of workforce housing financially infeasible.
Workforce Housing X X X X
Environmental Challenges Urban sites are more likely to be contaminated than greenfield suburban sites. They also pose staging and access challenges during the construction process.
Infill Development X X X X
Lack of Information about Available SitesIn markets with significant unsatisfied demand, the profit motive will lead developers to find the sites; in low-demand markets, government assistance may be helpful.
Workforce Housing X X X X
Lack of Understanding the Market Segment’s Location Preferences
Where do workers want to live, and by which amenities? Workforce Housing X X X X X
Inadequate Existing Building StockExisting stock may not meet demands of the market and, therefore, may require the demolition or conversion of existing structures. These costs may be too high to make development financially feasible.
Workforce Housing X X X
Limited Government FundingLimited Federal money is available to fund workforce housing programs. Few programs extend their income restrictions to include moderate- income households.
Workforce Housing X X X
Down Payment Requirements Few moderate-income workers are able to save enough money for the down payment required to secure a loan. Many are forced to remain in the rental market.
Workforce Housing X X
Park Access Proximity of parks to homes can affect access. Studies show that on average people will walk a ¼ mile to a park. Parks X X X
Perceptions of Safety Areas where traffic fatalities occurred recently and crime frequency is high can alter the way residents interact with their environments. Walkability X X X
Higher Developer Risk and Cost
Mixed-use higher density projects, higher density projects with reduced amounts of parking (such as in TOD) can significantly increase risk for developers and financiers. Transit-oriented development can be more costly, and subject to added regulations and more complex local approval processes, as compared to conventional “auto-oriented” development.
Transit-Oriented Development X X X X

understanding the values of, perceptions of and barriers to placemaking
land
pol
icy
inst
itut
e
Basic Information Barrier For Barrier Can Be Addressed By
Barriers DescriptionPlacemaking
ElementLocal
GovernmentFinancial
Institutions DeveloperCommunity
MembersLocal
GovernmentFinancial
Institutions DeveloperCommunity
Members
Aversion to Density Many individuals and communities do not accept higher density development. Smart Growth X X X X X XCost of Infill or Brownfield Development It is less expensive for developers to build in greenfield locations. Smart Growth X X X XHome Rule Local land use decisions interfere with solving regional problems,
such as transportation. Smart Growth X X X XSocial Class Desire to sort communities into like economic classes. Smart Growth X X X X X XLack of Training, Education and Information
Developers, local governments and financial institutions are unwilling or unfamiliar with “smart growth” principles; many community master plans that promote “smart growth” have little buy-in from citizens.
Smart Growth X X X X XRisk Financial institutions are reluctant or refuse to provide funding for “smart
growth” projects, due to their perceived risk. Smart Growth X XHigh Land Costs High land costs in urban areas was cited as the biggest site-related barrier to
the construction of workforce housing (Urban Land Institute, 2002).Workforce Housing X X
Deteriorated InfrastructureInfrastructure in many urban areas is in need of repair, enlargement or replacement. The costs to repair such infrastructure add to the overall project costs and can make the production of workforce housing financially infeasible.
Workforce Housing X X X X
Environmental Challenges Urban sites are more likely to be contaminated than greenfield suburban sites. They also pose staging and access challenges during the construction process.
Infill Development X X X X
Lack of Information about Available SitesIn markets with significant unsatisfied demand, the profit motive will lead developers to find the sites; in low-demand markets, government assistance may be helpful.
Workforce Housing X X X X
Lack of Understanding the Market Segment’s Location Preferences
Where do workers want to live, and by which amenities? Workforce Housing X X X X X
Inadequate Existing Building StockExisting stock may not meet demands of the market and, therefore, may require the demolition or conversion of existing structures. These costs may be too high to make development financially feasible.
Workforce Housing X X X
Limited Government FundingLimited Federal money is available to fund workforce housing programs. Few programs extend their income restrictions to include moderate- income households.
Workforce Housing X X X
Down Payment Requirements Few moderate-income workers are able to save enough money for the down payment required to secure a loan. Many are forced to remain in the rental market.
Workforce Housing X X
Park Access Proximity of parks to homes can affect access. Studies show that on average people will walk a ¼ mile to a park. Parks X X X
Perceptions of Safety Areas where traffic fatalities occurred recently and crime frequency is high can alter the way residents interact with their environments. Walkability X X X
Higher Developer Risk and Cost
Mixed-use higher density projects, higher density projects with reduced amounts of parking (such as in TOD) can significantly increase risk for developers and financiers. Transit-oriented development can be more costly, and subject to added regulations and more complex local approval processes, as compared to conventional “auto-oriented” development.
Transit-Oriented Development X X X X
111

full
repo
rt
BUILDING PROSPEROUS PLACES IN MICHIGAN112
Appendix F: Placemaking Case Studies
Table 13: Placemaking Case StudiesTitle Categories City/County State Year Description Source
Posadas Sentinel, Tucson Affordable Housing Tucson AZ 2001 Use of HUD’s HOPE VI Grants. Smart Growth
Network and National Neighborhood Coalition
Sara Conner CourtAffordable Housing; Environmental Health and Sustainability; Mixed-Use
Hayward CA 2009 Sara Conner Court is an affordable family housing development designed to create a supportive family environment immediately adjacent to a busy four-lane boulevard.
Enterprise Green Communities (Incremental Costs, Measurable Savings)
Leighton TownhomesAffordable Housing; Environmental Health and Sustainability
Los Angeles CA 2009 For more than 20 years, a vacant lot stood at the intersection of Los Angeles’ Leighton Avenue and Martin Luther King Jr. Boulevard. Today, eight stylish, energy-saving townhomes house 14 families at Leighton Townhomes, a development by Enterprise Home Ownership Partners.
Enterprise Green Communities (Incremental Costs, Measurable Savings)
Madrone Plaza
Affordable Housing; Environmental Health and Sustainability; Walkability
Morgan Hill CA 2009 Madrone Plaza, built by South County Community Builders, is a mixed-income housing development located on 6.5 acres of previously vacant land. Madrone Plaza homeowner’s association provides all residents, regardless of income, with access to a park, barbecue/picnic area, tot lot, clubhouse, swimming pool, bocce ball court, putting green and basketball court. The project features Craftsman architecture and incorporates many green building elements. It offers spectacular views of the mountains, with plenty of outdoor opportunities for walking, biking, golfing and other activities. The majority of the townhomes will front a pedestrian paseo lined with shade trees to encourage community interaction.
Enterprise Green Communities (Incremental Costs, Measurable Savings)
Fox Courts
Affordable Housing; Environmental Health and Sustainability; Social Services; Public Transit
Oakland CA 2009 Fox Courts is a transit-oriented, arts-enriched, family-focused, affordable housing development in the Uptown District of central Oakland. It is one part of a redevelopment that also includes 700 market-rate homes, the historic Fox Theater, the Oakland School for the Arts, restaurants and retail opportunities. Fox Courts’ 0.88-acre site used to be a parking lot. Community activists banded together to negotiate a community benefits agreement for the redevelopment, and Fox Courts is the resulting affordable housing component.
Enterprise Green Communities (Incremental Costs, Measurable Savings)
275 10th Street
Affordable Housing; Environmental Health and Sustainability; Green Space; Public Transit
San Francisco CA 2009 A development of Episcopal Community Services (ECS) of San Francisco, 275 10th Street Supportive Housing features 134 single-room occupancy units for chronically homeless single adults in San Francisco. Included in the project was the demolition of three light industrial buildings on the site, clearing the way for a single, five-story building. Residents of 275 10th Street Supportive Housing are chronically homeless adults, many with multiple special needs or disabilities including mental health problems, substance abuse and HIV/AIDS. They have access to a full array of supportive services through ECS and other community organizations. Moreover, because of its location, residents have easy access to several transit lines, including buses, street car and regional light rail.
Enterprise Green Communities (Incremental Costs, Measurable Savings)
Arnett Watson Apartments
Affordable Housing; Environmental Health and Sustainability; Green Space
San Francisco CA 2009 Tenderloin Neighborhood Development Corporation (TNDC) and Community Housing Partnership (CHP) joined together to develop 83 supportive homes for formerly homeless individuals and families at 650 Eddy Street, renamed Arnett Watson Apartments. The nine-story building houses several different apartment types and an assortment of amenities aimed at assisting residents—many of whom suffer from mental illnesses, HIV/AIDS, physical disability or chronic substance abuse, in addition to homelessness—achieve permanent stability and independence. The unit types for the $32 million development break down to 36 studios, 33 one-bedrooms and 14 two-bedrooms.
Enterprise Green Communities (Incremental Costs, Measurable Savings)
The Essex
Affordable Housing; Environmental Health and Sustainability; Social Services
San Francisco CA 2009 A seven-story hotel in San Francisco’s Tenderloin neighborhood has been converted into 84 single-room occupancy apartments for homeless individuals with disabilities. Known as the Essex, the building was first constructed in 1912 and has undergone substantial renovations, a process that included several upgrades to meet current safety standards as well as features that satisfy Enterprise’s Green Communities criteria. Offering a supportive but independent living environment, the studio apartments each have bathrooms and kitchenettes. In addition to the apartments, the building features 3,000 square feet of street-level commercial space and 5,500 square feet of community facilities where the Community Housing Partners (CHP) provide supportive services to residents. The CHP also serves as the building’s property manager and owner.
Enterprise Green Communities (Incremental Costs, Measurable Savings)
Mixed Uses and Incomes
Mixed-Use San Francisco CA 2009 Yerba Buena Gardens is an 87-acre project, formerly an area of decaying warehouses and vacant lots, where redevelopment was begun in the 1960s. While the project extends to 12 city blocks, there are three “Central Blocks” comprising 22 acres of retail, entertainment, and cultural uses, where most of the public space is located. The overall district includes low- and middle-income housing, as well as market-rate condominiums; a large Marriott Hotel; six acres of gardens; retail, recreational, entertainment, parking and cultural facilities; a five-acre children’s center; and the George Moscone Convention Center. The outdoor space, most of which is concentrated on Central Block Two and comprises approximately 5.5 acres, is very versatile and can accommodate a variety of activities without seeming overly crowded.
Project for Public Spaces (Multi-Use Web Page)

understanding the values of, perceptions of and barriers to placemaking
land
pol
icy
inst
itut
e
Title Categories City/County State Year Description Source
Posadas Sentinel, Tucson Affordable Housing Tucson AZ 2001 Use of HUD’s HOPE VI Grants. Smart Growth
Network and National Neighborhood Coalition
Sara Conner CourtAffordable Housing; Environmental Health and Sustainability; Mixed-Use
Hayward CA 2009 Sara Conner Court is an affordable family housing development designed to create a supportive family environment immediately adjacent to a busy four-lane boulevard.
Enterprise Green Communities (Incremental Costs, Measurable Savings)
Leighton TownhomesAffordable Housing; Environmental Health and Sustainability
Los Angeles CA 2009 For more than 20 years, a vacant lot stood at the intersection of Los Angeles’ Leighton Avenue and Martin Luther King Jr. Boulevard. Today, eight stylish, energy-saving townhomes house 14 families at Leighton Townhomes, a development by Enterprise Home Ownership Partners.
Enterprise Green Communities (Incremental Costs, Measurable Savings)
Madrone Plaza
Affordable Housing; Environmental Health and Sustainability; Walkability
Morgan Hill CA 2009 Madrone Plaza, built by South County Community Builders, is a mixed-income housing development located on 6.5 acres of previously vacant land. Madrone Plaza homeowner’s association provides all residents, regardless of income, with access to a park, barbecue/picnic area, tot lot, clubhouse, swimming pool, bocce ball court, putting green and basketball court. The project features Craftsman architecture and incorporates many green building elements. It offers spectacular views of the mountains, with plenty of outdoor opportunities for walking, biking, golfing and other activities. The majority of the townhomes will front a pedestrian paseo lined with shade trees to encourage community interaction.
Enterprise Green Communities (Incremental Costs, Measurable Savings)
Fox Courts
Affordable Housing; Environmental Health and Sustainability; Social Services; Public Transit
Oakland CA 2009 Fox Courts is a transit-oriented, arts-enriched, family-focused, affordable housing development in the Uptown District of central Oakland. It is one part of a redevelopment that also includes 700 market-rate homes, the historic Fox Theater, the Oakland School for the Arts, restaurants and retail opportunities. Fox Courts’ 0.88-acre site used to be a parking lot. Community activists banded together to negotiate a community benefits agreement for the redevelopment, and Fox Courts is the resulting affordable housing component.
Enterprise Green Communities (Incremental Costs, Measurable Savings)
275 10th Street
Affordable Housing; Environmental Health and Sustainability; Green Space; Public Transit
San Francisco CA 2009 A development of Episcopal Community Services (ECS) of San Francisco, 275 10th Street Supportive Housing features 134 single-room occupancy units for chronically homeless single adults in San Francisco. Included in the project was the demolition of three light industrial buildings on the site, clearing the way for a single, five-story building. Residents of 275 10th Street Supportive Housing are chronically homeless adults, many with multiple special needs or disabilities including mental health problems, substance abuse and HIV/AIDS. They have access to a full array of supportive services through ECS and other community organizations. Moreover, because of its location, residents have easy access to several transit lines, including buses, street car and regional light rail.
Enterprise Green Communities (Incremental Costs, Measurable Savings)
Arnett Watson Apartments
Affordable Housing; Environmental Health and Sustainability; Green Space
San Francisco CA 2009 Tenderloin Neighborhood Development Corporation (TNDC) and Community Housing Partnership (CHP) joined together to develop 83 supportive homes for formerly homeless individuals and families at 650 Eddy Street, renamed Arnett Watson Apartments. The nine-story building houses several different apartment types and an assortment of amenities aimed at assisting residents—many of whom suffer from mental illnesses, HIV/AIDS, physical disability or chronic substance abuse, in addition to homelessness—achieve permanent stability and independence. The unit types for the $32 million development break down to 36 studios, 33 one-bedrooms and 14 two-bedrooms.
Enterprise Green Communities (Incremental Costs, Measurable Savings)
The Essex
Affordable Housing; Environmental Health and Sustainability; Social Services
San Francisco CA 2009 A seven-story hotel in San Francisco’s Tenderloin neighborhood has been converted into 84 single-room occupancy apartments for homeless individuals with disabilities. Known as the Essex, the building was first constructed in 1912 and has undergone substantial renovations, a process that included several upgrades to meet current safety standards as well as features that satisfy Enterprise’s Green Communities criteria. Offering a supportive but independent living environment, the studio apartments each have bathrooms and kitchenettes. In addition to the apartments, the building features 3,000 square feet of street-level commercial space and 5,500 square feet of community facilities where the Community Housing Partners (CHP) provide supportive services to residents. The CHP also serves as the building’s property manager and owner.
Enterprise Green Communities (Incremental Costs, Measurable Savings)
Mixed Uses and Incomes
Mixed-Use San Francisco CA 2009 Yerba Buena Gardens is an 87-acre project, formerly an area of decaying warehouses and vacant lots, where redevelopment was begun in the 1960s. While the project extends to 12 city blocks, there are three “Central Blocks” comprising 22 acres of retail, entertainment, and cultural uses, where most of the public space is located. The overall district includes low- and middle-income housing, as well as market-rate condominiums; a large Marriott Hotel; six acres of gardens; retail, recreational, entertainment, parking and cultural facilities; a five-acre children’s center; and the George Moscone Convention Center. The outdoor space, most of which is concentrated on Central Block Two and comprises approximately 5.5 acres, is very versatile and can accommodate a variety of activities without seeming overly crowded.
Project for Public Spaces (Multi-Use Web Page)
113

full
repo
rt
BUILDING PROSPEROUS PLACES IN MICHIGAN
Table 13: Placemaking Case Studies (cont.)
114
Title Categories City/County State Year Description Source
Central Park at Stapleton
Affordable Housing; Environmental Health and Sustainability; Mixed-Use
Denver CO 2009 Central Park at Stapleton is a new rental development in Denver, designed to provide affordable units for households making less than 50% Area Median Income (AMI), while also incorporating principles of sustainable design and green building standards. Although this is a new housing construction, the site is part of the old Denver Stapleton Airport redevelopment, a “sustainable designed” planned community that has received local and national awards development consists of two buildings housing 18 homes.
Enterprise Green Communities (Incremental Costs, Measurable Savings)
Community Development Block Grant in Denver
Affordable Housing Denver CO 2001 Use of HUD's Community Development Block Grants (CDBG). Smart Growth Network and National Neighborhood Coalition
Renaissance Riverfront Lofts
Affordable Housing; Environmental Health and Sustainability; Brownfield Development
Denver CO 2009 Renaissance Riverfront Lofts is a transit-oriented development integrating supportive housing for homeless persons and affordable housing for individuals who otherwise could not afford to live downtown. It is a five-story, new construction building on a 1.4 acre site. At 97,000 square feet, it contains 86 one-bedroom and 14 two-bedroom apartments. It is on a former brownfield site that was home to an asphalt plant. The original site was divided into two parcels. The north parcel was developed as a neighborhood retail center, and the south parcel is home to Riverfront Lofts.
Enterprise Green Communities (Incremental Costs, Measurable Savings)
Villa Italia MallMixed-Use; Walkability Denver CO 2008 In Denver, the aging Villa Italia Mall in suburban Lakewood was demolished and replaced with a
commercial and residential district with 1,300 apartments, 200 condominiums and single family homes, offices and a neo-traditional main street.
CEO's for Cities (Walk the Walk)
E-Star in ColoradoAffordable Housing; Energy Efficiency N/A CO 2001 Below-market-rate energy efficiency mortgages and energy improvement mortgages. Smart Growth
Network and National Neighborhood Coalition
Galen Terrace
Affordable Housing; Environmental Health and Sustainability; Mixed-Use
Washington DC 2009 Galen Terrace is a rehab of an existing Section 8 housing community made up of three three-story apartment buildings on two separate parcels in the Anacostia neighborhood of South East Washington, D.C. Located in the heart of a historic district, including the Frederick Douglass home, with access to public transportation and many amenities, the site has much to offer. The neighborhood is among the lowest-income and highest crime rate areas in the District of Columbia.
Enterprise Green Communities (Incremental Costs, Measurable Savings)
Workforce Housing Development in Palm Beach County, FL
Affordable Housing Palm Beach County
FL 2009 Transfer of development rights (TDR) a market-based land use tool that local governments can use to preserve agricultural land, historic landmarks, affordable housing, or environmentally sensitive sites by directing growth to locations that are more suitable for higher-density development.
Breakthroughs (8.5)
Florida's Fair Housing ActAffordable Housing N/A FL 2001 Developing policies that protect workforce households. Smart Growth
Network and National Neighborhood Coalition
Location-Efficient Mortgages in ChicagoAffordable Housing; Energy Efficiency Chicago IL 2001 Banks offering mortgages that incorporate energy-efficiency as a part of customers' savings. Smart Growth
Network and National Neighborhood Coalition
Neighborhood Early Warning System Affordable Housing Chicago IL 2001 Chicago’s Neighborhood Early Warning System (NEWS) is an online information system that helps
communities, developers and non-profit organizations become aware of land opportunities.Smart Growth Network and National Neighborhood Coalition
Roseland Ridge Apartments, Chicago Affordable Housing Chicago IL 2001 Low-income tax credit to builders. Smart Growth
Network and National Neighborhood Coalition
Massachusetts Affordable Housing Alliance
Affordable Housing Boston MA 2001 Engaged local banks in providing a Soft Second Mortgage Program. Smart Growth Network and National Neighborhood Coalition
Trolley SquareAffordable Housing; Environmental Health and Sustainability
Cambridge MA 2009 Trolley Square was built on a vacant lot, formerly the site of a bus storage facility. It includes 40 affordable rental and for-sale units, 2,800 square feet of office and community space, an underground garage and 14,000 square feet of open space. Building facades were designed to enhance the streetscape and enliven a previously blank stretch of Massachusetts Avenue.
Enterprise Green Communities (Incremental Costs, Measurable Savings)
Healthy Urban Design: Maryland's Smart Codes and the Pedestrian Environment
Walkability; Multiple N/A MA 1997 The Maryland General Assembly passed five pieces of legislation and budget initiatives (Priority Funding Areas, Brownfields, Live Near Your Work, Job Creation Tax Credit, and Rural Legacy Program) to encourage mix-land use; compact building design; creating housing opportunities and choices; foster distinctive, attractive communities with a strong sense of [place]; preserve open space, farmland, natural beauty, and critical environmental areas; strengthen and direct development to existing communities; make development decisions predictable, fair, and cost effective; encourage community and stakeholder collaboration in development decisions; and provide a variety of transportation options.
Smart Growth Network

understanding the values of, perceptions of and barriers to placemaking
land
pol
icy
inst
itut
e
Title Categories City/County State Year Description Source
Central Park at Stapleton
Affordable Housing; Environmental Health and Sustainability; Mixed-Use
Denver CO 2009 Central Park at Stapleton is a new rental development in Denver, designed to provide affordable units for households making less than 50% Area Median Income (AMI), while also incorporating principles of sustainable design and green building standards. Although this is a new housing construction, the site is part of the old Denver Stapleton Airport redevelopment, a “sustainable designed” planned community that has received local and national awards development consists of two buildings housing 18 homes.
Enterprise Green Communities (Incremental Costs, Measurable Savings)
Community Development Block Grant in Denver
Affordable Housing Denver CO 2001 Use of HUD's Community Development Block Grants (CDBG). Smart Growth Network and National Neighborhood Coalition
Renaissance Riverfront Lofts
Affordable Housing; Environmental Health and Sustainability; Brownfield Development
Denver CO 2009 Renaissance Riverfront Lofts is a transit-oriented development integrating supportive housing for homeless persons and affordable housing for individuals who otherwise could not afford to live downtown. It is a five-story, new construction building on a 1.4 acre site. At 97,000 square feet, it contains 86 one-bedroom and 14 two-bedroom apartments. It is on a former brownfield site that was home to an asphalt plant. The original site was divided into two parcels. The north parcel was developed as a neighborhood retail center, and the south parcel is home to Riverfront Lofts.
Enterprise Green Communities (Incremental Costs, Measurable Savings)
Villa Italia MallMixed-Use; Walkability Denver CO 2008 In Denver, the aging Villa Italia Mall in suburban Lakewood was demolished and replaced with a
commercial and residential district with 1,300 apartments, 200 condominiums and single family homes, offices and a neo-traditional main street.
CEO's for Cities (Walk the Walk)
E-Star in ColoradoAffordable Housing; Energy Efficiency N/A CO 2001 Below-market-rate energy efficiency mortgages and energy improvement mortgages. Smart Growth
Network and National Neighborhood Coalition
Galen Terrace
Affordable Housing; Environmental Health and Sustainability; Mixed-Use
Washington DC 2009 Galen Terrace is a rehab of an existing Section 8 housing community made up of three three-story apartment buildings on two separate parcels in the Anacostia neighborhood of South East Washington, D.C. Located in the heart of a historic district, including the Frederick Douglass home, with access to public transportation and many amenities, the site has much to offer. The neighborhood is among the lowest-income and highest crime rate areas in the District of Columbia.
Enterprise Green Communities (Incremental Costs, Measurable Savings)
Workforce Housing Development in Palm Beach County, FL
Affordable Housing Palm Beach County
FL 2009 Transfer of development rights (TDR) a market-based land use tool that local governments can use to preserve agricultural land, historic landmarks, affordable housing, or environmentally sensitive sites by directing growth to locations that are more suitable for higher-density development.
Breakthroughs (8.5)
Florida's Fair Housing ActAffordable Housing N/A FL 2001 Developing policies that protect workforce households. Smart Growth
Network and National Neighborhood Coalition
Location-Efficient Mortgages in ChicagoAffordable Housing; Energy Efficiency Chicago IL 2001 Banks offering mortgages that incorporate energy-efficiency as a part of customers' savings. Smart Growth
Network and National Neighborhood Coalition
Neighborhood Early Warning System Affordable Housing Chicago IL 2001 Chicago’s Neighborhood Early Warning System (NEWS) is an online information system that helps
communities, developers and non-profit organizations become aware of land opportunities.Smart Growth Network and National Neighborhood Coalition
Roseland Ridge Apartments, Chicago Affordable Housing Chicago IL 2001 Low-income tax credit to builders. Smart Growth
Network and National Neighborhood Coalition
Massachusetts Affordable Housing Alliance
Affordable Housing Boston MA 2001 Engaged local banks in providing a Soft Second Mortgage Program. Smart Growth Network and National Neighborhood Coalition
Trolley SquareAffordable Housing; Environmental Health and Sustainability
Cambridge MA 2009 Trolley Square was built on a vacant lot, formerly the site of a bus storage facility. It includes 40 affordable rental and for-sale units, 2,800 square feet of office and community space, an underground garage and 14,000 square feet of open space. Building facades were designed to enhance the streetscape and enliven a previously blank stretch of Massachusetts Avenue.
Enterprise Green Communities (Incremental Costs, Measurable Savings)
Healthy Urban Design: Maryland's Smart Codes and the Pedestrian Environment
Walkability; Multiple N/A MA 1997 The Maryland General Assembly passed five pieces of legislation and budget initiatives (Priority Funding Areas, Brownfields, Live Near Your Work, Job Creation Tax Credit, and Rural Legacy Program) to encourage mix-land use; compact building design; creating housing opportunities and choices; foster distinctive, attractive communities with a strong sense of [place]; preserve open space, farmland, natural beauty, and critical environmental areas; strengthen and direct development to existing communities; make development decisions predictable, fair, and cost effective; encourage community and stakeholder collaboration in development decisions; and provide a variety of transportation options.
Smart Growth Network
115

full
repo
rt
BUILDING PROSPEROUS PLACES IN MICHIGAN
Table 13: Placemaking Case Studies (cont.)
116
Title Categories City/County State Year Description Source
Adrian, Michigan, Saves $1M By Turning Old Plant Into New Complex
Building Renovation Adrian MI 2010 Purchasing and renovating an existing facility for its parks and forestry building, rather than building a new facility, has proved a lucrative decision for Adrian, MI.
Smart Growth Network (Smart Growth Online)
Michigan Towns Score Smart Growth Victories at Polls
Green Space; Land Preservation Ann Arbor MI 2003 Ann Arbor and Ann Arbor Township scored similar Smart Growth wins, one by an over 66% approval for a 30-year extension of the current property tax to create an 8,000-acre greenbelt, the other by a 75% vote for a higher property tax, also to preserve rural land.
Smart Growth Network (Smart Growth Online)
Development Brings "Neighborhood Feel" to Suburban Detroit
Affordable Housing; Walkability; Public Space; Green Space
Canton Township MI 2002 Cherry Hill Village is a the 338-acre subdivision that will get more than 1,200 homes and condos over 10 years (since 2002), in a $175,000–$550,000 price range, with an 85-acre sister village across the road adding 600 apartments. Along with small yards, front porches and sidewalk benches, conducive to close-knit community, the villages will have more than 75 acres of parks and 26 miles of bike trails.
Smart Growth Network (Smart Growth Online)
New Urbanism in Chesterfield TownshipMixed-Use Chesterfield
TownshipMI 2001 Another Metro Detroit community leaning toward the neighborly feel and small-town designs of New
Urbanism is Chesterfield Township, where officials are considering a $27 million, 29-acre mixed-use project, boasting a landscaped park with a large pond, benches and a gazebo for outdoor concerts, eight single-family townhouses and 20 brownstones.
Smart Growth Network (Smart Growth Online)
Agnes Street Apartments
Affordable Housing; Environmental Health and Sustainability; Mixed-Use
Detroit MI 2009 Two blocks north of the Detroit River, which forms part of the international border between the U.S. and Canada, is the Agnes Street Apartments. The Low-Income Housing Tax Credit urban development consists of two three-story apartment buildings on a former grayfield—a property with infrastructure in place, but is currently outdated and underutilized, like an aging shopping center. The Agnes Street Apartments site is slightly larger than an acre, and was assembled from multiple residential tax lots, some vacant and two with condemned residential structures that were demolished. Agnes Street Housing’s effort to create a wholesome, affordable living environment for low-income families near downtown Detroit has been successful.
Enterprise Green Communities (Incremental Costs, Measurable Savings)
Almost Six Decades after Historic Streetcar, Federal Funds Will Help Detroit Build Light Rail
Public Transit Detroit MI 2010 With $125 million raised by business and civic leaders in and $25 million in the U.S. Department of Transportation’s Transportation Investment Generating Economic Recovery (TIGER) grant, Detroit's 9.3-mile Woodward Avenue light-rail project will now enter the Environmental Impact Statement stage.
Smart Growth Network (Smart Growth Online)
Detroit Region Moves to Improve and Rebuild City from within
Multiple Housing; Mixed-Use; Public Space
Detroit MI 2004 Detroit is implementing a $1.4 billion public school construction program; its 3,395 housing permits last year leave other big cities behind; the River Rouge cleanup is the largest watershed improvement project nationwide; the $60 million Max M. Fisher Music Center opened last year; General Motors spent $500 million to renovate and set up headquarters in the Renaissance Center; a new Compuware headquarters brought 4,000 workers downtown; public and private groups are funding a $200 million park along the Detroit River; young local architects are envisioning the nation's largest neighborhood reconstruction, which would involve 1,200 acres of housing and business on Detroit's far east side; and the old Tiger Stadium's closure freed several parking lots for redevelopment and prompted wider building renovation and adaptation for mixed use.
Smart Growth Network (Smart Growth Online)
Detroit Revitalization Program Would Lead to 1,200 Housing Units
Housing Detroit MI 2002 Local Initiatives Support Corporation (LISC), has launched a three-year, $26-million Detroit neighborhood revitalization program, called From the Ground Up, to build 1,200 housing units, spur economic development and help the City find the most profitable way of disposing of its land.
Smart Growth Network (Smart Growth Online)
Detroit River FrontMixed-Use; Walkability Detroit MI 1999 City officials and developers are advancing $5 billion plans to transform the City's 25-acre eastern
riverfront, long ruled by industries, into a pedestrian-friendly urban village, with housing, shops, offices, restaurants, parks and casinos. The City is using its new eminent domain law to relocate three cement companies from the riverfront, and to buy the sites for casinos, parks and other projects.
Smart Growth Network (Smart Growth Online)
Detroit's Eastside Redevelopment to Focus on Rehabilitation and Revitalization, Not Displacement
Mixed-Use; Mixed-Income; Housing Detroit MI 2004 With Detroit's ''biggest building boom in 50 years'' spurred by 782 permits for new construction and more than 6,000 permits for home or business renovation last year, and with 4,400 housing starts underway right now, Democratic Mayor Kwame M. Kilpatrick announced in his State of the City speech another major historic transformation project—''top to bottom'' redevelopment of the City's 1,200-acre eastside section as a mixed-use, mixed-income, infill-type neighborhood, which will offer between 3,000 and 4,000 new or renovated homes.
Smart Growth Network (Smart Growth Online)
Revised Brownfield Law Expands Single Business Tax Credit to Help Michigan Communities Reuse Small Vacant Sites
Land Re-Use Detroit MI 2006 Focused not so long ago on reclamation of large postindustrial tracts in Detroit and other metro areas, Michigan revised its brownfield law in early April to facilitate reuse of small vacant sites anywhere, expanding the Single Business Tax credit—which may equal 10% of a developer's investment, up to $1 million—to projects worth $2 million or less and easing transfer of such credits to banks or other entities.
Smart Growth Network (Smart Growth Online)
Technical Assistance Program Eases Redevelopment Barriers for Detroit's Inner Suburbs and Older Neighborhoods
Technology Information Sharing Detroit MI 2005 Metro Detroit's inner suburbs and older neighborhoods can now qualify for technical assistance from the Ferndale-based Michigan Suburbs Alliance, a group of 24 cities in the state's Southeast region, under its just-launched Redevelopment Ready Communities (RRC) Certification Program, designed to remove redevelopment barriers and facilitate innovative government-developer cooperation.
Smart Growth Network (Smart Growth Online)
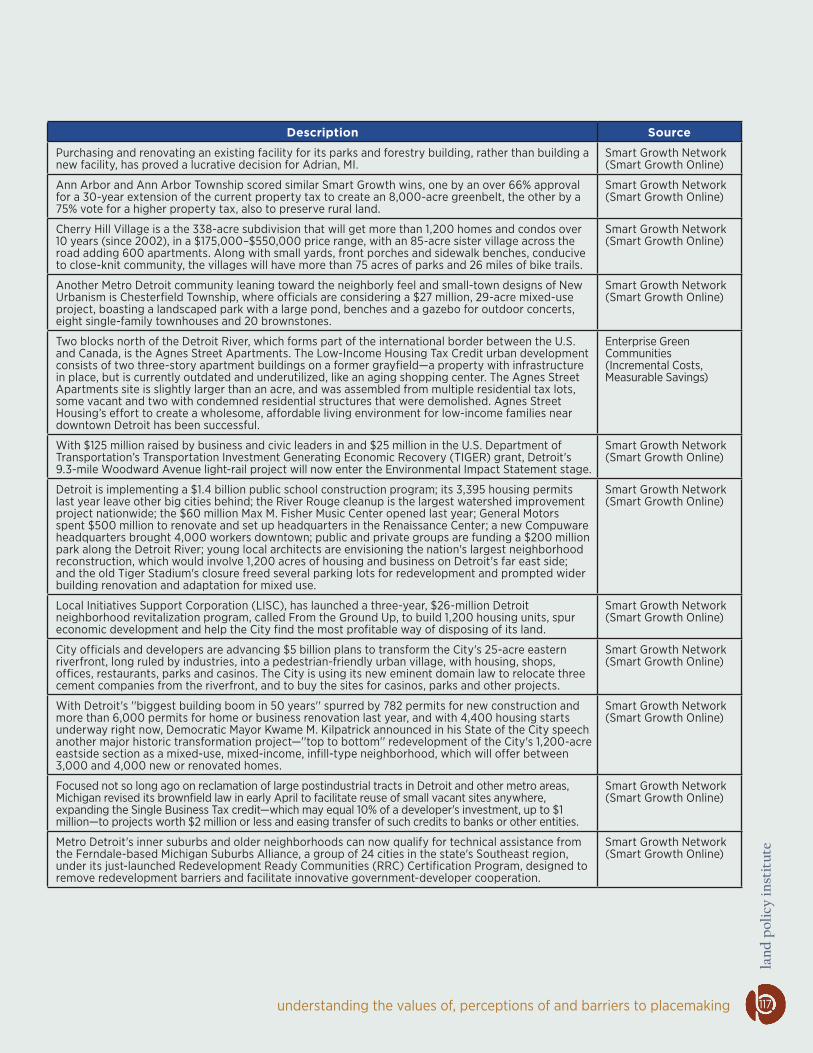
understanding the values of, perceptions of and barriers to placemaking
land
pol
icy
inst
itut
e
Title Categories City/County State Year Description Source
Adrian, Michigan, Saves $1M By Turning Old Plant Into New Complex
Building Renovation Adrian MI 2010 Purchasing and renovating an existing facility for its parks and forestry building, rather than building a new facility, has proved a lucrative decision for Adrian, MI.
Smart Growth Network (Smart Growth Online)
Michigan Towns Score Smart Growth Victories at Polls
Green Space; Land Preservation Ann Arbor MI 2003 Ann Arbor and Ann Arbor Township scored similar Smart Growth wins, one by an over 66% approval for a 30-year extension of the current property tax to create an 8,000-acre greenbelt, the other by a 75% vote for a higher property tax, also to preserve rural land.
Smart Growth Network (Smart Growth Online)
Development Brings "Neighborhood Feel" to Suburban Detroit
Affordable Housing; Walkability; Public Space; Green Space
Canton Township MI 2002 Cherry Hill Village is a the 338-acre subdivision that will get more than 1,200 homes and condos over 10 years (since 2002), in a $175,000–$550,000 price range, with an 85-acre sister village across the road adding 600 apartments. Along with small yards, front porches and sidewalk benches, conducive to close-knit community, the villages will have more than 75 acres of parks and 26 miles of bike trails.
Smart Growth Network (Smart Growth Online)
New Urbanism in Chesterfield TownshipMixed-Use Chesterfield
TownshipMI 2001 Another Metro Detroit community leaning toward the neighborly feel and small-town designs of New
Urbanism is Chesterfield Township, where officials are considering a $27 million, 29-acre mixed-use project, boasting a landscaped park with a large pond, benches and a gazebo for outdoor concerts, eight single-family townhouses and 20 brownstones.
Smart Growth Network (Smart Growth Online)
Agnes Street Apartments
Affordable Housing; Environmental Health and Sustainability; Mixed-Use
Detroit MI 2009 Two blocks north of the Detroit River, which forms part of the international border between the U.S. and Canada, is the Agnes Street Apartments. The Low-Income Housing Tax Credit urban development consists of two three-story apartment buildings on a former grayfield—a property with infrastructure in place, but is currently outdated and underutilized, like an aging shopping center. The Agnes Street Apartments site is slightly larger than an acre, and was assembled from multiple residential tax lots, some vacant and two with condemned residential structures that were demolished. Agnes Street Housing’s effort to create a wholesome, affordable living environment for low-income families near downtown Detroit has been successful.
Enterprise Green Communities (Incremental Costs, Measurable Savings)
Almost Six Decades after Historic Streetcar, Federal Funds Will Help Detroit Build Light Rail
Public Transit Detroit MI 2010 With $125 million raised by business and civic leaders in and $25 million in the U.S. Department of Transportation’s Transportation Investment Generating Economic Recovery (TIGER) grant, Detroit's 9.3-mile Woodward Avenue light-rail project will now enter the Environmental Impact Statement stage.
Smart Growth Network (Smart Growth Online)
Detroit Region Moves to Improve and Rebuild City from within
Multiple Housing; Mixed-Use; Public Space
Detroit MI 2004 Detroit is implementing a $1.4 billion public school construction program; its 3,395 housing permits last year leave other big cities behind; the River Rouge cleanup is the largest watershed improvement project nationwide; the $60 million Max M. Fisher Music Center opened last year; General Motors spent $500 million to renovate and set up headquarters in the Renaissance Center; a new Compuware headquarters brought 4,000 workers downtown; public and private groups are funding a $200 million park along the Detroit River; young local architects are envisioning the nation's largest neighborhood reconstruction, which would involve 1,200 acres of housing and business on Detroit's far east side; and the old Tiger Stadium's closure freed several parking lots for redevelopment and prompted wider building renovation and adaptation for mixed use.
Smart Growth Network (Smart Growth Online)
Detroit Revitalization Program Would Lead to 1,200 Housing Units
Housing Detroit MI 2002 Local Initiatives Support Corporation (LISC), has launched a three-year, $26-million Detroit neighborhood revitalization program, called From the Ground Up, to build 1,200 housing units, spur economic development and help the City find the most profitable way of disposing of its land.
Smart Growth Network (Smart Growth Online)
Detroit River FrontMixed-Use; Walkability Detroit MI 1999 City officials and developers are advancing $5 billion plans to transform the City's 25-acre eastern
riverfront, long ruled by industries, into a pedestrian-friendly urban village, with housing, shops, offices, restaurants, parks and casinos. The City is using its new eminent domain law to relocate three cement companies from the riverfront, and to buy the sites for casinos, parks and other projects.
Smart Growth Network (Smart Growth Online)
Detroit's Eastside Redevelopment to Focus on Rehabilitation and Revitalization, Not Displacement
Mixed-Use; Mixed-Income; Housing Detroit MI 2004 With Detroit's ''biggest building boom in 50 years'' spurred by 782 permits for new construction and more than 6,000 permits for home or business renovation last year, and with 4,400 housing starts underway right now, Democratic Mayor Kwame M. Kilpatrick announced in his State of the City speech another major historic transformation project—''top to bottom'' redevelopment of the City's 1,200-acre eastside section as a mixed-use, mixed-income, infill-type neighborhood, which will offer between 3,000 and 4,000 new or renovated homes.
Smart Growth Network (Smart Growth Online)
Revised Brownfield Law Expands Single Business Tax Credit to Help Michigan Communities Reuse Small Vacant Sites
Land Re-Use Detroit MI 2006 Focused not so long ago on reclamation of large postindustrial tracts in Detroit and other metro areas, Michigan revised its brownfield law in early April to facilitate reuse of small vacant sites anywhere, expanding the Single Business Tax credit—which may equal 10% of a developer's investment, up to $1 million—to projects worth $2 million or less and easing transfer of such credits to banks or other entities.
Smart Growth Network (Smart Growth Online)
Technical Assistance Program Eases Redevelopment Barriers for Detroit's Inner Suburbs and Older Neighborhoods
Technology Information Sharing Detroit MI 2005 Metro Detroit's inner suburbs and older neighborhoods can now qualify for technical assistance from the Ferndale-based Michigan Suburbs Alliance, a group of 24 cities in the state's Southeast region, under its just-launched Redevelopment Ready Communities (RRC) Certification Program, designed to remove redevelopment barriers and facilitate innovative government-developer cooperation.
Smart Growth Network (Smart Growth Online)
117

full
repo
rt
BUILDING PROSPEROUS PLACES IN MICHIGAN
Table 13: Placemaking Case Studies (cont.)
118
Title Categories City/County State Year Description Source
Urban Farmers Grow Food in DetroitGreen Space; Community Engagement Detroit MI 2009 The G.R.O.W. Collaborative looks for Detroit residents already involved in urban gardening, and
helps them buy vacant land. Up to 600 farmers have taken over empty lots. About a third of those are in the collaborative.
Smart Growth Network (Smart Growth Online)
Greenway Initiative in Metro DetroitPublic Space; Green Space Metro Detroit MI 2001 The Community Foundation for Southeast Michigan awarded the first $1.7 million in GreenWays
Initiative grants to the University of Michigan-Dearborn, Washtenaw County, eight municipalities and three nonprofit groups, to help them buy land for hiking and biking trials.
Smart Growth Network (Smart Growth Online)
Flint Farmer's Market
Public Space Flint MI 2007 Flint Farmers’ Market is one of the most beloved destinations in the City, a shining example of a place that has been turned around in recent years. A little over four years ago, the Uptown Reinvestment Corporation assumed management of the failing market, and was able to transform it through improved management, programming, promotion and infrastructure. Today, the market functions as a place that transcends cultural and social boundaries, where people from Flint and beyond come for food, entertainment, activities and social interaction. In many ways, the market is already a great place, but it still has room for improvement.
Project for Public Spaces (New Direction for Public Spaces in Flint)
Riverbank Park in Flint, MIPublic Space Flint MI 2007 When Riverbank Park opened in the late 1970s in Flint, it represented the culmination of a community
dream to transform the center of the City and create what was termed Flint’s “living room.” The project was especially noteworthy, because it transformed a flood control measure into a community place, which highlights the river as a unique asset for downtown Flint.
Project for Public Spaces (New Direction for Public Spaces in Flint)
Remediating Blighted Properties: Genesee County Land Bank Shows How It's Done
Affordable Housing Genesee County MI 2009 Genesee County Land Bank takes over properties seized by the county for unpaid property taxes, sells those in better shape, and invests the money in blighted areas of the County.
Smart Growth Network (Smart Growth Online)
Grand Rapids Called "Rising Smart Growth Star"
Multiple Grand Rapids MI 2002 The Grand Rapids' 2002 Master Plan, the journalist writes, ''celebrates civic heritage,'' reduces car dependency and restores the socio-cultural urban identity rooted in ''a unique sense of place.'' The plan's 10 principles promise growth for present communities; mixed land use; compact development; a range of housing choices and opportunities; a variety of transportation choices; walkable and accessible neighborhoods; preservation of farmland, open space, natural beauty and crucial environmental areas; broad stakeholder and community cooperation; and predictable, fair and cost-effective development decisions.
Smart Growth Network (Smart Growth Online)
Hudsonville Selected as Partner in Ottawa County's Urban S.G. Demonstration Project
Anti-Sprawl Hudsonville MI 2004 Eager for downtown revitalization and hopeful that the majority of residents at a special town hearing will approve the partnership with the county is the first step in the joint $125,000 smart-growth demonstration project. Next will come a review of zoning rules, followed by ordinance amendments to encourage ''smart'' development within the town boundary.
Smart Growth Network (Smart Growth Online)
Farmland Preservation Helps Agriculture, Frees Funds for Urban Reinvestments
Land Preservation Kent County MI 2010 The Kent County Commission approved the preservation of 25,000 of the county’s 170,000 rural acres in years ahead.
Smart Growth Network (Smart Growth Online)
Residents of Lansing Neighborhood Ecstatic over Plans to Replace 4.3-Acre Eyesore with Affordable Homes
Affordable Housing Lansing MI 2006 Residents of one South Lansing neighborhood were ecstatic about a new plan to replace a local 4.3-acre eyesore with a $3 million project of 18 single-family housing units in the $120,000–$200,000 price range, while East Lansing leaders voiced similar appreciation of a newly received $1.5 million Community Development Block Grant loan guarantee to provide a number of affordable homes for low-to-moderate-income families.
Smart Growth Network (Smart Growth Online)
Bengel Wildlife CenterGreen Space Lansing MI 2001 A long-time county dump six miles northeast of Lansing, bought by the Michigan Wildlife Habitat
Foundation, was cleared, landscaped and transformed into the 296-acre Bengel Wildlife Center to promote smart growth.
Smart Growth Network (Smart Growth Online)
Lansing-Area Counties Draft Regional Growth Plan to Coordinate Development
Multiple Lansing-Area MI 2002 The Tri-County region already agreed to establish urban service boundaries; coordinate decisions to make the region ''internally cooperative and externally competitive;'' strengthen their urban cores to ensure its long-term viability; develop targeted growth areas before those without services; address housing needs of all residents equally; and enhance the present road, transit and ''non-motorized'' transportation network before extending roads into rural areas.
Smart Growth Network (Smart Growth Online)
Creating Urban Neighborhoods in Michigan's Suburbs
Mixed-Use; Housing; Walkability Macomb Township
MI 2002 Macomb Township approved an ordinance, which requires the expected 2,500 homes in the one-square-mile area to be built close together, all within a five-minute walk of the almost completed $7-million town hall and all according to strict design guidelines, with large front porches and detached garages in the back.
Smart Growth Network (Smart Growth Online)
Monroe County Adopts Farmland Preservation Ordinance
Land Preservation Monroe County MI 2001 Farmers' participation in the land preservation program relieves financial pressure, with the county paying them the difference between land for agriculture and land for development and holding their development rights in trust.
Smart Growth Network (Smart Growth Online)

understanding the values of, perceptions of and barriers to placemaking
land
pol
icy
inst
itut
e
Title Categories City/County State Year Description Source
Urban Farmers Grow Food in DetroitGreen Space; Community Engagement Detroit MI 2009 The G.R.O.W. Collaborative looks for Detroit residents already involved in urban gardening, and
helps them buy vacant land. Up to 600 farmers have taken over empty lots. About a third of those are in the collaborative.
Smart Growth Network (Smart Growth Online)
Greenway Initiative in Metro DetroitPublic Space; Green Space Metro Detroit MI 2001 The Community Foundation for Southeast Michigan awarded the first $1.7 million in GreenWays
Initiative grants to the University of Michigan-Dearborn, Washtenaw County, eight municipalities and three nonprofit groups, to help them buy land for hiking and biking trials.
Smart Growth Network (Smart Growth Online)
Flint Farmer's Market
Public Space Flint MI 2007 Flint Farmers’ Market is one of the most beloved destinations in the City, a shining example of a place that has been turned around in recent years. A little over four years ago, the Uptown Reinvestment Corporation assumed management of the failing market, and was able to transform it through improved management, programming, promotion and infrastructure. Today, the market functions as a place that transcends cultural and social boundaries, where people from Flint and beyond come for food, entertainment, activities and social interaction. In many ways, the market is already a great place, but it still has room for improvement.
Project for Public Spaces (New Direction for Public Spaces in Flint)
Riverbank Park in Flint, MIPublic Space Flint MI 2007 When Riverbank Park opened in the late 1970s in Flint, it represented the culmination of a community
dream to transform the center of the City and create what was termed Flint’s “living room.” The project was especially noteworthy, because it transformed a flood control measure into a community place, which highlights the river as a unique asset for downtown Flint.
Project for Public Spaces (New Direction for Public Spaces in Flint)
Remediating Blighted Properties: Genesee County Land Bank Shows How It's Done
Affordable Housing Genesee County MI 2009 Genesee County Land Bank takes over properties seized by the county for unpaid property taxes, sells those in better shape, and invests the money in blighted areas of the County.
Smart Growth Network (Smart Growth Online)
Grand Rapids Called "Rising Smart Growth Star"
Multiple Grand Rapids MI 2002 The Grand Rapids' 2002 Master Plan, the journalist writes, ''celebrates civic heritage,'' reduces car dependency and restores the socio-cultural urban identity rooted in ''a unique sense of place.'' The plan's 10 principles promise growth for present communities; mixed land use; compact development; a range of housing choices and opportunities; a variety of transportation choices; walkable and accessible neighborhoods; preservation of farmland, open space, natural beauty and crucial environmental areas; broad stakeholder and community cooperation; and predictable, fair and cost-effective development decisions.
Smart Growth Network (Smart Growth Online)
Hudsonville Selected as Partner in Ottawa County's Urban S.G. Demonstration Project
Anti-Sprawl Hudsonville MI 2004 Eager for downtown revitalization and hopeful that the majority of residents at a special town hearing will approve the partnership with the county is the first step in the joint $125,000 smart-growth demonstration project. Next will come a review of zoning rules, followed by ordinance amendments to encourage ''smart'' development within the town boundary.
Smart Growth Network (Smart Growth Online)
Farmland Preservation Helps Agriculture, Frees Funds for Urban Reinvestments
Land Preservation Kent County MI 2010 The Kent County Commission approved the preservation of 25,000 of the county’s 170,000 rural acres in years ahead.
Smart Growth Network (Smart Growth Online)
Residents of Lansing Neighborhood Ecstatic over Plans to Replace 4.3-Acre Eyesore with Affordable Homes
Affordable Housing Lansing MI 2006 Residents of one South Lansing neighborhood were ecstatic about a new plan to replace a local 4.3-acre eyesore with a $3 million project of 18 single-family housing units in the $120,000–$200,000 price range, while East Lansing leaders voiced similar appreciation of a newly received $1.5 million Community Development Block Grant loan guarantee to provide a number of affordable homes for low-to-moderate-income families.
Smart Growth Network (Smart Growth Online)
Bengel Wildlife CenterGreen Space Lansing MI 2001 A long-time county dump six miles northeast of Lansing, bought by the Michigan Wildlife Habitat
Foundation, was cleared, landscaped and transformed into the 296-acre Bengel Wildlife Center to promote smart growth.
Smart Growth Network (Smart Growth Online)
Lansing-Area Counties Draft Regional Growth Plan to Coordinate Development
Multiple Lansing-Area MI 2002 The Tri-County region already agreed to establish urban service boundaries; coordinate decisions to make the region ''internally cooperative and externally competitive;'' strengthen their urban cores to ensure its long-term viability; develop targeted growth areas before those without services; address housing needs of all residents equally; and enhance the present road, transit and ''non-motorized'' transportation network before extending roads into rural areas.
Smart Growth Network (Smart Growth Online)
Creating Urban Neighborhoods in Michigan's Suburbs
Mixed-Use; Housing; Walkability Macomb Township
MI 2002 Macomb Township approved an ordinance, which requires the expected 2,500 homes in the one-square-mile area to be built close together, all within a five-minute walk of the almost completed $7-million town hall and all according to strict design guidelines, with large front porches and detached garages in the back.
Smart Growth Network (Smart Growth Online)
Monroe County Adopts Farmland Preservation Ordinance
Land Preservation Monroe County MI 2001 Farmers' participation in the land preservation program relieves financial pressure, with the county paying them the difference between land for agriculture and land for development and holding their development rights in trust.
Smart Growth Network (Smart Growth Online)
119

full
repo
rt
BUILDING PROSPEROUS PLACES IN MICHIGAN
Table 13: Placemaking Case Studies (cont.)
120
Title Categories City/County State Year Description Source
Green Space in Affluent Oakland TownshipPublic Space; Green Space Oakland
TownshipMI 2001 Affluent Oakland Township, with a population of 13,000, a median home price of $430,000 and six
golf courses, has already preserved about 2,600 acres of green space, making residents feel they live in a "paradise," but in a move to inhibit sprawl even further, officials are asking voters to approve a 0.75-mil bond levy to buy another 500 acres for parks.
Smart Growth Network (Smart Growth Online)
EPA Grant for the Oakland County Brownfield Initiative
Downtown Revitalization Pontiac MI 2001 With a $250,000 U.S. EPA grant for the Oakland County Brownfield Initiative, County Executive allocated $80,000 to help Pontiac launch environmental assessments on three of its 15 brownfields and create a downtown revitalization plan.
Smart Growth Network (Smart Growth Online)
Local Group Opposes Rochester Hills Mixed-Use Complex
Mixed-Use; Walkability Rochester Hills MI 2004 Rochester Hills City Council gave initial approval to a planned $70 million mixed-use complex of 300 housing units and some commercial space on 28 acres near a key intersection; "(t)hese kinds of developments help create a walkable atmosphere and provide the residents with small-scale retail.”
Smart Growth Network (Smart Growth Online)
Kingsbury Place
Affordable Housing; Environmental Health and Sustainability; Social Services
Walker MI 2009 Kingsbury Place is Genesis’ fourth housing development for low-income individuals and families with special needs. The development has 44 units in 10 buildings: 29 one-bedrooms, 13 two-bedrooms and two three-bedrooms. The housing will be targeted to extremely low-income (i.e., earning less than 40% AMI) and chronically homeless individuals in the Kent County area. Enterprise’s $93,000 grant helped the sponsor to provide the first Michigan Green Communities project by a nonprofit housing developer. Genesis plans to receive LEED certification for Kingsbury Place as a pilot project for the LEED-H certification process.
Enterprise Green Communities (Incremental Costs, Measurable Savings)
Five-Point Bill to Curb Sprawl
Multiple N/A MI 2001 Push for a legislation that would require municipalities to pass ordinances on land preservation in new subdivisions; encourage inter-municipal coordination of planning and zoning; cut the procedural red tape snarling redevelopment of vacant urban parcels, estimated at 45,000 in Detroit alone; provide communities with low-interest loans and other assistance for water and sewer system improvements; and promote cooperation with the federal government and with Canada to protect the Great Lakes from foreign aquatic species immigrants and from water diversion.
Smart Growth Network (Smart Growth Online)
New San Marco
Affordable Housing; Environmental Health and Sustainability; Social Services
Duluth MN 2009 The New San Marco Apartments is a new construction project with 70 units of affordable permanent housing serving the homeless in downtown Duluth. The project is located on an urban infill redevelopment site donated by the City of Duluth. The building has two wings. One wing has 40 units of supportive efficiency apartments for people with a history of homelessness. Thirty-six of the units will be set aside for individuals experiencing chronic homelessness for a year or more, or for those who have had at least four episodes of homelessness in the past three years. The New San Marco opened in May 2007, and the building quickly filled with residents. Since then, occupancy has been near 100%.
Enterprise Green Communities (Incremental Costs, Measurable Savings)
Park Avenue Apartments
Affordable Housing; Environmental Health and Sustainability; Social Services
Minneapolis MN 2009 Park Avenue Apartments will be built adjacent to Lutheran Social Service’s new service center, Center for Changing Lives, which opened in the winter of 2008. The new center will house mental health counseling services, after school services for kids, wellness services, housing and financial services. All 48 units are affordable, with 38 units targeted for households earning up to 45% AMI and the remaining 10 units targeted for households earning up to 15% AMI. Thirteen apartments are specifically designated for households experiencing long-term homelessness or near homelessness. These households will pay no more than 30% of their income towards rent.
Enterprise Green Communities (Incremental Costs, Measurable Savings)
Ripley GardensAffordable Housing; Environmental Health and Sustainability; Green Space
Minneapolis MN 2009 Ripley Gardens is the redevelopment of the former Ripley Maternity Hospital in the Harrison Neighborhood of Minneapolis. The development includes the restoration of three historic buildings and the addition of three new buildings to provide 52 rental and eight home ownership units.
Enterprise Green Communities (Incremental Costs, Measurable Savings)
Viking Terrace ApartmentsAffordable Housing; Environmental Health and Sustainability; Green Space
Worthington MN 2009 As an affordable housing preservation project, Viking Terrace will provide an excellent opportunity to evaluate those strategies that prove to be most cost-effective and will identify tools for long-term sustainability and green preservation throughout Minnesota.
Enterprise Green Communities (Incremental Costs, Measurable Savings)
Accessory Dwelling Units in Cary, NCAffordable Housing; Mixed-Use Cary NC 2001 Accessory dwelling units. Smart Growth
Network and National Neighborhood Coalition
Ewing Independent Living
Affordable Housing; Environmental Health and Sustainability; Mixed-Use; Disability Friendly
Ewing NJ 2009 Ewing Independent Living is a newly constructed, 72-unit affordable community in Ewing, NJ, dedicated to seniors 55 and older and adults with disabilities. With 56 one-bedroom and 16 two-bedroom apartments in an elevator building, Ewing Independent Living has 58,000 square feet of residential space. All apartments consist of, at a minimum, a kitchen, living room, bathroom and bedroom. The building surrounds two large courtyards, which contain a patio, bocce ball court, raised gardens, shuffleboard and a sandbox for children.
Enterprise Green Communities (Incremental Costs, Measurable Savings)
understanding the values of, perceptions of and barriers to placemaking
land
pol
icy
inst
itut
e
Title Categories City/County State Year Description Source
Green Space in Affluent Oakland TownshipPublic Space; Green Space Oakland
TownshipMI 2001 Affluent Oakland Township, with a population of 13,000, a median home price of $430,000 and six
golf courses, has already preserved about 2,600 acres of green space, making residents feel they live in a "paradise," but in a move to inhibit sprawl even further, officials are asking voters to approve a 0.75-mil bond levy to buy another 500 acres for parks.
Smart Growth Network (Smart Growth Online)
EPA Grant for the Oakland County Brownfield Initiative
Downtown Revitalization Pontiac MI 2001 With a $250,000 U.S. EPA grant for the Oakland County Brownfield Initiative, County Executive allocated $80,000 to help Pontiac launch environmental assessments on three of its 15 brownfields and create a downtown revitalization plan.
Smart Growth Network (Smart Growth Online)
Local Group Opposes Rochester Hills Mixed-Use Complex
Mixed-Use; Walkability Rochester Hills MI 2004 Rochester Hills City Council gave initial approval to a planned $70 million mixed-use complex of 300 housing units and some commercial space on 28 acres near a key intersection; "(t)hese kinds of developments help create a walkable atmosphere and provide the residents with small-scale retail.”
Smart Growth Network (Smart Growth Online)
Kingsbury Place
Affordable Housing; Environmental Health and Sustainability; Social Services
Walker MI 2009 Kingsbury Place is Genesis’ fourth housing development for low-income individuals and families with special needs. The development has 44 units in 10 buildings: 29 one-bedrooms, 13 two-bedrooms and two three-bedrooms. The housing will be targeted to extremely low-income (i.e., earning less than 40% AMI) and chronically homeless individuals in the Kent County area. Enterprise’s $93,000 grant helped the sponsor to provide the first Michigan Green Communities project by a nonprofit housing developer. Genesis plans to receive LEED certification for Kingsbury Place as a pilot project for the LEED-H certification process.
Enterprise Green Communities (Incremental Costs, Measurable Savings)
Five-Point Bill to Curb Sprawl
Multiple N/A MI 2001 Push for a legislation that would require municipalities to pass ordinances on land preservation in new subdivisions; encourage inter-municipal coordination of planning and zoning; cut the procedural red tape snarling redevelopment of vacant urban parcels, estimated at 45,000 in Detroit alone; provide communities with low-interest loans and other assistance for water and sewer system improvements; and promote cooperation with the federal government and with Canada to protect the Great Lakes from foreign aquatic species immigrants and from water diversion.
Smart Growth Network (Smart Growth Online)
New San Marco
Affordable Housing; Environmental Health and Sustainability; Social Services
Duluth MN 2009 The New San Marco Apartments is a new construction project with 70 units of affordable permanent housing serving the homeless in downtown Duluth. The project is located on an urban infill redevelopment site donated by the City of Duluth. The building has two wings. One wing has 40 units of supportive efficiency apartments for people with a history of homelessness. Thirty-six of the units will be set aside for individuals experiencing chronic homelessness for a year or more, or for those who have had at least four episodes of homelessness in the past three years. The New San Marco opened in May 2007, and the building quickly filled with residents. Since then, occupancy has been near 100%.
Enterprise Green Communities (Incremental Costs, Measurable Savings)
Park Avenue Apartments
Affordable Housing; Environmental Health and Sustainability; Social Services
Minneapolis MN 2009 Park Avenue Apartments will be built adjacent to Lutheran Social Service’s new service center, Center for Changing Lives, which opened in the winter of 2008. The new center will house mental health counseling services, after school services for kids, wellness services, housing and financial services. All 48 units are affordable, with 38 units targeted for households earning up to 45% AMI and the remaining 10 units targeted for households earning up to 15% AMI. Thirteen apartments are specifically designated for households experiencing long-term homelessness or near homelessness. These households will pay no more than 30% of their income towards rent.
Enterprise Green Communities (Incremental Costs, Measurable Savings)
Ripley GardensAffordable Housing; Environmental Health and Sustainability; Green Space
Minneapolis MN 2009 Ripley Gardens is the redevelopment of the former Ripley Maternity Hospital in the Harrison Neighborhood of Minneapolis. The development includes the restoration of three historic buildings and the addition of three new buildings to provide 52 rental and eight home ownership units.
Enterprise Green Communities (Incremental Costs, Measurable Savings)
Viking Terrace ApartmentsAffordable Housing; Environmental Health and Sustainability; Green Space
Worthington MN 2009 As an affordable housing preservation project, Viking Terrace will provide an excellent opportunity to evaluate those strategies that prove to be most cost-effective and will identify tools for long-term sustainability and green preservation throughout Minnesota.
Enterprise Green Communities (Incremental Costs, Measurable Savings)
Accessory Dwelling Units in Cary, NCAffordable Housing; Mixed-Use Cary NC 2001 Accessory dwelling units. Smart Growth
Network and National Neighborhood Coalition
Ewing Independent Living
Affordable Housing; Environmental Health and Sustainability; Mixed-Use; Disability Friendly
Ewing NJ 2009 Ewing Independent Living is a newly constructed, 72-unit affordable community in Ewing, NJ, dedicated to seniors 55 and older and adults with disabilities. With 56 one-bedroom and 16 two-bedroom apartments in an elevator building, Ewing Independent Living has 58,000 square feet of residential space. All apartments consist of, at a minimum, a kitchen, living room, bathroom and bedroom. The building surrounds two large courtyards, which contain a patio, bocce ball court, raised gardens, shuffleboard and a sandbox for children.
Enterprise Green Communities (Incremental Costs, Measurable Savings)
121

full
repo
rt
BUILDING PROSPEROUS PLACES IN MICHIGAN
Table 13: Placemaking Case Studies (cont.)
122
Title Categories City/County State Year Description Source
New Jersey’s Mt. Laurel Decision Affordable Housing; Inclusionary Zoning N/A NJ 2001 Municipalities voluntarily enter a Council on Affordable Housing by committing to providing affordable
housing in order to prevent lawsuits against exclusionary zoning.Smart Growth Network and National Neighborhood Coalition
New Jersey's Smart CodesAffordable Housing N/A NJ 2001 Governmental support of codes that make workforce housing provision cheaper and more efficient. Smart Growth
Network and National Neighborhood Coalition
Chuska ApartmentsAffordable Housing; Environmental Health and Sustainability; Green Space
Gallup NM 2009 Chuska Apartments is the first affordable housing development supported by the Enterprise Rural and Native American Initiative that works with tribes to create healthy, safe, affordable housing and to increase opportunities for economic advancement. Chuska Apartments is a 30-unit, new construction property with six residential buildings and a community center.
Enterprise Green Communities (Incremental Costs, Measurable Savings)
David & Joyce Dinkins Gardens
Affordable Housing; Environmental Health and Sustainability; Mixed-Use
New York NY 2009 The David & Joyce Dinkins Gardens, named in honor of former Mayor David N. Dinkins and his wife, is a green building that includes homes for families earning less than 60% AMI and youth aging out of foster care. It consists of 28 studio, 24 one-bedroom and 33 two-bedroom apartments. It also includes a 2,500-square-foot community facility to house HCCI’s Construction Trades Academy, a program that provides local residents with skills in the construction trades and building maintenance industries. Built on formerly City-owned property in Harlem’s Bradhurst neighborhood, the building is designed to meet the community’s critical social and environmental needs. The affordable housing and community space are key elements in the nearly 20-year-old Bradhurst plan, a blueprint for revitalizing 32 square blocks of north central Harlem.
Enterprise Green Communities (Incremental Costs, Measurable Savings)
Decatur GreenAffordable Housing; Environmental Health and Sustainability; Mixed-Use
New York NY 2009 Decatur Green is a six-story development built on an urban infill—a built-up, but obsolete or underutilized, area that can be reused or repositioned—instead of a greenfield in a rural area. The 18-unit building sits on a third of an acre in the Bronx. Building includes an 815-square-foot community room and 1,500 square feet of landscaped backyard and sitting areas.
Enterprise Green Communities (Incremental Costs, Measurable Savings)
Linked Deposits for Housing Rehabilitation in Cuyahoga County, OH
Affordable Housing Cuyahoga County
OH 2001 Banks providing low-interest loans for home renovation and rehabilitation. Smart Growth Network and National Neighborhood Coalition
Living on Track
Affordable Housing; Environmental Health and Sustainability; Social Services
Medford OR 2009 Living on Track is a two-site development providing new construction of 63 units of supportive housing in Medford, OR. Sky Vista will have 48 units and Lithia Place will have 15 units. The project provides 18 one-bedroom, 41 two-bedroom and four three-bedroom units on two parcels of land, six acres of development total. Living on Track units will house residents in need of supportive housing earning less than 50% of AMI. The project is geared to address the needs of developmentally disabled adults in recovery from alcohol and drug issues, chronically medically ill citizens, homeless individuals and victims of domestic violence.
Enterprise Green Communities (Incremental Costs, Measurable Savings)
Portland Community Land Trust Affordable Housing Portland OR 2001 Land trusts by purchasing land in which nonprofits and affordable housing developers build homes
that will be occupied by mixed-income residents and offering subsidies.Smart Growth Network and National Neighborhood Coalition
Crane Arts Program Arts and Culture Philadelphia PA 2007 Renovation of industrial site into an art center. The Reinvestment Fund
Philadelphia's Mural Arts Program Arts and Culture Philadelphia PA 2007 City-wide mural program. The Reinvestment Fund
Powelton HeightsAffordable Housing; Environmental Health and Sustainability; Social Services
Philadelphia PA 2009 Powelton Heights’ blend of service-enriched housing and green building design serve as an innovative contribution to the active redevelopment of Philadelphia’s neighborhoods.
Enterprise Green Communities (Incremental Costs, Measurable Savings)
Northside Coalition for Fair Housing, Pittsburgh
Affordable Housing; Community Engagement
Pittsburgh PA 2001 Coalition purchasing land to encourage community-building projects. Smart Growth Network and National Neighborhood Coalition
Addressing Lead Hazards in Rhode Island Affordable Housing; Inclusionary Zoning N/A RI 2001 Refurbishing homes by using Medicaid funds. Smart Growth
Network and National Neighborhood Coalition
SMART Housing in Austin, TX Affordable Housing Austin TX 2001 Smart growth matrix, creates a score for development projects based on how they meet the City’s goals. Smart Growth
Network and National Neighborhood Coalition

understanding the values of, perceptions of and barriers to placemaking
land
pol
icy
inst
itut
e
Title Categories City/County State Year Description Source
New Jersey’s Mt. Laurel Decision Affordable Housing; Inclusionary Zoning N/A NJ 2001 Municipalities voluntarily enter a Council on Affordable Housing by committing to providing affordable
housing in order to prevent lawsuits against exclusionary zoning.Smart Growth Network and National Neighborhood Coalition
New Jersey's Smart CodesAffordable Housing N/A NJ 2001 Governmental support of codes that make workforce housing provision cheaper and more efficient. Smart Growth
Network and National Neighborhood Coalition
Chuska ApartmentsAffordable Housing; Environmental Health and Sustainability; Green Space
Gallup NM 2009 Chuska Apartments is the first affordable housing development supported by the Enterprise Rural and Native American Initiative that works with tribes to create healthy, safe, affordable housing and to increase opportunities for economic advancement. Chuska Apartments is a 30-unit, new construction property with six residential buildings and a community center.
Enterprise Green Communities (Incremental Costs, Measurable Savings)
David & Joyce Dinkins Gardens
Affordable Housing; Environmental Health and Sustainability; Mixed-Use
New York NY 2009 The David & Joyce Dinkins Gardens, named in honor of former Mayor David N. Dinkins and his wife, is a green building that includes homes for families earning less than 60% AMI and youth aging out of foster care. It consists of 28 studio, 24 one-bedroom and 33 two-bedroom apartments. It also includes a 2,500-square-foot community facility to house HCCI’s Construction Trades Academy, a program that provides local residents with skills in the construction trades and building maintenance industries. Built on formerly City-owned property in Harlem’s Bradhurst neighborhood, the building is designed to meet the community’s critical social and environmental needs. The affordable housing and community space are key elements in the nearly 20-year-old Bradhurst plan, a blueprint for revitalizing 32 square blocks of north central Harlem.
Enterprise Green Communities (Incremental Costs, Measurable Savings)
Decatur GreenAffordable Housing; Environmental Health and Sustainability; Mixed-Use
New York NY 2009 Decatur Green is a six-story development built on an urban infill—a built-up, but obsolete or underutilized, area that can be reused or repositioned—instead of a greenfield in a rural area. The 18-unit building sits on a third of an acre in the Bronx. Building includes an 815-square-foot community room and 1,500 square feet of landscaped backyard and sitting areas.
Enterprise Green Communities (Incremental Costs, Measurable Savings)
Linked Deposits for Housing Rehabilitation in Cuyahoga County, OH
Affordable Housing Cuyahoga County
OH 2001 Banks providing low-interest loans for home renovation and rehabilitation. Smart Growth Network and National Neighborhood Coalition
Living on Track
Affordable Housing; Environmental Health and Sustainability; Social Services
Medford OR 2009 Living on Track is a two-site development providing new construction of 63 units of supportive housing in Medford, OR. Sky Vista will have 48 units and Lithia Place will have 15 units. The project provides 18 one-bedroom, 41 two-bedroom and four three-bedroom units on two parcels of land, six acres of development total. Living on Track units will house residents in need of supportive housing earning less than 50% of AMI. The project is geared to address the needs of developmentally disabled adults in recovery from alcohol and drug issues, chronically medically ill citizens, homeless individuals and victims of domestic violence.
Enterprise Green Communities (Incremental Costs, Measurable Savings)
Portland Community Land Trust Affordable Housing Portland OR 2001 Land trusts by purchasing land in which nonprofits and affordable housing developers build homes
that will be occupied by mixed-income residents and offering subsidies.Smart Growth Network and National Neighborhood Coalition
Crane Arts Program Arts and Culture Philadelphia PA 2007 Renovation of industrial site into an art center. The Reinvestment Fund
Philadelphia's Mural Arts Program Arts and Culture Philadelphia PA 2007 City-wide mural program. The Reinvestment Fund
Powelton HeightsAffordable Housing; Environmental Health and Sustainability; Social Services
Philadelphia PA 2009 Powelton Heights’ blend of service-enriched housing and green building design serve as an innovative contribution to the active redevelopment of Philadelphia’s neighborhoods.
Enterprise Green Communities (Incremental Costs, Measurable Savings)
Northside Coalition for Fair Housing, Pittsburgh
Affordable Housing; Community Engagement
Pittsburgh PA 2001 Coalition purchasing land to encourage community-building projects. Smart Growth Network and National Neighborhood Coalition
Addressing Lead Hazards in Rhode Island Affordable Housing; Inclusionary Zoning N/A RI 2001 Refurbishing homes by using Medicaid funds. Smart Growth
Network and National Neighborhood Coalition
SMART Housing in Austin, TX Affordable Housing Austin TX 2001 Smart growth matrix, creates a score for development projects based on how they meet the City’s goals. Smart Growth
Network and National Neighborhood Coalition
123

full
repo
rt
BUILDING PROSPEROUS PLACES IN MICHIGAN
Table 13: Placemaking Case Studies (Cont.)
124
Title Categories City/County State Year Description Source
Spring TerraceAffordable Housing; Environmental Health and Sustainability; Social Services
Austin TX 2009 Formerly an extended-stay hotel, Spring Terrace was renovated into furnished efficiency apartments, each with a private bath and kitchenette, as well as community areas and green spaces. Spring Terrace provides permanent supportive housing to 140 formerly homeless individuals with extremely low incomes.
Enterprise Green Communities (Incremental Costs, Measurable Savings)
Neighborhoods in Bloom in Richmond Affordable Housing Richmond VA 2001 Rehabilitation projects. Smart Growth
Network and National Neighborhood Coalition
Virginia’s Bayview Citizens for Social Justice
Affordable Housing; Mixed-Use; Community Engagement
Bayview VA 2001 Federal aid used to construct housing, retail space and a community center. Smart Growth Network and National Neighborhood Coalition
Roanoke-Lee Street Project
Affordable Housing; Environmental Health and Sustainability; Social Services
Blacksburg VA 2009 Community Housing Partners, a nonprofit community development corporation, completed construction in 2006 of the Roanoke-Lee Street Project. The project includes 14 duplex homes in the town’s historic Roanoke-Lee Street neighborhood. This development has four building designs, with nine two-bedrooms and five three-bedrooms. Homes are situated in an established neighborhood with mature trees and sidewalks, within walking distance of public transportation and community amenities. All homes were constructed in an area targeted by the town for revitalization and were restricted for sale to homebuyers with incomes at or below 80% of the area median.
Enterprise Green Communities (Incremental Costs, Measurable Savings)
Affordable Housing Preservation in SeattleAffordable Housing Seattle WA 2009 Transfer of development rights (TDR) a market-based land use tool that local governments can use to
preserve agricultural land, historic landmarks, affordable housing or environmentally sensitive sites by directing growth to locations that are more suitable for higher-density development.
Breakthroughs (8.5)
Noji Gardens, Seattle Affordable Housing; Mixed-Income Seattle WA 2001 Manufactured housing. Smart Growth
Network and National Neighborhood Coalition
Riverwalk Point IIAffordable Housing; Environmental Health and Sustainability; Community Engagement
Spokane WA 2009 Riverwalk Point II provides affordable one-, two- and three-bedroom apartments for 50 families with low incomes. There are four residential buildings and a large community building on-site, and all have been arranged to blend harmoniously with the existing Riverwalk Point complex, an affordable development that started in 1999.
Enterprise Green Communities (Incremental Costs, Measurable Savings)
Pear Tree PlaceAffordable Housing; Environmental Health and Sustainability; Social Services
Yakima WA 2009 Pear Tree Place (PTP) is a low-income housing tax credit development and consists of five buildings on two and a half acres of an obsolete pear orchard. Dedicated to helping people struggling with alcohol addiction, PTP is the very first alcohol- and drug-free community (ADFC) in the state of Washington to serve large families with children.
Enterprise Green Communities (Incremental Costs, Measurable Savings)
Parmenter Circle
Affordable Housing; Environmental Health and Sustainability; Mixed-Use
Middleton WI 2009 Parmenter Circle is the new construction of a four-story elevator building that brings green, affordable housing to Middleton, WI, Madison’s largest suburb. As part of Middleton’s Highway 12 Plan, to transform the former highway corridor into an urban retail district, Parmenter Circle not only adds new, affordable housing on the west side, it also contributes to the revitalization effort underway in Middleton’s downtown area. Green Communities’’ first development in Wisconsin, Parmenter Circle provides four efficiencies, three studio lofts, 16 one-bedroom, 23 two-bedroom and four three-bedroom apartments.
Enterprise Green Communities (Incremental Costs, Measurable Savings)
understanding the values of, perceptions of and barriers to placemaking
land
pol
icy
inst
itut
e
Title Categories City/County State Year Description Source
Spring TerraceAffordable Housing; Environmental Health and Sustainability; Social Services
Austin TX 2009 Formerly an extended-stay hotel, Spring Terrace was renovated into furnished efficiency apartments, each with a private bath and kitchenette, as well as community areas and green spaces. Spring Terrace provides permanent supportive housing to 140 formerly homeless individuals with extremely low incomes.
Enterprise Green Communities (Incremental Costs, Measurable Savings)
Neighborhoods in Bloom in Richmond Affordable Housing Richmond VA 2001 Rehabilitation projects. Smart Growth
Network and National Neighborhood Coalition
Virginia’s Bayview Citizens for Social Justice
Affordable Housing; Mixed-Use; Community Engagement
Bayview VA 2001 Federal aid used to construct housing, retail space and a community center. Smart Growth Network and National Neighborhood Coalition
Roanoke-Lee Street Project
Affordable Housing; Environmental Health and Sustainability; Social Services
Blacksburg VA 2009 Community Housing Partners, a nonprofit community development corporation, completed construction in 2006 of the Roanoke-Lee Street Project. The project includes 14 duplex homes in the town’s historic Roanoke-Lee Street neighborhood. This development has four building designs, with nine two-bedrooms and five three-bedrooms. Homes are situated in an established neighborhood with mature trees and sidewalks, within walking distance of public transportation and community amenities. All homes were constructed in an area targeted by the town for revitalization and were restricted for sale to homebuyers with incomes at or below 80% of the area median.
Enterprise Green Communities (Incremental Costs, Measurable Savings)
Affordable Housing Preservation in SeattleAffordable Housing Seattle WA 2009 Transfer of development rights (TDR) a market-based land use tool that local governments can use to
preserve agricultural land, historic landmarks, affordable housing or environmentally sensitive sites by directing growth to locations that are more suitable for higher-density development.
Breakthroughs (8.5)
Noji Gardens, Seattle Affordable Housing; Mixed-Income Seattle WA 2001 Manufactured housing. Smart Growth
Network and National Neighborhood Coalition
Riverwalk Point IIAffordable Housing; Environmental Health and Sustainability; Community Engagement
Spokane WA 2009 Riverwalk Point II provides affordable one-, two- and three-bedroom apartments for 50 families with low incomes. There are four residential buildings and a large community building on-site, and all have been arranged to blend harmoniously with the existing Riverwalk Point complex, an affordable development that started in 1999.
Enterprise Green Communities (Incremental Costs, Measurable Savings)
Pear Tree PlaceAffordable Housing; Environmental Health and Sustainability; Social Services
Yakima WA 2009 Pear Tree Place (PTP) is a low-income housing tax credit development and consists of five buildings on two and a half acres of an obsolete pear orchard. Dedicated to helping people struggling with alcohol addiction, PTP is the very first alcohol- and drug-free community (ADFC) in the state of Washington to serve large families with children.
Enterprise Green Communities (Incremental Costs, Measurable Savings)
Parmenter Circle
Affordable Housing; Environmental Health and Sustainability; Mixed-Use
Middleton WI 2009 Parmenter Circle is the new construction of a four-story elevator building that brings green, affordable housing to Middleton, WI, Madison’s largest suburb. As part of Middleton’s Highway 12 Plan, to transform the former highway corridor into an urban retail district, Parmenter Circle not only adds new, affordable housing on the west side, it also contributes to the revitalization effort underway in Middleton’s downtown area. Green Communities’’ first development in Wisconsin, Parmenter Circle provides four efficiencies, three studio lofts, 16 one-bedroom, 23 two-bedroom and four three-bedroom apartments.
Enterprise Green Communities (Incremental Costs, Measurable Savings)
125

full
repo
rt
BUILDING PROSPEROUS PLACES IN MICHIGAN
Adelaja, A., Y.G. Hailu and M. Abdulla. 2009. Chasing the Past or Investing in Our Future: Placemaking for Prosperity in the New Economy. Land Policy Institute, Michigan State University, East Lansing, MI. Available at: http://www.landpolicy.msu.edu/ChasingthePastReport; accessed September 3, 2010.
Adelaja, A. 2008. “Regional Place-Making in the New Global Economy.” Presentation Prepared for the Northwest Michigan Council of Governments. Available at http://www.landpolicy.msu.edu/modules.php?name=Pages&sp_id=317; accessed September 3, 2010.
Alexander, L.T. 2009. “Stakeholder Participation in New Governance: Lessons from Chicago’s Public Housing Reform Experiment.” Georgetown Journal on Poverty Law Policy 16:117–185.
Alexander, C. 1979. “The Timeless Way of Building.” New York, NY: Oxford University Press.
Anderson, W.L. 1964. “Trickling Down: The Relationship between Economic Growth and the Extent of Poverty Among American Families.” The Quarterly Journal of Economics 78(4):511–524.
Aravot, I. 2002. “Back to Phenomenological Placemaking.” Journal of Urban Design 7 (2):201–212.
Arigoni, D. 2001. Affordable Housing and Smart Growth: Making the Connection. Smart Growth Network and National Neighborhood Coalition, Washington, DC. Available at: http://www.smartgrowth.org/pdf/epa_ah-sg.pdf; accessed February 19, 2011.
Audretsch, D.B., and M.P. Feldman. 1996. “R&D Spillovers and the Geography of Innovation and Production.” The American Economic Review 86 (3):630–640.
Ben-Joseph, E. 2003. “Subdivision Regulations: Practices and Attitudes.” Working Paper, Lincoln Institute of Land Policy, Cambridge, MA.
Bennett, S. 2000. “Possibility of a Beloved Place: Residents and Placemaking in Public Housing Communities.” St. Louis Public Law Review 19:259.
Benson, E.D., J.L. Hansen, J.A. Schwartz and G.T. Smersh. 1998. “Pricing Residential Amenities: The Value of a View.” The Journal of Real Estate Finance & Economics 16 (1):55–73.
Brandenburg, A.M., and M.S. Carroll. 1995. “Your Place or Mine?: The Effect of Place Creation on Environmental Values and Landscape Meanings.” Society and Natural Resources 8:381–398.
Bohl, C.C. 2007. “Affordable Housing Design for Place Making and Community Building.” In Chasing the American Dream: New Perspectives on Affordable Homeownership, ed. W. Rohe, H. Watson, 113–145. Ithaca, NY: Cornell University Press.
Brophy, P.C., and R.N. Smith. 1997. “Mixed-Income Housing: Factors for Success.” Cityscape 3 (2):3–31.
Carlino, G., S. Chatterjee and R. Hunt. 2007. “Urban Density and the Rate of Invention.” Journal of Urban Economics 61 (3):389–419.
Center for Housing Policy/National Housing Conference. 2002. “America’s Working Families and the Housing Landscape, 1997–2001.” National Housing Conference. Washington DC.
Cervero, R. 1996. “Mixed Land Uses and Commuting: Evidence from the American Housing Survey.” Transportation Research Part A: Policy and Practice 30 (5):361–377.
Cervero, R. 2009. “Transport Infrastructure and Global Competitiveness: Balancing Mobility and Livability.” The ANNALS of the American Academy of Political and Social Science 626 (1):210–225.
Cheshire, P., and S. Sheppard. 1995. “On the Price of Land and the Value of Amenities.” Economica 62 (246): 247–267.
Cho, S., J.M. Bowker and W.M. Park. 2006. “Measuring the Contribution of Water and Green Space Amenities to Housing Values: An Application and Comparison of Spatially Weighted Hedonic Models.” Journal of Agricultural and Resource Economics 31 (3):485.
Ciccone, A., and R.E. Hall. 1996. “Productivity and the Density of Economic Activity.” NBER Working Paper No. 4313, National Bureau of Economic Research, Cambridge, MA.
Clark, D.E., and J.R. Kahn. 1988. “The Social Benefits of Urban Cultural Amenities.” Journal of Regional Science 28 (3):363–377.
The CLEAR Network. 2004. “Smart Growth and Placemaking in London: Proposed Demonstration Project.” London, UK: The CLEAR Network. Available at: http://www.clear.london.ca/pdf/SmartGrowthReport_2004.pdf; accessed March 4, 2011.
Combes, P.P., G. Duranton, L. Gobillon, D. Puga and S. Roux. 2009. “The Productivity Advantages of Large Cities: Distinguishing Agglomeration from Firm Selection.” CEPR Discussion Paper No. DP7191, Centre for Economic Policy Research, London, UK.
Part 10: References
126

understanding the values of, perceptions of and barriers to placemaking
land
pol
icy
inst
itut
e
Cortright, J. 2009. Walking the Walk: How Walkability Raises Home Values in U.S. Cities. Prepared for CEOs for Cities. Impresa, Inc., Portland, OR. Available at: http://blog.walkscore.com/wp-content/uploads/2009/08/WalkingTheWalk_CEOsforCities.pdf; accessed December 11, 2011.
Cox, W., and R.D. Utt. 2000. “Smart Growth, Housing Costs, and Homeownership.” Heritage Foundation, Washington, DC. Available at http://www.heritage.org/research/reports/2001/04/smart-growth-housing-costs-and-homeownership; accessed November 23, 2011.
Crane, R., and M. Manville. 2008. “People or Place? Revisiting the Who Versus the Where of Urban Development.” Land Lines 20 (3):2–7.
Cuff, D. 2009. “Design after Disaster.” Places 21 (1):4–7.
Cullen, G. 1961. “The Concise Townscape.” New York, NY: Reinhold.
Darden, J.T., R.C. Hill, J. Thomas and R. Thomas. 1987. “Detroit: Race and Uneven Development.” Philadelphia, PA: Temple University Press.
Davidson, N.M. 2009. “Reconciling People and Place in Housing and Community Development Policy.” Georgetown Journal on Poverty Law Policy 16 (1):1–10.
Deller, S.C., T.H. Tsai, D.W. Marcouiller and D.B.K. English. 2001. “The Role of Amenities and Quality of Life in Rural Economic Growth.” American Journal of Agricultural Economics 83 (2):352–365.
Dissart, J. C. 2007. “Landscapes and Regional Development: What are the Links?” Cahiers d’Economie et Sociologie Rurales 84:61–91.
Dissart, J.C., and S.C. Deller. 2000. “Quality of Life in the Planning Literature.” Journal of Planning Literature 15 (1):135–161.
Forsyth, A., and K. Crewe. 2009. “New Visions for Suburbia: Reassessing Aesthetics and Placemaking in Modernism, Imageability and New Urbanism.” Journal of Urban Design 14 (4):415–438.
Franz, M., O. Gules and G. Prey. 2008. “Place-Making and ‘Green’ Reuses of Brownfields in the Ruhr.” Tijdschrift Voor Economische en Sociale geografie 99 (3):316–328.
Geoghegan, J., L.A. Wainger and N.E. Bockstael. 1997. “Spatial Landscape Indices in a Hedonic Framework: An Ecological Economics Analysis Using GIS.” Ecological Economics 23 (3):251–264.
Geraghty, A.B., W. Seifart, T. Preston, C.V. Holm, T.H. Duarte and S.M. Farrar. 2009. “Partnership Moves Community toward Complete Streets.” American Journal of Preventative Medicine 37 (6):S420–S427.
Gibson, C.R. 2010. “Place Making: Mapping Culture, Creating Places: Collisions of Science and Art.” Local-Global: Identity, Security, Community 7:66–83.
Glaeser, E.L., and J. Gottlieb. 2008. “The Economics of Place-Making Policies.” Discussion Paper Number 2166, Harvard Institute of Economic Research, Harvard University, Cambridge, MA. Available at: http://works.bepress.com/cgi/viewcontent.cgi?article=1001&context=joshua_gottlieb; accessed August 22, 2011.
Glaeser, E.L., J. Kolko and A. Saiz. 2001. “Consumer City.” Journal of Economic Geography 1 (1):27–50.
Glaeser, E.L., and A. Saiz. 2003. “The Rise of the Skilled City.” Discussion Paper Number 2025, Harvard Institute of Economic Research, Harvard University, Cambridge, MA. Available at: http://time.dufe.edu.cn/spti/article/harvard/2025.pdf; accessed March 11, 2011.
Glanz, K., and J.F. Sallis. 2006. “The Role of Built Environments in Physical Activity, Eating, and Obesity in Childhood.” The Future of Children 16 (1):89–108.
Green, G.P. 2001. “Amenities and Community Economic Development: Strategies for Sustainability.” Journal of Regional Analysis and Policy 31 (2):61–75.
Halprin, L. 1989. “Design as a Value System.” Places 6 (1):60–67.
Hamlin, R.E. 2002. “Public-Private Partnerships for Inner-City Redevelopment.” In Informing the Debate, ed. C.S. Weissert, D.W. Thornton and A. Schneider. East Lansing, MI: Institute for Public Policy and Social Research, Michigan State University, East Lansing, MI.
Hamlin, R.E., and T.S. Lyons. 2003. Financing Small Business in America: Debt Capital in a Global Economy. Westport, CT: Praeger Publishers.
Hankins, K., and A. Walter. 2011. “‘Gentrification with Justice’: An Urban Ministry Collective and the Practice of Placemaking in Atlanta’s Inner-City Neighbourhoods.” Urban Studies 48 (12):1–19.
Hansen, T.J., and L. Kalambokidis 2010. “How Are Businesses Responding to Minnesota’s Tax-Free Zone Program?” Economic Development Quarterly, 24 (2):180–192.
Haughey, R., and R. Sherriff. 2010. Preserving Affordable Housing Near Transit and in Other Location-Efficient Areas. What Works Collaborative, Washington, DC. Available at: http://reconnectingamerica.org/assets/PDFs/2010chpaffordablehousingTODchallengesandoptions1.pdf; accessed December 18, 2011.
Hou, J., and M. Rios. 2003. “Community-Driven Place Making.” Journal of Architectural Education, 57 (1):19–27.
127

full
repo
rt
BUILDING PROSPEROUS PLACES IN MICHIGAN
Imbroscio, D. 2011. “Beyond Mobility: The Limits of Liberal Urban Policy.” Journal of Urban Affairs 00 (00):1–20.
Jacobs, J. 1961. “The Death and Life of Great American Cities.” New York, NY: Vintage.
Kong, F., H. Yin and N. Nakagoshi. 2007. “Using GIS and Landscape Metrics in the Hedonic Price Modeling of the Amenity Value of Urban Green Space: A Case Study in Jinan City, China.” Landscape and Urban Planning 79 (3–4):240–252.
Kunstler, J. H. 1993. “The Geography of Nowhere: The Rise and Decline of America’s Man-Made Landscape.” New York, NY: Free Press.
Kunstler, J. H. 1996. “Home From Nowhere: Remaking Our Everyday World for the 21st Century.” New York, NY: Touchstone Press.
Kweon, B.S., C.D. Ellis, P.I. Leiva and G.O. Rogers. 2010. “Landscape Components, Land Use, and Neighborhood Satisfaction.” Environment and Planning B: Planning and Design 37 (3):500–517.
Lancaster, K.J. 1966. “A New Approach to Consumer Theory.” The Journal of Political Economy 74 (2):132–157.
Le Goffe, P. 2000. “Hedonic Pricing of Agriculture and Forestry Externalities.” Environmental and Resource Economics 15 (4):397–401.
Lee, D., and K.I. Wolpin. 2006. “Intersectoral Labor Mobility and the Growth of the Service Sector.” Econometrica 74 (1):1–46.
Leggett, C.G., and N.E. Bockstael. 2000. “Evidence of the Effects of Water Quality on Residential Land Prices.” Journal of Environmental Economics and Management 39 (2): 121–144.
Leinberger, C.B. 2007. Back to the Future: The Need for Patient Equity in Real Estate Development Finance. The Brookings Institution, Washington, DC.
Leinberger, C.B. 2001. “Financing Progressive Development.” A Capital Exchange Journal Article Prepared for: The Brookings Institution Center on Urban and Metropolitan Policy. The Brookings Institution, Washington, DC. Available at: http://www.brookings.edu/articles/2001/05metropolitanpolicy_leinberger.aspx; accessed March 11, 2011.
Leinberger, C.B., and H. Kozloff. 2003. “Financing Mixed-Use.” Multifamily Trends 6 (4):36–39.
Leslie, E., E. Cerin, L. duToit, N. Owen and A. Bauman. 2007. “Objectively Assessing ‘Walkability’ of Local Communities: Using GIS to Identify the Relevant Environmental Attributes.” In GIS for Health and the Environment, ed. P.C. Lai and A.S.H. Mak, 90–104. Berlin, Germany: Springer.
Litman, T. 2009. “Evaluating Criticism of Smart Growth.” Victoria Transport Policy Institute, Victoria, BC. Available at: http://www.vtpi.org/sgcritics.pdf; accessed September 2, 2011.
Luttik, J. 2000. “The Value of Trees, Water and Open Space as Reflected by House Prices in the Netherlands.” Landscape and Urban Planning 48 (3–4):161–167.
Macpherson, D.A., and G.S. Sirmans. 2001. “Neighborhood Diversity and House-Price Appreciation.” The Journal of Real Estate Finance and Economics 22(1): 81–97.
Madden, M.E., and B. Spikowski. 2006. “Place Making with Form-Based Codes.” Urban Land 65(9): 174.
Malpezzi, S. 2008. “Hedonic Pricing Models: A Selective and Applied Review.” Housing Economics and Public Policy, 67–89.
Malpezzi, S., and K. Vandell. 2002. “Does the Low-Income Housing Tax Credit Increase the Supply of Housing?” Journal of Housing Economics 11 (4):360–380.
Markusen, A., and A. Gadwa. 2010. “Creative Placemaking: National Endowment for the Arts.” Prepared for The Mayors’ Institute on City Design, National Endowment for the Arts, Washington, DC. Available at: http://www.nea.gov/pub/CreativePlacemaking-Paper.Pdf; accessed March 31, 2011.
Martin, D.G. 2003. “‘Place-Framing’ as Place-Making: Constituting a Neighborhood for Organizing and Activism.” Annals of the Association of American Geographers 93 (3):730–750.
Michigan Land Use Leadership Council. 2003. Michigan’s Land, Michigan’s Future: Final Report of the Michigan Land Use Leadership Council. Michigan Land Use Leadership Council, Lansing, MI. Available at http://www.michiganlanduse.org/finalreport.htm; accessed November 18, 2010.
Milon, J.W., J. Gressel and D. Mulkey. 1984. “Hedonic Amenity Valuation and Functional Form Specification.” Land Economics 60 (4):378–387.
Nelson, J.P. 1979. “Airport Noise, Location Rent, and the Market for Residential Amenities.” Journal of Environmental Economics and Management 6 (4):320–331.
Pardew, J.B., R.L. Shane and J.F. Yanagida. 1986. “Structural Hedonic Prices of Land Parcels in Transition from Agriculture in a Western Community.” Western Journal of Agricultural Economics 11 (1):50–57.
Pierce, J., D.G. Martin and J.T. Murphy. 2010. “Relational Place-Making: The Networked Politics of Place.” Transactions of the Institute of British Geographers 36 (1):54–70.
Pivo, G., and J.D. Fisher. 2010. “The Walkability Premium in Commercial Real Estate Investments.” Real Estate Economics 39 (2):185–219.
Part 10: References (cont.)
128

understanding the values of, perceptions of and barriers to placemaking
land
pol
icy
inst
itut
e
Porta, S., V. Latora, F. Wang, S. Rueda, B. Cormenzana, F. Càrdenas, L. Latora, E. Strano, E. Belli, A. Cardillo, and S. Scellato. 2007. “Correlating Densities of Centrality and Activities in Cities: The Cases of Bologna (IT) and Barcelona (ES).” In Planning, Complexity and New ICT, ed. G. Rabino and M. Caglioni, 37–46. Firenze, Italy: Alinea.
Porter, M.E. 2000. “Location, Competition, and Economic Development: Local Clusters in a Global Economy.” Economic Development Quarterly 14 (1):15.
Potter, M.F. 1989. “Racial Diversity in Residential Communities: Societal Housing Patterns and a Proposal for a Racial Inclusionary Ordinance.” Southern California Law Review 63:1151, 1171.
Pritchett, W.E. 2003. “The Public Menace of Blight: Urban Renewal and the Private Uses of Eminent Domain.” Yale Law & Policy Review 21 (1):1–52.
Project for Public Spaces. N.D. “What is Placemaking?” Web page on the website of Project for Public Spaces, New York, NY. Available at: http://www.pps.org/articles/what_is_placemaking/; accessed January 6, 2011.
Putnam, R.D., R. Leonardi and R. Nanetti. 1994. “Making Democracy Work: Civic Traditions in Modern Italy.” Princeton, NJ: Princeton University Press.
Relph, E. 1997. “Sense of Place.” In Ten Geographic Ideas that Changed the World, ed. S. Hanson, 205–226. New Brunswick, NJ: Rutgers University Press.
Rodríguez, A., and C.A. Vogt. 2009. “Demographic, Environmental, Access, and Attitude Factors That Influence Walking to School by Elementary School-Aged Children.” Journal of School Health 79 (6): 255–261.
Rosen, S. 1974. “Hedonic Prices and Implicit Markets: Product Differentiation in Pure Competition.” The Journal of Political Economy 82 (1):34–55.
Schneekloth, L.H., and R.G. Shibley. 1995. “Placemaking: The Art and Practice of Building Communities.” New York, NY: John Wiley & Sons, Inc.
Sengupta, S., and D.E. Osgood. 2003. “The Value of Remoteness: A Hedonic Estimation of Ranchette Prices.” Ecological Economics 44 (1):91–103.
Sevilla, C.M. 1971. “Asphalt through the Model Cities: A Study of Highways and the Urban Poor.” Journal of Urban Law 49:297.
Sheppard, S. 1999. “Hedonic Analysis of Housing Markets.” Handbook of Regional and Urban Economics 3:1595–1635.
Smart Growth Network. 2006. This is Smart Growth. Smart Growth Network, Butte, MT. Available at: http://www.smartgrowthonlineaudio.org/pdf/TISG_2006_8-5x11.pdf; accessed March 11, 2011.
Staley, S.R., J.G. Edgens and G.C.S Mildner. 1999. “A Line in the Land.” Policy Study No. 263, Reason Public Policy Institute, Washington, DC.
Stedman, R., T. Beckley, S. Wallace and M. Ambard. 2004. “A Picture and 1000 Words: Using Resident-Employed Photography to Understand Attachment to High Amenity Places.” Journal of Leisure Research 36 (4):580–606.
Stevens, Q., and M. Ambler. 2010. “Europe’s City Beaches as Post-Fordist Placemaking.” Journal of Urban Design 15 (4):515–537.
Teaford, J.C. 2000. “Urban Renewal and its Aftermath.” Housing Policy Debate 11 (2):443–465.
TenBrink, D.S., R. McMunn and S. Panken. 2009. “Project U-Turn: Increasing Active Transportation in Jackson, Michigan.” American Journal of Preventive Medicine 37 (6):S329–S335.
Thorsnes, P. 2002. “The Value of a Suburban Forest Preserve: Estimates from Sales of Vacant Residential Building Lots.” Land Economics 78 (3):426–441.
Tuan, Y.F. 1977. Space and Place. Minneapolis, MN: University of Minnesota Press.
Turner, M.A., and L. Rawlings. 2009. “Promoting Neighborhood Diversity: Benefits, Barriers, and Strategies.” The Urban Institute, Washington, DC. Available at http://www.urban.org/uploadedpdf/411955promotingneighborhooddiversity.pdf; accessed March 14, 2012.
Tyrväinen, L. 1997. “The Amenity Value of the Urban Forest: An Application of the Hedonic Pricing Method. Landscape and Urban Planning 37 (3–4):211–222.
Urban Land Institute (ULI). 2008. Placemaking: The Business of Creating Thriving Mixed-Use Development. Paper presented at the 10th Annual Placemaking Conference, September 15–16, 2008, Denver, CO. Urban Land Institute, Washington, DC.
Urban Land Institute. 2006. “Workforce Housing: Innovative Strategies and Best Practices. Urban Land Institute, Washington, DC.
Warbach, J.D., S. Nicholls, T.F.Y. Bristor, D.F. Holecek, L.A. Martin and T.I. Herbowicz. 2004. “Overcoming Impediments to Smart Growth: Finding Ways for Land Development Professionals to Help Achieve Sustainability.” Michigan Travel, Tourism and Recreation Resource Center at Michigan State University, East Lansing, MI; and Planning & Zoning Center, Inc., Lansing, MI. Available at: http://www.tourismcenter.msu.edu/publications/12-01-04.pdf; accessed March 11, 2011.
129

full
repo
rt
BUILDING PROSPEROUS PLACES IN MICHIGAN130
Michigan State University has been advancing knowledge and transforming lives through innovative teaching,
research and outreach for more than 150 years. MSU is known internationally as a major public university,
with global reach and extraordinary impact. Its 17 degree-granting colleges attract scholars worldwide who are
interested in combining education with practical problem solving. www.msu.edu
School of Planning, Design and Construction
The Land Policy Institute was founded in 2006 and focuses on research and outreach related to land use, regional
strategic growth in the New Economy and sustainable communities. The Institute is affiliated with the MSU
School of Planning, Design and Construction, and collaborates with many faculty, centers and institutes across
campus, as well as stakeholders outside the university. The Land Policy Institute delivers innovative solutions,
transitioning knowledge from a variety of experts to the community. www.landpolicy.msu.edu.
Land Policy Institute
John A. Hannah Professor in Land Policy
Housed in the Department of Agricultural, Food and Resource Economics (AFRE) at Michigan State
University (MSU), the program of the Hannah Professor in Land Policy focuses on research-based innovation
in land use, land policy, land security, place science, growth strategies, economic development and prosperity
domestically and internationally. In Michigan, the Hannah Professor’s work has been a cornerstone of
economic development policy initiatives of the state, especially in areas related to renewable energy, the New
Economy and the green economy. As Director and Founder of the Land Policy Institute, the Hannah Professor
developed its research agenda and spearheaded several studies that relate to Michigan’s growing economy. At
the international level, the Hannah Professor’s program focuses on resource availability, economic appetites of
nations, global resource competition, land security and economic security. At the time of printing, Professor
Adelaja is on leave from Michigan State University on a foreign assignment with the Office of the National
Security Adviser at the Presidency of Nigeria, serving as Special Advisor on Economic Intelligence.
The School of Planning Design and Construction will be known for leading education, research and outreach
towards the integration of planning, design and construction to create a sustainable built and natural
environment. The goal of SPDC is to create knowledge that enriches communities, advances economic and
family life through leadership, fosters the development of entrepreneurial creativity, imbues a sense of social
responsibility, promotes the appreciation of cultural relevance, and above all, advances the understanding of
environmentally beneficial planning, design and construction. www.spdc.msu.edu

understanding the values of, perceptions of and barriers to placemaking
land
pol
icy
inst
itut
e
The Full ReportThis full report is available for download online at
www.landpolicy.msu.edu/BuildingProsperousPlacesinMIReport.
The summary report is also available for download online at
www.landpolicy.msu.edu/BuildingProsperousPlacesinMIReport/Summary.
131
Photos by Aaron Murphy, pg. 24; Ariniko Artistry, pg. 11; Brandon Bartoszek, back cover; Bryan Robb, pg. 31; Culinary Escapes, pg. 33; Gary L. Howe, pg. 66; iStock, front-cover top and middle, pgs. 1, 8, 14, 17, 42, 58, 64 and 67; Kenn W. Kiser, pg. iii; Kevin Goolsby, pg. 55; Michael Connors, pg. 26; Michael Forsyth, front-cover bottom and pg. 21; Michigan State University, pg. 65; Thad Zajdowicz, pg. 22; and Todd L. Church, pg. 46.

Land Policy InstituteMichigan State University
1405 S. Harrison Road3rd Floor Manly Miles Building
East Lansing, MI 48823
517.432.8800517.432.8769 fax
www.landpolicy.msu.edu
Land Policy Institute
Washington Square in Lansing.