part 75 cems field audit manual - us epa
TRANSCRIPT

Part 75 CEMS Field Audit Manual
Clean Air Markets DivisionUS EPA
Washington DC 20014
July 16 2003
Acknowledgments
This Part 75 CEMS Field Audit Manual is the result of past US EPA documents as well as significant support and reviews to provide updated information The Clean Air Markets Division (CAMD) of the US EPA had prepared an Acid Rain Program CEMS Field Audit Manual to assist with auditing continuous emission monitoring systems (CEMS) installed under 40 CFR Part 75 In addition Joseph Winkler US EPA Region VI with contractor assistance from Gerhard Gschwandtner Comprehensive Monitoring Services Inc had prepared a separate Acid Rain Program Continuous Emission Monitoring Systems Reference Manual Dr James Jahnke of Source Technology Associates prepared EPAs 1994 document entitled An Operators Guide to Eliminating Bias in CEM Systems (EPA 430-R-94-016) Additional references used in developing this manual are listed at the end of Section 2 The Clean Air Markets Division acknowledges the authors of these existing documents for providing a valuable foundation for preparing this document
The CAMD team leader for this manual was Matthew Boze Other CAMD staff provided valuable support and comments including Louis Nichols and others in the Emission Monitoring Branch Contract support for this document was provided by Perrin Quarles Associates Inc under Purchase Order No 2W-1382-NTSA James Jahnke PhD Source Technology Associates and James Peeler Emission Monitoring Inc provided a technical review of a draft of this manual Other reviews were provided by Joseph Winkler EPA Region VI and Errin Pichard Florida Department of Environmental Protection
Disclaimer
Any mention of trade names or commercial products in this document is not intended to constitute endorsement or recommendation for use
July 16 2003
Part 75 CEMS Field Audit Manual
Table of Contents
Page
Section 1 Introduction 111 Background 1
111 Importance of Monitoring for Emission Trading Programs 1112 Structure of Part 75 Monitoring Provisions 3
12 What does the manual cover 613 Part 75 Audit Program Overview 8
131 Part 75 Electronic Audit Program 8132 Audit Targeting 8133 Field Audits 8
14 Role of the Inspector 9141 Hands Off Approach 10142 Inspection Safety 11143 Recommended Training Courses 11
15 Key Part 75 Materials with Internet Links 12
Section 2 Part 75 CEMS Overview 1521 Introduction 1522 Sampling Location 17
221 Gas Measurement Location 18222 Flow Measurement Location 18223 Sampling in Stratified and Swirling Flow Conditions 18
23 Extractive Gas CEMS 19231 Source Level or Direct Extractive Systems 19
2311 Sample Probe 202312 Sample Transport and Conditioning Systems 22
232 Dilution Extractive Systems 232321 Dilution Probe 242322 Out-of-Stack Dilution System 252323 Sample Transport and Dilution Air Cleaning Systems 26
233 Calibration Gas System 27234 Analyzers 27
2341 Absorption Spectroscopy 282342 Luminescence Spectroscopy 292343 Electro-Analytical Methods 302344 Paramagnetic Techniques 30
24 In-Situ Gas Monitors 31241 Path In-Situ CEMS 32242 Point In-Situ CEMS 32243 In-Situ Gas Analyzers 32244 System Calibration 33
Part 75 Field Audit Manual ndash July 16 2003 Page i
Table of Contents (cont)
Page
25 Flow CEMS 33251 Sampling Location 34252 Differential Pressure Flow Monitors 34253 Thermal Mass Flow Monitors 35254 Ultrasonic Flow Monitor 37
26 Data Acquisition and Handling System (DAHS) 38261 CEMS Computer Systems 38262 Emissions Data Processing 39263 QA Test Data Processing 39264 Part 75 Reporting 39
27 References 40
Section 3 Audit Preparation 4131 Using Part 75 Electronic Data to Conduct Pre-Audit Reviews 41
311 Quarterly Electronic Data Reports 41312 Quarterly Feedback Reports 44313 Using MDC to Prepare for an Audit 44
3131 MDC Overview 443132 Getting Started with MDC 453133 Review and Print Electronic Portion of Monitoring Plans 463134 QA Tests Exemptions and Extensions 473135 Recertification Events and Monitoring System Downtime
Reports 503136 Using MDC Hourly to Check Emissions Data
and Calculations 5032 Hardcopy File Review 53
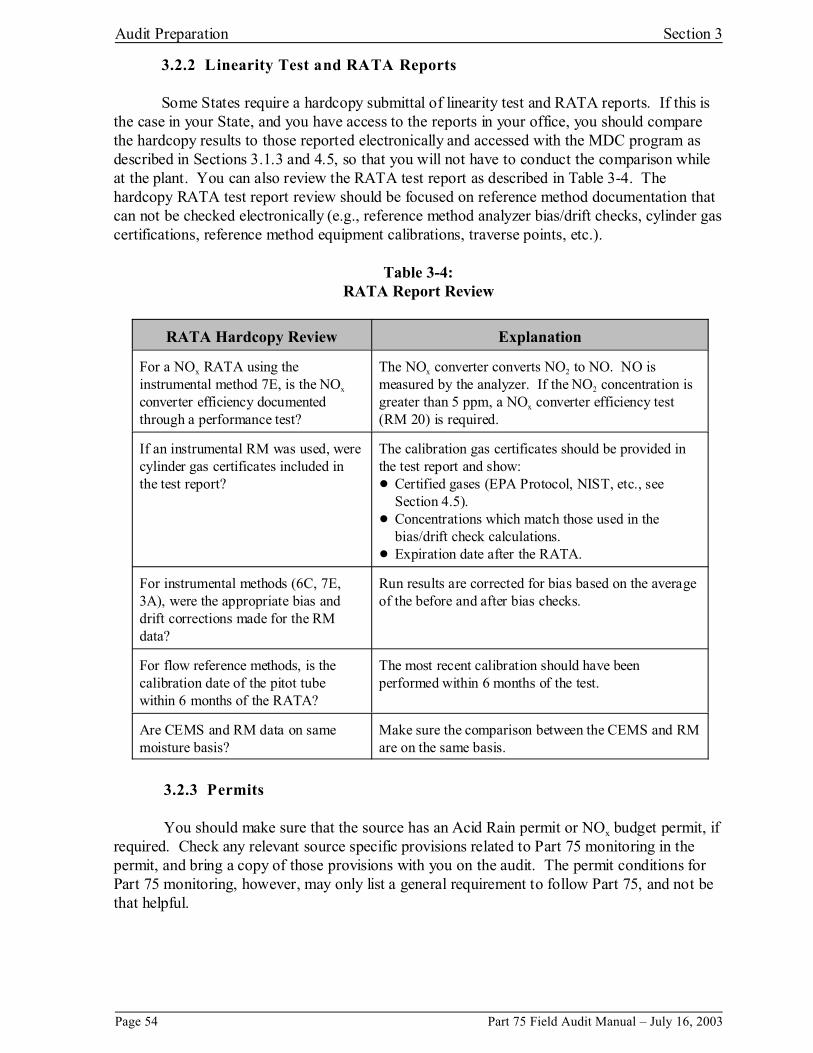
321 Correspondence Petitions and Previous AuditInspection Reports 53322 Linearity Test and RATA Reports 54323 Permits 54
33 Scheduling and Coordinating the Audit 5534 Materials to Bring 55
Section 4 On-Site CEMS Inspection 5741 Pre-Audit Interview 5842 Calibration Error Test 5943 ProbeSensors Sample Lines and Sample Conditioning Systems 62
431 Probe 62432 Sample Lines 63433 Dilution Air and Gas Sample Conditioning Systems 64
4331 Dilution Extractive Systems 644332 Source Level Extractive Systems 66
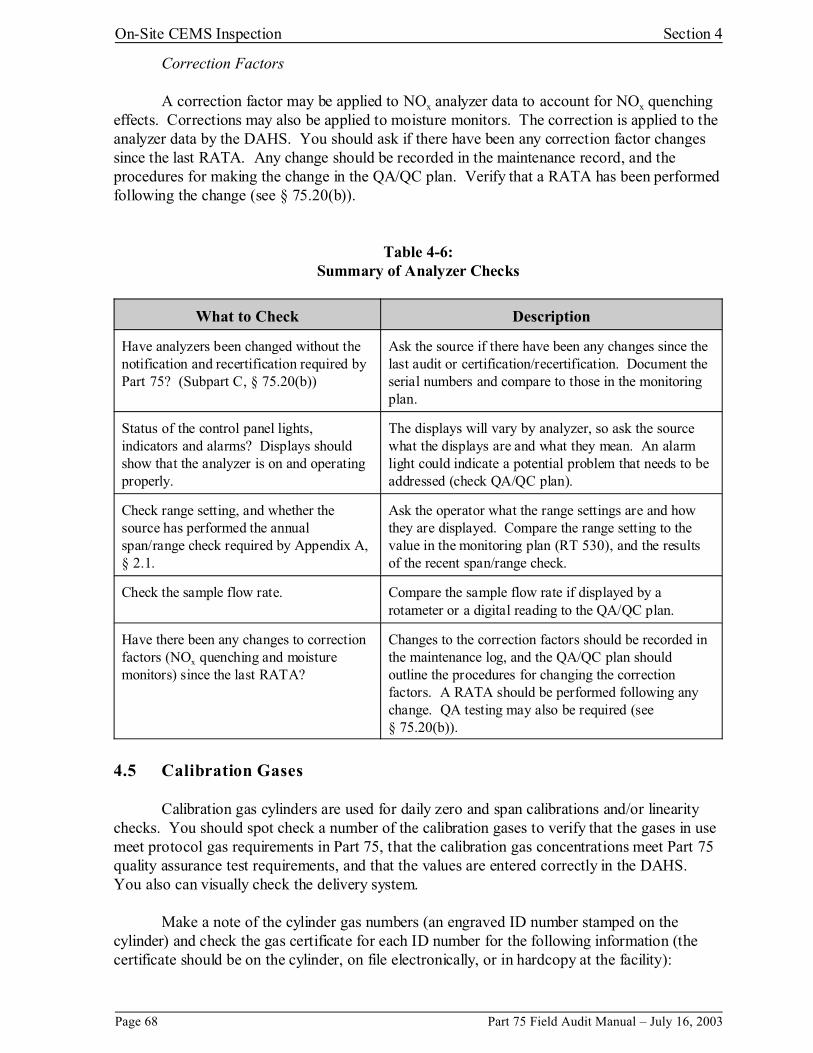
44 Gas Analyzers 67 68
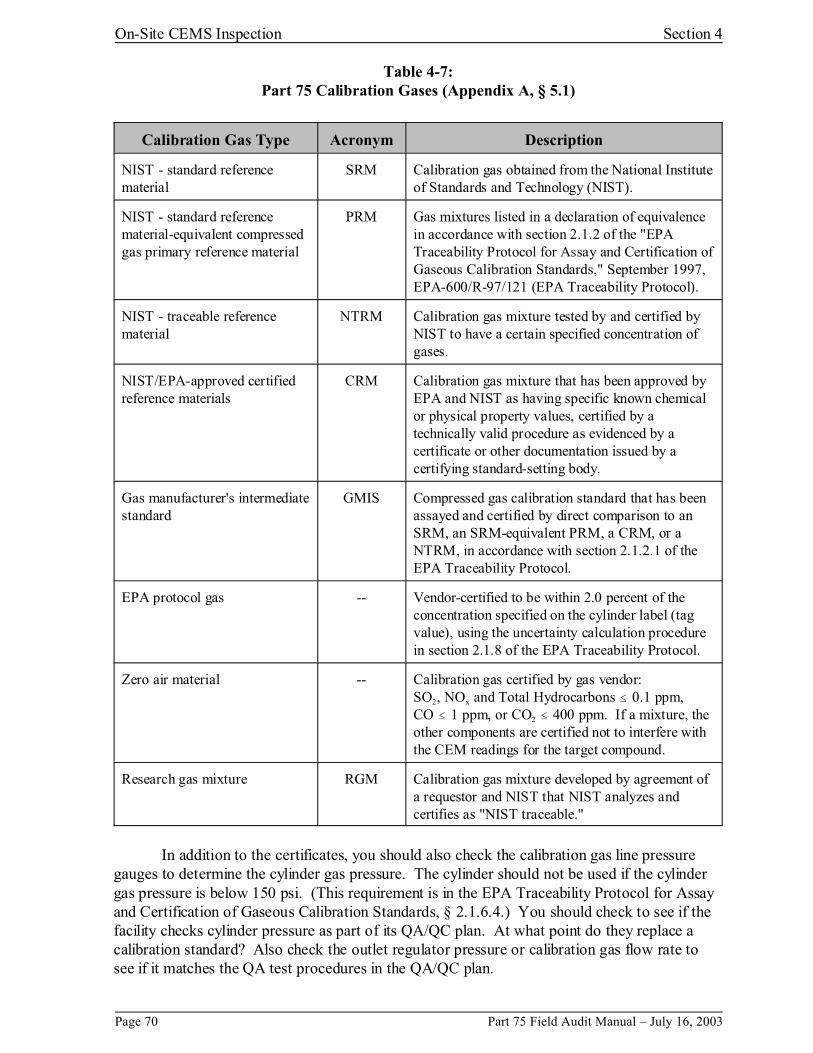
45 Calibration Gases 6846 Flow Monitors 71
Page ii Part 75 Field Audit Manual ndash July 16 2003
Table of Contents (cont)
Page
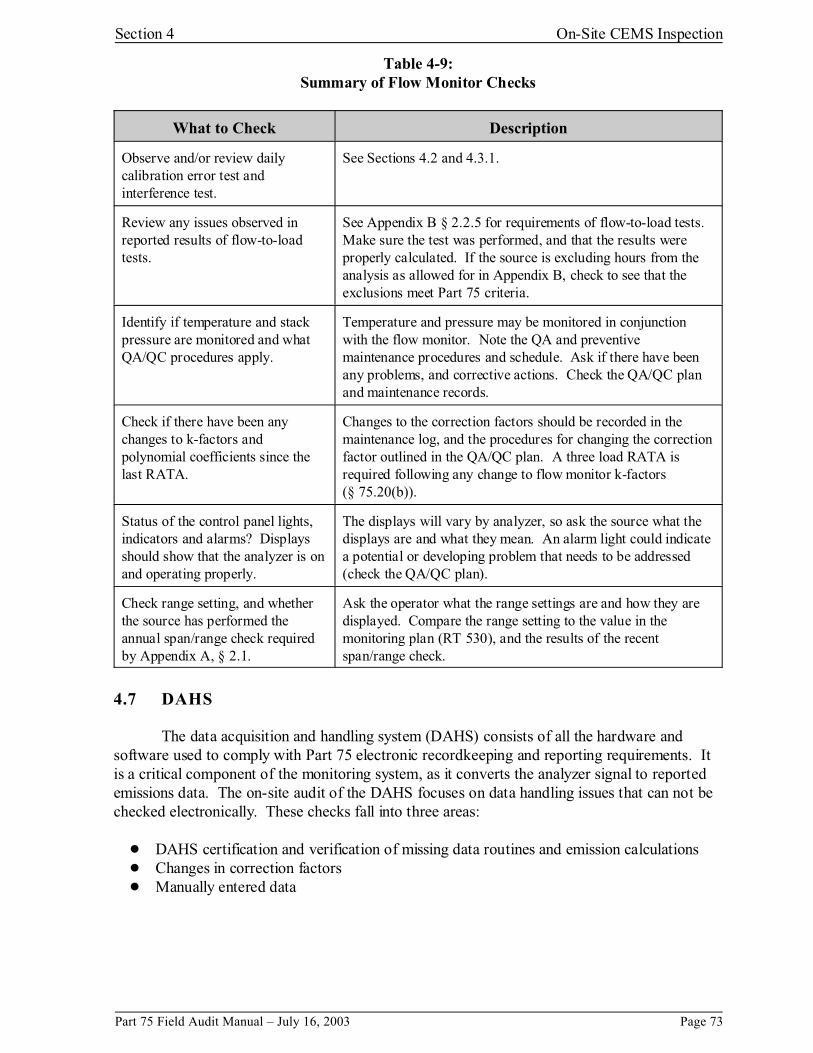
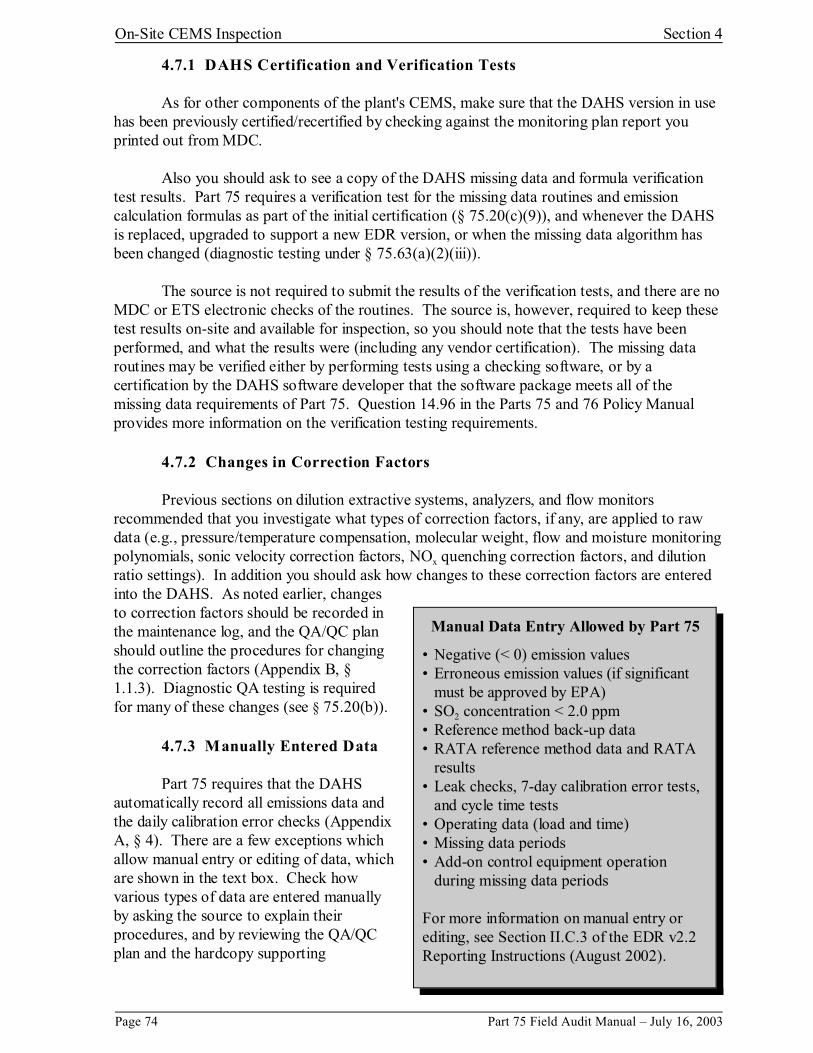
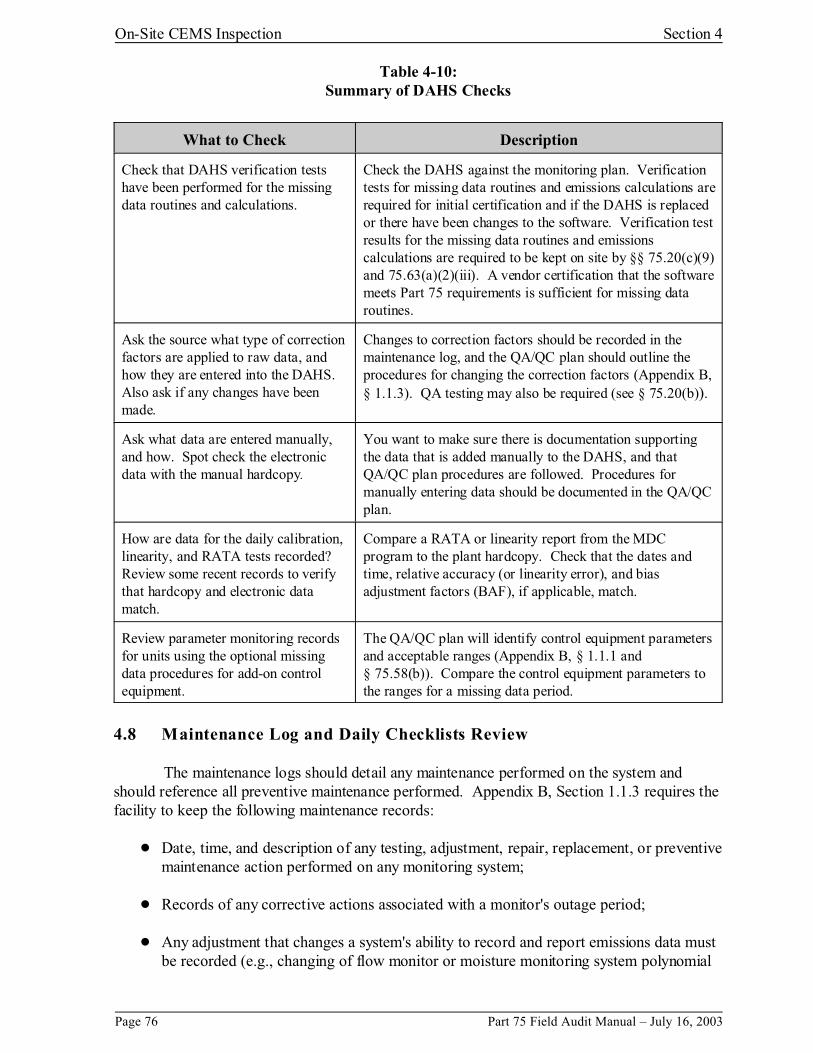
47 DAHS 73471 DAHS Certification and Verification Tests 74472 Changes in Correction Factors 74473 Manually Entered Data 74
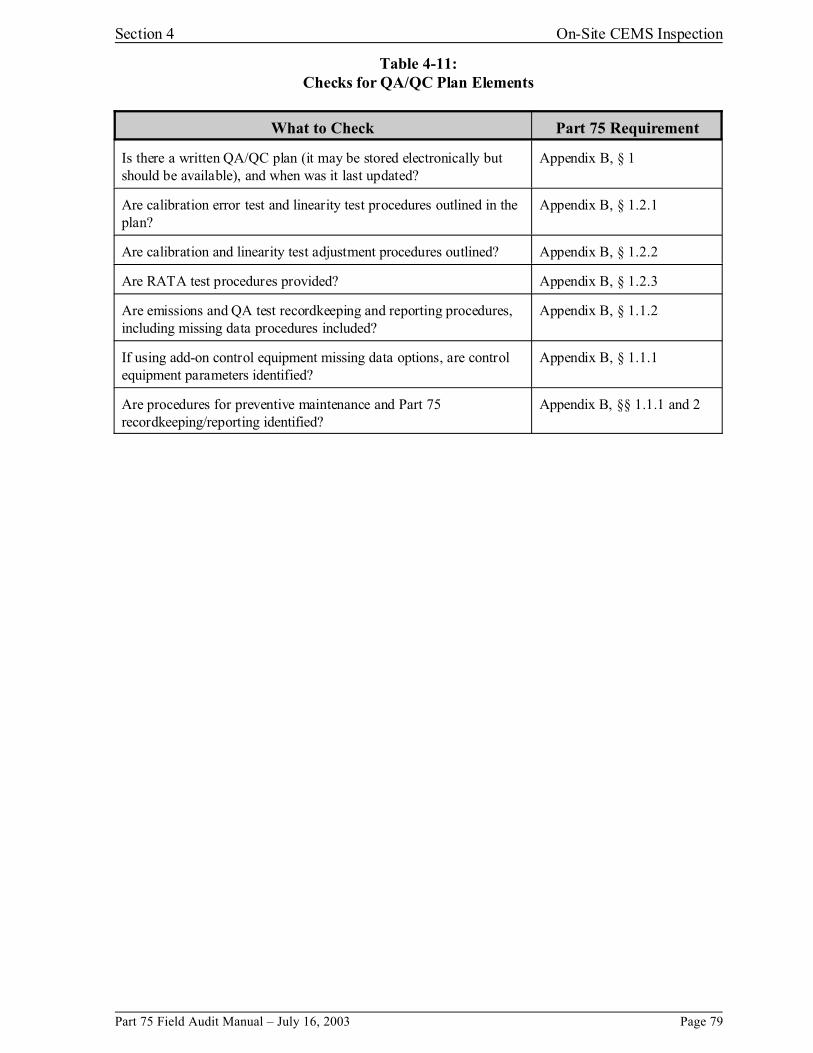
48 Maintenance Log and Daily Checklists Review 7649 QAQC Plan Review 78
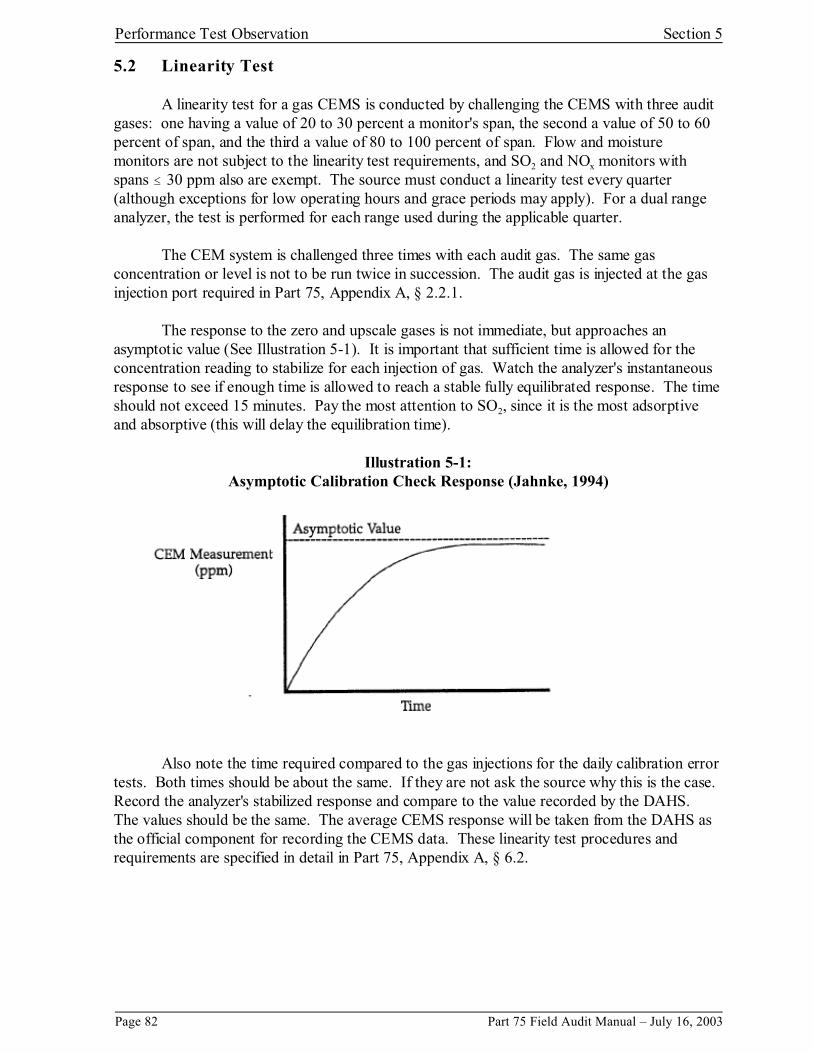
Section 5 CEMS Performance Test Observation 8151 Introduction 8152 Linearity Test 8253 Relative Accuracy Test Audit (RATA) 83
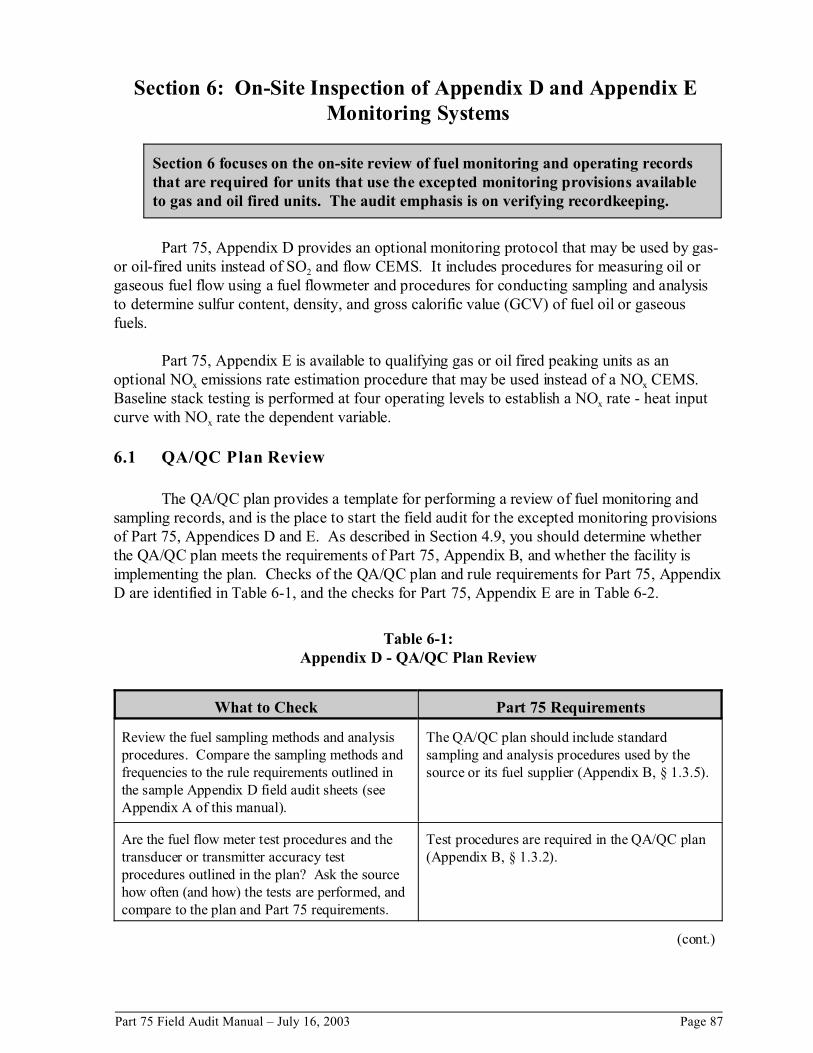
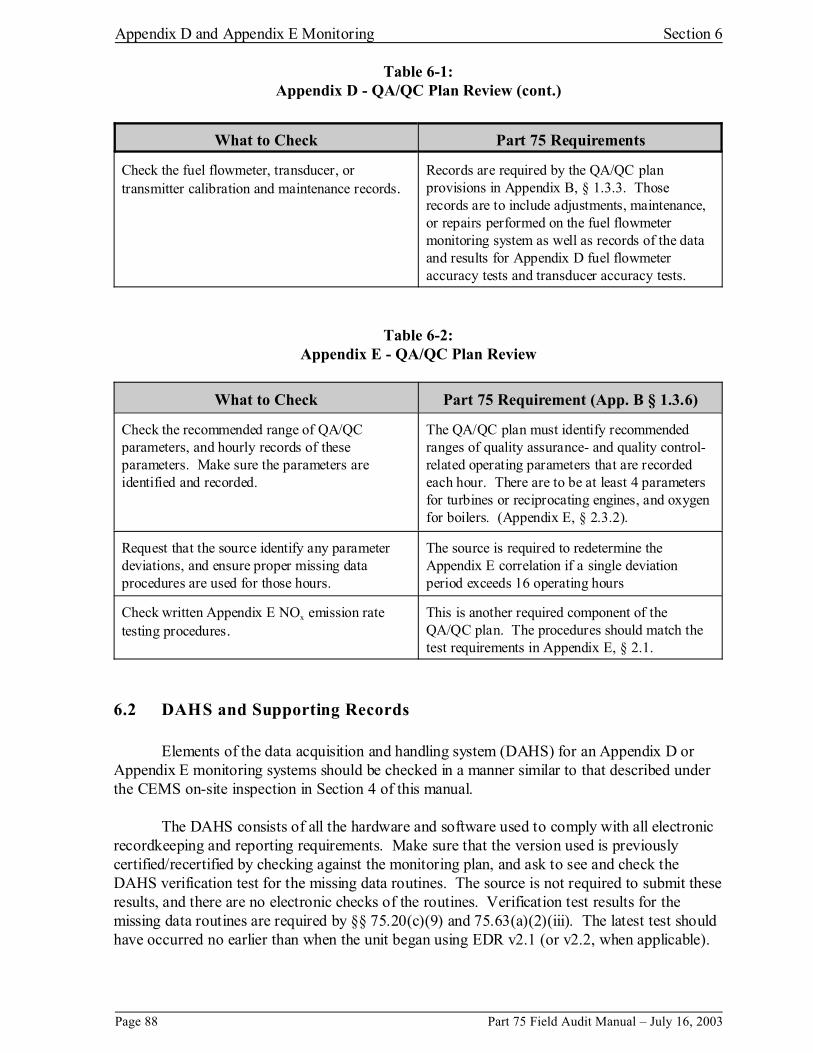
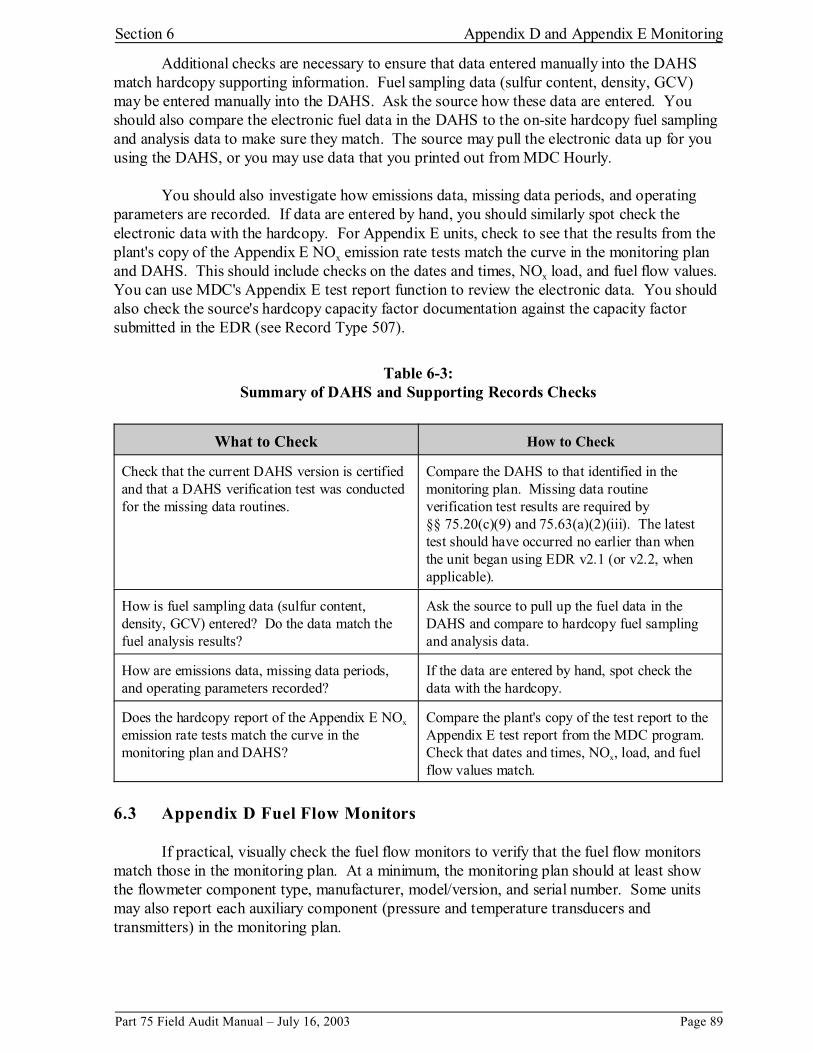
Section 6 On-Site Inspection of Appendix D and Appendix E Monitoring Systems 8761 QAQC Plan Review 8762 DAHS and Supporting Records 8863 Appendix D Fuel Flow Monitors 8964 Appendix D Fuel Flow Monitor Quality Assurance 90
641 QA Testing 90642 Maintenance and Inspection Records 90
Section 7 Reporting Audit Results 9171 Exit Interview 9172 Audit Report 9173 Follow-up Activities 92
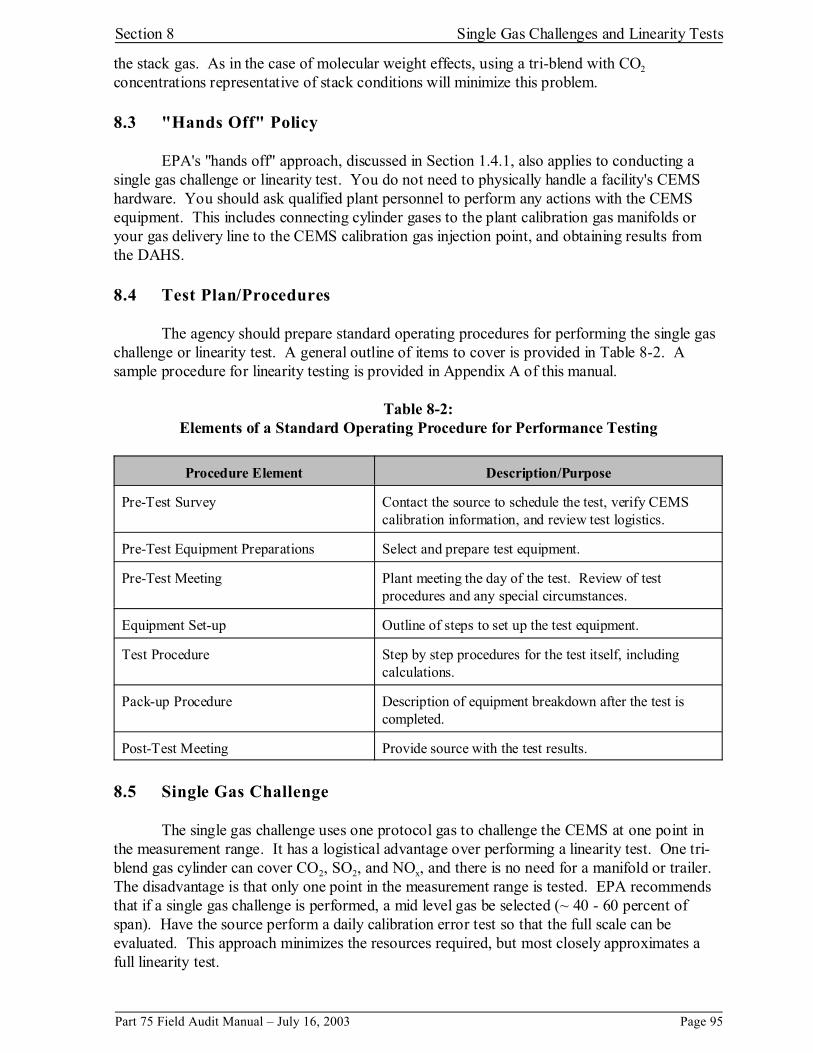
Section 8 Conducting Level 3 Audits 9381 Overview 9382 Tri-Blend or Single Blend Gases 9383 Hands Off Policy 9584 Test PlanProcedures 9585 Single Gas Challenge 9586 Linearity Test 9687 Calibration Gases 9688 Training 97
Part 75 Field Audit Manual ndash July 16 2003 Page iii
[This page intentionally left blank]
Page iv Part 75 Field Audit Manual ndash July 16 2003
List of Tables
Page
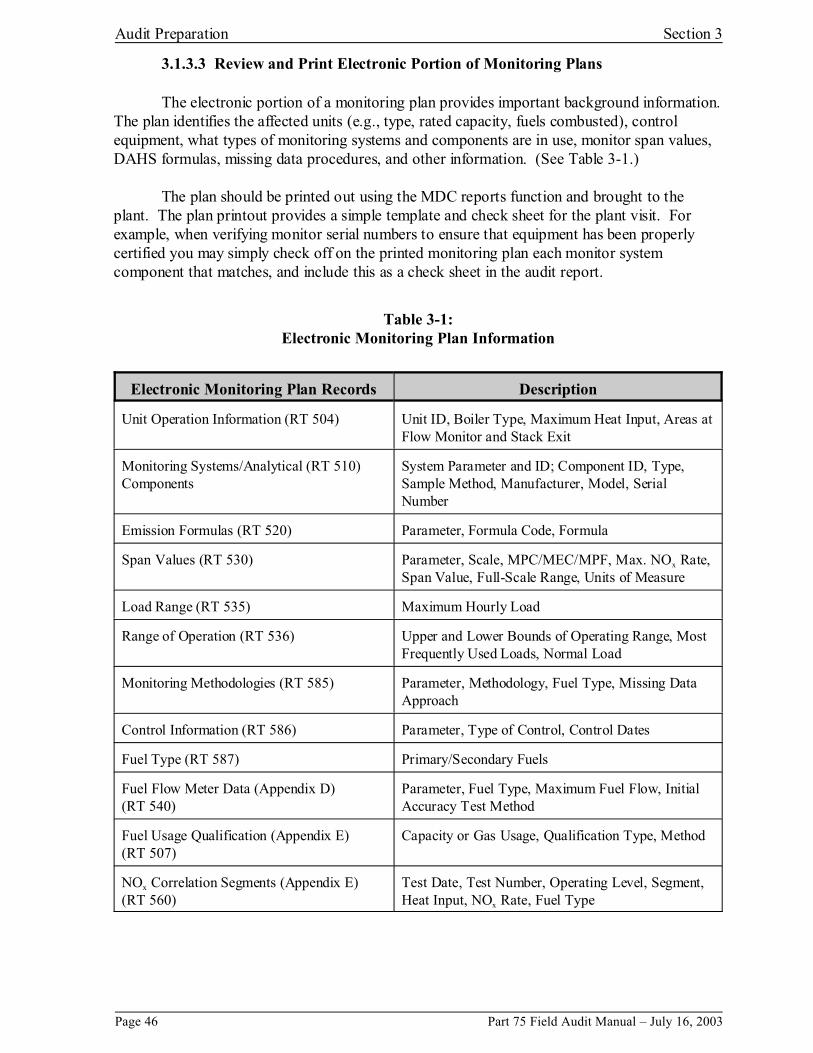
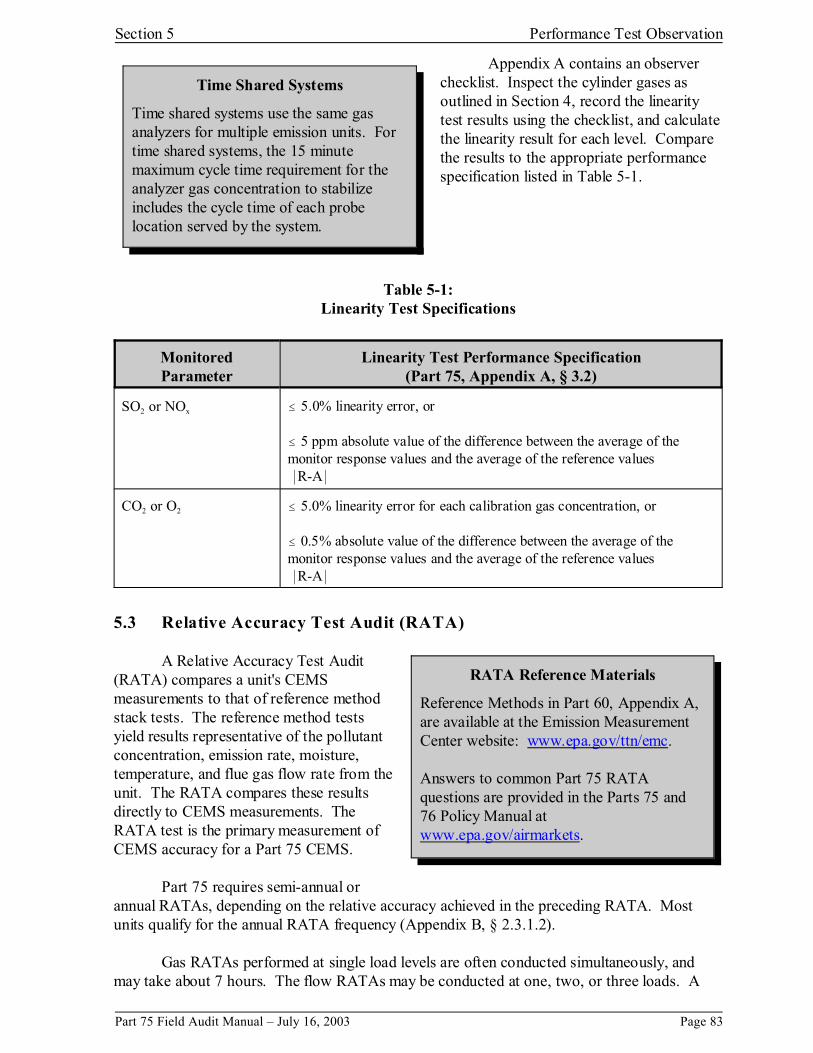
Table 1-1 Part 75 PollutantsParameters and CEMS Components 4Table 1-2 Part 75 Non-CEMS Methodologies 5Table 1-3 Levels of Field Audits 9Table 1-4 Available EPA Training Courses 12Table 2-1 Common Extractive Gas CEM Analytical Methods 28Table 2-2 In-Situ Gas Analyzer Methods 33Table 3-1 Electronic Monitoring Plan Information 46Table 3-2 Summary of MDC QA Test Checks 49Table 3-3 Summary of MDC Hourly Checks 53Table 4-1 Pre-Audit Interview Items 59Table 4-2 Part 75 Calibration Error Test Data Validation Requirements 61Table 4-3 ProbeSensor Check Summary 63Table 4-4 Summary of Dilution Air System Checks 65Table 4-5 Summary of Source Level Extractive System Checks 66Table 4-6 Summary of Analyzer Checks 68Table 4-7 Part 75 Calibration Gases (Appendix A sect 51) 70Table 4-8 Summary of Calibration Gas Checks 71Table 4-9 Summary of Flow Monitor Checks 73Table 4-10 Summary of DAHS Checks 76Table 4-11 Checks for QAQC Plan Elements 79Table 5-1 Linearity Test Specifications 83Table 6-1 Appendix D - QAQC Plan Review 87Table 6-2 Appendix E - QAQC Plan Review 88Table 6-3 Summary of DAHS and Supporting Records Checks 89Table 8-1 Effects of Gas Blends on Dilution System Measurements 94Table 8-2 Elements of a Standard Operating Procedure for Performance Testing 95Table 8-3 Available EPA Training Courses 97
Part 75 Field Audit Manual ndash July 16 2003 Page v
List of Illustrations Page
Illustration 1-1 Overview of Continuous Emission Monitoring in a Part 75 Trading Program 3
Illustration 2-1 Basic CEMS Types (Jahnke and Peeler 1997) 16Illustration 2-2 Example of Continuous Emission Monitoring Systems
at a Part 75 Unit 17Illustration 2-3 Typical Source-Level Extractive CEMS (Gschwandtner
and Winkler 2001) 21Illustration 2-4 Dilution Extractive CEMS (Gschwandtner and Winkler 2001) 23Illustration 2-5 In-Stack Dilution Probe (adapted from Jahnke 2000) 24Illustration 2-6 One Type of Out-of-Stack Dilution System (Gschwandtner
and Winkler 2001) 26Illustration 2-7 In-Situ Gas CEMS (Jahnke 1992) 32Illustration 2-8 Example of Multiple Probe Locations (Jahnke 1994) 35Illustration 2-9 Thermal Mass Flow Monitor Probe (adapted from Jahnke 1992) 36Illustration 2-10 Ultrasonic Flow Monitor 37Illustration 3-1 Example EDR Data Format for Record Type 320 42Illustration 3-2 Example Summary of Quarterly Report Content For Two Acid Rain
CEMS Units Emitting Through Common Stack 43Illustration 3-3 MDC Screen Showing Multiple Linearity Tests in One Quarter 48Illustration 3-4 Example MDC Hourly Graph of SO2 Concentration 52Illustration 5-1 Asymptotic Calibration Check Response (Jahnke 1994) 82
Page vi Part 75 Field Audit Manual ndash July 16 2003
Section 1 Introduction
After reading this Introduction the inspector (auditor) should understand the organization of the manual and the topics it covers the role of the field audit in the Part 75 compliance program the key components of the field audit and where to obtain the latest information on the regulation and on manual updates
11 Background
111 Importance of Monitoring for Emission Trading Programs
The US Environmental Protection Agency (EPA) has established monitoring requirements at 40 CFR Part 75 as part of its efforts to develop cap and trade emission reduction programs A cap and trade program is an innovative market-based approach to reducing emissions The cap sets a ceiling on emissions that is below an applicable baseline level Sources in the program receive emission allowances with each allowance authorizing a source to emit one ton of the pollutant being controlled Limiting the number of available allowances ensures the caps integrity At the end of each year every source must have enough allowances to cover its emissions for that year Unused allowances may be sold traded or saved (banked) for future use While this approach allows sources flexibility in deciding how they achieve compliance the cap ensures that the affected sources reduce emissions collectively to the desired reduction goal
The cornerstone for ensuring that sources achieve the required emission reductions is a strong monitoring program Accurate monitoring of all emissions and timely reporting ensure that a ton from one source is equal to a ton from any other source and that the integrity of the cap is maintained Under Part 75 participating sources must fully account for each ton of emissions according to stringent uniform protocols The resulting compliance information is unprecedented in its accuracy and comprehensiveness All data are publicly available on the Internet providing complete transparency
To date the Part 75 monitoring requirements are used for two separate programs Under the Acid Rain Program sources have had to meet Part 75 and emission reduction requirements since 1995 EPA has had the lead in ensuring compliance with the Acid Rain Program although EPA has teamed with State and local agencies on various aspects of implementing the Part 75 monitoring provisions
In May 2002 State agencies began to take the lead role in implementing and ensuring compliance with Part 75 for purposes of a separate nitrogen oxides (NOx) trading program that many eastern States have adopted in response to EPAs 1998 NOx SIP Call EPA believes that a strong audit program is an essential component of an effective Part 75 compliance oversight program Given the increased role of State and local agencies in Part 75 implementation EPA has prepared this manual to assist agencies in implementing Part 75 and to ensure the ongoing integrity of the new NOx trading program
The manual begins with the premise that each link in the chain of the Part 75 program is important in ensuring that the data ultimately used to measure emissions and account for the
Part 75 Field Audit Manual ndash July 16 2003 Page 1
Introduction Section 1
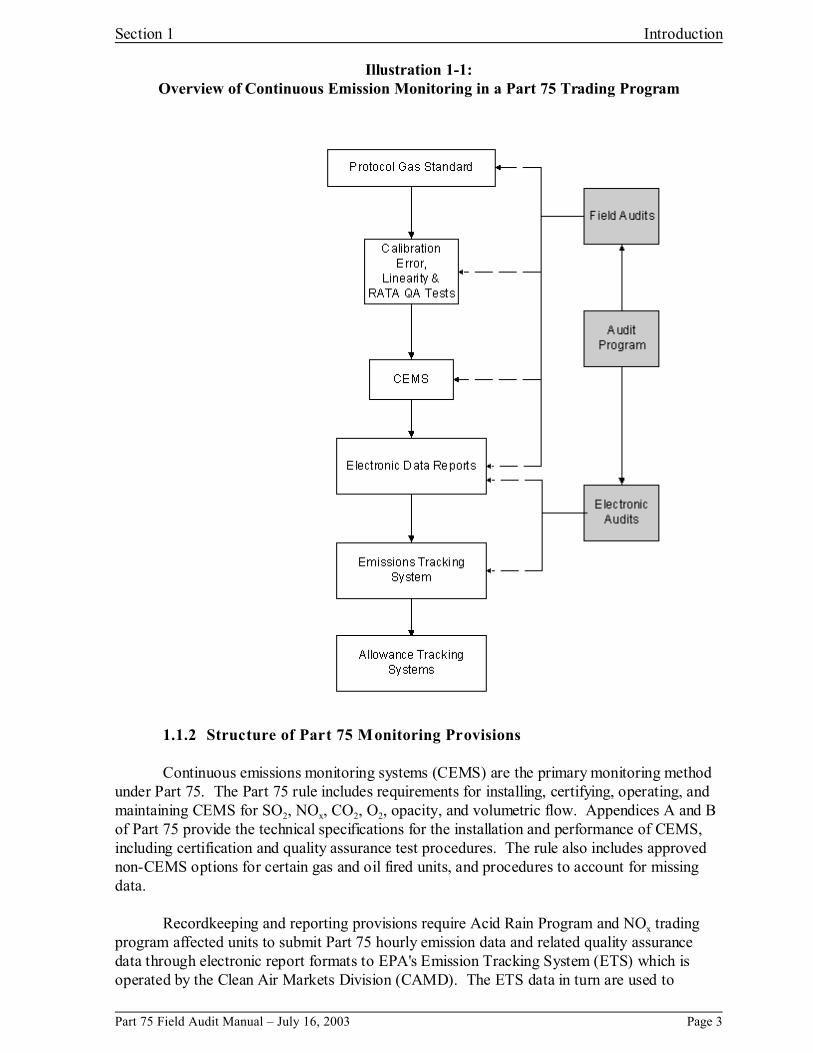
use of allowances in a trading program remain accurate Illustration 1-1 depicts the major links in the data quality chain for a continuous emissions monitoring system (CEMS) The process starts with ensuring that the gas standards used to calibrate and test the monitoring equipment are accurate EPA adopted the Traceability Protocol for Assay and Certification of Gaseous Calibration Standards for this purpose The source must conduct the necessary quality assurance tests following all appropriate procedures and report the results of those tests accurately These quality assurance activities are conducted initially for certification and then on an ongoing basis to maintain a measure of the systems ability to accurately determine emissions Once the data measurements are quality-assured the next step is to ensure that the measured data obtained from the CEM analyzer are accurately recorded by the data acquisition and handling system (DAHS) and appropriately reported in the quarterly electronic data reports (EDR) The EDRs are submitted quarterly to EPA so that it can review and account for the emissions data in the cap and trade program EPA provides the necessary data management systems to track emissions and allowance transfers
The integrity of the overall trading program can break down anywhere along this chain of activities therefore EPA relies on a combination of electronic and field auditing to verify overall data integrity The field audit procedures in this manual are critical for examining these links to verify proper performance of the monitoring systems and identify problems which may lead to inaccurate emissions accounting
Page 2 Part 75 Field Audit Manual ndash July 16 2003
Section 1 Introduction
Illustration 1-1Overview of Continuous Emission Monitoring in a Part 75 Trading Program
112 Structure of Part 75 Monitoring Provisions
Continuous emissions monitoring systems (CEMS) are the primary monitoring method under Part 75 The Part 75 rule includes requirements for installing certifying operating and maintaining CEMS for SO2 NOx CO2 O2 opacity and volumetric flow Appendices A and B of Part 75 provide the technical specifications for the installation and performance of CEMS including certification and quality assurance test procedures The rule also includes approved non-CEMS options for certain gas and oil fired units and procedures to account for missing data
Recordkeeping and reporting provisions require Acid Rain Program and NOx trading program affected units to submit Part 75 hourly emission data and related quality assurance data through electronic report formats to EPAs Emission Tracking System (ETS) which is operated by the Clean Air Markets Division (CAMD) The ETS data in turn are used to
Part 75 Field Audit Manual ndash July 16 2003 Page 3
Introduction Section 1
TIP
Check wwwepagovairmarkets for further regulatory information
maintain the emission allowance accounts in the Allowance Tracking System and the NOx
Allowance Tracking System
The Part 75 requirements are outlined below to introduce you to the rule and some of the terminology used in the manual can obtain copies of Part 75 and determine whether EPA has published further revisions to Part 75 issued new monitoring guidance or revised the information in this manual by checking CAMDs website ion 15 of the manual provides a list of important regulations and policy guidance documents with links to specific pages on CAMDs website you may find helpful
Monitoring Methods
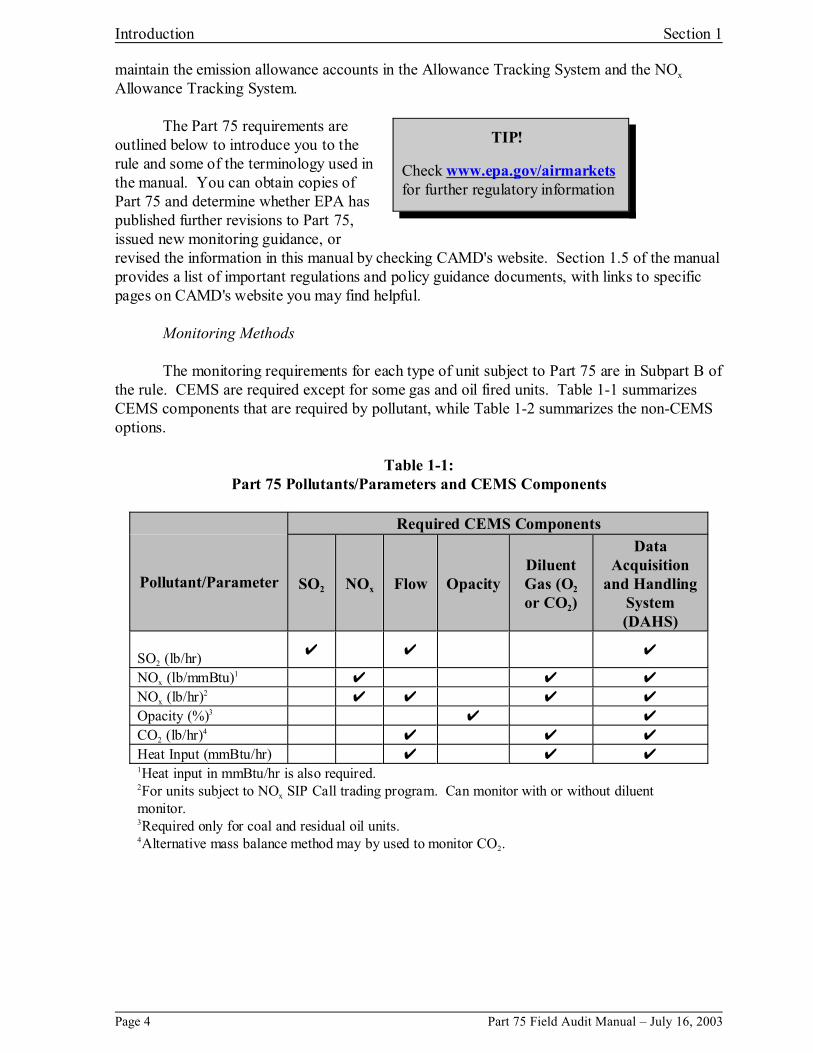
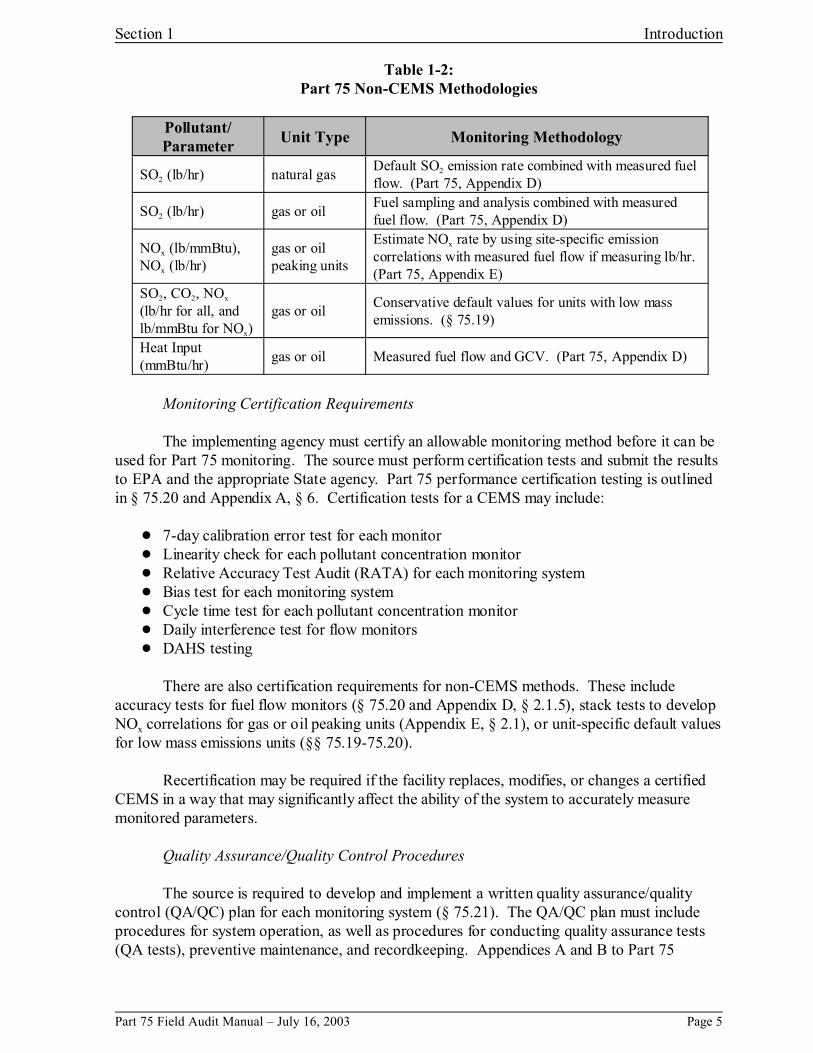
The monitoring requirements for each type of unit subject to Part 75 are in Subpart B of the rule red except for some gas and oil fired units e 1-1 summarizes CEMS components that are required by pollutant while Table 1-2 summarizes the non-CEMS options
Table 1-1 Part 75 PollutantsParameters and CEMS Components
PollutantParameter
Required CEMS Components
SO2 NOx Flow Opacity Diluent Gas (O2
or CO2)
Data Acquisition
and Handling System (DAHS)
SO2 (lbhr)
NOx (lbmmBtu)1 NOx (lbhr)2 Opacity ()3 CO2 (lbhr)4 Heat Input (mmBtuhr)
You
Sect
CEMS are requi Tabl
1Heat input in mmBtuhr is also required2For units subject to NOx SIP Call trading program Can monitor with or without diluentmonitor3Required only for coal and residual oil units4Alternative mass balance method may by used to monitor CO2
Page 4 Part 75 Field Audit Manual ndash July 16 2003
Section 1 Introduction
Table 1-2Part 75 Non-CEMS Methodologies
Pollutant Parameter
Unit Type Monitoring Methodology
SO2 (lbhr) natural gas Default SO2 emission rate combined with measured fuel flow (Part 75 Appendix D)
SO2 (lbhr) gas or oil Fuel sampling and analysis combined with measured fuel flow (Part 75 Appendix D)
NOx (lbmmBtu) NOx (lbhr)
gas or oil peaking units
Estimate NOx rate by using site-specific emission correlations with measured fuel flow if measuring lbhr (Part 75 Appendix E)
SO2 CO2 NOx
(lbhr for all and lbmmBtu for NOx)
gas or oil Conservative default values for units with low mass emissions (sect 7519)
Heat Input (mmBtuhr)
gas or oil Measured fuel flow and GCV (Part 75 Appendix D)
Monitoring Certification Requirements
The implementing agency must certify an allowable monitoring method before it can be used for Part 75 monitoring The source must perform certification tests and submit the results to EPA and the appropriate State agency Part 75 performance certification testing is outlined in sect 7520 and Appendix A sect 6 Certification tests for a CEMS may include
7-day calibration error test for each monitor Linearity check for each pollutant concentration monitor Relative Accuracy Test Audit (RATA) for each monitoring system Bias test for each monitoring system Cycle time test for each pollutant concentration monitor Daily interference test for flow monitors DAHS testing
There are also certification requirements for non-CEMS methods These include accuracy tests for fuel flow monitors (sect 7520 and Appendix D sect 215) stack tests to develop NOx correlations for gas or oil peaking units (Appendix E sect 21) or unit-specific default values for low mass emissions units (sectsect 7519-7520)
Recertification may be required if the facility replaces modifies or changes a certified CEMS in a way that may significantly affect the ability of the system to accurately measure monitored parameters
Quality AssuranceQuality Control Procedures
The source is required to develop and implement a written quality assurancequality control (QAQC) plan for each monitoring system (sect 7521) The QAQC plan must include procedures for system operation as well as procedures for conducting quality assurance tests (QA tests) preventive maintenance and recordkeeping Appendices A and B to Part 75
Part 75 Field Audit Manual ndash July 16 2003 Page 5
----
Introduction Section 1
describe the technical procedures for how and when to conduct periodic QA tests which include
Daily calibration error tests Challenge a gas CEMS at a zero and high level with calibration gas
Daily interference tests for flow monitors Follow procedure to detect plugging or other problems that could interfere with a flow monitor
Quarterly linearity tests Challenge a gas CEMS at 3 levels with calibration gases Quarterly flow-to-load evaluations Compare flow monitor values to values from an
initial flow-to-load correlation as a means to check flow monitor data quality over time Semi-annual or annual RATAs Compare monitored values to values measured by an
approved EPA reference method Also use RATA results to detect and if necessary adjust for low bias
Recordkeeping and Reporting
Part 75 includes requirements for notifications recordkeeping and reporting in Subparts F and G As noted earlier most of the reporting to EPA is done electronically every quarter in a standard electronic format and much of the recording will be done automatically using the DAHS Some important records and reporting that you will want to review include
Monitoring plan Submitted electronically although some information is submitted only in hardcopy Contains information describing the unit CEMS other monitoring methodologies and specific calculation procedures
Hourly parameters including emissions flow heat input monitor availability and other information
Periodic QA test results Recertification tests Other records that are required to be kept on-site such as
Annual spanrange evaluationSO2 scrubber parameters to verify proper control operation during a missing dataperiod
Missing Data
Part 75 requires sources to account for emissions during periods when there are no valid data (missing data periods) due to the monitor not operating or operating out of control The missing data methodologies are necessary so that a source accounts for emissions during each hour of operation The missing data algorithms become increasingly conservative as monitor downtime increases so that sources have an incentive to maintain high data availability
12 What does the manual cover
This manual details recommended procedures for conducting a field audit of a Part 75 monitoring system Included are tools you can use to prepare for an audit techniques you can use to conduct the on-site inspection and review records proper methods for observing performance tests and guidelines for preparing a final report EPA has designed the audit procedures in this document so that personnel with varying levels of experience can use them
Page 6 Part 75 Field Audit Manual ndash July 16 2003
Section 1 Introduction
While the manual is written primarily for State and local agency inspectors industry personnel may find some of the material useful for their internal data quality management activities
The manual covers gas (SO2 NOx and diluent) and flow monitoring systems -- it does not cover opacity monitor audits Although Part 75 requires opacity monitors for coal-fired units subject to the Acid Rain Program opacity data and quality assurance tests are not reported to CAMD in quarterly emission data reports Moreover the source can comply with Part 75 by satisfying performance specifications in Part 60 that are generally applicable to opacity monitors and can follow a States recording and reporting requirements Thus there are no special Part 75 audit techniques for these systems
The manual is organized into eight major sections with one appendix
Section 1 introduces cap and trade programs Part 75 the role of field audits and the inspector CAMDs audit targeting role the importance of inspector training and a list of key Part 75 materials with Internet links
Section 2 provides a short introduction to the various types of CEMS and the major components of a CEMS including basic installation and operating principles
Section 3 describes preparing for an audit prior to the plant visit with emphasis on using CAMDs Monitoring Data Checking (MDC) software to review the electronic data
Section 4 covers the on-site CEMS inspection including what to look for and questions to ask during a walk through of CEMS components as well as how to review the QAQC plan and other in-plant records
Section 5 describes how to observe CEMS performance tests (linearity and relative accuracy test audits)
Section 6 outlines specific on-site review procedures for Appendix D and E monitoring systems and records
Section 7 guides you in conducting the exit interview and preparing a written audit report
Section 8 discusses issues that should be considered by a State or local agency in developing a performance testing program with an emphasis on single gas challenges and linearity tests
Appendix A to the Manual provides sample checklists for the field audit RATA and linearity observations The checklists are based on the discussions and techniques in Sections 3 through 6
Part 75 Field Audit Manual ndash July 16 2003 Page 7
Introduction Section 1
13 Part 75 Audit Program Overview
The Part 75 audit program consists of both electronic audits and field audits CAMD uses automated tools such as the Monitoring Data Checking (MDC) system to conduct automated checks of data submitted under Part 75 for potential problems Also it uses its data systems and its ability to check data through automated information systems to target units for follow-up data audits On-site field audits performed to ensure that monitoring systems are installed and operated properly are also essential in the Part 75 audit program
131 Part 75 Electronic Audit Program
CAMD performs routine electronic audits on each quarterly report submittal using the ETS and MDC software EPA may also perform targeted electronic checks to find other specific data reporting problems The electronic audits identify errors in the quarterly electronic data report the monitoring plan and the QA tests An automated ETS feedback report that focuses on the reported emissions data is sent to the source instantly upon electronic submittal by ETS EPA then uses MDC to analyze the monitoring plan and QA data and sends an MDC feedback report at the end of the quarterly submission period The reports categorize errors as critical and non-critical -- for critical errors the source must correct and resubmit the quarterly report
132 Audit Targeting
In addition to performing electronic audits EPA periodically compiles a recommended field audit target list based on a review of all of the quarterly electronic data reports This national list attempts to identify trends based on a large population of units that may not be identifiable from a smaller population at the State level alone The target list is intended to help States allocate their auditing resources on those units that are most likely to have data problems based on the findings of EPAs electronic auditing efforts States may use these recommendations to focus their audit efforts but may also choose other units for field audits through State targeting approaches or at random
133 Field Audits
EPA relies on State and local agencies to conduct field audits of monitoring systems to assess the systems performance and a sources compliance with monitoring requirements The audits also encourage good monitoring practices by raising plant awareness of monitoring requirements The field audit consists of a thorough evaluation of the CEMS via pre-audit record review on-site inspection of equipment and system peripherals record reviews test observations and interviews with the appropriate plant personnel
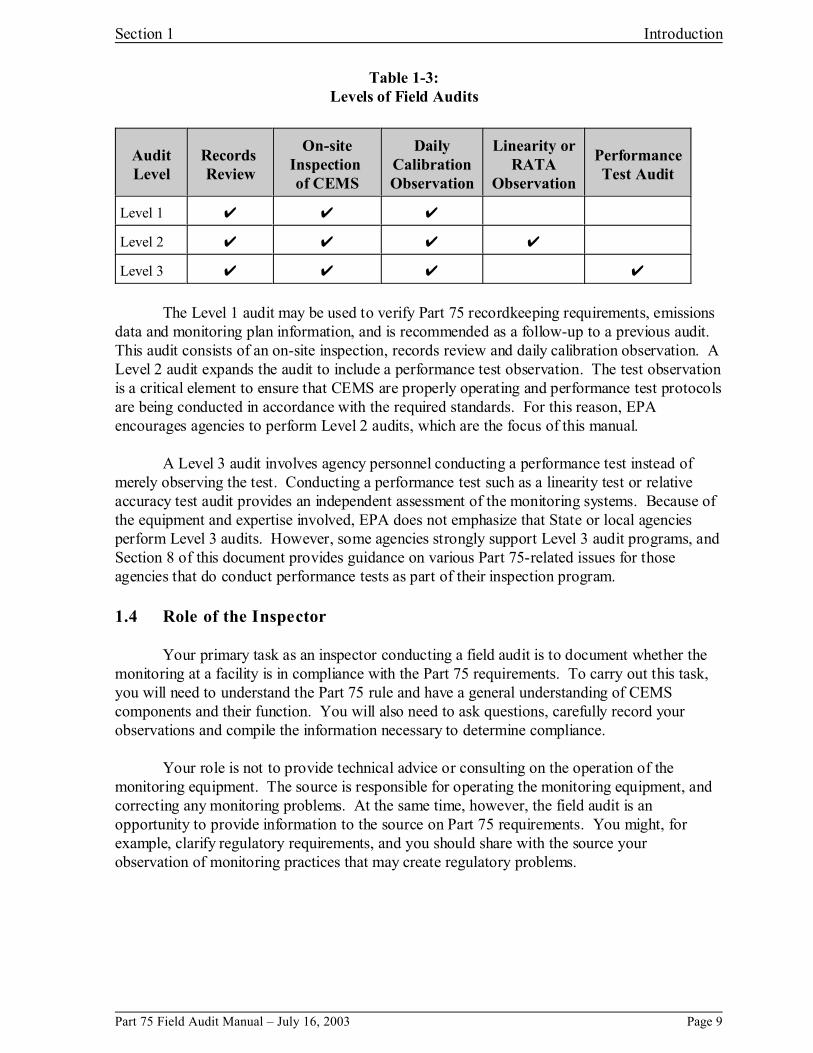
EPA has defined three levels (see Table 1-3) to describe field audit activities and procedures and the objective of the audit
Page 8 Part 75 Field Audit Manual ndash July 16 2003
Section 1 Introduction
Table 1-3 Levels of Field Audits
Audit Level
Records Review
On-site Inspection of CEMS
Daily Calibration Observation
Linearity or RATA
Observation
Performance Test Audit
Level 1
Level 2
Level 3
The Level 1 audit may be used to verify Part 75 recordkeeping requirements emissions data and monitoring plan information and is recommended as a follow-up to a previous audit This audit consists of an on-site inspection records review and daily calibration observation A Level 2 audit expands the audit to include a performance test observation The test observation is a critical element to ensure that CEMS are properly operating and performance test protocols are being conducted in accordance with the required standards For this reason EPA encourages agencies to perform Level 2 audits which are the focus of this manual
A Level 3 audit involves agency personnel conducting a performance test instead of merely observing the test Conducting a performance test such as a linearity test or relative accuracy test audit provides an independent assessment of the monitoring systems Because of the equipment and expertise involved EPA does not emphasize that State or local agencies perform Level 3 audits However some agencies strongly support Level 3 audit programs and Section 8 of this document provides guidance on various Part 75-related issues for those agencies that do conduct performance tests as part of their inspection program
14 Role of the Inspector
Your primary task as an inspector conducting a field audit is to document whether the monitoring at a facility is in compliance with the Part 75 requirements To carry out this task you will need to understand the Part 75 rule and have a general understanding of CEMS components and their function You will also need to ask questions carefully record your observations and compile the information necessary to determine compliance
Your role is not to provide technical advice or consulting on the operation of the monitoring equipment The source is responsible for operating the monitoring equipment and correcting any monitoring problems At the same time however the field audit is an opportunity to provide information to the source on Part 75 requirements You might for example clarify regulatory requirements and you should share with the source your observation of monitoring practices that may create regulatory problems
Part 75 Field Audit Manual ndash July 16 2003 Page 9
Introduction Section 1
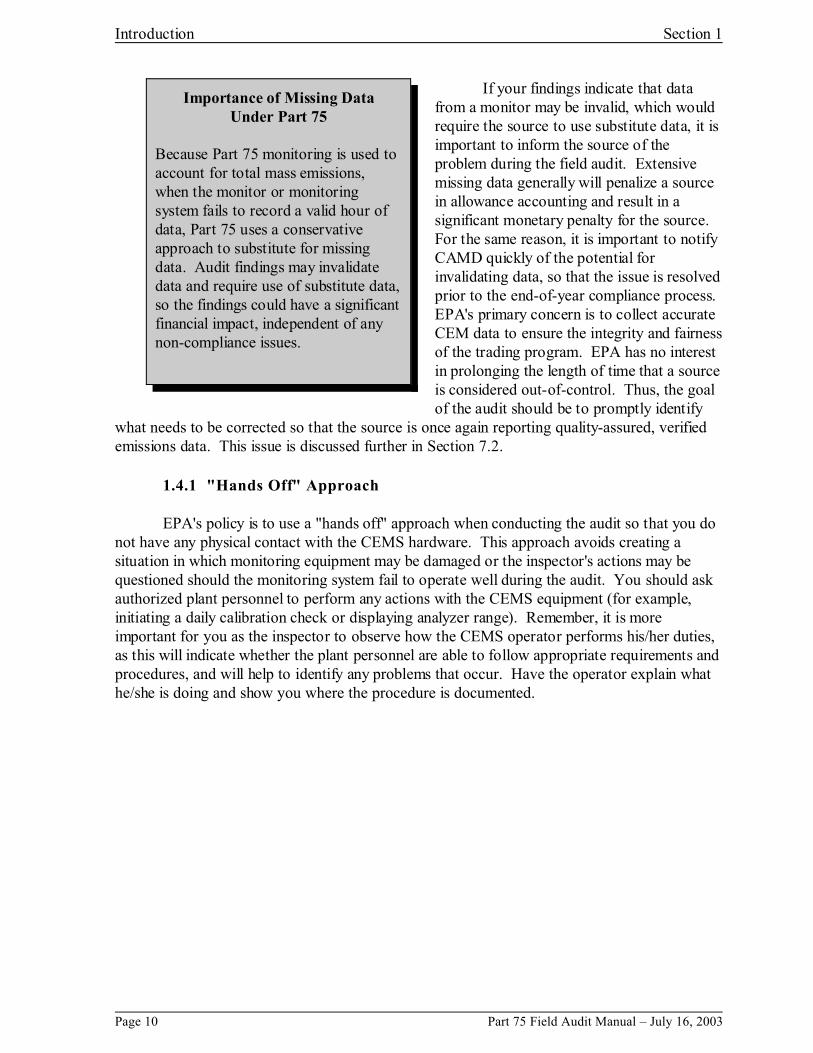
Importance of Missing Data Under Part 75
Because Part 75 monitoring is used to account for total mass emissions when the monitor or monitoring system fails to record a valid hour of data Part 75 uses a conservative approach to substitute for missing data Audit findings may invalidate data and require use of substitute data so the findings could have a significant financial impact independent of any non-compliance issues
If your findings indicate that data from a monitor may be invalid which would require the source to use substitute data it is important to inform the source of the problem during the field audit Extensive missing data generally will penalize a source in allowance accounting and result in a significant monetary penalty for the source For the same reason it is important to notify CAMD quickly of the potential for invalidating data so that the issue is resolved prior to the end-of-year compliance process EPAs primary concern is to collect accurate CEM data to ensure the integrity and fairness of the trading program EPA has no interest in prolonging the length of time that a source is considered out-of-control Thus the goal of the audit should be to promptly identify
what needs to be corrected so that the source is once again reporting quality-assured verified emissions data This issue is discussed further in Section 72
141 Hands Off Approach
EPAs policy is to use a hands off approach when conducting the audit so that you do not have any physical contact with the CEMS hardware This approach avoids creating a situation in which monitoring equipment may be damaged or the inspectors actions may be questioned should the monitoring system fail to operate well during the audit You should ask authorized plant personnel to perform any actions with the CEMS equipment (for example initiating a daily calibration check or displaying analyzer range) Remember it is more important for you as the inspector to observe how the CEMS operator performs hisher duties as this will indicate whether the plant personnel are able to follow appropriate requirements and procedures and will help to identify any problems that occur Have the operator explain what heshe is doing and show you where the procedure is documented
Page 10 Part 75 Field Audit Manual ndash July 16 2003
Section 1 Introduction
142 Inspection Safety
Any type of air pollution source inspection has potential health and safety problems and inspection safety is a serious concern Appropriate safety training is imperative for all inspectors and each plant may have specialized training andor safety equipment policies Before going on site for an audit you must ensure that you have all necessary personal safety equipment Also make sure to contact the site and ask for details on plant safety requirements Once on site use the safety equipment properly adhere to your agencys safety requirements and follow plant safety requirements as well Some of the hazards you may encounter in performing CEMS audits include
Accessing CEMS equipment or platforms and working at elevations with fall hazards Electrical shock when inspecting heated lines pumps or internal areas of CEMS
cabinets and enclosures Hazards associated with use or transport of compressed gas cylinders Hazards associated with poisonous calibration gases (NO) Exposure to effluent gases Entry of confined spaces Typical hazards associated with working in an industrial environment (moving
equipment vehicles and machinery trip and fall hazards etc)
143 Recommended Training
Courses
The following table lists EPA classes that you may find helpful in developing a knowledge base for performing Part 75 CEMS field audits at stationary sources State agencies
Air Pollution Training Institute
Information on EPA courses and course schedules are available at EPAs AIR Pollution Training Institute website httpwwwepagovairoaqpseogaptihtml
regional organizations or university professional development programs may provide similar courses in your area
Part 75 Field Audit Manual ndash July 16 2003 Page 11
Introduction Section 1
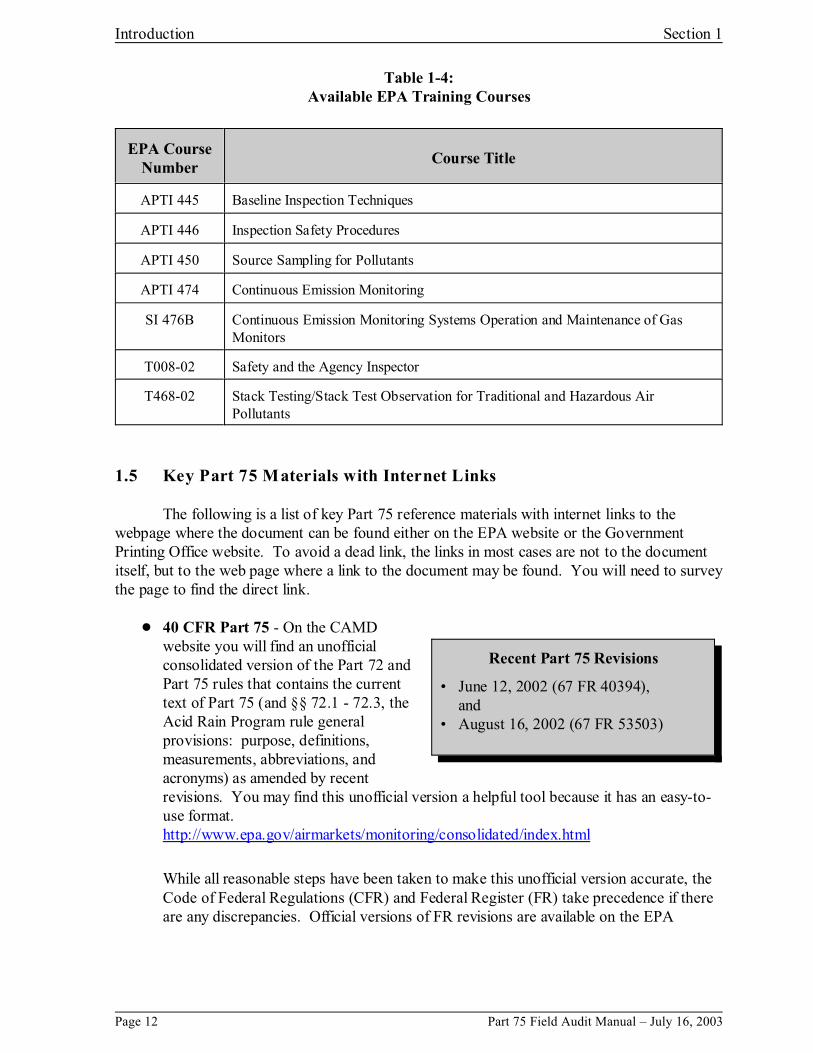
Table 1-4Available EPA Training Courses
EPA Course Number
Course Title
APTI 445 Baseline Inspection Techniques
APTI 446 Inspection Safety Procedures
APTI 450 Source Sampling for Pollutants
APTI 474 Continuous Emission Monitoring
SI 476B Continuous Emission Monitoring Systems Operation and Maintenance of Gas Monitors
T008-02 Safety and the Agency Inspector
T468-02 Stack TestingStack Test Observation for Traditional and Hazardous Air Pollutants
15 Key Part 75 M aterials with Internet Links
The following is a list of key Part 75 reference materials with internet links to the webpage where the document can be found either on the EPA website or the Government Printing Office website To avoid a dead link the links in most cases are not to the document itself but to the web page where a link to the document may be found l need to survey the page to find the direct link
40 CFR Part 75 - On the CAMD website you will find an unofficial consolidated version of the Part 72 and Part 75 rules that contains the current text of Part 75 (and sectsect 721 - 723 the Acid Rain Program rule general provisions efinitions measurements abbreviations and acronyms) as amended by recent revisions may find this unofficial version a helpful tool because it has an easy-to-
Recent Part 75 Revisions
bull June 12 2002 (67 FR 40394) and
bull August 16 2002 (67 FR 53503)
You wil
purpose d
Youuse format httpwwwepagovairmarketsmonitoringconsolidatedindexhtml
While all reasonable steps have been taken to make this unofficial version accurate the Code of Federal Regulations (CFR) and Federal Register (FR) take precedence if there are any discrepancies Official versions of FR revisions are available on the EPA
Page 12 Part 75 Field Audit Manual ndash July 16 2003
Section 1 Introduction
website httpwwwepagovfedrgstr and the official CFR is available at the Government Printing Office website httpwwwaccessgpogovnaracfrcfrhtml_00Title_4040cfr75_00html
Electronic Data Report Version 22 Reporting Instructions - The instruction manual describes each data field element for the information that is recorded and reported to EPA for Part 75 and provides the field auditor with a helpful summary of Part 75 requirements The EDR v22 Instructions support the June 12 2002 revised Part 75 rule httpwwwepagovairmarketsmonitoring
Parts 75 and 76 Policy Manual - This manual contains a series of questions and answers that can be used on a nationwide basis to ensure that the Part 75 provisions are applied consistently for all sources affected by the rule It is intended to be a living document EPA will issue new questions and answers as they arise and will revise previously issued questions and answers as necessary to provide clarification EPA intends to release a revised verison of the manual in 2003 httpwwwepagovairmarketsmonitoringpolmanindexhtml
Recertification and Diagnostic Testing Policy - Recertification is required whenever a replacement modification or change in the certified continuous emissions monitoring system or continuous opacity monitoring system occurs that may significantly affect the systems ability to accurately measure or record the pollutant or parameter of interest EPA is preparing a document to clarify what types of changes to a monitoring system may be considered significant EPA expects that the document will describe various events as either recertification events or diagnostic testing events and describe the type of certification or diagnostic testing that needs to be performed You should check the wwwepagovairmarkets website for release of this policy
Monitoring Data Checking (MDC) Software - The MDC software discussed in Section 3 of this manual allows regulated industry and State agencies to enter analyze print and export electronic monitoring plan certification and quality assurance data and to evaluate hourly emissions data required by Part 75 The software also allows regulated sources to submit electronically monitoring plan and certification data to EPA via ftp The software provides a standard Windows-based mouse-driven point and click user interface and can be installed under Windows 95 (or higher) Windows NT or Windows 2000 The software and installation instructions can be downloaded from the CAMD website httpwwwepagovairmarketsmonitoringmdc
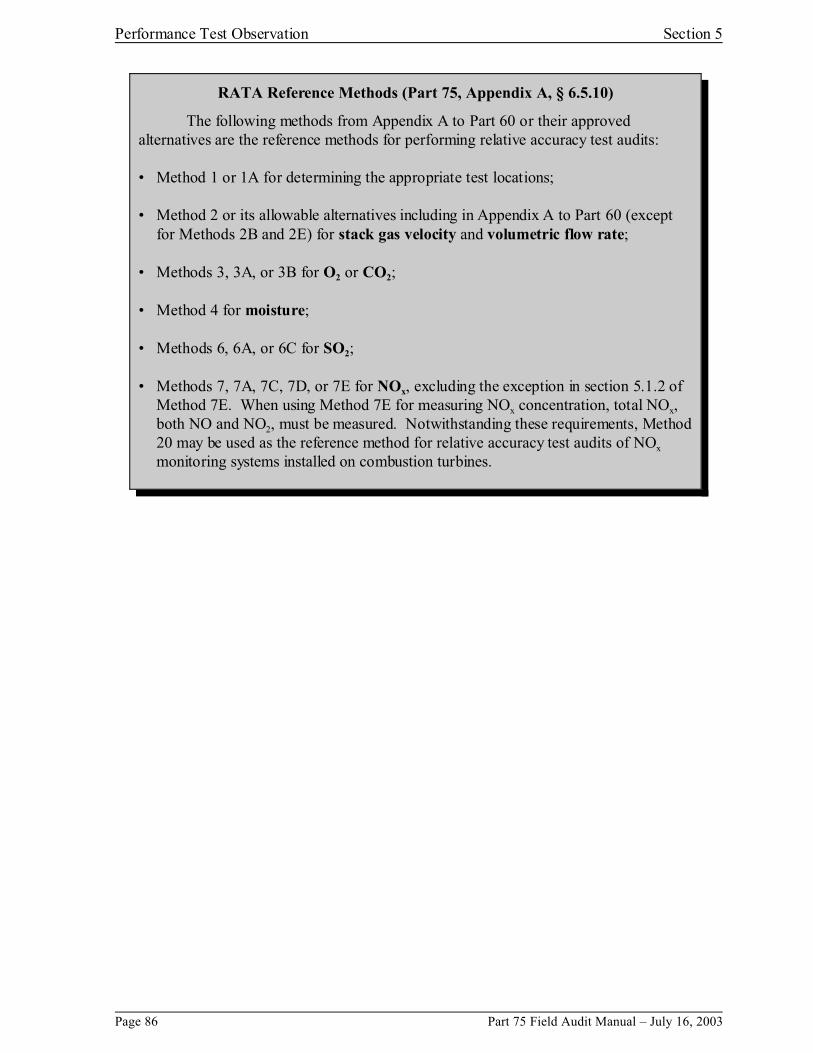
40 CFR Part 60 Appendix A Reference Methods - The RATA reference methods (and related information) are available from EPAs Emission Measurement Center website The website versions of the reference methods are the official CFR version httpwwwepagovttnemcpromgatehtml
Part 75 Field Audit Manual ndash July 16 2003 Page 13
Introduction Section 1
An Operators Guide to Eliminating Bias in CEM Systems - This EPA publication is designed for CEMS operators as a tool for diagnosing and correcting the causes of measurement bias in CEMS It is also a useful CEMS reference guide for the field auditor httpwwwepagovairmarketsmonitoring
Observers Checklists for Test Methods 2F 2G and 2H - These are detailed observer checklists that can be used when observing a flow RATA using one of these alternative flow reference methods httpwwwepagovairmarketsmonitoring
Page 14 Part 75 Field Audit Manual ndash July 16 2003
Section 2 Part 75 CEMS Overview
This section provides a brief introduction to the various types of components of continuous emission monitoring systems that facilities have installed to meet Part 75 requirements
21 Introduction
The monitoring requirements of Part 75 are performance-based requirements that generally do not require that a source use a particular type of CEMS There are several types of CEMS available The differences in how these systems are designed and operate (in terms of sample acquisition sample handling sample analysis and data recording) can be important in understanding what to look for in a field audit and how to interpret audit results
This section provides only an overview of the major concepts related to the types of CEMS and their principles of operation For further detail on these complex systems see Section 27 which provides a list of in-depth references EPA recommends that inspectors who will conduct Part 75 CEMS audits should attend EPAs Air Pollution Training Institute course on CEMS (APTI Course 474) The summary information in this section draws heavily from the manual for that course (Jahnke 1992) as well as from an EPA reference manual specifically tailored to Part 75 CEMS (Gschwandtner and Winkler 2001)
All CEMS perform the following basic functions
Locate or extract a representative sample
Analyze the sample and
Compile and record the results
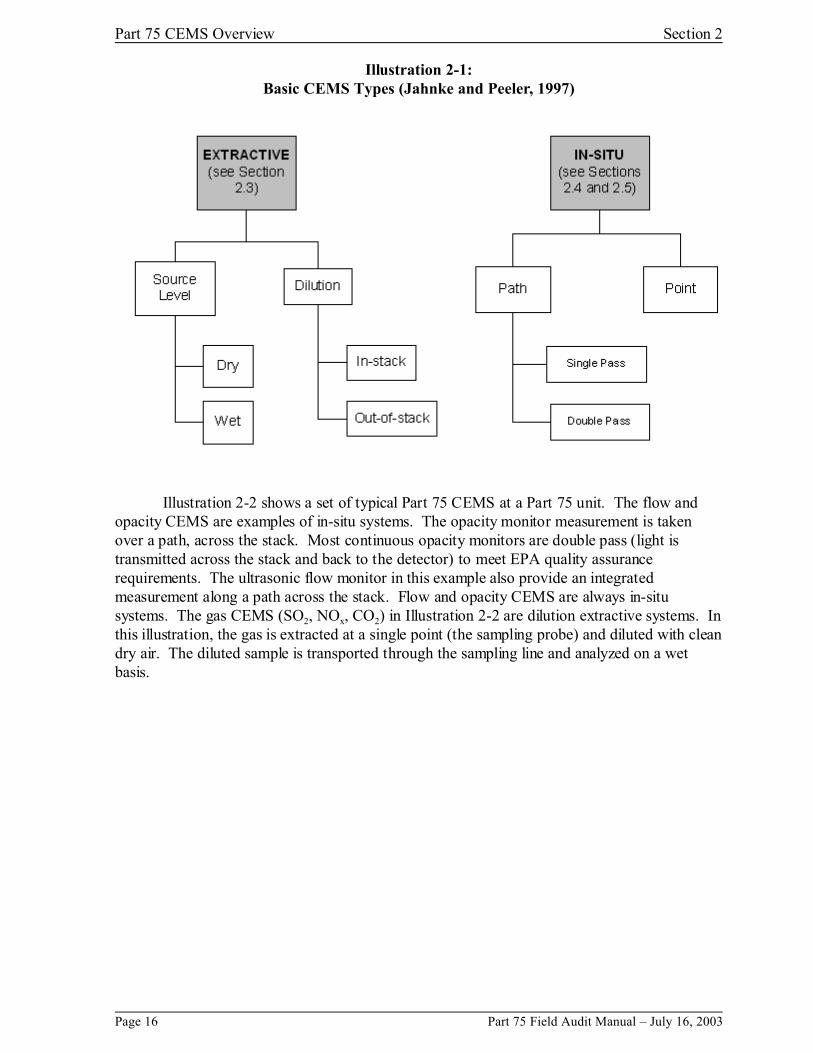
CEMS are divided into two types based on the first of these basic functions An extractive system removes and transports the sample from the stack to the analyzer often conditioning the sample prior to the analyzer An in-situ system analyzes the sample directly in the stack Illustration 2-1 identifies these two main system types There are several variations on these types which Sections 23 through 25 review
Part 75 Field Audit Manual ndash July 16 2003 Page 15
Part 75 CEMS Overview Section 2
Illustration 2-1Basic CEMS Types (Jahnke and Peeler 1997)
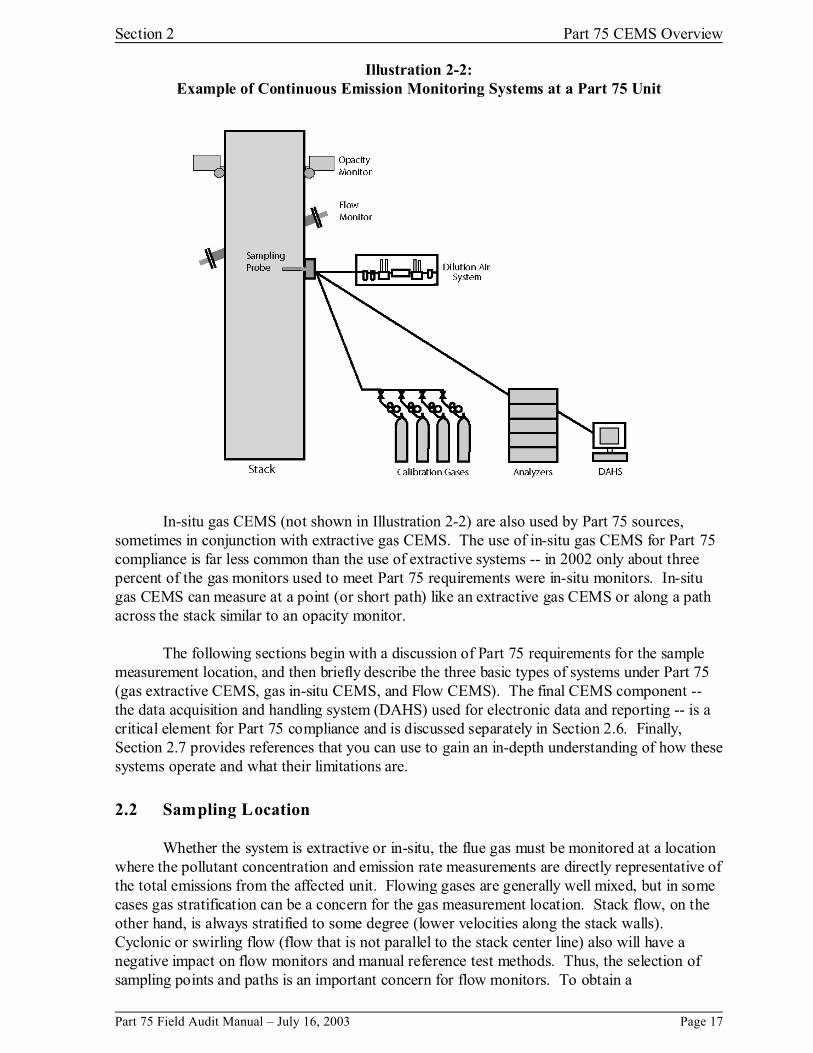
Illustration 2-2 shows a set of typical Part 75 CEMS at a Part 75 unit The flow and opacity CEMS are examples of in-situ systems The opacity monitor measurement is taken over a path across the stack Most continuous opacity monitors are double pass (light is transmitted across the stack and back to the detector) to meet EPA quality assurance requirements The ultrasonic flow monitor in this example also provide an integrated measurement along a path across the stack Flow and opacity CEMS are always in-situ systems The gas CEMS (SO2 NOx CO2) in Illustration 2-2 are dilution extractive systems In this illustration the gas is extracted at a single point (the sampling probe) and diluted with clean dry air The diluted sample is transported through the sampling line and analyzed on a wet basis
Page 16 Part 75 Field Audit Manual ndash July 16 2003
Section 2 Part 75 CEMS Overview
Illustration 2-2Example of Continuous Emission Monitoring Systems at a Part 75 Unit
In-situ gas CEMS (not shown in Illustration 2-2) are also used by Part 75 sources sometimes in conjunction with extractive gas CEMS The use of in-situ gas CEMS for Part 75 compliance is far less common than the use of extractive systems -- in 2002 only about three percent of the gas monitors used to meet Part 75 requirements were in-situ monitors In-situ gas CEMS can measure at a point (or short path) like an extractive gas CEMS or along a path across the stack similar to an opacity monitor
The following sections begin with a discussion of Part 75 requirements for the sample measurement location and then briefly describe the three basic types of systems under Part 75 (gas extractive CEMS gas in-situ CEMS and Flow CEMS) The final CEMS component --the data acquisition and handling system (DAHS) used for electronic data and reporting -- is a critical element for Part 75 compliance and is discussed separately in Section 26 Finally Section 27 provides references that you can use to gain an in-depth understanding of how these systems operate and what their limitations are
22 Sampling Location
Whether the system is extractive or in-situ the flue gas must be monitored at a location where the pollutant concentration and emission rate measurements are directly representative of the total emissions from the affected unit Flowing gases are generally well mixed but in some cases gas stratification can be a concern for the gas measurement location Stack flow on the other hand is always stratified to some degree (lower velocities along the stack walls) Cyclonic or swirling flow (flow that is not parallel to the stack center line) also will have a negative impact on flow monitors and manual reference test methods Thus the selection of sampling points and paths is an important concern for flow monitors To obtain a
Part 75 Field Audit Manual ndash July 16 2003 Page 17
Part 75 CEMS Overview Section 2
representative measurement and avoid problems due to stratification and cyclonic flow Part 75 provides specific requirements for the CEMS sampling location in Appendix A sect 1
221 Gas Measurement Location
Part 75 requires that the representative sampling location be chosen based on the procedures in 40 CFR Part 60 Appendix B Performance Specification 2 which suggests a measurement location (1) at least two equivalent diameters downstream from the nearest control device the point of pollutant generation or at another point at which a change in pollutant concentration or rate may occur and (2) at least a half equivalent diameter upstream from the effluent exhaust or control device Other Part 75 location requirements from Appendix A are summarized below
Locate the measurement location so that the gas CEMS (pollutant and diluent monitor) passes the certification RATA (Note - while not required specifically the diluent O2 or CO2 monitor should sample at the same point as the pollutant monitor)
Point Monitors - Locate the measurement point (1) within the centroidal area of the stack or duct cross section or (2) no less than 10 meter from the stack or duct wall
Path Monitors - Locate the measurement path (1) totally within the inner area bounded by a line 10 meter from the stack or duct wall or (2) such that at least 700 percent of the path is within the inner 500 percent of the stack or duct cross-sectional area or (3) such that the path is centrally located within any part of the centroidal area
222 Flow Measurement Location
Part 75 establishes the following basic location criteria for flow monitors
The location satisfies the minimum siting criteria of Part 60 Appendix A Method 1 (ie the location is greater than or equal to eight stack or duct diameters downstream and two diameters upstream from a flow disturbance or if necessary two stack or duct diameters downstream and one-half stack or duct diameter upstream from a flow disturbance) or
The results of a flow profile study if performed are acceptable (ie there are no cyclonic (or swirling) or unacceptable stratified flow conditions) Part 75 recommends that if a flow profile study indicates unacceptable results the facility should relocate the monitor or add straightening vanes or other source modifications to correct the flow patterns
Regardless of whether these criteria are met a flow monitor can be installed in any location if the flow CEMS can meet the Part 75 performance specification requirements
223 Sampling in Stratified and Swirling Flow Conditions
Stack flow is seldom ideal and some degree of stratification and swirling flow will be present at the monitoring location Approaches to dealing with stratification swirling or cyclonic flow and changing flow profiles due to load changes are discussed below
Page 18 Part 75 Field Audit Manual ndash July 16 2003
Section 2 Part 75 CEMS Overview
Stratified Flow - Flow monitoring systems may locate a single point or path representative of the reference method determined stack flow if the stratification is fairly constant over varying loads If stratification varies with load an array of sampling points can be placed across the stack to obtain a flow average instead of one single sample point For a path monitoring system that is already averaging over a line across the stack the source can select a path that is not as sensitive to the variation or can add a monitor to provide multiple paths on the cross section
Correction Factors - Part 75 allows the source to calibrate the flow monitor to the reference method flow (pre-RATA) Sources commonly use this approach to enable a flow CEMS to pass the multi-load flow RATA at a particular measurement location A flow RATA typically is performed at three loads to account for different flow profiles at changing loads The options described above for stratified flow can include application of a correction factor for stratification based on the reference method RATA values If the source conducts a test using new Methods 2F 2G or 2H (developed to account for non-parallel flow conditions and wall effects on flow measurement) calibrating to the reference method also can account for effects due to swirling Method 2 using the s-type pitot tube will be subject to bias if swirling or stratification due to wall effects or other factors are present Calibration of flow monitors relative to Method 2 under such conditions will not account for those effects
23 Extractive Gas CEMS
There are two types of extractive gas CEMS
The source level or direct extractive system extracts gas from the stack and conveys the sample to one or more analyzers These extractive systems will include filters to remove particulates and may include conditioning to remove moisture acids condensible particulates and interfering compounds In the case of a hot wet system the sample lines and analytic components of the systems are heated to prevent condensation of the stack moisture Heated lines are also required for dry systems up to the point where conditioning occurs
A dilution extractive system filters the stack sample and dilutes the stack sample with clean dry air Dilution occurs either inside the sample probe in the stack or outside of the stack usually at the stack port Dilution systems sample the gas at flow rates much smaller than those used in source level systems Using dry air to dilute the flue gas at ratios of 501 to 3001 the dew point of the diluted sample is reduced to levels where condensation will not occur in the monitoring system As a result moisture removal systems and heated sample lines may not be incorporated into the system A dilution air cleaning system however is required to clean the dilution air and remove CO2 water and any traces of the gases that are to be monitored
231 Source Level or Direct Extractive Systems
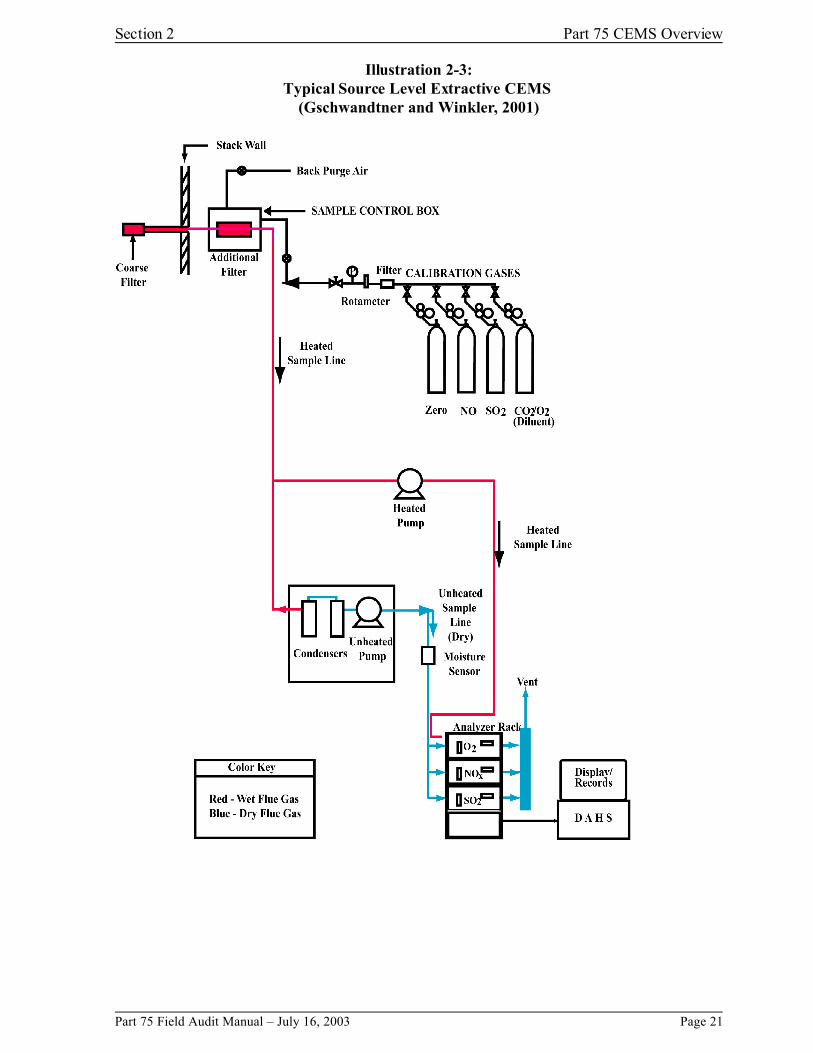
A diagram of a source level extractive system is shown in Illustration 2-3 The illustration shows both wet (heated sampling line by-passing the conditioning system) and dry systems
Part 75 Field Audit Manual ndash July 16 2003 Page 19
Part 75 CEMS Overview Section 2
2311 Sample Probe
Probes for source level extractive systems are constructed with stainless steel or Hastelloyreg tubes A coarse filter is commonly attached at the end of the probe to filter out particulate matter before it can enter into the tube Some designs place a deflector plate or cylindrical sheath around the filter to provide protection from plugging A coarse filter can also be in-line in a housing outside of the stack prior to the sample line Sometimes a combination of filters a coarse filter at the probe opening and an in-line fine filter outside of the stack are used to ensure the removal of particulate matter
Blowback or back purging is frequently used to keep the coarse filter from plugging This involves blowing pressurized air or steam back through the filter in an opposite direction to the normal stack flow The blowback occurs at regular intervals (typically from 15 minutes to 8 hours) and typically lasts for 5 to 10 seconds
Page 20 Part 75 Field Audit Manual ndash July 16 2003
Section 2 Part 75 CEMS Overview
Illustration 2-3 Typical Source Level Extractive CEMS
(Gschwandtner and Winkler 2001)
Part 75 Field Audit Manual ndash July 16 2003 Page 21
Part 75 CEMS Overview Section 2
2312 Sample Transport and Conditioning Systems
Most source level extractive systems used in Part 75 applications are dry systems which remove moisture prior to the sample pump and analyzer In a dry system the sample line from the probe to the moisture removal system is heated to prevent water condensation If the facility uses a wet system that does not remove moisture prior to the analyzer the entire length of the sample line sample pump and analyzer must be heated The sample line is usually wrapped in a tube bundle or umbilical which includes the sample lines blowback lines calibration gas lines heating elements and electric lines
Dry source level CEMS used in conjunction with a flow CEMS for Part 75 SO2 NOx
and CO2 mass measurements must also determine the moisture content of the stack gas Illustration 2-3 shows a heated wet sample line connected to a wet O2 analyzer This wet system is used in conjunction with the dry systems dry O2 analyzer to determine moisture Another alternative is to use an in-situ wet O2 analyzer with the dry extractive O2 analyzer A less common approach is to use an H2O analyzer to measure the wet sample
Moisture Removal Systems
There are two common types of moisture removal systems condensers and permeation dryers Condensers cool the gas below the dew point (using refrigerated coils or cooled jet stream condensers) and then remove the condensed liquid water from the gas stream Water removal is performed automatically to prevent filling the condensate trap and flooding the sampling line Absorption of SO2 and NO2 in the condensate is a concern so systems are designed to minimize contact time between the dried gas and liquid
Permeation dryers are constructed using Nafionreg a material that selectively allows the mass transfer of water vapor from the sample gas through the tube membrane to dry purge gas flowing in an outer tube in the opposite direction The gas entering the permeation dryer must be heated above the dew point temperature Permeation dryers avoid the problems of condensate absorption of pollutants and do not have condensate traps However the dryers can be subject to plugging problems from condensing liquids particulates or precipitates
Pumps
Diaphragm pumps and ejector pumps are the most common pumps used in extractive systems Both operate without pump lubricating oils which can cause sample contamination Both diaphragm pumps and ejector pumps can be heated and used in a hot wet system or used ahead of a conditioning system
Fine filter
Many analyzers require removal of particulate larger than 05 m so systems will usually have an additional fine filter near the analyzer inlet There are two types (1) a surface filter usually paper or other porous material which builds up a filter cake and (2) a depth filter which consists of packed fibers of quartz wool or other material
Page 22 Part 75 Field Audit Manual ndash July 16 2003
Section 2 Part 75 CEMS Overview
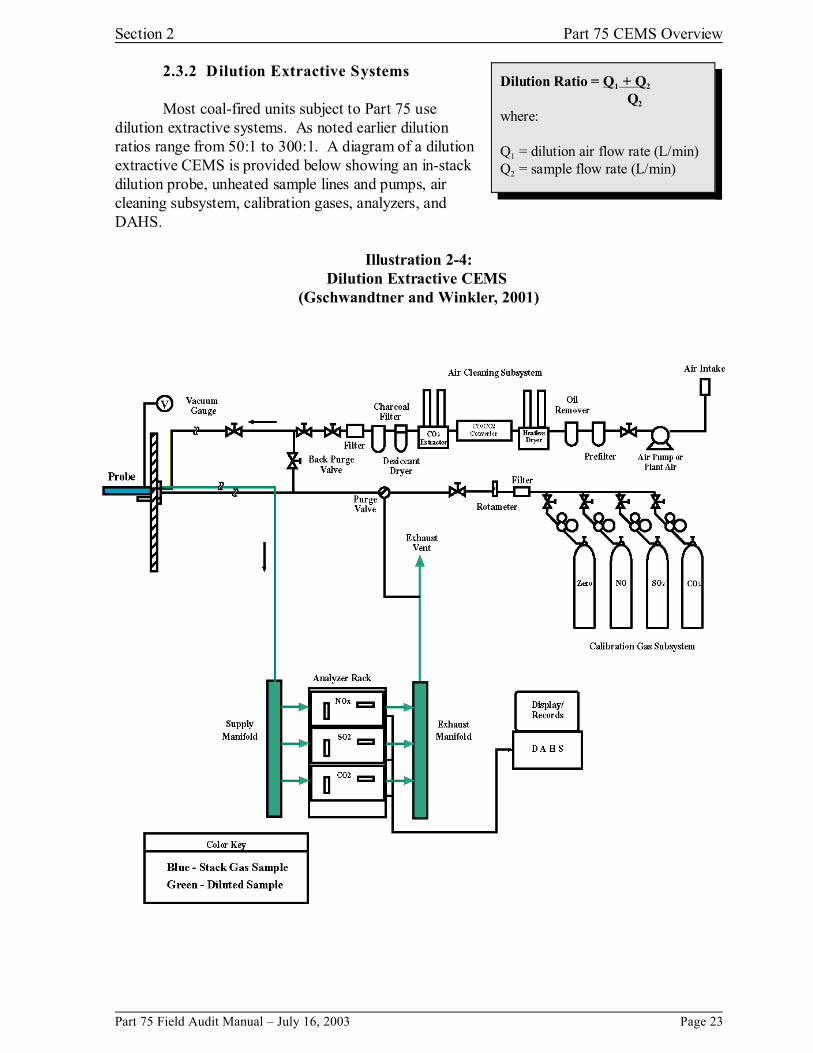
232 Dilution Extractive Systems
Most coal-fired units subject to Part 75 use dilution extractive systems As noted earlier dilution ratios range from 501 to 3001 A diagram of a dilution extractive CEMS is provided below showing an in-stack dilution probe unheated sample lines and pumps air cleaning subsystem calibration gases analyzers and DAHS
Illustration 2-4
Dilution Ratio = Q1 + Q2
Q2
where
Q1 = dilution air flow rate (Lmin) Q2 = sample flow rate (Lmin)
Dilution Extractive CEMS (Gschwandtner and Winkler 2001)
Part 75 Field Audit Manual ndash July 16 2003 Page 23
Part 75 CEMS Overview Section 2
The dilution of the sample can occur in the stack using a dilution probe or outside the stack using an out-of-stack dilution system Both approaches use the same operating principles A critical orifice controls the sample gas flow rate which is drawn through the orifice by creating a vacuum at the outlet of the orifice with an ejector pump As long as a sufficient vacuum is present the sample gas flow rate through the critical orifice is independent of the downstream pressure The ejector pump also called an aspirator or an eductor pump is operated by the compressed dry clean dilution air The dilution air flow through the venturi nozzle of the pump (flow rates of 1 to 10 Lmin) creates the vacuum pressure at the orifice outlet This vacuum pulls the gas sample through the orifice at rates of 50 to 500 mLmin (limited by the orifice design) and into the ejector pump where it mixes with the dilution air
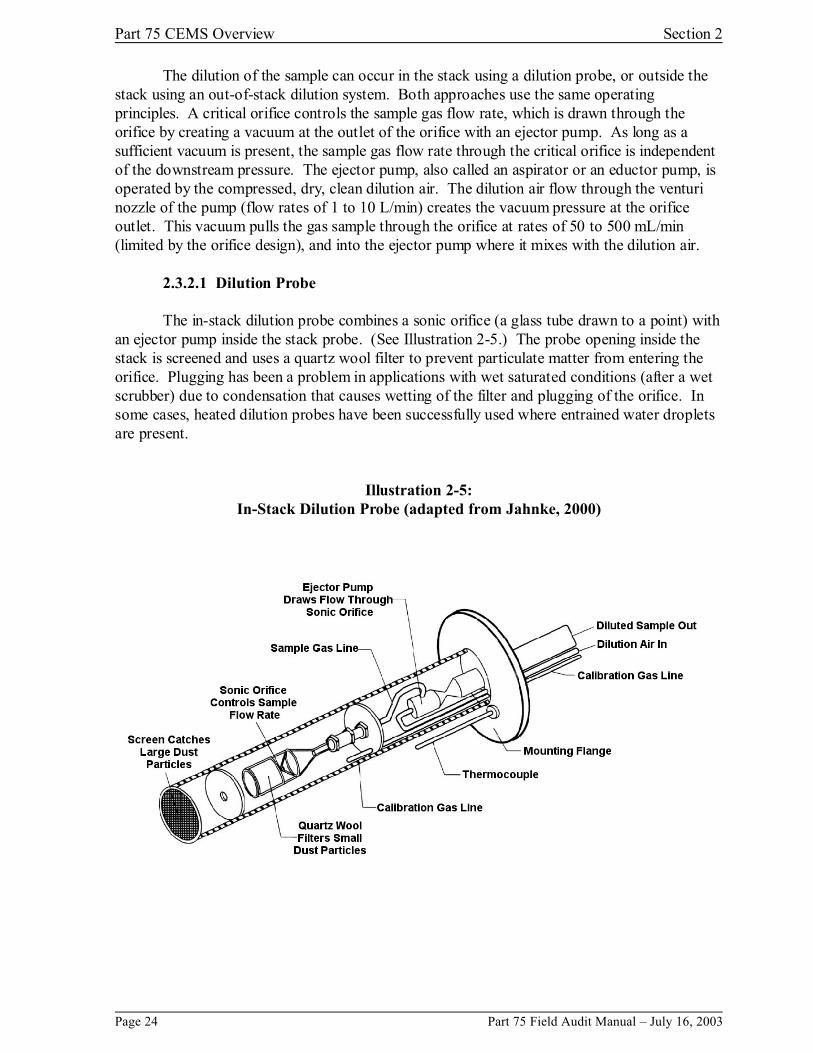
2321 Dilution Probe
The in-stack dilution probe combines a sonic orifice (a glass tube drawn to a point) with an ejector pump inside the stack probe (See Illustration 2-5) The probe opening inside the stack is screened and uses a quartz wool filter to prevent particulate matter from entering the orifice Plugging has been a problem in applications with wet saturated conditions (after a wet scrubber) due to condensation that causes wetting of the filter and plugging of the orifice In some cases heated dilution probes have been successfully used where entrained water droplets are present
Illustration 2-5In-Stack Dilution Probe (adapted from Jahnke 2000)
Page 24 Part 75 Field Audit Manual ndash July 16 2003
Section 2 Part 75 CEMS Overview
Gas Density Affects
The sonic flow of stack gas through the orifice is affected by the stack gas density and viscosity which in turn are dependent on molecular weight stack pressure and temperature A change in any of these factors will affect the sonic flow and dilution ratio The primary means for addressing theses issues include
Molecular Weight Effect - Gas density changes that result from changing molecular weight are mainly due to changes in-stack moisture or CO2 concentrations These parameters do not vary much in base load units but both can be monitored and often are as part of the Part 75 CEMS With these measurements empirical corrections can be made to the dilution ratio
The molecular weight effect is also a concern in choosing calibration gases Gases used in the initial and subsequent QA tests should have a consistent molecular weight otherwise a bias can be introduced due to the molecular weight differences
Stack Pressure - Stack pressure (absolute stack pressure which includes ambient pressure and stack static pressure) can vary due to changing load or ambient conditions Stack pressure can be monitored separately with the DAHS applying pressure related correction algorithms to the CEMS data
Temperature - Temperature also can vary with load and can be monitored separately with the DAHS correcting the data as described above Temperature correction factors have been more difficult to develop however and have not worked well in situations with temperature changes greater than 50oF (Note - Calibration checks performed when the source is not operating may not provide valid results due to the temperature effect) In response some vendors heat the dilution probe -- the heated probe is the same as shown in Illustration 2-5 except electric heating coils are placed around the probe and controlled to maintain a constant temperature Another approach for stabilizing the temperature is to use an out-of-stack dilution system described in the next section
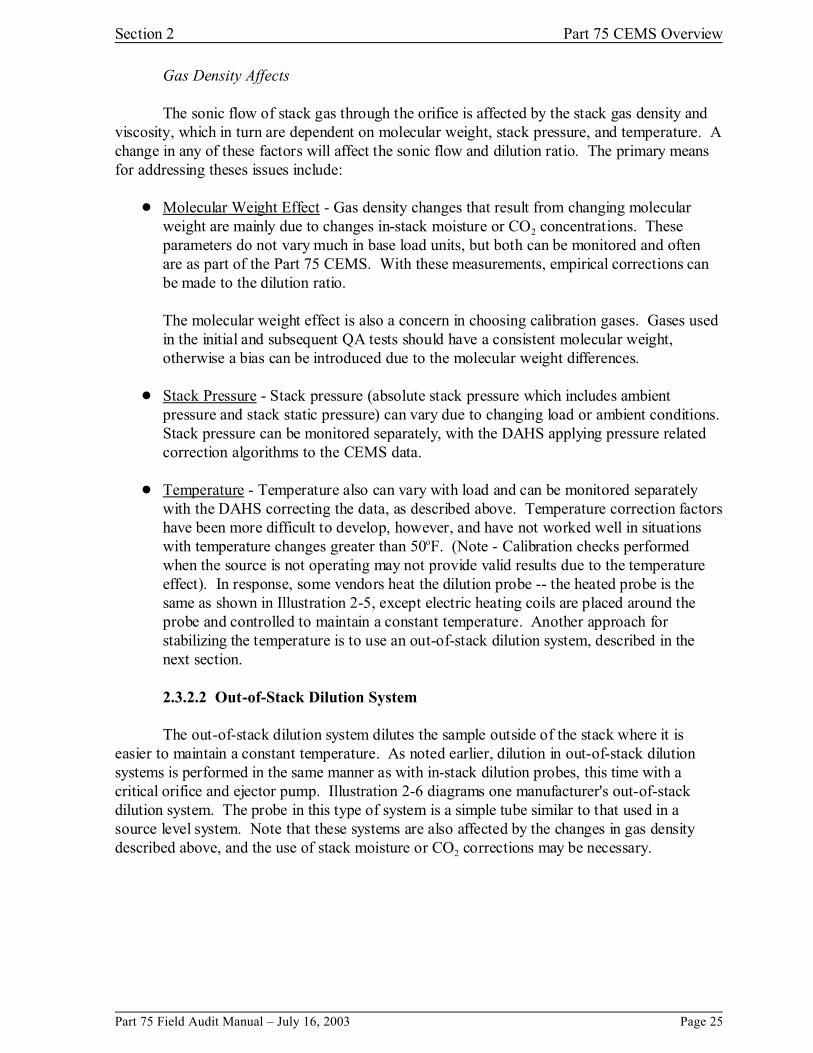
2322 Out-of-Stack Dilution System
The out-of-stack dilution system dilutes the sample outside of the stack where it is easier to maintain a constant temperature As noted earlier dilution in out-of-stack dilution systems is performed in the same manner as with in-stack dilution probes this time with a critical orifice and ejector pump Illustration 2-6 diagrams one manufacturers out-of-stack dilution system The probe in this type of system is a simple tube similar to that used in a source level system Note that these systems are also affected by the changes in gas density described above and the use of stack moisture or CO2 corrections may be necessary
Part 75 Field Audit Manual ndash July 16 2003 Page 25
Part 75 CEMS Overview Section 2
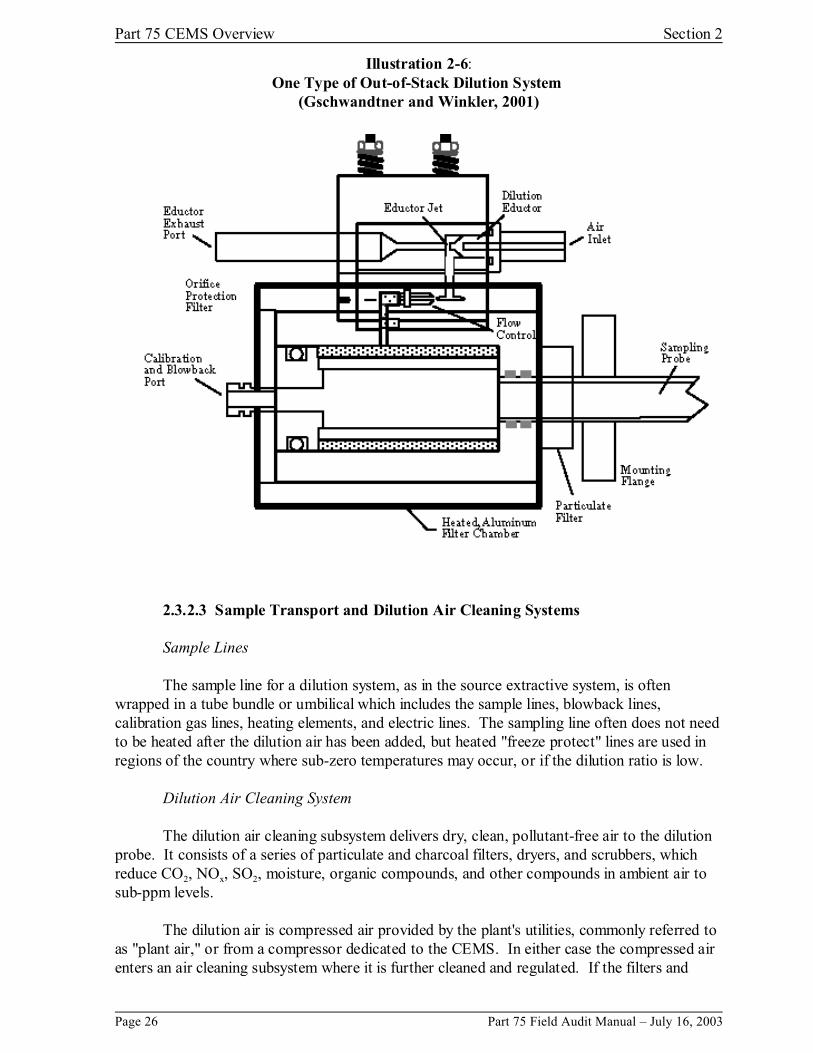
Illustration 2-6One Type of Out-of-Stack Dilution System
(Gschwandtner and Winkler 2001)
2323 Sample Transport and Dilution Air Cleaning Systems
Sample Lines
The sample line for a dilution system as in the source extractive system is often wrapped in a tube bundle or umbilical which includes the sample lines blowback lines calibration gas lines heating elements and electric lines The sampling line often does not need to be heated after the dilution air has been added but heated freeze protect lines are used in regions of the country where sub-zero temperatures may occur or if the dilution ratio is low
Dilution Air Cleaning System
The dilution air cleaning subsystem delivers dry clean pollutant-free air to the dilution probe It consists of a series of particulate and charcoal filters dryers and scrubbers which reduce CO2 NOx SO2 moisture organic compounds and other compounds in ambient air to sub-ppm levels
The dilution air is compressed air provided by the plants utilities commonly referred to as plant air or from a compressor dedicated to the CEMS In either case the compressed air enters an air cleaning subsystem where it is further cleaned and regulated If the filters and
Page 26 Part 75 Field Audit Manual ndash July 16 2003
Section 2 Part 75 CEMS Overview
scrubbers are changed regularly and there are no leaks in the subsystem the dilution air will be dry clean and free of contaminants including CO2
The flow of pressurized dilution air through the ejector pump moves the sample to the analyzers so a separate pump is not required The dilution air pressure should be held relatively constant because changes in the pressure will affect the dilution ratio Some systems include mass flow controllers to maintain the dilution flow rate at a constant level
233 Calibration Gas System
Part 75 quality assurance requirements include daily calibration error tests and linearity tests (usually quarterly) which challenge the extractive gas CEMS with calibration gases of known concentrations The calibration gases used in the tests include a zero level gas as well as low mid and high concentration levels based on the span of the monitor The calibration gas system consists of calibration gases gas regulators valves and line filters The gases must meet the criteria specified in Part 75 Appendix A sect 51
Calibration gases for the daily calibration error test and linearity tests are injected as close as possible to the probe (Part 75 App A sect 221) The calibration gas system must include controls to ensure that calibration gases are injected at the same flow rate pressure and temperature as the sample gas under normal system operation
There are two common injection locations for source level extractive systems (1) the calibration gas is injected into the in-stack probe external filter housing and is drawn into the sampling system or (2) the calibration gas may be injected into an internal filter housing between the probe and sample line at the stack flange In dilution extractive systems the calibration gas must be injected into the dilution probe housing with the calibration gas drawn through the sonic orifice In an out-of-stack dilution system the calibration is injected prior to the inlet of the critical orifice
Calibration gases are also sometimes injected at the analyzers when performing certain diagnostic tests or calibration adjustments
234 Analyzers
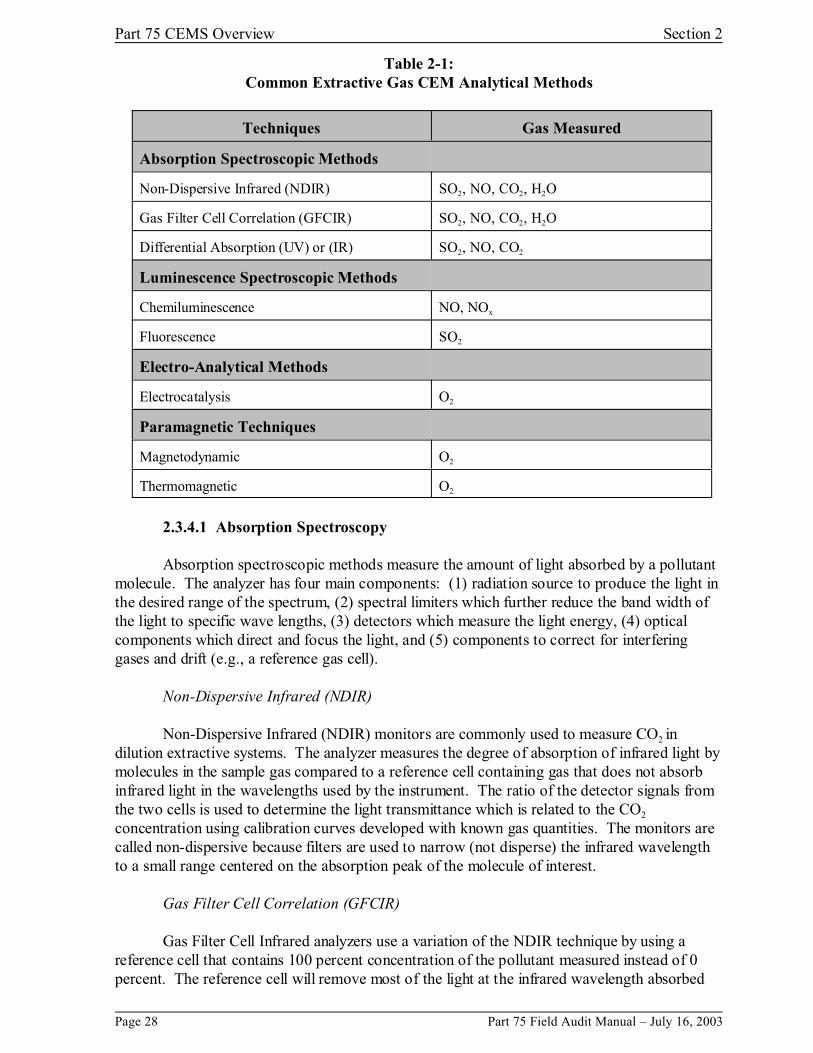
Gas analysis methods for extractive systems can be divided into four major categories Those categories with common Part 75 applications are shown in Table 2-1 and are briefly described below More detailed discussion of analyzer operating principles are available in the references listed in Section 27 The CEMS designer will choose the analytical method based on the overall system design (eg dilution extractive versus source-level extractive wet versus dry systems) In source level extractive systems the gas analyzers measure at stack concentrations in the ppm range while in the dilution extractive system gas analyzers read in the ppm or ppb range similar to those of ambient monitors
Part 75 Field Audit Manual ndash July 16 2003 Page 27
Part 75 CEMS Overview Section 2
Table 2-1Common Extractive Gas CEM Analytical Methods
Techniques Gas Measured
Absorption Spectroscopic Methods
Non-Dispersive Infrared (NDIR) SO2 NO CO2 H2O
Gas Filter Cell Correlation (GFCIR) SO2 NO CO2 H2O
Differential Absorption (UV) or (IR) SO2 NO CO2
Luminescence Spectroscopic Methods
Chemiluminescence NO NOx
Fluorescence SO2
Electro-Analytical Methods
Electrocatalysis O2
Paramagnetic Techniques
Magnetodynamic O2
Thermomagnetic O2
2341 Absorption Spectroscopy
Absorption spectroscopic methods measure the amount of light absorbed by a pollutant molecule The analyzer has four main components (1) radiation source to produce the light in the desired range of the spectrum (2) spectral limiters which further reduce the band width of the light to specific wave lengths (3) detectors which measure the light energy (4) optical components which direct and focus the light and (5) components to correct for interfering gases and drift (eg a reference gas cell)
Non-Dispersive Infrared (NDIR)
Non-Dispersive Infrared (NDIR) monitors are commonly used to measure CO2 in dilution extractive systems The analyzer measures the degree of absorption of infrared light by molecules in the sample gas compared to a reference cell containing gas that does not absorb infrared light in the wavelengths used by the instrument The ratio of the detector signals from the two cells is used to determine the light transmittance which is related to the CO2
concentration using calibration curves developed with known gas quantities The monitors are called non-dispersive because filters are used to narrow (not disperse) the infrared wavelength to a small range centered on the absorption peak of the molecule of interest
Gas Filter Cell Correlation (GFCIR)
Gas Filter Cell Infrared analyzers use a variation of the NDIR technique by using a reference cell that contains 100 percent concentration of the pollutant measured instead of 0 percent The reference cell will remove most of the light at the infrared wavelength absorbed
Page 28 Part 75 Field Audit Manual ndash July 16 2003
Section 2 Part 75 CEMS Overview
by the compound of interest This method is more commonly used in in-situ applications but is used in extractive systems
Differential Absorption
Differential Absorption analyzers perform measurements at two different light frequencies One frequency is absorbed by the target molecule while the other reference frequency is not The ratio of the absorption at the two wavelengths is correlated to the target gas concentration Again calibration curves are created using known gas concentrations Part 75 sources use UV non-dispersive photometers for SO2 and NOx measurements These types of instruments can be used in wet extractive systems as water vapor does not absorb light very well in the UV region There are also differential absorption analyzers that use light in the infrared region particularly for CO2 in wet source-level extractive systems
A single differential absorption analyzer may also measure a number of component gases by using multiple wavelengths of light
2342 Luminescence Spectroscopy
Luminescence spectroscopic methods measure the amount of light emitted by an excited molecule Analyzers using these methods are very specific for a given molecule and are more sensitive than absorption spectroscopy or electrochemical methods As in the absorption spectroscopic methods all of the instruments use calibration curves developed from known target gas compositions to relate the measured light energy to gas concentration
Chemiluminescence
Chemiluminescence monitors are commonly used for NOx in dilution extractive systems Chemiluminescence is the emission of light produced as a result of a chemical reaction and a chemiluminescence NO - NOx monitor measures the amount of light generated by the reaction of NO with O3 This monitor uses an ozone generator to produce O3 and a catalytic converter to reduce NO2 in the sample gas to NO before reacting with O3 The monitor can measure both NO or NOx by sequencing the NO-O3 reactions First the sample gas can bypass the converter and go directly to the reaction cell measuring the NO Then after this reaction the gas goes to the converter where the NO2 is reduced to NO and sent back to the reaction chamber to measure NOx (NO and NO2) NO2 can be determined by subtracting the NO measured by the first measurement from the total NOx (NO and NO2) measured in the second step
Fluorescence
Fluorescence analyzers are used to measure SO2 in both dilution and source-level extractive systems Fluorescence occurs when a molecule absorbs light at one wavelength as a result of the absorbed energy the molecule emits light at a different wavelength The analyzer uses light (either from a continuous or pulsed infrared light source) to irradiate the gas sample The light radiated back from the sample is measured by the sensor after filtering to select a narrow bandwidth of the fluorescent radiation
Interference from quenching is a concern for both chemiluminescence and fluorescence analyzers Quenching occurs when the excited molecules collide with other molecules losing energy as a result of the collision This changes the energy state from the level caused by the
Part 75 Field Audit Manual ndash July 16 2003 Page 29
Part 75 CEMS Overview Section 2
analyzer chemical reaction or irradiation For example in a fluorescence analyzer the excited SO2 molecule in the gas sample might collide with another molecule changing its energy state from what it would have been due to the analyzer irradiation This can be a problem if the stack gas composition changes as different molecules have different quenching affects It is also a problem if the calibration gas background concentrations change (single blend - multiblend calibration gases)
Quenching effects can be limited by using dilution extractive systems which will result in a constant background composition (the dilution air) Fluorescence analyzers can also use ultraviolet light at lower wavelengths to shorten the fluorescence time to reduce quenching probabilities Chemiluminescence systems can increase the O3 flow into the reaction chamber to provide a more constant background concentration
2343 Electro-Analytical Methods
The zirconium oxide (ZrO2) analyzer an electrocatalytic analyzer is the most common O2 analyzer used by Part 75 sources The analyzer can measure O2 on both a dry and wet basis and it is used with source level extractive systems and as an in-situ monitor
This analyzer uses a heated ceramic material (ZrO2) with a thin platinum catalytic coating as a solid electrolyte which allows the transfer of oxygen from the reference side of the cell (maintained at 21 percent O2) to the sample side (continual flow of stack gas with lower O2
concentrations eg 3 - 6 percent) The sample O2 concentration can be determined by measuring the electromotive force of the O2 transfer combined with a stable cell temperature and reference cell partial O2 pressure
The ZrO2 electolyte is heated to 850 oC At that temperature O-2 ions catalyzed by the platinum can move through the material Combustibles materials in the stack gas sample (CO hydrocarbons) can burn at the operating temperatures of the analyzer consuming sample gas O2 The combustible concentrations however are in much lower concentrations (ppm) than the O2 and have a negligible impact on O2 measured on a percentage basis
2344 Paramagnetic Techniques
Paramagnetic techniques are also used by Part 75 sources to measure O2 Analyzers using these techniques are only used in conjunction with source level extractive systems and water and particulate matter must be removed prior to the monitor
Molecules that are attracted by a magnetic field are described as paramagnetic while those repelled are called diamagnetic Most materials are diamagnetic but O2 is paramagnetic and strongly attracted to magnetic fields compared to most other gases (though NO and NO2
are also paramagnetic and may cause interference if present at high concentrations)
Magnetodynamic
A magnetodynamic analyzer makes use of the effect that O2 has on modifying a magnets magnetic field In a dumbbell type of magnetodynamic analyzer a torsion balance dumbbell with diamagnetic glass spheres is suspended in a nonuniform magnetic field The dumbbell spheres are pushed away from the strongest part of the magnetic field Oxygen alters the field causing a change in the dumbbell position A light source mirror on the dumbbell and
Page 30 Part 75 Field Audit Manual ndash July 16 2003
Section 2 Part 75 CEMS Overview
detector measure the dumbbell position Current through a wire encircling the dumbbell creates an electromagnetic counter-torque which restores the mirror to the position when O2 is not present The amount of current required to restore the dumbbell position is related to the amount of O2 present
Thermomagnetic
Thermomagnetic analyzers are often called magnetic wind analyzers and are based on the decrease in the paramagnetic attraction of O2 with increased temperature The O2 in the sample gas is drawn into a tube with a heated coil filament and magnetic field at one end The O2 enters the tube attracted by the magnetic field As the molecules are heated the paramagnetic attraction is decreased and the heated molecules are pushed out by cooler molecules with stronger paramagnetic attraction The O2 flow through the tube creates the so called wind and cools the heating coil reducing its resistance The change in resistance is measured and related to O2 concentration The monitor can be affected by changes in the gas composition which affect thermal conductivity and the filament temperature Combustible materials can also react on the heated filament changing the resistance
24 In-Situ Gas Monitors
In-situ gas monitors are far less common at Part 75 sources In-situ monitors were initially designed for high concentration combustion gas applications not for the lower pollutant gas concentrations following pollution control devices Some in-situ analyzers also had difficulty meeting EPA certification and quality assurance requirements However in-situ monitors do have some advantages over extractive systems The monitoring system measures concentrations at stack conditions and eliminates the need for the sample transport and conditioning systems required by extractive CEMS Newer designs offer a wider range of analyzer options and virtually all point and some path systems can now be calibrated with calibration gases as required by Part 75
In-situ monitors are classified as either path or point monitoring systems (See Illustration 2-6) The in-situ point CEMS measures gas concentrations at a single point in the stack much like the single probe in a gas extractive system The term point is used when the sampling is over a short path but still much less than the stack cross-section The in-situ path CEMS measures gas concentrations over an optical path equivalent to the internal stack diameter by transmitting a light through the flue gas (single pass) and sometimes back (double pass)
Part 75 Field Audit Manual ndash July 16 2003 Page 31
Part 75 CEMS Overview Section 2
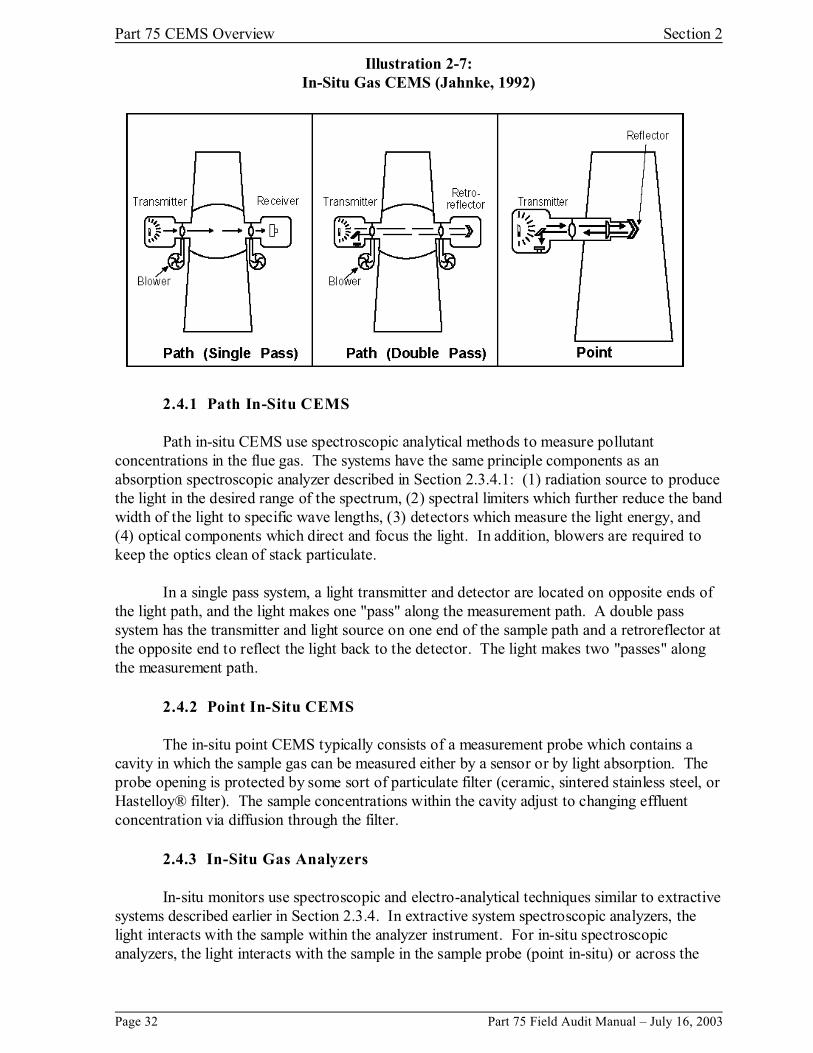
Illustration 2-7In-Situ Gas CEMS (Jahnke 1992)
241 Path In-Situ CEMS
Path in-situ CEMS use spectroscopic analytical methods to measure pollutant concentrations in the flue gas The systems have the same principle components as an absorption spectroscopic analyzer described in Section 2341 (1) radiation source to produce the light in the desired range of the spectrum (2) spectral limiters which further reduce the band width of the light to specific wave lengths (3) detectors which measure the light energy and (4) optical components which direct and focus the light In addition blowers are required to keep the optics clean of stack particulate
In a single pass system a light transmitter and detector are located on opposite ends of the light path and the light makes one pass along the measurement path A double pass system has the transmitter and light source on one end of the sample path and a retroreflector at the opposite end to reflect the light back to the detector The light makes two passes along the measurement path
242 Point In-Situ CEMS
The in-situ point CEMS typically consists of a measurement probe which contains a cavity in which the sample gas can be measured either by a sensor or by light absorption The probe opening is protected by some sort of particulate filter (ceramic sintered stainless steel or Hastelloyreg filter) The sample concentrations within the cavity adjust to changing effluent concentration via diffusion through the filter
243 In-Situ Gas Analyzers
In-situ monitors use spectroscopic and electro-analytical techniques similar to extractive systems described earlier in Section 234 In extractive system spectroscopic analyzers the light interacts with the sample within the analyzer instrument For in-situ spectroscopic analyzers the light interacts with the sample in the sample probe (point in-situ) or across the
Page 32 Part 75 Field Audit Manual ndash July 16 2003
Section 2 Part 75 CEMS Overview
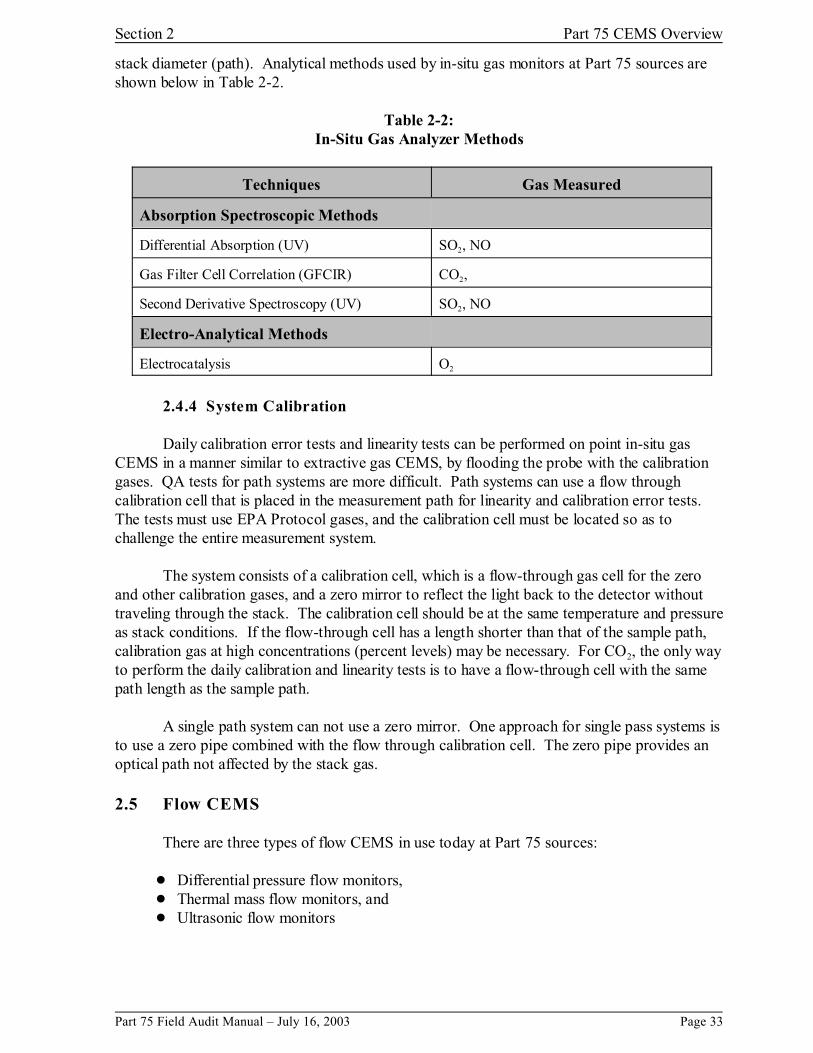
stack diameter (path) Analytical methods used by in-situ gas monitors at Part 75 sources are shown below in Table 2-2
Table 2-2In-Situ Gas Analyzer Methods
Techniques Gas Measured
Absorption Spectroscopic Methods
Differential Absorption (UV) SO2 NO
Gas Filter Cell Correlation (GFCIR) CO2
Second Derivative Spectroscopy (UV) SO2 NO
Electro-Analytical Methods
Electrocatalysis O2
244 System Calibration
Daily calibration error tests and linearity tests can be performed on point in-situ gas CEMS in a manner similar to extractive gas CEMS by flooding the probe with the calibration gases QA tests for path systems are more difficult Path systems can use a flow through calibration cell that is placed in the measurement path for linearity and calibration error tests The tests must use EPA Protocol gases and the calibration cell must be located so as to challenge the entire measurement system
The system consists of a calibration cell which is a flow-through gas cell for the zero and other calibration gases and a zero mirror to reflect the light back to the detector without traveling through the stack The calibration cell should be at the same temperature and pressure as stack conditions If the flow-through cell has a length shorter than that of the sample path calibration gas at high concentrations (percent levels) may be necessary For CO2 the only way to perform the daily calibration and linearity tests is to have a flow-through cell with the same path length as the sample path
A single path system can not use a zero mirror One approach for single pass systems is to use a zero pipe combined with the flow through calibration cell The zero pipe provides an optical path not affected by the stack gas
25 Flow CEMS
There are three types of flow CEMS in use today at Part 75 sources
Differential pressure flow monitors Thermal mass flow monitors and Ultrasonic flow monitors
Part 75 Field Audit Manual ndash July 16 2003 Page 33
Part 75 CEMS Overview Section 2
All of the flow monitors are in-situ monitors determining flow on a wet basis based on dynamic measurements of parameters that can be related to the stack velocity at a point or along a path within the stack
251 Sampling Location
As noted earlier in Section 22 the measurement location must provide a representative volumetric flow over all operating conditions Stratified flow profiles cyclonic flow and flow profiles that change with load all can impact the choice of measurement location Multiple measurement points or paths and the use of correction factors to calibrate the flow CEMS to the reference method (pre-RATA) may be required to meet the location requirements in Appendix A sect 12
252 Differential Pressure
Flow Monitors
Factors Affecting Flow Data Accuracy
Representative sampling points Sensormonitor accuracy and stability
(performance specifications in Appendix A sect 33)
Accuracy of secondary parameter values (gas temperature measurement path length)
Accurate duct dimensions (area calculation)
Proper calibration
Differential pressure monitors sense the difference between the impact and wake pressures at tube openings (pitot tubes or multi-point tubes) in the gas flow and a differential pressure transducer converts the pressure signals into electric current ifferential pressure is the difference between the impact and wake pressures e differential pressure is combined with stack gas temperature stack pressure and molecular weight to determine velocity using the pitot equation below olumetric flow is calculated by multiplying velocity by the stack or duct cross sectional area
where vs = stack gas velocity Kp = dimensionless constant Cp = pitot tube coefficient p = velocity pressure Ts(abs) = absolute temperature of the stack gas Ps = absolute pressure of the stack gas Ms = molecular weight of the stack gas
Usually the molecular weight of the flue gas and stack pressure are assumed to be constants and are not measured Temperature measurements are made either with a thermocouple or resistence temperature device (RTD) The temperature probe should also be placed in a location representative of the stack flow profile
The dTh
V
Page 34 Part 75 Field Audit Manual ndash July 16 2003
Section 2 Part 75 CEMS Overview
The flow CEMS differential pressure probe may measure at one point in the stack or at multiple points using a multi-point averaging probe or multiple pitot tube assembly (See Illustration 2-7)
Differential pressure monitors are sensitive to non-parallel or swirling flow If the flow is at an angle to the stack center line there will be a bias in the velocity measurement The bias is usually positive
Illustration 2-8 Example of Multiple Probe Locations (Jahnke 1994)
Quality Assurance Issues
Probe and line plugging is minimized by intermittently back purging the line and probe openings with clean air Back purging is required as a daily interference check (Part 75 Appendix A sect 2222) and prevents extreme plugging in most situations Daily calibration error tests are performed after the probe and test the pressure transducer and system electronics The pressure side of the probe or transducer is pressurized to a pre-set level to check the span and then both inputs are equalized to test the zero level Because probes are subject to corrosion and abrasion they should be visually inspected periodically in addition to these tests Part 75 requires a quarterly leak check of all sample lines for a differential pressure flow monitor
253 Thermal Mass Flow Monitors
Thermal mass flow monitors are based on the principle of thermal heat transfer due to convection Gas flowing across a heated surface tends to cool the surface The molecules of the flowing gas interact with the heated boundary layer surrounding the surface and remove heat The greater the flow rate the more heat is removed There are two types of sensors used by thermal flow monitors the constant power anemometer and the constant temperature anemometer
Both types of anemometers use two RTDs one heated and the other unheated The RTDs are usually protected by a stainless steel tube and mounted together in the stack The constant power anemometer measures the temperature difference between the RTDs at a constant current The temperature difference responds proportionally to changes in velocity The temperature difference will be high at low velocities (less cooling of the heated RTD) and
Part 75 Field Audit Manual ndash July 16 2003 Page 35
Part 75 CEMS Overview Section 2
low at high velocities (more cooling of the heated RTD) The constant temperature anemometer maintains a constant temperature difference between the RTDs by varying the current The change in current is proportional to the change in gas velocity The higher the velocity the higher the current required to maintain the heated RTD temperature conversely at lower velocities a lower current is required
The sensors can be placed at a single point if the flow profile or in a multiple point array depending on flow conditions
Illustration 2-9Thermal Mass Flow Monitor Probe (adapted from Jahnke 1992)
(Th = Temperature of Heated RTD Ta = Temperature of Unheated RTD)
The output from a thermal flow monitor (an empirical function dependent on the measured temperature difference gas composition and power to the anemometers) is proportional to mass flow Information on the flue gas density is required to convert mass flow to volumetric flow The gas density is dependent on fuel gas composition so changes in moisture or CO2 can affect the systems response
f(heat loss) f(Tv - Ts) = vsAs
where vs
f(Tv - Ts) Tv
Ts
As
= stack gas velocity= heat loss function= temperature of velocity sensor= stack temperature= gas density= stack cross sectional area
Thermal flow monitors can not be used in locations where there are entrained water droplets The water droplets evaporate on the sensor causing a dramatic temperature loss due to the heat of evaporation which would be interpreted as caused by the flowing gas Corrosion and particulate build up on the sensors can be a problem
Page 36 Part 75 Field Audit Manual ndash July 16 2003
Section 2 Part 75 CEMS Overview
Daily Interference and Calibration Error Tests
The daily interference test check requires a means to ensure on a daily basis that the probe is sufficiently clean to prevent interference (Part 75 Appendix A sect 2222) The sensors are usually cleaned by self heating at temperatures of 700oF or higher to burn off any adhering particles or chemical compounds Daily calibration error tests check that the sensors are operational and that the system electronics are functioning correctly
254 Ultrasonic Flow Monitor
Ultrasonic flow monitors measure the time required for an ultrasonic pulse to travel across a stack or duct at an angle to the stack flow The monitors are also called transit time monitors The monitor consists of downstream and upstream transducers located opposite of each other on the stack wall which send and receive ultrasonic pulses The difference in the time that it takes for the pulse to go in the different directions between the two transducers (the time it takes to go downstream is shorter than the time to go upstream) and the distance traveled are used to calculate velocity The equation for an ideal flow profile is shown below
where va = average velocity of the flue gas L = distance between the transducers = angle of inclination t1 = traverse time in upstream direction t2 = traverse time in downstream direction
The most common angle of inclination or path angle between the transducers at Part 75 sources is 45o Other angles are possible and various designs and approaches are used to optimize signal recognition for better transmission reception reliability and accuracy
Illustration 2-10 Ultrasonic Flow Monitor
Part 75 Field Audit Manual ndash July 16 2003 Page 37
Part 75 CEMS Overview Section 2
The velocity of the sound pulse through the stack gas is affected by the stack gas density so changes in the stack temperature due to load changes andor temperature variations across the sonic path will affect the flow measurement In some cases correction factors can be developed using the pre-RATA testing to account for these changes
Non-parallel flow will also affect the ultrasonic monitor measurements If the angle or pitch of the non-parallel flow is in the same direction from the stack center line as the measurement path inclination the flow measurement will have a positive bias The flow measurement will have a negative bias if the flow pitch angle and inclination angle are in opposite directions Two ultrasonic monitors measuring along different path cross sections (an x-pattern) can be used in situations with a stratified flow profile that varies with load One path is usually sufficient if the stratification is stable
Daily Interference and Calibration Error Tests
Part 75 requires a means to ensure on at least a daily basis that the probe remains sufficiently clean to prevent interference (Part 75 Appendix A sect 2222) Blowers are provided to keep the sensors clean much like on an opacity monitor The blower air is heated to the temperature of the flue gas to prevent condensation which may damage the transducer Daily calibrations of this type of flow CEMS are indirect The electronic calibration process verifies that the upstream and downstream sensors are working in both the transmitting and receiving modes The procedure also verifies that the signal to noise ratio is acceptable
26 Data Acquisition and Handling System (DAHS)
The term data acquisition and handling system (DAHS) refers to the CEMS hardware and software components that take the output from the analyzers combine it with other information and compute hourly emissions The DAHS acquires and stores the necessary data (Part 75 requires that the DAHS automatically record all emissions data and the daily calibration error checks - Appendix A sect 4) It also computes the emissions and quality assurance test results in terms of the regulatory requirements displays the data and produces the quarterly reports required by Part 75 The DAHS software for Part 75 is highly specialized to match the electronic data reporting (EDR) format
In addition to a DAHS a CEMS requires softwarehardware components for system control functions These functions include automatic calibration probe blowback analyzer sequencing for time-shared analyzers error detection diagnostic routines and similar tasks
261 CEMS Computer Systems
In general there are two approaches for a CEMS computer system In one approach a single computer handles both the CEMS control functions and the DAHS functions In the other there is a separate control system that handles the CEMS functions and may manipulate data as an interface between the analyzers and a separate DAHS computer Because of the complexity of the control and DAHS functions in Part 75 CEMS it is more typical to have separate systems for control and data acquisition and handling
System control hardware options include computers programmable logic controllers (PLCs) data loggers and embedded microprocessors Besides providing CEMS control
Page 38 Part 75 Field Audit Manual ndash July 16 2003
Section 2 Part 75 CEMS Overview
functions described above controllers also can provide some analyzer data processing prior to the DAHS These may include converting analog data to digital and performing some of the automatic correction calculations and emission calculations
The DAHS computer is most often a stand alone personal computer although some plants are using the plants distributive control system (DCS)
262 Emissions Data Processing
The analyzers may send digital signals directly to the DAHS or send analog signals that must be converted to a digital value and scaled The real time second-to-second data is first averaged (1-15 minutes) by the analyzer control interface or DAHS Corrections may be applied to the data (eg pressuretemperature compensation molecular weight flow and moisture monitoring polynomials sonic velocity correction factors NOx quenching correction factors and dilution ratio settings) and the data then converted to the proper units for the Part 75 formula calculations
The data must be averaged again to one-hour averages as required by Part 75 A valid measurement must be recorded in each quadrant of the hour except when performing required Part 75 QA testing (eg a daily calibration or quarterly linearity test) For hours in which Part 75 QA testing is performed only two quadrants of the hour need to be captured (sect 7510(d)(1)) The hourly data are then used to calculate the Part 75 emissions parameters and rates based on formulas in Part 75 Appendices D - G with the CEMS-based formulas in Appendix F A table of the required formulas is provided in the EDR v22 Reporting Instructions (August 2002)
263 QA Test Data Processing
As noted previously Part 75 requires automatic data capture and calculation of daily calibration error test results Other QA test data and results may be entered manually Automatic and manual data entry for a Part 75 DAHS are discussed further in Section 46 of this manual and in Section IIC3 of the EDR v22 Reporting Instructions
Some CEMS use the daily calibration error test results to automatically correct the analyzer data These mathematical adjustments are similar to an internal bias adjustment factor in that the DAHS evaluates the response in comparison to the reference value and assigns from that time forward an adjustment factor which is used to adjust the data for reporting
264 Part 75 Reporting
The DAHS generates the quarterly electronic data report (EDR) submitted by the source to EPAs Clean Air Markets Division The EDR is in ASCII text format with each line representing a separate record which includes plant and unit information monitoring plan information hourly monitoring data and QA test results The reports are sent directly to EPA by electronic data transfer There is more discussion of the EDR in Section 311 of this manual
Part 75 Field Audit Manual ndash July 16 2003 Page 39
Part 75 CEMS Overview Section 2
27 References
Gschwandtner G and Winkler J (2001) US EPA Acid Rain Program Continuous Emissions Monitoring Systems Reference Manual US Environmental Protection Agency Acid Rain Division
Jahnke J A (1992) APTI Course 474 Continuous Emissions Monitoring Systems Student Manual (Revised) US Environmental Protection Agency Office of Air Quality and Planning Standards
Jahnke J A (1994) An Operators Guide to Eliminating Bias in CEM Systems US Environmental Protection Agency Office of Air and Radiation EPA 430-R-94-016
Jahnke J A and Peeler J W (1997) Handbook Continuous Emission Monitoring Systems for Non-Criteria Pollutants US Environmental Protection Agency Office of Research and Development EPA625R-97001
Jahnke J A (2000) Continuous Emission Monitoring Second Edition John Wiley amp Sons Inc
Shigehara R T and Peeler J W (1998) Evaluation of Daily Calibration Techniques of Continuous Flow Monitoring Systems US Environmental Protection Agency Acid Rain Division
Page 40 Part 75 Field Audit Manual ndash July 16 2003
Section 3 Audit Preparation
Section 3 covers the data that are available to help you prepare for the field audit and explains how to use that data eparing for the audit can increase your efficiency by allowing you to target issues for auditing while at the plant lso gain credibility with plant personnel if you come prepared ection emphasizes the use of the MDC software to review quarterly electronic data
PrYou a
This s
31 Using Part 75 Electronic Data to Conduct Pre-Audit Reviews
You will have available two types of source file information in preparing for a Part 75 field audit Hardcopy file information may include correspondence petition responses portions of the monitoring plan (such as system diagrams) reports of previous inspections or audits performance test reports and permits This type of information may be similar to background file information available for other types of air compliance inspections and audits
The second type of information is the quarterly electronic report required under Part 75 This wealth of electronic data generally is not available under other programs and provides a valuable resource that you can use prior to the plant visit to conduct monitoring checks and to identify potential source monitoring problems The electronic information includes data on the units monitoring plan certification and recertification events QA tests and emissions and operating data for each hour of the quarter
This section first introduces you to the quarterly Electronic Data Report (EDR) The section then describes how to review reports that EPA sends to affected sources to provide feedback on each EDR submitted Finally the section focuses on how to use EPAs Monitoring Data Checking (MDC) software to review EDRs
The format and volume of the electronic data can be daunting at first especially for inspectors who have responsibilities for multiple air programs The MDC software will be a vital asset to help you access and analyze the EDR and you should ensure that you take advantage of this tool as you prepare for an audit
311 Quarterly Electronic Data Reports
A facility usually submits each Part 75 quarterly EDR on a unit basis so one facility may submit multiple EDRs each quarter In other cases one report may be submitted for all units that exhaust to a common monitored stack or other complex stack configuration The EDR is in ASCII text format with each line representing a separate record referred to as a record type or RT An example of the layout of information in a report line or record type is provided in Illustration 3-1 In this example a line of hourly NOx emission rate data (RT 320) is presented If you want to explore the structure and content of the EDR in more detail you should review the most up-to-date version of the EDR Reporting Instructions and Formats --see Section 15 for guidance on how to access the EDR guidance documents
Part 75 Field Audit Manual ndash July 16 2003 Page 41
Audit Preparation Section 3
Illustration 3-1Example EDR Data Format for Record Type 320
To show you the various data elements you will see in an EDR Illustration 3-2 below provides an example summary of the content of an EDR by record type The example is for two Acid Rain CEMS units monitored at a common stack A number of these record types like RT 320 in Illustration 3-1 above pertain to emissions or operating data that are reported for each hour of operation so a quarterly EDR will have many lines of data A quarterly EDR for a unit with a single stack may have over 20000 lines An EDR in text file format therefore may look overwhelming but the MDC software tool allows you to streamline your review and analysis of the data
Page 42 Part 75 Field Audit Manual ndash July 16 2003
Section 3 Audit Preparation
Illustration 3-2Example Summary Of Quarterly Report Content For Two Acid Rain
CEMS Units Emitting Through Common Stack
FACILITY INFORMATION Type 100 Record (Facility and report data)
Type 102 Record (Facility information)
COMMON STACK FOR UNITS 1 amp 2 Type 200 Records (SO2 concentration data by date and hour)
Type 201 Records (NOx concentration data by date and hour)
Type 202 Records (CO2 concentration data by date and hour)
Type 210 Records (Diluent data by date and hour)
Type 220 Records (Volumetric flow data by date and hour)
Type 230 Records (Daily calibration test data by date and hour)
Type 231 Records (Flow interference data by date and hour)
Type 300 Records (Stack operating parameters by date and hour)
Type 301 Record (Quarterly and cumulative emission data)
Type 310 Records (SO2 mass emissions data by date and hour)
Type 320 Records (NOx emission rate data by date and hour)
Type 330 Records (CO2 mass emissions data by date and hour)
Type 503 Records (For Unit 1 (Common stack definition table)) (For Unit 2 (Common stack definition table))
Type 510 Records (Monitoring systemsanalytical components table)
Type 520 Records (Formula table)
Type 530 Records (Span table)
Type 535 Records (Stack operating load data)
Type 536 Record (Range of Operation normal load and load usage)
Type 556 Records (Monitoring system recertification events)
Type 601 Records (Quarterly linearity test data) Type 602 Records (Quarterly linearity check results)
Type 603 Records (Flow quarterly leak check results)
Type 605 Records (Reference data for flow-to-load ratio or GHR evaluation)
Type 606 Records (Quarterly flow-to-load or GHR check)
Type 610 Records (RATA and bias test data)
Type 611 Records (RATA and bias test results)
Type 623 Records (On-lineOff-line calibration demonstration)
Type 699 Record (QA test extension claim based on grace period)
UNIT 1 (MONITORED AT COMMON STACK) Type 300 Records (Unit operating parameters by date and hour)
Type 301 Record (Quarterly and cumulative emission data)
Type 504 Record (Unit information)
Type 505 Record (Unitprogram information)
Type 585 Records (Monitoring methodology information)
Type 586 Record (Control equipment information)
Type 587 Record (Unit fuel type)
UNIT 2 (MONITORED AT COMMON STACK) Type 300 Records (Unit operating parameters by date and hour)
Type 301 Record (Quarterly and cumulative emission data)
Type 504 Record (Unit definition table)
Type 505 Record (Unitprogram information)
Type 585 Records (Monitoring methodology information)
Type 586 Record (Control equipment information)
Type 587 Record (Unit fuel type)
CERTIFICATIONS Type 900 Records (Certification electronic signature)
Type 901 Records (Certification statement)
Type 999 Record (Contact person information)
Part 75 Field Audit Manual ndash July 16 2003 Page 43
Audit Preparation Section 3
312 Quarterly Feedback Reports
CAMD conducts two separate automated reviews of each quarterly EDR submission The first is generated by the Emission Tracking System (ETS) as instant feedback when the source submits the file to the EPA mainframe This instant ETS feedback provides the EPA Status Code which indicates whether the file was accepted and whether any errors were identified Certain errors are considered critical and necessitate a resubmission of a corrected file Other errors are considered informational and should be corrected by the source in future quarters but need not necessarily be addressed immediately Any errors that are identified are listed in the ETS feedback report with the relevant error code description number of hours and identification of the first hour in which the error occurred ETS checks include recalculations of hourly and cumulative emission values as well as range checks for acceptable values and codes in various fields
As part of preparing for a field audit you can download the ETS feedback report from the EPA mainframe (if you have access rights) or you can request a copy of the feedback from your CAMD contact If errors were identified on the latest ETS feedback you should review this report with the source during the on-site inspection and verify that the source has corrected those errors
The second automated review is generated by the Monitoring Data Checking (MDC) software and is sent by email to a facilitys Designated Representative shortly after the quarterly EDR submission period The MDC feedback consists of monitoring plan and QA test data evaluations As with the ETS errors certain MDC errors are considered critical and must be corrected by a resubmission of the quarterly file Note that since MDC is available to sources to download from the CAMD website they can run these same evaluations on their quarterly files prior to submission The MDC software is discussed in more detail in the following sections with guidance on how you can use the software to prepare for the plant visit
313 Using MDC to Prepare
for an Audit Key Checks Using MDC to Prepare
for the Field Audit
bull Print a copy of the monitoring plan report to take with you to the plant
bull Evaluate QA Test results (eg linearity RATA flow-to-load) and check for duplicate tests Identify if the source has claimed an exemption or grace period
bull Print and review recertification reports Also print missing data reports if available
bull Check hourly emissions calculations and missing data periods using the MDC Hourly feature
3131 MDC Overview
EPA developed the MDC software to allow affected sources State agencies and EPA staff to enter analyze print and export electronic monitoring plan certification and quality assurance data and to evaluate hourly emissions data for Part 75 monitoring The software also allows industry users to submit monitoring plan and certification data to EPA through standard electronic data transfer protocols
Page 44 Part 75 Field Audit Manual ndash July 16 2003
Section 3 Audit Preparation
To prepare for an audit you can use MDC to perform the following tasks in reviewing the quarterly EDR data
View monitoring plan QA test extensionexemption and compliance certification records directly on screen
Evaluate monitoring plans quality assurance tests and extensionexemption records
Print out reports of monitoring plans QA test data or evaluations
Analyze hourly data with the MDC Hourly data module
Analyze view and chart hourly data records for SO2 CO2 O2 NOx and heat input Also calculate and display summary data for daily monthly and quarterly time periods
Check hourly emissions calculations (MDC relies on the calculation procedures identified in a units monitoring plan together with RATA test data for these calculations) You can also calculate cumulative emissions from the hourly data to compare to the quarterly and annual values that the source reports in the EDR (see RTs 301 and 307)
Check to determine the quality assurance status (with respect to RATAs and linearity tests) of measurements reported for specific hours and monitors (MDC uses the ongoing reported quality assurance test data and extensionexemption records for this analysis)
Archive hourly data calculations and QA status for quick retrieval
Use a utility in MDC to modify parameter tolerances for comparisons of reported versus calculated hourly emissions
The following subsections address these uses in greater detail
3132 Getting Started with MDC
The most current version of MDC along with instructions and training materials are available on CAMDs website Once you obtain MDC and install it on your computer the next step is to import recent EDRs for the units to be audited You will need first to obtain the quarterly EDRs which can be downloaded from CAMDs website or received on a CD from CAMD
Obtaining MDC Software
EPAs MDC Software and supporting information can be downloaded at wwwepagovairmarketsmonitoringmdc
The EDR files should be saved in the data folder of the MDC directory You may need as many as four quarters of the most recent EDRs for the units and may need to go back additional quarters depending on when the most recent RATA was performed QA tests are included in the EDR for the quarter during which the tests were performed
Part 75 Field Audit Manual ndash July 16 2003 Page 45
Audit Preparation Section 3
3133 Review and Print Electronic Portion of Monitoring Plans
The electronic portion of a monitoring plan provides important background information The plan identifies the affected units (eg type rated capacity fuels combusted) control equipment what types of monitoring systems and components are in use monitor span values DAHS formulas missing data procedures and other information (See Table 3-1)
The plan should be printed out using the MDC reports function and brought to the plant The plan printout provides a simple template and check sheet for the plant visit For example when verifying monitor serial numbers to ensure that equipment has been properly certified you may simply check off on the printed monitoring plan each monitor system component that matches and include this as a check sheet in the audit report
Table 3-1Electronic Monitoring Plan Information
Electronic Monitoring Plan Records Description
Unit Operation Information (RT 504) Unit ID Boiler Type Maximum Heat Input Areas at Flow Monitor and Stack Exit
Monitoring SystemsAnalytical (RT 510) Components
System Parameter and ID Component ID Type Sample Method Manufacturer Model Serial Number
Emission Formulas (RT 520) Parameter Formula Code Formula
Span Values (RT 530) Parameter Scale MPCMECMPF Max NOx Rate Span Value Full-Scale Range Units of Measure
Load Range (RT 535) Maximum Hourly Load
Range of Operation (RT 536) Upper and Lower Bounds of Operating Range Most Frequently Used Loads Normal Load
Monitoring Methodologies (RT 585) Parameter Methodology Fuel Type Missing Data Approach
Control Information (RT 586) Parameter Type of Control Control Dates
Fuel Type (RT 587) PrimarySecondary Fuels
Fuel Flow Meter Data (Appendix D) (RT 540)
Parameter Fuel Type Maximum Fuel Flow Initial Accuracy Test Method
Fuel Usage Qualification (Appendix E) (RT 507)
Capacity or Gas Usage Qualification Type Method
NOx Correlation Segments (Appendix E) (RT 560)
Test Date Test Number Operating Level Segment Heat Input NOx Rate Fuel Type
Page 46 Part 75 Field Audit Manual ndash July 16 2003
Section 3 Audit Preparation
3134 ts Exemptions and Extensions
The MDC program evaluates QA test data and provides detailed test reports u can view a list of the QA tests (linearity flow-to-load and RATAs) -- as well as any test grace periods and exemptions -- in the EDRs that you have imported into MDC by selecting Certification and QA Tests or Test Extensions and Exemptions from the Edit or Report pull down menus
QA Tests
MDC will evaluate QA test data and provide brief error messages if errors are found For example low medium and high gas levels are compared to the instrument span to determine if the linearity was performed at the appropriate levels The program also will re-calculate linearity and RATA results including RATA bias adjustment factors (BAF) These are the same evaluations that are performed by CAMD at the end of each quarter described above in Section 312
If you have not received a copy of CAMDs evaluation you should run QA test evaluations of all the QA tests performed in the quarters you have downloaded ke a note of errors also you can print out specific pages of the MDC evaluation report for follow up with the plant during the audit visit
In addition to the test evaluations you will want to view the list of QA tests performed by the source to see if a particular QA test (RATA or linearity) has been repeated in a quarter This would indicate a failed or aborted test that might be due to CEMS problems You should investigate these failedaborted tests during the plant visit to find out what adjustments (if any) were made to the system and why they were necessary rform this check view the list of QA tests for a source by using the Edit pull down menu in MDC An example is shown in Illustration 3-3 where the SO2 linearity test has been repeated multiple times for a unit during the second quarter of 2000
Part 75 QA Tests
In the context of Part 75 and this manual QA tests refer to quality assurance tests required by the rule The primary tests for electronic data evaluation using MDC are
bull Linearity Tests bull Relative Accuracy Test Audits
(RATAs) bull Flow-to-Load Tests
QA Tes
Yo
Ma
To pe
Part 75 Field Audit Manual ndash July 16 2003 Page 47
Audit Preparation Section 3
Illustration 3-3 MDC Screen Showing Multiple Linearity Tests in One Quarter
You should also print out copies of a number of RATA and linearity test reports to bring with you to the plant so that you may compare the results reported in the quarterly EDR to on-site test report records You should perform this check (see Section 46) to ensure that the source properly transferred QA test data not automatically recorded by a CEMS to the CEMS data acquisition and handling system (DAHS)
Extensions and Exemptions
The Part 75 rule allows for the extension of QA test deadlines and in some cases exemptions from QA test requirements based on specific unit circumstances Test extensions are available for RATAs and quarterly Appendix D fuel flowmeter accuracy tests There is also a general grace period extension for all quarterly QA tests and RATAs which allows time in which to complete the testing for a short period after the end-of-quarter deadline
Exemptions are available from the multi-load flow RATA requirement (flow RATA may be allowed at a single operating level) SO2 RATA requirement (for units burning a low sulfur fuel) and the requirement to perform a single load RATA at normal load In addition quarterly QA test exemptions are available for linearity tests leak checks and flow-to-load ratio tests in any quarter which does not qualify as a QA operating quarter (a QA operating quarter has at least 168 hours of stack or unit operation) Quarterly QA test exemptions are also available for linearity tests of one range of a dual range monitor (range not used in the quarter) linearity tests of SO2 or NOx monitors with spans of 30 ppm or less and flow-to-load ratio tests for
Page 48 Part 75 Field Audit Manual ndash July 16 2003
Section 3 Audit Preparation
complex stack configurations that have been approved by petition The EDR v22 Instructions (see sections that discuss RT 695 - RT 699) provide useful background descriptions of the available extensions and exemptions and qualification requirements A link to the EDR Instructions is provided in Section 15 of this manual
You can use MDC to determine whether the source has claimed any extensions or exemptions Select Test Extensions and Exemptions from MDCs Report pull down menu Then run an evaluation report for all of the extensions and exemptions to determine if there are any errors that require follow-up during the field audit
Extension and Exemption Record Types
bull RT 695 Single-Load Flow Rata Claim bull RT 696 owmeter Accuracy Test
Extension bull RT 697 RATA Extension or
Exemption bull RT 698 arterly QA Test Exemption
Fuel Fl
Qu
A common test exemption is the use of a 1-load level RATA for flow RATAs Generally a 2-load test is required for QA testing At least once every 5 years a 3-load test is required for quality assurance purposes In addition a 3-load test is required for certification and recertification
There are also a few situations in which a 1-load test is allowed without a special exemption (1) peaking units and bypass stacks automatically qualify (2) a source that conducts flow RATAs on a semiannual basis can alternate between a 2-load and 1-load test and (3) cement kilns and other non-load based units can conduct tests at a single level if representative of normal operations For other sources to qualify to use a 1-load level flow RATA the source must submit the results of the single load analysis required by Appendix B sect 2313(c) in RT 695 Check to make sure that flow RATAs were performed at multiple loads (or that a unit otherwise qualified for a single load test) if the MDC exemption report indicates that the source did not report RT 695
Table 3-2Summary of MDC QA Test Checks
QA Test Checks Description
QA test evaluations MDC will evaluate QA test data recalculate results and provide error messages if errors are found
Repeated QA tests Look for FailedRepeated QA Tests (multiple tests in a quarter)
Print RATA and linearity reports for comparison with on-site hardcopy data
Bring the reports to the plant to make sure the electronic data match hardcopy data or linearity tests make sure the reference cylinder gas concentrations match those on site
Extensions and grace periods Identify if the source has claimed an extension or grace period
F
(cont)
Part 75 Field Audit Manual ndash July 16 2003 Page 49
Audit Preparation Section 3
Table 3-2Summary of MDC QA Test Checks (cont)
QA Test Checks Description
Single load flow RATAs (RT 695) Check for the exemption analysis single load flow RATA claim record (RT 695) which will show the results of the single load analysis required by App B 2313(c) Make sure flow RATAs were performed at multiple load levels for units (other than peaking units) without the single load exemption request Note Non-peaking units performing RATAs semiannually can alternate between single-load and multiple-load test without requesting an exemption or reporting RT 695 Certain non-load based units (such as cement kilns) also may be exempt from multiple-level tests
3135 Recertification Events and Monitoring System Downtime Reports
Sources must report certification recertification and certain maintenance events in the quarterly EDR (RT 556) in the report for the quarter in which the event occurred The MDC report function (currently under the Reports drop down menu) can provide a printout report of recertification and maintenance events This report identifies certification recertification and maintenance events and what QA tests were required If any of these records have been reported you should print a copy of this report and bring it with you on the plant visit to compare against the plant records It is important that all monitoring components are properly certified If there have been changes to equipment proper diagnostic or recertification testing should have occurred as required by sect 7520(b) Note that MDC does not verify that all required certification recertification or diagnostic testing is included in the report EPA therefore relies on the inspector to make this verification as part of the audit
A Monitoring System Downtime or Missing Parameter Report (RT 550) may also be available though unlike the Recertification Report (RT 556) this record is optional This useful report shows the start and end time of all missing data periods by monitoring system reason for missing data and the corrective action taken You can print out a copy of this report and use the report to (1) target monitoring system problems for further investigation with plant personnel during the plant visit and (2) identify missing data periods that can be used in reviewing plant maintenance plan records or control device parameter records at the plant Alternatively if this report has not been submitted the MDC Hourly function can be used to identify missing data periods as discussed in the following section
3136 Using MDC Hourly to Check Emissions Data and Calculations
The MDC Hourly module analyzes calculates views and graphs the hourly emissions data records for SO2 CO2 O2 NOx flow and heat input It also calculates and displays summary data for daily monthly and quarterly time periods The program can analyze up to 4 quarters of calendar year data MDC Hourly was designed for use with EDR v21 Use of EDR v21 began in the second quarter of 2000
Page 50 Part 75 Field Audit Manual ndash July 16 2003
Section 3 Audit Preparation
Getting Started with MDC Hourly
In order to check the hourly calculations with MDC Hourly you will need to make sure that you have imported quarterly EDR files that include the quarter with data from the most recent pollutant and flow RATAs so that you can take full advantage of the MDC data checks If you do not import all of the historical monitoring plan and quality assurance data into MDC prior to running MDC Hourly MDC Hourly may mistake hourly data as being out of control (OOC) and will not provide any further analysis on those hours
Hourly Calculations and Error Messages
View the Detailed Emissions Data tables for the different CEMS The program recalculates emissions for each hour using the monitoring plan formula and provides an error message in the far right column if there is a discrepancy There is no need to perform the emission calculations yourself One issue is the bias adjustment factor (BAF) If a source uses the wrong BAF they could underreport emissions and undermine the integrity of the trading program This recalculation feature in MDC can assist you in spotting this problem and understand the potential magnitude of the impact on emission allowances
Error messages will also identify OOC periods which indicate that a QA test (RATA or Linearity) was expired failed or not performed MDC Hourly does not currently determine the control status of the unit with respect to daily calibrations Be careful of the out-of-control error messages you may generate when you run MDC Hourly As noted in the Getting Started discussion above you can receive these error messages if you do not import the data into MDC for the quarter in which the RATA was performed prior to running the analysis on the hourly data
Missing Data Periods
Use the filter function to identify missing data periods This is especially important if the source did not submit the optional RT 550 record described above in Section 3135 The reasons for the missing data are not provided but this information may be used to identify systems with high amounts of missing data to target during the plant visit and also to select missing data periods for an in-plant records review
Appendix D Units
For oil- or gas-fired units that use Appendix D fuel monitoring to determine heat input and SO2 emissions view and record the fuel gross caloric value (GCV) and sulfur content across quarters so that you can check these values against on-site fuel sampling and analysis results
Graphing
MDC Hourlys graphing function allows you to graph the hourly emission data as well as flow and heat input Graphing emissions data can be an invaluable tool for preparing for a field audit Graphing allows the inspector to verify that the reported emissions look reasonable for the type of unit being evaluated Abnormal emission trends can often be quickly identified and should be investigated as part of the field audit to identify if the abnormality is due to a problem with the monitoring system or to a change in the way the unit is operated An abrupt
Part 75 Field Audit Manual ndash July 16 2003 Page 51
Audit Preparation Section 3
or unusual change could indicate a modification to unit operation or the CEMS that may require recertification or diagnostic testing Consistent data with very little change (flat line) may indicate that the CEMS is not operating properly or that the unit is using a missing data routine Either situation should be investigated with the source during the on-site visit
Illustration 3-4Example MDC Hourly Graph of SO2 Concentrations
The graphing function also can be used to compare the hourly emissions or parameter (flow heat input) against the monitor span values listed in the monitoring plan You should note if the emissions or parameter exceed the relevant maximum potential concentration (MPC) maximum expected concentration (MEC) or maximum potential stack gas flow rate (MPF) The emissions should typically be between 20 and 80 percent of the monitor range identified in the monitoring plan (See Appendix A sect 21) If a majority of the emissionparameter readings are outside 20 to 80 percent of the monitoring range you should make sure that the source has performed the MPC MEC span and range checks that are required at least annually by Appendix A sect 21
Page 52 Part 75 Field Audit Manual ndash July 16 2003
Section 3 Audit Preparation
Table 3-3Summary of MDC Hourly Checks
MDC Hourly Checks Description
Check hourly calculations and error messages
Check recalculated hourly emissions for error messages which are provided for each hour in the far right column
Error messages also identify out of control periods which indicate that a QA test was failed or was not performed
Hourly error messages may need to be ignored if the most recent RATA for a parameter was not imported
Check BAFs used in hourly calculations
MDC Hourly will use the BAF in the most recent RATA to recalculate hourly emissions
Check missing data periods Use the filter function to identify missing data periods Identify systems with high amounts of missing data and to select missing data periods for in-plant records review
For oil or gas units using Appendix D note fuel GCV and sulfur content
View and record these values across quarters to check against on-site fuel sampling and analysis results
Check spans Use the graph function to compare the hourly emissions or parameter (flow heat input) against the monitor span values in the monitor plan report Follow-up with the source if emissionsparameters are higher than the span The source is required to perform a spanrange check at least annually (App A sect 21)
View graphs of data trends Use the graph function to plot emissions and flow Note any abrupt changes in the data or consistent data with no change
32 Hardcopy File Review
In addition to the electronic review of monitoring plan and quarterly report data you should also review the sources file for written correspondence and information pertaining to Part 75 monitoring These documents would include any petitions previous auditinspection reports linearity and RATA reports and the sources acid rain permit or operating permit
321 Correspondence Petitions and Previous AuditInspection Reports
Correspondence and any petitions provide background on any recent issues or unusual monitoring situations that may come up during the plant visit Previous audit or inspection reports serve the same purpose Also if a prior report identified problems that required follow-up you should confirm (either through your pre-audit review or on-site audit) that the source took appropriate corrective action
Part 75 Field Audit Manual ndash July 16 2003 Page 53
Audit Preparation Section 3
322 Linearity Test and RATA Reports
Some States require a hardcopy submittal of linearity test and RATA reports If this is the case in your State and you have access to the reports in your office you should compare the hardcopy results to those reported electronically and accessed with the MDC program as described in Sections 313 and 45 so that you will not have to conduct the comparison while at the plant You can also review the RATA test report as described in Table 3-4 The hardcopy RATA test report review should be focused on reference method documentation that can not be checked electronically (eg reference method analyzer biasdrift checks cylinder gas certifications reference method equipment calibrations traverse points etc)
Table 3-4RATA Report Review
RATA Hardcopy Review Explanation
For a NOx RATA using the instrumental method 7E is the NOx
converter efficiency documented through a performance test
The NOx converter converts NO2 to NO NO is measured by the analyzer If the NO2 concentration is greater than 5 ppm a NOx converter efficiency test (RM 20) is required
If an instrumental RM was used were cylinder gas certificates included in the test report
The calibration gas certificates should be provided in the test report and show Certified gases (EPA Protocol NIST etc see
Section 45) Concentrations which match those used in the
biasdrift check calculations Expiration date after the RATA
For instrumental methods (6C 7E 3A) were the appropriate bias and drift corrections made for the RM data
Run results are corrected for bias based on the average of the before and after bias checks
For flow reference methods is the calibration date of the pitot tube within 6 months of the RATA
The most recent calibration should have been performed within 6 months of the test
Are CEMS and RM data on same moisture basis
Make sure the comparison between the CEMS and RM are on the same basis
323 Permits
You should make sure that the source has an Acid Rain permit or NOx budget permit if required Check any relevant source specific provisions related to Part 75 monitoring in the permit and bring a copy of those provisions with you on the audit The permit conditions for Part 75 monitoring however may only list a general requirement to follow Part 75 and not be that helpful
Page 54 Part 75 Field Audit Manual ndash July 16 2003
Section 3 Audit Preparation
33 Scheduling and Coordinating the Audit
Level 2 audits require coordination with the source to obtain their schedule for performing RATA and linearity performance tests The source is required to provide written notice of the date of periodic RATAs no later than 21 days prior to the first scheduled day of testing (sect 7561(a)(5)) Written notification may be provided by mail or by facsimile and may be provided by electronic mail if the EPA Regional Office or State agency determines that electronic mail is acceptable (sect7561(a)(5)(i)) However the date can be changed and often is due to operating constraints at the plant or with the CEMS Part 75 allows performing a test on a different date as long as notice of the new date is provided as soon as practicable but no later than twenty-four (24) hours in advance of the new test date
Notice is not required prior to the quarterly linearity tests So you will need to coordinate with the facility staff to schedule your audit to coincide with a linearity test date if desired
Because the audit policy is hands-off you should review all of the inspection procedures and requirements at the time of scheduling to allow the facility the opportunity to gather the necessary information and arrange for the appropriate personnel to be available (The plant environmental contact may also not be authorized to access the CEMS) Prior knowledge of all procedures and the audit objectives will help to avoid problems and will allow the audit to proceed as planned and in a timely manner You should also check plant-specific safety requirements with the source and what safety equipment you will need
Level 1 unannounced audits of a Part 75 monitoring system are often performed as part of the overall unannounced air compliance inspection of the facility If you conduct a Level 1 audit as part of an unannounced inspection you should also go over the inspection procedures and requirements as outlined in the previous paragraph when you arrive at the facility Unannounced audits may not be as productive since the sources often rely on outside contractors or personnel from other sites to perform certain tasks It is therefore more productive to coordinate with the source before the audit to make sure that the proper personnel are present to answer any questions that might arise during the audit
34 Materials to Bring
The inspector should bring personal safety equipment (eg hard hat safety glasses safety shoes hearing protection etc) as provided by agency policy Useful materials and data sheets to bring on the field audit include
Note
Section 15 of this manual contains information to help you find related documents including regulatory text for Part 60 and Part 75 and the Parts 75 and 76 Policy Manual
MDC printout of the monitoring plan
MDC printout of linearity and RATA reports
MDC printout of recertification and missing data reports
Appropriate Part 60 reference method requirements if observing a RATA
Part 75 Field Audit Manual ndash July 16 2003 Page 55
Audit Preparation Section 3
Checklists and data entry forms (see Appendix A of this manual)
Part 75 Rule (see easy-to-use version maintained on CAMDs website)
Parts 75 and 76 Policy Manual (bring and leave in car for reference as needed)
Copy of Acid Rain permit or operating permit monitoring provisions
Page 56 Part 75 Field Audit Manual ndash July 16 2003
Section 4 On-Site CEMS Inspection
This section describes the primary on-site activities that will apply to any field audit for a Part 75 CEMS
Outline of Section 4
41 Pre-Audit Interview 42 Calibration Error Test 43 ProbeSensors Sample Lines and
Sample Conditioning Systems 44 Gas Analyzers 45 Calibration Gases 46 Flow Monitors 47 DAHS 48 Maintenance Log and Daily Checklists
Review 49 QAQC Plan Review
The field audit will consist of an initial interview (Section 41) the walk through and inspection of the various components of CEMS (Sections 42 -47) and a review of QA and maintenance records (Sections 48 and 49) If you are conducting a Level 2 audit you will also observe performance tests (Section 5) For a Level 3 audit you will conduct certain performance tests (Section 6) In each case you will complete your audit with an exit interview and final report (Section 7)
You should not consider the organization of this section as suggesting a specific order to the audit For example this section discusses conducting a walk-through visual observation of all equipment first followed by a review of the QAQC plan and recordkeeping In many audits you may go back and forth between visual observations and records review
In budgeting your time you should spend more time on items that can not be checked or verified off-site from EDR submittals or other file information In addition focus on any potential problems flagged during the pre-audit review For example focus on CEMS and time periods with the most missing data multiple failed QA tests unusual data trends or mistakes in emissions calculations If you analyzed information using MDC or MDC Hourly bring a specific list of the questions and issues based on these pre-audit activities
In conjunction with your own visual observations and records review interviews with plant staff provide important information on how the monitoring systems work and are operated as well as on compliance with Part 75 requirements You should ask the staff how they operate the equipment and perform QA activities and how the QAQC plan is used in relation to the different CEMS and quality assurance components A key auditing technique is to establish a dialogue with personnel at the source and to let them answer your questions by going through their procedures and showing you where they document the procedures
You will want to confirm that actual equipment settings monitor operations and quality assurance activities match the QAQC plan The QAQC plan is an important resource and a Part 75 requirement The QAQC plan is the document that provides detailed procedures for how the CEMS is to be operated If a source is following a complete QAQC plan that covers all of the Part 75 quality assurance requirements and the operating parameters for the monitoring systems then the data can be considered valid at all times that the system is operating within those parameters since the system is being operated as it was during the RATA If the QAQC plan is not followed or is incomplete then it is questionable whether the emissions data are of the same quality as was demonstrated during the RATA You may also
Part 75 Field Audit Manual ndash July 16 2003 Page 57
On-Site CEMS Inspection Section 4
find that the procedures currently in use are appropriate but the QAQC plan has not been updated Many of the recommended checks in this manual refer back to the QAQC plan
One critical step is to verify that the CEMS components match those in the monitoring plan If changes have been made you need to determine if the proper recertification testing or diagnostic testing has been performed Part 75 quality assurance begins with the initial certification of the CEMS and any changes since that certification need to be evaluated for their effect on CEMS data
Identifying Monitoring Hardware Recertification Issues
Recertification is required for a replacement modification or change that may significantly affect the ability of a CEMS to accurately measure monitored parameters
bull Complete System Replacement bull Analyzer Replacement bull Change in Orientation or Location of Sampling Probe or Site bull Change in Flow Monitor K factor or Polynomial
This is a key issue for audits ee Section 15 of this manual for a link to CAMDs guidance on recertification under Part 75
S
41 Pre-Audit Interview
You should conduct a pre-audit meeting when you arrive at the plant The meeting should include the plant contact the plant CEMS technician assigned to assist with the audit and may include plant management personnel At this time it is important for you to make sure the plant personnel understand the general scope of the audit and to agree upon a tentative audit schedule so that necessary personnel will be available when needed Table 4-1 identifies several items you should discuss in the interview
Page 58 Part 75 Field Audit Manual ndash July 16 2003
Section 4 On-Site CEMS Inspection
Table 4-1Pre-Audit Interview Items
Topic Purpose
Audit purpose and agenda bull Inform facility of the purpose and scope of the audit
bull Streamline subsequent activities bull Allow for meetings with necessary plant personnel
Inspection and audit techniques to be used including hands-off policy and the need for a CEMS technician
bull Streamline subsequent activities bull Identify plant contacts for different parts of the
audit
Specific areas to be observed bull Identify any constraints on visiting locations in the plant
Safety requirements bull Identify necessary safety equipment and plant safety issues
Records to be reviewed and copying needs bull Streamline subsequent activities bull Provide source an opportunity to collect information
during the other audit activities
Notify plant personnel of intent to take photographs or videos to document observed conditions
bull The inspector should ask for permission to take photographs on the plant property and explain the purpose for the photos The source can make a confidentiality claim but emission-related information is public information under the Clean Air Act You should follow your agencys policy on the treatment of confidential business information claims This is not likely to be an issue if photos or videos are limited to the CEMS components
42 Calibration Error Test
Part 75 requires a daily calibration error test This test provides a simple check of most CEMS components and can detect many but not all sources of potential error in the monitoring system
If possible you should observe routine daily calibration error tests as part of any CEMS field audit but often the tests are initiated automatically at a specific time of day Following the calibration sequence the DAHS will typically generate a calibration summary report (presenting the CEMS responses and calculated calibration error results) to record the data for each operating day Daily calibration check results are also reported electronically in the EDR
If the daily checks have occurred before you arrived at the plant review the results of the tests for that day and request the plant contact or CEMS technician to initiate a routine daily calibration test Ask for an explanation of how daily calibrations are performed how the results are used what responses will trigger adjustments and how adjustments are made The specific procedures used to conduct this calibration routine should be described in the QAQC plan available on-site Adjustments are not to be made during the calibration error test When
Part 75 Field Audit Manual ndash July 16 2003 Page 59
On-Site CEMS Inspection Section 4
adjustments are made following a calibration test another calibration error test is required after all adjustments are completed to validate that the adjustment was appropriate
The Daily Calibration Summary form included in Appendix A can be used to compile the daily calibration check data while on-site You should also request a printout from the sources DAHS and compare these values to the values you recorded from the analyzers display For each monitor
Record the gas monitor responses from the zero and upscale calibration gas injections (for dilution systems multiply the monitor data by the dilution ratio to obtain the actual concentration)
For flow monitors record the results of the electronic tests for ultrasonic and thermal flow monitors or the pressure transducer checks for differential pressure monitors
Note the start and stop times and whether the response is stable when the system records the calibration test response Also check that the time taken for the test still provides at least two valid CEMS data points per hour to meet the valid hour requirements of Part 75
Check that the calibration gas flow rates and pressure match sampling conditions
Calculate the results from the monitor data and retrieve the daily calibration error (CE) results from the daily report generated by the DAHS Compare your results to those generated by the DAHS If there is a discrepancy ask about correction factors in the DAHS such as pressure correction factors for dilution probes or similar factors
Compare the calibration error at the zero and high levels to the Part 75 data validation requirements in Appendix B sect 214(a) (see Table 4-2)
If the calibration error check is failed the data from the monitor are invalid and the monitor is out of control until it successfully passes a subsequent calibration error test Missing data routines must be used until the monitor is adjusted and successfully passes a subsequent calibration error test
Page 60 Part 75 Field Audit Manual ndash July 16 2003
Section 4 On-Site CEMS Inspection
Table 4-2 Part 75 Calibration Error Test Data Validation Requirements
Monitored Parameter Calibration Error Requirement (App B sect 214(a))
SO2 or NOx 50 of the Span Value or
5 ppm absolute value of the difference between the monitor response and the reference value if the span value of the monitor is less than 50 ppm or
10 ppm absolute value of the difference between the monitor response and the reference value if the span value of the monitor is greater than 50 ppm but less than 200 ppm
CO2 or O2 10 CO2 or O2
H2O 60 of the Span Value Moisture monitor systems composed of wet and dry O2 monitors must meet the O2 calibration error requirement of 10
Flow 60 of the span value or
002 inches of water absolute value of the difference between the monitor response and the reference value if the monitor is a differential pressure type
You should also compare the CE results you obtain to the results of the most recent automatic calibration error test that occurred earlier in the day of your audit or on previous days Previous calibration error tests usually can be brought up on the DAHS visual display screen If there is a significant shift in the CE results from that previous test ask the facility contact if they can explain the shift Were adjustments made to the monitoring system(s) that could cause the shift Does the shift indicate that adjustments are necessary
Routine adjustments of the monitor are allowed after successful calibration error tests These adjustments are to be made to bring the monitor as close as practicable to the calibration gas tag value or flow reference signal If the monitor is physically adjusted by a person a follow-up calibration error test is required to verify that the adjustment was performed properly No follow-up calibration error testing is required when only a mathematical adjustment is made automatically by the DAHS These mathematical adjustments are similar to an internal bias adjustment factor in that the DAHS evaluates the response in comparison to the reference value and assigns from that time forward an adjustment factor which is used to adjust the data for reporting If this type of adjustment is used the inspector should determine at what point the source physically adjusts the calibration of the analyzer (ie what the range of acceptable calibration error adjustment factors is) Typically sources that use the auto adjustment in this manner physically recalibrate when the mathematical adjustment exceeds 25 percent of the span The criteria that are used should be documented in the sources QAQC plan
Part 75 Field Audit Manual ndash July 16 2003 Page 61
On-Site CEMS Inspection Section 4
43 ProbeSensors Sample Lines and Sample Conditioning Systems
Most of the suggested checks of the probesensors and the sample lines do not require a visual check of the actual probesensors or lines The probesensors and sample lines may not be easily accessible and may be located in a confined space that your agencys (or the plants) safety policies prohibit you from entering Access to the gas sampling probe and flow monitor probesensors also may require climbing ladders or working at substantial heights
431 ProbeSensors
You should ensure that the probesensors are in the same location as when the unit was certifiedrecertified (as detailed in the monitoring plan) -- changes in probesensors orientation or location require recertification of a CEMS A hardcopy submittal of the monitoring plan will contain a diagram with the probesensors location A copy should have been submitted to the State agency If it is not available in your files it should be on file at the plant In addition ask how frequently the probesensors are inspected if there have been any problems (plugging for example) and if the probesensors or a component have been recently changed The change might also require recertification or diagnostic testing
Flow Monitors
In addition for flow monitors you could ask the source representative to perform a daily interference check as required by App B sect 212 or review the results of the most recent interference tests The daily interference check tests the flow monitor probe or sensors sample lines and temperature transceiver for plugging or malfunctioning
The interference test procedure should be identified in the QAQC Plan Go over the interference test procedures with the source representative and ask if there have been any recent failures and what corrective action was taken Some interference checks for various types of flow monitors are described below
Differential Pressure - Regular back purge of probe and sample lines Back purge flow or measured flow is monitored and compared to baseline values to indicate if there is a plugging problem There may also be a moisture removal system or a heated sample line
Ultrasonic - Purge air blowers may be installed to prevent particulate build up on the transceivers and purge air flow rate is monitored Units without purge air blowers can monitor signal strength to identify particulate build up
Thermal - Temperature sensors may have an auto self clean feature which heat the sensors to burn off particulate build-up and help avoid moisture condensation Another approach uses short high pressure blasts of air Interference can be tested by checking the stack temperature measured by both sensors or by comparing the sensor measurements against calibration data
Page 62 Part 75 Field Audit Manual ndash July 16 2003
Section 4 On-Site CEMS Inspection
Table 4-3ProbeSensor Check Summary
What to Check Description
All ProbeSensor Types
Is the probe in the same stack or duct location as in the monitoring plan
Visually compare probe location to location on the diagram submitted with the monitoring plan A measurement of distances from disturbances or stackduct diameter are not necessary
Has the duct or stack location been modified (Dimensions)
Ask the source representative and note during a check of CEMS maintenance logs These ductstack changes could affect CEMS measurements and may require recertification
How often are the probessensors inspected have there been problems and have the probesensors or components been changed
Ask the source and note during a check of CEMS QAQC Plan and maintenance logs
Flow Monitors
Ask the source to perform a daily interference check or review the results of the most recent interference check
Appendix B sect 212 requires a daily interference check for flow monitors Each flow monitor is to be designed to provide a means for checking interference from plugging of each sample line and sensing port and malfunction of each resistance temperature detector (RTD) transceiver or equivalent
432 Sample Lines
Extractive Gas CEMS Sample Lines
The daily calibration error test (see Section 42) provides the best check on whether gas sample line leaks are diluting the sample gas measured by the analyzer The daily calibration error test should also detect most problems from condensation However for source level extractive NOx systems that do not have an SO2 analyzer if practical you should also visually check the umbilical line as it enters the CEM shelter Look for loops or sags in the line as well as moisture droplets Because calibration gases do not have significant amounts of NO2 the daily calibration error test for a NOx monitor may not detect a negative bias from absorption of NO2 by condensed water
Differential Pressure Flow CEMS Sample Lines
Manual or automatic quarterly leak checks are required for differential pressure flow monitors (Appendix B sect 222) The test criteria are not specified by Part 75 Most often the test checks the line after the probe flange by closing the line and holding a steady pressure for a specified time Check how and when the tests were performed The test date and results (passfail) are reported in the EDRs so you can confirm the reported electronic results with on-site data If a recent test failed find out what was done to correct the problem A failed leak
Part 75 Field Audit Manual ndash July 16 2003 Page 63
On-Site CEMS Inspection Section 4
test results in out of control data until the leak is fixed and a subsequent leak check is passed (Appendix B sect 223(g))
433 Dilution Air and Gas Sample Conditioning Systems
The majority of Part 75 gas CEMS are extractive systems that transport the stack gas from the stack to an analyzer The checks described in the next two sections relate to the systems that condition the stack gas for analysis
4331 Dilution Extractive Systems
Dilution systems are frequently used for Part 75 compliance These systems dilute the stack gas with clean dry air prior to the analyzer The ratio of sample taken from the stack to dilution air is the dilution ratio and is an important parameter of a dilution system How that ratio is maintained or what mathematical compensations are made to account for changes in the ratio is important to cover during an audit
Dilution Air Ratio
The following questions may be useful for auditing dilution extractive CEMS systems
What is the dilution ratio and how is it verified This should be described in the QAQC plan
Is the dilution probe ejector pump vacuum at or below the certification value The ejector vacuum affects sample flow if it decreases below the values which creates critical flow through the orifice How often does the source check the ejector vacuum as well as the dilution air and analyzer flow settings Some systems automatically adjust the dilution air pressure from a pressure transducer signal so ask how this works Again these activities should be described in the QAQC plan
Check if any corrections are applied to the dilution ratio for changes in pressure temperature or molecular weight (See Section 2331 on gas density effects) These corrections are typically applied by the DAHS and should be described in the QAQC plan Also find out if there have been any changes in the factors since the last RATA because a RATA is required following a change in these factors
You should also ask the source if the dilution probe orifice has been changed The orifice controls the sample flow rate if the orifice has changed it may have changed the dilution ratio You can also check this during the maintenance record reviews
If the orifice has been changed ask the source if there is a procedure for doing this in the QAQC plan In addition ask what prompts making a change Replacing a dilution probe orifice with one of the same size requires diagnostic testing while replacement by a different sized orifice requires recertification Check to see that the appropriate testing has been completed
Page 64 Part 75 Field Audit Manual ndash July 16 2003
Section 4 On-Site CEMS Inspection
Dilution Air Cleaning System
The dilution air supplied to the dilution probe must be treated to remove contaminants that could interfere with the analyzers The dilution air cleaning system removes moisture CO2 particulate matter hydrocarbons and other contaminants that may be present in ambient air A good place to start is simply to ask the source representative how the system works You should also investigate maintenance practices For the air cleaning system ask the source how often the filters are changed and at what point drying agents are replaced Again this should be verified against the QAQC plan documentation You can also ask to see a copy of the filter replacement documentation in either the maintenance log or a copy of the daily checklist You can check the inlet and outlet pressures of the CO2 filter and compare to the appropriate range for the inlet and outlet pressure in the QAQC plan Find out from the source how often these pressures are checked and how these checks are documented
Table 4-4Summary of Dilution Air System Checks
What to Check Description
Has the dilution probe orifice been bull The orifice controls the sample flow rate so a change in the changed orifice will affect the dilution air ratio Ask the source
CEMS operator if the orifice has been changed since the last RATA and note maintenance records for any evidence of changes (Section 47)
bull If the orifice has been changed ask if there is a procedure for changing the orifice in the QAQC Plan what prompts a change and how is the dilution ratio verified
bull If it has been changed confirm that necessary diagnosticrecertification testing was performed
Is the dilution probe ejector pump vacuum at or below the certification value
bull Ask the CEMS operator how often they check the ejector vacuum as well as the dilution air and analyzer flow settings and ask whether the values are recorded and what are the proper settings
bull Also ask the operator to show that the pressure gauges or rotameters are set in accordance with the QAQC plan and ask how often the values are verified and documented
Are the dilution ratio and dilution air and analyzer flow settings properly set
Are correction factors applied to the dilution ratio for changes in pressure temperature or molecular weight ve these been changed since the last RATA
bull Some systems apply correction factors to the dilution ratio to account for changes in gas density nges to the correction factors should be recorded in the maintenance log and the QAQC plan should outline the procedures for changing the correction factors TA should be performed following any change
Ha
Cha
A RA
(cont)
Part 75 Field Audit Manual ndash July 16 2003 Page 65
On-Site CEMS Inspection Section 4
Table 4-4Summary of Dilution Air System Checks (cont)
What to Check Description
Check the inlet and outlet pressures of CO2 air cleaner filter
bull Ask the CEMS operator how often they check the CO2 air cleaner filter inlet and outlet pressures if the values are recorded and the proper setting
bull Also ask how often the filters are changed and at what point drying agents are replaced Again this should be verified against the QAQC plan documentation
Check CO2 air cleaner
4332 Source Level Extractive Systems
Source level extractive systems transport the stack gas to the analyzer without dilution These systems also are described as direct extractive or non-dilution systems These systems may measure emissions on either a wet or dry basis Wet systems need to maintain the extracted sample at a temperature above the dew point of the sample to avoid condensation in the umbilical lines Therefore each component of the sampling and analysis system in a wet extractive system must be heated Dry systems require some sort of moisture removal either through condensation or permeation driers as well as heating of the components upstream of the moisture removal system The daily calibration error test may show problems related with the conditioning system (except for NOx systems as noted in Section 432)
In addition to observing a daily calibration error test ask the source representative to describe what maintenance is performed on the conditioning system and check that information against the maintenance log and QAQC plan You can also check the chiller temperature if water is removed by condensation and compare the temperature to the acceptable ranges in the QAQC plan These system checks are summarized in Table 4-5
Table 4-5Summary of Source Level Extractive System Checks
What to Check Description
Observe a daily calibration error test Ask the source to perform a test This can be initiated by the source representative from the analyzer or DAHS (See Section 42)
Check the umbilical lines entering the CEM shelter for condensation
Visual check as described earlier in Section 432 Are there water droplets visible in the line
For a dry system using chillers check the chiller temperature
Ask the CEMS operator what the proper temperature range is and how often it is verified pare against the QAQC plan
Check general conditioning system maintenance practices
Ask the source representative how the conditioning system is maintained re to the QAQC plan and check the maintenance records
Com
Compa
Page 66 Part 75 Field Audit Manual ndash July 16 2003
Section 4 On-Site CEMS Inspection
44 Gas Analyzers
Analyzers for extractive systems often are located in a CEM shelter and generally will be rack-mounted and connected to the conditioning system usually with a sample manifold Inshysitu analyzers are located on the stack or duct or in the annulus between the stack and stack liner
In checking the analyzers it is important that you first verify that each analyzer in use is the same as the one thatReminder - MDC Monitoring
Plan Report
A printout of the MDC monitoring plan report can be used as a convenient check off sheet when verifying the serial numbers of CEMS components
was previously certified or recertified Analyzers may have been changed without the notification and recertification required by Part 75 (Subpart C sect 7520(b)) As noted in previous sections it is important that the source certifies the equipment actually in use
Analyzer DisplaysAlarms
Displays and alarms will vary by analyzer model You should ask the plant contact what displays and alarms are in the model that the source uses and what they indicate The displays should show that the analyzer is operating properly An alarm light may show a potential or developing problem which should be addressed as described in the QAQC plan Ask the source when an alarm last occurred and what caused the alarm This information should be recorded in the maintenance log
Flow Rate
Check the sample flow rate to each analyzer It may be displayed digitally or by a rotameter The proper flow rates should be identified in the QAQC plan
Range Settings
Ask the source what the range settings are for each analyzer and how these settings are displayed Compare the settings to the monitoring plan (RT 530 Column 49) You should also check to see if the source has conducted an annual spanrange check as required by Part 75 Appendix A sect 21 The range may need to be changed if that setting is not representative of the concentrations being measured or if the stack concentrations have changed (such as a change in fuel supply or new control equipment) The rule requires that the evaluation of the MPC MEC span and range for each gas monitor be conducted at least once a year
Span versus Range Under Part 75
bull The span is the calculated quality-assured portion of a monitors measurement range
bull The span is equal to 10 to 125 times the Maximum Potential Concentration (MPC) or Maximum Potential Stack Gas Flow Rate (MPF)
bull The range is the actual setting of the monitor
bull The range is to be set so that the majority of readings fall between 20 to 80 of the range selected
Range is always gt Span
Part 75 Field Audit Manual ndash July 16 2003 Page 67
On-Site CEMS Inspection Section 4
Correction Factors
A correction factor may be applied to NOx analyzer data to account for NOx quenching effects Corrections may also be applied to moisture monitors The correction is applied to the analyzer data by the DAHS You should ask if there have been any correction factor changes since the last RATA Any change should be recorded in the maintenance record and the procedures for making the change in the QAQC plan Verify that a RATA has been performed following the change (see sect 7520(b))
Table 4-6Summary of Analyzer Checks
What to Check Description
Have analyzers been changed without the notification and recertification required by Part 75 (Subpart C sect 7520(b))
Ask the source if there have been any changes since the last audit or certificationrecertification Document the serial numbers and compare to those in the monitoring plan
Status of the control panel lights indicators and alarms Displays should show that the analyzer is on and operating properly
The displays will vary by analyzer so ask the source what the displays are and what they mean An alarm light could indicate a potential problem that needs to be addressed (check QAQC plan)
Check range setting and whether the source has performed the annual spanrange check required by Appendix A sect 21
Ask the operator what the range settings are and how they are displayed Compare the range setting to the value in the monitoring plan (RT 530) and the results of the recent spanrange check
Check the sample flow rate Compare the sample flow rate if displayed by a rotameter or a digital reading to the QAQC plan
Have there been any changes to correction factors (NOx quenching and moisture monitors) since the last RATA
Changes to the correction factors should be recorded in the maintenance log and the QAQC plan should outline the procedures for changing the correction factors A RATA should be performed following any change QA testing may also be required (see sect 7520(b))
45 Calibration Gases
Calibration gas cylinders are used for daily zero and span calibrations andor linearity checks You should spot check a number of the calibration gases to verify that the gases in use meet protocol gas requirements in Part 75 that the calibration gas concentrations meet Part 75 quality assurance test requirements and that the values are entered correctly in the DAHS You also can visually check the delivery system
Make a note of the cylinder gas numbers (an engraved ID number stamped on the cylinder) and check the gas certificate for each ID number for the following information (the certificate should be on the cylinder on file electronically or in hardcopy at the facility)
Page 68 Part 75 Field Audit Manual ndash July 16 2003
-- ----
Section 4 On-Site CEMS Inspection
Meets Calibration Gas Certification Requirements
Expiration Date Cylinder gases are not certified after the expiration date The use of an expired cylinder is not in compliance with sect 7521(c)
Check the type of gas certification Part 75 requires the use of a calibration gas as defined in sect 722 Table 4-7 below describes the types of permissible Part 75 calibration gases
Meets Gas Concentration Requirements
Check that the zero air calibration gas concentrations are certified by the supplier to meet the concentration limits in sect 722 (See Table 4-7) Zero air material is a calibration gas that may be used to zero an SO2 NOx or CO2 analyzer Zero air material has an effective concentration of 00 for the component being zeroed (SO2 NOx and Total Hydrocarbons 01 ppm CO 1 ppm or CO2 400 ppm) and is free of certain other interfering gaseous species A zero air cylinder containing a multi-component mixture should be certified that it meets the concentrations above and that other components do not interfere with the CEMS reading For more on zero air calibration gas or zero air materials see Questions 102 and 103 in the Parts 75 and 76 Policy Manual
Determine the cylinder gas concentration values and verify that the values are in the correct range for the instrument span You also should record the concentrations to make sure the values are consistent with the values entered into the DAHS for daily calibration error and linearity tests The ranges for the low medium and high linearity points are
Low level 20 - 30 of span Mid level 50 - 60 of span High level 80 - 100 of span
Part 75 Field Audit Manual ndash July 16 2003 Page 69
--
--
On-Site CEMS Inspection Section 4
Table 4-7Part 75 Calibration Gases (Appendix A sect 51)
Calibration Gas Type Acronym Description
NIST - standard reference material
SRM Calibration gas obtained from the National Institute of Standards and Technology (NIST)
NIST - standard reference material-equivalent compressed gas primary reference material
PRM Gas mixtures listed in a declaration of equivalence in accordance with section 212 of the EPA Traceability Protocol for Assay and Certification of Gaseous Calibration Standards September 1997 EPA-600R-97121 (EPA Traceability Protocol)
NIST - traceable reference material
NTRM Calibration gas mixture tested by and certified by NIST to have a certain specified concentration of gases
NISTEPA-approved certified reference materials
CRM Calibration gas mixture that has been approved by EPA and NIST as having specific known chemical or physical property values certified by a technically valid procedure as evidenced by a certificate or other documentation issued by a certifying standard-setting body
Gas manufacturers intermediate standard
GMIS Compressed gas calibration standard that has been assayed and certified by direct comparison to an SRM an SRM-equivalent PRM a CRM or a NTRM in accordance with section 2121 of the EPA Traceability Protocol
EPA protocol gas Vendor-certified to be within 20 percent of the concentration specified on the cylinder label (tag value) using the uncertainty calculation procedure in section 218 of the EPA Traceability Protocol
Zero air material Calibration gas certified by gas vendor SO2 NOx and Total Hydrocarbons 01 ppm CO 1 ppm or CO2 400 ppm If a mixture the other components are certified not to interfere with the CEM readings for the target compound
Research gas mixture RGM Calibration gas mixture developed by agreement of a requestor and NIST that NIST analyzes and certifies as NIST traceable
In addition to the certificates you should also check the calibration gas line pressure gauges to determine the cylinder gas pressure The cylinder should not be used if the cylinder gas pressure is below 150 psi (This requirement is in the EPA Traceability Protocol for Assay and Certification of Gaseous Calibration Standards sect 2164) You should check to see if the facility checks cylinder pressure as part of its QAQC plan At what point do they replace a calibration standard Also check the outlet regulator pressure or calibration gas flow rate to see if it matches the QA test procedures in the QAQC plan
Page 70 Part 75 Field Audit Manual ndash July 16 2003
Section 4 On-Site CEMS Inspection
Table 4-8Summary of Calibration Gas Checks
What to Check Description
Check the certificates for the expiration date of the cylinder gas
Gas cylinders may have expired dates Cylinder gases are not certified after expiration date and the use of an expired cylinders is not in compliance with sect 7521(c)
Check the calibration gas type (certified EPA Protocol or other)
Gas certifications must meet the definitions in sect722 Check the type of cylinder gas against the descriptions in Table 4-7 and sect 722
Check the zero air material documentation to ensure that it is properly certified
Calibration gas used to zero a gas analyzer See Table 4-7 for the zero air material concentrations defined in sect 722 (Also see Policy Manual questions 102 and 103)
Check the concentration values for each cylinder and that the cylinder calibration tags are withing the correct concentration range for the span
Linearity test point ranges are shown below Low level 20 - 30 of span Mid level 50 - 60 of span
High level 80 - 100 of span
Record the concentration values to check against the values recorded by the DAHS for calibration error and linearity tests
This check is to ensure that the proper cylinder gas concentration values have been entered into the DAHS for calculation of daily calibration error tests
Read the cylinder regulator pressure The cylinder should not be used if the cylinder gas pressure is below 150 psi (EPA Traceability Protocol for Assay and Certification of Gaseous Calibration Standards sect 2164)
Check the regulator outlet pressure The pressure or calibration gas flow rate should be set as specified in the QA test procedures in the QAQC plan
46 Flow Monitors
In addition to the daily calibration error tests (Section 42) and daily interference tests (Section 431) there are a number of other flow monitor issues you can investigate
Flow-to-Load
There is no equivalent to a linearity test for a flow CEMS In response EPA developed a quarterly comparison of flow CEMS data to unit load data Each quarter the source must conduct a comparison of the hourly flow and load data for any hour in which the unit load is within plusmn 10 of the average load during the most recent RATA As part of your pre-audit checks you should note whether the source conducted this test as required and whether the test was passed If there are issues with the test conducted at the facility go over those issues with the source representative while on site
Part 75 Field Audit Manual ndash July 16 2003 Page 71
On-Site CEMS Inspection Section 4
TemperaturePressure Monitoring
Check to see if there are monitors for stack temperature andor stack absolute pressure associated with the flow monitor Ask the source what type of QAQC procedures are followed for these monitors (what is checked and on what schedule) and if there have been any problems with these components You can compare to the QAQC plan or maintenance records
K-factors
A k-factor refers to a correction factor or polynomial coefficient used by the DAHS to correct the flow monitor measurement for flow variables not measured by the monitoring method as well as for measured changes in stack pressure and temperature The factors are set based on a pre-RATA test in which the source correlates the monitor measurement to the RATA flow reference method results
Changing the k-factors or polynomial coefficients does not require recertification but does require that a three load RATA be performed (sect 7520(b)) as a diagnostic test event You should ask when the last time the correction factors were changed and why and check that the RATA was performed The changes should be recorded in the maintenance log and a procedure outlined in the QAQC plan
DisplaysAlarms
As in the case of gas analyzers the displays and alarms will vary by manufacturer You should ask the plant contact what displays and alarms are in the model that the source uses and what they indicate Information on alarms and corrective action should be recorded in the maintenance log
SpanRange
Ask the source what the range settings are for the flow monitor and how these settings are displayed Compare the settings to the monitoring plan (RT 530 Column 49) You should also check to see if the source has conducted an annual spanrange check as required by Part 75 Appendix A sect 21 (See the spanrange discussion in Section 44)
Page 72 Part 75 Field Audit Manual ndash July 16 2003
Section 4 On-Site CEMS Inspection
Table 4-9Summary of Flow Monitor Checks
What to Check Description
Observe andor review daily calibration error test and interference test
See Sections 42 and 431
Review any issues observed in reported results of flow-to-load tests
See Appendix B sect 225 for requirements of flow-to-load tests Make sure the test was performed and that the results were properly calculated If the source is excluding hours from the analysis as allowed for in Appendix B check to see that the exclusions meet Part 75 criteria
Identify if temperature and stack pressure are monitored and what QAQC procedures apply
Temperature and pressure may be monitored in conjunction with the flow monitor Note the QA and preventive maintenance procedures and schedule Ask if there have been any problems and corrective actions Check the QAQC plan and maintenance records
Check if there have been any changes to k-factors and polynomial coefficients since the last RATA
Changes to the correction factors should be recorded in the maintenance log and the procedures for changing the correction factor outlined in the QAQC plan A three load RATA is required following any change to flow monitor k-factors (sect 7520(b))
Status of the control panel lights indicators and alarms Displays should show that the analyzer is on and operating properly
The displays will vary by analyzer so ask the source what the displays are and what they mean An alarm light could indicate a potential or developing problem that needs to be addressed (check the QAQC plan)
Check range setting and whether the source has performed the annual spanrange check required by Appendix A sect 21
Ask the operator what the range settings are and how they are displayed Compare the range setting to the value in the monitoring plan (RT 530) and the results of the recent spanrange check
47 DAHS
The data acquisition and handling system (DAHS) consists of all the hardware and software used to comply with Part 75 electronic recordkeeping and reporting requirements It is a critical component of the monitoring system as it converts the analyzer signal to reported emissions data The on-site audit of the DAHS focuses on data handling issues that can not be checked electronically These checks fall into three areas
DAHS certification and verification of missing data routines and emission calculations Changes in correction factors Manually entered data
Part 75 Field Audit Manual ndash July 16 2003 Page 73
On-Site CEMS Inspection Section 4
471 DAHS Certification and Verification Tests
As for other components of the plants CEMS make sure that the DAHS version in use has been previously certifiedrecertified by checking against the monitoring plan report you printed out from MDC
Also you should ask to see a copy of the DAHS missing data and formula verification test results Part 75 requires a verification test for the missing data routines and emission calculation formulas as part of the initial certification (sect 7520(c)(9)) and whenever the DAHS is replaced upgraded to support a new EDR version or when the missing data algorithm has been changed (diagnostic testing under sect 7563(a)(2)(iii))
The source is not required to submit the results of the verification tests and there are no MDC or ETS electronic checks of the routines The source is however required to keep these test results on-site and available for inspection so you should note that the tests have been performed and what the results were (including any vendor certification) The missing data routines may be verified either by performing tests using a checking software or by a certification by the DAHS software developer that the software package meets all of the missing data requirements of Part 75 Question 1496 in the Parts 75 and 76 Policy Manual provides more information on the verification testing requirements
472 Changes in Correction Factors
Previous sections on dilution extractive systems analyzers and flow monitors recommended that you investigate what types of correction factors if any are applied to raw data (eg pressuretemperature compensation molecular weight flow and moisture monitoring polynomials sonic velocity correction factors NOx quenching correction factors and dilution ratio settings) In addition you should ask how changes to these correction factors are entered into the DAHS As noted earlier changes to correction factors should be recorded in the maintenance log and the QAQC plan should outline the procedures for changing the correction factors (Appendix B sect 113) Diagnostic QA testing is required for many of these changes (see sect 7520(b))
473 Manually Entered Data
Part 75 requires that the DAHS automatically record all emissions data and the daily calibration error checks (Appendix A sect 4) There are a few exceptions which allow manual entry or editing of data which are shown in the text box Check how various types of data are entered manually by asking the source to explain their procedures and by reviewing the QAQC plan and the hardcopy supporting
Manual Data Entry Allowed by Part 75
bull Negative (lt 0) emission values bull Erroneous emission values (if significant
must be approved by EPA) bull SO2 concentration lt 20 ppm bull Reference method back-up data bull RATA reference method data and RATA
results bull Leak checks 7-day calibration error tests
and cycle time tests bull Operating data (load and time) bull Missing data periods bull Add-on control equipment operation
during missing data periods
For more information on manual entry or editing see Section IIC3 of the EDR v22 Reporting Instructions (August 2002)
Page 74 Part 75 Field Audit Manual ndash July 16 2003
Section 4 On-Site CEMS Inspection
information for the manually entered data A number of areas you may emphasize are described below
QA Tests
Ask the source how the QA test results (daily calibration error test linearity test and RATAs) are entered into the DAHS If you have not compared a RATA report from the MDC program to plant hardcopy RATA results in your pre-audit review ask for a hardcopy of the report and check that the dates and time relative accuracy and bias adjustment factors (BAF) match Also if you identified problems with QA test calculations go over how that data are entered into the DAHS as well as the applicable QAQC plan procedures For example the BAF may not have been applied correctly to the emission data The BAF should be applied starting with the hour following completion of the RATA
Missing Data
Ask how the source records and reviews missing data How do they check that the substitute values appear correct (eg do the substituted values appear to be correct in view of the percent monitor data availability (PMA) and the length of the missing data period do the substitute NOx and flow rate values change when the load range changes during a missing data period are maximum potential values substituted when the PMA drops below 800 percent) Compare the procedures described to those in the QAQC plan Pick out a recent missing data period (one you may have identified in your pre-audit review) and spot check the electronic data by comparing against supporting hardcopy documentation
Optional Missing Data Routines - Units with Add-on Control Equipment
If the source is using an optional missing data routine for units with add-on control equipment you also may need to review control device parameter monitoring records There are four missing data options for units with add-on controls three of which require parameter monitoring to demonstrate the level of control achieved during the missing data period (sect 7534)
You will first need to check the QAQC plan The facility must identify add-on SO2 or NOx control equipment parameters and acceptable ranges in the plan
sect 7534 Optional Missing Data Procedures for Units with Add-On
Control Equipment
(1) Standard Missing Data Routines with Parametric Supporting Data
(2) No Parameter Data (3) Parametric Missing Data Substitution
Method (4) Parameter Data Used to Support Use of
Maximum Controlled Emission Rate
if the source is using add-on control equipment missing data options (see Part 75 Appendix B sect 111) Ask the source for the parameter monitoring records for a number of missing data periods You may have identified specific missing data periods from your pre-audit preparation Compare the parameter data to the acceptable ranges in the QAQC plan and identify any periods when the parameter range is exceeded Check how the missing data period was then flagged in the DAHS (control operating properly or not operating properly)
Part 75 Field Audit Manual ndash July 16 2003 Page 75
On-Site CEMS Inspection Section 4
Table 4-10Summary of DAHS Checks
What to Check Description
Check that DAHS verification tests have been performed for the missing data routines and calculations
Check the DAHS against the monitoring plan Verification tests for missing data routines and emissions calculations are required for initial certification and if the DAHS is replaced or there have been changes to the software Verification test results for the missing data routines and emissions calculations are required to be kept on site by sectsect 7520(c)(9) and 7563(a)(2)(iii) A vendor certification that the software meets Part 75 requirements is sufficient for missing data routines
Ask the source what type of correction factors are applied to raw data and how they are entered into the DAHS Also ask if any changes have been made
Changes to correction factors should be recorded in the maintenance log and the QAQC plan should outline the procedures for changing the correction factors (Appendix B
sect 113) QA testing may also be required (see sect 7520(b))
Ask what data are entered manually and how Spot check the electronic data with the manual hardcopy
You want to make sure there is documentation supporting the data that is added manually to the DAHS and that QAQC plan procedures are followed Procedures for manually entering data should be documented in the QAQC plan
How are data for the daily calibration linearity and RATA tests recorded Review some recent records to verify that hardcopy and electronic data match
Compare a RATA or linearity report from the MDC program to the plant hardcopy Check that the dates and time relative accuracy (or linearity error) and bias adjustment factors (BAF) if applicable match
Review parameter monitoring records for units using the optional missing data procedures for add-on control equipment
The QAQC plan will identify control equipment parameters and acceptable ranges (Appendix B sect 111 and sect 7558(b)) Compare the control equipment parameters to the ranges for a missing data period
48 Maintenance Log and Daily Checklists Review
The maintenance logs should detail any maintenance performed on the system and should reference all preventive maintenance performed Appendix B Section 113 requires the facility to keep the following maintenance records
Date time and description of any testing adjustment repair replacement or preventive maintenance action performed on any monitoring system
Records of any corrective actions associated with a monitors outage period
Any adjustment that changes a systems ability to record and report emissions data must be recorded (eg changing of flow monitor or moisture monitoring system polynomial
Page 76 Part 75 Field Audit Manual ndash July 16 2003
Section 4 On-Site CEMS Inspection
coefficients K factors or mathematical algorithms changing of temperature and pressure coefficients and dilution ratio settings) and
A written explanation of the procedures used to make the adjustment(s)
During the inspection you should begin by asking the CEMS technicians to describe what goes wrong with equipment what breaks and what maintenance is required Ask how they knew something was wrong and what they did about it Also ask what QA tests were done to show that the problem was resolved Make sure you understand what they are saying as their terminology may not always match the Part 75 rule terminology For example the plant personnel may refer to a daily calibration error test as a system cal overboard cal or span check
Then check the maintenance log book to see how the information is recorded You should point out any entries that you do not understand and explain why you do not understand the entry Compare to the QAQC plan to determine whether the source is implementing the preventive maintenance procedures You should also review the maintenance log to identify recertification events and adjustments that have been made to the systems which could affect the monitored data The maintenance log may also provide another check on handling of missing data periods and it can verify that linearity tests and RATAs were performed on the dates identified in the EDR
Some checks may include
Do the log entries sufficiently describe the action taken Are the entries understandable
Does the log show maintenance checks at the frequency identified in the QAQC plan
Are there recurring failures or malfunctions recorded in the log
Are malfunctions resolved as specified in the QAQC plan Are calibration error tests or other required QA tests performed before the CEMS is returned to service
Do events in the maintenance log correspond to reported missing data periods in the quarterly reports
Are there repeated adjustments to the zero or span
Have system parts or components been replaced If so has the proper recertification or diagnostic testing been performed
Are corrective actions recorded for malfunctions or as a result of daily calibration error tests or other performance tests
Are the nameinitials of the person performing task or logging data provided (While this is not required it is important for the log entries to be traceable to the person who makes the entry so that further questions can be answered if needed)
Part 75 Field Audit Manual ndash July 16 2003 Page 77
On-Site CEMS Inspection Section 4
49 QAQC Plan Review
The QAQC plan has been referenced throughout the previous sections At a minimum a QAQC plan should describe the detailed procedures and operations for calibration error and linearity tests calibration and linearity adjustments preventive maintenance and any adjustments to the system spare parts list a troubleshooting matrix and recordkeeping and reporting For units with add-on SO2 or NOx emission controls the QAQC plan may also contain (for missing data purposes) add-on emission control parameters and the range for each parameter representative of the normal operating conditions Required elements in the QAQC plan are summarized in Table 4-11 You should note that Part 75 allows electronic storage of the information in the QAQC plan provided that the information can be made available in hardcopy upon request during an audit The plan may also reference manufacturers operating manuals
Reviewing QAQC plan information is an important aspect of the on-site inspection activities described throughout the previous sections A recommended approach to inspecting various aspects and components of a plants CEMS QA program is to
Ask the plant staff to explain how they operate the equipment and perform QA and maintenance activities
Observe and record your own observations of procedures plant documentation and equipment settings
Compare the QAQC plan description of the equipment settings monitoring operating procedures and QA test procedures to actual operations at the plant
You should note instances where actual plant operations are different from the operations described in the QAQC plan and ask for an explanation Determine and discuss whether the actual procedure or the QA plan procedures meet Part 75 requirements In some cases the actual operations may be appropriate but the QAQC plan may need to be updated Clearly you should also note areas where the actual operations and QAQC plan match but neither meet Part 75 requirements
In addition to examining specific elements of the QAQC plan where there are discrepancies or potential problems you may also do a general review of the QAQC plan to check that the plan covers the Part 75 elements as shown in Table 4-11 Particular areas to focus on are the QA test procedures CEMS adjustment procedures and preventive maintenance procedures
Page 78 Part 75 Field Audit Manual ndash July 16 2003
Section 4 On-Site CEMS Inspection
Table 4-11 Checks for QAQC Plan Elements
What to Check Part 75 Requirement
Is there a written QAQC plan (it may be stored electronically but Appendix B sect 1 should be available) and when was it last updated
Are calibration error test and linearity test procedures outlined in the plan
Appendix B sect 121
Are calibration and linearity test adjustment procedures outlined Appendix B sect 122
Are RATA test procedures provided Appendix B sect 123
Are emissions and QA test recordkeeping and reporting procedures including missing data procedures included
Appendix B sect 112
If using add-on control equipment missing data options are control equipment parameters identified
Appendix B sect 111
Are procedures for preventive maintenance and Part 75 recordkeepingreporting identified
Appendix B sectsect 111 and 2
Part 75 Field Audit Manual ndash July 16 2003 Page 79
On-Site CEMS Inspection Section 4
[This page intentionally left blank]
Page 80 Part 75 Field Audit Manual ndash July 16 2003
Section 5 CEMS Performance Test Observation
Section 5 covers how you should observe CEMS performance tests (linearity tests and RATAs) u will generally observe a performance test in conjunction with the on-site CEMS audit activities outlined in Section 4
Yo
51 Introduction
In addition to the basic step of observing a daily calibration error test (see Section 42) EPA encourages all States and Regional Offices to conduct level 2 audits that include a RATA or linearity test observation These performance tests are a critical element of the Part 75 QA program The RATA in particular serves as the primary measurement of CEMS accuracy The presence of an agency observer can serve as an effective tool for ensuring that the source carries out the testing properly and that the results of the tests provide a valid assessment of data quality
During the performance test observation you should document any deviations from the test protocol You should provide copies to the source to avoid misunderstandings about any decisions you may make The observer should notify the tester immediately if there is a question as to whether or not any test procedures comply with Part 75 requirements so that the tester can take corrective action and if necessary restart the testing
Once the performance test is started and until it is concluded the only adjustments that may be made to the monitor are routine calibration adjustments towards the calibration gas or reference signal value that are the result of a regularly scheduled calibration error test This is more likely to occur during a RATA than during a linearity test
The source can make non-routine calibration adjustments (done by physically adjusting the instrument response using analyzer controls) before the linearity or RATA and at other times provided the QAQC plan includes specific criteria for the adjustment A calibration error test must be performed following the adjustment (Part 75 Appendix B sect 213) You should note if any adjustments were made prior to the performance test and review plant maintenance records for documentation of the adjustment (Part 75 Appendix B sect 113)
Calibration error tests are often performed prior to a linearity test or RATA As discussed earlier with respect to monitor adjustments you should ask the source if a calibration error test was performed prior to the linearity or RATA to be observed what the results were and if any adjustments were made RATA and linearity tests should not be conducted on a system that is out-of-control with respect to the calibration error requirements
Appendix A contains observer checklists to assist you in observing the performance tests You should also be familiar with the Part 75 performance test requirements in Appendix A sectsect 62 and 65 and the Part 60 reference methods used in the RATAs
Part 75 Field Audit Manual ndash July 16 2003 Page 81
Performance Test Observation Section 5
52 Linearity Test
A linearity test for a gas CEMS is conducted by challenging the CEMS with three audit gases one having a value of 20 to 30 percent a monitors span the second a value of 50 to 60 percent of span and the third a value of 80 to 100 percent of span Flow and moisture monitors are not subject to the linearity test requirements and SO2 and NOx monitors with spans 30 ppm also are exempt The source must conduct a linearity test every quarter (although exceptions for low operating hours and grace periods may apply) For a dual range analyzer the test is performed for each range used during the applicable quarter
The CEM system is challenged three times with each audit gas The same gas concentration or level is not to be run twice in succession The audit gas is injected at the gas injection port required in Part 75 Appendix A sect 221
The response to the zero and upscale gases is not immediate but approaches an asymptotic value (See Illustration 5-1) It is important that sufficient time is allowed for the concentration reading to stabilize for each injection of gas Watch the analyzers instantaneous response to see if enough time is allowed to reach a stable fully equilibrated response The time should not exceed 15 minutes Pay the most attention to SO2 since it is the most adsorptive and absorptive (this will delay the equilibration time)
Illustration 5-1Asymptotic Calibration Check Response (Jahnke 1994)
Also note the time required compared to the gas injections for the daily calibration error tests Both times should be about the same If they are not ask the source why this is the case Record the analyzers stabilized response and compare to the value recorded by the DAHS The values should be the same The average CEMS response will be taken from the DAHS as the official component for recording the CEMS data These linearity test procedures and requirements are specified in detail in Part 75 Appendix A sect 62
Page 82 Part 75 Field Audit Manual ndash July 16 2003
Section 5 Performance Test Observation
Time Shared Systems
Time shared systems use the same gas analyzers for multiple emission units or time shared systems the 15 minute maximum cycle time requirement for the analyzer gas concentration to stabilize includes the cycle time of each probe location served by the system
F
Appendix A contains an observer checklist Inspect the cylinder gases as outlined in Section 4 record the linearity test results using the checklist and calculate the linearity result for each level Compare the results to the appropriate performance specification listed in Table 5-1
Table 5-1Linearity Test Specifications
Monitored Parameter
Linearity Test Performance Specification (Part 75 Appendix A sect 32)
SO2 or NOx 50 linearity error or
5 ppm absolute value of the difference between the average of the monitor response values and the average of the reference values R-A
CO2 or O2 50 linearity error for each calibration gas concentration or
05 absolute value of the difference between the average of the monitor response values and the average of the reference values R-A
53 Relative Accuracy Test Audit (RATA)
A Relative Accuracy Test Audit (RATA) compares a units CEMS measurements to that of reference method stack tests The reference method tests yield results representative of the pollutant concentration emission rate moisture temperature and flue gas flow rate from the unit The RATA compares these results directly to CEMS measurements The RATA test is the primary measurement of CEMS accuracy for a Part 75 CEMS
Part 75 requires semi-annual or
RATA Reference Materials
Reference Methods in Part 60 Appendix A are available at the Emission Measurement Center website wwwepagovttnemc
Answers to common Part 75 RATA questions are provided in the Parts 75 and 76 Policy Manual at wwwepagovairmarkets
annual RATAs depending on the relative accuracy achieved in the preceding RATA Most units qualify for the annual RATA frequency (Appendix B sect 2312)
Gas RATAs performed at single load levels are often conducted simultaneously and may take about 7 hours The flow RATAs may be conducted at one two or three loads A
Part 75 Field Audit Manual ndash July 16 2003 Page 83
Performance Test Observation Section 5
multi-load RATA may therefore be performed over 2 to 3 days with each load of the flow RATA taking about 3 to 5 hours One load of the flow RATA testing often is conducted at the same time as the gas RATAs Part 75 requires that each RATA be completed within 168 consecutive unit or stack operating hours For multi-load flow RATAs up to 720 consecutive unit or stack operating hours are allowed to complete the testing at all load levels (Part 75 Appendix A sect 65)
Flow RATAs are conducted at load levels in the range of operation that extends from the minimum safe stable load to the maximum sustainable load hree levels apply in this range
Low First 30 of range Mid gt 300 and 600 High gt 600 of range
T
You should ensure that the source performs the RATA according to Part 75 and reference method requirements RATA issues of specific importance to Part 75 requirements include
Unit operating conditions The RATA should be performed while the unit is burning a normal fuel listed in the monitoring plan (App A sect 65(a)) Gas RATAs should be performed at normal load Check the load against the monitoring plan normal load If you have questions about the normal load identified in the plan you may also check load against the most recent load data submitted in the EDR to verify that the current load designation is representative of the loads reported Flow RATAs for peaking units or bypass stacks can always be performed at one load For all other situations the RATA for initial certification or recertification of a flow monitor must be a 3-load test A 3-load flow RATA also is required at least once every 5 years as part of the ongoing QA requirements For units that must conduct a flow RATA on an annual basis the standard QA flow RATA is a 2-load test For units that must conduct a flow RATA on a semi-annual basis the source can alternate between a 1-load and a 2-load test Finally units that operate at 1-load consistently (at least 85 percent of the time) can qualify for 1-load testing instead of the 2-load test (see Part 75 Appendix B sect 2313(c))
Check if the source conducted a daily calibration error test on the CEMS prior to the testing or pre-RATA adjustments While Part 75 allows a source to make pre-RATA non-routine adjustments adjustments may not be made between runs at a load level or between load levels except for routine adjustments as a result of the calibration error test (Part 75 Appendix B sect 213)
Has the source performed and passed a stratification test Stratification testing is required for units wishing to use fewer traverse points under the alternatives allowed in Part 75 Appendix A sect 656(a) and (b) For details on stratification testing see Part 75 Appendix A sect 6561 - 6563
Rake probes should not be used as they do not distinctly capture the required traverse points to ensure that a representative stack sample is obtained for analysis See Policy Manual Question 839
Page 84 Part 75 Field Audit Manual ndash July 16 2003
Section 5 Performance Test Observation
Moisture measurements used to correct dry basis measurements in determining emission rate may not be made using the wet bulb-dry bulb technique Wet-bulb-dry bulb measurements however may be used to determine molecular weight See Policy Manual Question 310
EPA recently promulgated new flow reference methods (2F 2G and 2H) Part 75 sources had raised concerns that Method 2 measurements could be biased high in some situations due to stratified or non-parallel flow In response Method 2F measures yaw and pitch angle adjusted velocity 2G adjusts for yaw angle and 2H accounts for wall effects A detailed observer checklist is available for these methods at CAMDs website and you should refer to that observer checklist if you are observing a flow RATA using one of these new methods Also available for downloading from the website is software (FLOW-CALC) that you can use to enter the reference method data and calculate results See httpwwwepagovairmarketsmonitoringindexhtml
Check that the traverse point locations for the reference method tests meet the requirements of Appendix A sect 656 and the sampling location dimensions Gas tests should typically use at least 3 traverse points Check Performance Specification (PS) 2 in Part 60 Appendix B Units with wet scrubbers may use a shorter measurement line than required by PS 2 if minimal stratification is demonstrated and moisture and gas systems may use a single point if the stratification test is passed (Part 75 Appendix A sect 656) The minimum number of traverse points for a flow test is 12 unless also using Reference Method 2H which requires at least 16 points (Part 60 Appendix B) A source can use more than the minimum number of sample points
Check the reference method calibration gases used for instrumental test methods The calibration gas certificate should show EPA Protocol gases or other certified gases concentrations that match those used in the biasdrift check calculations and an expiration date after the RATA The regulator gauge should show a cylinder pressure gt 150 psi
Verify the relative accuracy and reference method calculations yourself by doing the calculations on site using the raw data You should also obtain a copy or record the results of the RATA testers calculations Make sure that the CEMS and reference method data are for the same runs
Observation forms for flow and gas RATAs are provided in Appendix A The forms have more detailed checks than provided here In addition as noted above an observer checklist for flow reference methods 2F 2G and 2H is available at CAMDs website
Part 75 Field Audit Manual ndash July 16 2003 Page 85
Performance Test Observation Section 5
RATA Reference Methods (Part 75 Appendix A sect 6510)
The following methods from Appendix A to Part 60 or their approved alternatives are the reference methods for performing relative accuracy test audits
bull Method 1 or 1A for determining the appropriate test locations
bull Method 2 or its allowable alternatives including in Appendix A to Part 60 (except for Methods 2B and 2E) for stack gas velocity and volumetric flow rate
bull Methods 3 3A or 3B for O2 or CO2
bull Method 4 for moisture
bull Methods 6 6A or 6C for SO2
bull Methods 7 7A 7C 7D or 7E for NOx excluding the exception in section 512 of Method 7E ing Method 7E for measuring NOx concentration total NOx both NO and NO2 must be measured ithstanding these requirements Method 20 may be used as the reference method for relative accuracy test audits of NOx
monitoring systems installed on combustion turbines
When usNotw
Page 86 Part 75 Field Audit Manual ndash July 16 2003
Section 6 On-Site Inspection of Appendix D and Appendix E Monitoring Systems
Section 6 focuses on the on-site review of fuel monitoring and operating records that are required for units that use the excepted monitoring provisions available to gas and oil fired units ecordkeeping The audit emphasis is on verifying r
Part 75 Appendix D provides an optional monitoring protocol that may be used by gas-or oil-fired units instead of SO2 and flow CEMS It includes procedures for measuring oil or gaseous fuel flow using a fuel flowmeter and procedures for conducting sampling and analysis to determine sulfur content density and gross calorific value (GCV) of fuel oil or gaseous fuels
Part 75 Appendix E is available to qualifying gas or oil fired peaking units as an optional NOx emissions rate estimation procedure that may be used instead of a NOx CEMS Baseline stack testing is performed at four operating levels to establish a NOx rate - heat input curve with NOx rate the dependent variable
61 QAQC Plan Review
The QAQC plan provides a template for performing a review of fuel monitoring and sampling records and is the place to start the field audit for the excepted monitoring provisions of Part 75 Appendices D and E As described in Section 49 you should determine whether the QAQC plan meets the requirements of Part 75 Appendix B and whether the facility is implementing the plan Checks of the QAQC plan and rule requirements for Part 75 Appendix D are identified in Table 6-1 and the checks for Part 75 Appendix E are in Table 6-2
Table 6-1Appendix D - QAQC Plan Review
What to Check Part 75 Requirements
Review the fuel sampling methods and analysis The QAQC plan should include standardprocedures Compare the sampling methods and sampling and analysis procedures used by thefrequencies to the rule requirements outlined in source or its fuel supplier (Appendix B sect 135) the sample Appendix D field audit sheets (seeAppendix A of this manual)
Are the fuel flow meter test procedures and the transducer or transmitter accuracy test procedures outlined in the plan sk the source how often (and how) the tests are performed and compare to the plan and Part 75 requirements
Test procedures are required in the QAQC plan (Appendix B sect 132)
A
(cont)
Part 75 Field Audit Manual ndash July 16 2003 Page 87
Appendix D and Appendix E Monitoring Section 6
Table 6-1Appendix D - QAQC Plan Review (cont)
What to Check Part 75 Requirements
Check the fuel flowmeter transducer or
transmitter calibration and maintenance records Records are required by the QAQC plan provisions in Appendix B sect 133 se records are to include adjustments maintenance or repairs performed on the fuel flowmeter monitoring system as well as records of the data and results for Appendix D fuel flowmeter accuracy tests and transducer accuracy tests
Tho
Table 6-2Appendix E - QAQC Plan Review
What to Check Part 75 Requirement (App B sect 136)
Check the recommended range of QAQC parameters and hourly records of these parameters Make sure the parameters are identified and recorded
The QAQC plan must identify recommended ranges of quality assurance- and quality control-related operating parameters that are recorded each hour There are to be at least 4 parameters for turbines or reciprocating engines and oxygen for boilers (Appendix E sect 232)
Request that the source identify any parameter deviations and ensure proper missing data procedures are used for those hours
The source is required to redetermine the Appendix E correlation if a single deviation period exceeds 16 operating hours
Check written Appendix E NOx emission rate
testing procedures This is another required component of the QAQC plan The procedures should match the test requirements in Appendix E sect 21
62 DAHS and Supporting Records
Elements of the data acquisition and handling system (DAHS) for an Appendix D or Appendix E monitoring systems should be checked in a manner similar to that described under the CEMS on-site inspection in Section 4 of this manual
The DAHS consists of all the hardware and software used to comply with all electronic recordkeeping and reporting requirements Make sure that the version used is previously certifiedrecertified by checking against the monitoring plan and ask to see and check the DAHS verification test for the missing data routines The source is not required to submit these results and there are no electronic checks of the routines Verification test results for the missing data routines are required by sectsect 7520(c)(9) and 7563(a)(2)(iii) The latest test should have occurred no earlier than when the unit began using EDR v21 (or v22 when applicable)
Page 88 Part 75 Field Audit Manual ndash July 16 2003
Section 6 Appendix D and Appendix E Monitoring
Additional checks are necessary to ensure that data entered manually into the DAHS match hardcopy supporting information Fuel sampling data (sulfur content density GCV) may be entered manually into the DAHS Ask the source how these data are entered You should also compare the electronic fuel data in the DAHS to the on-site hardcopy fuel sampling and analysis data to make sure they match The source may pull the electronic data up for you using the DAHS or you may use data that you printed out from MDC Hourly
You should also investigate how emissions data missing data periods and operating parameters are recorded If data are entered by hand you should similarly spot check the electronic data with the hardcopy For Appendix E units check to see that the results from the plants copy of the Appendix E NOx emission rate tests match the curve in the monitoring plan and DAHS This should include checks on the dates and times NOx load and fuel flow values You can use MDCs Appendix E test report function to review the electronic data You should also check the sources hardcopy capacity factor documentation against the capacity factor submitted in the EDR (see Record Type 507)
Table 6-3Summary of DAHS and Supporting Records Checks
What to Check How to Check
Check that the current DAHS version is certified and that a DAHS verification test was conducted for the missing data routines
Compare the DAHS to that identified in the monitoring plan Missing data routine verification test results are required by sectsect 7520(c)(9) and 7563(a)(2)(iii) The latest test should have occurred no earlier than when the unit began using EDR v21 (or v22 when applicable)
How is fuel sampling data (sulfur content density GCV) entered Do the data match the fuel analysis results
Ask the source to pull up the fuel data in the DAHS and compare to hardcopy fuel sampling and analysis data
How are emissions data missing data periods and operating parameters recorded
If the data are entered by hand spot check the data with the hardcopy
Does the hardcopy report of the Appendix E NOx
emission rate tests match the curve in the monitoring plan and DAHS
Compare the plants copy of the test report to the Appendix E test report from the MDC program Check that dates and times NOx load and fuel flow values match
63 Appendix D Fuel Flow Monitors
If practical visually check the fuel flow monitors to verify that the fuel flow monitors match those in the monitoring plan At a minimum the monitoring plan should at least show the flowmeter component type manufacturer modelversion and serial number Some units may also report each auxiliary component (pressure and temperature transducers and transmitters) in the monitoring plan
Part 75 Field Audit Manual ndash July 16 2003 Page 89
Appendix D and Appendix E Monitoring Section 6
64 Appendix D Fuel Flow Monitor Quality Assurance
Billing meters are exempt from QA accuracy testing and other quality assurance requirements (Part 75 Appendix D sect 214) You should first ask if the monitor is used for commercial billing and has been designated as such This should be identified in the monitoring plan If it is no further checks are necessary
641 QA Testing
After the initial certification tests fuel flow monitors are to be tested once every four fuel flowmeter QA operating quarters Extensions up to 20 operating quarters are available based on quarterly fuel flow-to-load test results For these QA tests make the following checks
Are quarterly fuel flow-to-load tests performed This test is optional Test results are reported in the EDR -- you may have reviewed the data prior to the visit using MDC Verify that on-site test results match those in the electronic report
Check fuel flow monitor accuracy test reports Compare the hardcopy accuracy test results against those reported electronically MDC can provide a copy of the electronic report You can also verify the calculations Ask the source for a copy of the report which should be in a format similar to Part 75 Appendix D Table D-1 or D-2
642 Maintenance and Inspection Records
The maintenance logs should detail any maintenance performed on the system and should reference all preventive maintenance performed During the inspection you should look at the maintenance log book which is required as part of the QAQC plan The maintenance conducted should match the maintenance procedures in the plan Also verify that there have been no changes to monitoring equipment without appropriate recertification testing See Section 48 for more discussion of maintenance logs
Page 90 Part 75 Field Audit Manual ndash July 16 2003
Section 7 Reporting Audit Results
Section 7 provides a brief overview of reporting results in the exit interview and audit report ould highlight issues suggesting data invalidity so that the source can take steps to minimize allowance penalties from missing data CAMD should receive prompt notice of issues that may affect the validity of mass emissions data
The interview sh
71 Exit Interview
You should conduct an informal summary of the audit findings (exit briefing) before you leave the facility You should discuss the audit findings with reference to specific regulatory requirements or in terms of potential problems Evidence should be available to support a finding or observation although you should raise any questions on a monitoring method or rule requirement If a source disputes a finding you should give it an opportunity to provide adequate alternate information Further investigation after the meeting may be required to achieve the resolution of questioned items In such cases you should table the discussion at the briefing
If you perform the audit periodically you should address any progress or lack thereof since the previous audit This is readily done by reviewing the findings of the last audit and noting how the issues have been resolved If there has been no progress the review should emphasize the ongoing problems and stress the need for immediate resolution
72 Audit Report
The audit report organizes and coordinates information gathered during the audit in a usable manner -- it is the compilation of factual information and professional judgment resulting from the audit The report also serves to record the procedures used in gathering the data and gives factual observations and evaluations from the audit Information in the report must be accurate relevant complete objective and clear You should avoid discussions of general topics and should link all compliance issues directly to regulatory requirements Include any follow-up actions in the audit report
You also should prepare a cover letter summarizing the audit results and follow-up activities Send the cover letter and audit report to the Designated Representative or the sources contact person and a copy to the EPA Regional andor State agencies The Clean Air Markets Division should receive a copy of the cover letter If any findings are likely to affect reported mass emissions used for allowance true-up activities notify CAMD immediately You should complete the audit report within one month following the audit while observations are still fresh and to provide a quick response to any problems Notify the source if the report is delayed
Part 75 Field Audit Manual ndash July 16 2003 Page 91
Reporting Audit Results Section 7
73 Follow-up Activities
The audit team should keep documentation of any outstanding issues from the audit A follow-up review should be scheduled within a reasonable time after the audit
Page 92 Part 75 Field Audit Manual ndash July 16 2003
Section 8 Conducting Level 3 Audits
Section 8 discusses issues that an agency should consider in developing a performance testing program (a Level 3 audit capability) es single gas challenges and linearity tests
This section emphasiz
81 Overview
This section focuses on issues that an agency should consider if it chooses to develop a Level 3 audit program that includes single gas challenges and linearity testing of gas CEMS The emphasis in this section is on the calibration gases and development of a testing program rather than on a step-by-step description of how to perform a test
Agencies that currently do not perform Level 3 performance tests may have in-house expertise and experience available in the agencys ambient air monitoring staff Single gas challenges and linearity testing of Part 75 gas CEMS require the same knowledge base as calibration testing of ambient gas monitors An agency can take advantage of this existing resource in developing a Level 3 program for Part 75 audits
82 Tri-Blend or Single Blend Gases
Part 75 affected sources commonly use multi-component calibration gases Multi-component gases provide cost savings over single component gases by reducing the number of cylinder gases and the equipment necessary for calibration tests These calibration gases also allow for calibrating analyzers simultaneously The tri-blend (or triple blend) contains SO2 NO and CO2 The SO2 and NO are at relatively low concentrations in the ppm range while the CO2
concentration is in the percent range The single component (or single blend) calibration gas consists of the target compound -- SO2 NO or CO2 -- blended with N2 or air Compared to a single blend a tri-blend replaces a portion of the N2 or air with CO2 (up to 20 percent by volume for high range testing)
Tri-blends with a CO2 concentration of 11 percent (representative of most stack conditions) are recommended for agency auditors CO2 concentrations representative of stack gas conditions will minimize molecular weight or interference effects described below that can occur if the CO2 concentration in the calibration gas is different from the stack gas
Molecular Weight Effects - Dilution Systems
CO2 weighs more than N2 or air so a tri-blend calibration gas containing CO2 will be heavier than a single blend calibration gas in which the balance is either N2 or air This will impact a single gas challenge or linearity test of dilution extractive systems if the inspector uses a single blend to conduct a test on units that normally use tri-blends for calibration and quality assurance The sample flow in a dilution extractive system is controlled by the critical orifice
Molecular Weight of Major Calibration Gas
Component Compounds
bull CO2 44 bull N2 28 bull Air 29
Part 75 Field Audit Manual ndash July 16 2003 Page 93
Single Gas Challenges and Linearity Tests Section 8
which is dependent on molecular weight Dilution extractive systems therefore will produce different test results depending on whether a single blend or tri-blend gas is used Your best approach to dealing with this issue is to use a tri-blend with CO2 concentrations representative of stack conditions Table 8-1 summarizes the effects of calibration gas blend molecular weights on dilution system emission measurements and QA testing measurements
Table 8-1Effects of Gas Blends on Dilution System Measurements
(from Table 3-2 in Jahnke 1994)
Activity Performed Calibration Gas Blend
Used Possible Resulting Measurement Biases
Emissions Measurements
CEM system calibrated with CO2 triple blend
Emission measurements bias minimized (because CO2 present in both flue gas and calibration gas)
CEM system calibrated with single blend (eg SO2 in nitrogen)
Emission measurements are biased (because CO2 is present in flue gas)
Calibration Error Test and Linearity Check
CEM system calibrated with single blend
Calibration error test conducted with CO2
triple blend will show a bias Linearity check conducted with CO2 triple blends will show bias
CEM system calibrated with CO2 triple blend
Calibration error test conducted with single blend will show a bias Linearity check conducted with single blends will show bias
CEM system calibrated with single blend
RATA conducted with Reference Method 6C calibrated with a CO2 triple blend will show bias
CEM system calibrated with CO2 triple blend
RATA conducted with Reference Method 6C calibrated with a single blend will show bias
RATA CEM system calibrated with a single blend
RATA conducted with Reference Method 6C calibrated with a single blend will minimize bias
CEM system calibrated with CO2 triple blend
RATA conducted with Reference Method 6C calibrated with a CO2 triple blend will minimize bias
Interference Effects
CO2 can interfere with chemiluminescent NOX monitors (quenching) and cause a negative error in the NOx emission measurement If the auditor uses a NO single blend calibration gas without CO2 the result reported by the DAHS will be higher than the calibration gas concentration as the CEMS results are corrected to account for the CO2 concentration in
Page 94 Part 75 Field Audit Manual ndash July 16 2003
Section 8 Single Gas Challenges and Linearity Tests
the stack gas As in the case of molecular weight effects using a tri-blend with CO2
concentrations representative of stack conditions will minimize this problem
83 Hands Off Policy
EPAs hands off approach discussed in Section 141 also applies to conducting a single gas challenge or linearity test You do not need to physically handle a facilitys CEMS hardware You should ask qualified plant personnel to perform any actions with the CEMS equipment This includes connecting cylinder gases to the plant calibration gas manifolds or your gas delivery line to the CEMS calibration gas injection point and obtaining results from the DAHS
84 Test PlanProcedures
The agency should prepare standard operating procedures for performing the single gas challenge or linearity test A general outline of items to cover is provided in Table 8-2 A sample procedure for linearity testing is provided in Appendix A of this manual
Table 8-2Elements of a Standard Operating Procedure for Performance Testing
Procedure Element DescriptionPurpose
Pre-Test Survey Contact the source to schedule the test verify CEMS calibration information and review test logistics
Pre-Test Equipment Preparations Select and prepare test equipment
Pre-Test Meeting Plant meeting the day of the test Review of test procedures and any special circumstances
Equipment Set-up Outline of steps to set up the test equipment
Test Procedure Step by step procedures for the test itself including calculations
Pack-up Procedure Description of equipment breakdown after the test is completed
Post-Test Meeting Provide source with the test results
85 Single Gas Challenge
The single gas challenge uses one protocol gas to challenge the CEMS at one point in the measurement range It has a logistical advantage over performing a linearity test One trishyblend gas cylinder can cover CO2 SO2 and NOx and there is no need for a manifold or trailer The disadvantage is that only one point in the measurement range is tested EPA recommends that if a single gas challenge is performed a mid level gas be selected (~ 40 - 60 percent of span) Have the source perform a daily calibration error test so that the full scale can be evaluated This approach minimizes the resources required but most closely approximates a full linearity test
Part 75 Field Audit Manual ndash July 16 2003 Page 95
Single Gas Challenges and Linearity Tests Section 8
When you perform the single gas challenge connect your calibration gas cylinder to the sources calibration gas manifold ep in mind the hands off policy ould perform three runs For each run
Inject gas wait for the response to fully stabilize and record value from the DAHS and
Allow system to sample stack gas and equilibrate before the next run
Based on this test the percent error is calculated in the same manner as the linearity error
where
LE = Percent linearity error R = Reference value of calibration gas A = Average of monitoring system responses
86 Linearity Test
Linearity test procedures and requirements are outlined in Part 75 Appendix A sect 62 There are two approaches your agency might take with regards to the logistics of on-site linearity testing rst approach is similar to the single gas challenge in that you bring your own calibration gases to the site and have the source connect each of your three cylinder gases (low mid and high) to the plant calibration gas manifold ach is to provide your own gas delivery manifold set-up with your cylinders in a truck or trailer and have the source attach your gas delivery line to the CEMS injection point
You will challenge the CEMS three times with each audit gas s injected at the gas injection port required in Part 75 Appendix A sect 221 e same gas concentration or level is not used twice in succession Sufficient time should be allowed for the concentration reading to stabilize for each gas injection he average CEMS response will be taken from the DAHS as the official component for recording the CEMS data You then calculate the percent error using the same equation identified in Section 85 above
87 Calibration Gases
As noted earlier a tri-blend gas containing SO2 NOx and 11 percent CO2 is recommended for agency audits of SO2 and NOx monitors The number of different calibration gases that your agency will need is dependent on the spans of the CEMS installed on units in your area At least three audit gases will be needed to conduct the linearity test at a unit ne having a value 20 to 30 percent of span the second with a value of 50 to 60 percent of span and the third with a value of 80 to 100 percent of span Review the monitoring plans for the units in your area to identify which gases you will need gency should develop a standard operating procedure for maintaining the calibration gas inventory
Ke You sh
The fi
The other appro
The audit gas iTh
T
o
Your a
Page 96 Part 75 Field Audit Manual ndash July 16 2003
Section 8 Single Gas Challenges and Linearity Tests
88 Training
Table 8-3 lists available EPA training courses pertaining to gas CEMS and analyzer calibration Two of the courses APTI 435 and APTI 464 are geared to operating an ambient monitoring system but include instructions on how to calibrate gas analyzers that are directly applicable to performing a single gas challenge or linearity test on a Part 75 gas CEMS
Table 8-3Available EPA Training Courses
EPA Course Number
Course Title
APTI 435 Atmospheric Sampling
APTI 464 Analytical Methods for Air Quality Standards
APTI 450 Source Sampling for Pollutants
APTI 474 Continuous Emission Monitoring
SI 476B Continuous Emission Monitoring Systems Operation and Maintenance of Gas Monitors
Part 75 Field Audit Manual ndash July 16 2003 Page 97
- Page 1
- Page 2
- Page 3
- Page 4
- Page 5
- Page 6
- Page 7
- Page 8
- Page 9
- Page 10
- Page 11
- Page 12
- Page 13
- Page 14
- Page 15
- Page 16
- Page 17
- Page 18
- Page 19
- Page 20
- Page 21
- Page 22
- Page 23
- Page 24
- Page 25
- Page 26
- Page 27
- Page 28
- Page 29
- Page 30
- Page 31
- Page 32
- Page 33
- Page 34
- Page 35
- Page 36
- Page 37
- Page 38
- Page 39
- Page 40
- Page 41
- Page 42
- Page 43
- Page 44
- Page 45
- Page 46
- Page 47
- Page 48
- Page 49
- Page 50
- Page 51
- Page 52
- Page 53
- Page 54
- Page 55
- Page 56
- Page 57
- Page 58
- Page 59
- Page 60
- Page 61
- Page 62
- Page 63
- Page 64
- Page 65
- Page 66
- Page 67
- Page 68
- Page 69
- Page 70
- Page 71
- Page 72
- Page 73
- Page 74
- Page 75
- Page 76
- Page 77
- Page 78
- Page 79
- Page 80
- Page 81
- Page 82
- Page 83
- Page 84
- Page 85
- Page 86
- Page 87
- Page 88
- Page 89
- Page 90
- Page 91
- Page 92
- Page 93
- Page 94
- Page 95
- Page 96
- Page 97
- Page 98
- Page 99
- Page 100
- Page 101
- Page 102
- Page 103
- Page 104
- Page 105
- Page 106
- Page 107
-

Acknowledgments
This Part 75 CEMS Field Audit Manual is the result of past US EPA documents as well as significant support and reviews to provide updated information The Clean Air Markets Division (CAMD) of the US EPA had prepared an Acid Rain Program CEMS Field Audit Manual to assist with auditing continuous emission monitoring systems (CEMS) installed under 40 CFR Part 75 In addition Joseph Winkler US EPA Region VI with contractor assistance from Gerhard Gschwandtner Comprehensive Monitoring Services Inc had prepared a separate Acid Rain Program Continuous Emission Monitoring Systems Reference Manual Dr James Jahnke of Source Technology Associates prepared EPAs 1994 document entitled An Operators Guide to Eliminating Bias in CEM Systems (EPA 430-R-94-016) Additional references used in developing this manual are listed at the end of Section 2 The Clean Air Markets Division acknowledges the authors of these existing documents for providing a valuable foundation for preparing this document
The CAMD team leader for this manual was Matthew Boze Other CAMD staff provided valuable support and comments including Louis Nichols and others in the Emission Monitoring Branch Contract support for this document was provided by Perrin Quarles Associates Inc under Purchase Order No 2W-1382-NTSA James Jahnke PhD Source Technology Associates and James Peeler Emission Monitoring Inc provided a technical review of a draft of this manual Other reviews were provided by Joseph Winkler EPA Region VI and Errin Pichard Florida Department of Environmental Protection
Disclaimer
Any mention of trade names or commercial products in this document is not intended to constitute endorsement or recommendation for use
July 16 2003
Part 75 CEMS Field Audit Manual
Table of Contents
Page
Section 1 Introduction 111 Background 1
111 Importance of Monitoring for Emission Trading Programs 1112 Structure of Part 75 Monitoring Provisions 3
12 What does the manual cover 613 Part 75 Audit Program Overview 8
131 Part 75 Electronic Audit Program 8132 Audit Targeting 8133 Field Audits 8
14 Role of the Inspector 9141 Hands Off Approach 10142 Inspection Safety 11143 Recommended Training Courses 11
15 Key Part 75 Materials with Internet Links 12
Section 2 Part 75 CEMS Overview 1521 Introduction 1522 Sampling Location 17
221 Gas Measurement Location 18222 Flow Measurement Location 18223 Sampling in Stratified and Swirling Flow Conditions 18
23 Extractive Gas CEMS 19231 Source Level or Direct Extractive Systems 19
2311 Sample Probe 202312 Sample Transport and Conditioning Systems 22
232 Dilution Extractive Systems 232321 Dilution Probe 242322 Out-of-Stack Dilution System 252323 Sample Transport and Dilution Air Cleaning Systems 26
233 Calibration Gas System 27234 Analyzers 27
2341 Absorption Spectroscopy 282342 Luminescence Spectroscopy 292343 Electro-Analytical Methods 302344 Paramagnetic Techniques 30
24 In-Situ Gas Monitors 31241 Path In-Situ CEMS 32242 Point In-Situ CEMS 32243 In-Situ Gas Analyzers 32244 System Calibration 33
Part 75 Field Audit Manual ndash July 16 2003 Page i
Table of Contents (cont)
Page
25 Flow CEMS 33251 Sampling Location 34252 Differential Pressure Flow Monitors 34253 Thermal Mass Flow Monitors 35254 Ultrasonic Flow Monitor 37
26 Data Acquisition and Handling System (DAHS) 38261 CEMS Computer Systems 38262 Emissions Data Processing 39263 QA Test Data Processing 39264 Part 75 Reporting 39
27 References 40
Section 3 Audit Preparation 4131 Using Part 75 Electronic Data to Conduct Pre-Audit Reviews 41
311 Quarterly Electronic Data Reports 41312 Quarterly Feedback Reports 44313 Using MDC to Prepare for an Audit 44
3131 MDC Overview 443132 Getting Started with MDC 453133 Review and Print Electronic Portion of Monitoring Plans 463134 QA Tests Exemptions and Extensions 473135 Recertification Events and Monitoring System Downtime
Reports 503136 Using MDC Hourly to Check Emissions Data
and Calculations 5032 Hardcopy File Review 53
321 Correspondence Petitions and Previous AuditInspection Reports 53322 Linearity Test and RATA Reports 54323 Permits 54
33 Scheduling and Coordinating the Audit 5534 Materials to Bring 55
Section 4 On-Site CEMS Inspection 5741 Pre-Audit Interview 5842 Calibration Error Test 5943 ProbeSensors Sample Lines and Sample Conditioning Systems 62
431 Probe 62432 Sample Lines 63433 Dilution Air and Gas Sample Conditioning Systems 64
4331 Dilution Extractive Systems 644332 Source Level Extractive Systems 66
44 Gas Analyzers 67 68
45 Calibration Gases 6846 Flow Monitors 71
Page ii Part 75 Field Audit Manual ndash July 16 2003
Table of Contents (cont)
Page
47 DAHS 73471 DAHS Certification and Verification Tests 74472 Changes in Correction Factors 74473 Manually Entered Data 74
48 Maintenance Log and Daily Checklists Review 7649 QAQC Plan Review 78
Section 5 CEMS Performance Test Observation 8151 Introduction 8152 Linearity Test 8253 Relative Accuracy Test Audit (RATA) 83
Section 6 On-Site Inspection of Appendix D and Appendix E Monitoring Systems 8761 QAQC Plan Review 8762 DAHS and Supporting Records 8863 Appendix D Fuel Flow Monitors 8964 Appendix D Fuel Flow Monitor Quality Assurance 90
641 QA Testing 90642 Maintenance and Inspection Records 90
Section 7 Reporting Audit Results 9171 Exit Interview 9172 Audit Report 9173 Follow-up Activities 92
Section 8 Conducting Level 3 Audits 9381 Overview 9382 Tri-Blend or Single Blend Gases 9383 Hands Off Policy 9584 Test PlanProcedures 9585 Single Gas Challenge 9586 Linearity Test 9687 Calibration Gases 9688 Training 97
Part 75 Field Audit Manual ndash July 16 2003 Page iii
[This page intentionally left blank]
Page iv Part 75 Field Audit Manual ndash July 16 2003
List of Tables
Page
Table 1-1 Part 75 PollutantsParameters and CEMS Components 4Table 1-2 Part 75 Non-CEMS Methodologies 5Table 1-3 Levels of Field Audits 9Table 1-4 Available EPA Training Courses 12Table 2-1 Common Extractive Gas CEM Analytical Methods 28Table 2-2 In-Situ Gas Analyzer Methods 33Table 3-1 Electronic Monitoring Plan Information 46Table 3-2 Summary of MDC QA Test Checks 49Table 3-3 Summary of MDC Hourly Checks 53Table 4-1 Pre-Audit Interview Items 59Table 4-2 Part 75 Calibration Error Test Data Validation Requirements 61Table 4-3 ProbeSensor Check Summary 63Table 4-4 Summary of Dilution Air System Checks 65Table 4-5 Summary of Source Level Extractive System Checks 66Table 4-6 Summary of Analyzer Checks 68Table 4-7 Part 75 Calibration Gases (Appendix A sect 51) 70Table 4-8 Summary of Calibration Gas Checks 71Table 4-9 Summary of Flow Monitor Checks 73Table 4-10 Summary of DAHS Checks 76Table 4-11 Checks for QAQC Plan Elements 79Table 5-1 Linearity Test Specifications 83Table 6-1 Appendix D - QAQC Plan Review 87Table 6-2 Appendix E - QAQC Plan Review 88Table 6-3 Summary of DAHS and Supporting Records Checks 89Table 8-1 Effects of Gas Blends on Dilution System Measurements 94Table 8-2 Elements of a Standard Operating Procedure for Performance Testing 95Table 8-3 Available EPA Training Courses 97
Part 75 Field Audit Manual ndash July 16 2003 Page v
List of Illustrations Page
Illustration 1-1 Overview of Continuous Emission Monitoring in a Part 75 Trading Program 3
Illustration 2-1 Basic CEMS Types (Jahnke and Peeler 1997) 16Illustration 2-2 Example of Continuous Emission Monitoring Systems
at a Part 75 Unit 17Illustration 2-3 Typical Source-Level Extractive CEMS (Gschwandtner
and Winkler 2001) 21Illustration 2-4 Dilution Extractive CEMS (Gschwandtner and Winkler 2001) 23Illustration 2-5 In-Stack Dilution Probe (adapted from Jahnke 2000) 24Illustration 2-6 One Type of Out-of-Stack Dilution System (Gschwandtner
and Winkler 2001) 26Illustration 2-7 In-Situ Gas CEMS (Jahnke 1992) 32Illustration 2-8 Example of Multiple Probe Locations (Jahnke 1994) 35Illustration 2-9 Thermal Mass Flow Monitor Probe (adapted from Jahnke 1992) 36Illustration 2-10 Ultrasonic Flow Monitor 37Illustration 3-1 Example EDR Data Format for Record Type 320 42Illustration 3-2 Example Summary of Quarterly Report Content For Two Acid Rain
CEMS Units Emitting Through Common Stack 43Illustration 3-3 MDC Screen Showing Multiple Linearity Tests in One Quarter 48Illustration 3-4 Example MDC Hourly Graph of SO2 Concentration 52Illustration 5-1 Asymptotic Calibration Check Response (Jahnke 1994) 82
Page vi Part 75 Field Audit Manual ndash July 16 2003
Section 1 Introduction
After reading this Introduction the inspector (auditor) should understand the organization of the manual and the topics it covers the role of the field audit in the Part 75 compliance program the key components of the field audit and where to obtain the latest information on the regulation and on manual updates
11 Background
111 Importance of Monitoring for Emission Trading Programs
The US Environmental Protection Agency (EPA) has established monitoring requirements at 40 CFR Part 75 as part of its efforts to develop cap and trade emission reduction programs A cap and trade program is an innovative market-based approach to reducing emissions The cap sets a ceiling on emissions that is below an applicable baseline level Sources in the program receive emission allowances with each allowance authorizing a source to emit one ton of the pollutant being controlled Limiting the number of available allowances ensures the caps integrity At the end of each year every source must have enough allowances to cover its emissions for that year Unused allowances may be sold traded or saved (banked) for future use While this approach allows sources flexibility in deciding how they achieve compliance the cap ensures that the affected sources reduce emissions collectively to the desired reduction goal
The cornerstone for ensuring that sources achieve the required emission reductions is a strong monitoring program Accurate monitoring of all emissions and timely reporting ensure that a ton from one source is equal to a ton from any other source and that the integrity of the cap is maintained Under Part 75 participating sources must fully account for each ton of emissions according to stringent uniform protocols The resulting compliance information is unprecedented in its accuracy and comprehensiveness All data are publicly available on the Internet providing complete transparency
To date the Part 75 monitoring requirements are used for two separate programs Under the Acid Rain Program sources have had to meet Part 75 and emission reduction requirements since 1995 EPA has had the lead in ensuring compliance with the Acid Rain Program although EPA has teamed with State and local agencies on various aspects of implementing the Part 75 monitoring provisions
In May 2002 State agencies began to take the lead role in implementing and ensuring compliance with Part 75 for purposes of a separate nitrogen oxides (NOx) trading program that many eastern States have adopted in response to EPAs 1998 NOx SIP Call EPA believes that a strong audit program is an essential component of an effective Part 75 compliance oversight program Given the increased role of State and local agencies in Part 75 implementation EPA has prepared this manual to assist agencies in implementing Part 75 and to ensure the ongoing integrity of the new NOx trading program
The manual begins with the premise that each link in the chain of the Part 75 program is important in ensuring that the data ultimately used to measure emissions and account for the
Part 75 Field Audit Manual ndash July 16 2003 Page 1
Introduction Section 1
use of allowances in a trading program remain accurate Illustration 1-1 depicts the major links in the data quality chain for a continuous emissions monitoring system (CEMS) The process starts with ensuring that the gas standards used to calibrate and test the monitoring equipment are accurate EPA adopted the Traceability Protocol for Assay and Certification of Gaseous Calibration Standards for this purpose The source must conduct the necessary quality assurance tests following all appropriate procedures and report the results of those tests accurately These quality assurance activities are conducted initially for certification and then on an ongoing basis to maintain a measure of the systems ability to accurately determine emissions Once the data measurements are quality-assured the next step is to ensure that the measured data obtained from the CEM analyzer are accurately recorded by the data acquisition and handling system (DAHS) and appropriately reported in the quarterly electronic data reports (EDR) The EDRs are submitted quarterly to EPA so that it can review and account for the emissions data in the cap and trade program EPA provides the necessary data management systems to track emissions and allowance transfers
The integrity of the overall trading program can break down anywhere along this chain of activities therefore EPA relies on a combination of electronic and field auditing to verify overall data integrity The field audit procedures in this manual are critical for examining these links to verify proper performance of the monitoring systems and identify problems which may lead to inaccurate emissions accounting
Page 2 Part 75 Field Audit Manual ndash July 16 2003
Section 1 Introduction
Illustration 1-1Overview of Continuous Emission Monitoring in a Part 75 Trading Program
112 Structure of Part 75 Monitoring Provisions
Continuous emissions monitoring systems (CEMS) are the primary monitoring method under Part 75 The Part 75 rule includes requirements for installing certifying operating and maintaining CEMS for SO2 NOx CO2 O2 opacity and volumetric flow Appendices A and B of Part 75 provide the technical specifications for the installation and performance of CEMS including certification and quality assurance test procedures The rule also includes approved non-CEMS options for certain gas and oil fired units and procedures to account for missing data
Recordkeeping and reporting provisions require Acid Rain Program and NOx trading program affected units to submit Part 75 hourly emission data and related quality assurance data through electronic report formats to EPAs Emission Tracking System (ETS) which is operated by the Clean Air Markets Division (CAMD) The ETS data in turn are used to
Part 75 Field Audit Manual ndash July 16 2003 Page 3
Introduction Section 1
TIP
Check wwwepagovairmarkets for further regulatory information
maintain the emission allowance accounts in the Allowance Tracking System and the NOx
Allowance Tracking System
The Part 75 requirements are outlined below to introduce you to the rule and some of the terminology used in the manual can obtain copies of Part 75 and determine whether EPA has published further revisions to Part 75 issued new monitoring guidance or revised the information in this manual by checking CAMDs website ion 15 of the manual provides a list of important regulations and policy guidance documents with links to specific pages on CAMDs website you may find helpful
Monitoring Methods
The monitoring requirements for each type of unit subject to Part 75 are in Subpart B of the rule red except for some gas and oil fired units e 1-1 summarizes CEMS components that are required by pollutant while Table 1-2 summarizes the non-CEMS options
Table 1-1 Part 75 PollutantsParameters and CEMS Components
PollutantParameter
Required CEMS Components
SO2 NOx Flow Opacity Diluent Gas (O2
or CO2)
Data Acquisition
and Handling System (DAHS)
SO2 (lbhr)
NOx (lbmmBtu)1 NOx (lbhr)2 Opacity ()3 CO2 (lbhr)4 Heat Input (mmBtuhr)
You
Sect
CEMS are requi Tabl
1Heat input in mmBtuhr is also required2For units subject to NOx SIP Call trading program Can monitor with or without diluentmonitor3Required only for coal and residual oil units4Alternative mass balance method may by used to monitor CO2
Page 4 Part 75 Field Audit Manual ndash July 16 2003
Section 1 Introduction
Table 1-2Part 75 Non-CEMS Methodologies
Pollutant Parameter
Unit Type Monitoring Methodology
SO2 (lbhr) natural gas Default SO2 emission rate combined with measured fuel flow (Part 75 Appendix D)
SO2 (lbhr) gas or oil Fuel sampling and analysis combined with measured fuel flow (Part 75 Appendix D)
NOx (lbmmBtu) NOx (lbhr)
gas or oil peaking units
Estimate NOx rate by using site-specific emission correlations with measured fuel flow if measuring lbhr (Part 75 Appendix E)
SO2 CO2 NOx
(lbhr for all and lbmmBtu for NOx)
gas or oil Conservative default values for units with low mass emissions (sect 7519)
Heat Input (mmBtuhr)
gas or oil Measured fuel flow and GCV (Part 75 Appendix D)
Monitoring Certification Requirements
The implementing agency must certify an allowable monitoring method before it can be used for Part 75 monitoring The source must perform certification tests and submit the results to EPA and the appropriate State agency Part 75 performance certification testing is outlined in sect 7520 and Appendix A sect 6 Certification tests for a CEMS may include
7-day calibration error test for each monitor Linearity check for each pollutant concentration monitor Relative Accuracy Test Audit (RATA) for each monitoring system Bias test for each monitoring system Cycle time test for each pollutant concentration monitor Daily interference test for flow monitors DAHS testing
There are also certification requirements for non-CEMS methods These include accuracy tests for fuel flow monitors (sect 7520 and Appendix D sect 215) stack tests to develop NOx correlations for gas or oil peaking units (Appendix E sect 21) or unit-specific default values for low mass emissions units (sectsect 7519-7520)
Recertification may be required if the facility replaces modifies or changes a certified CEMS in a way that may significantly affect the ability of the system to accurately measure monitored parameters
Quality AssuranceQuality Control Procedures
The source is required to develop and implement a written quality assurancequality control (QAQC) plan for each monitoring system (sect 7521) The QAQC plan must include procedures for system operation as well as procedures for conducting quality assurance tests (QA tests) preventive maintenance and recordkeeping Appendices A and B to Part 75
Part 75 Field Audit Manual ndash July 16 2003 Page 5
----
Introduction Section 1
describe the technical procedures for how and when to conduct periodic QA tests which include
Daily calibration error tests Challenge a gas CEMS at a zero and high level with calibration gas
Daily interference tests for flow monitors Follow procedure to detect plugging or other problems that could interfere with a flow monitor
Quarterly linearity tests Challenge a gas CEMS at 3 levels with calibration gases Quarterly flow-to-load evaluations Compare flow monitor values to values from an
initial flow-to-load correlation as a means to check flow monitor data quality over time Semi-annual or annual RATAs Compare monitored values to values measured by an
approved EPA reference method Also use RATA results to detect and if necessary adjust for low bias
Recordkeeping and Reporting
Part 75 includes requirements for notifications recordkeeping and reporting in Subparts F and G As noted earlier most of the reporting to EPA is done electronically every quarter in a standard electronic format and much of the recording will be done automatically using the DAHS Some important records and reporting that you will want to review include
Monitoring plan Submitted electronically although some information is submitted only in hardcopy Contains information describing the unit CEMS other monitoring methodologies and specific calculation procedures
Hourly parameters including emissions flow heat input monitor availability and other information
Periodic QA test results Recertification tests Other records that are required to be kept on-site such as
Annual spanrange evaluationSO2 scrubber parameters to verify proper control operation during a missing dataperiod
Missing Data
Part 75 requires sources to account for emissions during periods when there are no valid data (missing data periods) due to the monitor not operating or operating out of control The missing data methodologies are necessary so that a source accounts for emissions during each hour of operation The missing data algorithms become increasingly conservative as monitor downtime increases so that sources have an incentive to maintain high data availability
12 What does the manual cover
This manual details recommended procedures for conducting a field audit of a Part 75 monitoring system Included are tools you can use to prepare for an audit techniques you can use to conduct the on-site inspection and review records proper methods for observing performance tests and guidelines for preparing a final report EPA has designed the audit procedures in this document so that personnel with varying levels of experience can use them
Page 6 Part 75 Field Audit Manual ndash July 16 2003
Section 1 Introduction
While the manual is written primarily for State and local agency inspectors industry personnel may find some of the material useful for their internal data quality management activities
The manual covers gas (SO2 NOx and diluent) and flow monitoring systems -- it does not cover opacity monitor audits Although Part 75 requires opacity monitors for coal-fired units subject to the Acid Rain Program opacity data and quality assurance tests are not reported to CAMD in quarterly emission data reports Moreover the source can comply with Part 75 by satisfying performance specifications in Part 60 that are generally applicable to opacity monitors and can follow a States recording and reporting requirements Thus there are no special Part 75 audit techniques for these systems
The manual is organized into eight major sections with one appendix
Section 1 introduces cap and trade programs Part 75 the role of field audits and the inspector CAMDs audit targeting role the importance of inspector training and a list of key Part 75 materials with Internet links
Section 2 provides a short introduction to the various types of CEMS and the major components of a CEMS including basic installation and operating principles
Section 3 describes preparing for an audit prior to the plant visit with emphasis on using CAMDs Monitoring Data Checking (MDC) software to review the electronic data
Section 4 covers the on-site CEMS inspection including what to look for and questions to ask during a walk through of CEMS components as well as how to review the QAQC plan and other in-plant records
Section 5 describes how to observe CEMS performance tests (linearity and relative accuracy test audits)
Section 6 outlines specific on-site review procedures for Appendix D and E monitoring systems and records
Section 7 guides you in conducting the exit interview and preparing a written audit report
Section 8 discusses issues that should be considered by a State or local agency in developing a performance testing program with an emphasis on single gas challenges and linearity tests
Appendix A to the Manual provides sample checklists for the field audit RATA and linearity observations The checklists are based on the discussions and techniques in Sections 3 through 6
Part 75 Field Audit Manual ndash July 16 2003 Page 7
Introduction Section 1
13 Part 75 Audit Program Overview
The Part 75 audit program consists of both electronic audits and field audits CAMD uses automated tools such as the Monitoring Data Checking (MDC) system to conduct automated checks of data submitted under Part 75 for potential problems Also it uses its data systems and its ability to check data through automated information systems to target units for follow-up data audits On-site field audits performed to ensure that monitoring systems are installed and operated properly are also essential in the Part 75 audit program
131 Part 75 Electronic Audit Program
CAMD performs routine electronic audits on each quarterly report submittal using the ETS and MDC software EPA may also perform targeted electronic checks to find other specific data reporting problems The electronic audits identify errors in the quarterly electronic data report the monitoring plan and the QA tests An automated ETS feedback report that focuses on the reported emissions data is sent to the source instantly upon electronic submittal by ETS EPA then uses MDC to analyze the monitoring plan and QA data and sends an MDC feedback report at the end of the quarterly submission period The reports categorize errors as critical and non-critical -- for critical errors the source must correct and resubmit the quarterly report
132 Audit Targeting
In addition to performing electronic audits EPA periodically compiles a recommended field audit target list based on a review of all of the quarterly electronic data reports This national list attempts to identify trends based on a large population of units that may not be identifiable from a smaller population at the State level alone The target list is intended to help States allocate their auditing resources on those units that are most likely to have data problems based on the findings of EPAs electronic auditing efforts States may use these recommendations to focus their audit efforts but may also choose other units for field audits through State targeting approaches or at random
133 Field Audits
EPA relies on State and local agencies to conduct field audits of monitoring systems to assess the systems performance and a sources compliance with monitoring requirements The audits also encourage good monitoring practices by raising plant awareness of monitoring requirements The field audit consists of a thorough evaluation of the CEMS via pre-audit record review on-site inspection of equipment and system peripherals record reviews test observations and interviews with the appropriate plant personnel
EPA has defined three levels (see Table 1-3) to describe field audit activities and procedures and the objective of the audit
Page 8 Part 75 Field Audit Manual ndash July 16 2003
Section 1 Introduction
Table 1-3 Levels of Field Audits
Audit Level
Records Review
On-site Inspection of CEMS
Daily Calibration Observation
Linearity or RATA
Observation
Performance Test Audit
Level 1
Level 2
Level 3
The Level 1 audit may be used to verify Part 75 recordkeeping requirements emissions data and monitoring plan information and is recommended as a follow-up to a previous audit This audit consists of an on-site inspection records review and daily calibration observation A Level 2 audit expands the audit to include a performance test observation The test observation is a critical element to ensure that CEMS are properly operating and performance test protocols are being conducted in accordance with the required standards For this reason EPA encourages agencies to perform Level 2 audits which are the focus of this manual
A Level 3 audit involves agency personnel conducting a performance test instead of merely observing the test Conducting a performance test such as a linearity test or relative accuracy test audit provides an independent assessment of the monitoring systems Because of the equipment and expertise involved EPA does not emphasize that State or local agencies perform Level 3 audits However some agencies strongly support Level 3 audit programs and Section 8 of this document provides guidance on various Part 75-related issues for those agencies that do conduct performance tests as part of their inspection program
14 Role of the Inspector
Your primary task as an inspector conducting a field audit is to document whether the monitoring at a facility is in compliance with the Part 75 requirements To carry out this task you will need to understand the Part 75 rule and have a general understanding of CEMS components and their function You will also need to ask questions carefully record your observations and compile the information necessary to determine compliance
Your role is not to provide technical advice or consulting on the operation of the monitoring equipment The source is responsible for operating the monitoring equipment and correcting any monitoring problems At the same time however the field audit is an opportunity to provide information to the source on Part 75 requirements You might for example clarify regulatory requirements and you should share with the source your observation of monitoring practices that may create regulatory problems
Part 75 Field Audit Manual ndash July 16 2003 Page 9
Introduction Section 1
Importance of Missing Data Under Part 75
Because Part 75 monitoring is used to account for total mass emissions when the monitor or monitoring system fails to record a valid hour of data Part 75 uses a conservative approach to substitute for missing data Audit findings may invalidate data and require use of substitute data so the findings could have a significant financial impact independent of any non-compliance issues
If your findings indicate that data from a monitor may be invalid which would require the source to use substitute data it is important to inform the source of the problem during the field audit Extensive missing data generally will penalize a source in allowance accounting and result in a significant monetary penalty for the source For the same reason it is important to notify CAMD quickly of the potential for invalidating data so that the issue is resolved prior to the end-of-year compliance process EPAs primary concern is to collect accurate CEM data to ensure the integrity and fairness of the trading program EPA has no interest in prolonging the length of time that a source is considered out-of-control Thus the goal of the audit should be to promptly identify
what needs to be corrected so that the source is once again reporting quality-assured verified emissions data This issue is discussed further in Section 72
141 Hands Off Approach
EPAs policy is to use a hands off approach when conducting the audit so that you do not have any physical contact with the CEMS hardware This approach avoids creating a situation in which monitoring equipment may be damaged or the inspectors actions may be questioned should the monitoring system fail to operate well during the audit You should ask authorized plant personnel to perform any actions with the CEMS equipment (for example initiating a daily calibration check or displaying analyzer range) Remember it is more important for you as the inspector to observe how the CEMS operator performs hisher duties as this will indicate whether the plant personnel are able to follow appropriate requirements and procedures and will help to identify any problems that occur Have the operator explain what heshe is doing and show you where the procedure is documented
Page 10 Part 75 Field Audit Manual ndash July 16 2003
Section 1 Introduction
142 Inspection Safety
Any type of air pollution source inspection has potential health and safety problems and inspection safety is a serious concern Appropriate safety training is imperative for all inspectors and each plant may have specialized training andor safety equipment policies Before going on site for an audit you must ensure that you have all necessary personal safety equipment Also make sure to contact the site and ask for details on plant safety requirements Once on site use the safety equipment properly adhere to your agencys safety requirements and follow plant safety requirements as well Some of the hazards you may encounter in performing CEMS audits include
Accessing CEMS equipment or platforms and working at elevations with fall hazards Electrical shock when inspecting heated lines pumps or internal areas of CEMS
cabinets and enclosures Hazards associated with use or transport of compressed gas cylinders Hazards associated with poisonous calibration gases (NO) Exposure to effluent gases Entry of confined spaces Typical hazards associated with working in an industrial environment (moving
equipment vehicles and machinery trip and fall hazards etc)
143 Recommended Training
Courses
The following table lists EPA classes that you may find helpful in developing a knowledge base for performing Part 75 CEMS field audits at stationary sources State agencies
Air Pollution Training Institute
Information on EPA courses and course schedules are available at EPAs AIR Pollution Training Institute website httpwwwepagovairoaqpseogaptihtml
regional organizations or university professional development programs may provide similar courses in your area
Part 75 Field Audit Manual ndash July 16 2003 Page 11
Introduction Section 1
Table 1-4Available EPA Training Courses
EPA Course Number
Course Title
APTI 445 Baseline Inspection Techniques
APTI 446 Inspection Safety Procedures
APTI 450 Source Sampling for Pollutants
APTI 474 Continuous Emission Monitoring
SI 476B Continuous Emission Monitoring Systems Operation and Maintenance of Gas Monitors
T008-02 Safety and the Agency Inspector
T468-02 Stack TestingStack Test Observation for Traditional and Hazardous Air Pollutants
15 Key Part 75 M aterials with Internet Links
The following is a list of key Part 75 reference materials with internet links to the webpage where the document can be found either on the EPA website or the Government Printing Office website To avoid a dead link the links in most cases are not to the document itself but to the web page where a link to the document may be found l need to survey the page to find the direct link
40 CFR Part 75 - On the CAMD website you will find an unofficial consolidated version of the Part 72 and Part 75 rules that contains the current text of Part 75 (and sectsect 721 - 723 the Acid Rain Program rule general provisions efinitions measurements abbreviations and acronyms) as amended by recent revisions may find this unofficial version a helpful tool because it has an easy-to-
Recent Part 75 Revisions
bull June 12 2002 (67 FR 40394) and
bull August 16 2002 (67 FR 53503)
You wil
purpose d
Youuse format httpwwwepagovairmarketsmonitoringconsolidatedindexhtml
While all reasonable steps have been taken to make this unofficial version accurate the Code of Federal Regulations (CFR) and Federal Register (FR) take precedence if there are any discrepancies Official versions of FR revisions are available on the EPA
Page 12 Part 75 Field Audit Manual ndash July 16 2003
Section 1 Introduction
website httpwwwepagovfedrgstr and the official CFR is available at the Government Printing Office website httpwwwaccessgpogovnaracfrcfrhtml_00Title_4040cfr75_00html
Electronic Data Report Version 22 Reporting Instructions - The instruction manual describes each data field element for the information that is recorded and reported to EPA for Part 75 and provides the field auditor with a helpful summary of Part 75 requirements The EDR v22 Instructions support the June 12 2002 revised Part 75 rule httpwwwepagovairmarketsmonitoring
Parts 75 and 76 Policy Manual - This manual contains a series of questions and answers that can be used on a nationwide basis to ensure that the Part 75 provisions are applied consistently for all sources affected by the rule It is intended to be a living document EPA will issue new questions and answers as they arise and will revise previously issued questions and answers as necessary to provide clarification EPA intends to release a revised verison of the manual in 2003 httpwwwepagovairmarketsmonitoringpolmanindexhtml
Recertification and Diagnostic Testing Policy - Recertification is required whenever a replacement modification or change in the certified continuous emissions monitoring system or continuous opacity monitoring system occurs that may significantly affect the systems ability to accurately measure or record the pollutant or parameter of interest EPA is preparing a document to clarify what types of changes to a monitoring system may be considered significant EPA expects that the document will describe various events as either recertification events or diagnostic testing events and describe the type of certification or diagnostic testing that needs to be performed You should check the wwwepagovairmarkets website for release of this policy
Monitoring Data Checking (MDC) Software - The MDC software discussed in Section 3 of this manual allows regulated industry and State agencies to enter analyze print and export electronic monitoring plan certification and quality assurance data and to evaluate hourly emissions data required by Part 75 The software also allows regulated sources to submit electronically monitoring plan and certification data to EPA via ftp The software provides a standard Windows-based mouse-driven point and click user interface and can be installed under Windows 95 (or higher) Windows NT or Windows 2000 The software and installation instructions can be downloaded from the CAMD website httpwwwepagovairmarketsmonitoringmdc
40 CFR Part 60 Appendix A Reference Methods - The RATA reference methods (and related information) are available from EPAs Emission Measurement Center website The website versions of the reference methods are the official CFR version httpwwwepagovttnemcpromgatehtml
Part 75 Field Audit Manual ndash July 16 2003 Page 13
Introduction Section 1
An Operators Guide to Eliminating Bias in CEM Systems - This EPA publication is designed for CEMS operators as a tool for diagnosing and correcting the causes of measurement bias in CEMS It is also a useful CEMS reference guide for the field auditor httpwwwepagovairmarketsmonitoring
Observers Checklists for Test Methods 2F 2G and 2H - These are detailed observer checklists that can be used when observing a flow RATA using one of these alternative flow reference methods httpwwwepagovairmarketsmonitoring
Page 14 Part 75 Field Audit Manual ndash July 16 2003
Section 2 Part 75 CEMS Overview
This section provides a brief introduction to the various types of components of continuous emission monitoring systems that facilities have installed to meet Part 75 requirements
21 Introduction
The monitoring requirements of Part 75 are performance-based requirements that generally do not require that a source use a particular type of CEMS There are several types of CEMS available The differences in how these systems are designed and operate (in terms of sample acquisition sample handling sample analysis and data recording) can be important in understanding what to look for in a field audit and how to interpret audit results
This section provides only an overview of the major concepts related to the types of CEMS and their principles of operation For further detail on these complex systems see Section 27 which provides a list of in-depth references EPA recommends that inspectors who will conduct Part 75 CEMS audits should attend EPAs Air Pollution Training Institute course on CEMS (APTI Course 474) The summary information in this section draws heavily from the manual for that course (Jahnke 1992) as well as from an EPA reference manual specifically tailored to Part 75 CEMS (Gschwandtner and Winkler 2001)
All CEMS perform the following basic functions
Locate or extract a representative sample
Analyze the sample and
Compile and record the results
CEMS are divided into two types based on the first of these basic functions An extractive system removes and transports the sample from the stack to the analyzer often conditioning the sample prior to the analyzer An in-situ system analyzes the sample directly in the stack Illustration 2-1 identifies these two main system types There are several variations on these types which Sections 23 through 25 review
Part 75 Field Audit Manual ndash July 16 2003 Page 15
Part 75 CEMS Overview Section 2
Illustration 2-1Basic CEMS Types (Jahnke and Peeler 1997)
Illustration 2-2 shows a set of typical Part 75 CEMS at a Part 75 unit The flow and opacity CEMS are examples of in-situ systems The opacity monitor measurement is taken over a path across the stack Most continuous opacity monitors are double pass (light is transmitted across the stack and back to the detector) to meet EPA quality assurance requirements The ultrasonic flow monitor in this example also provide an integrated measurement along a path across the stack Flow and opacity CEMS are always in-situ systems The gas CEMS (SO2 NOx CO2) in Illustration 2-2 are dilution extractive systems In this illustration the gas is extracted at a single point (the sampling probe) and diluted with clean dry air The diluted sample is transported through the sampling line and analyzed on a wet basis
Page 16 Part 75 Field Audit Manual ndash July 16 2003
Section 2 Part 75 CEMS Overview
Illustration 2-2Example of Continuous Emission Monitoring Systems at a Part 75 Unit
In-situ gas CEMS (not shown in Illustration 2-2) are also used by Part 75 sources sometimes in conjunction with extractive gas CEMS The use of in-situ gas CEMS for Part 75 compliance is far less common than the use of extractive systems -- in 2002 only about three percent of the gas monitors used to meet Part 75 requirements were in-situ monitors In-situ gas CEMS can measure at a point (or short path) like an extractive gas CEMS or along a path across the stack similar to an opacity monitor
The following sections begin with a discussion of Part 75 requirements for the sample measurement location and then briefly describe the three basic types of systems under Part 75 (gas extractive CEMS gas in-situ CEMS and Flow CEMS) The final CEMS component --the data acquisition and handling system (DAHS) used for electronic data and reporting -- is a critical element for Part 75 compliance and is discussed separately in Section 26 Finally Section 27 provides references that you can use to gain an in-depth understanding of how these systems operate and what their limitations are
22 Sampling Location
Whether the system is extractive or in-situ the flue gas must be monitored at a location where the pollutant concentration and emission rate measurements are directly representative of the total emissions from the affected unit Flowing gases are generally well mixed but in some cases gas stratification can be a concern for the gas measurement location Stack flow on the other hand is always stratified to some degree (lower velocities along the stack walls) Cyclonic or swirling flow (flow that is not parallel to the stack center line) also will have a negative impact on flow monitors and manual reference test methods Thus the selection of sampling points and paths is an important concern for flow monitors To obtain a
Part 75 Field Audit Manual ndash July 16 2003 Page 17
Part 75 CEMS Overview Section 2
representative measurement and avoid problems due to stratification and cyclonic flow Part 75 provides specific requirements for the CEMS sampling location in Appendix A sect 1
221 Gas Measurement Location
Part 75 requires that the representative sampling location be chosen based on the procedures in 40 CFR Part 60 Appendix B Performance Specification 2 which suggests a measurement location (1) at least two equivalent diameters downstream from the nearest control device the point of pollutant generation or at another point at which a change in pollutant concentration or rate may occur and (2) at least a half equivalent diameter upstream from the effluent exhaust or control device Other Part 75 location requirements from Appendix A are summarized below
Locate the measurement location so that the gas CEMS (pollutant and diluent monitor) passes the certification RATA (Note - while not required specifically the diluent O2 or CO2 monitor should sample at the same point as the pollutant monitor)
Point Monitors - Locate the measurement point (1) within the centroidal area of the stack or duct cross section or (2) no less than 10 meter from the stack or duct wall
Path Monitors - Locate the measurement path (1) totally within the inner area bounded by a line 10 meter from the stack or duct wall or (2) such that at least 700 percent of the path is within the inner 500 percent of the stack or duct cross-sectional area or (3) such that the path is centrally located within any part of the centroidal area
222 Flow Measurement Location
Part 75 establishes the following basic location criteria for flow monitors
The location satisfies the minimum siting criteria of Part 60 Appendix A Method 1 (ie the location is greater than or equal to eight stack or duct diameters downstream and two diameters upstream from a flow disturbance or if necessary two stack or duct diameters downstream and one-half stack or duct diameter upstream from a flow disturbance) or
The results of a flow profile study if performed are acceptable (ie there are no cyclonic (or swirling) or unacceptable stratified flow conditions) Part 75 recommends that if a flow profile study indicates unacceptable results the facility should relocate the monitor or add straightening vanes or other source modifications to correct the flow patterns
Regardless of whether these criteria are met a flow monitor can be installed in any location if the flow CEMS can meet the Part 75 performance specification requirements
223 Sampling in Stratified and Swirling Flow Conditions
Stack flow is seldom ideal and some degree of stratification and swirling flow will be present at the monitoring location Approaches to dealing with stratification swirling or cyclonic flow and changing flow profiles due to load changes are discussed below
Page 18 Part 75 Field Audit Manual ndash July 16 2003
Section 2 Part 75 CEMS Overview
Stratified Flow - Flow monitoring systems may locate a single point or path representative of the reference method determined stack flow if the stratification is fairly constant over varying loads If stratification varies with load an array of sampling points can be placed across the stack to obtain a flow average instead of one single sample point For a path monitoring system that is already averaging over a line across the stack the source can select a path that is not as sensitive to the variation or can add a monitor to provide multiple paths on the cross section
Correction Factors - Part 75 allows the source to calibrate the flow monitor to the reference method flow (pre-RATA) Sources commonly use this approach to enable a flow CEMS to pass the multi-load flow RATA at a particular measurement location A flow RATA typically is performed at three loads to account for different flow profiles at changing loads The options described above for stratified flow can include application of a correction factor for stratification based on the reference method RATA values If the source conducts a test using new Methods 2F 2G or 2H (developed to account for non-parallel flow conditions and wall effects on flow measurement) calibrating to the reference method also can account for effects due to swirling Method 2 using the s-type pitot tube will be subject to bias if swirling or stratification due to wall effects or other factors are present Calibration of flow monitors relative to Method 2 under such conditions will not account for those effects
23 Extractive Gas CEMS
There are two types of extractive gas CEMS
The source level or direct extractive system extracts gas from the stack and conveys the sample to one or more analyzers These extractive systems will include filters to remove particulates and may include conditioning to remove moisture acids condensible particulates and interfering compounds In the case of a hot wet system the sample lines and analytic components of the systems are heated to prevent condensation of the stack moisture Heated lines are also required for dry systems up to the point where conditioning occurs
A dilution extractive system filters the stack sample and dilutes the stack sample with clean dry air Dilution occurs either inside the sample probe in the stack or outside of the stack usually at the stack port Dilution systems sample the gas at flow rates much smaller than those used in source level systems Using dry air to dilute the flue gas at ratios of 501 to 3001 the dew point of the diluted sample is reduced to levels where condensation will not occur in the monitoring system As a result moisture removal systems and heated sample lines may not be incorporated into the system A dilution air cleaning system however is required to clean the dilution air and remove CO2 water and any traces of the gases that are to be monitored
231 Source Level or Direct Extractive Systems
A diagram of a source level extractive system is shown in Illustration 2-3 The illustration shows both wet (heated sampling line by-passing the conditioning system) and dry systems
Part 75 Field Audit Manual ndash July 16 2003 Page 19
Part 75 CEMS Overview Section 2
2311 Sample Probe
Probes for source level extractive systems are constructed with stainless steel or Hastelloyreg tubes A coarse filter is commonly attached at the end of the probe to filter out particulate matter before it can enter into the tube Some designs place a deflector plate or cylindrical sheath around the filter to provide protection from plugging A coarse filter can also be in-line in a housing outside of the stack prior to the sample line Sometimes a combination of filters a coarse filter at the probe opening and an in-line fine filter outside of the stack are used to ensure the removal of particulate matter
Blowback or back purging is frequently used to keep the coarse filter from plugging This involves blowing pressurized air or steam back through the filter in an opposite direction to the normal stack flow The blowback occurs at regular intervals (typically from 15 minutes to 8 hours) and typically lasts for 5 to 10 seconds
Page 20 Part 75 Field Audit Manual ndash July 16 2003
Section 2 Part 75 CEMS Overview
Illustration 2-3 Typical Source Level Extractive CEMS
(Gschwandtner and Winkler 2001)
Part 75 Field Audit Manual ndash July 16 2003 Page 21
Part 75 CEMS Overview Section 2
2312 Sample Transport and Conditioning Systems
Most source level extractive systems used in Part 75 applications are dry systems which remove moisture prior to the sample pump and analyzer In a dry system the sample line from the probe to the moisture removal system is heated to prevent water condensation If the facility uses a wet system that does not remove moisture prior to the analyzer the entire length of the sample line sample pump and analyzer must be heated The sample line is usually wrapped in a tube bundle or umbilical which includes the sample lines blowback lines calibration gas lines heating elements and electric lines
Dry source level CEMS used in conjunction with a flow CEMS for Part 75 SO2 NOx
and CO2 mass measurements must also determine the moisture content of the stack gas Illustration 2-3 shows a heated wet sample line connected to a wet O2 analyzer This wet system is used in conjunction with the dry systems dry O2 analyzer to determine moisture Another alternative is to use an in-situ wet O2 analyzer with the dry extractive O2 analyzer A less common approach is to use an H2O analyzer to measure the wet sample
Moisture Removal Systems
There are two common types of moisture removal systems condensers and permeation dryers Condensers cool the gas below the dew point (using refrigerated coils or cooled jet stream condensers) and then remove the condensed liquid water from the gas stream Water removal is performed automatically to prevent filling the condensate trap and flooding the sampling line Absorption of SO2 and NO2 in the condensate is a concern so systems are designed to minimize contact time between the dried gas and liquid
Permeation dryers are constructed using Nafionreg a material that selectively allows the mass transfer of water vapor from the sample gas through the tube membrane to dry purge gas flowing in an outer tube in the opposite direction The gas entering the permeation dryer must be heated above the dew point temperature Permeation dryers avoid the problems of condensate absorption of pollutants and do not have condensate traps However the dryers can be subject to plugging problems from condensing liquids particulates or precipitates
Pumps
Diaphragm pumps and ejector pumps are the most common pumps used in extractive systems Both operate without pump lubricating oils which can cause sample contamination Both diaphragm pumps and ejector pumps can be heated and used in a hot wet system or used ahead of a conditioning system
Fine filter
Many analyzers require removal of particulate larger than 05 m so systems will usually have an additional fine filter near the analyzer inlet There are two types (1) a surface filter usually paper or other porous material which builds up a filter cake and (2) a depth filter which consists of packed fibers of quartz wool or other material
Page 22 Part 75 Field Audit Manual ndash July 16 2003
Section 2 Part 75 CEMS Overview
232 Dilution Extractive Systems
Most coal-fired units subject to Part 75 use dilution extractive systems As noted earlier dilution ratios range from 501 to 3001 A diagram of a dilution extractive CEMS is provided below showing an in-stack dilution probe unheated sample lines and pumps air cleaning subsystem calibration gases analyzers and DAHS
Illustration 2-4
Dilution Ratio = Q1 + Q2
Q2
where
Q1 = dilution air flow rate (Lmin) Q2 = sample flow rate (Lmin)
Dilution Extractive CEMS (Gschwandtner and Winkler 2001)
Part 75 Field Audit Manual ndash July 16 2003 Page 23
Part 75 CEMS Overview Section 2
The dilution of the sample can occur in the stack using a dilution probe or outside the stack using an out-of-stack dilution system Both approaches use the same operating principles A critical orifice controls the sample gas flow rate which is drawn through the orifice by creating a vacuum at the outlet of the orifice with an ejector pump As long as a sufficient vacuum is present the sample gas flow rate through the critical orifice is independent of the downstream pressure The ejector pump also called an aspirator or an eductor pump is operated by the compressed dry clean dilution air The dilution air flow through the venturi nozzle of the pump (flow rates of 1 to 10 Lmin) creates the vacuum pressure at the orifice outlet This vacuum pulls the gas sample through the orifice at rates of 50 to 500 mLmin (limited by the orifice design) and into the ejector pump where it mixes with the dilution air
2321 Dilution Probe
The in-stack dilution probe combines a sonic orifice (a glass tube drawn to a point) with an ejector pump inside the stack probe (See Illustration 2-5) The probe opening inside the stack is screened and uses a quartz wool filter to prevent particulate matter from entering the orifice Plugging has been a problem in applications with wet saturated conditions (after a wet scrubber) due to condensation that causes wetting of the filter and plugging of the orifice In some cases heated dilution probes have been successfully used where entrained water droplets are present
Illustration 2-5In-Stack Dilution Probe (adapted from Jahnke 2000)
Page 24 Part 75 Field Audit Manual ndash July 16 2003
Section 2 Part 75 CEMS Overview
Gas Density Affects
The sonic flow of stack gas through the orifice is affected by the stack gas density and viscosity which in turn are dependent on molecular weight stack pressure and temperature A change in any of these factors will affect the sonic flow and dilution ratio The primary means for addressing theses issues include
Molecular Weight Effect - Gas density changes that result from changing molecular weight are mainly due to changes in-stack moisture or CO2 concentrations These parameters do not vary much in base load units but both can be monitored and often are as part of the Part 75 CEMS With these measurements empirical corrections can be made to the dilution ratio
The molecular weight effect is also a concern in choosing calibration gases Gases used in the initial and subsequent QA tests should have a consistent molecular weight otherwise a bias can be introduced due to the molecular weight differences
Stack Pressure - Stack pressure (absolute stack pressure which includes ambient pressure and stack static pressure) can vary due to changing load or ambient conditions Stack pressure can be monitored separately with the DAHS applying pressure related correction algorithms to the CEMS data
Temperature - Temperature also can vary with load and can be monitored separately with the DAHS correcting the data as described above Temperature correction factors have been more difficult to develop however and have not worked well in situations with temperature changes greater than 50oF (Note - Calibration checks performed when the source is not operating may not provide valid results due to the temperature effect) In response some vendors heat the dilution probe -- the heated probe is the same as shown in Illustration 2-5 except electric heating coils are placed around the probe and controlled to maintain a constant temperature Another approach for stabilizing the temperature is to use an out-of-stack dilution system described in the next section
2322 Out-of-Stack Dilution System
The out-of-stack dilution system dilutes the sample outside of the stack where it is easier to maintain a constant temperature As noted earlier dilution in out-of-stack dilution systems is performed in the same manner as with in-stack dilution probes this time with a critical orifice and ejector pump Illustration 2-6 diagrams one manufacturers out-of-stack dilution system The probe in this type of system is a simple tube similar to that used in a source level system Note that these systems are also affected by the changes in gas density described above and the use of stack moisture or CO2 corrections may be necessary
Part 75 Field Audit Manual ndash July 16 2003 Page 25
Part 75 CEMS Overview Section 2
Illustration 2-6One Type of Out-of-Stack Dilution System
(Gschwandtner and Winkler 2001)
2323 Sample Transport and Dilution Air Cleaning Systems
Sample Lines
The sample line for a dilution system as in the source extractive system is often wrapped in a tube bundle or umbilical which includes the sample lines blowback lines calibration gas lines heating elements and electric lines The sampling line often does not need to be heated after the dilution air has been added but heated freeze protect lines are used in regions of the country where sub-zero temperatures may occur or if the dilution ratio is low
Dilution Air Cleaning System
The dilution air cleaning subsystem delivers dry clean pollutant-free air to the dilution probe It consists of a series of particulate and charcoal filters dryers and scrubbers which reduce CO2 NOx SO2 moisture organic compounds and other compounds in ambient air to sub-ppm levels
The dilution air is compressed air provided by the plants utilities commonly referred to as plant air or from a compressor dedicated to the CEMS In either case the compressed air enters an air cleaning subsystem where it is further cleaned and regulated If the filters and
Page 26 Part 75 Field Audit Manual ndash July 16 2003
Section 2 Part 75 CEMS Overview
scrubbers are changed regularly and there are no leaks in the subsystem the dilution air will be dry clean and free of contaminants including CO2
The flow of pressurized dilution air through the ejector pump moves the sample to the analyzers so a separate pump is not required The dilution air pressure should be held relatively constant because changes in the pressure will affect the dilution ratio Some systems include mass flow controllers to maintain the dilution flow rate at a constant level
233 Calibration Gas System
Part 75 quality assurance requirements include daily calibration error tests and linearity tests (usually quarterly) which challenge the extractive gas CEMS with calibration gases of known concentrations The calibration gases used in the tests include a zero level gas as well as low mid and high concentration levels based on the span of the monitor The calibration gas system consists of calibration gases gas regulators valves and line filters The gases must meet the criteria specified in Part 75 Appendix A sect 51
Calibration gases for the daily calibration error test and linearity tests are injected as close as possible to the probe (Part 75 App A sect 221) The calibration gas system must include controls to ensure that calibration gases are injected at the same flow rate pressure and temperature as the sample gas under normal system operation
There are two common injection locations for source level extractive systems (1) the calibration gas is injected into the in-stack probe external filter housing and is drawn into the sampling system or (2) the calibration gas may be injected into an internal filter housing between the probe and sample line at the stack flange In dilution extractive systems the calibration gas must be injected into the dilution probe housing with the calibration gas drawn through the sonic orifice In an out-of-stack dilution system the calibration is injected prior to the inlet of the critical orifice
Calibration gases are also sometimes injected at the analyzers when performing certain diagnostic tests or calibration adjustments
234 Analyzers
Gas analysis methods for extractive systems can be divided into four major categories Those categories with common Part 75 applications are shown in Table 2-1 and are briefly described below More detailed discussion of analyzer operating principles are available in the references listed in Section 27 The CEMS designer will choose the analytical method based on the overall system design (eg dilution extractive versus source-level extractive wet versus dry systems) In source level extractive systems the gas analyzers measure at stack concentrations in the ppm range while in the dilution extractive system gas analyzers read in the ppm or ppb range similar to those of ambient monitors
Part 75 Field Audit Manual ndash July 16 2003 Page 27
Part 75 CEMS Overview Section 2
Table 2-1Common Extractive Gas CEM Analytical Methods
Techniques Gas Measured
Absorption Spectroscopic Methods
Non-Dispersive Infrared (NDIR) SO2 NO CO2 H2O
Gas Filter Cell Correlation (GFCIR) SO2 NO CO2 H2O
Differential Absorption (UV) or (IR) SO2 NO CO2
Luminescence Spectroscopic Methods
Chemiluminescence NO NOx
Fluorescence SO2
Electro-Analytical Methods
Electrocatalysis O2
Paramagnetic Techniques
Magnetodynamic O2
Thermomagnetic O2
2341 Absorption Spectroscopy
Absorption spectroscopic methods measure the amount of light absorbed by a pollutant molecule The analyzer has four main components (1) radiation source to produce the light in the desired range of the spectrum (2) spectral limiters which further reduce the band width of the light to specific wave lengths (3) detectors which measure the light energy (4) optical components which direct and focus the light and (5) components to correct for interfering gases and drift (eg a reference gas cell)
Non-Dispersive Infrared (NDIR)
Non-Dispersive Infrared (NDIR) monitors are commonly used to measure CO2 in dilution extractive systems The analyzer measures the degree of absorption of infrared light by molecules in the sample gas compared to a reference cell containing gas that does not absorb infrared light in the wavelengths used by the instrument The ratio of the detector signals from the two cells is used to determine the light transmittance which is related to the CO2
concentration using calibration curves developed with known gas quantities The monitors are called non-dispersive because filters are used to narrow (not disperse) the infrared wavelength to a small range centered on the absorption peak of the molecule of interest
Gas Filter Cell Correlation (GFCIR)
Gas Filter Cell Infrared analyzers use a variation of the NDIR technique by using a reference cell that contains 100 percent concentration of the pollutant measured instead of 0 percent The reference cell will remove most of the light at the infrared wavelength absorbed
Page 28 Part 75 Field Audit Manual ndash July 16 2003
Section 2 Part 75 CEMS Overview
by the compound of interest This method is more commonly used in in-situ applications but is used in extractive systems
Differential Absorption
Differential Absorption analyzers perform measurements at two different light frequencies One frequency is absorbed by the target molecule while the other reference frequency is not The ratio of the absorption at the two wavelengths is correlated to the target gas concentration Again calibration curves are created using known gas concentrations Part 75 sources use UV non-dispersive photometers for SO2 and NOx measurements These types of instruments can be used in wet extractive systems as water vapor does not absorb light very well in the UV region There are also differential absorption analyzers that use light in the infrared region particularly for CO2 in wet source-level extractive systems
A single differential absorption analyzer may also measure a number of component gases by using multiple wavelengths of light
2342 Luminescence Spectroscopy
Luminescence spectroscopic methods measure the amount of light emitted by an excited molecule Analyzers using these methods are very specific for a given molecule and are more sensitive than absorption spectroscopy or electrochemical methods As in the absorption spectroscopic methods all of the instruments use calibration curves developed from known target gas compositions to relate the measured light energy to gas concentration
Chemiluminescence
Chemiluminescence monitors are commonly used for NOx in dilution extractive systems Chemiluminescence is the emission of light produced as a result of a chemical reaction and a chemiluminescence NO - NOx monitor measures the amount of light generated by the reaction of NO with O3 This monitor uses an ozone generator to produce O3 and a catalytic converter to reduce NO2 in the sample gas to NO before reacting with O3 The monitor can measure both NO or NOx by sequencing the NO-O3 reactions First the sample gas can bypass the converter and go directly to the reaction cell measuring the NO Then after this reaction the gas goes to the converter where the NO2 is reduced to NO and sent back to the reaction chamber to measure NOx (NO and NO2) NO2 can be determined by subtracting the NO measured by the first measurement from the total NOx (NO and NO2) measured in the second step
Fluorescence
Fluorescence analyzers are used to measure SO2 in both dilution and source-level extractive systems Fluorescence occurs when a molecule absorbs light at one wavelength as a result of the absorbed energy the molecule emits light at a different wavelength The analyzer uses light (either from a continuous or pulsed infrared light source) to irradiate the gas sample The light radiated back from the sample is measured by the sensor after filtering to select a narrow bandwidth of the fluorescent radiation
Interference from quenching is a concern for both chemiluminescence and fluorescence analyzers Quenching occurs when the excited molecules collide with other molecules losing energy as a result of the collision This changes the energy state from the level caused by the
Part 75 Field Audit Manual ndash July 16 2003 Page 29
Part 75 CEMS Overview Section 2
analyzer chemical reaction or irradiation For example in a fluorescence analyzer the excited SO2 molecule in the gas sample might collide with another molecule changing its energy state from what it would have been due to the analyzer irradiation This can be a problem if the stack gas composition changes as different molecules have different quenching affects It is also a problem if the calibration gas background concentrations change (single blend - multiblend calibration gases)
Quenching effects can be limited by using dilution extractive systems which will result in a constant background composition (the dilution air) Fluorescence analyzers can also use ultraviolet light at lower wavelengths to shorten the fluorescence time to reduce quenching probabilities Chemiluminescence systems can increase the O3 flow into the reaction chamber to provide a more constant background concentration
2343 Electro-Analytical Methods
The zirconium oxide (ZrO2) analyzer an electrocatalytic analyzer is the most common O2 analyzer used by Part 75 sources The analyzer can measure O2 on both a dry and wet basis and it is used with source level extractive systems and as an in-situ monitor
This analyzer uses a heated ceramic material (ZrO2) with a thin platinum catalytic coating as a solid electrolyte which allows the transfer of oxygen from the reference side of the cell (maintained at 21 percent O2) to the sample side (continual flow of stack gas with lower O2
concentrations eg 3 - 6 percent) The sample O2 concentration can be determined by measuring the electromotive force of the O2 transfer combined with a stable cell temperature and reference cell partial O2 pressure
The ZrO2 electolyte is heated to 850 oC At that temperature O-2 ions catalyzed by the platinum can move through the material Combustibles materials in the stack gas sample (CO hydrocarbons) can burn at the operating temperatures of the analyzer consuming sample gas O2 The combustible concentrations however are in much lower concentrations (ppm) than the O2 and have a negligible impact on O2 measured on a percentage basis
2344 Paramagnetic Techniques
Paramagnetic techniques are also used by Part 75 sources to measure O2 Analyzers using these techniques are only used in conjunction with source level extractive systems and water and particulate matter must be removed prior to the monitor
Molecules that are attracted by a magnetic field are described as paramagnetic while those repelled are called diamagnetic Most materials are diamagnetic but O2 is paramagnetic and strongly attracted to magnetic fields compared to most other gases (though NO and NO2
are also paramagnetic and may cause interference if present at high concentrations)
Magnetodynamic
A magnetodynamic analyzer makes use of the effect that O2 has on modifying a magnets magnetic field In a dumbbell type of magnetodynamic analyzer a torsion balance dumbbell with diamagnetic glass spheres is suspended in a nonuniform magnetic field The dumbbell spheres are pushed away from the strongest part of the magnetic field Oxygen alters the field causing a change in the dumbbell position A light source mirror on the dumbbell and
Page 30 Part 75 Field Audit Manual ndash July 16 2003
Section 2 Part 75 CEMS Overview
detector measure the dumbbell position Current through a wire encircling the dumbbell creates an electromagnetic counter-torque which restores the mirror to the position when O2 is not present The amount of current required to restore the dumbbell position is related to the amount of O2 present
Thermomagnetic
Thermomagnetic analyzers are often called magnetic wind analyzers and are based on the decrease in the paramagnetic attraction of O2 with increased temperature The O2 in the sample gas is drawn into a tube with a heated coil filament and magnetic field at one end The O2 enters the tube attracted by the magnetic field As the molecules are heated the paramagnetic attraction is decreased and the heated molecules are pushed out by cooler molecules with stronger paramagnetic attraction The O2 flow through the tube creates the so called wind and cools the heating coil reducing its resistance The change in resistance is measured and related to O2 concentration The monitor can be affected by changes in the gas composition which affect thermal conductivity and the filament temperature Combustible materials can also react on the heated filament changing the resistance
24 In-Situ Gas Monitors
In-situ gas monitors are far less common at Part 75 sources In-situ monitors were initially designed for high concentration combustion gas applications not for the lower pollutant gas concentrations following pollution control devices Some in-situ analyzers also had difficulty meeting EPA certification and quality assurance requirements However in-situ monitors do have some advantages over extractive systems The monitoring system measures concentrations at stack conditions and eliminates the need for the sample transport and conditioning systems required by extractive CEMS Newer designs offer a wider range of analyzer options and virtually all point and some path systems can now be calibrated with calibration gases as required by Part 75
In-situ monitors are classified as either path or point monitoring systems (See Illustration 2-6) The in-situ point CEMS measures gas concentrations at a single point in the stack much like the single probe in a gas extractive system The term point is used when the sampling is over a short path but still much less than the stack cross-section The in-situ path CEMS measures gas concentrations over an optical path equivalent to the internal stack diameter by transmitting a light through the flue gas (single pass) and sometimes back (double pass)
Part 75 Field Audit Manual ndash July 16 2003 Page 31
Part 75 CEMS Overview Section 2
Illustration 2-7In-Situ Gas CEMS (Jahnke 1992)
241 Path In-Situ CEMS
Path in-situ CEMS use spectroscopic analytical methods to measure pollutant concentrations in the flue gas The systems have the same principle components as an absorption spectroscopic analyzer described in Section 2341 (1) radiation source to produce the light in the desired range of the spectrum (2) spectral limiters which further reduce the band width of the light to specific wave lengths (3) detectors which measure the light energy and (4) optical components which direct and focus the light In addition blowers are required to keep the optics clean of stack particulate
In a single pass system a light transmitter and detector are located on opposite ends of the light path and the light makes one pass along the measurement path A double pass system has the transmitter and light source on one end of the sample path and a retroreflector at the opposite end to reflect the light back to the detector The light makes two passes along the measurement path
242 Point In-Situ CEMS
The in-situ point CEMS typically consists of a measurement probe which contains a cavity in which the sample gas can be measured either by a sensor or by light absorption The probe opening is protected by some sort of particulate filter (ceramic sintered stainless steel or Hastelloyreg filter) The sample concentrations within the cavity adjust to changing effluent concentration via diffusion through the filter
243 In-Situ Gas Analyzers
In-situ monitors use spectroscopic and electro-analytical techniques similar to extractive systems described earlier in Section 234 In extractive system spectroscopic analyzers the light interacts with the sample within the analyzer instrument For in-situ spectroscopic analyzers the light interacts with the sample in the sample probe (point in-situ) or across the
Page 32 Part 75 Field Audit Manual ndash July 16 2003
Section 2 Part 75 CEMS Overview
stack diameter (path) Analytical methods used by in-situ gas monitors at Part 75 sources are shown below in Table 2-2
Table 2-2In-Situ Gas Analyzer Methods
Techniques Gas Measured
Absorption Spectroscopic Methods
Differential Absorption (UV) SO2 NO
Gas Filter Cell Correlation (GFCIR) CO2
Second Derivative Spectroscopy (UV) SO2 NO
Electro-Analytical Methods
Electrocatalysis O2
244 System Calibration
Daily calibration error tests and linearity tests can be performed on point in-situ gas CEMS in a manner similar to extractive gas CEMS by flooding the probe with the calibration gases QA tests for path systems are more difficult Path systems can use a flow through calibration cell that is placed in the measurement path for linearity and calibration error tests The tests must use EPA Protocol gases and the calibration cell must be located so as to challenge the entire measurement system
The system consists of a calibration cell which is a flow-through gas cell for the zero and other calibration gases and a zero mirror to reflect the light back to the detector without traveling through the stack The calibration cell should be at the same temperature and pressure as stack conditions If the flow-through cell has a length shorter than that of the sample path calibration gas at high concentrations (percent levels) may be necessary For CO2 the only way to perform the daily calibration and linearity tests is to have a flow-through cell with the same path length as the sample path
A single path system can not use a zero mirror One approach for single pass systems is to use a zero pipe combined with the flow through calibration cell The zero pipe provides an optical path not affected by the stack gas
25 Flow CEMS
There are three types of flow CEMS in use today at Part 75 sources
Differential pressure flow monitors Thermal mass flow monitors and Ultrasonic flow monitors
Part 75 Field Audit Manual ndash July 16 2003 Page 33
Part 75 CEMS Overview Section 2
All of the flow monitors are in-situ monitors determining flow on a wet basis based on dynamic measurements of parameters that can be related to the stack velocity at a point or along a path within the stack
251 Sampling Location
As noted earlier in Section 22 the measurement location must provide a representative volumetric flow over all operating conditions Stratified flow profiles cyclonic flow and flow profiles that change with load all can impact the choice of measurement location Multiple measurement points or paths and the use of correction factors to calibrate the flow CEMS to the reference method (pre-RATA) may be required to meet the location requirements in Appendix A sect 12
252 Differential Pressure
Flow Monitors
Factors Affecting Flow Data Accuracy
Representative sampling points Sensormonitor accuracy and stability
(performance specifications in Appendix A sect 33)
Accuracy of secondary parameter values (gas temperature measurement path length)
Accurate duct dimensions (area calculation)
Proper calibration
Differential pressure monitors sense the difference between the impact and wake pressures at tube openings (pitot tubes or multi-point tubes) in the gas flow and a differential pressure transducer converts the pressure signals into electric current ifferential pressure is the difference between the impact and wake pressures e differential pressure is combined with stack gas temperature stack pressure and molecular weight to determine velocity using the pitot equation below olumetric flow is calculated by multiplying velocity by the stack or duct cross sectional area
where vs = stack gas velocity Kp = dimensionless constant Cp = pitot tube coefficient p = velocity pressure Ts(abs) = absolute temperature of the stack gas Ps = absolute pressure of the stack gas Ms = molecular weight of the stack gas
Usually the molecular weight of the flue gas and stack pressure are assumed to be constants and are not measured Temperature measurements are made either with a thermocouple or resistence temperature device (RTD) The temperature probe should also be placed in a location representative of the stack flow profile
The dTh
V
Page 34 Part 75 Field Audit Manual ndash July 16 2003
Section 2 Part 75 CEMS Overview
The flow CEMS differential pressure probe may measure at one point in the stack or at multiple points using a multi-point averaging probe or multiple pitot tube assembly (See Illustration 2-7)
Differential pressure monitors are sensitive to non-parallel or swirling flow If the flow is at an angle to the stack center line there will be a bias in the velocity measurement The bias is usually positive
Illustration 2-8 Example of Multiple Probe Locations (Jahnke 1994)
Quality Assurance Issues
Probe and line plugging is minimized by intermittently back purging the line and probe openings with clean air Back purging is required as a daily interference check (Part 75 Appendix A sect 2222) and prevents extreme plugging in most situations Daily calibration error tests are performed after the probe and test the pressure transducer and system electronics The pressure side of the probe or transducer is pressurized to a pre-set level to check the span and then both inputs are equalized to test the zero level Because probes are subject to corrosion and abrasion they should be visually inspected periodically in addition to these tests Part 75 requires a quarterly leak check of all sample lines for a differential pressure flow monitor
253 Thermal Mass Flow Monitors
Thermal mass flow monitors are based on the principle of thermal heat transfer due to convection Gas flowing across a heated surface tends to cool the surface The molecules of the flowing gas interact with the heated boundary layer surrounding the surface and remove heat The greater the flow rate the more heat is removed There are two types of sensors used by thermal flow monitors the constant power anemometer and the constant temperature anemometer
Both types of anemometers use two RTDs one heated and the other unheated The RTDs are usually protected by a stainless steel tube and mounted together in the stack The constant power anemometer measures the temperature difference between the RTDs at a constant current The temperature difference responds proportionally to changes in velocity The temperature difference will be high at low velocities (less cooling of the heated RTD) and
Part 75 Field Audit Manual ndash July 16 2003 Page 35
Part 75 CEMS Overview Section 2
low at high velocities (more cooling of the heated RTD) The constant temperature anemometer maintains a constant temperature difference between the RTDs by varying the current The change in current is proportional to the change in gas velocity The higher the velocity the higher the current required to maintain the heated RTD temperature conversely at lower velocities a lower current is required
The sensors can be placed at a single point if the flow profile or in a multiple point array depending on flow conditions
Illustration 2-9Thermal Mass Flow Monitor Probe (adapted from Jahnke 1992)
(Th = Temperature of Heated RTD Ta = Temperature of Unheated RTD)
The output from a thermal flow monitor (an empirical function dependent on the measured temperature difference gas composition and power to the anemometers) is proportional to mass flow Information on the flue gas density is required to convert mass flow to volumetric flow The gas density is dependent on fuel gas composition so changes in moisture or CO2 can affect the systems response
f(heat loss) f(Tv - Ts) = vsAs
where vs
f(Tv - Ts) Tv
Ts
As
= stack gas velocity= heat loss function= temperature of velocity sensor= stack temperature= gas density= stack cross sectional area
Thermal flow monitors can not be used in locations where there are entrained water droplets The water droplets evaporate on the sensor causing a dramatic temperature loss due to the heat of evaporation which would be interpreted as caused by the flowing gas Corrosion and particulate build up on the sensors can be a problem
Page 36 Part 75 Field Audit Manual ndash July 16 2003
Section 2 Part 75 CEMS Overview
Daily Interference and Calibration Error Tests
The daily interference test check requires a means to ensure on a daily basis that the probe is sufficiently clean to prevent interference (Part 75 Appendix A sect 2222) The sensors are usually cleaned by self heating at temperatures of 700oF or higher to burn off any adhering particles or chemical compounds Daily calibration error tests check that the sensors are operational and that the system electronics are functioning correctly
254 Ultrasonic Flow Monitor
Ultrasonic flow monitors measure the time required for an ultrasonic pulse to travel across a stack or duct at an angle to the stack flow The monitors are also called transit time monitors The monitor consists of downstream and upstream transducers located opposite of each other on the stack wall which send and receive ultrasonic pulses The difference in the time that it takes for the pulse to go in the different directions between the two transducers (the time it takes to go downstream is shorter than the time to go upstream) and the distance traveled are used to calculate velocity The equation for an ideal flow profile is shown below
where va = average velocity of the flue gas L = distance between the transducers = angle of inclination t1 = traverse time in upstream direction t2 = traverse time in downstream direction
The most common angle of inclination or path angle between the transducers at Part 75 sources is 45o Other angles are possible and various designs and approaches are used to optimize signal recognition for better transmission reception reliability and accuracy
Illustration 2-10 Ultrasonic Flow Monitor
Part 75 Field Audit Manual ndash July 16 2003 Page 37
Part 75 CEMS Overview Section 2
The velocity of the sound pulse through the stack gas is affected by the stack gas density so changes in the stack temperature due to load changes andor temperature variations across the sonic path will affect the flow measurement In some cases correction factors can be developed using the pre-RATA testing to account for these changes
Non-parallel flow will also affect the ultrasonic monitor measurements If the angle or pitch of the non-parallel flow is in the same direction from the stack center line as the measurement path inclination the flow measurement will have a positive bias The flow measurement will have a negative bias if the flow pitch angle and inclination angle are in opposite directions Two ultrasonic monitors measuring along different path cross sections (an x-pattern) can be used in situations with a stratified flow profile that varies with load One path is usually sufficient if the stratification is stable
Daily Interference and Calibration Error Tests
Part 75 requires a means to ensure on at least a daily basis that the probe remains sufficiently clean to prevent interference (Part 75 Appendix A sect 2222) Blowers are provided to keep the sensors clean much like on an opacity monitor The blower air is heated to the temperature of the flue gas to prevent condensation which may damage the transducer Daily calibrations of this type of flow CEMS are indirect The electronic calibration process verifies that the upstream and downstream sensors are working in both the transmitting and receiving modes The procedure also verifies that the signal to noise ratio is acceptable
26 Data Acquisition and Handling System (DAHS)
The term data acquisition and handling system (DAHS) refers to the CEMS hardware and software components that take the output from the analyzers combine it with other information and compute hourly emissions The DAHS acquires and stores the necessary data (Part 75 requires that the DAHS automatically record all emissions data and the daily calibration error checks - Appendix A sect 4) It also computes the emissions and quality assurance test results in terms of the regulatory requirements displays the data and produces the quarterly reports required by Part 75 The DAHS software for Part 75 is highly specialized to match the electronic data reporting (EDR) format
In addition to a DAHS a CEMS requires softwarehardware components for system control functions These functions include automatic calibration probe blowback analyzer sequencing for time-shared analyzers error detection diagnostic routines and similar tasks
261 CEMS Computer Systems
In general there are two approaches for a CEMS computer system In one approach a single computer handles both the CEMS control functions and the DAHS functions In the other there is a separate control system that handles the CEMS functions and may manipulate data as an interface between the analyzers and a separate DAHS computer Because of the complexity of the control and DAHS functions in Part 75 CEMS it is more typical to have separate systems for control and data acquisition and handling
System control hardware options include computers programmable logic controllers (PLCs) data loggers and embedded microprocessors Besides providing CEMS control
Page 38 Part 75 Field Audit Manual ndash July 16 2003
Section 2 Part 75 CEMS Overview
functions described above controllers also can provide some analyzer data processing prior to the DAHS These may include converting analog data to digital and performing some of the automatic correction calculations and emission calculations
The DAHS computer is most often a stand alone personal computer although some plants are using the plants distributive control system (DCS)
262 Emissions Data Processing
The analyzers may send digital signals directly to the DAHS or send analog signals that must be converted to a digital value and scaled The real time second-to-second data is first averaged (1-15 minutes) by the analyzer control interface or DAHS Corrections may be applied to the data (eg pressuretemperature compensation molecular weight flow and moisture monitoring polynomials sonic velocity correction factors NOx quenching correction factors and dilution ratio settings) and the data then converted to the proper units for the Part 75 formula calculations
The data must be averaged again to one-hour averages as required by Part 75 A valid measurement must be recorded in each quadrant of the hour except when performing required Part 75 QA testing (eg a daily calibration or quarterly linearity test) For hours in which Part 75 QA testing is performed only two quadrants of the hour need to be captured (sect 7510(d)(1)) The hourly data are then used to calculate the Part 75 emissions parameters and rates based on formulas in Part 75 Appendices D - G with the CEMS-based formulas in Appendix F A table of the required formulas is provided in the EDR v22 Reporting Instructions (August 2002)
263 QA Test Data Processing
As noted previously Part 75 requires automatic data capture and calculation of daily calibration error test results Other QA test data and results may be entered manually Automatic and manual data entry for a Part 75 DAHS are discussed further in Section 46 of this manual and in Section IIC3 of the EDR v22 Reporting Instructions
Some CEMS use the daily calibration error test results to automatically correct the analyzer data These mathematical adjustments are similar to an internal bias adjustment factor in that the DAHS evaluates the response in comparison to the reference value and assigns from that time forward an adjustment factor which is used to adjust the data for reporting
264 Part 75 Reporting
The DAHS generates the quarterly electronic data report (EDR) submitted by the source to EPAs Clean Air Markets Division The EDR is in ASCII text format with each line representing a separate record which includes plant and unit information monitoring plan information hourly monitoring data and QA test results The reports are sent directly to EPA by electronic data transfer There is more discussion of the EDR in Section 311 of this manual
Part 75 Field Audit Manual ndash July 16 2003 Page 39
Part 75 CEMS Overview Section 2
27 References
Gschwandtner G and Winkler J (2001) US EPA Acid Rain Program Continuous Emissions Monitoring Systems Reference Manual US Environmental Protection Agency Acid Rain Division
Jahnke J A (1992) APTI Course 474 Continuous Emissions Monitoring Systems Student Manual (Revised) US Environmental Protection Agency Office of Air Quality and Planning Standards
Jahnke J A (1994) An Operators Guide to Eliminating Bias in CEM Systems US Environmental Protection Agency Office of Air and Radiation EPA 430-R-94-016
Jahnke J A and Peeler J W (1997) Handbook Continuous Emission Monitoring Systems for Non-Criteria Pollutants US Environmental Protection Agency Office of Research and Development EPA625R-97001
Jahnke J A (2000) Continuous Emission Monitoring Second Edition John Wiley amp Sons Inc
Shigehara R T and Peeler J W (1998) Evaluation of Daily Calibration Techniques of Continuous Flow Monitoring Systems US Environmental Protection Agency Acid Rain Division
Page 40 Part 75 Field Audit Manual ndash July 16 2003
Section 3 Audit Preparation
Section 3 covers the data that are available to help you prepare for the field audit and explains how to use that data eparing for the audit can increase your efficiency by allowing you to target issues for auditing while at the plant lso gain credibility with plant personnel if you come prepared ection emphasizes the use of the MDC software to review quarterly electronic data
PrYou a
This s
31 Using Part 75 Electronic Data to Conduct Pre-Audit Reviews
You will have available two types of source file information in preparing for a Part 75 field audit Hardcopy file information may include correspondence petition responses portions of the monitoring plan (such as system diagrams) reports of previous inspections or audits performance test reports and permits This type of information may be similar to background file information available for other types of air compliance inspections and audits
The second type of information is the quarterly electronic report required under Part 75 This wealth of electronic data generally is not available under other programs and provides a valuable resource that you can use prior to the plant visit to conduct monitoring checks and to identify potential source monitoring problems The electronic information includes data on the units monitoring plan certification and recertification events QA tests and emissions and operating data for each hour of the quarter
This section first introduces you to the quarterly Electronic Data Report (EDR) The section then describes how to review reports that EPA sends to affected sources to provide feedback on each EDR submitted Finally the section focuses on how to use EPAs Monitoring Data Checking (MDC) software to review EDRs
The format and volume of the electronic data can be daunting at first especially for inspectors who have responsibilities for multiple air programs The MDC software will be a vital asset to help you access and analyze the EDR and you should ensure that you take advantage of this tool as you prepare for an audit
311 Quarterly Electronic Data Reports
A facility usually submits each Part 75 quarterly EDR on a unit basis so one facility may submit multiple EDRs each quarter In other cases one report may be submitted for all units that exhaust to a common monitored stack or other complex stack configuration The EDR is in ASCII text format with each line representing a separate record referred to as a record type or RT An example of the layout of information in a report line or record type is provided in Illustration 3-1 In this example a line of hourly NOx emission rate data (RT 320) is presented If you want to explore the structure and content of the EDR in more detail you should review the most up-to-date version of the EDR Reporting Instructions and Formats --see Section 15 for guidance on how to access the EDR guidance documents
Part 75 Field Audit Manual ndash July 16 2003 Page 41
Audit Preparation Section 3
Illustration 3-1Example EDR Data Format for Record Type 320
To show you the various data elements you will see in an EDR Illustration 3-2 below provides an example summary of the content of an EDR by record type The example is for two Acid Rain CEMS units monitored at a common stack A number of these record types like RT 320 in Illustration 3-1 above pertain to emissions or operating data that are reported for each hour of operation so a quarterly EDR will have many lines of data A quarterly EDR for a unit with a single stack may have over 20000 lines An EDR in text file format therefore may look overwhelming but the MDC software tool allows you to streamline your review and analysis of the data
Page 42 Part 75 Field Audit Manual ndash July 16 2003
Section 3 Audit Preparation
Illustration 3-2Example Summary Of Quarterly Report Content For Two Acid Rain
CEMS Units Emitting Through Common Stack
FACILITY INFORMATION Type 100 Record (Facility and report data)
Type 102 Record (Facility information)
COMMON STACK FOR UNITS 1 amp 2 Type 200 Records (SO2 concentration data by date and hour)
Type 201 Records (NOx concentration data by date and hour)
Type 202 Records (CO2 concentration data by date and hour)
Type 210 Records (Diluent data by date and hour)
Type 220 Records (Volumetric flow data by date and hour)
Type 230 Records (Daily calibration test data by date and hour)
Type 231 Records (Flow interference data by date and hour)
Type 300 Records (Stack operating parameters by date and hour)
Type 301 Record (Quarterly and cumulative emission data)
Type 310 Records (SO2 mass emissions data by date and hour)
Type 320 Records (NOx emission rate data by date and hour)
Type 330 Records (CO2 mass emissions data by date and hour)
Type 503 Records (For Unit 1 (Common stack definition table)) (For Unit 2 (Common stack definition table))
Type 510 Records (Monitoring systemsanalytical components table)
Type 520 Records (Formula table)
Type 530 Records (Span table)
Type 535 Records (Stack operating load data)
Type 536 Record (Range of Operation normal load and load usage)
Type 556 Records (Monitoring system recertification events)
Type 601 Records (Quarterly linearity test data) Type 602 Records (Quarterly linearity check results)
Type 603 Records (Flow quarterly leak check results)
Type 605 Records (Reference data for flow-to-load ratio or GHR evaluation)
Type 606 Records (Quarterly flow-to-load or GHR check)
Type 610 Records (RATA and bias test data)
Type 611 Records (RATA and bias test results)
Type 623 Records (On-lineOff-line calibration demonstration)
Type 699 Record (QA test extension claim based on grace period)
UNIT 1 (MONITORED AT COMMON STACK) Type 300 Records (Unit operating parameters by date and hour)
Type 301 Record (Quarterly and cumulative emission data)
Type 504 Record (Unit information)
Type 505 Record (Unitprogram information)
Type 585 Records (Monitoring methodology information)
Type 586 Record (Control equipment information)
Type 587 Record (Unit fuel type)
UNIT 2 (MONITORED AT COMMON STACK) Type 300 Records (Unit operating parameters by date and hour)
Type 301 Record (Quarterly and cumulative emission data)
Type 504 Record (Unit definition table)
Type 505 Record (Unitprogram information)
Type 585 Records (Monitoring methodology information)
Type 586 Record (Control equipment information)
Type 587 Record (Unit fuel type)
CERTIFICATIONS Type 900 Records (Certification electronic signature)
Type 901 Records (Certification statement)
Type 999 Record (Contact person information)
Part 75 Field Audit Manual ndash July 16 2003 Page 43
Audit Preparation Section 3
312 Quarterly Feedback Reports
CAMD conducts two separate automated reviews of each quarterly EDR submission The first is generated by the Emission Tracking System (ETS) as instant feedback when the source submits the file to the EPA mainframe This instant ETS feedback provides the EPA Status Code which indicates whether the file was accepted and whether any errors were identified Certain errors are considered critical and necessitate a resubmission of a corrected file Other errors are considered informational and should be corrected by the source in future quarters but need not necessarily be addressed immediately Any errors that are identified are listed in the ETS feedback report with the relevant error code description number of hours and identification of the first hour in which the error occurred ETS checks include recalculations of hourly and cumulative emission values as well as range checks for acceptable values and codes in various fields
As part of preparing for a field audit you can download the ETS feedback report from the EPA mainframe (if you have access rights) or you can request a copy of the feedback from your CAMD contact If errors were identified on the latest ETS feedback you should review this report with the source during the on-site inspection and verify that the source has corrected those errors
The second automated review is generated by the Monitoring Data Checking (MDC) software and is sent by email to a facilitys Designated Representative shortly after the quarterly EDR submission period The MDC feedback consists of monitoring plan and QA test data evaluations As with the ETS errors certain MDC errors are considered critical and must be corrected by a resubmission of the quarterly file Note that since MDC is available to sources to download from the CAMD website they can run these same evaluations on their quarterly files prior to submission The MDC software is discussed in more detail in the following sections with guidance on how you can use the software to prepare for the plant visit
313 Using MDC to Prepare
for an Audit Key Checks Using MDC to Prepare
for the Field Audit
bull Print a copy of the monitoring plan report to take with you to the plant
bull Evaluate QA Test results (eg linearity RATA flow-to-load) and check for duplicate tests Identify if the source has claimed an exemption or grace period
bull Print and review recertification reports Also print missing data reports if available
bull Check hourly emissions calculations and missing data periods using the MDC Hourly feature
3131 MDC Overview
EPA developed the MDC software to allow affected sources State agencies and EPA staff to enter analyze print and export electronic monitoring plan certification and quality assurance data and to evaluate hourly emissions data for Part 75 monitoring The software also allows industry users to submit monitoring plan and certification data to EPA through standard electronic data transfer protocols
Page 44 Part 75 Field Audit Manual ndash July 16 2003
Section 3 Audit Preparation
To prepare for an audit you can use MDC to perform the following tasks in reviewing the quarterly EDR data
View monitoring plan QA test extensionexemption and compliance certification records directly on screen
Evaluate monitoring plans quality assurance tests and extensionexemption records
Print out reports of monitoring plans QA test data or evaluations
Analyze hourly data with the MDC Hourly data module
Analyze view and chart hourly data records for SO2 CO2 O2 NOx and heat input Also calculate and display summary data for daily monthly and quarterly time periods
Check hourly emissions calculations (MDC relies on the calculation procedures identified in a units monitoring plan together with RATA test data for these calculations) You can also calculate cumulative emissions from the hourly data to compare to the quarterly and annual values that the source reports in the EDR (see RTs 301 and 307)
Check to determine the quality assurance status (with respect to RATAs and linearity tests) of measurements reported for specific hours and monitors (MDC uses the ongoing reported quality assurance test data and extensionexemption records for this analysis)
Archive hourly data calculations and QA status for quick retrieval
Use a utility in MDC to modify parameter tolerances for comparisons of reported versus calculated hourly emissions
The following subsections address these uses in greater detail
3132 Getting Started with MDC
The most current version of MDC along with instructions and training materials are available on CAMDs website Once you obtain MDC and install it on your computer the next step is to import recent EDRs for the units to be audited You will need first to obtain the quarterly EDRs which can be downloaded from CAMDs website or received on a CD from CAMD
Obtaining MDC Software
EPAs MDC Software and supporting information can be downloaded at wwwepagovairmarketsmonitoringmdc
The EDR files should be saved in the data folder of the MDC directory You may need as many as four quarters of the most recent EDRs for the units and may need to go back additional quarters depending on when the most recent RATA was performed QA tests are included in the EDR for the quarter during which the tests were performed
Part 75 Field Audit Manual ndash July 16 2003 Page 45
Audit Preparation Section 3
3133 Review and Print Electronic Portion of Monitoring Plans
The electronic portion of a monitoring plan provides important background information The plan identifies the affected units (eg type rated capacity fuels combusted) control equipment what types of monitoring systems and components are in use monitor span values DAHS formulas missing data procedures and other information (See Table 3-1)
The plan should be printed out using the MDC reports function and brought to the plant The plan printout provides a simple template and check sheet for the plant visit For example when verifying monitor serial numbers to ensure that equipment has been properly certified you may simply check off on the printed monitoring plan each monitor system component that matches and include this as a check sheet in the audit report
Table 3-1Electronic Monitoring Plan Information
Electronic Monitoring Plan Records Description
Unit Operation Information (RT 504) Unit ID Boiler Type Maximum Heat Input Areas at Flow Monitor and Stack Exit
Monitoring SystemsAnalytical (RT 510) Components
System Parameter and ID Component ID Type Sample Method Manufacturer Model Serial Number
Emission Formulas (RT 520) Parameter Formula Code Formula
Span Values (RT 530) Parameter Scale MPCMECMPF Max NOx Rate Span Value Full-Scale Range Units of Measure
Load Range (RT 535) Maximum Hourly Load
Range of Operation (RT 536) Upper and Lower Bounds of Operating Range Most Frequently Used Loads Normal Load
Monitoring Methodologies (RT 585) Parameter Methodology Fuel Type Missing Data Approach
Control Information (RT 586) Parameter Type of Control Control Dates
Fuel Type (RT 587) PrimarySecondary Fuels
Fuel Flow Meter Data (Appendix D) (RT 540)
Parameter Fuel Type Maximum Fuel Flow Initial Accuracy Test Method
Fuel Usage Qualification (Appendix E) (RT 507)
Capacity or Gas Usage Qualification Type Method
NOx Correlation Segments (Appendix E) (RT 560)
Test Date Test Number Operating Level Segment Heat Input NOx Rate Fuel Type
Page 46 Part 75 Field Audit Manual ndash July 16 2003
Section 3 Audit Preparation
3134 ts Exemptions and Extensions
The MDC program evaluates QA test data and provides detailed test reports u can view a list of the QA tests (linearity flow-to-load and RATAs) -- as well as any test grace periods and exemptions -- in the EDRs that you have imported into MDC by selecting Certification and QA Tests or Test Extensions and Exemptions from the Edit or Report pull down menus
QA Tests
MDC will evaluate QA test data and provide brief error messages if errors are found For example low medium and high gas levels are compared to the instrument span to determine if the linearity was performed at the appropriate levels The program also will re-calculate linearity and RATA results including RATA bias adjustment factors (BAF) These are the same evaluations that are performed by CAMD at the end of each quarter described above in Section 312
If you have not received a copy of CAMDs evaluation you should run QA test evaluations of all the QA tests performed in the quarters you have downloaded ke a note of errors also you can print out specific pages of the MDC evaluation report for follow up with the plant during the audit visit
In addition to the test evaluations you will want to view the list of QA tests performed by the source to see if a particular QA test (RATA or linearity) has been repeated in a quarter This would indicate a failed or aborted test that might be due to CEMS problems You should investigate these failedaborted tests during the plant visit to find out what adjustments (if any) were made to the system and why they were necessary rform this check view the list of QA tests for a source by using the Edit pull down menu in MDC An example is shown in Illustration 3-3 where the SO2 linearity test has been repeated multiple times for a unit during the second quarter of 2000
Part 75 QA Tests
In the context of Part 75 and this manual QA tests refer to quality assurance tests required by the rule The primary tests for electronic data evaluation using MDC are
bull Linearity Tests bull Relative Accuracy Test Audits
(RATAs) bull Flow-to-Load Tests
QA Tes
Yo
Ma
To pe
Part 75 Field Audit Manual ndash July 16 2003 Page 47
Audit Preparation Section 3
Illustration 3-3 MDC Screen Showing Multiple Linearity Tests in One Quarter
You should also print out copies of a number of RATA and linearity test reports to bring with you to the plant so that you may compare the results reported in the quarterly EDR to on-site test report records You should perform this check (see Section 46) to ensure that the source properly transferred QA test data not automatically recorded by a CEMS to the CEMS data acquisition and handling system (DAHS)
Extensions and Exemptions
The Part 75 rule allows for the extension of QA test deadlines and in some cases exemptions from QA test requirements based on specific unit circumstances Test extensions are available for RATAs and quarterly Appendix D fuel flowmeter accuracy tests There is also a general grace period extension for all quarterly QA tests and RATAs which allows time in which to complete the testing for a short period after the end-of-quarter deadline
Exemptions are available from the multi-load flow RATA requirement (flow RATA may be allowed at a single operating level) SO2 RATA requirement (for units burning a low sulfur fuel) and the requirement to perform a single load RATA at normal load In addition quarterly QA test exemptions are available for linearity tests leak checks and flow-to-load ratio tests in any quarter which does not qualify as a QA operating quarter (a QA operating quarter has at least 168 hours of stack or unit operation) Quarterly QA test exemptions are also available for linearity tests of one range of a dual range monitor (range not used in the quarter) linearity tests of SO2 or NOx monitors with spans of 30 ppm or less and flow-to-load ratio tests for
Page 48 Part 75 Field Audit Manual ndash July 16 2003
Section 3 Audit Preparation
complex stack configurations that have been approved by petition The EDR v22 Instructions (see sections that discuss RT 695 - RT 699) provide useful background descriptions of the available extensions and exemptions and qualification requirements A link to the EDR Instructions is provided in Section 15 of this manual
You can use MDC to determine whether the source has claimed any extensions or exemptions Select Test Extensions and Exemptions from MDCs Report pull down menu Then run an evaluation report for all of the extensions and exemptions to determine if there are any errors that require follow-up during the field audit
Extension and Exemption Record Types
bull RT 695 Single-Load Flow Rata Claim bull RT 696 owmeter Accuracy Test
Extension bull RT 697 RATA Extension or
Exemption bull RT 698 arterly QA Test Exemption
Fuel Fl
Qu
A common test exemption is the use of a 1-load level RATA for flow RATAs Generally a 2-load test is required for QA testing At least once every 5 years a 3-load test is required for quality assurance purposes In addition a 3-load test is required for certification and recertification
There are also a few situations in which a 1-load test is allowed without a special exemption (1) peaking units and bypass stacks automatically qualify (2) a source that conducts flow RATAs on a semiannual basis can alternate between a 2-load and 1-load test and (3) cement kilns and other non-load based units can conduct tests at a single level if representative of normal operations For other sources to qualify to use a 1-load level flow RATA the source must submit the results of the single load analysis required by Appendix B sect 2313(c) in RT 695 Check to make sure that flow RATAs were performed at multiple loads (or that a unit otherwise qualified for a single load test) if the MDC exemption report indicates that the source did not report RT 695
Table 3-2Summary of MDC QA Test Checks
QA Test Checks Description
QA test evaluations MDC will evaluate QA test data recalculate results and provide error messages if errors are found
Repeated QA tests Look for FailedRepeated QA Tests (multiple tests in a quarter)
Print RATA and linearity reports for comparison with on-site hardcopy data
Bring the reports to the plant to make sure the electronic data match hardcopy data or linearity tests make sure the reference cylinder gas concentrations match those on site
Extensions and grace periods Identify if the source has claimed an extension or grace period
F
(cont)
Part 75 Field Audit Manual ndash July 16 2003 Page 49
Audit Preparation Section 3
Table 3-2Summary of MDC QA Test Checks (cont)
QA Test Checks Description
Single load flow RATAs (RT 695) Check for the exemption analysis single load flow RATA claim record (RT 695) which will show the results of the single load analysis required by App B 2313(c) Make sure flow RATAs were performed at multiple load levels for units (other than peaking units) without the single load exemption request Note Non-peaking units performing RATAs semiannually can alternate between single-load and multiple-load test without requesting an exemption or reporting RT 695 Certain non-load based units (such as cement kilns) also may be exempt from multiple-level tests
3135 Recertification Events and Monitoring System Downtime Reports
Sources must report certification recertification and certain maintenance events in the quarterly EDR (RT 556) in the report for the quarter in which the event occurred The MDC report function (currently under the Reports drop down menu) can provide a printout report of recertification and maintenance events This report identifies certification recertification and maintenance events and what QA tests were required If any of these records have been reported you should print a copy of this report and bring it with you on the plant visit to compare against the plant records It is important that all monitoring components are properly certified If there have been changes to equipment proper diagnostic or recertification testing should have occurred as required by sect 7520(b) Note that MDC does not verify that all required certification recertification or diagnostic testing is included in the report EPA therefore relies on the inspector to make this verification as part of the audit
A Monitoring System Downtime or Missing Parameter Report (RT 550) may also be available though unlike the Recertification Report (RT 556) this record is optional This useful report shows the start and end time of all missing data periods by monitoring system reason for missing data and the corrective action taken You can print out a copy of this report and use the report to (1) target monitoring system problems for further investigation with plant personnel during the plant visit and (2) identify missing data periods that can be used in reviewing plant maintenance plan records or control device parameter records at the plant Alternatively if this report has not been submitted the MDC Hourly function can be used to identify missing data periods as discussed in the following section
3136 Using MDC Hourly to Check Emissions Data and Calculations
The MDC Hourly module analyzes calculates views and graphs the hourly emissions data records for SO2 CO2 O2 NOx flow and heat input It also calculates and displays summary data for daily monthly and quarterly time periods The program can analyze up to 4 quarters of calendar year data MDC Hourly was designed for use with EDR v21 Use of EDR v21 began in the second quarter of 2000
Page 50 Part 75 Field Audit Manual ndash July 16 2003
Section 3 Audit Preparation
Getting Started with MDC Hourly
In order to check the hourly calculations with MDC Hourly you will need to make sure that you have imported quarterly EDR files that include the quarter with data from the most recent pollutant and flow RATAs so that you can take full advantage of the MDC data checks If you do not import all of the historical monitoring plan and quality assurance data into MDC prior to running MDC Hourly MDC Hourly may mistake hourly data as being out of control (OOC) and will not provide any further analysis on those hours
Hourly Calculations and Error Messages
View the Detailed Emissions Data tables for the different CEMS The program recalculates emissions for each hour using the monitoring plan formula and provides an error message in the far right column if there is a discrepancy There is no need to perform the emission calculations yourself One issue is the bias adjustment factor (BAF) If a source uses the wrong BAF they could underreport emissions and undermine the integrity of the trading program This recalculation feature in MDC can assist you in spotting this problem and understand the potential magnitude of the impact on emission allowances
Error messages will also identify OOC periods which indicate that a QA test (RATA or Linearity) was expired failed or not performed MDC Hourly does not currently determine the control status of the unit with respect to daily calibrations Be careful of the out-of-control error messages you may generate when you run MDC Hourly As noted in the Getting Started discussion above you can receive these error messages if you do not import the data into MDC for the quarter in which the RATA was performed prior to running the analysis on the hourly data
Missing Data Periods
Use the filter function to identify missing data periods This is especially important if the source did not submit the optional RT 550 record described above in Section 3135 The reasons for the missing data are not provided but this information may be used to identify systems with high amounts of missing data to target during the plant visit and also to select missing data periods for an in-plant records review
Appendix D Units
For oil- or gas-fired units that use Appendix D fuel monitoring to determine heat input and SO2 emissions view and record the fuel gross caloric value (GCV) and sulfur content across quarters so that you can check these values against on-site fuel sampling and analysis results
Graphing
MDC Hourlys graphing function allows you to graph the hourly emission data as well as flow and heat input Graphing emissions data can be an invaluable tool for preparing for a field audit Graphing allows the inspector to verify that the reported emissions look reasonable for the type of unit being evaluated Abnormal emission trends can often be quickly identified and should be investigated as part of the field audit to identify if the abnormality is due to a problem with the monitoring system or to a change in the way the unit is operated An abrupt
Part 75 Field Audit Manual ndash July 16 2003 Page 51
Audit Preparation Section 3
or unusual change could indicate a modification to unit operation or the CEMS that may require recertification or diagnostic testing Consistent data with very little change (flat line) may indicate that the CEMS is not operating properly or that the unit is using a missing data routine Either situation should be investigated with the source during the on-site visit
Illustration 3-4Example MDC Hourly Graph of SO2 Concentrations
The graphing function also can be used to compare the hourly emissions or parameter (flow heat input) against the monitor span values listed in the monitoring plan You should note if the emissions or parameter exceed the relevant maximum potential concentration (MPC) maximum expected concentration (MEC) or maximum potential stack gas flow rate (MPF) The emissions should typically be between 20 and 80 percent of the monitor range identified in the monitoring plan (See Appendix A sect 21) If a majority of the emissionparameter readings are outside 20 to 80 percent of the monitoring range you should make sure that the source has performed the MPC MEC span and range checks that are required at least annually by Appendix A sect 21
Page 52 Part 75 Field Audit Manual ndash July 16 2003
Section 3 Audit Preparation
Table 3-3Summary of MDC Hourly Checks
MDC Hourly Checks Description
Check hourly calculations and error messages
Check recalculated hourly emissions for error messages which are provided for each hour in the far right column
Error messages also identify out of control periods which indicate that a QA test was failed or was not performed
Hourly error messages may need to be ignored if the most recent RATA for a parameter was not imported
Check BAFs used in hourly calculations
MDC Hourly will use the BAF in the most recent RATA to recalculate hourly emissions
Check missing data periods Use the filter function to identify missing data periods Identify systems with high amounts of missing data and to select missing data periods for in-plant records review
For oil or gas units using Appendix D note fuel GCV and sulfur content
View and record these values across quarters to check against on-site fuel sampling and analysis results
Check spans Use the graph function to compare the hourly emissions or parameter (flow heat input) against the monitor span values in the monitor plan report Follow-up with the source if emissionsparameters are higher than the span The source is required to perform a spanrange check at least annually (App A sect 21)
View graphs of data trends Use the graph function to plot emissions and flow Note any abrupt changes in the data or consistent data with no change
32 Hardcopy File Review
In addition to the electronic review of monitoring plan and quarterly report data you should also review the sources file for written correspondence and information pertaining to Part 75 monitoring These documents would include any petitions previous auditinspection reports linearity and RATA reports and the sources acid rain permit or operating permit
321 Correspondence Petitions and Previous AuditInspection Reports
Correspondence and any petitions provide background on any recent issues or unusual monitoring situations that may come up during the plant visit Previous audit or inspection reports serve the same purpose Also if a prior report identified problems that required follow-up you should confirm (either through your pre-audit review or on-site audit) that the source took appropriate corrective action
Part 75 Field Audit Manual ndash July 16 2003 Page 53
Audit Preparation Section 3
322 Linearity Test and RATA Reports
Some States require a hardcopy submittal of linearity test and RATA reports If this is the case in your State and you have access to the reports in your office you should compare the hardcopy results to those reported electronically and accessed with the MDC program as described in Sections 313 and 45 so that you will not have to conduct the comparison while at the plant You can also review the RATA test report as described in Table 3-4 The hardcopy RATA test report review should be focused on reference method documentation that can not be checked electronically (eg reference method analyzer biasdrift checks cylinder gas certifications reference method equipment calibrations traverse points etc)
Table 3-4RATA Report Review
RATA Hardcopy Review Explanation
For a NOx RATA using the instrumental method 7E is the NOx
converter efficiency documented through a performance test
The NOx converter converts NO2 to NO NO is measured by the analyzer If the NO2 concentration is greater than 5 ppm a NOx converter efficiency test (RM 20) is required
If an instrumental RM was used were cylinder gas certificates included in the test report
The calibration gas certificates should be provided in the test report and show Certified gases (EPA Protocol NIST etc see
Section 45) Concentrations which match those used in the
biasdrift check calculations Expiration date after the RATA
For instrumental methods (6C 7E 3A) were the appropriate bias and drift corrections made for the RM data
Run results are corrected for bias based on the average of the before and after bias checks
For flow reference methods is the calibration date of the pitot tube within 6 months of the RATA
The most recent calibration should have been performed within 6 months of the test
Are CEMS and RM data on same moisture basis
Make sure the comparison between the CEMS and RM are on the same basis
323 Permits
You should make sure that the source has an Acid Rain permit or NOx budget permit if required Check any relevant source specific provisions related to Part 75 monitoring in the permit and bring a copy of those provisions with you on the audit The permit conditions for Part 75 monitoring however may only list a general requirement to follow Part 75 and not be that helpful
Page 54 Part 75 Field Audit Manual ndash July 16 2003
Section 3 Audit Preparation
33 Scheduling and Coordinating the Audit
Level 2 audits require coordination with the source to obtain their schedule for performing RATA and linearity performance tests The source is required to provide written notice of the date of periodic RATAs no later than 21 days prior to the first scheduled day of testing (sect 7561(a)(5)) Written notification may be provided by mail or by facsimile and may be provided by electronic mail if the EPA Regional Office or State agency determines that electronic mail is acceptable (sect7561(a)(5)(i)) However the date can be changed and often is due to operating constraints at the plant or with the CEMS Part 75 allows performing a test on a different date as long as notice of the new date is provided as soon as practicable but no later than twenty-four (24) hours in advance of the new test date
Notice is not required prior to the quarterly linearity tests So you will need to coordinate with the facility staff to schedule your audit to coincide with a linearity test date if desired
Because the audit policy is hands-off you should review all of the inspection procedures and requirements at the time of scheduling to allow the facility the opportunity to gather the necessary information and arrange for the appropriate personnel to be available (The plant environmental contact may also not be authorized to access the CEMS) Prior knowledge of all procedures and the audit objectives will help to avoid problems and will allow the audit to proceed as planned and in a timely manner You should also check plant-specific safety requirements with the source and what safety equipment you will need
Level 1 unannounced audits of a Part 75 monitoring system are often performed as part of the overall unannounced air compliance inspection of the facility If you conduct a Level 1 audit as part of an unannounced inspection you should also go over the inspection procedures and requirements as outlined in the previous paragraph when you arrive at the facility Unannounced audits may not be as productive since the sources often rely on outside contractors or personnel from other sites to perform certain tasks It is therefore more productive to coordinate with the source before the audit to make sure that the proper personnel are present to answer any questions that might arise during the audit
34 Materials to Bring
The inspector should bring personal safety equipment (eg hard hat safety glasses safety shoes hearing protection etc) as provided by agency policy Useful materials and data sheets to bring on the field audit include
Note
Section 15 of this manual contains information to help you find related documents including regulatory text for Part 60 and Part 75 and the Parts 75 and 76 Policy Manual
MDC printout of the monitoring plan
MDC printout of linearity and RATA reports
MDC printout of recertification and missing data reports
Appropriate Part 60 reference method requirements if observing a RATA
Part 75 Field Audit Manual ndash July 16 2003 Page 55
Audit Preparation Section 3
Checklists and data entry forms (see Appendix A of this manual)
Part 75 Rule (see easy-to-use version maintained on CAMDs website)
Parts 75 and 76 Policy Manual (bring and leave in car for reference as needed)
Copy of Acid Rain permit or operating permit monitoring provisions
Page 56 Part 75 Field Audit Manual ndash July 16 2003
Section 4 On-Site CEMS Inspection
This section describes the primary on-site activities that will apply to any field audit for a Part 75 CEMS
Outline of Section 4
41 Pre-Audit Interview 42 Calibration Error Test 43 ProbeSensors Sample Lines and
Sample Conditioning Systems 44 Gas Analyzers 45 Calibration Gases 46 Flow Monitors 47 DAHS 48 Maintenance Log and Daily Checklists
Review 49 QAQC Plan Review
The field audit will consist of an initial interview (Section 41) the walk through and inspection of the various components of CEMS (Sections 42 -47) and a review of QA and maintenance records (Sections 48 and 49) If you are conducting a Level 2 audit you will also observe performance tests (Section 5) For a Level 3 audit you will conduct certain performance tests (Section 6) In each case you will complete your audit with an exit interview and final report (Section 7)
You should not consider the organization of this section as suggesting a specific order to the audit For example this section discusses conducting a walk-through visual observation of all equipment first followed by a review of the QAQC plan and recordkeeping In many audits you may go back and forth between visual observations and records review
In budgeting your time you should spend more time on items that can not be checked or verified off-site from EDR submittals or other file information In addition focus on any potential problems flagged during the pre-audit review For example focus on CEMS and time periods with the most missing data multiple failed QA tests unusual data trends or mistakes in emissions calculations If you analyzed information using MDC or MDC Hourly bring a specific list of the questions and issues based on these pre-audit activities
In conjunction with your own visual observations and records review interviews with plant staff provide important information on how the monitoring systems work and are operated as well as on compliance with Part 75 requirements You should ask the staff how they operate the equipment and perform QA activities and how the QAQC plan is used in relation to the different CEMS and quality assurance components A key auditing technique is to establish a dialogue with personnel at the source and to let them answer your questions by going through their procedures and showing you where they document the procedures
You will want to confirm that actual equipment settings monitor operations and quality assurance activities match the QAQC plan The QAQC plan is an important resource and a Part 75 requirement The QAQC plan is the document that provides detailed procedures for how the CEMS is to be operated If a source is following a complete QAQC plan that covers all of the Part 75 quality assurance requirements and the operating parameters for the monitoring systems then the data can be considered valid at all times that the system is operating within those parameters since the system is being operated as it was during the RATA If the QAQC plan is not followed or is incomplete then it is questionable whether the emissions data are of the same quality as was demonstrated during the RATA You may also
Part 75 Field Audit Manual ndash July 16 2003 Page 57
On-Site CEMS Inspection Section 4
find that the procedures currently in use are appropriate but the QAQC plan has not been updated Many of the recommended checks in this manual refer back to the QAQC plan
One critical step is to verify that the CEMS components match those in the monitoring plan If changes have been made you need to determine if the proper recertification testing or diagnostic testing has been performed Part 75 quality assurance begins with the initial certification of the CEMS and any changes since that certification need to be evaluated for their effect on CEMS data
Identifying Monitoring Hardware Recertification Issues
Recertification is required for a replacement modification or change that may significantly affect the ability of a CEMS to accurately measure monitored parameters
bull Complete System Replacement bull Analyzer Replacement bull Change in Orientation or Location of Sampling Probe or Site bull Change in Flow Monitor K factor or Polynomial
This is a key issue for audits ee Section 15 of this manual for a link to CAMDs guidance on recertification under Part 75
S
41 Pre-Audit Interview
You should conduct a pre-audit meeting when you arrive at the plant The meeting should include the plant contact the plant CEMS technician assigned to assist with the audit and may include plant management personnel At this time it is important for you to make sure the plant personnel understand the general scope of the audit and to agree upon a tentative audit schedule so that necessary personnel will be available when needed Table 4-1 identifies several items you should discuss in the interview
Page 58 Part 75 Field Audit Manual ndash July 16 2003
Section 4 On-Site CEMS Inspection
Table 4-1Pre-Audit Interview Items
Topic Purpose
Audit purpose and agenda bull Inform facility of the purpose and scope of the audit
bull Streamline subsequent activities bull Allow for meetings with necessary plant personnel
Inspection and audit techniques to be used including hands-off policy and the need for a CEMS technician
bull Streamline subsequent activities bull Identify plant contacts for different parts of the
audit
Specific areas to be observed bull Identify any constraints on visiting locations in the plant
Safety requirements bull Identify necessary safety equipment and plant safety issues
Records to be reviewed and copying needs bull Streamline subsequent activities bull Provide source an opportunity to collect information
during the other audit activities
Notify plant personnel of intent to take photographs or videos to document observed conditions
bull The inspector should ask for permission to take photographs on the plant property and explain the purpose for the photos The source can make a confidentiality claim but emission-related information is public information under the Clean Air Act You should follow your agencys policy on the treatment of confidential business information claims This is not likely to be an issue if photos or videos are limited to the CEMS components
42 Calibration Error Test
Part 75 requires a daily calibration error test This test provides a simple check of most CEMS components and can detect many but not all sources of potential error in the monitoring system
If possible you should observe routine daily calibration error tests as part of any CEMS field audit but often the tests are initiated automatically at a specific time of day Following the calibration sequence the DAHS will typically generate a calibration summary report (presenting the CEMS responses and calculated calibration error results) to record the data for each operating day Daily calibration check results are also reported electronically in the EDR
If the daily checks have occurred before you arrived at the plant review the results of the tests for that day and request the plant contact or CEMS technician to initiate a routine daily calibration test Ask for an explanation of how daily calibrations are performed how the results are used what responses will trigger adjustments and how adjustments are made The specific procedures used to conduct this calibration routine should be described in the QAQC plan available on-site Adjustments are not to be made during the calibration error test When
Part 75 Field Audit Manual ndash July 16 2003 Page 59
On-Site CEMS Inspection Section 4
adjustments are made following a calibration test another calibration error test is required after all adjustments are completed to validate that the adjustment was appropriate
The Daily Calibration Summary form included in Appendix A can be used to compile the daily calibration check data while on-site You should also request a printout from the sources DAHS and compare these values to the values you recorded from the analyzers display For each monitor
Record the gas monitor responses from the zero and upscale calibration gas injections (for dilution systems multiply the monitor data by the dilution ratio to obtain the actual concentration)
For flow monitors record the results of the electronic tests for ultrasonic and thermal flow monitors or the pressure transducer checks for differential pressure monitors
Note the start and stop times and whether the response is stable when the system records the calibration test response Also check that the time taken for the test still provides at least two valid CEMS data points per hour to meet the valid hour requirements of Part 75
Check that the calibration gas flow rates and pressure match sampling conditions
Calculate the results from the monitor data and retrieve the daily calibration error (CE) results from the daily report generated by the DAHS Compare your results to those generated by the DAHS If there is a discrepancy ask about correction factors in the DAHS such as pressure correction factors for dilution probes or similar factors
Compare the calibration error at the zero and high levels to the Part 75 data validation requirements in Appendix B sect 214(a) (see Table 4-2)
If the calibration error check is failed the data from the monitor are invalid and the monitor is out of control until it successfully passes a subsequent calibration error test Missing data routines must be used until the monitor is adjusted and successfully passes a subsequent calibration error test
Page 60 Part 75 Field Audit Manual ndash July 16 2003
Section 4 On-Site CEMS Inspection
Table 4-2 Part 75 Calibration Error Test Data Validation Requirements
Monitored Parameter Calibration Error Requirement (App B sect 214(a))
SO2 or NOx 50 of the Span Value or
5 ppm absolute value of the difference between the monitor response and the reference value if the span value of the monitor is less than 50 ppm or
10 ppm absolute value of the difference between the monitor response and the reference value if the span value of the monitor is greater than 50 ppm but less than 200 ppm
CO2 or O2 10 CO2 or O2
H2O 60 of the Span Value Moisture monitor systems composed of wet and dry O2 monitors must meet the O2 calibration error requirement of 10
Flow 60 of the span value or
002 inches of water absolute value of the difference between the monitor response and the reference value if the monitor is a differential pressure type
You should also compare the CE results you obtain to the results of the most recent automatic calibration error test that occurred earlier in the day of your audit or on previous days Previous calibration error tests usually can be brought up on the DAHS visual display screen If there is a significant shift in the CE results from that previous test ask the facility contact if they can explain the shift Were adjustments made to the monitoring system(s) that could cause the shift Does the shift indicate that adjustments are necessary
Routine adjustments of the monitor are allowed after successful calibration error tests These adjustments are to be made to bring the monitor as close as practicable to the calibration gas tag value or flow reference signal If the monitor is physically adjusted by a person a follow-up calibration error test is required to verify that the adjustment was performed properly No follow-up calibration error testing is required when only a mathematical adjustment is made automatically by the DAHS These mathematical adjustments are similar to an internal bias adjustment factor in that the DAHS evaluates the response in comparison to the reference value and assigns from that time forward an adjustment factor which is used to adjust the data for reporting If this type of adjustment is used the inspector should determine at what point the source physically adjusts the calibration of the analyzer (ie what the range of acceptable calibration error adjustment factors is) Typically sources that use the auto adjustment in this manner physically recalibrate when the mathematical adjustment exceeds 25 percent of the span The criteria that are used should be documented in the sources QAQC plan
Part 75 Field Audit Manual ndash July 16 2003 Page 61
On-Site CEMS Inspection Section 4
43 ProbeSensors Sample Lines and Sample Conditioning Systems
Most of the suggested checks of the probesensors and the sample lines do not require a visual check of the actual probesensors or lines The probesensors and sample lines may not be easily accessible and may be located in a confined space that your agencys (or the plants) safety policies prohibit you from entering Access to the gas sampling probe and flow monitor probesensors also may require climbing ladders or working at substantial heights
431 ProbeSensors
You should ensure that the probesensors are in the same location as when the unit was certifiedrecertified (as detailed in the monitoring plan) -- changes in probesensors orientation or location require recertification of a CEMS A hardcopy submittal of the monitoring plan will contain a diagram with the probesensors location A copy should have been submitted to the State agency If it is not available in your files it should be on file at the plant In addition ask how frequently the probesensors are inspected if there have been any problems (plugging for example) and if the probesensors or a component have been recently changed The change might also require recertification or diagnostic testing
Flow Monitors
In addition for flow monitors you could ask the source representative to perform a daily interference check as required by App B sect 212 or review the results of the most recent interference tests The daily interference check tests the flow monitor probe or sensors sample lines and temperature transceiver for plugging or malfunctioning
The interference test procedure should be identified in the QAQC Plan Go over the interference test procedures with the source representative and ask if there have been any recent failures and what corrective action was taken Some interference checks for various types of flow monitors are described below
Differential Pressure - Regular back purge of probe and sample lines Back purge flow or measured flow is monitored and compared to baseline values to indicate if there is a plugging problem There may also be a moisture removal system or a heated sample line
Ultrasonic - Purge air blowers may be installed to prevent particulate build up on the transceivers and purge air flow rate is monitored Units without purge air blowers can monitor signal strength to identify particulate build up
Thermal - Temperature sensors may have an auto self clean feature which heat the sensors to burn off particulate build-up and help avoid moisture condensation Another approach uses short high pressure blasts of air Interference can be tested by checking the stack temperature measured by both sensors or by comparing the sensor measurements against calibration data
Page 62 Part 75 Field Audit Manual ndash July 16 2003
Section 4 On-Site CEMS Inspection
Table 4-3ProbeSensor Check Summary
What to Check Description
All ProbeSensor Types
Is the probe in the same stack or duct location as in the monitoring plan
Visually compare probe location to location on the diagram submitted with the monitoring plan A measurement of distances from disturbances or stackduct diameter are not necessary
Has the duct or stack location been modified (Dimensions)
Ask the source representative and note during a check of CEMS maintenance logs These ductstack changes could affect CEMS measurements and may require recertification
How often are the probessensors inspected have there been problems and have the probesensors or components been changed
Ask the source and note during a check of CEMS QAQC Plan and maintenance logs
Flow Monitors
Ask the source to perform a daily interference check or review the results of the most recent interference check
Appendix B sect 212 requires a daily interference check for flow monitors Each flow monitor is to be designed to provide a means for checking interference from plugging of each sample line and sensing port and malfunction of each resistance temperature detector (RTD) transceiver or equivalent
432 Sample Lines
Extractive Gas CEMS Sample Lines
The daily calibration error test (see Section 42) provides the best check on whether gas sample line leaks are diluting the sample gas measured by the analyzer The daily calibration error test should also detect most problems from condensation However for source level extractive NOx systems that do not have an SO2 analyzer if practical you should also visually check the umbilical line as it enters the CEM shelter Look for loops or sags in the line as well as moisture droplets Because calibration gases do not have significant amounts of NO2 the daily calibration error test for a NOx monitor may not detect a negative bias from absorption of NO2 by condensed water
Differential Pressure Flow CEMS Sample Lines
Manual or automatic quarterly leak checks are required for differential pressure flow monitors (Appendix B sect 222) The test criteria are not specified by Part 75 Most often the test checks the line after the probe flange by closing the line and holding a steady pressure for a specified time Check how and when the tests were performed The test date and results (passfail) are reported in the EDRs so you can confirm the reported electronic results with on-site data If a recent test failed find out what was done to correct the problem A failed leak
Part 75 Field Audit Manual ndash July 16 2003 Page 63
On-Site CEMS Inspection Section 4
test results in out of control data until the leak is fixed and a subsequent leak check is passed (Appendix B sect 223(g))
433 Dilution Air and Gas Sample Conditioning Systems
The majority of Part 75 gas CEMS are extractive systems that transport the stack gas from the stack to an analyzer The checks described in the next two sections relate to the systems that condition the stack gas for analysis
4331 Dilution Extractive Systems
Dilution systems are frequently used for Part 75 compliance These systems dilute the stack gas with clean dry air prior to the analyzer The ratio of sample taken from the stack to dilution air is the dilution ratio and is an important parameter of a dilution system How that ratio is maintained or what mathematical compensations are made to account for changes in the ratio is important to cover during an audit
Dilution Air Ratio
The following questions may be useful for auditing dilution extractive CEMS systems
What is the dilution ratio and how is it verified This should be described in the QAQC plan
Is the dilution probe ejector pump vacuum at or below the certification value The ejector vacuum affects sample flow if it decreases below the values which creates critical flow through the orifice How often does the source check the ejector vacuum as well as the dilution air and analyzer flow settings Some systems automatically adjust the dilution air pressure from a pressure transducer signal so ask how this works Again these activities should be described in the QAQC plan
Check if any corrections are applied to the dilution ratio for changes in pressure temperature or molecular weight (See Section 2331 on gas density effects) These corrections are typically applied by the DAHS and should be described in the QAQC plan Also find out if there have been any changes in the factors since the last RATA because a RATA is required following a change in these factors
You should also ask the source if the dilution probe orifice has been changed The orifice controls the sample flow rate if the orifice has changed it may have changed the dilution ratio You can also check this during the maintenance record reviews
If the orifice has been changed ask the source if there is a procedure for doing this in the QAQC plan In addition ask what prompts making a change Replacing a dilution probe orifice with one of the same size requires diagnostic testing while replacement by a different sized orifice requires recertification Check to see that the appropriate testing has been completed
Page 64 Part 75 Field Audit Manual ndash July 16 2003
Section 4 On-Site CEMS Inspection
Dilution Air Cleaning System
The dilution air supplied to the dilution probe must be treated to remove contaminants that could interfere with the analyzers The dilution air cleaning system removes moisture CO2 particulate matter hydrocarbons and other contaminants that may be present in ambient air A good place to start is simply to ask the source representative how the system works You should also investigate maintenance practices For the air cleaning system ask the source how often the filters are changed and at what point drying agents are replaced Again this should be verified against the QAQC plan documentation You can also ask to see a copy of the filter replacement documentation in either the maintenance log or a copy of the daily checklist You can check the inlet and outlet pressures of the CO2 filter and compare to the appropriate range for the inlet and outlet pressure in the QAQC plan Find out from the source how often these pressures are checked and how these checks are documented
Table 4-4Summary of Dilution Air System Checks
What to Check Description
Has the dilution probe orifice been bull The orifice controls the sample flow rate so a change in the changed orifice will affect the dilution air ratio Ask the source
CEMS operator if the orifice has been changed since the last RATA and note maintenance records for any evidence of changes (Section 47)
bull If the orifice has been changed ask if there is a procedure for changing the orifice in the QAQC Plan what prompts a change and how is the dilution ratio verified
bull If it has been changed confirm that necessary diagnosticrecertification testing was performed
Is the dilution probe ejector pump vacuum at or below the certification value
bull Ask the CEMS operator how often they check the ejector vacuum as well as the dilution air and analyzer flow settings and ask whether the values are recorded and what are the proper settings
bull Also ask the operator to show that the pressure gauges or rotameters are set in accordance with the QAQC plan and ask how often the values are verified and documented
Are the dilution ratio and dilution air and analyzer flow settings properly set
Are correction factors applied to the dilution ratio for changes in pressure temperature or molecular weight ve these been changed since the last RATA
bull Some systems apply correction factors to the dilution ratio to account for changes in gas density nges to the correction factors should be recorded in the maintenance log and the QAQC plan should outline the procedures for changing the correction factors TA should be performed following any change
Ha
Cha
A RA
(cont)
Part 75 Field Audit Manual ndash July 16 2003 Page 65
On-Site CEMS Inspection Section 4
Table 4-4Summary of Dilution Air System Checks (cont)
What to Check Description
Check the inlet and outlet pressures of CO2 air cleaner filter
bull Ask the CEMS operator how often they check the CO2 air cleaner filter inlet and outlet pressures if the values are recorded and the proper setting
bull Also ask how often the filters are changed and at what point drying agents are replaced Again this should be verified against the QAQC plan documentation
Check CO2 air cleaner
4332 Source Level Extractive Systems
Source level extractive systems transport the stack gas to the analyzer without dilution These systems also are described as direct extractive or non-dilution systems These systems may measure emissions on either a wet or dry basis Wet systems need to maintain the extracted sample at a temperature above the dew point of the sample to avoid condensation in the umbilical lines Therefore each component of the sampling and analysis system in a wet extractive system must be heated Dry systems require some sort of moisture removal either through condensation or permeation driers as well as heating of the components upstream of the moisture removal system The daily calibration error test may show problems related with the conditioning system (except for NOx systems as noted in Section 432)
In addition to observing a daily calibration error test ask the source representative to describe what maintenance is performed on the conditioning system and check that information against the maintenance log and QAQC plan You can also check the chiller temperature if water is removed by condensation and compare the temperature to the acceptable ranges in the QAQC plan These system checks are summarized in Table 4-5
Table 4-5Summary of Source Level Extractive System Checks
What to Check Description
Observe a daily calibration error test Ask the source to perform a test This can be initiated by the source representative from the analyzer or DAHS (See Section 42)
Check the umbilical lines entering the CEM shelter for condensation
Visual check as described earlier in Section 432 Are there water droplets visible in the line
For a dry system using chillers check the chiller temperature
Ask the CEMS operator what the proper temperature range is and how often it is verified pare against the QAQC plan
Check general conditioning system maintenance practices
Ask the source representative how the conditioning system is maintained re to the QAQC plan and check the maintenance records
Com
Compa
Page 66 Part 75 Field Audit Manual ndash July 16 2003
Section 4 On-Site CEMS Inspection
44 Gas Analyzers
Analyzers for extractive systems often are located in a CEM shelter and generally will be rack-mounted and connected to the conditioning system usually with a sample manifold Inshysitu analyzers are located on the stack or duct or in the annulus between the stack and stack liner
In checking the analyzers it is important that you first verify that each analyzer in use is the same as the one thatReminder - MDC Monitoring
Plan Report
A printout of the MDC monitoring plan report can be used as a convenient check off sheet when verifying the serial numbers of CEMS components
was previously certified or recertified Analyzers may have been changed without the notification and recertification required by Part 75 (Subpart C sect 7520(b)) As noted in previous sections it is important that the source certifies the equipment actually in use
Analyzer DisplaysAlarms
Displays and alarms will vary by analyzer model You should ask the plant contact what displays and alarms are in the model that the source uses and what they indicate The displays should show that the analyzer is operating properly An alarm light may show a potential or developing problem which should be addressed as described in the QAQC plan Ask the source when an alarm last occurred and what caused the alarm This information should be recorded in the maintenance log
Flow Rate
Check the sample flow rate to each analyzer It may be displayed digitally or by a rotameter The proper flow rates should be identified in the QAQC plan
Range Settings
Ask the source what the range settings are for each analyzer and how these settings are displayed Compare the settings to the monitoring plan (RT 530 Column 49) You should also check to see if the source has conducted an annual spanrange check as required by Part 75 Appendix A sect 21 The range may need to be changed if that setting is not representative of the concentrations being measured or if the stack concentrations have changed (such as a change in fuel supply or new control equipment) The rule requires that the evaluation of the MPC MEC span and range for each gas monitor be conducted at least once a year
Span versus Range Under Part 75
bull The span is the calculated quality-assured portion of a monitors measurement range
bull The span is equal to 10 to 125 times the Maximum Potential Concentration (MPC) or Maximum Potential Stack Gas Flow Rate (MPF)
bull The range is the actual setting of the monitor
bull The range is to be set so that the majority of readings fall between 20 to 80 of the range selected
Range is always gt Span
Part 75 Field Audit Manual ndash July 16 2003 Page 67
On-Site CEMS Inspection Section 4
Correction Factors
A correction factor may be applied to NOx analyzer data to account for NOx quenching effects Corrections may also be applied to moisture monitors The correction is applied to the analyzer data by the DAHS You should ask if there have been any correction factor changes since the last RATA Any change should be recorded in the maintenance record and the procedures for making the change in the QAQC plan Verify that a RATA has been performed following the change (see sect 7520(b))
Table 4-6Summary of Analyzer Checks
What to Check Description
Have analyzers been changed without the notification and recertification required by Part 75 (Subpart C sect 7520(b))
Ask the source if there have been any changes since the last audit or certificationrecertification Document the serial numbers and compare to those in the monitoring plan
Status of the control panel lights indicators and alarms Displays should show that the analyzer is on and operating properly
The displays will vary by analyzer so ask the source what the displays are and what they mean An alarm light could indicate a potential problem that needs to be addressed (check QAQC plan)
Check range setting and whether the source has performed the annual spanrange check required by Appendix A sect 21
Ask the operator what the range settings are and how they are displayed Compare the range setting to the value in the monitoring plan (RT 530) and the results of the recent spanrange check
Check the sample flow rate Compare the sample flow rate if displayed by a rotameter or a digital reading to the QAQC plan
Have there been any changes to correction factors (NOx quenching and moisture monitors) since the last RATA
Changes to the correction factors should be recorded in the maintenance log and the QAQC plan should outline the procedures for changing the correction factors A RATA should be performed following any change QA testing may also be required (see sect 7520(b))
45 Calibration Gases
Calibration gas cylinders are used for daily zero and span calibrations andor linearity checks You should spot check a number of the calibration gases to verify that the gases in use meet protocol gas requirements in Part 75 that the calibration gas concentrations meet Part 75 quality assurance test requirements and that the values are entered correctly in the DAHS You also can visually check the delivery system
Make a note of the cylinder gas numbers (an engraved ID number stamped on the cylinder) and check the gas certificate for each ID number for the following information (the certificate should be on the cylinder on file electronically or in hardcopy at the facility)
Page 68 Part 75 Field Audit Manual ndash July 16 2003
-- ----
Section 4 On-Site CEMS Inspection
Meets Calibration Gas Certification Requirements
Expiration Date Cylinder gases are not certified after the expiration date The use of an expired cylinder is not in compliance with sect 7521(c)
Check the type of gas certification Part 75 requires the use of a calibration gas as defined in sect 722 Table 4-7 below describes the types of permissible Part 75 calibration gases
Meets Gas Concentration Requirements
Check that the zero air calibration gas concentrations are certified by the supplier to meet the concentration limits in sect 722 (See Table 4-7) Zero air material is a calibration gas that may be used to zero an SO2 NOx or CO2 analyzer Zero air material has an effective concentration of 00 for the component being zeroed (SO2 NOx and Total Hydrocarbons 01 ppm CO 1 ppm or CO2 400 ppm) and is free of certain other interfering gaseous species A zero air cylinder containing a multi-component mixture should be certified that it meets the concentrations above and that other components do not interfere with the CEMS reading For more on zero air calibration gas or zero air materials see Questions 102 and 103 in the Parts 75 and 76 Policy Manual
Determine the cylinder gas concentration values and verify that the values are in the correct range for the instrument span You also should record the concentrations to make sure the values are consistent with the values entered into the DAHS for daily calibration error and linearity tests The ranges for the low medium and high linearity points are
Low level 20 - 30 of span Mid level 50 - 60 of span High level 80 - 100 of span
Part 75 Field Audit Manual ndash July 16 2003 Page 69
--
--
On-Site CEMS Inspection Section 4
Table 4-7Part 75 Calibration Gases (Appendix A sect 51)
Calibration Gas Type Acronym Description
NIST - standard reference material
SRM Calibration gas obtained from the National Institute of Standards and Technology (NIST)
NIST - standard reference material-equivalent compressed gas primary reference material
PRM Gas mixtures listed in a declaration of equivalence in accordance with section 212 of the EPA Traceability Protocol for Assay and Certification of Gaseous Calibration Standards September 1997 EPA-600R-97121 (EPA Traceability Protocol)
NIST - traceable reference material
NTRM Calibration gas mixture tested by and certified by NIST to have a certain specified concentration of gases
NISTEPA-approved certified reference materials
CRM Calibration gas mixture that has been approved by EPA and NIST as having specific known chemical or physical property values certified by a technically valid procedure as evidenced by a certificate or other documentation issued by a certifying standard-setting body
Gas manufacturers intermediate standard
GMIS Compressed gas calibration standard that has been assayed and certified by direct comparison to an SRM an SRM-equivalent PRM a CRM or a NTRM in accordance with section 2121 of the EPA Traceability Protocol
EPA protocol gas Vendor-certified to be within 20 percent of the concentration specified on the cylinder label (tag value) using the uncertainty calculation procedure in section 218 of the EPA Traceability Protocol
Zero air material Calibration gas certified by gas vendor SO2 NOx and Total Hydrocarbons 01 ppm CO 1 ppm or CO2 400 ppm If a mixture the other components are certified not to interfere with the CEM readings for the target compound
Research gas mixture RGM Calibration gas mixture developed by agreement of a requestor and NIST that NIST analyzes and certifies as NIST traceable
In addition to the certificates you should also check the calibration gas line pressure gauges to determine the cylinder gas pressure The cylinder should not be used if the cylinder gas pressure is below 150 psi (This requirement is in the EPA Traceability Protocol for Assay and Certification of Gaseous Calibration Standards sect 2164) You should check to see if the facility checks cylinder pressure as part of its QAQC plan At what point do they replace a calibration standard Also check the outlet regulator pressure or calibration gas flow rate to see if it matches the QA test procedures in the QAQC plan
Page 70 Part 75 Field Audit Manual ndash July 16 2003
Section 4 On-Site CEMS Inspection
Table 4-8Summary of Calibration Gas Checks
What to Check Description
Check the certificates for the expiration date of the cylinder gas
Gas cylinders may have expired dates Cylinder gases are not certified after expiration date and the use of an expired cylinders is not in compliance with sect 7521(c)
Check the calibration gas type (certified EPA Protocol or other)
Gas certifications must meet the definitions in sect722 Check the type of cylinder gas against the descriptions in Table 4-7 and sect 722
Check the zero air material documentation to ensure that it is properly certified
Calibration gas used to zero a gas analyzer See Table 4-7 for the zero air material concentrations defined in sect 722 (Also see Policy Manual questions 102 and 103)
Check the concentration values for each cylinder and that the cylinder calibration tags are withing the correct concentration range for the span
Linearity test point ranges are shown below Low level 20 - 30 of span Mid level 50 - 60 of span
High level 80 - 100 of span
Record the concentration values to check against the values recorded by the DAHS for calibration error and linearity tests
This check is to ensure that the proper cylinder gas concentration values have been entered into the DAHS for calculation of daily calibration error tests
Read the cylinder regulator pressure The cylinder should not be used if the cylinder gas pressure is below 150 psi (EPA Traceability Protocol for Assay and Certification of Gaseous Calibration Standards sect 2164)
Check the regulator outlet pressure The pressure or calibration gas flow rate should be set as specified in the QA test procedures in the QAQC plan
46 Flow Monitors
In addition to the daily calibration error tests (Section 42) and daily interference tests (Section 431) there are a number of other flow monitor issues you can investigate
Flow-to-Load
There is no equivalent to a linearity test for a flow CEMS In response EPA developed a quarterly comparison of flow CEMS data to unit load data Each quarter the source must conduct a comparison of the hourly flow and load data for any hour in which the unit load is within plusmn 10 of the average load during the most recent RATA As part of your pre-audit checks you should note whether the source conducted this test as required and whether the test was passed If there are issues with the test conducted at the facility go over those issues with the source representative while on site
Part 75 Field Audit Manual ndash July 16 2003 Page 71
On-Site CEMS Inspection Section 4
TemperaturePressure Monitoring
Check to see if there are monitors for stack temperature andor stack absolute pressure associated with the flow monitor Ask the source what type of QAQC procedures are followed for these monitors (what is checked and on what schedule) and if there have been any problems with these components You can compare to the QAQC plan or maintenance records
K-factors
A k-factor refers to a correction factor or polynomial coefficient used by the DAHS to correct the flow monitor measurement for flow variables not measured by the monitoring method as well as for measured changes in stack pressure and temperature The factors are set based on a pre-RATA test in which the source correlates the monitor measurement to the RATA flow reference method results
Changing the k-factors or polynomial coefficients does not require recertification but does require that a three load RATA be performed (sect 7520(b)) as a diagnostic test event You should ask when the last time the correction factors were changed and why and check that the RATA was performed The changes should be recorded in the maintenance log and a procedure outlined in the QAQC plan
DisplaysAlarms
As in the case of gas analyzers the displays and alarms will vary by manufacturer You should ask the plant contact what displays and alarms are in the model that the source uses and what they indicate Information on alarms and corrective action should be recorded in the maintenance log
SpanRange
Ask the source what the range settings are for the flow monitor and how these settings are displayed Compare the settings to the monitoring plan (RT 530 Column 49) You should also check to see if the source has conducted an annual spanrange check as required by Part 75 Appendix A sect 21 (See the spanrange discussion in Section 44)
Page 72 Part 75 Field Audit Manual ndash July 16 2003
Section 4 On-Site CEMS Inspection
Table 4-9Summary of Flow Monitor Checks
What to Check Description
Observe andor review daily calibration error test and interference test
See Sections 42 and 431
Review any issues observed in reported results of flow-to-load tests
See Appendix B sect 225 for requirements of flow-to-load tests Make sure the test was performed and that the results were properly calculated If the source is excluding hours from the analysis as allowed for in Appendix B check to see that the exclusions meet Part 75 criteria
Identify if temperature and stack pressure are monitored and what QAQC procedures apply
Temperature and pressure may be monitored in conjunction with the flow monitor Note the QA and preventive maintenance procedures and schedule Ask if there have been any problems and corrective actions Check the QAQC plan and maintenance records
Check if there have been any changes to k-factors and polynomial coefficients since the last RATA
Changes to the correction factors should be recorded in the maintenance log and the procedures for changing the correction factor outlined in the QAQC plan A three load RATA is required following any change to flow monitor k-factors (sect 7520(b))
Status of the control panel lights indicators and alarms Displays should show that the analyzer is on and operating properly
The displays will vary by analyzer so ask the source what the displays are and what they mean An alarm light could indicate a potential or developing problem that needs to be addressed (check the QAQC plan)
Check range setting and whether the source has performed the annual spanrange check required by Appendix A sect 21
Ask the operator what the range settings are and how they are displayed Compare the range setting to the value in the monitoring plan (RT 530) and the results of the recent spanrange check
47 DAHS
The data acquisition and handling system (DAHS) consists of all the hardware and software used to comply with Part 75 electronic recordkeeping and reporting requirements It is a critical component of the monitoring system as it converts the analyzer signal to reported emissions data The on-site audit of the DAHS focuses on data handling issues that can not be checked electronically These checks fall into three areas
DAHS certification and verification of missing data routines and emission calculations Changes in correction factors Manually entered data
Part 75 Field Audit Manual ndash July 16 2003 Page 73
On-Site CEMS Inspection Section 4
471 DAHS Certification and Verification Tests
As for other components of the plants CEMS make sure that the DAHS version in use has been previously certifiedrecertified by checking against the monitoring plan report you printed out from MDC
Also you should ask to see a copy of the DAHS missing data and formula verification test results Part 75 requires a verification test for the missing data routines and emission calculation formulas as part of the initial certification (sect 7520(c)(9)) and whenever the DAHS is replaced upgraded to support a new EDR version or when the missing data algorithm has been changed (diagnostic testing under sect 7563(a)(2)(iii))
The source is not required to submit the results of the verification tests and there are no MDC or ETS electronic checks of the routines The source is however required to keep these test results on-site and available for inspection so you should note that the tests have been performed and what the results were (including any vendor certification) The missing data routines may be verified either by performing tests using a checking software or by a certification by the DAHS software developer that the software package meets all of the missing data requirements of Part 75 Question 1496 in the Parts 75 and 76 Policy Manual provides more information on the verification testing requirements
472 Changes in Correction Factors
Previous sections on dilution extractive systems analyzers and flow monitors recommended that you investigate what types of correction factors if any are applied to raw data (eg pressuretemperature compensation molecular weight flow and moisture monitoring polynomials sonic velocity correction factors NOx quenching correction factors and dilution ratio settings) In addition you should ask how changes to these correction factors are entered into the DAHS As noted earlier changes to correction factors should be recorded in the maintenance log and the QAQC plan should outline the procedures for changing the correction factors (Appendix B sect 113) Diagnostic QA testing is required for many of these changes (see sect 7520(b))
473 Manually Entered Data
Part 75 requires that the DAHS automatically record all emissions data and the daily calibration error checks (Appendix A sect 4) There are a few exceptions which allow manual entry or editing of data which are shown in the text box Check how various types of data are entered manually by asking the source to explain their procedures and by reviewing the QAQC plan and the hardcopy supporting
Manual Data Entry Allowed by Part 75
bull Negative (lt 0) emission values bull Erroneous emission values (if significant
must be approved by EPA) bull SO2 concentration lt 20 ppm bull Reference method back-up data bull RATA reference method data and RATA
results bull Leak checks 7-day calibration error tests
and cycle time tests bull Operating data (load and time) bull Missing data periods bull Add-on control equipment operation
during missing data periods
For more information on manual entry or editing see Section IIC3 of the EDR v22 Reporting Instructions (August 2002)
Page 74 Part 75 Field Audit Manual ndash July 16 2003
Section 4 On-Site CEMS Inspection
information for the manually entered data A number of areas you may emphasize are described below
QA Tests
Ask the source how the QA test results (daily calibration error test linearity test and RATAs) are entered into the DAHS If you have not compared a RATA report from the MDC program to plant hardcopy RATA results in your pre-audit review ask for a hardcopy of the report and check that the dates and time relative accuracy and bias adjustment factors (BAF) match Also if you identified problems with QA test calculations go over how that data are entered into the DAHS as well as the applicable QAQC plan procedures For example the BAF may not have been applied correctly to the emission data The BAF should be applied starting with the hour following completion of the RATA
Missing Data
Ask how the source records and reviews missing data How do they check that the substitute values appear correct (eg do the substituted values appear to be correct in view of the percent monitor data availability (PMA) and the length of the missing data period do the substitute NOx and flow rate values change when the load range changes during a missing data period are maximum potential values substituted when the PMA drops below 800 percent) Compare the procedures described to those in the QAQC plan Pick out a recent missing data period (one you may have identified in your pre-audit review) and spot check the electronic data by comparing against supporting hardcopy documentation
Optional Missing Data Routines - Units with Add-on Control Equipment
If the source is using an optional missing data routine for units with add-on control equipment you also may need to review control device parameter monitoring records There are four missing data options for units with add-on controls three of which require parameter monitoring to demonstrate the level of control achieved during the missing data period (sect 7534)
You will first need to check the QAQC plan The facility must identify add-on SO2 or NOx control equipment parameters and acceptable ranges in the plan
sect 7534 Optional Missing Data Procedures for Units with Add-On
Control Equipment
(1) Standard Missing Data Routines with Parametric Supporting Data
(2) No Parameter Data (3) Parametric Missing Data Substitution
Method (4) Parameter Data Used to Support Use of
Maximum Controlled Emission Rate
if the source is using add-on control equipment missing data options (see Part 75 Appendix B sect 111) Ask the source for the parameter monitoring records for a number of missing data periods You may have identified specific missing data periods from your pre-audit preparation Compare the parameter data to the acceptable ranges in the QAQC plan and identify any periods when the parameter range is exceeded Check how the missing data period was then flagged in the DAHS (control operating properly or not operating properly)
Part 75 Field Audit Manual ndash July 16 2003 Page 75
On-Site CEMS Inspection Section 4
Table 4-10Summary of DAHS Checks
What to Check Description
Check that DAHS verification tests have been performed for the missing data routines and calculations
Check the DAHS against the monitoring plan Verification tests for missing data routines and emissions calculations are required for initial certification and if the DAHS is replaced or there have been changes to the software Verification test results for the missing data routines and emissions calculations are required to be kept on site by sectsect 7520(c)(9) and 7563(a)(2)(iii) A vendor certification that the software meets Part 75 requirements is sufficient for missing data routines
Ask the source what type of correction factors are applied to raw data and how they are entered into the DAHS Also ask if any changes have been made
Changes to correction factors should be recorded in the maintenance log and the QAQC plan should outline the procedures for changing the correction factors (Appendix B
sect 113) QA testing may also be required (see sect 7520(b))
Ask what data are entered manually and how Spot check the electronic data with the manual hardcopy
You want to make sure there is documentation supporting the data that is added manually to the DAHS and that QAQC plan procedures are followed Procedures for manually entering data should be documented in the QAQC plan
How are data for the daily calibration linearity and RATA tests recorded Review some recent records to verify that hardcopy and electronic data match
Compare a RATA or linearity report from the MDC program to the plant hardcopy Check that the dates and time relative accuracy (or linearity error) and bias adjustment factors (BAF) if applicable match
Review parameter monitoring records for units using the optional missing data procedures for add-on control equipment
The QAQC plan will identify control equipment parameters and acceptable ranges (Appendix B sect 111 and sect 7558(b)) Compare the control equipment parameters to the ranges for a missing data period
48 Maintenance Log and Daily Checklists Review
The maintenance logs should detail any maintenance performed on the system and should reference all preventive maintenance performed Appendix B Section 113 requires the facility to keep the following maintenance records
Date time and description of any testing adjustment repair replacement or preventive maintenance action performed on any monitoring system
Records of any corrective actions associated with a monitors outage period
Any adjustment that changes a systems ability to record and report emissions data must be recorded (eg changing of flow monitor or moisture monitoring system polynomial
Page 76 Part 75 Field Audit Manual ndash July 16 2003
Section 4 On-Site CEMS Inspection
coefficients K factors or mathematical algorithms changing of temperature and pressure coefficients and dilution ratio settings) and
A written explanation of the procedures used to make the adjustment(s)
During the inspection you should begin by asking the CEMS technicians to describe what goes wrong with equipment what breaks and what maintenance is required Ask how they knew something was wrong and what they did about it Also ask what QA tests were done to show that the problem was resolved Make sure you understand what they are saying as their terminology may not always match the Part 75 rule terminology For example the plant personnel may refer to a daily calibration error test as a system cal overboard cal or span check
Then check the maintenance log book to see how the information is recorded You should point out any entries that you do not understand and explain why you do not understand the entry Compare to the QAQC plan to determine whether the source is implementing the preventive maintenance procedures You should also review the maintenance log to identify recertification events and adjustments that have been made to the systems which could affect the monitored data The maintenance log may also provide another check on handling of missing data periods and it can verify that linearity tests and RATAs were performed on the dates identified in the EDR
Some checks may include
Do the log entries sufficiently describe the action taken Are the entries understandable
Does the log show maintenance checks at the frequency identified in the QAQC plan
Are there recurring failures or malfunctions recorded in the log
Are malfunctions resolved as specified in the QAQC plan Are calibration error tests or other required QA tests performed before the CEMS is returned to service
Do events in the maintenance log correspond to reported missing data periods in the quarterly reports
Are there repeated adjustments to the zero or span
Have system parts or components been replaced If so has the proper recertification or diagnostic testing been performed
Are corrective actions recorded for malfunctions or as a result of daily calibration error tests or other performance tests
Are the nameinitials of the person performing task or logging data provided (While this is not required it is important for the log entries to be traceable to the person who makes the entry so that further questions can be answered if needed)
Part 75 Field Audit Manual ndash July 16 2003 Page 77
On-Site CEMS Inspection Section 4
49 QAQC Plan Review
The QAQC plan has been referenced throughout the previous sections At a minimum a QAQC plan should describe the detailed procedures and operations for calibration error and linearity tests calibration and linearity adjustments preventive maintenance and any adjustments to the system spare parts list a troubleshooting matrix and recordkeeping and reporting For units with add-on SO2 or NOx emission controls the QAQC plan may also contain (for missing data purposes) add-on emission control parameters and the range for each parameter representative of the normal operating conditions Required elements in the QAQC plan are summarized in Table 4-11 You should note that Part 75 allows electronic storage of the information in the QAQC plan provided that the information can be made available in hardcopy upon request during an audit The plan may also reference manufacturers operating manuals
Reviewing QAQC plan information is an important aspect of the on-site inspection activities described throughout the previous sections A recommended approach to inspecting various aspects and components of a plants CEMS QA program is to
Ask the plant staff to explain how they operate the equipment and perform QA and maintenance activities
Observe and record your own observations of procedures plant documentation and equipment settings
Compare the QAQC plan description of the equipment settings monitoring operating procedures and QA test procedures to actual operations at the plant
You should note instances where actual plant operations are different from the operations described in the QAQC plan and ask for an explanation Determine and discuss whether the actual procedure or the QA plan procedures meet Part 75 requirements In some cases the actual operations may be appropriate but the QAQC plan may need to be updated Clearly you should also note areas where the actual operations and QAQC plan match but neither meet Part 75 requirements
In addition to examining specific elements of the QAQC plan where there are discrepancies or potential problems you may also do a general review of the QAQC plan to check that the plan covers the Part 75 elements as shown in Table 4-11 Particular areas to focus on are the QA test procedures CEMS adjustment procedures and preventive maintenance procedures
Page 78 Part 75 Field Audit Manual ndash July 16 2003
Section 4 On-Site CEMS Inspection
Table 4-11 Checks for QAQC Plan Elements
What to Check Part 75 Requirement
Is there a written QAQC plan (it may be stored electronically but Appendix B sect 1 should be available) and when was it last updated
Are calibration error test and linearity test procedures outlined in the plan
Appendix B sect 121
Are calibration and linearity test adjustment procedures outlined Appendix B sect 122
Are RATA test procedures provided Appendix B sect 123
Are emissions and QA test recordkeeping and reporting procedures including missing data procedures included
Appendix B sect 112
If using add-on control equipment missing data options are control equipment parameters identified
Appendix B sect 111
Are procedures for preventive maintenance and Part 75 recordkeepingreporting identified
Appendix B sectsect 111 and 2
Part 75 Field Audit Manual ndash July 16 2003 Page 79
On-Site CEMS Inspection Section 4
[This page intentionally left blank]
Page 80 Part 75 Field Audit Manual ndash July 16 2003
Section 5 CEMS Performance Test Observation
Section 5 covers how you should observe CEMS performance tests (linearity tests and RATAs) u will generally observe a performance test in conjunction with the on-site CEMS audit activities outlined in Section 4
Yo
51 Introduction
In addition to the basic step of observing a daily calibration error test (see Section 42) EPA encourages all States and Regional Offices to conduct level 2 audits that include a RATA or linearity test observation These performance tests are a critical element of the Part 75 QA program The RATA in particular serves as the primary measurement of CEMS accuracy The presence of an agency observer can serve as an effective tool for ensuring that the source carries out the testing properly and that the results of the tests provide a valid assessment of data quality
During the performance test observation you should document any deviations from the test protocol You should provide copies to the source to avoid misunderstandings about any decisions you may make The observer should notify the tester immediately if there is a question as to whether or not any test procedures comply with Part 75 requirements so that the tester can take corrective action and if necessary restart the testing
Once the performance test is started and until it is concluded the only adjustments that may be made to the monitor are routine calibration adjustments towards the calibration gas or reference signal value that are the result of a regularly scheduled calibration error test This is more likely to occur during a RATA than during a linearity test
The source can make non-routine calibration adjustments (done by physically adjusting the instrument response using analyzer controls) before the linearity or RATA and at other times provided the QAQC plan includes specific criteria for the adjustment A calibration error test must be performed following the adjustment (Part 75 Appendix B sect 213) You should note if any adjustments were made prior to the performance test and review plant maintenance records for documentation of the adjustment (Part 75 Appendix B sect 113)
Calibration error tests are often performed prior to a linearity test or RATA As discussed earlier with respect to monitor adjustments you should ask the source if a calibration error test was performed prior to the linearity or RATA to be observed what the results were and if any adjustments were made RATA and linearity tests should not be conducted on a system that is out-of-control with respect to the calibration error requirements
Appendix A contains observer checklists to assist you in observing the performance tests You should also be familiar with the Part 75 performance test requirements in Appendix A sectsect 62 and 65 and the Part 60 reference methods used in the RATAs
Part 75 Field Audit Manual ndash July 16 2003 Page 81
Performance Test Observation Section 5
52 Linearity Test
A linearity test for a gas CEMS is conducted by challenging the CEMS with three audit gases one having a value of 20 to 30 percent a monitors span the second a value of 50 to 60 percent of span and the third a value of 80 to 100 percent of span Flow and moisture monitors are not subject to the linearity test requirements and SO2 and NOx monitors with spans 30 ppm also are exempt The source must conduct a linearity test every quarter (although exceptions for low operating hours and grace periods may apply) For a dual range analyzer the test is performed for each range used during the applicable quarter
The CEM system is challenged three times with each audit gas The same gas concentration or level is not to be run twice in succession The audit gas is injected at the gas injection port required in Part 75 Appendix A sect 221
The response to the zero and upscale gases is not immediate but approaches an asymptotic value (See Illustration 5-1) It is important that sufficient time is allowed for the concentration reading to stabilize for each injection of gas Watch the analyzers instantaneous response to see if enough time is allowed to reach a stable fully equilibrated response The time should not exceed 15 minutes Pay the most attention to SO2 since it is the most adsorptive and absorptive (this will delay the equilibration time)
Illustration 5-1Asymptotic Calibration Check Response (Jahnke 1994)
Also note the time required compared to the gas injections for the daily calibration error tests Both times should be about the same If they are not ask the source why this is the case Record the analyzers stabilized response and compare to the value recorded by the DAHS The values should be the same The average CEMS response will be taken from the DAHS as the official component for recording the CEMS data These linearity test procedures and requirements are specified in detail in Part 75 Appendix A sect 62
Page 82 Part 75 Field Audit Manual ndash July 16 2003
Section 5 Performance Test Observation
Time Shared Systems
Time shared systems use the same gas analyzers for multiple emission units or time shared systems the 15 minute maximum cycle time requirement for the analyzer gas concentration to stabilize includes the cycle time of each probe location served by the system
F
Appendix A contains an observer checklist Inspect the cylinder gases as outlined in Section 4 record the linearity test results using the checklist and calculate the linearity result for each level Compare the results to the appropriate performance specification listed in Table 5-1
Table 5-1Linearity Test Specifications
Monitored Parameter
Linearity Test Performance Specification (Part 75 Appendix A sect 32)
SO2 or NOx 50 linearity error or
5 ppm absolute value of the difference between the average of the monitor response values and the average of the reference values R-A
CO2 or O2 50 linearity error for each calibration gas concentration or
05 absolute value of the difference between the average of the monitor response values and the average of the reference values R-A
53 Relative Accuracy Test Audit (RATA)
A Relative Accuracy Test Audit (RATA) compares a units CEMS measurements to that of reference method stack tests The reference method tests yield results representative of the pollutant concentration emission rate moisture temperature and flue gas flow rate from the unit The RATA compares these results directly to CEMS measurements The RATA test is the primary measurement of CEMS accuracy for a Part 75 CEMS
Part 75 requires semi-annual or
RATA Reference Materials
Reference Methods in Part 60 Appendix A are available at the Emission Measurement Center website wwwepagovttnemc
Answers to common Part 75 RATA questions are provided in the Parts 75 and 76 Policy Manual at wwwepagovairmarkets
annual RATAs depending on the relative accuracy achieved in the preceding RATA Most units qualify for the annual RATA frequency (Appendix B sect 2312)
Gas RATAs performed at single load levels are often conducted simultaneously and may take about 7 hours The flow RATAs may be conducted at one two or three loads A
Part 75 Field Audit Manual ndash July 16 2003 Page 83
Performance Test Observation Section 5
multi-load RATA may therefore be performed over 2 to 3 days with each load of the flow RATA taking about 3 to 5 hours One load of the flow RATA testing often is conducted at the same time as the gas RATAs Part 75 requires that each RATA be completed within 168 consecutive unit or stack operating hours For multi-load flow RATAs up to 720 consecutive unit or stack operating hours are allowed to complete the testing at all load levels (Part 75 Appendix A sect 65)
Flow RATAs are conducted at load levels in the range of operation that extends from the minimum safe stable load to the maximum sustainable load hree levels apply in this range
Low First 30 of range Mid gt 300 and 600 High gt 600 of range
T
You should ensure that the source performs the RATA according to Part 75 and reference method requirements RATA issues of specific importance to Part 75 requirements include
Unit operating conditions The RATA should be performed while the unit is burning a normal fuel listed in the monitoring plan (App A sect 65(a)) Gas RATAs should be performed at normal load Check the load against the monitoring plan normal load If you have questions about the normal load identified in the plan you may also check load against the most recent load data submitted in the EDR to verify that the current load designation is representative of the loads reported Flow RATAs for peaking units or bypass stacks can always be performed at one load For all other situations the RATA for initial certification or recertification of a flow monitor must be a 3-load test A 3-load flow RATA also is required at least once every 5 years as part of the ongoing QA requirements For units that must conduct a flow RATA on an annual basis the standard QA flow RATA is a 2-load test For units that must conduct a flow RATA on a semi-annual basis the source can alternate between a 1-load and a 2-load test Finally units that operate at 1-load consistently (at least 85 percent of the time) can qualify for 1-load testing instead of the 2-load test (see Part 75 Appendix B sect 2313(c))
Check if the source conducted a daily calibration error test on the CEMS prior to the testing or pre-RATA adjustments While Part 75 allows a source to make pre-RATA non-routine adjustments adjustments may not be made between runs at a load level or between load levels except for routine adjustments as a result of the calibration error test (Part 75 Appendix B sect 213)
Has the source performed and passed a stratification test Stratification testing is required for units wishing to use fewer traverse points under the alternatives allowed in Part 75 Appendix A sect 656(a) and (b) For details on stratification testing see Part 75 Appendix A sect 6561 - 6563
Rake probes should not be used as they do not distinctly capture the required traverse points to ensure that a representative stack sample is obtained for analysis See Policy Manual Question 839
Page 84 Part 75 Field Audit Manual ndash July 16 2003
Section 5 Performance Test Observation
Moisture measurements used to correct dry basis measurements in determining emission rate may not be made using the wet bulb-dry bulb technique Wet-bulb-dry bulb measurements however may be used to determine molecular weight See Policy Manual Question 310
EPA recently promulgated new flow reference methods (2F 2G and 2H) Part 75 sources had raised concerns that Method 2 measurements could be biased high in some situations due to stratified or non-parallel flow In response Method 2F measures yaw and pitch angle adjusted velocity 2G adjusts for yaw angle and 2H accounts for wall effects A detailed observer checklist is available for these methods at CAMDs website and you should refer to that observer checklist if you are observing a flow RATA using one of these new methods Also available for downloading from the website is software (FLOW-CALC) that you can use to enter the reference method data and calculate results See httpwwwepagovairmarketsmonitoringindexhtml
Check that the traverse point locations for the reference method tests meet the requirements of Appendix A sect 656 and the sampling location dimensions Gas tests should typically use at least 3 traverse points Check Performance Specification (PS) 2 in Part 60 Appendix B Units with wet scrubbers may use a shorter measurement line than required by PS 2 if minimal stratification is demonstrated and moisture and gas systems may use a single point if the stratification test is passed (Part 75 Appendix A sect 656) The minimum number of traverse points for a flow test is 12 unless also using Reference Method 2H which requires at least 16 points (Part 60 Appendix B) A source can use more than the minimum number of sample points
Check the reference method calibration gases used for instrumental test methods The calibration gas certificate should show EPA Protocol gases or other certified gases concentrations that match those used in the biasdrift check calculations and an expiration date after the RATA The regulator gauge should show a cylinder pressure gt 150 psi
Verify the relative accuracy and reference method calculations yourself by doing the calculations on site using the raw data You should also obtain a copy or record the results of the RATA testers calculations Make sure that the CEMS and reference method data are for the same runs
Observation forms for flow and gas RATAs are provided in Appendix A The forms have more detailed checks than provided here In addition as noted above an observer checklist for flow reference methods 2F 2G and 2H is available at CAMDs website
Part 75 Field Audit Manual ndash July 16 2003 Page 85
Performance Test Observation Section 5
RATA Reference Methods (Part 75 Appendix A sect 6510)
The following methods from Appendix A to Part 60 or their approved alternatives are the reference methods for performing relative accuracy test audits
bull Method 1 or 1A for determining the appropriate test locations
bull Method 2 or its allowable alternatives including in Appendix A to Part 60 (except for Methods 2B and 2E) for stack gas velocity and volumetric flow rate
bull Methods 3 3A or 3B for O2 or CO2
bull Method 4 for moisture
bull Methods 6 6A or 6C for SO2
bull Methods 7 7A 7C 7D or 7E for NOx excluding the exception in section 512 of Method 7E ing Method 7E for measuring NOx concentration total NOx both NO and NO2 must be measured ithstanding these requirements Method 20 may be used as the reference method for relative accuracy test audits of NOx
monitoring systems installed on combustion turbines
When usNotw
Page 86 Part 75 Field Audit Manual ndash July 16 2003
Section 6 On-Site Inspection of Appendix D and Appendix E Monitoring Systems
Section 6 focuses on the on-site review of fuel monitoring and operating records that are required for units that use the excepted monitoring provisions available to gas and oil fired units ecordkeeping The audit emphasis is on verifying r
Part 75 Appendix D provides an optional monitoring protocol that may be used by gas-or oil-fired units instead of SO2 and flow CEMS It includes procedures for measuring oil or gaseous fuel flow using a fuel flowmeter and procedures for conducting sampling and analysis to determine sulfur content density and gross calorific value (GCV) of fuel oil or gaseous fuels
Part 75 Appendix E is available to qualifying gas or oil fired peaking units as an optional NOx emissions rate estimation procedure that may be used instead of a NOx CEMS Baseline stack testing is performed at four operating levels to establish a NOx rate - heat input curve with NOx rate the dependent variable
61 QAQC Plan Review
The QAQC plan provides a template for performing a review of fuel monitoring and sampling records and is the place to start the field audit for the excepted monitoring provisions of Part 75 Appendices D and E As described in Section 49 you should determine whether the QAQC plan meets the requirements of Part 75 Appendix B and whether the facility is implementing the plan Checks of the QAQC plan and rule requirements for Part 75 Appendix D are identified in Table 6-1 and the checks for Part 75 Appendix E are in Table 6-2
Table 6-1Appendix D - QAQC Plan Review
What to Check Part 75 Requirements
Review the fuel sampling methods and analysis The QAQC plan should include standardprocedures Compare the sampling methods and sampling and analysis procedures used by thefrequencies to the rule requirements outlined in source or its fuel supplier (Appendix B sect 135) the sample Appendix D field audit sheets (seeAppendix A of this manual)
Are the fuel flow meter test procedures and the transducer or transmitter accuracy test procedures outlined in the plan sk the source how often (and how) the tests are performed and compare to the plan and Part 75 requirements
Test procedures are required in the QAQC plan (Appendix B sect 132)
A
(cont)
Part 75 Field Audit Manual ndash July 16 2003 Page 87
Appendix D and Appendix E Monitoring Section 6
Table 6-1Appendix D - QAQC Plan Review (cont)
What to Check Part 75 Requirements
Check the fuel flowmeter transducer or
transmitter calibration and maintenance records Records are required by the QAQC plan provisions in Appendix B sect 133 se records are to include adjustments maintenance or repairs performed on the fuel flowmeter monitoring system as well as records of the data and results for Appendix D fuel flowmeter accuracy tests and transducer accuracy tests
Tho
Table 6-2Appendix E - QAQC Plan Review
What to Check Part 75 Requirement (App B sect 136)
Check the recommended range of QAQC parameters and hourly records of these parameters Make sure the parameters are identified and recorded
The QAQC plan must identify recommended ranges of quality assurance- and quality control-related operating parameters that are recorded each hour There are to be at least 4 parameters for turbines or reciprocating engines and oxygen for boilers (Appendix E sect 232)
Request that the source identify any parameter deviations and ensure proper missing data procedures are used for those hours
The source is required to redetermine the Appendix E correlation if a single deviation period exceeds 16 operating hours
Check written Appendix E NOx emission rate
testing procedures This is another required component of the QAQC plan The procedures should match the test requirements in Appendix E sect 21
62 DAHS and Supporting Records
Elements of the data acquisition and handling system (DAHS) for an Appendix D or Appendix E monitoring systems should be checked in a manner similar to that described under the CEMS on-site inspection in Section 4 of this manual
The DAHS consists of all the hardware and software used to comply with all electronic recordkeeping and reporting requirements Make sure that the version used is previously certifiedrecertified by checking against the monitoring plan and ask to see and check the DAHS verification test for the missing data routines The source is not required to submit these results and there are no electronic checks of the routines Verification test results for the missing data routines are required by sectsect 7520(c)(9) and 7563(a)(2)(iii) The latest test should have occurred no earlier than when the unit began using EDR v21 (or v22 when applicable)
Page 88 Part 75 Field Audit Manual ndash July 16 2003
Section 6 Appendix D and Appendix E Monitoring
Additional checks are necessary to ensure that data entered manually into the DAHS match hardcopy supporting information Fuel sampling data (sulfur content density GCV) may be entered manually into the DAHS Ask the source how these data are entered You should also compare the electronic fuel data in the DAHS to the on-site hardcopy fuel sampling and analysis data to make sure they match The source may pull the electronic data up for you using the DAHS or you may use data that you printed out from MDC Hourly
You should also investigate how emissions data missing data periods and operating parameters are recorded If data are entered by hand you should similarly spot check the electronic data with the hardcopy For Appendix E units check to see that the results from the plants copy of the Appendix E NOx emission rate tests match the curve in the monitoring plan and DAHS This should include checks on the dates and times NOx load and fuel flow values You can use MDCs Appendix E test report function to review the electronic data You should also check the sources hardcopy capacity factor documentation against the capacity factor submitted in the EDR (see Record Type 507)
Table 6-3Summary of DAHS and Supporting Records Checks
What to Check How to Check
Check that the current DAHS version is certified and that a DAHS verification test was conducted for the missing data routines
Compare the DAHS to that identified in the monitoring plan Missing data routine verification test results are required by sectsect 7520(c)(9) and 7563(a)(2)(iii) The latest test should have occurred no earlier than when the unit began using EDR v21 (or v22 when applicable)
How is fuel sampling data (sulfur content density GCV) entered Do the data match the fuel analysis results
Ask the source to pull up the fuel data in the DAHS and compare to hardcopy fuel sampling and analysis data
How are emissions data missing data periods and operating parameters recorded
If the data are entered by hand spot check the data with the hardcopy
Does the hardcopy report of the Appendix E NOx
emission rate tests match the curve in the monitoring plan and DAHS
Compare the plants copy of the test report to the Appendix E test report from the MDC program Check that dates and times NOx load and fuel flow values match
63 Appendix D Fuel Flow Monitors
If practical visually check the fuel flow monitors to verify that the fuel flow monitors match those in the monitoring plan At a minimum the monitoring plan should at least show the flowmeter component type manufacturer modelversion and serial number Some units may also report each auxiliary component (pressure and temperature transducers and transmitters) in the monitoring plan
Part 75 Field Audit Manual ndash July 16 2003 Page 89
Appendix D and Appendix E Monitoring Section 6
64 Appendix D Fuel Flow Monitor Quality Assurance
Billing meters are exempt from QA accuracy testing and other quality assurance requirements (Part 75 Appendix D sect 214) You should first ask if the monitor is used for commercial billing and has been designated as such This should be identified in the monitoring plan If it is no further checks are necessary
641 QA Testing
After the initial certification tests fuel flow monitors are to be tested once every four fuel flowmeter QA operating quarters Extensions up to 20 operating quarters are available based on quarterly fuel flow-to-load test results For these QA tests make the following checks
Are quarterly fuel flow-to-load tests performed This test is optional Test results are reported in the EDR -- you may have reviewed the data prior to the visit using MDC Verify that on-site test results match those in the electronic report
Check fuel flow monitor accuracy test reports Compare the hardcopy accuracy test results against those reported electronically MDC can provide a copy of the electronic report You can also verify the calculations Ask the source for a copy of the report which should be in a format similar to Part 75 Appendix D Table D-1 or D-2
642 Maintenance and Inspection Records
The maintenance logs should detail any maintenance performed on the system and should reference all preventive maintenance performed During the inspection you should look at the maintenance log book which is required as part of the QAQC plan The maintenance conducted should match the maintenance procedures in the plan Also verify that there have been no changes to monitoring equipment without appropriate recertification testing See Section 48 for more discussion of maintenance logs
Page 90 Part 75 Field Audit Manual ndash July 16 2003
Section 7 Reporting Audit Results
Section 7 provides a brief overview of reporting results in the exit interview and audit report ould highlight issues suggesting data invalidity so that the source can take steps to minimize allowance penalties from missing data CAMD should receive prompt notice of issues that may affect the validity of mass emissions data
The interview sh
71 Exit Interview
You should conduct an informal summary of the audit findings (exit briefing) before you leave the facility You should discuss the audit findings with reference to specific regulatory requirements or in terms of potential problems Evidence should be available to support a finding or observation although you should raise any questions on a monitoring method or rule requirement If a source disputes a finding you should give it an opportunity to provide adequate alternate information Further investigation after the meeting may be required to achieve the resolution of questioned items In such cases you should table the discussion at the briefing
If you perform the audit periodically you should address any progress or lack thereof since the previous audit This is readily done by reviewing the findings of the last audit and noting how the issues have been resolved If there has been no progress the review should emphasize the ongoing problems and stress the need for immediate resolution
72 Audit Report
The audit report organizes and coordinates information gathered during the audit in a usable manner -- it is the compilation of factual information and professional judgment resulting from the audit The report also serves to record the procedures used in gathering the data and gives factual observations and evaluations from the audit Information in the report must be accurate relevant complete objective and clear You should avoid discussions of general topics and should link all compliance issues directly to regulatory requirements Include any follow-up actions in the audit report
You also should prepare a cover letter summarizing the audit results and follow-up activities Send the cover letter and audit report to the Designated Representative or the sources contact person and a copy to the EPA Regional andor State agencies The Clean Air Markets Division should receive a copy of the cover letter If any findings are likely to affect reported mass emissions used for allowance true-up activities notify CAMD immediately You should complete the audit report within one month following the audit while observations are still fresh and to provide a quick response to any problems Notify the source if the report is delayed
Part 75 Field Audit Manual ndash July 16 2003 Page 91
Reporting Audit Results Section 7
73 Follow-up Activities
The audit team should keep documentation of any outstanding issues from the audit A follow-up review should be scheduled within a reasonable time after the audit
Page 92 Part 75 Field Audit Manual ndash July 16 2003
Section 8 Conducting Level 3 Audits
Section 8 discusses issues that an agency should consider in developing a performance testing program (a Level 3 audit capability) es single gas challenges and linearity tests
This section emphasiz
81 Overview
This section focuses on issues that an agency should consider if it chooses to develop a Level 3 audit program that includes single gas challenges and linearity testing of gas CEMS The emphasis in this section is on the calibration gases and development of a testing program rather than on a step-by-step description of how to perform a test
Agencies that currently do not perform Level 3 performance tests may have in-house expertise and experience available in the agencys ambient air monitoring staff Single gas challenges and linearity testing of Part 75 gas CEMS require the same knowledge base as calibration testing of ambient gas monitors An agency can take advantage of this existing resource in developing a Level 3 program for Part 75 audits
82 Tri-Blend or Single Blend Gases
Part 75 affected sources commonly use multi-component calibration gases Multi-component gases provide cost savings over single component gases by reducing the number of cylinder gases and the equipment necessary for calibration tests These calibration gases also allow for calibrating analyzers simultaneously The tri-blend (or triple blend) contains SO2 NO and CO2 The SO2 and NO are at relatively low concentrations in the ppm range while the CO2
concentration is in the percent range The single component (or single blend) calibration gas consists of the target compound -- SO2 NO or CO2 -- blended with N2 or air Compared to a single blend a tri-blend replaces a portion of the N2 or air with CO2 (up to 20 percent by volume for high range testing)
Tri-blends with a CO2 concentration of 11 percent (representative of most stack conditions) are recommended for agency auditors CO2 concentrations representative of stack gas conditions will minimize molecular weight or interference effects described below that can occur if the CO2 concentration in the calibration gas is different from the stack gas
Molecular Weight Effects - Dilution Systems
CO2 weighs more than N2 or air so a tri-blend calibration gas containing CO2 will be heavier than a single blend calibration gas in which the balance is either N2 or air This will impact a single gas challenge or linearity test of dilution extractive systems if the inspector uses a single blend to conduct a test on units that normally use tri-blends for calibration and quality assurance The sample flow in a dilution extractive system is controlled by the critical orifice
Molecular Weight of Major Calibration Gas
Component Compounds
bull CO2 44 bull N2 28 bull Air 29
Part 75 Field Audit Manual ndash July 16 2003 Page 93
Single Gas Challenges and Linearity Tests Section 8
which is dependent on molecular weight Dilution extractive systems therefore will produce different test results depending on whether a single blend or tri-blend gas is used Your best approach to dealing with this issue is to use a tri-blend with CO2 concentrations representative of stack conditions Table 8-1 summarizes the effects of calibration gas blend molecular weights on dilution system emission measurements and QA testing measurements
Table 8-1Effects of Gas Blends on Dilution System Measurements
(from Table 3-2 in Jahnke 1994)
Activity Performed Calibration Gas Blend
Used Possible Resulting Measurement Biases
Emissions Measurements
CEM system calibrated with CO2 triple blend
Emission measurements bias minimized (because CO2 present in both flue gas and calibration gas)
CEM system calibrated with single blend (eg SO2 in nitrogen)
Emission measurements are biased (because CO2 is present in flue gas)
Calibration Error Test and Linearity Check
CEM system calibrated with single blend
Calibration error test conducted with CO2
triple blend will show a bias Linearity check conducted with CO2 triple blends will show bias
CEM system calibrated with CO2 triple blend
Calibration error test conducted with single blend will show a bias Linearity check conducted with single blends will show bias
CEM system calibrated with single blend
RATA conducted with Reference Method 6C calibrated with a CO2 triple blend will show bias
CEM system calibrated with CO2 triple blend
RATA conducted with Reference Method 6C calibrated with a single blend will show bias
RATA CEM system calibrated with a single blend
RATA conducted with Reference Method 6C calibrated with a single blend will minimize bias
CEM system calibrated with CO2 triple blend
RATA conducted with Reference Method 6C calibrated with a CO2 triple blend will minimize bias
Interference Effects
CO2 can interfere with chemiluminescent NOX monitors (quenching) and cause a negative error in the NOx emission measurement If the auditor uses a NO single blend calibration gas without CO2 the result reported by the DAHS will be higher than the calibration gas concentration as the CEMS results are corrected to account for the CO2 concentration in
Page 94 Part 75 Field Audit Manual ndash July 16 2003
Section 8 Single Gas Challenges and Linearity Tests
the stack gas As in the case of molecular weight effects using a tri-blend with CO2
concentrations representative of stack conditions will minimize this problem
83 Hands Off Policy
EPAs hands off approach discussed in Section 141 also applies to conducting a single gas challenge or linearity test You do not need to physically handle a facilitys CEMS hardware You should ask qualified plant personnel to perform any actions with the CEMS equipment This includes connecting cylinder gases to the plant calibration gas manifolds or your gas delivery line to the CEMS calibration gas injection point and obtaining results from the DAHS
84 Test PlanProcedures
The agency should prepare standard operating procedures for performing the single gas challenge or linearity test A general outline of items to cover is provided in Table 8-2 A sample procedure for linearity testing is provided in Appendix A of this manual
Table 8-2Elements of a Standard Operating Procedure for Performance Testing
Procedure Element DescriptionPurpose
Pre-Test Survey Contact the source to schedule the test verify CEMS calibration information and review test logistics
Pre-Test Equipment Preparations Select and prepare test equipment
Pre-Test Meeting Plant meeting the day of the test Review of test procedures and any special circumstances
Equipment Set-up Outline of steps to set up the test equipment
Test Procedure Step by step procedures for the test itself including calculations
Pack-up Procedure Description of equipment breakdown after the test is completed
Post-Test Meeting Provide source with the test results
85 Single Gas Challenge
The single gas challenge uses one protocol gas to challenge the CEMS at one point in the measurement range It has a logistical advantage over performing a linearity test One trishyblend gas cylinder can cover CO2 SO2 and NOx and there is no need for a manifold or trailer The disadvantage is that only one point in the measurement range is tested EPA recommends that if a single gas challenge is performed a mid level gas be selected (~ 40 - 60 percent of span) Have the source perform a daily calibration error test so that the full scale can be evaluated This approach minimizes the resources required but most closely approximates a full linearity test
Part 75 Field Audit Manual ndash July 16 2003 Page 95
Single Gas Challenges and Linearity Tests Section 8
When you perform the single gas challenge connect your calibration gas cylinder to the sources calibration gas manifold ep in mind the hands off policy ould perform three runs For each run
Inject gas wait for the response to fully stabilize and record value from the DAHS and
Allow system to sample stack gas and equilibrate before the next run
Based on this test the percent error is calculated in the same manner as the linearity error
where
LE = Percent linearity error R = Reference value of calibration gas A = Average of monitoring system responses
86 Linearity Test
Linearity test procedures and requirements are outlined in Part 75 Appendix A sect 62 There are two approaches your agency might take with regards to the logistics of on-site linearity testing rst approach is similar to the single gas challenge in that you bring your own calibration gases to the site and have the source connect each of your three cylinder gases (low mid and high) to the plant calibration gas manifold ach is to provide your own gas delivery manifold set-up with your cylinders in a truck or trailer and have the source attach your gas delivery line to the CEMS injection point
You will challenge the CEMS three times with each audit gas s injected at the gas injection port required in Part 75 Appendix A sect 221 e same gas concentration or level is not used twice in succession Sufficient time should be allowed for the concentration reading to stabilize for each gas injection he average CEMS response will be taken from the DAHS as the official component for recording the CEMS data You then calculate the percent error using the same equation identified in Section 85 above
87 Calibration Gases
As noted earlier a tri-blend gas containing SO2 NOx and 11 percent CO2 is recommended for agency audits of SO2 and NOx monitors The number of different calibration gases that your agency will need is dependent on the spans of the CEMS installed on units in your area At least three audit gases will be needed to conduct the linearity test at a unit ne having a value 20 to 30 percent of span the second with a value of 50 to 60 percent of span and the third with a value of 80 to 100 percent of span Review the monitoring plans for the units in your area to identify which gases you will need gency should develop a standard operating procedure for maintaining the calibration gas inventory
Ke You sh
The fi
The other appro
The audit gas iTh
T
o
Your a
Page 96 Part 75 Field Audit Manual ndash July 16 2003
Section 8 Single Gas Challenges and Linearity Tests
88 Training
Table 8-3 lists available EPA training courses pertaining to gas CEMS and analyzer calibration Two of the courses APTI 435 and APTI 464 are geared to operating an ambient monitoring system but include instructions on how to calibrate gas analyzers that are directly applicable to performing a single gas challenge or linearity test on a Part 75 gas CEMS
Table 8-3Available EPA Training Courses
EPA Course Number
Course Title
APTI 435 Atmospheric Sampling
APTI 464 Analytical Methods for Air Quality Standards
APTI 450 Source Sampling for Pollutants
APTI 474 Continuous Emission Monitoring
SI 476B Continuous Emission Monitoring Systems Operation and Maintenance of Gas Monitors
Part 75 Field Audit Manual ndash July 16 2003 Page 97
- Page 1
- Page 2
- Page 3
- Page 4
- Page 5
- Page 6
- Page 7
- Page 8
- Page 9
- Page 10
- Page 11
- Page 12
- Page 13
- Page 14
- Page 15
- Page 16
- Page 17
- Page 18
- Page 19
- Page 20
- Page 21
- Page 22
- Page 23
- Page 24
- Page 25
- Page 26
- Page 27
- Page 28
- Page 29
- Page 30
- Page 31
- Page 32
- Page 33
- Page 34
- Page 35
- Page 36
- Page 37
- Page 38
- Page 39
- Page 40
- Page 41
- Page 42
- Page 43
- Page 44
- Page 45
- Page 46
- Page 47
- Page 48
- Page 49
- Page 50
- Page 51
- Page 52
- Page 53
- Page 54
- Page 55
- Page 56
- Page 57
- Page 58
- Page 59
- Page 60
- Page 61
- Page 62
- Page 63
- Page 64
- Page 65
- Page 66
- Page 67
- Page 68
- Page 69
- Page 70
- Page 71
- Page 72
- Page 73
- Page 74
- Page 75
- Page 76
- Page 77
- Page 78
- Page 79
- Page 80
- Page 81
- Page 82
- Page 83
- Page 84
- Page 85
- Page 86
- Page 87
- Page 88
- Page 89
- Page 90
- Page 91
- Page 92
- Page 93
- Page 94
- Page 95
- Page 96
- Page 97
- Page 98
- Page 99
- Page 100
- Page 101
- Page 102
- Page 103
- Page 104
- Page 105
- Page 106
- Page 107
-

Table of Contents (cont)
Page
25 Flow CEMS 33251 Sampling Location 34252 Differential Pressure Flow Monitors 34253 Thermal Mass Flow Monitors 35254 Ultrasonic Flow Monitor 37
26 Data Acquisition and Handling System (DAHS) 38261 CEMS Computer Systems 38262 Emissions Data Processing 39263 QA Test Data Processing 39264 Part 75 Reporting 39
27 References 40
Section 3 Audit Preparation 4131 Using Part 75 Electronic Data to Conduct Pre-Audit Reviews 41
311 Quarterly Electronic Data Reports 41312 Quarterly Feedback Reports 44313 Using MDC to Prepare for an Audit 44
3131 MDC Overview 443132 Getting Started with MDC 453133 Review and Print Electronic Portion of Monitoring Plans 463134 QA Tests Exemptions and Extensions 473135 Recertification Events and Monitoring System Downtime
Reports 503136 Using MDC Hourly to Check Emissions Data
and Calculations 5032 Hardcopy File Review 53
321 Correspondence Petitions and Previous AuditInspection Reports 53322 Linearity Test and RATA Reports 54323 Permits 54
33 Scheduling and Coordinating the Audit 5534 Materials to Bring 55
Section 4 On-Site CEMS Inspection 5741 Pre-Audit Interview 5842 Calibration Error Test 5943 ProbeSensors Sample Lines and Sample Conditioning Systems 62
431 Probe 62432 Sample Lines 63433 Dilution Air and Gas Sample Conditioning Systems 64
4331 Dilution Extractive Systems 644332 Source Level Extractive Systems 66
44 Gas Analyzers 67 68
45 Calibration Gases 6846 Flow Monitors 71
Page ii Part 75 Field Audit Manual ndash July 16 2003
Table of Contents (cont)
Page
47 DAHS 73471 DAHS Certification and Verification Tests 74472 Changes in Correction Factors 74473 Manually Entered Data 74
48 Maintenance Log and Daily Checklists Review 7649 QAQC Plan Review 78
Section 5 CEMS Performance Test Observation 8151 Introduction 8152 Linearity Test 8253 Relative Accuracy Test Audit (RATA) 83
Section 6 On-Site Inspection of Appendix D and Appendix E Monitoring Systems 8761 QAQC Plan Review 8762 DAHS and Supporting Records 8863 Appendix D Fuel Flow Monitors 8964 Appendix D Fuel Flow Monitor Quality Assurance 90
641 QA Testing 90642 Maintenance and Inspection Records 90
Section 7 Reporting Audit Results 9171 Exit Interview 9172 Audit Report 9173 Follow-up Activities 92
Section 8 Conducting Level 3 Audits 9381 Overview 9382 Tri-Blend or Single Blend Gases 9383 Hands Off Policy 9584 Test PlanProcedures 9585 Single Gas Challenge 9586 Linearity Test 9687 Calibration Gases 9688 Training 97
Part 75 Field Audit Manual ndash July 16 2003 Page iii
[This page intentionally left blank]
Page iv Part 75 Field Audit Manual ndash July 16 2003
List of Tables
Page
Table 1-1 Part 75 PollutantsParameters and CEMS Components 4Table 1-2 Part 75 Non-CEMS Methodologies 5Table 1-3 Levels of Field Audits 9Table 1-4 Available EPA Training Courses 12Table 2-1 Common Extractive Gas CEM Analytical Methods 28Table 2-2 In-Situ Gas Analyzer Methods 33Table 3-1 Electronic Monitoring Plan Information 46Table 3-2 Summary of MDC QA Test Checks 49Table 3-3 Summary of MDC Hourly Checks 53Table 4-1 Pre-Audit Interview Items 59Table 4-2 Part 75 Calibration Error Test Data Validation Requirements 61Table 4-3 ProbeSensor Check Summary 63Table 4-4 Summary of Dilution Air System Checks 65Table 4-5 Summary of Source Level Extractive System Checks 66Table 4-6 Summary of Analyzer Checks 68Table 4-7 Part 75 Calibration Gases (Appendix A sect 51) 70Table 4-8 Summary of Calibration Gas Checks 71Table 4-9 Summary of Flow Monitor Checks 73Table 4-10 Summary of DAHS Checks 76Table 4-11 Checks for QAQC Plan Elements 79Table 5-1 Linearity Test Specifications 83Table 6-1 Appendix D - QAQC Plan Review 87Table 6-2 Appendix E - QAQC Plan Review 88Table 6-3 Summary of DAHS and Supporting Records Checks 89Table 8-1 Effects of Gas Blends on Dilution System Measurements 94Table 8-2 Elements of a Standard Operating Procedure for Performance Testing 95Table 8-3 Available EPA Training Courses 97
Part 75 Field Audit Manual ndash July 16 2003 Page v
List of Illustrations Page
Illustration 1-1 Overview of Continuous Emission Monitoring in a Part 75 Trading Program 3
Illustration 2-1 Basic CEMS Types (Jahnke and Peeler 1997) 16Illustration 2-2 Example of Continuous Emission Monitoring Systems
at a Part 75 Unit 17Illustration 2-3 Typical Source-Level Extractive CEMS (Gschwandtner
and Winkler 2001) 21Illustration 2-4 Dilution Extractive CEMS (Gschwandtner and Winkler 2001) 23Illustration 2-5 In-Stack Dilution Probe (adapted from Jahnke 2000) 24Illustration 2-6 One Type of Out-of-Stack Dilution System (Gschwandtner
and Winkler 2001) 26Illustration 2-7 In-Situ Gas CEMS (Jahnke 1992) 32Illustration 2-8 Example of Multiple Probe Locations (Jahnke 1994) 35Illustration 2-9 Thermal Mass Flow Monitor Probe (adapted from Jahnke 1992) 36Illustration 2-10 Ultrasonic Flow Monitor 37Illustration 3-1 Example EDR Data Format for Record Type 320 42Illustration 3-2 Example Summary of Quarterly Report Content For Two Acid Rain
CEMS Units Emitting Through Common Stack 43Illustration 3-3 MDC Screen Showing Multiple Linearity Tests in One Quarter 48Illustration 3-4 Example MDC Hourly Graph of SO2 Concentration 52Illustration 5-1 Asymptotic Calibration Check Response (Jahnke 1994) 82
Page vi Part 75 Field Audit Manual ndash July 16 2003
Section 1 Introduction
After reading this Introduction the inspector (auditor) should understand the organization of the manual and the topics it covers the role of the field audit in the Part 75 compliance program the key components of the field audit and where to obtain the latest information on the regulation and on manual updates
11 Background
111 Importance of Monitoring for Emission Trading Programs
The US Environmental Protection Agency (EPA) has established monitoring requirements at 40 CFR Part 75 as part of its efforts to develop cap and trade emission reduction programs A cap and trade program is an innovative market-based approach to reducing emissions The cap sets a ceiling on emissions that is below an applicable baseline level Sources in the program receive emission allowances with each allowance authorizing a source to emit one ton of the pollutant being controlled Limiting the number of available allowances ensures the caps integrity At the end of each year every source must have enough allowances to cover its emissions for that year Unused allowances may be sold traded or saved (banked) for future use While this approach allows sources flexibility in deciding how they achieve compliance the cap ensures that the affected sources reduce emissions collectively to the desired reduction goal
The cornerstone for ensuring that sources achieve the required emission reductions is a strong monitoring program Accurate monitoring of all emissions and timely reporting ensure that a ton from one source is equal to a ton from any other source and that the integrity of the cap is maintained Under Part 75 participating sources must fully account for each ton of emissions according to stringent uniform protocols The resulting compliance information is unprecedented in its accuracy and comprehensiveness All data are publicly available on the Internet providing complete transparency
To date the Part 75 monitoring requirements are used for two separate programs Under the Acid Rain Program sources have had to meet Part 75 and emission reduction requirements since 1995 EPA has had the lead in ensuring compliance with the Acid Rain Program although EPA has teamed with State and local agencies on various aspects of implementing the Part 75 monitoring provisions
In May 2002 State agencies began to take the lead role in implementing and ensuring compliance with Part 75 for purposes of a separate nitrogen oxides (NOx) trading program that many eastern States have adopted in response to EPAs 1998 NOx SIP Call EPA believes that a strong audit program is an essential component of an effective Part 75 compliance oversight program Given the increased role of State and local agencies in Part 75 implementation EPA has prepared this manual to assist agencies in implementing Part 75 and to ensure the ongoing integrity of the new NOx trading program
The manual begins with the premise that each link in the chain of the Part 75 program is important in ensuring that the data ultimately used to measure emissions and account for the
Part 75 Field Audit Manual ndash July 16 2003 Page 1
Introduction Section 1
use of allowances in a trading program remain accurate Illustration 1-1 depicts the major links in the data quality chain for a continuous emissions monitoring system (CEMS) The process starts with ensuring that the gas standards used to calibrate and test the monitoring equipment are accurate EPA adopted the Traceability Protocol for Assay and Certification of Gaseous Calibration Standards for this purpose The source must conduct the necessary quality assurance tests following all appropriate procedures and report the results of those tests accurately These quality assurance activities are conducted initially for certification and then on an ongoing basis to maintain a measure of the systems ability to accurately determine emissions Once the data measurements are quality-assured the next step is to ensure that the measured data obtained from the CEM analyzer are accurately recorded by the data acquisition and handling system (DAHS) and appropriately reported in the quarterly electronic data reports (EDR) The EDRs are submitted quarterly to EPA so that it can review and account for the emissions data in the cap and trade program EPA provides the necessary data management systems to track emissions and allowance transfers
The integrity of the overall trading program can break down anywhere along this chain of activities therefore EPA relies on a combination of electronic and field auditing to verify overall data integrity The field audit procedures in this manual are critical for examining these links to verify proper performance of the monitoring systems and identify problems which may lead to inaccurate emissions accounting
Page 2 Part 75 Field Audit Manual ndash July 16 2003
Section 1 Introduction
Illustration 1-1Overview of Continuous Emission Monitoring in a Part 75 Trading Program
112 Structure of Part 75 Monitoring Provisions
Continuous emissions monitoring systems (CEMS) are the primary monitoring method under Part 75 The Part 75 rule includes requirements for installing certifying operating and maintaining CEMS for SO2 NOx CO2 O2 opacity and volumetric flow Appendices A and B of Part 75 provide the technical specifications for the installation and performance of CEMS including certification and quality assurance test procedures The rule also includes approved non-CEMS options for certain gas and oil fired units and procedures to account for missing data
Recordkeeping and reporting provisions require Acid Rain Program and NOx trading program affected units to submit Part 75 hourly emission data and related quality assurance data through electronic report formats to EPAs Emission Tracking System (ETS) which is operated by the Clean Air Markets Division (CAMD) The ETS data in turn are used to
Part 75 Field Audit Manual ndash July 16 2003 Page 3
Introduction Section 1
TIP
Check wwwepagovairmarkets for further regulatory information
maintain the emission allowance accounts in the Allowance Tracking System and the NOx
Allowance Tracking System
The Part 75 requirements are outlined below to introduce you to the rule and some of the terminology used in the manual can obtain copies of Part 75 and determine whether EPA has published further revisions to Part 75 issued new monitoring guidance or revised the information in this manual by checking CAMDs website ion 15 of the manual provides a list of important regulations and policy guidance documents with links to specific pages on CAMDs website you may find helpful
Monitoring Methods
The monitoring requirements for each type of unit subject to Part 75 are in Subpart B of the rule red except for some gas and oil fired units e 1-1 summarizes CEMS components that are required by pollutant while Table 1-2 summarizes the non-CEMS options
Table 1-1 Part 75 PollutantsParameters and CEMS Components
PollutantParameter
Required CEMS Components
SO2 NOx Flow Opacity Diluent Gas (O2
or CO2)
Data Acquisition
and Handling System (DAHS)
SO2 (lbhr)
NOx (lbmmBtu)1 NOx (lbhr)2 Opacity ()3 CO2 (lbhr)4 Heat Input (mmBtuhr)
You
Sect
CEMS are requi Tabl
1Heat input in mmBtuhr is also required2For units subject to NOx SIP Call trading program Can monitor with or without diluentmonitor3Required only for coal and residual oil units4Alternative mass balance method may by used to monitor CO2
Page 4 Part 75 Field Audit Manual ndash July 16 2003
Section 1 Introduction
Table 1-2Part 75 Non-CEMS Methodologies
Pollutant Parameter
Unit Type Monitoring Methodology
SO2 (lbhr) natural gas Default SO2 emission rate combined with measured fuel flow (Part 75 Appendix D)
SO2 (lbhr) gas or oil Fuel sampling and analysis combined with measured fuel flow (Part 75 Appendix D)
NOx (lbmmBtu) NOx (lbhr)
gas or oil peaking units
Estimate NOx rate by using site-specific emission correlations with measured fuel flow if measuring lbhr (Part 75 Appendix E)
SO2 CO2 NOx
(lbhr for all and lbmmBtu for NOx)
gas or oil Conservative default values for units with low mass emissions (sect 7519)
Heat Input (mmBtuhr)
gas or oil Measured fuel flow and GCV (Part 75 Appendix D)
Monitoring Certification Requirements
The implementing agency must certify an allowable monitoring method before it can be used for Part 75 monitoring The source must perform certification tests and submit the results to EPA and the appropriate State agency Part 75 performance certification testing is outlined in sect 7520 and Appendix A sect 6 Certification tests for a CEMS may include
7-day calibration error test for each monitor Linearity check for each pollutant concentration monitor Relative Accuracy Test Audit (RATA) for each monitoring system Bias test for each monitoring system Cycle time test for each pollutant concentration monitor Daily interference test for flow monitors DAHS testing
There are also certification requirements for non-CEMS methods These include accuracy tests for fuel flow monitors (sect 7520 and Appendix D sect 215) stack tests to develop NOx correlations for gas or oil peaking units (Appendix E sect 21) or unit-specific default values for low mass emissions units (sectsect 7519-7520)
Recertification may be required if the facility replaces modifies or changes a certified CEMS in a way that may significantly affect the ability of the system to accurately measure monitored parameters
Quality AssuranceQuality Control Procedures
The source is required to develop and implement a written quality assurancequality control (QAQC) plan for each monitoring system (sect 7521) The QAQC plan must include procedures for system operation as well as procedures for conducting quality assurance tests (QA tests) preventive maintenance and recordkeeping Appendices A and B to Part 75
Part 75 Field Audit Manual ndash July 16 2003 Page 5
----
Introduction Section 1
describe the technical procedures for how and when to conduct periodic QA tests which include
Daily calibration error tests Challenge a gas CEMS at a zero and high level with calibration gas
Daily interference tests for flow monitors Follow procedure to detect plugging or other problems that could interfere with a flow monitor
Quarterly linearity tests Challenge a gas CEMS at 3 levels with calibration gases Quarterly flow-to-load evaluations Compare flow monitor values to values from an
initial flow-to-load correlation as a means to check flow monitor data quality over time Semi-annual or annual RATAs Compare monitored values to values measured by an
approved EPA reference method Also use RATA results to detect and if necessary adjust for low bias
Recordkeeping and Reporting
Part 75 includes requirements for notifications recordkeeping and reporting in Subparts F and G As noted earlier most of the reporting to EPA is done electronically every quarter in a standard electronic format and much of the recording will be done automatically using the DAHS Some important records and reporting that you will want to review include
Monitoring plan Submitted electronically although some information is submitted only in hardcopy Contains information describing the unit CEMS other monitoring methodologies and specific calculation procedures
Hourly parameters including emissions flow heat input monitor availability and other information
Periodic QA test results Recertification tests Other records that are required to be kept on-site such as
Annual spanrange evaluationSO2 scrubber parameters to verify proper control operation during a missing dataperiod
Missing Data
Part 75 requires sources to account for emissions during periods when there are no valid data (missing data periods) due to the monitor not operating or operating out of control The missing data methodologies are necessary so that a source accounts for emissions during each hour of operation The missing data algorithms become increasingly conservative as monitor downtime increases so that sources have an incentive to maintain high data availability
12 What does the manual cover
This manual details recommended procedures for conducting a field audit of a Part 75 monitoring system Included are tools you can use to prepare for an audit techniques you can use to conduct the on-site inspection and review records proper methods for observing performance tests and guidelines for preparing a final report EPA has designed the audit procedures in this document so that personnel with varying levels of experience can use them
Page 6 Part 75 Field Audit Manual ndash July 16 2003
Section 1 Introduction
While the manual is written primarily for State and local agency inspectors industry personnel may find some of the material useful for their internal data quality management activities
The manual covers gas (SO2 NOx and diluent) and flow monitoring systems -- it does not cover opacity monitor audits Although Part 75 requires opacity monitors for coal-fired units subject to the Acid Rain Program opacity data and quality assurance tests are not reported to CAMD in quarterly emission data reports Moreover the source can comply with Part 75 by satisfying performance specifications in Part 60 that are generally applicable to opacity monitors and can follow a States recording and reporting requirements Thus there are no special Part 75 audit techniques for these systems
The manual is organized into eight major sections with one appendix
Section 1 introduces cap and trade programs Part 75 the role of field audits and the inspector CAMDs audit targeting role the importance of inspector training and a list of key Part 75 materials with Internet links
Section 2 provides a short introduction to the various types of CEMS and the major components of a CEMS including basic installation and operating principles
Section 3 describes preparing for an audit prior to the plant visit with emphasis on using CAMDs Monitoring Data Checking (MDC) software to review the electronic data
Section 4 covers the on-site CEMS inspection including what to look for and questions to ask during a walk through of CEMS components as well as how to review the QAQC plan and other in-plant records
Section 5 describes how to observe CEMS performance tests (linearity and relative accuracy test audits)
Section 6 outlines specific on-site review procedures for Appendix D and E monitoring systems and records
Section 7 guides you in conducting the exit interview and preparing a written audit report
Section 8 discusses issues that should be considered by a State or local agency in developing a performance testing program with an emphasis on single gas challenges and linearity tests
Appendix A to the Manual provides sample checklists for the field audit RATA and linearity observations The checklists are based on the discussions and techniques in Sections 3 through 6
Part 75 Field Audit Manual ndash July 16 2003 Page 7
Introduction Section 1
13 Part 75 Audit Program Overview
The Part 75 audit program consists of both electronic audits and field audits CAMD uses automated tools such as the Monitoring Data Checking (MDC) system to conduct automated checks of data submitted under Part 75 for potential problems Also it uses its data systems and its ability to check data through automated information systems to target units for follow-up data audits On-site field audits performed to ensure that monitoring systems are installed and operated properly are also essential in the Part 75 audit program
131 Part 75 Electronic Audit Program
CAMD performs routine electronic audits on each quarterly report submittal using the ETS and MDC software EPA may also perform targeted electronic checks to find other specific data reporting problems The electronic audits identify errors in the quarterly electronic data report the monitoring plan and the QA tests An automated ETS feedback report that focuses on the reported emissions data is sent to the source instantly upon electronic submittal by ETS EPA then uses MDC to analyze the monitoring plan and QA data and sends an MDC feedback report at the end of the quarterly submission period The reports categorize errors as critical and non-critical -- for critical errors the source must correct and resubmit the quarterly report
132 Audit Targeting
In addition to performing electronic audits EPA periodically compiles a recommended field audit target list based on a review of all of the quarterly electronic data reports This national list attempts to identify trends based on a large population of units that may not be identifiable from a smaller population at the State level alone The target list is intended to help States allocate their auditing resources on those units that are most likely to have data problems based on the findings of EPAs electronic auditing efforts States may use these recommendations to focus their audit efforts but may also choose other units for field audits through State targeting approaches or at random
133 Field Audits
EPA relies on State and local agencies to conduct field audits of monitoring systems to assess the systems performance and a sources compliance with monitoring requirements The audits also encourage good monitoring practices by raising plant awareness of monitoring requirements The field audit consists of a thorough evaluation of the CEMS via pre-audit record review on-site inspection of equipment and system peripherals record reviews test observations and interviews with the appropriate plant personnel
EPA has defined three levels (see Table 1-3) to describe field audit activities and procedures and the objective of the audit
Page 8 Part 75 Field Audit Manual ndash July 16 2003
Section 1 Introduction
Table 1-3 Levels of Field Audits
Audit Level
Records Review
On-site Inspection of CEMS
Daily Calibration Observation
Linearity or RATA
Observation
Performance Test Audit
Level 1
Level 2
Level 3
The Level 1 audit may be used to verify Part 75 recordkeeping requirements emissions data and monitoring plan information and is recommended as a follow-up to a previous audit This audit consists of an on-site inspection records review and daily calibration observation A Level 2 audit expands the audit to include a performance test observation The test observation is a critical element to ensure that CEMS are properly operating and performance test protocols are being conducted in accordance with the required standards For this reason EPA encourages agencies to perform Level 2 audits which are the focus of this manual
A Level 3 audit involves agency personnel conducting a performance test instead of merely observing the test Conducting a performance test such as a linearity test or relative accuracy test audit provides an independent assessment of the monitoring systems Because of the equipment and expertise involved EPA does not emphasize that State or local agencies perform Level 3 audits However some agencies strongly support Level 3 audit programs and Section 8 of this document provides guidance on various Part 75-related issues for those agencies that do conduct performance tests as part of their inspection program
14 Role of the Inspector
Your primary task as an inspector conducting a field audit is to document whether the monitoring at a facility is in compliance with the Part 75 requirements To carry out this task you will need to understand the Part 75 rule and have a general understanding of CEMS components and their function You will also need to ask questions carefully record your observations and compile the information necessary to determine compliance
Your role is not to provide technical advice or consulting on the operation of the monitoring equipment The source is responsible for operating the monitoring equipment and correcting any monitoring problems At the same time however the field audit is an opportunity to provide information to the source on Part 75 requirements You might for example clarify regulatory requirements and you should share with the source your observation of monitoring practices that may create regulatory problems
Part 75 Field Audit Manual ndash July 16 2003 Page 9
Introduction Section 1
Importance of Missing Data Under Part 75
Because Part 75 monitoring is used to account for total mass emissions when the monitor or monitoring system fails to record a valid hour of data Part 75 uses a conservative approach to substitute for missing data Audit findings may invalidate data and require use of substitute data so the findings could have a significant financial impact independent of any non-compliance issues
If your findings indicate that data from a monitor may be invalid which would require the source to use substitute data it is important to inform the source of the problem during the field audit Extensive missing data generally will penalize a source in allowance accounting and result in a significant monetary penalty for the source For the same reason it is important to notify CAMD quickly of the potential for invalidating data so that the issue is resolved prior to the end-of-year compliance process EPAs primary concern is to collect accurate CEM data to ensure the integrity and fairness of the trading program EPA has no interest in prolonging the length of time that a source is considered out-of-control Thus the goal of the audit should be to promptly identify
what needs to be corrected so that the source is once again reporting quality-assured verified emissions data This issue is discussed further in Section 72
141 Hands Off Approach
EPAs policy is to use a hands off approach when conducting the audit so that you do not have any physical contact with the CEMS hardware This approach avoids creating a situation in which monitoring equipment may be damaged or the inspectors actions may be questioned should the monitoring system fail to operate well during the audit You should ask authorized plant personnel to perform any actions with the CEMS equipment (for example initiating a daily calibration check or displaying analyzer range) Remember it is more important for you as the inspector to observe how the CEMS operator performs hisher duties as this will indicate whether the plant personnel are able to follow appropriate requirements and procedures and will help to identify any problems that occur Have the operator explain what heshe is doing and show you where the procedure is documented
Page 10 Part 75 Field Audit Manual ndash July 16 2003
Section 1 Introduction
142 Inspection Safety
Any type of air pollution source inspection has potential health and safety problems and inspection safety is a serious concern Appropriate safety training is imperative for all inspectors and each plant may have specialized training andor safety equipment policies Before going on site for an audit you must ensure that you have all necessary personal safety equipment Also make sure to contact the site and ask for details on plant safety requirements Once on site use the safety equipment properly adhere to your agencys safety requirements and follow plant safety requirements as well Some of the hazards you may encounter in performing CEMS audits include
Accessing CEMS equipment or platforms and working at elevations with fall hazards Electrical shock when inspecting heated lines pumps or internal areas of CEMS
cabinets and enclosures Hazards associated with use or transport of compressed gas cylinders Hazards associated with poisonous calibration gases (NO) Exposure to effluent gases Entry of confined spaces Typical hazards associated with working in an industrial environment (moving
equipment vehicles and machinery trip and fall hazards etc)
143 Recommended Training
Courses
The following table lists EPA classes that you may find helpful in developing a knowledge base for performing Part 75 CEMS field audits at stationary sources State agencies
Air Pollution Training Institute
Information on EPA courses and course schedules are available at EPAs AIR Pollution Training Institute website httpwwwepagovairoaqpseogaptihtml
regional organizations or university professional development programs may provide similar courses in your area
Part 75 Field Audit Manual ndash July 16 2003 Page 11
Introduction Section 1
Table 1-4Available EPA Training Courses
EPA Course Number
Course Title
APTI 445 Baseline Inspection Techniques
APTI 446 Inspection Safety Procedures
APTI 450 Source Sampling for Pollutants
APTI 474 Continuous Emission Monitoring
SI 476B Continuous Emission Monitoring Systems Operation and Maintenance of Gas Monitors
T008-02 Safety and the Agency Inspector
T468-02 Stack TestingStack Test Observation for Traditional and Hazardous Air Pollutants
15 Key Part 75 M aterials with Internet Links
The following is a list of key Part 75 reference materials with internet links to the webpage where the document can be found either on the EPA website or the Government Printing Office website To avoid a dead link the links in most cases are not to the document itself but to the web page where a link to the document may be found l need to survey the page to find the direct link
40 CFR Part 75 - On the CAMD website you will find an unofficial consolidated version of the Part 72 and Part 75 rules that contains the current text of Part 75 (and sectsect 721 - 723 the Acid Rain Program rule general provisions efinitions measurements abbreviations and acronyms) as amended by recent revisions may find this unofficial version a helpful tool because it has an easy-to-
Recent Part 75 Revisions
bull June 12 2002 (67 FR 40394) and
bull August 16 2002 (67 FR 53503)
You wil
purpose d
Youuse format httpwwwepagovairmarketsmonitoringconsolidatedindexhtml
While all reasonable steps have been taken to make this unofficial version accurate the Code of Federal Regulations (CFR) and Federal Register (FR) take precedence if there are any discrepancies Official versions of FR revisions are available on the EPA
Page 12 Part 75 Field Audit Manual ndash July 16 2003
Section 1 Introduction
website httpwwwepagovfedrgstr and the official CFR is available at the Government Printing Office website httpwwwaccessgpogovnaracfrcfrhtml_00Title_4040cfr75_00html
Electronic Data Report Version 22 Reporting Instructions - The instruction manual describes each data field element for the information that is recorded and reported to EPA for Part 75 and provides the field auditor with a helpful summary of Part 75 requirements The EDR v22 Instructions support the June 12 2002 revised Part 75 rule httpwwwepagovairmarketsmonitoring
Parts 75 and 76 Policy Manual - This manual contains a series of questions and answers that can be used on a nationwide basis to ensure that the Part 75 provisions are applied consistently for all sources affected by the rule It is intended to be a living document EPA will issue new questions and answers as they arise and will revise previously issued questions and answers as necessary to provide clarification EPA intends to release a revised verison of the manual in 2003 httpwwwepagovairmarketsmonitoringpolmanindexhtml
Recertification and Diagnostic Testing Policy - Recertification is required whenever a replacement modification or change in the certified continuous emissions monitoring system or continuous opacity monitoring system occurs that may significantly affect the systems ability to accurately measure or record the pollutant or parameter of interest EPA is preparing a document to clarify what types of changes to a monitoring system may be considered significant EPA expects that the document will describe various events as either recertification events or diagnostic testing events and describe the type of certification or diagnostic testing that needs to be performed You should check the wwwepagovairmarkets website for release of this policy
Monitoring Data Checking (MDC) Software - The MDC software discussed in Section 3 of this manual allows regulated industry and State agencies to enter analyze print and export electronic monitoring plan certification and quality assurance data and to evaluate hourly emissions data required by Part 75 The software also allows regulated sources to submit electronically monitoring plan and certification data to EPA via ftp The software provides a standard Windows-based mouse-driven point and click user interface and can be installed under Windows 95 (or higher) Windows NT or Windows 2000 The software and installation instructions can be downloaded from the CAMD website httpwwwepagovairmarketsmonitoringmdc
40 CFR Part 60 Appendix A Reference Methods - The RATA reference methods (and related information) are available from EPAs Emission Measurement Center website The website versions of the reference methods are the official CFR version httpwwwepagovttnemcpromgatehtml
Part 75 Field Audit Manual ndash July 16 2003 Page 13
Introduction Section 1
An Operators Guide to Eliminating Bias in CEM Systems - This EPA publication is designed for CEMS operators as a tool for diagnosing and correcting the causes of measurement bias in CEMS It is also a useful CEMS reference guide for the field auditor httpwwwepagovairmarketsmonitoring
Observers Checklists for Test Methods 2F 2G and 2H - These are detailed observer checklists that can be used when observing a flow RATA using one of these alternative flow reference methods httpwwwepagovairmarketsmonitoring
Page 14 Part 75 Field Audit Manual ndash July 16 2003
Section 2 Part 75 CEMS Overview
This section provides a brief introduction to the various types of components of continuous emission monitoring systems that facilities have installed to meet Part 75 requirements
21 Introduction
The monitoring requirements of Part 75 are performance-based requirements that generally do not require that a source use a particular type of CEMS There are several types of CEMS available The differences in how these systems are designed and operate (in terms of sample acquisition sample handling sample analysis and data recording) can be important in understanding what to look for in a field audit and how to interpret audit results
This section provides only an overview of the major concepts related to the types of CEMS and their principles of operation For further detail on these complex systems see Section 27 which provides a list of in-depth references EPA recommends that inspectors who will conduct Part 75 CEMS audits should attend EPAs Air Pollution Training Institute course on CEMS (APTI Course 474) The summary information in this section draws heavily from the manual for that course (Jahnke 1992) as well as from an EPA reference manual specifically tailored to Part 75 CEMS (Gschwandtner and Winkler 2001)
All CEMS perform the following basic functions
Locate or extract a representative sample
Analyze the sample and
Compile and record the results
CEMS are divided into two types based on the first of these basic functions An extractive system removes and transports the sample from the stack to the analyzer often conditioning the sample prior to the analyzer An in-situ system analyzes the sample directly in the stack Illustration 2-1 identifies these two main system types There are several variations on these types which Sections 23 through 25 review
Part 75 Field Audit Manual ndash July 16 2003 Page 15
Part 75 CEMS Overview Section 2
Illustration 2-1Basic CEMS Types (Jahnke and Peeler 1997)
Illustration 2-2 shows a set of typical Part 75 CEMS at a Part 75 unit The flow and opacity CEMS are examples of in-situ systems The opacity monitor measurement is taken over a path across the stack Most continuous opacity monitors are double pass (light is transmitted across the stack and back to the detector) to meet EPA quality assurance requirements The ultrasonic flow monitor in this example also provide an integrated measurement along a path across the stack Flow and opacity CEMS are always in-situ systems The gas CEMS (SO2 NOx CO2) in Illustration 2-2 are dilution extractive systems In this illustration the gas is extracted at a single point (the sampling probe) and diluted with clean dry air The diluted sample is transported through the sampling line and analyzed on a wet basis
Page 16 Part 75 Field Audit Manual ndash July 16 2003
Section 2 Part 75 CEMS Overview
Illustration 2-2Example of Continuous Emission Monitoring Systems at a Part 75 Unit
In-situ gas CEMS (not shown in Illustration 2-2) are also used by Part 75 sources sometimes in conjunction with extractive gas CEMS The use of in-situ gas CEMS for Part 75 compliance is far less common than the use of extractive systems -- in 2002 only about three percent of the gas monitors used to meet Part 75 requirements were in-situ monitors In-situ gas CEMS can measure at a point (or short path) like an extractive gas CEMS or along a path across the stack similar to an opacity monitor
The following sections begin with a discussion of Part 75 requirements for the sample measurement location and then briefly describe the three basic types of systems under Part 75 (gas extractive CEMS gas in-situ CEMS and Flow CEMS) The final CEMS component --the data acquisition and handling system (DAHS) used for electronic data and reporting -- is a critical element for Part 75 compliance and is discussed separately in Section 26 Finally Section 27 provides references that you can use to gain an in-depth understanding of how these systems operate and what their limitations are
22 Sampling Location
Whether the system is extractive or in-situ the flue gas must be monitored at a location where the pollutant concentration and emission rate measurements are directly representative of the total emissions from the affected unit Flowing gases are generally well mixed but in some cases gas stratification can be a concern for the gas measurement location Stack flow on the other hand is always stratified to some degree (lower velocities along the stack walls) Cyclonic or swirling flow (flow that is not parallel to the stack center line) also will have a negative impact on flow monitors and manual reference test methods Thus the selection of sampling points and paths is an important concern for flow monitors To obtain a
Part 75 Field Audit Manual ndash July 16 2003 Page 17
Part 75 CEMS Overview Section 2
representative measurement and avoid problems due to stratification and cyclonic flow Part 75 provides specific requirements for the CEMS sampling location in Appendix A sect 1
221 Gas Measurement Location
Part 75 requires that the representative sampling location be chosen based on the procedures in 40 CFR Part 60 Appendix B Performance Specification 2 which suggests a measurement location (1) at least two equivalent diameters downstream from the nearest control device the point of pollutant generation or at another point at which a change in pollutant concentration or rate may occur and (2) at least a half equivalent diameter upstream from the effluent exhaust or control device Other Part 75 location requirements from Appendix A are summarized below
Locate the measurement location so that the gas CEMS (pollutant and diluent monitor) passes the certification RATA (Note - while not required specifically the diluent O2 or CO2 monitor should sample at the same point as the pollutant monitor)
Point Monitors - Locate the measurement point (1) within the centroidal area of the stack or duct cross section or (2) no less than 10 meter from the stack or duct wall
Path Monitors - Locate the measurement path (1) totally within the inner area bounded by a line 10 meter from the stack or duct wall or (2) such that at least 700 percent of the path is within the inner 500 percent of the stack or duct cross-sectional area or (3) such that the path is centrally located within any part of the centroidal area
222 Flow Measurement Location
Part 75 establishes the following basic location criteria for flow monitors
The location satisfies the minimum siting criteria of Part 60 Appendix A Method 1 (ie the location is greater than or equal to eight stack or duct diameters downstream and two diameters upstream from a flow disturbance or if necessary two stack or duct diameters downstream and one-half stack or duct diameter upstream from a flow disturbance) or
The results of a flow profile study if performed are acceptable (ie there are no cyclonic (or swirling) or unacceptable stratified flow conditions) Part 75 recommends that if a flow profile study indicates unacceptable results the facility should relocate the monitor or add straightening vanes or other source modifications to correct the flow patterns
Regardless of whether these criteria are met a flow monitor can be installed in any location if the flow CEMS can meet the Part 75 performance specification requirements
223 Sampling in Stratified and Swirling Flow Conditions
Stack flow is seldom ideal and some degree of stratification and swirling flow will be present at the monitoring location Approaches to dealing with stratification swirling or cyclonic flow and changing flow profiles due to load changes are discussed below
Page 18 Part 75 Field Audit Manual ndash July 16 2003
Section 2 Part 75 CEMS Overview
Stratified Flow - Flow monitoring systems may locate a single point or path representative of the reference method determined stack flow if the stratification is fairly constant over varying loads If stratification varies with load an array of sampling points can be placed across the stack to obtain a flow average instead of one single sample point For a path monitoring system that is already averaging over a line across the stack the source can select a path that is not as sensitive to the variation or can add a monitor to provide multiple paths on the cross section
Correction Factors - Part 75 allows the source to calibrate the flow monitor to the reference method flow (pre-RATA) Sources commonly use this approach to enable a flow CEMS to pass the multi-load flow RATA at a particular measurement location A flow RATA typically is performed at three loads to account for different flow profiles at changing loads The options described above for stratified flow can include application of a correction factor for stratification based on the reference method RATA values If the source conducts a test using new Methods 2F 2G or 2H (developed to account for non-parallel flow conditions and wall effects on flow measurement) calibrating to the reference method also can account for effects due to swirling Method 2 using the s-type pitot tube will be subject to bias if swirling or stratification due to wall effects or other factors are present Calibration of flow monitors relative to Method 2 under such conditions will not account for those effects
23 Extractive Gas CEMS
There are two types of extractive gas CEMS
The source level or direct extractive system extracts gas from the stack and conveys the sample to one or more analyzers These extractive systems will include filters to remove particulates and may include conditioning to remove moisture acids condensible particulates and interfering compounds In the case of a hot wet system the sample lines and analytic components of the systems are heated to prevent condensation of the stack moisture Heated lines are also required for dry systems up to the point where conditioning occurs
A dilution extractive system filters the stack sample and dilutes the stack sample with clean dry air Dilution occurs either inside the sample probe in the stack or outside of the stack usually at the stack port Dilution systems sample the gas at flow rates much smaller than those used in source level systems Using dry air to dilute the flue gas at ratios of 501 to 3001 the dew point of the diluted sample is reduced to levels where condensation will not occur in the monitoring system As a result moisture removal systems and heated sample lines may not be incorporated into the system A dilution air cleaning system however is required to clean the dilution air and remove CO2 water and any traces of the gases that are to be monitored
231 Source Level or Direct Extractive Systems
A diagram of a source level extractive system is shown in Illustration 2-3 The illustration shows both wet (heated sampling line by-passing the conditioning system) and dry systems
Part 75 Field Audit Manual ndash July 16 2003 Page 19
Part 75 CEMS Overview Section 2
2311 Sample Probe
Probes for source level extractive systems are constructed with stainless steel or Hastelloyreg tubes A coarse filter is commonly attached at the end of the probe to filter out particulate matter before it can enter into the tube Some designs place a deflector plate or cylindrical sheath around the filter to provide protection from plugging A coarse filter can also be in-line in a housing outside of the stack prior to the sample line Sometimes a combination of filters a coarse filter at the probe opening and an in-line fine filter outside of the stack are used to ensure the removal of particulate matter
Blowback or back purging is frequently used to keep the coarse filter from plugging This involves blowing pressurized air or steam back through the filter in an opposite direction to the normal stack flow The blowback occurs at regular intervals (typically from 15 minutes to 8 hours) and typically lasts for 5 to 10 seconds
Page 20 Part 75 Field Audit Manual ndash July 16 2003
Section 2 Part 75 CEMS Overview
Illustration 2-3 Typical Source Level Extractive CEMS
(Gschwandtner and Winkler 2001)
Part 75 Field Audit Manual ndash July 16 2003 Page 21
Part 75 CEMS Overview Section 2
2312 Sample Transport and Conditioning Systems
Most source level extractive systems used in Part 75 applications are dry systems which remove moisture prior to the sample pump and analyzer In a dry system the sample line from the probe to the moisture removal system is heated to prevent water condensation If the facility uses a wet system that does not remove moisture prior to the analyzer the entire length of the sample line sample pump and analyzer must be heated The sample line is usually wrapped in a tube bundle or umbilical which includes the sample lines blowback lines calibration gas lines heating elements and electric lines
Dry source level CEMS used in conjunction with a flow CEMS for Part 75 SO2 NOx
and CO2 mass measurements must also determine the moisture content of the stack gas Illustration 2-3 shows a heated wet sample line connected to a wet O2 analyzer This wet system is used in conjunction with the dry systems dry O2 analyzer to determine moisture Another alternative is to use an in-situ wet O2 analyzer with the dry extractive O2 analyzer A less common approach is to use an H2O analyzer to measure the wet sample
Moisture Removal Systems
There are two common types of moisture removal systems condensers and permeation dryers Condensers cool the gas below the dew point (using refrigerated coils or cooled jet stream condensers) and then remove the condensed liquid water from the gas stream Water removal is performed automatically to prevent filling the condensate trap and flooding the sampling line Absorption of SO2 and NO2 in the condensate is a concern so systems are designed to minimize contact time between the dried gas and liquid
Permeation dryers are constructed using Nafionreg a material that selectively allows the mass transfer of water vapor from the sample gas through the tube membrane to dry purge gas flowing in an outer tube in the opposite direction The gas entering the permeation dryer must be heated above the dew point temperature Permeation dryers avoid the problems of condensate absorption of pollutants and do not have condensate traps However the dryers can be subject to plugging problems from condensing liquids particulates or precipitates
Pumps
Diaphragm pumps and ejector pumps are the most common pumps used in extractive systems Both operate without pump lubricating oils which can cause sample contamination Both diaphragm pumps and ejector pumps can be heated and used in a hot wet system or used ahead of a conditioning system
Fine filter
Many analyzers require removal of particulate larger than 05 m so systems will usually have an additional fine filter near the analyzer inlet There are two types (1) a surface filter usually paper or other porous material which builds up a filter cake and (2) a depth filter which consists of packed fibers of quartz wool or other material
Page 22 Part 75 Field Audit Manual ndash July 16 2003
Section 2 Part 75 CEMS Overview
232 Dilution Extractive Systems
Most coal-fired units subject to Part 75 use dilution extractive systems As noted earlier dilution ratios range from 501 to 3001 A diagram of a dilution extractive CEMS is provided below showing an in-stack dilution probe unheated sample lines and pumps air cleaning subsystem calibration gases analyzers and DAHS
Illustration 2-4
Dilution Ratio = Q1 + Q2
Q2
where
Q1 = dilution air flow rate (Lmin) Q2 = sample flow rate (Lmin)
Dilution Extractive CEMS (Gschwandtner and Winkler 2001)
Part 75 Field Audit Manual ndash July 16 2003 Page 23
Part 75 CEMS Overview Section 2
The dilution of the sample can occur in the stack using a dilution probe or outside the stack using an out-of-stack dilution system Both approaches use the same operating principles A critical orifice controls the sample gas flow rate which is drawn through the orifice by creating a vacuum at the outlet of the orifice with an ejector pump As long as a sufficient vacuum is present the sample gas flow rate through the critical orifice is independent of the downstream pressure The ejector pump also called an aspirator or an eductor pump is operated by the compressed dry clean dilution air The dilution air flow through the venturi nozzle of the pump (flow rates of 1 to 10 Lmin) creates the vacuum pressure at the orifice outlet This vacuum pulls the gas sample through the orifice at rates of 50 to 500 mLmin (limited by the orifice design) and into the ejector pump where it mixes with the dilution air
2321 Dilution Probe
The in-stack dilution probe combines a sonic orifice (a glass tube drawn to a point) with an ejector pump inside the stack probe (See Illustration 2-5) The probe opening inside the stack is screened and uses a quartz wool filter to prevent particulate matter from entering the orifice Plugging has been a problem in applications with wet saturated conditions (after a wet scrubber) due to condensation that causes wetting of the filter and plugging of the orifice In some cases heated dilution probes have been successfully used where entrained water droplets are present
Illustration 2-5In-Stack Dilution Probe (adapted from Jahnke 2000)
Page 24 Part 75 Field Audit Manual ndash July 16 2003
Section 2 Part 75 CEMS Overview
Gas Density Affects
The sonic flow of stack gas through the orifice is affected by the stack gas density and viscosity which in turn are dependent on molecular weight stack pressure and temperature A change in any of these factors will affect the sonic flow and dilution ratio The primary means for addressing theses issues include
Molecular Weight Effect - Gas density changes that result from changing molecular weight are mainly due to changes in-stack moisture or CO2 concentrations These parameters do not vary much in base load units but both can be monitored and often are as part of the Part 75 CEMS With these measurements empirical corrections can be made to the dilution ratio
The molecular weight effect is also a concern in choosing calibration gases Gases used in the initial and subsequent QA tests should have a consistent molecular weight otherwise a bias can be introduced due to the molecular weight differences
Stack Pressure - Stack pressure (absolute stack pressure which includes ambient pressure and stack static pressure) can vary due to changing load or ambient conditions Stack pressure can be monitored separately with the DAHS applying pressure related correction algorithms to the CEMS data
Temperature - Temperature also can vary with load and can be monitored separately with the DAHS correcting the data as described above Temperature correction factors have been more difficult to develop however and have not worked well in situations with temperature changes greater than 50oF (Note - Calibration checks performed when the source is not operating may not provide valid results due to the temperature effect) In response some vendors heat the dilution probe -- the heated probe is the same as shown in Illustration 2-5 except electric heating coils are placed around the probe and controlled to maintain a constant temperature Another approach for stabilizing the temperature is to use an out-of-stack dilution system described in the next section
2322 Out-of-Stack Dilution System
The out-of-stack dilution system dilutes the sample outside of the stack where it is easier to maintain a constant temperature As noted earlier dilution in out-of-stack dilution systems is performed in the same manner as with in-stack dilution probes this time with a critical orifice and ejector pump Illustration 2-6 diagrams one manufacturers out-of-stack dilution system The probe in this type of system is a simple tube similar to that used in a source level system Note that these systems are also affected by the changes in gas density described above and the use of stack moisture or CO2 corrections may be necessary
Part 75 Field Audit Manual ndash July 16 2003 Page 25
Part 75 CEMS Overview Section 2
Illustration 2-6One Type of Out-of-Stack Dilution System
(Gschwandtner and Winkler 2001)
2323 Sample Transport and Dilution Air Cleaning Systems
Sample Lines
The sample line for a dilution system as in the source extractive system is often wrapped in a tube bundle or umbilical which includes the sample lines blowback lines calibration gas lines heating elements and electric lines The sampling line often does not need to be heated after the dilution air has been added but heated freeze protect lines are used in regions of the country where sub-zero temperatures may occur or if the dilution ratio is low
Dilution Air Cleaning System
The dilution air cleaning subsystem delivers dry clean pollutant-free air to the dilution probe It consists of a series of particulate and charcoal filters dryers and scrubbers which reduce CO2 NOx SO2 moisture organic compounds and other compounds in ambient air to sub-ppm levels
The dilution air is compressed air provided by the plants utilities commonly referred to as plant air or from a compressor dedicated to the CEMS In either case the compressed air enters an air cleaning subsystem where it is further cleaned and regulated If the filters and
Page 26 Part 75 Field Audit Manual ndash July 16 2003
Section 2 Part 75 CEMS Overview
scrubbers are changed regularly and there are no leaks in the subsystem the dilution air will be dry clean and free of contaminants including CO2
The flow of pressurized dilution air through the ejector pump moves the sample to the analyzers so a separate pump is not required The dilution air pressure should be held relatively constant because changes in the pressure will affect the dilution ratio Some systems include mass flow controllers to maintain the dilution flow rate at a constant level
233 Calibration Gas System
Part 75 quality assurance requirements include daily calibration error tests and linearity tests (usually quarterly) which challenge the extractive gas CEMS with calibration gases of known concentrations The calibration gases used in the tests include a zero level gas as well as low mid and high concentration levels based on the span of the monitor The calibration gas system consists of calibration gases gas regulators valves and line filters The gases must meet the criteria specified in Part 75 Appendix A sect 51
Calibration gases for the daily calibration error test and linearity tests are injected as close as possible to the probe (Part 75 App A sect 221) The calibration gas system must include controls to ensure that calibration gases are injected at the same flow rate pressure and temperature as the sample gas under normal system operation
There are two common injection locations for source level extractive systems (1) the calibration gas is injected into the in-stack probe external filter housing and is drawn into the sampling system or (2) the calibration gas may be injected into an internal filter housing between the probe and sample line at the stack flange In dilution extractive systems the calibration gas must be injected into the dilution probe housing with the calibration gas drawn through the sonic orifice In an out-of-stack dilution system the calibration is injected prior to the inlet of the critical orifice
Calibration gases are also sometimes injected at the analyzers when performing certain diagnostic tests or calibration adjustments
234 Analyzers
Gas analysis methods for extractive systems can be divided into four major categories Those categories with common Part 75 applications are shown in Table 2-1 and are briefly described below More detailed discussion of analyzer operating principles are available in the references listed in Section 27 The CEMS designer will choose the analytical method based on the overall system design (eg dilution extractive versus source-level extractive wet versus dry systems) In source level extractive systems the gas analyzers measure at stack concentrations in the ppm range while in the dilution extractive system gas analyzers read in the ppm or ppb range similar to those of ambient monitors
Part 75 Field Audit Manual ndash July 16 2003 Page 27
Part 75 CEMS Overview Section 2
Table 2-1Common Extractive Gas CEM Analytical Methods
Techniques Gas Measured
Absorption Spectroscopic Methods
Non-Dispersive Infrared (NDIR) SO2 NO CO2 H2O
Gas Filter Cell Correlation (GFCIR) SO2 NO CO2 H2O
Differential Absorption (UV) or (IR) SO2 NO CO2
Luminescence Spectroscopic Methods
Chemiluminescence NO NOx
Fluorescence SO2
Electro-Analytical Methods
Electrocatalysis O2
Paramagnetic Techniques
Magnetodynamic O2
Thermomagnetic O2
2341 Absorption Spectroscopy
Absorption spectroscopic methods measure the amount of light absorbed by a pollutant molecule The analyzer has four main components (1) radiation source to produce the light in the desired range of the spectrum (2) spectral limiters which further reduce the band width of the light to specific wave lengths (3) detectors which measure the light energy (4) optical components which direct and focus the light and (5) components to correct for interfering gases and drift (eg a reference gas cell)
Non-Dispersive Infrared (NDIR)
Non-Dispersive Infrared (NDIR) monitors are commonly used to measure CO2 in dilution extractive systems The analyzer measures the degree of absorption of infrared light by molecules in the sample gas compared to a reference cell containing gas that does not absorb infrared light in the wavelengths used by the instrument The ratio of the detector signals from the two cells is used to determine the light transmittance which is related to the CO2
concentration using calibration curves developed with known gas quantities The monitors are called non-dispersive because filters are used to narrow (not disperse) the infrared wavelength to a small range centered on the absorption peak of the molecule of interest
Gas Filter Cell Correlation (GFCIR)
Gas Filter Cell Infrared analyzers use a variation of the NDIR technique by using a reference cell that contains 100 percent concentration of the pollutant measured instead of 0 percent The reference cell will remove most of the light at the infrared wavelength absorbed
Page 28 Part 75 Field Audit Manual ndash July 16 2003
Section 2 Part 75 CEMS Overview
by the compound of interest This method is more commonly used in in-situ applications but is used in extractive systems
Differential Absorption
Differential Absorption analyzers perform measurements at two different light frequencies One frequency is absorbed by the target molecule while the other reference frequency is not The ratio of the absorption at the two wavelengths is correlated to the target gas concentration Again calibration curves are created using known gas concentrations Part 75 sources use UV non-dispersive photometers for SO2 and NOx measurements These types of instruments can be used in wet extractive systems as water vapor does not absorb light very well in the UV region There are also differential absorption analyzers that use light in the infrared region particularly for CO2 in wet source-level extractive systems
A single differential absorption analyzer may also measure a number of component gases by using multiple wavelengths of light
2342 Luminescence Spectroscopy
Luminescence spectroscopic methods measure the amount of light emitted by an excited molecule Analyzers using these methods are very specific for a given molecule and are more sensitive than absorption spectroscopy or electrochemical methods As in the absorption spectroscopic methods all of the instruments use calibration curves developed from known target gas compositions to relate the measured light energy to gas concentration
Chemiluminescence
Chemiluminescence monitors are commonly used for NOx in dilution extractive systems Chemiluminescence is the emission of light produced as a result of a chemical reaction and a chemiluminescence NO - NOx monitor measures the amount of light generated by the reaction of NO with O3 This monitor uses an ozone generator to produce O3 and a catalytic converter to reduce NO2 in the sample gas to NO before reacting with O3 The monitor can measure both NO or NOx by sequencing the NO-O3 reactions First the sample gas can bypass the converter and go directly to the reaction cell measuring the NO Then after this reaction the gas goes to the converter where the NO2 is reduced to NO and sent back to the reaction chamber to measure NOx (NO and NO2) NO2 can be determined by subtracting the NO measured by the first measurement from the total NOx (NO and NO2) measured in the second step
Fluorescence
Fluorescence analyzers are used to measure SO2 in both dilution and source-level extractive systems Fluorescence occurs when a molecule absorbs light at one wavelength as a result of the absorbed energy the molecule emits light at a different wavelength The analyzer uses light (either from a continuous or pulsed infrared light source) to irradiate the gas sample The light radiated back from the sample is measured by the sensor after filtering to select a narrow bandwidth of the fluorescent radiation
Interference from quenching is a concern for both chemiluminescence and fluorescence analyzers Quenching occurs when the excited molecules collide with other molecules losing energy as a result of the collision This changes the energy state from the level caused by the
Part 75 Field Audit Manual ndash July 16 2003 Page 29
Part 75 CEMS Overview Section 2
analyzer chemical reaction or irradiation For example in a fluorescence analyzer the excited SO2 molecule in the gas sample might collide with another molecule changing its energy state from what it would have been due to the analyzer irradiation This can be a problem if the stack gas composition changes as different molecules have different quenching affects It is also a problem if the calibration gas background concentrations change (single blend - multiblend calibration gases)
Quenching effects can be limited by using dilution extractive systems which will result in a constant background composition (the dilution air) Fluorescence analyzers can also use ultraviolet light at lower wavelengths to shorten the fluorescence time to reduce quenching probabilities Chemiluminescence systems can increase the O3 flow into the reaction chamber to provide a more constant background concentration
2343 Electro-Analytical Methods
The zirconium oxide (ZrO2) analyzer an electrocatalytic analyzer is the most common O2 analyzer used by Part 75 sources The analyzer can measure O2 on both a dry and wet basis and it is used with source level extractive systems and as an in-situ monitor
This analyzer uses a heated ceramic material (ZrO2) with a thin platinum catalytic coating as a solid electrolyte which allows the transfer of oxygen from the reference side of the cell (maintained at 21 percent O2) to the sample side (continual flow of stack gas with lower O2
concentrations eg 3 - 6 percent) The sample O2 concentration can be determined by measuring the electromotive force of the O2 transfer combined with a stable cell temperature and reference cell partial O2 pressure
The ZrO2 electolyte is heated to 850 oC At that temperature O-2 ions catalyzed by the platinum can move through the material Combustibles materials in the stack gas sample (CO hydrocarbons) can burn at the operating temperatures of the analyzer consuming sample gas O2 The combustible concentrations however are in much lower concentrations (ppm) than the O2 and have a negligible impact on O2 measured on a percentage basis
2344 Paramagnetic Techniques
Paramagnetic techniques are also used by Part 75 sources to measure O2 Analyzers using these techniques are only used in conjunction with source level extractive systems and water and particulate matter must be removed prior to the monitor
Molecules that are attracted by a magnetic field are described as paramagnetic while those repelled are called diamagnetic Most materials are diamagnetic but O2 is paramagnetic and strongly attracted to magnetic fields compared to most other gases (though NO and NO2
are also paramagnetic and may cause interference if present at high concentrations)
Magnetodynamic
A magnetodynamic analyzer makes use of the effect that O2 has on modifying a magnets magnetic field In a dumbbell type of magnetodynamic analyzer a torsion balance dumbbell with diamagnetic glass spheres is suspended in a nonuniform magnetic field The dumbbell spheres are pushed away from the strongest part of the magnetic field Oxygen alters the field causing a change in the dumbbell position A light source mirror on the dumbbell and
Page 30 Part 75 Field Audit Manual ndash July 16 2003
Section 2 Part 75 CEMS Overview
detector measure the dumbbell position Current through a wire encircling the dumbbell creates an electromagnetic counter-torque which restores the mirror to the position when O2 is not present The amount of current required to restore the dumbbell position is related to the amount of O2 present
Thermomagnetic
Thermomagnetic analyzers are often called magnetic wind analyzers and are based on the decrease in the paramagnetic attraction of O2 with increased temperature The O2 in the sample gas is drawn into a tube with a heated coil filament and magnetic field at one end The O2 enters the tube attracted by the magnetic field As the molecules are heated the paramagnetic attraction is decreased and the heated molecules are pushed out by cooler molecules with stronger paramagnetic attraction The O2 flow through the tube creates the so called wind and cools the heating coil reducing its resistance The change in resistance is measured and related to O2 concentration The monitor can be affected by changes in the gas composition which affect thermal conductivity and the filament temperature Combustible materials can also react on the heated filament changing the resistance
24 In-Situ Gas Monitors
In-situ gas monitors are far less common at Part 75 sources In-situ monitors were initially designed for high concentration combustion gas applications not for the lower pollutant gas concentrations following pollution control devices Some in-situ analyzers also had difficulty meeting EPA certification and quality assurance requirements However in-situ monitors do have some advantages over extractive systems The monitoring system measures concentrations at stack conditions and eliminates the need for the sample transport and conditioning systems required by extractive CEMS Newer designs offer a wider range of analyzer options and virtually all point and some path systems can now be calibrated with calibration gases as required by Part 75
In-situ monitors are classified as either path or point monitoring systems (See Illustration 2-6) The in-situ point CEMS measures gas concentrations at a single point in the stack much like the single probe in a gas extractive system The term point is used when the sampling is over a short path but still much less than the stack cross-section The in-situ path CEMS measures gas concentrations over an optical path equivalent to the internal stack diameter by transmitting a light through the flue gas (single pass) and sometimes back (double pass)
Part 75 Field Audit Manual ndash July 16 2003 Page 31
Part 75 CEMS Overview Section 2
Illustration 2-7In-Situ Gas CEMS (Jahnke 1992)
241 Path In-Situ CEMS
Path in-situ CEMS use spectroscopic analytical methods to measure pollutant concentrations in the flue gas The systems have the same principle components as an absorption spectroscopic analyzer described in Section 2341 (1) radiation source to produce the light in the desired range of the spectrum (2) spectral limiters which further reduce the band width of the light to specific wave lengths (3) detectors which measure the light energy and (4) optical components which direct and focus the light In addition blowers are required to keep the optics clean of stack particulate
In a single pass system a light transmitter and detector are located on opposite ends of the light path and the light makes one pass along the measurement path A double pass system has the transmitter and light source on one end of the sample path and a retroreflector at the opposite end to reflect the light back to the detector The light makes two passes along the measurement path
242 Point In-Situ CEMS
The in-situ point CEMS typically consists of a measurement probe which contains a cavity in which the sample gas can be measured either by a sensor or by light absorption The probe opening is protected by some sort of particulate filter (ceramic sintered stainless steel or Hastelloyreg filter) The sample concentrations within the cavity adjust to changing effluent concentration via diffusion through the filter
243 In-Situ Gas Analyzers
In-situ monitors use spectroscopic and electro-analytical techniques similar to extractive systems described earlier in Section 234 In extractive system spectroscopic analyzers the light interacts with the sample within the analyzer instrument For in-situ spectroscopic analyzers the light interacts with the sample in the sample probe (point in-situ) or across the
Page 32 Part 75 Field Audit Manual ndash July 16 2003
Section 2 Part 75 CEMS Overview
stack diameter (path) Analytical methods used by in-situ gas monitors at Part 75 sources are shown below in Table 2-2
Table 2-2In-Situ Gas Analyzer Methods
Techniques Gas Measured
Absorption Spectroscopic Methods
Differential Absorption (UV) SO2 NO
Gas Filter Cell Correlation (GFCIR) CO2
Second Derivative Spectroscopy (UV) SO2 NO
Electro-Analytical Methods
Electrocatalysis O2
244 System Calibration
Daily calibration error tests and linearity tests can be performed on point in-situ gas CEMS in a manner similar to extractive gas CEMS by flooding the probe with the calibration gases QA tests for path systems are more difficult Path systems can use a flow through calibration cell that is placed in the measurement path for linearity and calibration error tests The tests must use EPA Protocol gases and the calibration cell must be located so as to challenge the entire measurement system
The system consists of a calibration cell which is a flow-through gas cell for the zero and other calibration gases and a zero mirror to reflect the light back to the detector without traveling through the stack The calibration cell should be at the same temperature and pressure as stack conditions If the flow-through cell has a length shorter than that of the sample path calibration gas at high concentrations (percent levels) may be necessary For CO2 the only way to perform the daily calibration and linearity tests is to have a flow-through cell with the same path length as the sample path
A single path system can not use a zero mirror One approach for single pass systems is to use a zero pipe combined with the flow through calibration cell The zero pipe provides an optical path not affected by the stack gas
25 Flow CEMS
There are three types of flow CEMS in use today at Part 75 sources
Differential pressure flow monitors Thermal mass flow monitors and Ultrasonic flow monitors
Part 75 Field Audit Manual ndash July 16 2003 Page 33
Part 75 CEMS Overview Section 2
All of the flow monitors are in-situ monitors determining flow on a wet basis based on dynamic measurements of parameters that can be related to the stack velocity at a point or along a path within the stack
251 Sampling Location
As noted earlier in Section 22 the measurement location must provide a representative volumetric flow over all operating conditions Stratified flow profiles cyclonic flow and flow profiles that change with load all can impact the choice of measurement location Multiple measurement points or paths and the use of correction factors to calibrate the flow CEMS to the reference method (pre-RATA) may be required to meet the location requirements in Appendix A sect 12
252 Differential Pressure
Flow Monitors
Factors Affecting Flow Data Accuracy
Representative sampling points Sensormonitor accuracy and stability
(performance specifications in Appendix A sect 33)
Accuracy of secondary parameter values (gas temperature measurement path length)
Accurate duct dimensions (area calculation)
Proper calibration
Differential pressure monitors sense the difference between the impact and wake pressures at tube openings (pitot tubes or multi-point tubes) in the gas flow and a differential pressure transducer converts the pressure signals into electric current ifferential pressure is the difference between the impact and wake pressures e differential pressure is combined with stack gas temperature stack pressure and molecular weight to determine velocity using the pitot equation below olumetric flow is calculated by multiplying velocity by the stack or duct cross sectional area
where vs = stack gas velocity Kp = dimensionless constant Cp = pitot tube coefficient p = velocity pressure Ts(abs) = absolute temperature of the stack gas Ps = absolute pressure of the stack gas Ms = molecular weight of the stack gas
Usually the molecular weight of the flue gas and stack pressure are assumed to be constants and are not measured Temperature measurements are made either with a thermocouple or resistence temperature device (RTD) The temperature probe should also be placed in a location representative of the stack flow profile
The dTh
V
Page 34 Part 75 Field Audit Manual ndash July 16 2003
Section 2 Part 75 CEMS Overview
The flow CEMS differential pressure probe may measure at one point in the stack or at multiple points using a multi-point averaging probe or multiple pitot tube assembly (See Illustration 2-7)
Differential pressure monitors are sensitive to non-parallel or swirling flow If the flow is at an angle to the stack center line there will be a bias in the velocity measurement The bias is usually positive
Illustration 2-8 Example of Multiple Probe Locations (Jahnke 1994)
Quality Assurance Issues
Probe and line plugging is minimized by intermittently back purging the line and probe openings with clean air Back purging is required as a daily interference check (Part 75 Appendix A sect 2222) and prevents extreme plugging in most situations Daily calibration error tests are performed after the probe and test the pressure transducer and system electronics The pressure side of the probe or transducer is pressurized to a pre-set level to check the span and then both inputs are equalized to test the zero level Because probes are subject to corrosion and abrasion they should be visually inspected periodically in addition to these tests Part 75 requires a quarterly leak check of all sample lines for a differential pressure flow monitor
253 Thermal Mass Flow Monitors
Thermal mass flow monitors are based on the principle of thermal heat transfer due to convection Gas flowing across a heated surface tends to cool the surface The molecules of the flowing gas interact with the heated boundary layer surrounding the surface and remove heat The greater the flow rate the more heat is removed There are two types of sensors used by thermal flow monitors the constant power anemometer and the constant temperature anemometer
Both types of anemometers use two RTDs one heated and the other unheated The RTDs are usually protected by a stainless steel tube and mounted together in the stack The constant power anemometer measures the temperature difference between the RTDs at a constant current The temperature difference responds proportionally to changes in velocity The temperature difference will be high at low velocities (less cooling of the heated RTD) and
Part 75 Field Audit Manual ndash July 16 2003 Page 35
Part 75 CEMS Overview Section 2
low at high velocities (more cooling of the heated RTD) The constant temperature anemometer maintains a constant temperature difference between the RTDs by varying the current The change in current is proportional to the change in gas velocity The higher the velocity the higher the current required to maintain the heated RTD temperature conversely at lower velocities a lower current is required
The sensors can be placed at a single point if the flow profile or in a multiple point array depending on flow conditions
Illustration 2-9Thermal Mass Flow Monitor Probe (adapted from Jahnke 1992)
(Th = Temperature of Heated RTD Ta = Temperature of Unheated RTD)
The output from a thermal flow monitor (an empirical function dependent on the measured temperature difference gas composition and power to the anemometers) is proportional to mass flow Information on the flue gas density is required to convert mass flow to volumetric flow The gas density is dependent on fuel gas composition so changes in moisture or CO2 can affect the systems response
f(heat loss) f(Tv - Ts) = vsAs
where vs
f(Tv - Ts) Tv
Ts
As
= stack gas velocity= heat loss function= temperature of velocity sensor= stack temperature= gas density= stack cross sectional area
Thermal flow monitors can not be used in locations where there are entrained water droplets The water droplets evaporate on the sensor causing a dramatic temperature loss due to the heat of evaporation which would be interpreted as caused by the flowing gas Corrosion and particulate build up on the sensors can be a problem
Page 36 Part 75 Field Audit Manual ndash July 16 2003
Section 2 Part 75 CEMS Overview
Daily Interference and Calibration Error Tests
The daily interference test check requires a means to ensure on a daily basis that the probe is sufficiently clean to prevent interference (Part 75 Appendix A sect 2222) The sensors are usually cleaned by self heating at temperatures of 700oF or higher to burn off any adhering particles or chemical compounds Daily calibration error tests check that the sensors are operational and that the system electronics are functioning correctly
254 Ultrasonic Flow Monitor
Ultrasonic flow monitors measure the time required for an ultrasonic pulse to travel across a stack or duct at an angle to the stack flow The monitors are also called transit time monitors The monitor consists of downstream and upstream transducers located opposite of each other on the stack wall which send and receive ultrasonic pulses The difference in the time that it takes for the pulse to go in the different directions between the two transducers (the time it takes to go downstream is shorter than the time to go upstream) and the distance traveled are used to calculate velocity The equation for an ideal flow profile is shown below
where va = average velocity of the flue gas L = distance between the transducers = angle of inclination t1 = traverse time in upstream direction t2 = traverse time in downstream direction
The most common angle of inclination or path angle between the transducers at Part 75 sources is 45o Other angles are possible and various designs and approaches are used to optimize signal recognition for better transmission reception reliability and accuracy
Illustration 2-10 Ultrasonic Flow Monitor
Part 75 Field Audit Manual ndash July 16 2003 Page 37
Part 75 CEMS Overview Section 2
The velocity of the sound pulse through the stack gas is affected by the stack gas density so changes in the stack temperature due to load changes andor temperature variations across the sonic path will affect the flow measurement In some cases correction factors can be developed using the pre-RATA testing to account for these changes
Non-parallel flow will also affect the ultrasonic monitor measurements If the angle or pitch of the non-parallel flow is in the same direction from the stack center line as the measurement path inclination the flow measurement will have a positive bias The flow measurement will have a negative bias if the flow pitch angle and inclination angle are in opposite directions Two ultrasonic monitors measuring along different path cross sections (an x-pattern) can be used in situations with a stratified flow profile that varies with load One path is usually sufficient if the stratification is stable
Daily Interference and Calibration Error Tests
Part 75 requires a means to ensure on at least a daily basis that the probe remains sufficiently clean to prevent interference (Part 75 Appendix A sect 2222) Blowers are provided to keep the sensors clean much like on an opacity monitor The blower air is heated to the temperature of the flue gas to prevent condensation which may damage the transducer Daily calibrations of this type of flow CEMS are indirect The electronic calibration process verifies that the upstream and downstream sensors are working in both the transmitting and receiving modes The procedure also verifies that the signal to noise ratio is acceptable
26 Data Acquisition and Handling System (DAHS)
The term data acquisition and handling system (DAHS) refers to the CEMS hardware and software components that take the output from the analyzers combine it with other information and compute hourly emissions The DAHS acquires and stores the necessary data (Part 75 requires that the DAHS automatically record all emissions data and the daily calibration error checks - Appendix A sect 4) It also computes the emissions and quality assurance test results in terms of the regulatory requirements displays the data and produces the quarterly reports required by Part 75 The DAHS software for Part 75 is highly specialized to match the electronic data reporting (EDR) format
In addition to a DAHS a CEMS requires softwarehardware components for system control functions These functions include automatic calibration probe blowback analyzer sequencing for time-shared analyzers error detection diagnostic routines and similar tasks
261 CEMS Computer Systems
In general there are two approaches for a CEMS computer system In one approach a single computer handles both the CEMS control functions and the DAHS functions In the other there is a separate control system that handles the CEMS functions and may manipulate data as an interface between the analyzers and a separate DAHS computer Because of the complexity of the control and DAHS functions in Part 75 CEMS it is more typical to have separate systems for control and data acquisition and handling
System control hardware options include computers programmable logic controllers (PLCs) data loggers and embedded microprocessors Besides providing CEMS control
Page 38 Part 75 Field Audit Manual ndash July 16 2003
Section 2 Part 75 CEMS Overview
functions described above controllers also can provide some analyzer data processing prior to the DAHS These may include converting analog data to digital and performing some of the automatic correction calculations and emission calculations
The DAHS computer is most often a stand alone personal computer although some plants are using the plants distributive control system (DCS)
262 Emissions Data Processing
The analyzers may send digital signals directly to the DAHS or send analog signals that must be converted to a digital value and scaled The real time second-to-second data is first averaged (1-15 minutes) by the analyzer control interface or DAHS Corrections may be applied to the data (eg pressuretemperature compensation molecular weight flow and moisture monitoring polynomials sonic velocity correction factors NOx quenching correction factors and dilution ratio settings) and the data then converted to the proper units for the Part 75 formula calculations
The data must be averaged again to one-hour averages as required by Part 75 A valid measurement must be recorded in each quadrant of the hour except when performing required Part 75 QA testing (eg a daily calibration or quarterly linearity test) For hours in which Part 75 QA testing is performed only two quadrants of the hour need to be captured (sect 7510(d)(1)) The hourly data are then used to calculate the Part 75 emissions parameters and rates based on formulas in Part 75 Appendices D - G with the CEMS-based formulas in Appendix F A table of the required formulas is provided in the EDR v22 Reporting Instructions (August 2002)
263 QA Test Data Processing
As noted previously Part 75 requires automatic data capture and calculation of daily calibration error test results Other QA test data and results may be entered manually Automatic and manual data entry for a Part 75 DAHS are discussed further in Section 46 of this manual and in Section IIC3 of the EDR v22 Reporting Instructions
Some CEMS use the daily calibration error test results to automatically correct the analyzer data These mathematical adjustments are similar to an internal bias adjustment factor in that the DAHS evaluates the response in comparison to the reference value and assigns from that time forward an adjustment factor which is used to adjust the data for reporting
264 Part 75 Reporting
The DAHS generates the quarterly electronic data report (EDR) submitted by the source to EPAs Clean Air Markets Division The EDR is in ASCII text format with each line representing a separate record which includes plant and unit information monitoring plan information hourly monitoring data and QA test results The reports are sent directly to EPA by electronic data transfer There is more discussion of the EDR in Section 311 of this manual
Part 75 Field Audit Manual ndash July 16 2003 Page 39
Part 75 CEMS Overview Section 2
27 References
Gschwandtner G and Winkler J (2001) US EPA Acid Rain Program Continuous Emissions Monitoring Systems Reference Manual US Environmental Protection Agency Acid Rain Division
Jahnke J A (1992) APTI Course 474 Continuous Emissions Monitoring Systems Student Manual (Revised) US Environmental Protection Agency Office of Air Quality and Planning Standards
Jahnke J A (1994) An Operators Guide to Eliminating Bias in CEM Systems US Environmental Protection Agency Office of Air and Radiation EPA 430-R-94-016
Jahnke J A and Peeler J W (1997) Handbook Continuous Emission Monitoring Systems for Non-Criteria Pollutants US Environmental Protection Agency Office of Research and Development EPA625R-97001
Jahnke J A (2000) Continuous Emission Monitoring Second Edition John Wiley amp Sons Inc
Shigehara R T and Peeler J W (1998) Evaluation of Daily Calibration Techniques of Continuous Flow Monitoring Systems US Environmental Protection Agency Acid Rain Division
Page 40 Part 75 Field Audit Manual ndash July 16 2003
Section 3 Audit Preparation
Section 3 covers the data that are available to help you prepare for the field audit and explains how to use that data eparing for the audit can increase your efficiency by allowing you to target issues for auditing while at the plant lso gain credibility with plant personnel if you come prepared ection emphasizes the use of the MDC software to review quarterly electronic data
PrYou a
This s
31 Using Part 75 Electronic Data to Conduct Pre-Audit Reviews
You will have available two types of source file information in preparing for a Part 75 field audit Hardcopy file information may include correspondence petition responses portions of the monitoring plan (such as system diagrams) reports of previous inspections or audits performance test reports and permits This type of information may be similar to background file information available for other types of air compliance inspections and audits
The second type of information is the quarterly electronic report required under Part 75 This wealth of electronic data generally is not available under other programs and provides a valuable resource that you can use prior to the plant visit to conduct monitoring checks and to identify potential source monitoring problems The electronic information includes data on the units monitoring plan certification and recertification events QA tests and emissions and operating data for each hour of the quarter
This section first introduces you to the quarterly Electronic Data Report (EDR) The section then describes how to review reports that EPA sends to affected sources to provide feedback on each EDR submitted Finally the section focuses on how to use EPAs Monitoring Data Checking (MDC) software to review EDRs
The format and volume of the electronic data can be daunting at first especially for inspectors who have responsibilities for multiple air programs The MDC software will be a vital asset to help you access and analyze the EDR and you should ensure that you take advantage of this tool as you prepare for an audit
311 Quarterly Electronic Data Reports
A facility usually submits each Part 75 quarterly EDR on a unit basis so one facility may submit multiple EDRs each quarter In other cases one report may be submitted for all units that exhaust to a common monitored stack or other complex stack configuration The EDR is in ASCII text format with each line representing a separate record referred to as a record type or RT An example of the layout of information in a report line or record type is provided in Illustration 3-1 In this example a line of hourly NOx emission rate data (RT 320) is presented If you want to explore the structure and content of the EDR in more detail you should review the most up-to-date version of the EDR Reporting Instructions and Formats --see Section 15 for guidance on how to access the EDR guidance documents
Part 75 Field Audit Manual ndash July 16 2003 Page 41
Audit Preparation Section 3
Illustration 3-1Example EDR Data Format for Record Type 320
To show you the various data elements you will see in an EDR Illustration 3-2 below provides an example summary of the content of an EDR by record type The example is for two Acid Rain CEMS units monitored at a common stack A number of these record types like RT 320 in Illustration 3-1 above pertain to emissions or operating data that are reported for each hour of operation so a quarterly EDR will have many lines of data A quarterly EDR for a unit with a single stack may have over 20000 lines An EDR in text file format therefore may look overwhelming but the MDC software tool allows you to streamline your review and analysis of the data
Page 42 Part 75 Field Audit Manual ndash July 16 2003
Section 3 Audit Preparation
Illustration 3-2Example Summary Of Quarterly Report Content For Two Acid Rain
CEMS Units Emitting Through Common Stack
FACILITY INFORMATION Type 100 Record (Facility and report data)
Type 102 Record (Facility information)
COMMON STACK FOR UNITS 1 amp 2 Type 200 Records (SO2 concentration data by date and hour)
Type 201 Records (NOx concentration data by date and hour)
Type 202 Records (CO2 concentration data by date and hour)
Type 210 Records (Diluent data by date and hour)
Type 220 Records (Volumetric flow data by date and hour)
Type 230 Records (Daily calibration test data by date and hour)
Type 231 Records (Flow interference data by date and hour)
Type 300 Records (Stack operating parameters by date and hour)
Type 301 Record (Quarterly and cumulative emission data)
Type 310 Records (SO2 mass emissions data by date and hour)
Type 320 Records (NOx emission rate data by date and hour)
Type 330 Records (CO2 mass emissions data by date and hour)
Type 503 Records (For Unit 1 (Common stack definition table)) (For Unit 2 (Common stack definition table))
Type 510 Records (Monitoring systemsanalytical components table)
Type 520 Records (Formula table)
Type 530 Records (Span table)
Type 535 Records (Stack operating load data)
Type 536 Record (Range of Operation normal load and load usage)
Type 556 Records (Monitoring system recertification events)
Type 601 Records (Quarterly linearity test data) Type 602 Records (Quarterly linearity check results)
Type 603 Records (Flow quarterly leak check results)
Type 605 Records (Reference data for flow-to-load ratio or GHR evaluation)
Type 606 Records (Quarterly flow-to-load or GHR check)
Type 610 Records (RATA and bias test data)
Type 611 Records (RATA and bias test results)
Type 623 Records (On-lineOff-line calibration demonstration)
Type 699 Record (QA test extension claim based on grace period)
UNIT 1 (MONITORED AT COMMON STACK) Type 300 Records (Unit operating parameters by date and hour)
Type 301 Record (Quarterly and cumulative emission data)
Type 504 Record (Unit information)
Type 505 Record (Unitprogram information)
Type 585 Records (Monitoring methodology information)
Type 586 Record (Control equipment information)
Type 587 Record (Unit fuel type)
UNIT 2 (MONITORED AT COMMON STACK) Type 300 Records (Unit operating parameters by date and hour)
Type 301 Record (Quarterly and cumulative emission data)
Type 504 Record (Unit definition table)
Type 505 Record (Unitprogram information)
Type 585 Records (Monitoring methodology information)
Type 586 Record (Control equipment information)
Type 587 Record (Unit fuel type)
CERTIFICATIONS Type 900 Records (Certification electronic signature)
Type 901 Records (Certification statement)
Type 999 Record (Contact person information)
Part 75 Field Audit Manual ndash July 16 2003 Page 43
Audit Preparation Section 3
312 Quarterly Feedback Reports
CAMD conducts two separate automated reviews of each quarterly EDR submission The first is generated by the Emission Tracking System (ETS) as instant feedback when the source submits the file to the EPA mainframe This instant ETS feedback provides the EPA Status Code which indicates whether the file was accepted and whether any errors were identified Certain errors are considered critical and necessitate a resubmission of a corrected file Other errors are considered informational and should be corrected by the source in future quarters but need not necessarily be addressed immediately Any errors that are identified are listed in the ETS feedback report with the relevant error code description number of hours and identification of the first hour in which the error occurred ETS checks include recalculations of hourly and cumulative emission values as well as range checks for acceptable values and codes in various fields
As part of preparing for a field audit you can download the ETS feedback report from the EPA mainframe (if you have access rights) or you can request a copy of the feedback from your CAMD contact If errors were identified on the latest ETS feedback you should review this report with the source during the on-site inspection and verify that the source has corrected those errors
The second automated review is generated by the Monitoring Data Checking (MDC) software and is sent by email to a facilitys Designated Representative shortly after the quarterly EDR submission period The MDC feedback consists of monitoring plan and QA test data evaluations As with the ETS errors certain MDC errors are considered critical and must be corrected by a resubmission of the quarterly file Note that since MDC is available to sources to download from the CAMD website they can run these same evaluations on their quarterly files prior to submission The MDC software is discussed in more detail in the following sections with guidance on how you can use the software to prepare for the plant visit
313 Using MDC to Prepare
for an Audit Key Checks Using MDC to Prepare
for the Field Audit
bull Print a copy of the monitoring plan report to take with you to the plant
bull Evaluate QA Test results (eg linearity RATA flow-to-load) and check for duplicate tests Identify if the source has claimed an exemption or grace period
bull Print and review recertification reports Also print missing data reports if available
bull Check hourly emissions calculations and missing data periods using the MDC Hourly feature
3131 MDC Overview
EPA developed the MDC software to allow affected sources State agencies and EPA staff to enter analyze print and export electronic monitoring plan certification and quality assurance data and to evaluate hourly emissions data for Part 75 monitoring The software also allows industry users to submit monitoring plan and certification data to EPA through standard electronic data transfer protocols
Page 44 Part 75 Field Audit Manual ndash July 16 2003
Section 3 Audit Preparation
To prepare for an audit you can use MDC to perform the following tasks in reviewing the quarterly EDR data
View monitoring plan QA test extensionexemption and compliance certification records directly on screen
Evaluate monitoring plans quality assurance tests and extensionexemption records
Print out reports of monitoring plans QA test data or evaluations
Analyze hourly data with the MDC Hourly data module
Analyze view and chart hourly data records for SO2 CO2 O2 NOx and heat input Also calculate and display summary data for daily monthly and quarterly time periods
Check hourly emissions calculations (MDC relies on the calculation procedures identified in a units monitoring plan together with RATA test data for these calculations) You can also calculate cumulative emissions from the hourly data to compare to the quarterly and annual values that the source reports in the EDR (see RTs 301 and 307)
Check to determine the quality assurance status (with respect to RATAs and linearity tests) of measurements reported for specific hours and monitors (MDC uses the ongoing reported quality assurance test data and extensionexemption records for this analysis)
Archive hourly data calculations and QA status for quick retrieval
Use a utility in MDC to modify parameter tolerances for comparisons of reported versus calculated hourly emissions
The following subsections address these uses in greater detail
3132 Getting Started with MDC
The most current version of MDC along with instructions and training materials are available on CAMDs website Once you obtain MDC and install it on your computer the next step is to import recent EDRs for the units to be audited You will need first to obtain the quarterly EDRs which can be downloaded from CAMDs website or received on a CD from CAMD
Obtaining MDC Software
EPAs MDC Software and supporting information can be downloaded at wwwepagovairmarketsmonitoringmdc
The EDR files should be saved in the data folder of the MDC directory You may need as many as four quarters of the most recent EDRs for the units and may need to go back additional quarters depending on when the most recent RATA was performed QA tests are included in the EDR for the quarter during which the tests were performed
Part 75 Field Audit Manual ndash July 16 2003 Page 45
Audit Preparation Section 3
3133 Review and Print Electronic Portion of Monitoring Plans
The electronic portion of a monitoring plan provides important background information The plan identifies the affected units (eg type rated capacity fuels combusted) control equipment what types of monitoring systems and components are in use monitor span values DAHS formulas missing data procedures and other information (See Table 3-1)
The plan should be printed out using the MDC reports function and brought to the plant The plan printout provides a simple template and check sheet for the plant visit For example when verifying monitor serial numbers to ensure that equipment has been properly certified you may simply check off on the printed monitoring plan each monitor system component that matches and include this as a check sheet in the audit report
Table 3-1Electronic Monitoring Plan Information
Electronic Monitoring Plan Records Description
Unit Operation Information (RT 504) Unit ID Boiler Type Maximum Heat Input Areas at Flow Monitor and Stack Exit
Monitoring SystemsAnalytical (RT 510) Components
System Parameter and ID Component ID Type Sample Method Manufacturer Model Serial Number
Emission Formulas (RT 520) Parameter Formula Code Formula
Span Values (RT 530) Parameter Scale MPCMECMPF Max NOx Rate Span Value Full-Scale Range Units of Measure
Load Range (RT 535) Maximum Hourly Load
Range of Operation (RT 536) Upper and Lower Bounds of Operating Range Most Frequently Used Loads Normal Load
Monitoring Methodologies (RT 585) Parameter Methodology Fuel Type Missing Data Approach
Control Information (RT 586) Parameter Type of Control Control Dates
Fuel Type (RT 587) PrimarySecondary Fuels
Fuel Flow Meter Data (Appendix D) (RT 540)
Parameter Fuel Type Maximum Fuel Flow Initial Accuracy Test Method
Fuel Usage Qualification (Appendix E) (RT 507)
Capacity or Gas Usage Qualification Type Method
NOx Correlation Segments (Appendix E) (RT 560)
Test Date Test Number Operating Level Segment Heat Input NOx Rate Fuel Type
Page 46 Part 75 Field Audit Manual ndash July 16 2003
Section 3 Audit Preparation
3134 ts Exemptions and Extensions
The MDC program evaluates QA test data and provides detailed test reports u can view a list of the QA tests (linearity flow-to-load and RATAs) -- as well as any test grace periods and exemptions -- in the EDRs that you have imported into MDC by selecting Certification and QA Tests or Test Extensions and Exemptions from the Edit or Report pull down menus
QA Tests
MDC will evaluate QA test data and provide brief error messages if errors are found For example low medium and high gas levels are compared to the instrument span to determine if the linearity was performed at the appropriate levels The program also will re-calculate linearity and RATA results including RATA bias adjustment factors (BAF) These are the same evaluations that are performed by CAMD at the end of each quarter described above in Section 312
If you have not received a copy of CAMDs evaluation you should run QA test evaluations of all the QA tests performed in the quarters you have downloaded ke a note of errors also you can print out specific pages of the MDC evaluation report for follow up with the plant during the audit visit
In addition to the test evaluations you will want to view the list of QA tests performed by the source to see if a particular QA test (RATA or linearity) has been repeated in a quarter This would indicate a failed or aborted test that might be due to CEMS problems You should investigate these failedaborted tests during the plant visit to find out what adjustments (if any) were made to the system and why they were necessary rform this check view the list of QA tests for a source by using the Edit pull down menu in MDC An example is shown in Illustration 3-3 where the SO2 linearity test has been repeated multiple times for a unit during the second quarter of 2000
Part 75 QA Tests
In the context of Part 75 and this manual QA tests refer to quality assurance tests required by the rule The primary tests for electronic data evaluation using MDC are
bull Linearity Tests bull Relative Accuracy Test Audits
(RATAs) bull Flow-to-Load Tests
QA Tes
Yo
Ma
To pe
Part 75 Field Audit Manual ndash July 16 2003 Page 47
Audit Preparation Section 3
Illustration 3-3 MDC Screen Showing Multiple Linearity Tests in One Quarter
You should also print out copies of a number of RATA and linearity test reports to bring with you to the plant so that you may compare the results reported in the quarterly EDR to on-site test report records You should perform this check (see Section 46) to ensure that the source properly transferred QA test data not automatically recorded by a CEMS to the CEMS data acquisition and handling system (DAHS)
Extensions and Exemptions
The Part 75 rule allows for the extension of QA test deadlines and in some cases exemptions from QA test requirements based on specific unit circumstances Test extensions are available for RATAs and quarterly Appendix D fuel flowmeter accuracy tests There is also a general grace period extension for all quarterly QA tests and RATAs which allows time in which to complete the testing for a short period after the end-of-quarter deadline
Exemptions are available from the multi-load flow RATA requirement (flow RATA may be allowed at a single operating level) SO2 RATA requirement (for units burning a low sulfur fuel) and the requirement to perform a single load RATA at normal load In addition quarterly QA test exemptions are available for linearity tests leak checks and flow-to-load ratio tests in any quarter which does not qualify as a QA operating quarter (a QA operating quarter has at least 168 hours of stack or unit operation) Quarterly QA test exemptions are also available for linearity tests of one range of a dual range monitor (range not used in the quarter) linearity tests of SO2 or NOx monitors with spans of 30 ppm or less and flow-to-load ratio tests for
Page 48 Part 75 Field Audit Manual ndash July 16 2003
Section 3 Audit Preparation
complex stack configurations that have been approved by petition The EDR v22 Instructions (see sections that discuss RT 695 - RT 699) provide useful background descriptions of the available extensions and exemptions and qualification requirements A link to the EDR Instructions is provided in Section 15 of this manual
You can use MDC to determine whether the source has claimed any extensions or exemptions Select Test Extensions and Exemptions from MDCs Report pull down menu Then run an evaluation report for all of the extensions and exemptions to determine if there are any errors that require follow-up during the field audit
Extension and Exemption Record Types
bull RT 695 Single-Load Flow Rata Claim bull RT 696 owmeter Accuracy Test
Extension bull RT 697 RATA Extension or
Exemption bull RT 698 arterly QA Test Exemption
Fuel Fl
Qu
A common test exemption is the use of a 1-load level RATA for flow RATAs Generally a 2-load test is required for QA testing At least once every 5 years a 3-load test is required for quality assurance purposes In addition a 3-load test is required for certification and recertification
There are also a few situations in which a 1-load test is allowed without a special exemption (1) peaking units and bypass stacks automatically qualify (2) a source that conducts flow RATAs on a semiannual basis can alternate between a 2-load and 1-load test and (3) cement kilns and other non-load based units can conduct tests at a single level if representative of normal operations For other sources to qualify to use a 1-load level flow RATA the source must submit the results of the single load analysis required by Appendix B sect 2313(c) in RT 695 Check to make sure that flow RATAs were performed at multiple loads (or that a unit otherwise qualified for a single load test) if the MDC exemption report indicates that the source did not report RT 695
Table 3-2Summary of MDC QA Test Checks
QA Test Checks Description
QA test evaluations MDC will evaluate QA test data recalculate results and provide error messages if errors are found
Repeated QA tests Look for FailedRepeated QA Tests (multiple tests in a quarter)
Print RATA and linearity reports for comparison with on-site hardcopy data
Bring the reports to the plant to make sure the electronic data match hardcopy data or linearity tests make sure the reference cylinder gas concentrations match those on site
Extensions and grace periods Identify if the source has claimed an extension or grace period
F
(cont)
Part 75 Field Audit Manual ndash July 16 2003 Page 49
Audit Preparation Section 3
Table 3-2Summary of MDC QA Test Checks (cont)
QA Test Checks Description
Single load flow RATAs (RT 695) Check for the exemption analysis single load flow RATA claim record (RT 695) which will show the results of the single load analysis required by App B 2313(c) Make sure flow RATAs were performed at multiple load levels for units (other than peaking units) without the single load exemption request Note Non-peaking units performing RATAs semiannually can alternate between single-load and multiple-load test without requesting an exemption or reporting RT 695 Certain non-load based units (such as cement kilns) also may be exempt from multiple-level tests
3135 Recertification Events and Monitoring System Downtime Reports
Sources must report certification recertification and certain maintenance events in the quarterly EDR (RT 556) in the report for the quarter in which the event occurred The MDC report function (currently under the Reports drop down menu) can provide a printout report of recertification and maintenance events This report identifies certification recertification and maintenance events and what QA tests were required If any of these records have been reported you should print a copy of this report and bring it with you on the plant visit to compare against the plant records It is important that all monitoring components are properly certified If there have been changes to equipment proper diagnostic or recertification testing should have occurred as required by sect 7520(b) Note that MDC does not verify that all required certification recertification or diagnostic testing is included in the report EPA therefore relies on the inspector to make this verification as part of the audit
A Monitoring System Downtime or Missing Parameter Report (RT 550) may also be available though unlike the Recertification Report (RT 556) this record is optional This useful report shows the start and end time of all missing data periods by monitoring system reason for missing data and the corrective action taken You can print out a copy of this report and use the report to (1) target monitoring system problems for further investigation with plant personnel during the plant visit and (2) identify missing data periods that can be used in reviewing plant maintenance plan records or control device parameter records at the plant Alternatively if this report has not been submitted the MDC Hourly function can be used to identify missing data periods as discussed in the following section
3136 Using MDC Hourly to Check Emissions Data and Calculations
The MDC Hourly module analyzes calculates views and graphs the hourly emissions data records for SO2 CO2 O2 NOx flow and heat input It also calculates and displays summary data for daily monthly and quarterly time periods The program can analyze up to 4 quarters of calendar year data MDC Hourly was designed for use with EDR v21 Use of EDR v21 began in the second quarter of 2000
Page 50 Part 75 Field Audit Manual ndash July 16 2003
Section 3 Audit Preparation
Getting Started with MDC Hourly
In order to check the hourly calculations with MDC Hourly you will need to make sure that you have imported quarterly EDR files that include the quarter with data from the most recent pollutant and flow RATAs so that you can take full advantage of the MDC data checks If you do not import all of the historical monitoring plan and quality assurance data into MDC prior to running MDC Hourly MDC Hourly may mistake hourly data as being out of control (OOC) and will not provide any further analysis on those hours
Hourly Calculations and Error Messages
View the Detailed Emissions Data tables for the different CEMS The program recalculates emissions for each hour using the monitoring plan formula and provides an error message in the far right column if there is a discrepancy There is no need to perform the emission calculations yourself One issue is the bias adjustment factor (BAF) If a source uses the wrong BAF they could underreport emissions and undermine the integrity of the trading program This recalculation feature in MDC can assist you in spotting this problem and understand the potential magnitude of the impact on emission allowances
Error messages will also identify OOC periods which indicate that a QA test (RATA or Linearity) was expired failed or not performed MDC Hourly does not currently determine the control status of the unit with respect to daily calibrations Be careful of the out-of-control error messages you may generate when you run MDC Hourly As noted in the Getting Started discussion above you can receive these error messages if you do not import the data into MDC for the quarter in which the RATA was performed prior to running the analysis on the hourly data
Missing Data Periods
Use the filter function to identify missing data periods This is especially important if the source did not submit the optional RT 550 record described above in Section 3135 The reasons for the missing data are not provided but this information may be used to identify systems with high amounts of missing data to target during the plant visit and also to select missing data periods for an in-plant records review
Appendix D Units
For oil- or gas-fired units that use Appendix D fuel monitoring to determine heat input and SO2 emissions view and record the fuel gross caloric value (GCV) and sulfur content across quarters so that you can check these values against on-site fuel sampling and analysis results
Graphing
MDC Hourlys graphing function allows you to graph the hourly emission data as well as flow and heat input Graphing emissions data can be an invaluable tool for preparing for a field audit Graphing allows the inspector to verify that the reported emissions look reasonable for the type of unit being evaluated Abnormal emission trends can often be quickly identified and should be investigated as part of the field audit to identify if the abnormality is due to a problem with the monitoring system or to a change in the way the unit is operated An abrupt
Part 75 Field Audit Manual ndash July 16 2003 Page 51
Audit Preparation Section 3
or unusual change could indicate a modification to unit operation or the CEMS that may require recertification or diagnostic testing Consistent data with very little change (flat line) may indicate that the CEMS is not operating properly or that the unit is using a missing data routine Either situation should be investigated with the source during the on-site visit
Illustration 3-4Example MDC Hourly Graph of SO2 Concentrations
The graphing function also can be used to compare the hourly emissions or parameter (flow heat input) against the monitor span values listed in the monitoring plan You should note if the emissions or parameter exceed the relevant maximum potential concentration (MPC) maximum expected concentration (MEC) or maximum potential stack gas flow rate (MPF) The emissions should typically be between 20 and 80 percent of the monitor range identified in the monitoring plan (See Appendix A sect 21) If a majority of the emissionparameter readings are outside 20 to 80 percent of the monitoring range you should make sure that the source has performed the MPC MEC span and range checks that are required at least annually by Appendix A sect 21
Page 52 Part 75 Field Audit Manual ndash July 16 2003
Section 3 Audit Preparation
Table 3-3Summary of MDC Hourly Checks
MDC Hourly Checks Description
Check hourly calculations and error messages
Check recalculated hourly emissions for error messages which are provided for each hour in the far right column
Error messages also identify out of control periods which indicate that a QA test was failed or was not performed
Hourly error messages may need to be ignored if the most recent RATA for a parameter was not imported
Check BAFs used in hourly calculations
MDC Hourly will use the BAF in the most recent RATA to recalculate hourly emissions
Check missing data periods Use the filter function to identify missing data periods Identify systems with high amounts of missing data and to select missing data periods for in-plant records review
For oil or gas units using Appendix D note fuel GCV and sulfur content
View and record these values across quarters to check against on-site fuel sampling and analysis results
Check spans Use the graph function to compare the hourly emissions or parameter (flow heat input) against the monitor span values in the monitor plan report Follow-up with the source if emissionsparameters are higher than the span The source is required to perform a spanrange check at least annually (App A sect 21)
View graphs of data trends Use the graph function to plot emissions and flow Note any abrupt changes in the data or consistent data with no change
32 Hardcopy File Review
In addition to the electronic review of monitoring plan and quarterly report data you should also review the sources file for written correspondence and information pertaining to Part 75 monitoring These documents would include any petitions previous auditinspection reports linearity and RATA reports and the sources acid rain permit or operating permit
321 Correspondence Petitions and Previous AuditInspection Reports
Correspondence and any petitions provide background on any recent issues or unusual monitoring situations that may come up during the plant visit Previous audit or inspection reports serve the same purpose Also if a prior report identified problems that required follow-up you should confirm (either through your pre-audit review or on-site audit) that the source took appropriate corrective action
Part 75 Field Audit Manual ndash July 16 2003 Page 53
Audit Preparation Section 3
322 Linearity Test and RATA Reports
Some States require a hardcopy submittal of linearity test and RATA reports If this is the case in your State and you have access to the reports in your office you should compare the hardcopy results to those reported electronically and accessed with the MDC program as described in Sections 313 and 45 so that you will not have to conduct the comparison while at the plant You can also review the RATA test report as described in Table 3-4 The hardcopy RATA test report review should be focused on reference method documentation that can not be checked electronically (eg reference method analyzer biasdrift checks cylinder gas certifications reference method equipment calibrations traverse points etc)
Table 3-4RATA Report Review
RATA Hardcopy Review Explanation
For a NOx RATA using the instrumental method 7E is the NOx
converter efficiency documented through a performance test
The NOx converter converts NO2 to NO NO is measured by the analyzer If the NO2 concentration is greater than 5 ppm a NOx converter efficiency test (RM 20) is required
If an instrumental RM was used were cylinder gas certificates included in the test report
The calibration gas certificates should be provided in the test report and show Certified gases (EPA Protocol NIST etc see
Section 45) Concentrations which match those used in the
biasdrift check calculations Expiration date after the RATA
For instrumental methods (6C 7E 3A) were the appropriate bias and drift corrections made for the RM data
Run results are corrected for bias based on the average of the before and after bias checks
For flow reference methods is the calibration date of the pitot tube within 6 months of the RATA
The most recent calibration should have been performed within 6 months of the test
Are CEMS and RM data on same moisture basis
Make sure the comparison between the CEMS and RM are on the same basis
323 Permits
You should make sure that the source has an Acid Rain permit or NOx budget permit if required Check any relevant source specific provisions related to Part 75 monitoring in the permit and bring a copy of those provisions with you on the audit The permit conditions for Part 75 monitoring however may only list a general requirement to follow Part 75 and not be that helpful
Page 54 Part 75 Field Audit Manual ndash July 16 2003
Section 3 Audit Preparation
33 Scheduling and Coordinating the Audit
Level 2 audits require coordination with the source to obtain their schedule for performing RATA and linearity performance tests The source is required to provide written notice of the date of periodic RATAs no later than 21 days prior to the first scheduled day of testing (sect 7561(a)(5)) Written notification may be provided by mail or by facsimile and may be provided by electronic mail if the EPA Regional Office or State agency determines that electronic mail is acceptable (sect7561(a)(5)(i)) However the date can be changed and often is due to operating constraints at the plant or with the CEMS Part 75 allows performing a test on a different date as long as notice of the new date is provided as soon as practicable but no later than twenty-four (24) hours in advance of the new test date
Notice is not required prior to the quarterly linearity tests So you will need to coordinate with the facility staff to schedule your audit to coincide with a linearity test date if desired
Because the audit policy is hands-off you should review all of the inspection procedures and requirements at the time of scheduling to allow the facility the opportunity to gather the necessary information and arrange for the appropriate personnel to be available (The plant environmental contact may also not be authorized to access the CEMS) Prior knowledge of all procedures and the audit objectives will help to avoid problems and will allow the audit to proceed as planned and in a timely manner You should also check plant-specific safety requirements with the source and what safety equipment you will need
Level 1 unannounced audits of a Part 75 monitoring system are often performed as part of the overall unannounced air compliance inspection of the facility If you conduct a Level 1 audit as part of an unannounced inspection you should also go over the inspection procedures and requirements as outlined in the previous paragraph when you arrive at the facility Unannounced audits may not be as productive since the sources often rely on outside contractors or personnel from other sites to perform certain tasks It is therefore more productive to coordinate with the source before the audit to make sure that the proper personnel are present to answer any questions that might arise during the audit
34 Materials to Bring
The inspector should bring personal safety equipment (eg hard hat safety glasses safety shoes hearing protection etc) as provided by agency policy Useful materials and data sheets to bring on the field audit include
Note
Section 15 of this manual contains information to help you find related documents including regulatory text for Part 60 and Part 75 and the Parts 75 and 76 Policy Manual
MDC printout of the monitoring plan
MDC printout of linearity and RATA reports
MDC printout of recertification and missing data reports
Appropriate Part 60 reference method requirements if observing a RATA
Part 75 Field Audit Manual ndash July 16 2003 Page 55
Audit Preparation Section 3
Checklists and data entry forms (see Appendix A of this manual)
Part 75 Rule (see easy-to-use version maintained on CAMDs website)
Parts 75 and 76 Policy Manual (bring and leave in car for reference as needed)
Copy of Acid Rain permit or operating permit monitoring provisions
Page 56 Part 75 Field Audit Manual ndash July 16 2003
Section 4 On-Site CEMS Inspection
This section describes the primary on-site activities that will apply to any field audit for a Part 75 CEMS
Outline of Section 4
41 Pre-Audit Interview 42 Calibration Error Test 43 ProbeSensors Sample Lines and
Sample Conditioning Systems 44 Gas Analyzers 45 Calibration Gases 46 Flow Monitors 47 DAHS 48 Maintenance Log and Daily Checklists
Review 49 QAQC Plan Review
The field audit will consist of an initial interview (Section 41) the walk through and inspection of the various components of CEMS (Sections 42 -47) and a review of QA and maintenance records (Sections 48 and 49) If you are conducting a Level 2 audit you will also observe performance tests (Section 5) For a Level 3 audit you will conduct certain performance tests (Section 6) In each case you will complete your audit with an exit interview and final report (Section 7)
You should not consider the organization of this section as suggesting a specific order to the audit For example this section discusses conducting a walk-through visual observation of all equipment first followed by a review of the QAQC plan and recordkeeping In many audits you may go back and forth between visual observations and records review
In budgeting your time you should spend more time on items that can not be checked or verified off-site from EDR submittals or other file information In addition focus on any potential problems flagged during the pre-audit review For example focus on CEMS and time periods with the most missing data multiple failed QA tests unusual data trends or mistakes in emissions calculations If you analyzed information using MDC or MDC Hourly bring a specific list of the questions and issues based on these pre-audit activities
In conjunction with your own visual observations and records review interviews with plant staff provide important information on how the monitoring systems work and are operated as well as on compliance with Part 75 requirements You should ask the staff how they operate the equipment and perform QA activities and how the QAQC plan is used in relation to the different CEMS and quality assurance components A key auditing technique is to establish a dialogue with personnel at the source and to let them answer your questions by going through their procedures and showing you where they document the procedures
You will want to confirm that actual equipment settings monitor operations and quality assurance activities match the QAQC plan The QAQC plan is an important resource and a Part 75 requirement The QAQC plan is the document that provides detailed procedures for how the CEMS is to be operated If a source is following a complete QAQC plan that covers all of the Part 75 quality assurance requirements and the operating parameters for the monitoring systems then the data can be considered valid at all times that the system is operating within those parameters since the system is being operated as it was during the RATA If the QAQC plan is not followed or is incomplete then it is questionable whether the emissions data are of the same quality as was demonstrated during the RATA You may also
Part 75 Field Audit Manual ndash July 16 2003 Page 57
On-Site CEMS Inspection Section 4
find that the procedures currently in use are appropriate but the QAQC plan has not been updated Many of the recommended checks in this manual refer back to the QAQC plan
One critical step is to verify that the CEMS components match those in the monitoring plan If changes have been made you need to determine if the proper recertification testing or diagnostic testing has been performed Part 75 quality assurance begins with the initial certification of the CEMS and any changes since that certification need to be evaluated for their effect on CEMS data
Identifying Monitoring Hardware Recertification Issues
Recertification is required for a replacement modification or change that may significantly affect the ability of a CEMS to accurately measure monitored parameters
bull Complete System Replacement bull Analyzer Replacement bull Change in Orientation or Location of Sampling Probe or Site bull Change in Flow Monitor K factor or Polynomial
This is a key issue for audits ee Section 15 of this manual for a link to CAMDs guidance on recertification under Part 75
S
41 Pre-Audit Interview
You should conduct a pre-audit meeting when you arrive at the plant The meeting should include the plant contact the plant CEMS technician assigned to assist with the audit and may include plant management personnel At this time it is important for you to make sure the plant personnel understand the general scope of the audit and to agree upon a tentative audit schedule so that necessary personnel will be available when needed Table 4-1 identifies several items you should discuss in the interview
Page 58 Part 75 Field Audit Manual ndash July 16 2003
Section 4 On-Site CEMS Inspection
Table 4-1Pre-Audit Interview Items
Topic Purpose
Audit purpose and agenda bull Inform facility of the purpose and scope of the audit
bull Streamline subsequent activities bull Allow for meetings with necessary plant personnel
Inspection and audit techniques to be used including hands-off policy and the need for a CEMS technician
bull Streamline subsequent activities bull Identify plant contacts for different parts of the
audit
Specific areas to be observed bull Identify any constraints on visiting locations in the plant
Safety requirements bull Identify necessary safety equipment and plant safety issues
Records to be reviewed and copying needs bull Streamline subsequent activities bull Provide source an opportunity to collect information
during the other audit activities
Notify plant personnel of intent to take photographs or videos to document observed conditions
bull The inspector should ask for permission to take photographs on the plant property and explain the purpose for the photos The source can make a confidentiality claim but emission-related information is public information under the Clean Air Act You should follow your agencys policy on the treatment of confidential business information claims This is not likely to be an issue if photos or videos are limited to the CEMS components
42 Calibration Error Test
Part 75 requires a daily calibration error test This test provides a simple check of most CEMS components and can detect many but not all sources of potential error in the monitoring system
If possible you should observe routine daily calibration error tests as part of any CEMS field audit but often the tests are initiated automatically at a specific time of day Following the calibration sequence the DAHS will typically generate a calibration summary report (presenting the CEMS responses and calculated calibration error results) to record the data for each operating day Daily calibration check results are also reported electronically in the EDR
If the daily checks have occurred before you arrived at the plant review the results of the tests for that day and request the plant contact or CEMS technician to initiate a routine daily calibration test Ask for an explanation of how daily calibrations are performed how the results are used what responses will trigger adjustments and how adjustments are made The specific procedures used to conduct this calibration routine should be described in the QAQC plan available on-site Adjustments are not to be made during the calibration error test When
Part 75 Field Audit Manual ndash July 16 2003 Page 59
On-Site CEMS Inspection Section 4
adjustments are made following a calibration test another calibration error test is required after all adjustments are completed to validate that the adjustment was appropriate
The Daily Calibration Summary form included in Appendix A can be used to compile the daily calibration check data while on-site You should also request a printout from the sources DAHS and compare these values to the values you recorded from the analyzers display For each monitor
Record the gas monitor responses from the zero and upscale calibration gas injections (for dilution systems multiply the monitor data by the dilution ratio to obtain the actual concentration)
For flow monitors record the results of the electronic tests for ultrasonic and thermal flow monitors or the pressure transducer checks for differential pressure monitors
Note the start and stop times and whether the response is stable when the system records the calibration test response Also check that the time taken for the test still provides at least two valid CEMS data points per hour to meet the valid hour requirements of Part 75
Check that the calibration gas flow rates and pressure match sampling conditions
Calculate the results from the monitor data and retrieve the daily calibration error (CE) results from the daily report generated by the DAHS Compare your results to those generated by the DAHS If there is a discrepancy ask about correction factors in the DAHS such as pressure correction factors for dilution probes or similar factors
Compare the calibration error at the zero and high levels to the Part 75 data validation requirements in Appendix B sect 214(a) (see Table 4-2)
If the calibration error check is failed the data from the monitor are invalid and the monitor is out of control until it successfully passes a subsequent calibration error test Missing data routines must be used until the monitor is adjusted and successfully passes a subsequent calibration error test
Page 60 Part 75 Field Audit Manual ndash July 16 2003
Section 4 On-Site CEMS Inspection
Table 4-2 Part 75 Calibration Error Test Data Validation Requirements
Monitored Parameter Calibration Error Requirement (App B sect 214(a))
SO2 or NOx 50 of the Span Value or
5 ppm absolute value of the difference between the monitor response and the reference value if the span value of the monitor is less than 50 ppm or
10 ppm absolute value of the difference between the monitor response and the reference value if the span value of the monitor is greater than 50 ppm but less than 200 ppm
CO2 or O2 10 CO2 or O2
H2O 60 of the Span Value Moisture monitor systems composed of wet and dry O2 monitors must meet the O2 calibration error requirement of 10
Flow 60 of the span value or
002 inches of water absolute value of the difference between the monitor response and the reference value if the monitor is a differential pressure type
You should also compare the CE results you obtain to the results of the most recent automatic calibration error test that occurred earlier in the day of your audit or on previous days Previous calibration error tests usually can be brought up on the DAHS visual display screen If there is a significant shift in the CE results from that previous test ask the facility contact if they can explain the shift Were adjustments made to the monitoring system(s) that could cause the shift Does the shift indicate that adjustments are necessary
Routine adjustments of the monitor are allowed after successful calibration error tests These adjustments are to be made to bring the monitor as close as practicable to the calibration gas tag value or flow reference signal If the monitor is physically adjusted by a person a follow-up calibration error test is required to verify that the adjustment was performed properly No follow-up calibration error testing is required when only a mathematical adjustment is made automatically by the DAHS These mathematical adjustments are similar to an internal bias adjustment factor in that the DAHS evaluates the response in comparison to the reference value and assigns from that time forward an adjustment factor which is used to adjust the data for reporting If this type of adjustment is used the inspector should determine at what point the source physically adjusts the calibration of the analyzer (ie what the range of acceptable calibration error adjustment factors is) Typically sources that use the auto adjustment in this manner physically recalibrate when the mathematical adjustment exceeds 25 percent of the span The criteria that are used should be documented in the sources QAQC plan
Part 75 Field Audit Manual ndash July 16 2003 Page 61
On-Site CEMS Inspection Section 4
43 ProbeSensors Sample Lines and Sample Conditioning Systems
Most of the suggested checks of the probesensors and the sample lines do not require a visual check of the actual probesensors or lines The probesensors and sample lines may not be easily accessible and may be located in a confined space that your agencys (or the plants) safety policies prohibit you from entering Access to the gas sampling probe and flow monitor probesensors also may require climbing ladders or working at substantial heights
431 ProbeSensors
You should ensure that the probesensors are in the same location as when the unit was certifiedrecertified (as detailed in the monitoring plan) -- changes in probesensors orientation or location require recertification of a CEMS A hardcopy submittal of the monitoring plan will contain a diagram with the probesensors location A copy should have been submitted to the State agency If it is not available in your files it should be on file at the plant In addition ask how frequently the probesensors are inspected if there have been any problems (plugging for example) and if the probesensors or a component have been recently changed The change might also require recertification or diagnostic testing
Flow Monitors
In addition for flow monitors you could ask the source representative to perform a daily interference check as required by App B sect 212 or review the results of the most recent interference tests The daily interference check tests the flow monitor probe or sensors sample lines and temperature transceiver for plugging or malfunctioning
The interference test procedure should be identified in the QAQC Plan Go over the interference test procedures with the source representative and ask if there have been any recent failures and what corrective action was taken Some interference checks for various types of flow monitors are described below
Differential Pressure - Regular back purge of probe and sample lines Back purge flow or measured flow is monitored and compared to baseline values to indicate if there is a plugging problem There may also be a moisture removal system or a heated sample line
Ultrasonic - Purge air blowers may be installed to prevent particulate build up on the transceivers and purge air flow rate is monitored Units without purge air blowers can monitor signal strength to identify particulate build up
Thermal - Temperature sensors may have an auto self clean feature which heat the sensors to burn off particulate build-up and help avoid moisture condensation Another approach uses short high pressure blasts of air Interference can be tested by checking the stack temperature measured by both sensors or by comparing the sensor measurements against calibration data
Page 62 Part 75 Field Audit Manual ndash July 16 2003
Section 4 On-Site CEMS Inspection
Table 4-3ProbeSensor Check Summary
What to Check Description
All ProbeSensor Types
Is the probe in the same stack or duct location as in the monitoring plan
Visually compare probe location to location on the diagram submitted with the monitoring plan A measurement of distances from disturbances or stackduct diameter are not necessary
Has the duct or stack location been modified (Dimensions)
Ask the source representative and note during a check of CEMS maintenance logs These ductstack changes could affect CEMS measurements and may require recertification
How often are the probessensors inspected have there been problems and have the probesensors or components been changed
Ask the source and note during a check of CEMS QAQC Plan and maintenance logs
Flow Monitors
Ask the source to perform a daily interference check or review the results of the most recent interference check
Appendix B sect 212 requires a daily interference check for flow monitors Each flow monitor is to be designed to provide a means for checking interference from plugging of each sample line and sensing port and malfunction of each resistance temperature detector (RTD) transceiver or equivalent
432 Sample Lines
Extractive Gas CEMS Sample Lines
The daily calibration error test (see Section 42) provides the best check on whether gas sample line leaks are diluting the sample gas measured by the analyzer The daily calibration error test should also detect most problems from condensation However for source level extractive NOx systems that do not have an SO2 analyzer if practical you should also visually check the umbilical line as it enters the CEM shelter Look for loops or sags in the line as well as moisture droplets Because calibration gases do not have significant amounts of NO2 the daily calibration error test for a NOx monitor may not detect a negative bias from absorption of NO2 by condensed water
Differential Pressure Flow CEMS Sample Lines
Manual or automatic quarterly leak checks are required for differential pressure flow monitors (Appendix B sect 222) The test criteria are not specified by Part 75 Most often the test checks the line after the probe flange by closing the line and holding a steady pressure for a specified time Check how and when the tests were performed The test date and results (passfail) are reported in the EDRs so you can confirm the reported electronic results with on-site data If a recent test failed find out what was done to correct the problem A failed leak
Part 75 Field Audit Manual ndash July 16 2003 Page 63
On-Site CEMS Inspection Section 4
test results in out of control data until the leak is fixed and a subsequent leak check is passed (Appendix B sect 223(g))
433 Dilution Air and Gas Sample Conditioning Systems
The majority of Part 75 gas CEMS are extractive systems that transport the stack gas from the stack to an analyzer The checks described in the next two sections relate to the systems that condition the stack gas for analysis
4331 Dilution Extractive Systems
Dilution systems are frequently used for Part 75 compliance These systems dilute the stack gas with clean dry air prior to the analyzer The ratio of sample taken from the stack to dilution air is the dilution ratio and is an important parameter of a dilution system How that ratio is maintained or what mathematical compensations are made to account for changes in the ratio is important to cover during an audit
Dilution Air Ratio
The following questions may be useful for auditing dilution extractive CEMS systems
What is the dilution ratio and how is it verified This should be described in the QAQC plan
Is the dilution probe ejector pump vacuum at or below the certification value The ejector vacuum affects sample flow if it decreases below the values which creates critical flow through the orifice How often does the source check the ejector vacuum as well as the dilution air and analyzer flow settings Some systems automatically adjust the dilution air pressure from a pressure transducer signal so ask how this works Again these activities should be described in the QAQC plan
Check if any corrections are applied to the dilution ratio for changes in pressure temperature or molecular weight (See Section 2331 on gas density effects) These corrections are typically applied by the DAHS and should be described in the QAQC plan Also find out if there have been any changes in the factors since the last RATA because a RATA is required following a change in these factors
You should also ask the source if the dilution probe orifice has been changed The orifice controls the sample flow rate if the orifice has changed it may have changed the dilution ratio You can also check this during the maintenance record reviews
If the orifice has been changed ask the source if there is a procedure for doing this in the QAQC plan In addition ask what prompts making a change Replacing a dilution probe orifice with one of the same size requires diagnostic testing while replacement by a different sized orifice requires recertification Check to see that the appropriate testing has been completed
Page 64 Part 75 Field Audit Manual ndash July 16 2003
Section 4 On-Site CEMS Inspection
Dilution Air Cleaning System
The dilution air supplied to the dilution probe must be treated to remove contaminants that could interfere with the analyzers The dilution air cleaning system removes moisture CO2 particulate matter hydrocarbons and other contaminants that may be present in ambient air A good place to start is simply to ask the source representative how the system works You should also investigate maintenance practices For the air cleaning system ask the source how often the filters are changed and at what point drying agents are replaced Again this should be verified against the QAQC plan documentation You can also ask to see a copy of the filter replacement documentation in either the maintenance log or a copy of the daily checklist You can check the inlet and outlet pressures of the CO2 filter and compare to the appropriate range for the inlet and outlet pressure in the QAQC plan Find out from the source how often these pressures are checked and how these checks are documented
Table 4-4Summary of Dilution Air System Checks
What to Check Description
Has the dilution probe orifice been bull The orifice controls the sample flow rate so a change in the changed orifice will affect the dilution air ratio Ask the source
CEMS operator if the orifice has been changed since the last RATA and note maintenance records for any evidence of changes (Section 47)
bull If the orifice has been changed ask if there is a procedure for changing the orifice in the QAQC Plan what prompts a change and how is the dilution ratio verified
bull If it has been changed confirm that necessary diagnosticrecertification testing was performed
Is the dilution probe ejector pump vacuum at or below the certification value
bull Ask the CEMS operator how often they check the ejector vacuum as well as the dilution air and analyzer flow settings and ask whether the values are recorded and what are the proper settings
bull Also ask the operator to show that the pressure gauges or rotameters are set in accordance with the QAQC plan and ask how often the values are verified and documented
Are the dilution ratio and dilution air and analyzer flow settings properly set
Are correction factors applied to the dilution ratio for changes in pressure temperature or molecular weight ve these been changed since the last RATA
bull Some systems apply correction factors to the dilution ratio to account for changes in gas density nges to the correction factors should be recorded in the maintenance log and the QAQC plan should outline the procedures for changing the correction factors TA should be performed following any change
Ha
Cha
A RA
(cont)
Part 75 Field Audit Manual ndash July 16 2003 Page 65
On-Site CEMS Inspection Section 4
Table 4-4Summary of Dilution Air System Checks (cont)
What to Check Description
Check the inlet and outlet pressures of CO2 air cleaner filter
bull Ask the CEMS operator how often they check the CO2 air cleaner filter inlet and outlet pressures if the values are recorded and the proper setting
bull Also ask how often the filters are changed and at what point drying agents are replaced Again this should be verified against the QAQC plan documentation
Check CO2 air cleaner
4332 Source Level Extractive Systems
Source level extractive systems transport the stack gas to the analyzer without dilution These systems also are described as direct extractive or non-dilution systems These systems may measure emissions on either a wet or dry basis Wet systems need to maintain the extracted sample at a temperature above the dew point of the sample to avoid condensation in the umbilical lines Therefore each component of the sampling and analysis system in a wet extractive system must be heated Dry systems require some sort of moisture removal either through condensation or permeation driers as well as heating of the components upstream of the moisture removal system The daily calibration error test may show problems related with the conditioning system (except for NOx systems as noted in Section 432)
In addition to observing a daily calibration error test ask the source representative to describe what maintenance is performed on the conditioning system and check that information against the maintenance log and QAQC plan You can also check the chiller temperature if water is removed by condensation and compare the temperature to the acceptable ranges in the QAQC plan These system checks are summarized in Table 4-5
Table 4-5Summary of Source Level Extractive System Checks
What to Check Description
Observe a daily calibration error test Ask the source to perform a test This can be initiated by the source representative from the analyzer or DAHS (See Section 42)
Check the umbilical lines entering the CEM shelter for condensation
Visual check as described earlier in Section 432 Are there water droplets visible in the line
For a dry system using chillers check the chiller temperature
Ask the CEMS operator what the proper temperature range is and how often it is verified pare against the QAQC plan
Check general conditioning system maintenance practices
Ask the source representative how the conditioning system is maintained re to the QAQC plan and check the maintenance records
Com
Compa
Page 66 Part 75 Field Audit Manual ndash July 16 2003
Section 4 On-Site CEMS Inspection
44 Gas Analyzers
Analyzers for extractive systems often are located in a CEM shelter and generally will be rack-mounted and connected to the conditioning system usually with a sample manifold Inshysitu analyzers are located on the stack or duct or in the annulus between the stack and stack liner
In checking the analyzers it is important that you first verify that each analyzer in use is the same as the one thatReminder - MDC Monitoring
Plan Report
A printout of the MDC monitoring plan report can be used as a convenient check off sheet when verifying the serial numbers of CEMS components
was previously certified or recertified Analyzers may have been changed without the notification and recertification required by Part 75 (Subpart C sect 7520(b)) As noted in previous sections it is important that the source certifies the equipment actually in use
Analyzer DisplaysAlarms
Displays and alarms will vary by analyzer model You should ask the plant contact what displays and alarms are in the model that the source uses and what they indicate The displays should show that the analyzer is operating properly An alarm light may show a potential or developing problem which should be addressed as described in the QAQC plan Ask the source when an alarm last occurred and what caused the alarm This information should be recorded in the maintenance log
Flow Rate
Check the sample flow rate to each analyzer It may be displayed digitally or by a rotameter The proper flow rates should be identified in the QAQC plan
Range Settings
Ask the source what the range settings are for each analyzer and how these settings are displayed Compare the settings to the monitoring plan (RT 530 Column 49) You should also check to see if the source has conducted an annual spanrange check as required by Part 75 Appendix A sect 21 The range may need to be changed if that setting is not representative of the concentrations being measured or if the stack concentrations have changed (such as a change in fuel supply or new control equipment) The rule requires that the evaluation of the MPC MEC span and range for each gas monitor be conducted at least once a year
Span versus Range Under Part 75
bull The span is the calculated quality-assured portion of a monitors measurement range
bull The span is equal to 10 to 125 times the Maximum Potential Concentration (MPC) or Maximum Potential Stack Gas Flow Rate (MPF)
bull The range is the actual setting of the monitor
bull The range is to be set so that the majority of readings fall between 20 to 80 of the range selected
Range is always gt Span
Part 75 Field Audit Manual ndash July 16 2003 Page 67
On-Site CEMS Inspection Section 4
Correction Factors
A correction factor may be applied to NOx analyzer data to account for NOx quenching effects Corrections may also be applied to moisture monitors The correction is applied to the analyzer data by the DAHS You should ask if there have been any correction factor changes since the last RATA Any change should be recorded in the maintenance record and the procedures for making the change in the QAQC plan Verify that a RATA has been performed following the change (see sect 7520(b))
Table 4-6Summary of Analyzer Checks
What to Check Description
Have analyzers been changed without the notification and recertification required by Part 75 (Subpart C sect 7520(b))
Ask the source if there have been any changes since the last audit or certificationrecertification Document the serial numbers and compare to those in the monitoring plan
Status of the control panel lights indicators and alarms Displays should show that the analyzer is on and operating properly
The displays will vary by analyzer so ask the source what the displays are and what they mean An alarm light could indicate a potential problem that needs to be addressed (check QAQC plan)
Check range setting and whether the source has performed the annual spanrange check required by Appendix A sect 21
Ask the operator what the range settings are and how they are displayed Compare the range setting to the value in the monitoring plan (RT 530) and the results of the recent spanrange check
Check the sample flow rate Compare the sample flow rate if displayed by a rotameter or a digital reading to the QAQC plan
Have there been any changes to correction factors (NOx quenching and moisture monitors) since the last RATA
Changes to the correction factors should be recorded in the maintenance log and the QAQC plan should outline the procedures for changing the correction factors A RATA should be performed following any change QA testing may also be required (see sect 7520(b))
45 Calibration Gases
Calibration gas cylinders are used for daily zero and span calibrations andor linearity checks You should spot check a number of the calibration gases to verify that the gases in use meet protocol gas requirements in Part 75 that the calibration gas concentrations meet Part 75 quality assurance test requirements and that the values are entered correctly in the DAHS You also can visually check the delivery system
Make a note of the cylinder gas numbers (an engraved ID number stamped on the cylinder) and check the gas certificate for each ID number for the following information (the certificate should be on the cylinder on file electronically or in hardcopy at the facility)
Page 68 Part 75 Field Audit Manual ndash July 16 2003
-- ----
Section 4 On-Site CEMS Inspection
Meets Calibration Gas Certification Requirements
Expiration Date Cylinder gases are not certified after the expiration date The use of an expired cylinder is not in compliance with sect 7521(c)
Check the type of gas certification Part 75 requires the use of a calibration gas as defined in sect 722 Table 4-7 below describes the types of permissible Part 75 calibration gases
Meets Gas Concentration Requirements
Check that the zero air calibration gas concentrations are certified by the supplier to meet the concentration limits in sect 722 (See Table 4-7) Zero air material is a calibration gas that may be used to zero an SO2 NOx or CO2 analyzer Zero air material has an effective concentration of 00 for the component being zeroed (SO2 NOx and Total Hydrocarbons 01 ppm CO 1 ppm or CO2 400 ppm) and is free of certain other interfering gaseous species A zero air cylinder containing a multi-component mixture should be certified that it meets the concentrations above and that other components do not interfere with the CEMS reading For more on zero air calibration gas or zero air materials see Questions 102 and 103 in the Parts 75 and 76 Policy Manual
Determine the cylinder gas concentration values and verify that the values are in the correct range for the instrument span You also should record the concentrations to make sure the values are consistent with the values entered into the DAHS for daily calibration error and linearity tests The ranges for the low medium and high linearity points are
Low level 20 - 30 of span Mid level 50 - 60 of span High level 80 - 100 of span
Part 75 Field Audit Manual ndash July 16 2003 Page 69
--
--
On-Site CEMS Inspection Section 4
Table 4-7Part 75 Calibration Gases (Appendix A sect 51)
Calibration Gas Type Acronym Description
NIST - standard reference material
SRM Calibration gas obtained from the National Institute of Standards and Technology (NIST)
NIST - standard reference material-equivalent compressed gas primary reference material
PRM Gas mixtures listed in a declaration of equivalence in accordance with section 212 of the EPA Traceability Protocol for Assay and Certification of Gaseous Calibration Standards September 1997 EPA-600R-97121 (EPA Traceability Protocol)
NIST - traceable reference material
NTRM Calibration gas mixture tested by and certified by NIST to have a certain specified concentration of gases
NISTEPA-approved certified reference materials
CRM Calibration gas mixture that has been approved by EPA and NIST as having specific known chemical or physical property values certified by a technically valid procedure as evidenced by a certificate or other documentation issued by a certifying standard-setting body
Gas manufacturers intermediate standard
GMIS Compressed gas calibration standard that has been assayed and certified by direct comparison to an SRM an SRM-equivalent PRM a CRM or a NTRM in accordance with section 2121 of the EPA Traceability Protocol
EPA protocol gas Vendor-certified to be within 20 percent of the concentration specified on the cylinder label (tag value) using the uncertainty calculation procedure in section 218 of the EPA Traceability Protocol
Zero air material Calibration gas certified by gas vendor SO2 NOx and Total Hydrocarbons 01 ppm CO 1 ppm or CO2 400 ppm If a mixture the other components are certified not to interfere with the CEM readings for the target compound
Research gas mixture RGM Calibration gas mixture developed by agreement of a requestor and NIST that NIST analyzes and certifies as NIST traceable
In addition to the certificates you should also check the calibration gas line pressure gauges to determine the cylinder gas pressure The cylinder should not be used if the cylinder gas pressure is below 150 psi (This requirement is in the EPA Traceability Protocol for Assay and Certification of Gaseous Calibration Standards sect 2164) You should check to see if the facility checks cylinder pressure as part of its QAQC plan At what point do they replace a calibration standard Also check the outlet regulator pressure or calibration gas flow rate to see if it matches the QA test procedures in the QAQC plan
Page 70 Part 75 Field Audit Manual ndash July 16 2003
Section 4 On-Site CEMS Inspection
Table 4-8Summary of Calibration Gas Checks
What to Check Description
Check the certificates for the expiration date of the cylinder gas
Gas cylinders may have expired dates Cylinder gases are not certified after expiration date and the use of an expired cylinders is not in compliance with sect 7521(c)
Check the calibration gas type (certified EPA Protocol or other)
Gas certifications must meet the definitions in sect722 Check the type of cylinder gas against the descriptions in Table 4-7 and sect 722
Check the zero air material documentation to ensure that it is properly certified
Calibration gas used to zero a gas analyzer See Table 4-7 for the zero air material concentrations defined in sect 722 (Also see Policy Manual questions 102 and 103)
Check the concentration values for each cylinder and that the cylinder calibration tags are withing the correct concentration range for the span
Linearity test point ranges are shown below Low level 20 - 30 of span Mid level 50 - 60 of span
High level 80 - 100 of span
Record the concentration values to check against the values recorded by the DAHS for calibration error and linearity tests
This check is to ensure that the proper cylinder gas concentration values have been entered into the DAHS for calculation of daily calibration error tests
Read the cylinder regulator pressure The cylinder should not be used if the cylinder gas pressure is below 150 psi (EPA Traceability Protocol for Assay and Certification of Gaseous Calibration Standards sect 2164)
Check the regulator outlet pressure The pressure or calibration gas flow rate should be set as specified in the QA test procedures in the QAQC plan
46 Flow Monitors
In addition to the daily calibration error tests (Section 42) and daily interference tests (Section 431) there are a number of other flow monitor issues you can investigate
Flow-to-Load
There is no equivalent to a linearity test for a flow CEMS In response EPA developed a quarterly comparison of flow CEMS data to unit load data Each quarter the source must conduct a comparison of the hourly flow and load data for any hour in which the unit load is within plusmn 10 of the average load during the most recent RATA As part of your pre-audit checks you should note whether the source conducted this test as required and whether the test was passed If there are issues with the test conducted at the facility go over those issues with the source representative while on site
Part 75 Field Audit Manual ndash July 16 2003 Page 71
On-Site CEMS Inspection Section 4
TemperaturePressure Monitoring
Check to see if there are monitors for stack temperature andor stack absolute pressure associated with the flow monitor Ask the source what type of QAQC procedures are followed for these monitors (what is checked and on what schedule) and if there have been any problems with these components You can compare to the QAQC plan or maintenance records
K-factors
A k-factor refers to a correction factor or polynomial coefficient used by the DAHS to correct the flow monitor measurement for flow variables not measured by the monitoring method as well as for measured changes in stack pressure and temperature The factors are set based on a pre-RATA test in which the source correlates the monitor measurement to the RATA flow reference method results
Changing the k-factors or polynomial coefficients does not require recertification but does require that a three load RATA be performed (sect 7520(b)) as a diagnostic test event You should ask when the last time the correction factors were changed and why and check that the RATA was performed The changes should be recorded in the maintenance log and a procedure outlined in the QAQC plan
DisplaysAlarms
As in the case of gas analyzers the displays and alarms will vary by manufacturer You should ask the plant contact what displays and alarms are in the model that the source uses and what they indicate Information on alarms and corrective action should be recorded in the maintenance log
SpanRange
Ask the source what the range settings are for the flow monitor and how these settings are displayed Compare the settings to the monitoring plan (RT 530 Column 49) You should also check to see if the source has conducted an annual spanrange check as required by Part 75 Appendix A sect 21 (See the spanrange discussion in Section 44)
Page 72 Part 75 Field Audit Manual ndash July 16 2003
Section 4 On-Site CEMS Inspection
Table 4-9Summary of Flow Monitor Checks
What to Check Description
Observe andor review daily calibration error test and interference test
See Sections 42 and 431
Review any issues observed in reported results of flow-to-load tests
See Appendix B sect 225 for requirements of flow-to-load tests Make sure the test was performed and that the results were properly calculated If the source is excluding hours from the analysis as allowed for in Appendix B check to see that the exclusions meet Part 75 criteria
Identify if temperature and stack pressure are monitored and what QAQC procedures apply
Temperature and pressure may be monitored in conjunction with the flow monitor Note the QA and preventive maintenance procedures and schedule Ask if there have been any problems and corrective actions Check the QAQC plan and maintenance records
Check if there have been any changes to k-factors and polynomial coefficients since the last RATA
Changes to the correction factors should be recorded in the maintenance log and the procedures for changing the correction factor outlined in the QAQC plan A three load RATA is required following any change to flow monitor k-factors (sect 7520(b))
Status of the control panel lights indicators and alarms Displays should show that the analyzer is on and operating properly
The displays will vary by analyzer so ask the source what the displays are and what they mean An alarm light could indicate a potential or developing problem that needs to be addressed (check the QAQC plan)
Check range setting and whether the source has performed the annual spanrange check required by Appendix A sect 21
Ask the operator what the range settings are and how they are displayed Compare the range setting to the value in the monitoring plan (RT 530) and the results of the recent spanrange check
47 DAHS
The data acquisition and handling system (DAHS) consists of all the hardware and software used to comply with Part 75 electronic recordkeeping and reporting requirements It is a critical component of the monitoring system as it converts the analyzer signal to reported emissions data The on-site audit of the DAHS focuses on data handling issues that can not be checked electronically These checks fall into three areas
DAHS certification and verification of missing data routines and emission calculations Changes in correction factors Manually entered data
Part 75 Field Audit Manual ndash July 16 2003 Page 73
On-Site CEMS Inspection Section 4
471 DAHS Certification and Verification Tests
As for other components of the plants CEMS make sure that the DAHS version in use has been previously certifiedrecertified by checking against the monitoring plan report you printed out from MDC
Also you should ask to see a copy of the DAHS missing data and formula verification test results Part 75 requires a verification test for the missing data routines and emission calculation formulas as part of the initial certification (sect 7520(c)(9)) and whenever the DAHS is replaced upgraded to support a new EDR version or when the missing data algorithm has been changed (diagnostic testing under sect 7563(a)(2)(iii))
The source is not required to submit the results of the verification tests and there are no MDC or ETS electronic checks of the routines The source is however required to keep these test results on-site and available for inspection so you should note that the tests have been performed and what the results were (including any vendor certification) The missing data routines may be verified either by performing tests using a checking software or by a certification by the DAHS software developer that the software package meets all of the missing data requirements of Part 75 Question 1496 in the Parts 75 and 76 Policy Manual provides more information on the verification testing requirements
472 Changes in Correction Factors
Previous sections on dilution extractive systems analyzers and flow monitors recommended that you investigate what types of correction factors if any are applied to raw data (eg pressuretemperature compensation molecular weight flow and moisture monitoring polynomials sonic velocity correction factors NOx quenching correction factors and dilution ratio settings) In addition you should ask how changes to these correction factors are entered into the DAHS As noted earlier changes to correction factors should be recorded in the maintenance log and the QAQC plan should outline the procedures for changing the correction factors (Appendix B sect 113) Diagnostic QA testing is required for many of these changes (see sect 7520(b))
473 Manually Entered Data
Part 75 requires that the DAHS automatically record all emissions data and the daily calibration error checks (Appendix A sect 4) There are a few exceptions which allow manual entry or editing of data which are shown in the text box Check how various types of data are entered manually by asking the source to explain their procedures and by reviewing the QAQC plan and the hardcopy supporting
Manual Data Entry Allowed by Part 75
bull Negative (lt 0) emission values bull Erroneous emission values (if significant
must be approved by EPA) bull SO2 concentration lt 20 ppm bull Reference method back-up data bull RATA reference method data and RATA
results bull Leak checks 7-day calibration error tests
and cycle time tests bull Operating data (load and time) bull Missing data periods bull Add-on control equipment operation
during missing data periods
For more information on manual entry or editing see Section IIC3 of the EDR v22 Reporting Instructions (August 2002)
Page 74 Part 75 Field Audit Manual ndash July 16 2003
Section 4 On-Site CEMS Inspection
information for the manually entered data A number of areas you may emphasize are described below
QA Tests
Ask the source how the QA test results (daily calibration error test linearity test and RATAs) are entered into the DAHS If you have not compared a RATA report from the MDC program to plant hardcopy RATA results in your pre-audit review ask for a hardcopy of the report and check that the dates and time relative accuracy and bias adjustment factors (BAF) match Also if you identified problems with QA test calculations go over how that data are entered into the DAHS as well as the applicable QAQC plan procedures For example the BAF may not have been applied correctly to the emission data The BAF should be applied starting with the hour following completion of the RATA
Missing Data
Ask how the source records and reviews missing data How do they check that the substitute values appear correct (eg do the substituted values appear to be correct in view of the percent monitor data availability (PMA) and the length of the missing data period do the substitute NOx and flow rate values change when the load range changes during a missing data period are maximum potential values substituted when the PMA drops below 800 percent) Compare the procedures described to those in the QAQC plan Pick out a recent missing data period (one you may have identified in your pre-audit review) and spot check the electronic data by comparing against supporting hardcopy documentation
Optional Missing Data Routines - Units with Add-on Control Equipment
If the source is using an optional missing data routine for units with add-on control equipment you also may need to review control device parameter monitoring records There are four missing data options for units with add-on controls three of which require parameter monitoring to demonstrate the level of control achieved during the missing data period (sect 7534)
You will first need to check the QAQC plan The facility must identify add-on SO2 or NOx control equipment parameters and acceptable ranges in the plan
sect 7534 Optional Missing Data Procedures for Units with Add-On
Control Equipment
(1) Standard Missing Data Routines with Parametric Supporting Data
(2) No Parameter Data (3) Parametric Missing Data Substitution
Method (4) Parameter Data Used to Support Use of
Maximum Controlled Emission Rate
if the source is using add-on control equipment missing data options (see Part 75 Appendix B sect 111) Ask the source for the parameter monitoring records for a number of missing data periods You may have identified specific missing data periods from your pre-audit preparation Compare the parameter data to the acceptable ranges in the QAQC plan and identify any periods when the parameter range is exceeded Check how the missing data period was then flagged in the DAHS (control operating properly or not operating properly)
Part 75 Field Audit Manual ndash July 16 2003 Page 75
On-Site CEMS Inspection Section 4
Table 4-10Summary of DAHS Checks
What to Check Description
Check that DAHS verification tests have been performed for the missing data routines and calculations
Check the DAHS against the monitoring plan Verification tests for missing data routines and emissions calculations are required for initial certification and if the DAHS is replaced or there have been changes to the software Verification test results for the missing data routines and emissions calculations are required to be kept on site by sectsect 7520(c)(9) and 7563(a)(2)(iii) A vendor certification that the software meets Part 75 requirements is sufficient for missing data routines
Ask the source what type of correction factors are applied to raw data and how they are entered into the DAHS Also ask if any changes have been made
Changes to correction factors should be recorded in the maintenance log and the QAQC plan should outline the procedures for changing the correction factors (Appendix B
sect 113) QA testing may also be required (see sect 7520(b))
Ask what data are entered manually and how Spot check the electronic data with the manual hardcopy
You want to make sure there is documentation supporting the data that is added manually to the DAHS and that QAQC plan procedures are followed Procedures for manually entering data should be documented in the QAQC plan
How are data for the daily calibration linearity and RATA tests recorded Review some recent records to verify that hardcopy and electronic data match
Compare a RATA or linearity report from the MDC program to the plant hardcopy Check that the dates and time relative accuracy (or linearity error) and bias adjustment factors (BAF) if applicable match
Review parameter monitoring records for units using the optional missing data procedures for add-on control equipment
The QAQC plan will identify control equipment parameters and acceptable ranges (Appendix B sect 111 and sect 7558(b)) Compare the control equipment parameters to the ranges for a missing data period
48 Maintenance Log and Daily Checklists Review
The maintenance logs should detail any maintenance performed on the system and should reference all preventive maintenance performed Appendix B Section 113 requires the facility to keep the following maintenance records
Date time and description of any testing adjustment repair replacement or preventive maintenance action performed on any monitoring system
Records of any corrective actions associated with a monitors outage period
Any adjustment that changes a systems ability to record and report emissions data must be recorded (eg changing of flow monitor or moisture monitoring system polynomial
Page 76 Part 75 Field Audit Manual ndash July 16 2003
Section 4 On-Site CEMS Inspection
coefficients K factors or mathematical algorithms changing of temperature and pressure coefficients and dilution ratio settings) and
A written explanation of the procedures used to make the adjustment(s)
During the inspection you should begin by asking the CEMS technicians to describe what goes wrong with equipment what breaks and what maintenance is required Ask how they knew something was wrong and what they did about it Also ask what QA tests were done to show that the problem was resolved Make sure you understand what they are saying as their terminology may not always match the Part 75 rule terminology For example the plant personnel may refer to a daily calibration error test as a system cal overboard cal or span check
Then check the maintenance log book to see how the information is recorded You should point out any entries that you do not understand and explain why you do not understand the entry Compare to the QAQC plan to determine whether the source is implementing the preventive maintenance procedures You should also review the maintenance log to identify recertification events and adjustments that have been made to the systems which could affect the monitored data The maintenance log may also provide another check on handling of missing data periods and it can verify that linearity tests and RATAs were performed on the dates identified in the EDR
Some checks may include
Do the log entries sufficiently describe the action taken Are the entries understandable
Does the log show maintenance checks at the frequency identified in the QAQC plan
Are there recurring failures or malfunctions recorded in the log
Are malfunctions resolved as specified in the QAQC plan Are calibration error tests or other required QA tests performed before the CEMS is returned to service
Do events in the maintenance log correspond to reported missing data periods in the quarterly reports
Are there repeated adjustments to the zero or span
Have system parts or components been replaced If so has the proper recertification or diagnostic testing been performed
Are corrective actions recorded for malfunctions or as a result of daily calibration error tests or other performance tests
Are the nameinitials of the person performing task or logging data provided (While this is not required it is important for the log entries to be traceable to the person who makes the entry so that further questions can be answered if needed)
Part 75 Field Audit Manual ndash July 16 2003 Page 77
On-Site CEMS Inspection Section 4
49 QAQC Plan Review
The QAQC plan has been referenced throughout the previous sections At a minimum a QAQC plan should describe the detailed procedures and operations for calibration error and linearity tests calibration and linearity adjustments preventive maintenance and any adjustments to the system spare parts list a troubleshooting matrix and recordkeeping and reporting For units with add-on SO2 or NOx emission controls the QAQC plan may also contain (for missing data purposes) add-on emission control parameters and the range for each parameter representative of the normal operating conditions Required elements in the QAQC plan are summarized in Table 4-11 You should note that Part 75 allows electronic storage of the information in the QAQC plan provided that the information can be made available in hardcopy upon request during an audit The plan may also reference manufacturers operating manuals
Reviewing QAQC plan information is an important aspect of the on-site inspection activities described throughout the previous sections A recommended approach to inspecting various aspects and components of a plants CEMS QA program is to
Ask the plant staff to explain how they operate the equipment and perform QA and maintenance activities
Observe and record your own observations of procedures plant documentation and equipment settings
Compare the QAQC plan description of the equipment settings monitoring operating procedures and QA test procedures to actual operations at the plant
You should note instances where actual plant operations are different from the operations described in the QAQC plan and ask for an explanation Determine and discuss whether the actual procedure or the QA plan procedures meet Part 75 requirements In some cases the actual operations may be appropriate but the QAQC plan may need to be updated Clearly you should also note areas where the actual operations and QAQC plan match but neither meet Part 75 requirements
In addition to examining specific elements of the QAQC plan where there are discrepancies or potential problems you may also do a general review of the QAQC plan to check that the plan covers the Part 75 elements as shown in Table 4-11 Particular areas to focus on are the QA test procedures CEMS adjustment procedures and preventive maintenance procedures
Page 78 Part 75 Field Audit Manual ndash July 16 2003
Section 4 On-Site CEMS Inspection
Table 4-11 Checks for QAQC Plan Elements
What to Check Part 75 Requirement
Is there a written QAQC plan (it may be stored electronically but Appendix B sect 1 should be available) and when was it last updated
Are calibration error test and linearity test procedures outlined in the plan
Appendix B sect 121
Are calibration and linearity test adjustment procedures outlined Appendix B sect 122
Are RATA test procedures provided Appendix B sect 123
Are emissions and QA test recordkeeping and reporting procedures including missing data procedures included
Appendix B sect 112
If using add-on control equipment missing data options are control equipment parameters identified
Appendix B sect 111
Are procedures for preventive maintenance and Part 75 recordkeepingreporting identified
Appendix B sectsect 111 and 2
Part 75 Field Audit Manual ndash July 16 2003 Page 79
On-Site CEMS Inspection Section 4
[This page intentionally left blank]
Page 80 Part 75 Field Audit Manual ndash July 16 2003
Section 5 CEMS Performance Test Observation
Section 5 covers how you should observe CEMS performance tests (linearity tests and RATAs) u will generally observe a performance test in conjunction with the on-site CEMS audit activities outlined in Section 4
Yo
51 Introduction
In addition to the basic step of observing a daily calibration error test (see Section 42) EPA encourages all States and Regional Offices to conduct level 2 audits that include a RATA or linearity test observation These performance tests are a critical element of the Part 75 QA program The RATA in particular serves as the primary measurement of CEMS accuracy The presence of an agency observer can serve as an effective tool for ensuring that the source carries out the testing properly and that the results of the tests provide a valid assessment of data quality
During the performance test observation you should document any deviations from the test protocol You should provide copies to the source to avoid misunderstandings about any decisions you may make The observer should notify the tester immediately if there is a question as to whether or not any test procedures comply with Part 75 requirements so that the tester can take corrective action and if necessary restart the testing
Once the performance test is started and until it is concluded the only adjustments that may be made to the monitor are routine calibration adjustments towards the calibration gas or reference signal value that are the result of a regularly scheduled calibration error test This is more likely to occur during a RATA than during a linearity test
The source can make non-routine calibration adjustments (done by physically adjusting the instrument response using analyzer controls) before the linearity or RATA and at other times provided the QAQC plan includes specific criteria for the adjustment A calibration error test must be performed following the adjustment (Part 75 Appendix B sect 213) You should note if any adjustments were made prior to the performance test and review plant maintenance records for documentation of the adjustment (Part 75 Appendix B sect 113)
Calibration error tests are often performed prior to a linearity test or RATA As discussed earlier with respect to monitor adjustments you should ask the source if a calibration error test was performed prior to the linearity or RATA to be observed what the results were and if any adjustments were made RATA and linearity tests should not be conducted on a system that is out-of-control with respect to the calibration error requirements
Appendix A contains observer checklists to assist you in observing the performance tests You should also be familiar with the Part 75 performance test requirements in Appendix A sectsect 62 and 65 and the Part 60 reference methods used in the RATAs
Part 75 Field Audit Manual ndash July 16 2003 Page 81
Performance Test Observation Section 5
52 Linearity Test
A linearity test for a gas CEMS is conducted by challenging the CEMS with three audit gases one having a value of 20 to 30 percent a monitors span the second a value of 50 to 60 percent of span and the third a value of 80 to 100 percent of span Flow and moisture monitors are not subject to the linearity test requirements and SO2 and NOx monitors with spans 30 ppm also are exempt The source must conduct a linearity test every quarter (although exceptions for low operating hours and grace periods may apply) For a dual range analyzer the test is performed for each range used during the applicable quarter
The CEM system is challenged three times with each audit gas The same gas concentration or level is not to be run twice in succession The audit gas is injected at the gas injection port required in Part 75 Appendix A sect 221
The response to the zero and upscale gases is not immediate but approaches an asymptotic value (See Illustration 5-1) It is important that sufficient time is allowed for the concentration reading to stabilize for each injection of gas Watch the analyzers instantaneous response to see if enough time is allowed to reach a stable fully equilibrated response The time should not exceed 15 minutes Pay the most attention to SO2 since it is the most adsorptive and absorptive (this will delay the equilibration time)
Illustration 5-1Asymptotic Calibration Check Response (Jahnke 1994)
Also note the time required compared to the gas injections for the daily calibration error tests Both times should be about the same If they are not ask the source why this is the case Record the analyzers stabilized response and compare to the value recorded by the DAHS The values should be the same The average CEMS response will be taken from the DAHS as the official component for recording the CEMS data These linearity test procedures and requirements are specified in detail in Part 75 Appendix A sect 62
Page 82 Part 75 Field Audit Manual ndash July 16 2003
Section 5 Performance Test Observation
Time Shared Systems
Time shared systems use the same gas analyzers for multiple emission units or time shared systems the 15 minute maximum cycle time requirement for the analyzer gas concentration to stabilize includes the cycle time of each probe location served by the system
F
Appendix A contains an observer checklist Inspect the cylinder gases as outlined in Section 4 record the linearity test results using the checklist and calculate the linearity result for each level Compare the results to the appropriate performance specification listed in Table 5-1
Table 5-1Linearity Test Specifications
Monitored Parameter
Linearity Test Performance Specification (Part 75 Appendix A sect 32)
SO2 or NOx 50 linearity error or
5 ppm absolute value of the difference between the average of the monitor response values and the average of the reference values R-A
CO2 or O2 50 linearity error for each calibration gas concentration or
05 absolute value of the difference between the average of the monitor response values and the average of the reference values R-A
53 Relative Accuracy Test Audit (RATA)
A Relative Accuracy Test Audit (RATA) compares a units CEMS measurements to that of reference method stack tests The reference method tests yield results representative of the pollutant concentration emission rate moisture temperature and flue gas flow rate from the unit The RATA compares these results directly to CEMS measurements The RATA test is the primary measurement of CEMS accuracy for a Part 75 CEMS
Part 75 requires semi-annual or
RATA Reference Materials
Reference Methods in Part 60 Appendix A are available at the Emission Measurement Center website wwwepagovttnemc
Answers to common Part 75 RATA questions are provided in the Parts 75 and 76 Policy Manual at wwwepagovairmarkets
annual RATAs depending on the relative accuracy achieved in the preceding RATA Most units qualify for the annual RATA frequency (Appendix B sect 2312)
Gas RATAs performed at single load levels are often conducted simultaneously and may take about 7 hours The flow RATAs may be conducted at one two or three loads A
Part 75 Field Audit Manual ndash July 16 2003 Page 83
Performance Test Observation Section 5
multi-load RATA may therefore be performed over 2 to 3 days with each load of the flow RATA taking about 3 to 5 hours One load of the flow RATA testing often is conducted at the same time as the gas RATAs Part 75 requires that each RATA be completed within 168 consecutive unit or stack operating hours For multi-load flow RATAs up to 720 consecutive unit or stack operating hours are allowed to complete the testing at all load levels (Part 75 Appendix A sect 65)
Flow RATAs are conducted at load levels in the range of operation that extends from the minimum safe stable load to the maximum sustainable load hree levels apply in this range
Low First 30 of range Mid gt 300 and 600 High gt 600 of range
T
You should ensure that the source performs the RATA according to Part 75 and reference method requirements RATA issues of specific importance to Part 75 requirements include
Unit operating conditions The RATA should be performed while the unit is burning a normal fuel listed in the monitoring plan (App A sect 65(a)) Gas RATAs should be performed at normal load Check the load against the monitoring plan normal load If you have questions about the normal load identified in the plan you may also check load against the most recent load data submitted in the EDR to verify that the current load designation is representative of the loads reported Flow RATAs for peaking units or bypass stacks can always be performed at one load For all other situations the RATA for initial certification or recertification of a flow monitor must be a 3-load test A 3-load flow RATA also is required at least once every 5 years as part of the ongoing QA requirements For units that must conduct a flow RATA on an annual basis the standard QA flow RATA is a 2-load test For units that must conduct a flow RATA on a semi-annual basis the source can alternate between a 1-load and a 2-load test Finally units that operate at 1-load consistently (at least 85 percent of the time) can qualify for 1-load testing instead of the 2-load test (see Part 75 Appendix B sect 2313(c))
Check if the source conducted a daily calibration error test on the CEMS prior to the testing or pre-RATA adjustments While Part 75 allows a source to make pre-RATA non-routine adjustments adjustments may not be made between runs at a load level or between load levels except for routine adjustments as a result of the calibration error test (Part 75 Appendix B sect 213)
Has the source performed and passed a stratification test Stratification testing is required for units wishing to use fewer traverse points under the alternatives allowed in Part 75 Appendix A sect 656(a) and (b) For details on stratification testing see Part 75 Appendix A sect 6561 - 6563
Rake probes should not be used as they do not distinctly capture the required traverse points to ensure that a representative stack sample is obtained for analysis See Policy Manual Question 839
Page 84 Part 75 Field Audit Manual ndash July 16 2003
Section 5 Performance Test Observation
Moisture measurements used to correct dry basis measurements in determining emission rate may not be made using the wet bulb-dry bulb technique Wet-bulb-dry bulb measurements however may be used to determine molecular weight See Policy Manual Question 310
EPA recently promulgated new flow reference methods (2F 2G and 2H) Part 75 sources had raised concerns that Method 2 measurements could be biased high in some situations due to stratified or non-parallel flow In response Method 2F measures yaw and pitch angle adjusted velocity 2G adjusts for yaw angle and 2H accounts for wall effects A detailed observer checklist is available for these methods at CAMDs website and you should refer to that observer checklist if you are observing a flow RATA using one of these new methods Also available for downloading from the website is software (FLOW-CALC) that you can use to enter the reference method data and calculate results See httpwwwepagovairmarketsmonitoringindexhtml
Check that the traverse point locations for the reference method tests meet the requirements of Appendix A sect 656 and the sampling location dimensions Gas tests should typically use at least 3 traverse points Check Performance Specification (PS) 2 in Part 60 Appendix B Units with wet scrubbers may use a shorter measurement line than required by PS 2 if minimal stratification is demonstrated and moisture and gas systems may use a single point if the stratification test is passed (Part 75 Appendix A sect 656) The minimum number of traverse points for a flow test is 12 unless also using Reference Method 2H which requires at least 16 points (Part 60 Appendix B) A source can use more than the minimum number of sample points
Check the reference method calibration gases used for instrumental test methods The calibration gas certificate should show EPA Protocol gases or other certified gases concentrations that match those used in the biasdrift check calculations and an expiration date after the RATA The regulator gauge should show a cylinder pressure gt 150 psi
Verify the relative accuracy and reference method calculations yourself by doing the calculations on site using the raw data You should also obtain a copy or record the results of the RATA testers calculations Make sure that the CEMS and reference method data are for the same runs
Observation forms for flow and gas RATAs are provided in Appendix A The forms have more detailed checks than provided here In addition as noted above an observer checklist for flow reference methods 2F 2G and 2H is available at CAMDs website
Part 75 Field Audit Manual ndash July 16 2003 Page 85
Performance Test Observation Section 5
RATA Reference Methods (Part 75 Appendix A sect 6510)
The following methods from Appendix A to Part 60 or their approved alternatives are the reference methods for performing relative accuracy test audits
bull Method 1 or 1A for determining the appropriate test locations
bull Method 2 or its allowable alternatives including in Appendix A to Part 60 (except for Methods 2B and 2E) for stack gas velocity and volumetric flow rate
bull Methods 3 3A or 3B for O2 or CO2
bull Method 4 for moisture
bull Methods 6 6A or 6C for SO2
bull Methods 7 7A 7C 7D or 7E for NOx excluding the exception in section 512 of Method 7E ing Method 7E for measuring NOx concentration total NOx both NO and NO2 must be measured ithstanding these requirements Method 20 may be used as the reference method for relative accuracy test audits of NOx
monitoring systems installed on combustion turbines
When usNotw
Page 86 Part 75 Field Audit Manual ndash July 16 2003
Section 6 On-Site Inspection of Appendix D and Appendix E Monitoring Systems
Section 6 focuses on the on-site review of fuel monitoring and operating records that are required for units that use the excepted monitoring provisions available to gas and oil fired units ecordkeeping The audit emphasis is on verifying r
Part 75 Appendix D provides an optional monitoring protocol that may be used by gas-or oil-fired units instead of SO2 and flow CEMS It includes procedures for measuring oil or gaseous fuel flow using a fuel flowmeter and procedures for conducting sampling and analysis to determine sulfur content density and gross calorific value (GCV) of fuel oil or gaseous fuels
Part 75 Appendix E is available to qualifying gas or oil fired peaking units as an optional NOx emissions rate estimation procedure that may be used instead of a NOx CEMS Baseline stack testing is performed at four operating levels to establish a NOx rate - heat input curve with NOx rate the dependent variable
61 QAQC Plan Review
The QAQC plan provides a template for performing a review of fuel monitoring and sampling records and is the place to start the field audit for the excepted monitoring provisions of Part 75 Appendices D and E As described in Section 49 you should determine whether the QAQC plan meets the requirements of Part 75 Appendix B and whether the facility is implementing the plan Checks of the QAQC plan and rule requirements for Part 75 Appendix D are identified in Table 6-1 and the checks for Part 75 Appendix E are in Table 6-2
Table 6-1Appendix D - QAQC Plan Review
What to Check Part 75 Requirements
Review the fuel sampling methods and analysis The QAQC plan should include standardprocedures Compare the sampling methods and sampling and analysis procedures used by thefrequencies to the rule requirements outlined in source or its fuel supplier (Appendix B sect 135) the sample Appendix D field audit sheets (seeAppendix A of this manual)
Are the fuel flow meter test procedures and the transducer or transmitter accuracy test procedures outlined in the plan sk the source how often (and how) the tests are performed and compare to the plan and Part 75 requirements
Test procedures are required in the QAQC plan (Appendix B sect 132)
A
(cont)
Part 75 Field Audit Manual ndash July 16 2003 Page 87
Appendix D and Appendix E Monitoring Section 6
Table 6-1Appendix D - QAQC Plan Review (cont)
What to Check Part 75 Requirements
Check the fuel flowmeter transducer or
transmitter calibration and maintenance records Records are required by the QAQC plan provisions in Appendix B sect 133 se records are to include adjustments maintenance or repairs performed on the fuel flowmeter monitoring system as well as records of the data and results for Appendix D fuel flowmeter accuracy tests and transducer accuracy tests
Tho
Table 6-2Appendix E - QAQC Plan Review
What to Check Part 75 Requirement (App B sect 136)
Check the recommended range of QAQC parameters and hourly records of these parameters Make sure the parameters are identified and recorded
The QAQC plan must identify recommended ranges of quality assurance- and quality control-related operating parameters that are recorded each hour There are to be at least 4 parameters for turbines or reciprocating engines and oxygen for boilers (Appendix E sect 232)
Request that the source identify any parameter deviations and ensure proper missing data procedures are used for those hours
The source is required to redetermine the Appendix E correlation if a single deviation period exceeds 16 operating hours
Check written Appendix E NOx emission rate
testing procedures This is another required component of the QAQC plan The procedures should match the test requirements in Appendix E sect 21
62 DAHS and Supporting Records
Elements of the data acquisition and handling system (DAHS) for an Appendix D or Appendix E monitoring systems should be checked in a manner similar to that described under the CEMS on-site inspection in Section 4 of this manual
The DAHS consists of all the hardware and software used to comply with all electronic recordkeeping and reporting requirements Make sure that the version used is previously certifiedrecertified by checking against the monitoring plan and ask to see and check the DAHS verification test for the missing data routines The source is not required to submit these results and there are no electronic checks of the routines Verification test results for the missing data routines are required by sectsect 7520(c)(9) and 7563(a)(2)(iii) The latest test should have occurred no earlier than when the unit began using EDR v21 (or v22 when applicable)
Page 88 Part 75 Field Audit Manual ndash July 16 2003
Section 6 Appendix D and Appendix E Monitoring
Additional checks are necessary to ensure that data entered manually into the DAHS match hardcopy supporting information Fuel sampling data (sulfur content density GCV) may be entered manually into the DAHS Ask the source how these data are entered You should also compare the electronic fuel data in the DAHS to the on-site hardcopy fuel sampling and analysis data to make sure they match The source may pull the electronic data up for you using the DAHS or you may use data that you printed out from MDC Hourly
You should also investigate how emissions data missing data periods and operating parameters are recorded If data are entered by hand you should similarly spot check the electronic data with the hardcopy For Appendix E units check to see that the results from the plants copy of the Appendix E NOx emission rate tests match the curve in the monitoring plan and DAHS This should include checks on the dates and times NOx load and fuel flow values You can use MDCs Appendix E test report function to review the electronic data You should also check the sources hardcopy capacity factor documentation against the capacity factor submitted in the EDR (see Record Type 507)
Table 6-3Summary of DAHS and Supporting Records Checks
What to Check How to Check
Check that the current DAHS version is certified and that a DAHS verification test was conducted for the missing data routines
Compare the DAHS to that identified in the monitoring plan Missing data routine verification test results are required by sectsect 7520(c)(9) and 7563(a)(2)(iii) The latest test should have occurred no earlier than when the unit began using EDR v21 (or v22 when applicable)
How is fuel sampling data (sulfur content density GCV) entered Do the data match the fuel analysis results
Ask the source to pull up the fuel data in the DAHS and compare to hardcopy fuel sampling and analysis data
How are emissions data missing data periods and operating parameters recorded
If the data are entered by hand spot check the data with the hardcopy
Does the hardcopy report of the Appendix E NOx
emission rate tests match the curve in the monitoring plan and DAHS
Compare the plants copy of the test report to the Appendix E test report from the MDC program Check that dates and times NOx load and fuel flow values match
63 Appendix D Fuel Flow Monitors
If practical visually check the fuel flow monitors to verify that the fuel flow monitors match those in the monitoring plan At a minimum the monitoring plan should at least show the flowmeter component type manufacturer modelversion and serial number Some units may also report each auxiliary component (pressure and temperature transducers and transmitters) in the monitoring plan
Part 75 Field Audit Manual ndash July 16 2003 Page 89
Appendix D and Appendix E Monitoring Section 6
64 Appendix D Fuel Flow Monitor Quality Assurance
Billing meters are exempt from QA accuracy testing and other quality assurance requirements (Part 75 Appendix D sect 214) You should first ask if the monitor is used for commercial billing and has been designated as such This should be identified in the monitoring plan If it is no further checks are necessary
641 QA Testing
After the initial certification tests fuel flow monitors are to be tested once every four fuel flowmeter QA operating quarters Extensions up to 20 operating quarters are available based on quarterly fuel flow-to-load test results For these QA tests make the following checks
Are quarterly fuel flow-to-load tests performed This test is optional Test results are reported in the EDR -- you may have reviewed the data prior to the visit using MDC Verify that on-site test results match those in the electronic report
Check fuel flow monitor accuracy test reports Compare the hardcopy accuracy test results against those reported electronically MDC can provide a copy of the electronic report You can also verify the calculations Ask the source for a copy of the report which should be in a format similar to Part 75 Appendix D Table D-1 or D-2
642 Maintenance and Inspection Records
The maintenance logs should detail any maintenance performed on the system and should reference all preventive maintenance performed During the inspection you should look at the maintenance log book which is required as part of the QAQC plan The maintenance conducted should match the maintenance procedures in the plan Also verify that there have been no changes to monitoring equipment without appropriate recertification testing See Section 48 for more discussion of maintenance logs
Page 90 Part 75 Field Audit Manual ndash July 16 2003
Section 7 Reporting Audit Results
Section 7 provides a brief overview of reporting results in the exit interview and audit report ould highlight issues suggesting data invalidity so that the source can take steps to minimize allowance penalties from missing data CAMD should receive prompt notice of issues that may affect the validity of mass emissions data
The interview sh
71 Exit Interview
You should conduct an informal summary of the audit findings (exit briefing) before you leave the facility You should discuss the audit findings with reference to specific regulatory requirements or in terms of potential problems Evidence should be available to support a finding or observation although you should raise any questions on a monitoring method or rule requirement If a source disputes a finding you should give it an opportunity to provide adequate alternate information Further investigation after the meeting may be required to achieve the resolution of questioned items In such cases you should table the discussion at the briefing
If you perform the audit periodically you should address any progress or lack thereof since the previous audit This is readily done by reviewing the findings of the last audit and noting how the issues have been resolved If there has been no progress the review should emphasize the ongoing problems and stress the need for immediate resolution
72 Audit Report
The audit report organizes and coordinates information gathered during the audit in a usable manner -- it is the compilation of factual information and professional judgment resulting from the audit The report also serves to record the procedures used in gathering the data and gives factual observations and evaluations from the audit Information in the report must be accurate relevant complete objective and clear You should avoid discussions of general topics and should link all compliance issues directly to regulatory requirements Include any follow-up actions in the audit report
You also should prepare a cover letter summarizing the audit results and follow-up activities Send the cover letter and audit report to the Designated Representative or the sources contact person and a copy to the EPA Regional andor State agencies The Clean Air Markets Division should receive a copy of the cover letter If any findings are likely to affect reported mass emissions used for allowance true-up activities notify CAMD immediately You should complete the audit report within one month following the audit while observations are still fresh and to provide a quick response to any problems Notify the source if the report is delayed
Part 75 Field Audit Manual ndash July 16 2003 Page 91
Reporting Audit Results Section 7
73 Follow-up Activities
The audit team should keep documentation of any outstanding issues from the audit A follow-up review should be scheduled within a reasonable time after the audit
Page 92 Part 75 Field Audit Manual ndash July 16 2003
Section 8 Conducting Level 3 Audits
Section 8 discusses issues that an agency should consider in developing a performance testing program (a Level 3 audit capability) es single gas challenges and linearity tests
This section emphasiz
81 Overview
This section focuses on issues that an agency should consider if it chooses to develop a Level 3 audit program that includes single gas challenges and linearity testing of gas CEMS The emphasis in this section is on the calibration gases and development of a testing program rather than on a step-by-step description of how to perform a test
Agencies that currently do not perform Level 3 performance tests may have in-house expertise and experience available in the agencys ambient air monitoring staff Single gas challenges and linearity testing of Part 75 gas CEMS require the same knowledge base as calibration testing of ambient gas monitors An agency can take advantage of this existing resource in developing a Level 3 program for Part 75 audits
82 Tri-Blend or Single Blend Gases
Part 75 affected sources commonly use multi-component calibration gases Multi-component gases provide cost savings over single component gases by reducing the number of cylinder gases and the equipment necessary for calibration tests These calibration gases also allow for calibrating analyzers simultaneously The tri-blend (or triple blend) contains SO2 NO and CO2 The SO2 and NO are at relatively low concentrations in the ppm range while the CO2
concentration is in the percent range The single component (or single blend) calibration gas consists of the target compound -- SO2 NO or CO2 -- blended with N2 or air Compared to a single blend a tri-blend replaces a portion of the N2 or air with CO2 (up to 20 percent by volume for high range testing)
Tri-blends with a CO2 concentration of 11 percent (representative of most stack conditions) are recommended for agency auditors CO2 concentrations representative of stack gas conditions will minimize molecular weight or interference effects described below that can occur if the CO2 concentration in the calibration gas is different from the stack gas
Molecular Weight Effects - Dilution Systems
CO2 weighs more than N2 or air so a tri-blend calibration gas containing CO2 will be heavier than a single blend calibration gas in which the balance is either N2 or air This will impact a single gas challenge or linearity test of dilution extractive systems if the inspector uses a single blend to conduct a test on units that normally use tri-blends for calibration and quality assurance The sample flow in a dilution extractive system is controlled by the critical orifice
Molecular Weight of Major Calibration Gas
Component Compounds
bull CO2 44 bull N2 28 bull Air 29
Part 75 Field Audit Manual ndash July 16 2003 Page 93
Single Gas Challenges and Linearity Tests Section 8
which is dependent on molecular weight Dilution extractive systems therefore will produce different test results depending on whether a single blend or tri-blend gas is used Your best approach to dealing with this issue is to use a tri-blend with CO2 concentrations representative of stack conditions Table 8-1 summarizes the effects of calibration gas blend molecular weights on dilution system emission measurements and QA testing measurements
Table 8-1Effects of Gas Blends on Dilution System Measurements
(from Table 3-2 in Jahnke 1994)
Activity Performed Calibration Gas Blend
Used Possible Resulting Measurement Biases
Emissions Measurements
CEM system calibrated with CO2 triple blend
Emission measurements bias minimized (because CO2 present in both flue gas and calibration gas)
CEM system calibrated with single blend (eg SO2 in nitrogen)
Emission measurements are biased (because CO2 is present in flue gas)
Calibration Error Test and Linearity Check
CEM system calibrated with single blend
Calibration error test conducted with CO2
triple blend will show a bias Linearity check conducted with CO2 triple blends will show bias
CEM system calibrated with CO2 triple blend
Calibration error test conducted with single blend will show a bias Linearity check conducted with single blends will show bias
CEM system calibrated with single blend
RATA conducted with Reference Method 6C calibrated with a CO2 triple blend will show bias
CEM system calibrated with CO2 triple blend
RATA conducted with Reference Method 6C calibrated with a single blend will show bias
RATA CEM system calibrated with a single blend
RATA conducted with Reference Method 6C calibrated with a single blend will minimize bias
CEM system calibrated with CO2 triple blend
RATA conducted with Reference Method 6C calibrated with a CO2 triple blend will minimize bias
Interference Effects
CO2 can interfere with chemiluminescent NOX monitors (quenching) and cause a negative error in the NOx emission measurement If the auditor uses a NO single blend calibration gas without CO2 the result reported by the DAHS will be higher than the calibration gas concentration as the CEMS results are corrected to account for the CO2 concentration in
Page 94 Part 75 Field Audit Manual ndash July 16 2003
Section 8 Single Gas Challenges and Linearity Tests
the stack gas As in the case of molecular weight effects using a tri-blend with CO2
concentrations representative of stack conditions will minimize this problem
83 Hands Off Policy
EPAs hands off approach discussed in Section 141 also applies to conducting a single gas challenge or linearity test You do not need to physically handle a facilitys CEMS hardware You should ask qualified plant personnel to perform any actions with the CEMS equipment This includes connecting cylinder gases to the plant calibration gas manifolds or your gas delivery line to the CEMS calibration gas injection point and obtaining results from the DAHS
84 Test PlanProcedures
The agency should prepare standard operating procedures for performing the single gas challenge or linearity test A general outline of items to cover is provided in Table 8-2 A sample procedure for linearity testing is provided in Appendix A of this manual
Table 8-2Elements of a Standard Operating Procedure for Performance Testing
Procedure Element DescriptionPurpose
Pre-Test Survey Contact the source to schedule the test verify CEMS calibration information and review test logistics
Pre-Test Equipment Preparations Select and prepare test equipment
Pre-Test Meeting Plant meeting the day of the test Review of test procedures and any special circumstances
Equipment Set-up Outline of steps to set up the test equipment
Test Procedure Step by step procedures for the test itself including calculations
Pack-up Procedure Description of equipment breakdown after the test is completed
Post-Test Meeting Provide source with the test results
85 Single Gas Challenge
The single gas challenge uses one protocol gas to challenge the CEMS at one point in the measurement range It has a logistical advantage over performing a linearity test One trishyblend gas cylinder can cover CO2 SO2 and NOx and there is no need for a manifold or trailer The disadvantage is that only one point in the measurement range is tested EPA recommends that if a single gas challenge is performed a mid level gas be selected (~ 40 - 60 percent of span) Have the source perform a daily calibration error test so that the full scale can be evaluated This approach minimizes the resources required but most closely approximates a full linearity test
Part 75 Field Audit Manual ndash July 16 2003 Page 95
Single Gas Challenges and Linearity Tests Section 8
When you perform the single gas challenge connect your calibration gas cylinder to the sources calibration gas manifold ep in mind the hands off policy ould perform three runs For each run
Inject gas wait for the response to fully stabilize and record value from the DAHS and
Allow system to sample stack gas and equilibrate before the next run
Based on this test the percent error is calculated in the same manner as the linearity error
where
LE = Percent linearity error R = Reference value of calibration gas A = Average of monitoring system responses
86 Linearity Test
Linearity test procedures and requirements are outlined in Part 75 Appendix A sect 62 There are two approaches your agency might take with regards to the logistics of on-site linearity testing rst approach is similar to the single gas challenge in that you bring your own calibration gases to the site and have the source connect each of your three cylinder gases (low mid and high) to the plant calibration gas manifold ach is to provide your own gas delivery manifold set-up with your cylinders in a truck or trailer and have the source attach your gas delivery line to the CEMS injection point
You will challenge the CEMS three times with each audit gas s injected at the gas injection port required in Part 75 Appendix A sect 221 e same gas concentration or level is not used twice in succession Sufficient time should be allowed for the concentration reading to stabilize for each gas injection he average CEMS response will be taken from the DAHS as the official component for recording the CEMS data You then calculate the percent error using the same equation identified in Section 85 above
87 Calibration Gases
As noted earlier a tri-blend gas containing SO2 NOx and 11 percent CO2 is recommended for agency audits of SO2 and NOx monitors The number of different calibration gases that your agency will need is dependent on the spans of the CEMS installed on units in your area At least three audit gases will be needed to conduct the linearity test at a unit ne having a value 20 to 30 percent of span the second with a value of 50 to 60 percent of span and the third with a value of 80 to 100 percent of span Review the monitoring plans for the units in your area to identify which gases you will need gency should develop a standard operating procedure for maintaining the calibration gas inventory
Ke You sh
The fi
The other appro
The audit gas iTh
T
o
Your a
Page 96 Part 75 Field Audit Manual ndash July 16 2003
Section 8 Single Gas Challenges and Linearity Tests
88 Training
Table 8-3 lists available EPA training courses pertaining to gas CEMS and analyzer calibration Two of the courses APTI 435 and APTI 464 are geared to operating an ambient monitoring system but include instructions on how to calibrate gas analyzers that are directly applicable to performing a single gas challenge or linearity test on a Part 75 gas CEMS
Table 8-3Available EPA Training Courses
EPA Course Number
Course Title
APTI 435 Atmospheric Sampling
APTI 464 Analytical Methods for Air Quality Standards
APTI 450 Source Sampling for Pollutants
APTI 474 Continuous Emission Monitoring
SI 476B Continuous Emission Monitoring Systems Operation and Maintenance of Gas Monitors
Part 75 Field Audit Manual ndash July 16 2003 Page 97
- Page 1
- Page 2
- Page 3
- Page 4
- Page 5
- Page 6
- Page 7
- Page 8
- Page 9
- Page 10
- Page 11
- Page 12
- Page 13
- Page 14
- Page 15
- Page 16
- Page 17
- Page 18
- Page 19
- Page 20
- Page 21
- Page 22
- Page 23
- Page 24
- Page 25
- Page 26
- Page 27
- Page 28
- Page 29
- Page 30
- Page 31
- Page 32
- Page 33
- Page 34
- Page 35
- Page 36
- Page 37
- Page 38
- Page 39
- Page 40
- Page 41
- Page 42
- Page 43
- Page 44
- Page 45
- Page 46
- Page 47
- Page 48
- Page 49
- Page 50
- Page 51
- Page 52
- Page 53
- Page 54
- Page 55
- Page 56
- Page 57
- Page 58
- Page 59
- Page 60
- Page 61
- Page 62
- Page 63
- Page 64
- Page 65
- Page 66
- Page 67
- Page 68
- Page 69
- Page 70
- Page 71
- Page 72
- Page 73
- Page 74
- Page 75
- Page 76
- Page 77
- Page 78
- Page 79
- Page 80
- Page 81
- Page 82
- Page 83
- Page 84
- Page 85
- Page 86
- Page 87
- Page 88
- Page 89
- Page 90
- Page 91
- Page 92
- Page 93
- Page 94
- Page 95
- Page 96
- Page 97
- Page 98
- Page 99
- Page 100
- Page 101
- Page 102
- Page 103
- Page 104
- Page 105
- Page 106
- Page 107
-
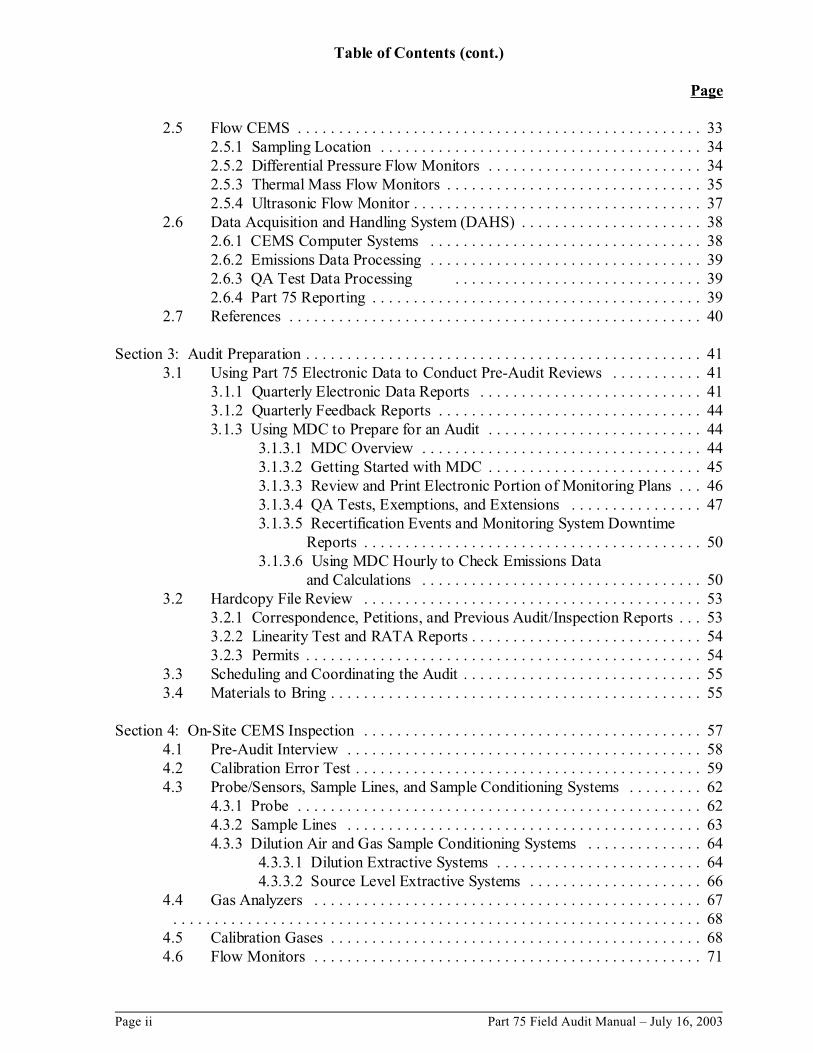
Table of Contents (cont)
Page
47 DAHS 73471 DAHS Certification and Verification Tests 74472 Changes in Correction Factors 74473 Manually Entered Data 74
48 Maintenance Log and Daily Checklists Review 7649 QAQC Plan Review 78
Section 5 CEMS Performance Test Observation 8151 Introduction 8152 Linearity Test 8253 Relative Accuracy Test Audit (RATA) 83
Section 6 On-Site Inspection of Appendix D and Appendix E Monitoring Systems 8761 QAQC Plan Review 8762 DAHS and Supporting Records 8863 Appendix D Fuel Flow Monitors 8964 Appendix D Fuel Flow Monitor Quality Assurance 90
641 QA Testing 90642 Maintenance and Inspection Records 90
Section 7 Reporting Audit Results 9171 Exit Interview 9172 Audit Report 9173 Follow-up Activities 92
Section 8 Conducting Level 3 Audits 9381 Overview 9382 Tri-Blend or Single Blend Gases 9383 Hands Off Policy 9584 Test PlanProcedures 9585 Single Gas Challenge 9586 Linearity Test 9687 Calibration Gases 9688 Training 97
Part 75 Field Audit Manual ndash July 16 2003 Page iii
[This page intentionally left blank]
Page iv Part 75 Field Audit Manual ndash July 16 2003
List of Tables
Page
Table 1-1 Part 75 PollutantsParameters and CEMS Components 4Table 1-2 Part 75 Non-CEMS Methodologies 5Table 1-3 Levels of Field Audits 9Table 1-4 Available EPA Training Courses 12Table 2-1 Common Extractive Gas CEM Analytical Methods 28Table 2-2 In-Situ Gas Analyzer Methods 33Table 3-1 Electronic Monitoring Plan Information 46Table 3-2 Summary of MDC QA Test Checks 49Table 3-3 Summary of MDC Hourly Checks 53Table 4-1 Pre-Audit Interview Items 59Table 4-2 Part 75 Calibration Error Test Data Validation Requirements 61Table 4-3 ProbeSensor Check Summary 63Table 4-4 Summary of Dilution Air System Checks 65Table 4-5 Summary of Source Level Extractive System Checks 66Table 4-6 Summary of Analyzer Checks 68Table 4-7 Part 75 Calibration Gases (Appendix A sect 51) 70Table 4-8 Summary of Calibration Gas Checks 71Table 4-9 Summary of Flow Monitor Checks 73Table 4-10 Summary of DAHS Checks 76Table 4-11 Checks for QAQC Plan Elements 79Table 5-1 Linearity Test Specifications 83Table 6-1 Appendix D - QAQC Plan Review 87Table 6-2 Appendix E - QAQC Plan Review 88Table 6-3 Summary of DAHS and Supporting Records Checks 89Table 8-1 Effects of Gas Blends on Dilution System Measurements 94Table 8-2 Elements of a Standard Operating Procedure for Performance Testing 95Table 8-3 Available EPA Training Courses 97
Part 75 Field Audit Manual ndash July 16 2003 Page v
List of Illustrations Page
Illustration 1-1 Overview of Continuous Emission Monitoring in a Part 75 Trading Program 3
Illustration 2-1 Basic CEMS Types (Jahnke and Peeler 1997) 16Illustration 2-2 Example of Continuous Emission Monitoring Systems
at a Part 75 Unit 17Illustration 2-3 Typical Source-Level Extractive CEMS (Gschwandtner
and Winkler 2001) 21Illustration 2-4 Dilution Extractive CEMS (Gschwandtner and Winkler 2001) 23Illustration 2-5 In-Stack Dilution Probe (adapted from Jahnke 2000) 24Illustration 2-6 One Type of Out-of-Stack Dilution System (Gschwandtner
and Winkler 2001) 26Illustration 2-7 In-Situ Gas CEMS (Jahnke 1992) 32Illustration 2-8 Example of Multiple Probe Locations (Jahnke 1994) 35Illustration 2-9 Thermal Mass Flow Monitor Probe (adapted from Jahnke 1992) 36Illustration 2-10 Ultrasonic Flow Monitor 37Illustration 3-1 Example EDR Data Format for Record Type 320 42Illustration 3-2 Example Summary of Quarterly Report Content For Two Acid Rain
CEMS Units Emitting Through Common Stack 43Illustration 3-3 MDC Screen Showing Multiple Linearity Tests in One Quarter 48Illustration 3-4 Example MDC Hourly Graph of SO2 Concentration 52Illustration 5-1 Asymptotic Calibration Check Response (Jahnke 1994) 82
Page vi Part 75 Field Audit Manual ndash July 16 2003
Section 1 Introduction
After reading this Introduction the inspector (auditor) should understand the organization of the manual and the topics it covers the role of the field audit in the Part 75 compliance program the key components of the field audit and where to obtain the latest information on the regulation and on manual updates
11 Background
111 Importance of Monitoring for Emission Trading Programs
The US Environmental Protection Agency (EPA) has established monitoring requirements at 40 CFR Part 75 as part of its efforts to develop cap and trade emission reduction programs A cap and trade program is an innovative market-based approach to reducing emissions The cap sets a ceiling on emissions that is below an applicable baseline level Sources in the program receive emission allowances with each allowance authorizing a source to emit one ton of the pollutant being controlled Limiting the number of available allowances ensures the caps integrity At the end of each year every source must have enough allowances to cover its emissions for that year Unused allowances may be sold traded or saved (banked) for future use While this approach allows sources flexibility in deciding how they achieve compliance the cap ensures that the affected sources reduce emissions collectively to the desired reduction goal
The cornerstone for ensuring that sources achieve the required emission reductions is a strong monitoring program Accurate monitoring of all emissions and timely reporting ensure that a ton from one source is equal to a ton from any other source and that the integrity of the cap is maintained Under Part 75 participating sources must fully account for each ton of emissions according to stringent uniform protocols The resulting compliance information is unprecedented in its accuracy and comprehensiveness All data are publicly available on the Internet providing complete transparency
To date the Part 75 monitoring requirements are used for two separate programs Under the Acid Rain Program sources have had to meet Part 75 and emission reduction requirements since 1995 EPA has had the lead in ensuring compliance with the Acid Rain Program although EPA has teamed with State and local agencies on various aspects of implementing the Part 75 monitoring provisions
In May 2002 State agencies began to take the lead role in implementing and ensuring compliance with Part 75 for purposes of a separate nitrogen oxides (NOx) trading program that many eastern States have adopted in response to EPAs 1998 NOx SIP Call EPA believes that a strong audit program is an essential component of an effective Part 75 compliance oversight program Given the increased role of State and local agencies in Part 75 implementation EPA has prepared this manual to assist agencies in implementing Part 75 and to ensure the ongoing integrity of the new NOx trading program
The manual begins with the premise that each link in the chain of the Part 75 program is important in ensuring that the data ultimately used to measure emissions and account for the
Part 75 Field Audit Manual ndash July 16 2003 Page 1
Introduction Section 1
use of allowances in a trading program remain accurate Illustration 1-1 depicts the major links in the data quality chain for a continuous emissions monitoring system (CEMS) The process starts with ensuring that the gas standards used to calibrate and test the monitoring equipment are accurate EPA adopted the Traceability Protocol for Assay and Certification of Gaseous Calibration Standards for this purpose The source must conduct the necessary quality assurance tests following all appropriate procedures and report the results of those tests accurately These quality assurance activities are conducted initially for certification and then on an ongoing basis to maintain a measure of the systems ability to accurately determine emissions Once the data measurements are quality-assured the next step is to ensure that the measured data obtained from the CEM analyzer are accurately recorded by the data acquisition and handling system (DAHS) and appropriately reported in the quarterly electronic data reports (EDR) The EDRs are submitted quarterly to EPA so that it can review and account for the emissions data in the cap and trade program EPA provides the necessary data management systems to track emissions and allowance transfers
The integrity of the overall trading program can break down anywhere along this chain of activities therefore EPA relies on a combination of electronic and field auditing to verify overall data integrity The field audit procedures in this manual are critical for examining these links to verify proper performance of the monitoring systems and identify problems which may lead to inaccurate emissions accounting
Page 2 Part 75 Field Audit Manual ndash July 16 2003
Section 1 Introduction
Illustration 1-1Overview of Continuous Emission Monitoring in a Part 75 Trading Program
112 Structure of Part 75 Monitoring Provisions
Continuous emissions monitoring systems (CEMS) are the primary monitoring method under Part 75 The Part 75 rule includes requirements for installing certifying operating and maintaining CEMS for SO2 NOx CO2 O2 opacity and volumetric flow Appendices A and B of Part 75 provide the technical specifications for the installation and performance of CEMS including certification and quality assurance test procedures The rule also includes approved non-CEMS options for certain gas and oil fired units and procedures to account for missing data
Recordkeeping and reporting provisions require Acid Rain Program and NOx trading program affected units to submit Part 75 hourly emission data and related quality assurance data through electronic report formats to EPAs Emission Tracking System (ETS) which is operated by the Clean Air Markets Division (CAMD) The ETS data in turn are used to
Part 75 Field Audit Manual ndash July 16 2003 Page 3
Introduction Section 1
TIP
Check wwwepagovairmarkets for further regulatory information
maintain the emission allowance accounts in the Allowance Tracking System and the NOx
Allowance Tracking System
The Part 75 requirements are outlined below to introduce you to the rule and some of the terminology used in the manual can obtain copies of Part 75 and determine whether EPA has published further revisions to Part 75 issued new monitoring guidance or revised the information in this manual by checking CAMDs website ion 15 of the manual provides a list of important regulations and policy guidance documents with links to specific pages on CAMDs website you may find helpful
Monitoring Methods
The monitoring requirements for each type of unit subject to Part 75 are in Subpart B of the rule red except for some gas and oil fired units e 1-1 summarizes CEMS components that are required by pollutant while Table 1-2 summarizes the non-CEMS options
Table 1-1 Part 75 PollutantsParameters and CEMS Components
PollutantParameter
Required CEMS Components
SO2 NOx Flow Opacity Diluent Gas (O2
or CO2)
Data Acquisition
and Handling System (DAHS)
SO2 (lbhr)
NOx (lbmmBtu)1 NOx (lbhr)2 Opacity ()3 CO2 (lbhr)4 Heat Input (mmBtuhr)
You
Sect
CEMS are requi Tabl
1Heat input in mmBtuhr is also required2For units subject to NOx SIP Call trading program Can monitor with or without diluentmonitor3Required only for coal and residual oil units4Alternative mass balance method may by used to monitor CO2
Page 4 Part 75 Field Audit Manual ndash July 16 2003
Section 1 Introduction
Table 1-2Part 75 Non-CEMS Methodologies
Pollutant Parameter
Unit Type Monitoring Methodology
SO2 (lbhr) natural gas Default SO2 emission rate combined with measured fuel flow (Part 75 Appendix D)
SO2 (lbhr) gas or oil Fuel sampling and analysis combined with measured fuel flow (Part 75 Appendix D)
NOx (lbmmBtu) NOx (lbhr)
gas or oil peaking units
Estimate NOx rate by using site-specific emission correlations with measured fuel flow if measuring lbhr (Part 75 Appendix E)
SO2 CO2 NOx
(lbhr for all and lbmmBtu for NOx)
gas or oil Conservative default values for units with low mass emissions (sect 7519)
Heat Input (mmBtuhr)
gas or oil Measured fuel flow and GCV (Part 75 Appendix D)
Monitoring Certification Requirements
The implementing agency must certify an allowable monitoring method before it can be used for Part 75 monitoring The source must perform certification tests and submit the results to EPA and the appropriate State agency Part 75 performance certification testing is outlined in sect 7520 and Appendix A sect 6 Certification tests for a CEMS may include
7-day calibration error test for each monitor Linearity check for each pollutant concentration monitor Relative Accuracy Test Audit (RATA) for each monitoring system Bias test for each monitoring system Cycle time test for each pollutant concentration monitor Daily interference test for flow monitors DAHS testing
There are also certification requirements for non-CEMS methods These include accuracy tests for fuel flow monitors (sect 7520 and Appendix D sect 215) stack tests to develop NOx correlations for gas or oil peaking units (Appendix E sect 21) or unit-specific default values for low mass emissions units (sectsect 7519-7520)
Recertification may be required if the facility replaces modifies or changes a certified CEMS in a way that may significantly affect the ability of the system to accurately measure monitored parameters
Quality AssuranceQuality Control Procedures
The source is required to develop and implement a written quality assurancequality control (QAQC) plan for each monitoring system (sect 7521) The QAQC plan must include procedures for system operation as well as procedures for conducting quality assurance tests (QA tests) preventive maintenance and recordkeeping Appendices A and B to Part 75
Part 75 Field Audit Manual ndash July 16 2003 Page 5
----
Introduction Section 1
describe the technical procedures for how and when to conduct periodic QA tests which include
Daily calibration error tests Challenge a gas CEMS at a zero and high level with calibration gas
Daily interference tests for flow monitors Follow procedure to detect plugging or other problems that could interfere with a flow monitor
Quarterly linearity tests Challenge a gas CEMS at 3 levels with calibration gases Quarterly flow-to-load evaluations Compare flow monitor values to values from an
initial flow-to-load correlation as a means to check flow monitor data quality over time Semi-annual or annual RATAs Compare monitored values to values measured by an
approved EPA reference method Also use RATA results to detect and if necessary adjust for low bias
Recordkeeping and Reporting
Part 75 includes requirements for notifications recordkeeping and reporting in Subparts F and G As noted earlier most of the reporting to EPA is done electronically every quarter in a standard electronic format and much of the recording will be done automatically using the DAHS Some important records and reporting that you will want to review include
Monitoring plan Submitted electronically although some information is submitted only in hardcopy Contains information describing the unit CEMS other monitoring methodologies and specific calculation procedures
Hourly parameters including emissions flow heat input monitor availability and other information
Periodic QA test results Recertification tests Other records that are required to be kept on-site such as
Annual spanrange evaluationSO2 scrubber parameters to verify proper control operation during a missing dataperiod
Missing Data
Part 75 requires sources to account for emissions during periods when there are no valid data (missing data periods) due to the monitor not operating or operating out of control The missing data methodologies are necessary so that a source accounts for emissions during each hour of operation The missing data algorithms become increasingly conservative as monitor downtime increases so that sources have an incentive to maintain high data availability
12 What does the manual cover
This manual details recommended procedures for conducting a field audit of a Part 75 monitoring system Included are tools you can use to prepare for an audit techniques you can use to conduct the on-site inspection and review records proper methods for observing performance tests and guidelines for preparing a final report EPA has designed the audit procedures in this document so that personnel with varying levels of experience can use them
Page 6 Part 75 Field Audit Manual ndash July 16 2003
Section 1 Introduction
While the manual is written primarily for State and local agency inspectors industry personnel may find some of the material useful for their internal data quality management activities
The manual covers gas (SO2 NOx and diluent) and flow monitoring systems -- it does not cover opacity monitor audits Although Part 75 requires opacity monitors for coal-fired units subject to the Acid Rain Program opacity data and quality assurance tests are not reported to CAMD in quarterly emission data reports Moreover the source can comply with Part 75 by satisfying performance specifications in Part 60 that are generally applicable to opacity monitors and can follow a States recording and reporting requirements Thus there are no special Part 75 audit techniques for these systems
The manual is organized into eight major sections with one appendix
Section 1 introduces cap and trade programs Part 75 the role of field audits and the inspector CAMDs audit targeting role the importance of inspector training and a list of key Part 75 materials with Internet links
Section 2 provides a short introduction to the various types of CEMS and the major components of a CEMS including basic installation and operating principles
Section 3 describes preparing for an audit prior to the plant visit with emphasis on using CAMDs Monitoring Data Checking (MDC) software to review the electronic data
Section 4 covers the on-site CEMS inspection including what to look for and questions to ask during a walk through of CEMS components as well as how to review the QAQC plan and other in-plant records
Section 5 describes how to observe CEMS performance tests (linearity and relative accuracy test audits)
Section 6 outlines specific on-site review procedures for Appendix D and E monitoring systems and records
Section 7 guides you in conducting the exit interview and preparing a written audit report
Section 8 discusses issues that should be considered by a State or local agency in developing a performance testing program with an emphasis on single gas challenges and linearity tests
Appendix A to the Manual provides sample checklists for the field audit RATA and linearity observations The checklists are based on the discussions and techniques in Sections 3 through 6
Part 75 Field Audit Manual ndash July 16 2003 Page 7
Introduction Section 1
13 Part 75 Audit Program Overview
The Part 75 audit program consists of both electronic audits and field audits CAMD uses automated tools such as the Monitoring Data Checking (MDC) system to conduct automated checks of data submitted under Part 75 for potential problems Also it uses its data systems and its ability to check data through automated information systems to target units for follow-up data audits On-site field audits performed to ensure that monitoring systems are installed and operated properly are also essential in the Part 75 audit program
131 Part 75 Electronic Audit Program
CAMD performs routine electronic audits on each quarterly report submittal using the ETS and MDC software EPA may also perform targeted electronic checks to find other specific data reporting problems The electronic audits identify errors in the quarterly electronic data report the monitoring plan and the QA tests An automated ETS feedback report that focuses on the reported emissions data is sent to the source instantly upon electronic submittal by ETS EPA then uses MDC to analyze the monitoring plan and QA data and sends an MDC feedback report at the end of the quarterly submission period The reports categorize errors as critical and non-critical -- for critical errors the source must correct and resubmit the quarterly report
132 Audit Targeting
In addition to performing electronic audits EPA periodically compiles a recommended field audit target list based on a review of all of the quarterly electronic data reports This national list attempts to identify trends based on a large population of units that may not be identifiable from a smaller population at the State level alone The target list is intended to help States allocate their auditing resources on those units that are most likely to have data problems based on the findings of EPAs electronic auditing efforts States may use these recommendations to focus their audit efforts but may also choose other units for field audits through State targeting approaches or at random
133 Field Audits
EPA relies on State and local agencies to conduct field audits of monitoring systems to assess the systems performance and a sources compliance with monitoring requirements The audits also encourage good monitoring practices by raising plant awareness of monitoring requirements The field audit consists of a thorough evaluation of the CEMS via pre-audit record review on-site inspection of equipment and system peripherals record reviews test observations and interviews with the appropriate plant personnel
EPA has defined three levels (see Table 1-3) to describe field audit activities and procedures and the objective of the audit
Page 8 Part 75 Field Audit Manual ndash July 16 2003
Section 1 Introduction
Table 1-3 Levels of Field Audits
Audit Level
Records Review
On-site Inspection of CEMS
Daily Calibration Observation
Linearity or RATA
Observation
Performance Test Audit
Level 1
Level 2
Level 3
The Level 1 audit may be used to verify Part 75 recordkeeping requirements emissions data and monitoring plan information and is recommended as a follow-up to a previous audit This audit consists of an on-site inspection records review and daily calibration observation A Level 2 audit expands the audit to include a performance test observation The test observation is a critical element to ensure that CEMS are properly operating and performance test protocols are being conducted in accordance with the required standards For this reason EPA encourages agencies to perform Level 2 audits which are the focus of this manual
A Level 3 audit involves agency personnel conducting a performance test instead of merely observing the test Conducting a performance test such as a linearity test or relative accuracy test audit provides an independent assessment of the monitoring systems Because of the equipment and expertise involved EPA does not emphasize that State or local agencies perform Level 3 audits However some agencies strongly support Level 3 audit programs and Section 8 of this document provides guidance on various Part 75-related issues for those agencies that do conduct performance tests as part of their inspection program
14 Role of the Inspector
Your primary task as an inspector conducting a field audit is to document whether the monitoring at a facility is in compliance with the Part 75 requirements To carry out this task you will need to understand the Part 75 rule and have a general understanding of CEMS components and their function You will also need to ask questions carefully record your observations and compile the information necessary to determine compliance
Your role is not to provide technical advice or consulting on the operation of the monitoring equipment The source is responsible for operating the monitoring equipment and correcting any monitoring problems At the same time however the field audit is an opportunity to provide information to the source on Part 75 requirements You might for example clarify regulatory requirements and you should share with the source your observation of monitoring practices that may create regulatory problems
Part 75 Field Audit Manual ndash July 16 2003 Page 9
Introduction Section 1
Importance of Missing Data Under Part 75
Because Part 75 monitoring is used to account for total mass emissions when the monitor or monitoring system fails to record a valid hour of data Part 75 uses a conservative approach to substitute for missing data Audit findings may invalidate data and require use of substitute data so the findings could have a significant financial impact independent of any non-compliance issues
If your findings indicate that data from a monitor may be invalid which would require the source to use substitute data it is important to inform the source of the problem during the field audit Extensive missing data generally will penalize a source in allowance accounting and result in a significant monetary penalty for the source For the same reason it is important to notify CAMD quickly of the potential for invalidating data so that the issue is resolved prior to the end-of-year compliance process EPAs primary concern is to collect accurate CEM data to ensure the integrity and fairness of the trading program EPA has no interest in prolonging the length of time that a source is considered out-of-control Thus the goal of the audit should be to promptly identify
what needs to be corrected so that the source is once again reporting quality-assured verified emissions data This issue is discussed further in Section 72
141 Hands Off Approach
EPAs policy is to use a hands off approach when conducting the audit so that you do not have any physical contact with the CEMS hardware This approach avoids creating a situation in which monitoring equipment may be damaged or the inspectors actions may be questioned should the monitoring system fail to operate well during the audit You should ask authorized plant personnel to perform any actions with the CEMS equipment (for example initiating a daily calibration check or displaying analyzer range) Remember it is more important for you as the inspector to observe how the CEMS operator performs hisher duties as this will indicate whether the plant personnel are able to follow appropriate requirements and procedures and will help to identify any problems that occur Have the operator explain what heshe is doing and show you where the procedure is documented
Page 10 Part 75 Field Audit Manual ndash July 16 2003
Section 1 Introduction
142 Inspection Safety
Any type of air pollution source inspection has potential health and safety problems and inspection safety is a serious concern Appropriate safety training is imperative for all inspectors and each plant may have specialized training andor safety equipment policies Before going on site for an audit you must ensure that you have all necessary personal safety equipment Also make sure to contact the site and ask for details on plant safety requirements Once on site use the safety equipment properly adhere to your agencys safety requirements and follow plant safety requirements as well Some of the hazards you may encounter in performing CEMS audits include
Accessing CEMS equipment or platforms and working at elevations with fall hazards Electrical shock when inspecting heated lines pumps or internal areas of CEMS
cabinets and enclosures Hazards associated with use or transport of compressed gas cylinders Hazards associated with poisonous calibration gases (NO) Exposure to effluent gases Entry of confined spaces Typical hazards associated with working in an industrial environment (moving
equipment vehicles and machinery trip and fall hazards etc)
143 Recommended Training
Courses
The following table lists EPA classes that you may find helpful in developing a knowledge base for performing Part 75 CEMS field audits at stationary sources State agencies
Air Pollution Training Institute
Information on EPA courses and course schedules are available at EPAs AIR Pollution Training Institute website httpwwwepagovairoaqpseogaptihtml
regional organizations or university professional development programs may provide similar courses in your area
Part 75 Field Audit Manual ndash July 16 2003 Page 11
Introduction Section 1
Table 1-4Available EPA Training Courses
EPA Course Number
Course Title
APTI 445 Baseline Inspection Techniques
APTI 446 Inspection Safety Procedures
APTI 450 Source Sampling for Pollutants
APTI 474 Continuous Emission Monitoring
SI 476B Continuous Emission Monitoring Systems Operation and Maintenance of Gas Monitors
T008-02 Safety and the Agency Inspector
T468-02 Stack TestingStack Test Observation for Traditional and Hazardous Air Pollutants
15 Key Part 75 M aterials with Internet Links
The following is a list of key Part 75 reference materials with internet links to the webpage where the document can be found either on the EPA website or the Government Printing Office website To avoid a dead link the links in most cases are not to the document itself but to the web page where a link to the document may be found l need to survey the page to find the direct link
40 CFR Part 75 - On the CAMD website you will find an unofficial consolidated version of the Part 72 and Part 75 rules that contains the current text of Part 75 (and sectsect 721 - 723 the Acid Rain Program rule general provisions efinitions measurements abbreviations and acronyms) as amended by recent revisions may find this unofficial version a helpful tool because it has an easy-to-
Recent Part 75 Revisions
bull June 12 2002 (67 FR 40394) and
bull August 16 2002 (67 FR 53503)
You wil
purpose d
Youuse format httpwwwepagovairmarketsmonitoringconsolidatedindexhtml
While all reasonable steps have been taken to make this unofficial version accurate the Code of Federal Regulations (CFR) and Federal Register (FR) take precedence if there are any discrepancies Official versions of FR revisions are available on the EPA
Page 12 Part 75 Field Audit Manual ndash July 16 2003
Section 1 Introduction
website httpwwwepagovfedrgstr and the official CFR is available at the Government Printing Office website httpwwwaccessgpogovnaracfrcfrhtml_00Title_4040cfr75_00html
Electronic Data Report Version 22 Reporting Instructions - The instruction manual describes each data field element for the information that is recorded and reported to EPA for Part 75 and provides the field auditor with a helpful summary of Part 75 requirements The EDR v22 Instructions support the June 12 2002 revised Part 75 rule httpwwwepagovairmarketsmonitoring
Parts 75 and 76 Policy Manual - This manual contains a series of questions and answers that can be used on a nationwide basis to ensure that the Part 75 provisions are applied consistently for all sources affected by the rule It is intended to be a living document EPA will issue new questions and answers as they arise and will revise previously issued questions and answers as necessary to provide clarification EPA intends to release a revised verison of the manual in 2003 httpwwwepagovairmarketsmonitoringpolmanindexhtml
Recertification and Diagnostic Testing Policy - Recertification is required whenever a replacement modification or change in the certified continuous emissions monitoring system or continuous opacity monitoring system occurs that may significantly affect the systems ability to accurately measure or record the pollutant or parameter of interest EPA is preparing a document to clarify what types of changes to a monitoring system may be considered significant EPA expects that the document will describe various events as either recertification events or diagnostic testing events and describe the type of certification or diagnostic testing that needs to be performed You should check the wwwepagovairmarkets website for release of this policy
Monitoring Data Checking (MDC) Software - The MDC software discussed in Section 3 of this manual allows regulated industry and State agencies to enter analyze print and export electronic monitoring plan certification and quality assurance data and to evaluate hourly emissions data required by Part 75 The software also allows regulated sources to submit electronically monitoring plan and certification data to EPA via ftp The software provides a standard Windows-based mouse-driven point and click user interface and can be installed under Windows 95 (or higher) Windows NT or Windows 2000 The software and installation instructions can be downloaded from the CAMD website httpwwwepagovairmarketsmonitoringmdc
40 CFR Part 60 Appendix A Reference Methods - The RATA reference methods (and related information) are available from EPAs Emission Measurement Center website The website versions of the reference methods are the official CFR version httpwwwepagovttnemcpromgatehtml
Part 75 Field Audit Manual ndash July 16 2003 Page 13
Introduction Section 1
An Operators Guide to Eliminating Bias in CEM Systems - This EPA publication is designed for CEMS operators as a tool for diagnosing and correcting the causes of measurement bias in CEMS It is also a useful CEMS reference guide for the field auditor httpwwwepagovairmarketsmonitoring
Observers Checklists for Test Methods 2F 2G and 2H - These are detailed observer checklists that can be used when observing a flow RATA using one of these alternative flow reference methods httpwwwepagovairmarketsmonitoring
Page 14 Part 75 Field Audit Manual ndash July 16 2003
Section 2 Part 75 CEMS Overview
This section provides a brief introduction to the various types of components of continuous emission monitoring systems that facilities have installed to meet Part 75 requirements
21 Introduction
The monitoring requirements of Part 75 are performance-based requirements that generally do not require that a source use a particular type of CEMS There are several types of CEMS available The differences in how these systems are designed and operate (in terms of sample acquisition sample handling sample analysis and data recording) can be important in understanding what to look for in a field audit and how to interpret audit results
This section provides only an overview of the major concepts related to the types of CEMS and their principles of operation For further detail on these complex systems see Section 27 which provides a list of in-depth references EPA recommends that inspectors who will conduct Part 75 CEMS audits should attend EPAs Air Pollution Training Institute course on CEMS (APTI Course 474) The summary information in this section draws heavily from the manual for that course (Jahnke 1992) as well as from an EPA reference manual specifically tailored to Part 75 CEMS (Gschwandtner and Winkler 2001)
All CEMS perform the following basic functions
Locate or extract a representative sample
Analyze the sample and
Compile and record the results
CEMS are divided into two types based on the first of these basic functions An extractive system removes and transports the sample from the stack to the analyzer often conditioning the sample prior to the analyzer An in-situ system analyzes the sample directly in the stack Illustration 2-1 identifies these two main system types There are several variations on these types which Sections 23 through 25 review
Part 75 Field Audit Manual ndash July 16 2003 Page 15
Part 75 CEMS Overview Section 2
Illustration 2-1Basic CEMS Types (Jahnke and Peeler 1997)
Illustration 2-2 shows a set of typical Part 75 CEMS at a Part 75 unit The flow and opacity CEMS are examples of in-situ systems The opacity monitor measurement is taken over a path across the stack Most continuous opacity monitors are double pass (light is transmitted across the stack and back to the detector) to meet EPA quality assurance requirements The ultrasonic flow monitor in this example also provide an integrated measurement along a path across the stack Flow and opacity CEMS are always in-situ systems The gas CEMS (SO2 NOx CO2) in Illustration 2-2 are dilution extractive systems In this illustration the gas is extracted at a single point (the sampling probe) and diluted with clean dry air The diluted sample is transported through the sampling line and analyzed on a wet basis
Page 16 Part 75 Field Audit Manual ndash July 16 2003
Section 2 Part 75 CEMS Overview
Illustration 2-2Example of Continuous Emission Monitoring Systems at a Part 75 Unit
In-situ gas CEMS (not shown in Illustration 2-2) are also used by Part 75 sources sometimes in conjunction with extractive gas CEMS The use of in-situ gas CEMS for Part 75 compliance is far less common than the use of extractive systems -- in 2002 only about three percent of the gas monitors used to meet Part 75 requirements were in-situ monitors In-situ gas CEMS can measure at a point (or short path) like an extractive gas CEMS or along a path across the stack similar to an opacity monitor
The following sections begin with a discussion of Part 75 requirements for the sample measurement location and then briefly describe the three basic types of systems under Part 75 (gas extractive CEMS gas in-situ CEMS and Flow CEMS) The final CEMS component --the data acquisition and handling system (DAHS) used for electronic data and reporting -- is a critical element for Part 75 compliance and is discussed separately in Section 26 Finally Section 27 provides references that you can use to gain an in-depth understanding of how these systems operate and what their limitations are
22 Sampling Location
Whether the system is extractive or in-situ the flue gas must be monitored at a location where the pollutant concentration and emission rate measurements are directly representative of the total emissions from the affected unit Flowing gases are generally well mixed but in some cases gas stratification can be a concern for the gas measurement location Stack flow on the other hand is always stratified to some degree (lower velocities along the stack walls) Cyclonic or swirling flow (flow that is not parallel to the stack center line) also will have a negative impact on flow monitors and manual reference test methods Thus the selection of sampling points and paths is an important concern for flow monitors To obtain a
Part 75 Field Audit Manual ndash July 16 2003 Page 17
Part 75 CEMS Overview Section 2
representative measurement and avoid problems due to stratification and cyclonic flow Part 75 provides specific requirements for the CEMS sampling location in Appendix A sect 1
221 Gas Measurement Location
Part 75 requires that the representative sampling location be chosen based on the procedures in 40 CFR Part 60 Appendix B Performance Specification 2 which suggests a measurement location (1) at least two equivalent diameters downstream from the nearest control device the point of pollutant generation or at another point at which a change in pollutant concentration or rate may occur and (2) at least a half equivalent diameter upstream from the effluent exhaust or control device Other Part 75 location requirements from Appendix A are summarized below
Locate the measurement location so that the gas CEMS (pollutant and diluent monitor) passes the certification RATA (Note - while not required specifically the diluent O2 or CO2 monitor should sample at the same point as the pollutant monitor)
Point Monitors - Locate the measurement point (1) within the centroidal area of the stack or duct cross section or (2) no less than 10 meter from the stack or duct wall
Path Monitors - Locate the measurement path (1) totally within the inner area bounded by a line 10 meter from the stack or duct wall or (2) such that at least 700 percent of the path is within the inner 500 percent of the stack or duct cross-sectional area or (3) such that the path is centrally located within any part of the centroidal area
222 Flow Measurement Location
Part 75 establishes the following basic location criteria for flow monitors
The location satisfies the minimum siting criteria of Part 60 Appendix A Method 1 (ie the location is greater than or equal to eight stack or duct diameters downstream and two diameters upstream from a flow disturbance or if necessary two stack or duct diameters downstream and one-half stack or duct diameter upstream from a flow disturbance) or
The results of a flow profile study if performed are acceptable (ie there are no cyclonic (or swirling) or unacceptable stratified flow conditions) Part 75 recommends that if a flow profile study indicates unacceptable results the facility should relocate the monitor or add straightening vanes or other source modifications to correct the flow patterns
Regardless of whether these criteria are met a flow monitor can be installed in any location if the flow CEMS can meet the Part 75 performance specification requirements
223 Sampling in Stratified and Swirling Flow Conditions
Stack flow is seldom ideal and some degree of stratification and swirling flow will be present at the monitoring location Approaches to dealing with stratification swirling or cyclonic flow and changing flow profiles due to load changes are discussed below
Page 18 Part 75 Field Audit Manual ndash July 16 2003
Section 2 Part 75 CEMS Overview
Stratified Flow - Flow monitoring systems may locate a single point or path representative of the reference method determined stack flow if the stratification is fairly constant over varying loads If stratification varies with load an array of sampling points can be placed across the stack to obtain a flow average instead of one single sample point For a path monitoring system that is already averaging over a line across the stack the source can select a path that is not as sensitive to the variation or can add a monitor to provide multiple paths on the cross section
Correction Factors - Part 75 allows the source to calibrate the flow monitor to the reference method flow (pre-RATA) Sources commonly use this approach to enable a flow CEMS to pass the multi-load flow RATA at a particular measurement location A flow RATA typically is performed at three loads to account for different flow profiles at changing loads The options described above for stratified flow can include application of a correction factor for stratification based on the reference method RATA values If the source conducts a test using new Methods 2F 2G or 2H (developed to account for non-parallel flow conditions and wall effects on flow measurement) calibrating to the reference method also can account for effects due to swirling Method 2 using the s-type pitot tube will be subject to bias if swirling or stratification due to wall effects or other factors are present Calibration of flow monitors relative to Method 2 under such conditions will not account for those effects
23 Extractive Gas CEMS
There are two types of extractive gas CEMS
The source level or direct extractive system extracts gas from the stack and conveys the sample to one or more analyzers These extractive systems will include filters to remove particulates and may include conditioning to remove moisture acids condensible particulates and interfering compounds In the case of a hot wet system the sample lines and analytic components of the systems are heated to prevent condensation of the stack moisture Heated lines are also required for dry systems up to the point where conditioning occurs
A dilution extractive system filters the stack sample and dilutes the stack sample with clean dry air Dilution occurs either inside the sample probe in the stack or outside of the stack usually at the stack port Dilution systems sample the gas at flow rates much smaller than those used in source level systems Using dry air to dilute the flue gas at ratios of 501 to 3001 the dew point of the diluted sample is reduced to levels where condensation will not occur in the monitoring system As a result moisture removal systems and heated sample lines may not be incorporated into the system A dilution air cleaning system however is required to clean the dilution air and remove CO2 water and any traces of the gases that are to be monitored
231 Source Level or Direct Extractive Systems
A diagram of a source level extractive system is shown in Illustration 2-3 The illustration shows both wet (heated sampling line by-passing the conditioning system) and dry systems
Part 75 Field Audit Manual ndash July 16 2003 Page 19
Part 75 CEMS Overview Section 2
2311 Sample Probe
Probes for source level extractive systems are constructed with stainless steel or Hastelloyreg tubes A coarse filter is commonly attached at the end of the probe to filter out particulate matter before it can enter into the tube Some designs place a deflector plate or cylindrical sheath around the filter to provide protection from plugging A coarse filter can also be in-line in a housing outside of the stack prior to the sample line Sometimes a combination of filters a coarse filter at the probe opening and an in-line fine filter outside of the stack are used to ensure the removal of particulate matter
Blowback or back purging is frequently used to keep the coarse filter from plugging This involves blowing pressurized air or steam back through the filter in an opposite direction to the normal stack flow The blowback occurs at regular intervals (typically from 15 minutes to 8 hours) and typically lasts for 5 to 10 seconds
Page 20 Part 75 Field Audit Manual ndash July 16 2003
Section 2 Part 75 CEMS Overview
Illustration 2-3 Typical Source Level Extractive CEMS
(Gschwandtner and Winkler 2001)
Part 75 Field Audit Manual ndash July 16 2003 Page 21
Part 75 CEMS Overview Section 2
2312 Sample Transport and Conditioning Systems
Most source level extractive systems used in Part 75 applications are dry systems which remove moisture prior to the sample pump and analyzer In a dry system the sample line from the probe to the moisture removal system is heated to prevent water condensation If the facility uses a wet system that does not remove moisture prior to the analyzer the entire length of the sample line sample pump and analyzer must be heated The sample line is usually wrapped in a tube bundle or umbilical which includes the sample lines blowback lines calibration gas lines heating elements and electric lines
Dry source level CEMS used in conjunction with a flow CEMS for Part 75 SO2 NOx
and CO2 mass measurements must also determine the moisture content of the stack gas Illustration 2-3 shows a heated wet sample line connected to a wet O2 analyzer This wet system is used in conjunction with the dry systems dry O2 analyzer to determine moisture Another alternative is to use an in-situ wet O2 analyzer with the dry extractive O2 analyzer A less common approach is to use an H2O analyzer to measure the wet sample
Moisture Removal Systems
There are two common types of moisture removal systems condensers and permeation dryers Condensers cool the gas below the dew point (using refrigerated coils or cooled jet stream condensers) and then remove the condensed liquid water from the gas stream Water removal is performed automatically to prevent filling the condensate trap and flooding the sampling line Absorption of SO2 and NO2 in the condensate is a concern so systems are designed to minimize contact time between the dried gas and liquid
Permeation dryers are constructed using Nafionreg a material that selectively allows the mass transfer of water vapor from the sample gas through the tube membrane to dry purge gas flowing in an outer tube in the opposite direction The gas entering the permeation dryer must be heated above the dew point temperature Permeation dryers avoid the problems of condensate absorption of pollutants and do not have condensate traps However the dryers can be subject to plugging problems from condensing liquids particulates or precipitates
Pumps
Diaphragm pumps and ejector pumps are the most common pumps used in extractive systems Both operate without pump lubricating oils which can cause sample contamination Both diaphragm pumps and ejector pumps can be heated and used in a hot wet system or used ahead of a conditioning system
Fine filter
Many analyzers require removal of particulate larger than 05 m so systems will usually have an additional fine filter near the analyzer inlet There are two types (1) a surface filter usually paper or other porous material which builds up a filter cake and (2) a depth filter which consists of packed fibers of quartz wool or other material
Page 22 Part 75 Field Audit Manual ndash July 16 2003
Section 2 Part 75 CEMS Overview
232 Dilution Extractive Systems
Most coal-fired units subject to Part 75 use dilution extractive systems As noted earlier dilution ratios range from 501 to 3001 A diagram of a dilution extractive CEMS is provided below showing an in-stack dilution probe unheated sample lines and pumps air cleaning subsystem calibration gases analyzers and DAHS
Illustration 2-4
Dilution Ratio = Q1 + Q2
Q2
where
Q1 = dilution air flow rate (Lmin) Q2 = sample flow rate (Lmin)
Dilution Extractive CEMS (Gschwandtner and Winkler 2001)
Part 75 Field Audit Manual ndash July 16 2003 Page 23
Part 75 CEMS Overview Section 2
The dilution of the sample can occur in the stack using a dilution probe or outside the stack using an out-of-stack dilution system Both approaches use the same operating principles A critical orifice controls the sample gas flow rate which is drawn through the orifice by creating a vacuum at the outlet of the orifice with an ejector pump As long as a sufficient vacuum is present the sample gas flow rate through the critical orifice is independent of the downstream pressure The ejector pump also called an aspirator or an eductor pump is operated by the compressed dry clean dilution air The dilution air flow through the venturi nozzle of the pump (flow rates of 1 to 10 Lmin) creates the vacuum pressure at the orifice outlet This vacuum pulls the gas sample through the orifice at rates of 50 to 500 mLmin (limited by the orifice design) and into the ejector pump where it mixes with the dilution air
2321 Dilution Probe
The in-stack dilution probe combines a sonic orifice (a glass tube drawn to a point) with an ejector pump inside the stack probe (See Illustration 2-5) The probe opening inside the stack is screened and uses a quartz wool filter to prevent particulate matter from entering the orifice Plugging has been a problem in applications with wet saturated conditions (after a wet scrubber) due to condensation that causes wetting of the filter and plugging of the orifice In some cases heated dilution probes have been successfully used where entrained water droplets are present
Illustration 2-5In-Stack Dilution Probe (adapted from Jahnke 2000)
Page 24 Part 75 Field Audit Manual ndash July 16 2003
Section 2 Part 75 CEMS Overview
Gas Density Affects
The sonic flow of stack gas through the orifice is affected by the stack gas density and viscosity which in turn are dependent on molecular weight stack pressure and temperature A change in any of these factors will affect the sonic flow and dilution ratio The primary means for addressing theses issues include
Molecular Weight Effect - Gas density changes that result from changing molecular weight are mainly due to changes in-stack moisture or CO2 concentrations These parameters do not vary much in base load units but both can be monitored and often are as part of the Part 75 CEMS With these measurements empirical corrections can be made to the dilution ratio
The molecular weight effect is also a concern in choosing calibration gases Gases used in the initial and subsequent QA tests should have a consistent molecular weight otherwise a bias can be introduced due to the molecular weight differences
Stack Pressure - Stack pressure (absolute stack pressure which includes ambient pressure and stack static pressure) can vary due to changing load or ambient conditions Stack pressure can be monitored separately with the DAHS applying pressure related correction algorithms to the CEMS data
Temperature - Temperature also can vary with load and can be monitored separately with the DAHS correcting the data as described above Temperature correction factors have been more difficult to develop however and have not worked well in situations with temperature changes greater than 50oF (Note - Calibration checks performed when the source is not operating may not provide valid results due to the temperature effect) In response some vendors heat the dilution probe -- the heated probe is the same as shown in Illustration 2-5 except electric heating coils are placed around the probe and controlled to maintain a constant temperature Another approach for stabilizing the temperature is to use an out-of-stack dilution system described in the next section
2322 Out-of-Stack Dilution System
The out-of-stack dilution system dilutes the sample outside of the stack where it is easier to maintain a constant temperature As noted earlier dilution in out-of-stack dilution systems is performed in the same manner as with in-stack dilution probes this time with a critical orifice and ejector pump Illustration 2-6 diagrams one manufacturers out-of-stack dilution system The probe in this type of system is a simple tube similar to that used in a source level system Note that these systems are also affected by the changes in gas density described above and the use of stack moisture or CO2 corrections may be necessary
Part 75 Field Audit Manual ndash July 16 2003 Page 25
Part 75 CEMS Overview Section 2
Illustration 2-6One Type of Out-of-Stack Dilution System
(Gschwandtner and Winkler 2001)
2323 Sample Transport and Dilution Air Cleaning Systems
Sample Lines
The sample line for a dilution system as in the source extractive system is often wrapped in a tube bundle or umbilical which includes the sample lines blowback lines calibration gas lines heating elements and electric lines The sampling line often does not need to be heated after the dilution air has been added but heated freeze protect lines are used in regions of the country where sub-zero temperatures may occur or if the dilution ratio is low
Dilution Air Cleaning System
The dilution air cleaning subsystem delivers dry clean pollutant-free air to the dilution probe It consists of a series of particulate and charcoal filters dryers and scrubbers which reduce CO2 NOx SO2 moisture organic compounds and other compounds in ambient air to sub-ppm levels
The dilution air is compressed air provided by the plants utilities commonly referred to as plant air or from a compressor dedicated to the CEMS In either case the compressed air enters an air cleaning subsystem where it is further cleaned and regulated If the filters and
Page 26 Part 75 Field Audit Manual ndash July 16 2003
Section 2 Part 75 CEMS Overview
scrubbers are changed regularly and there are no leaks in the subsystem the dilution air will be dry clean and free of contaminants including CO2
The flow of pressurized dilution air through the ejector pump moves the sample to the analyzers so a separate pump is not required The dilution air pressure should be held relatively constant because changes in the pressure will affect the dilution ratio Some systems include mass flow controllers to maintain the dilution flow rate at a constant level
233 Calibration Gas System
Part 75 quality assurance requirements include daily calibration error tests and linearity tests (usually quarterly) which challenge the extractive gas CEMS with calibration gases of known concentrations The calibration gases used in the tests include a zero level gas as well as low mid and high concentration levels based on the span of the monitor The calibration gas system consists of calibration gases gas regulators valves and line filters The gases must meet the criteria specified in Part 75 Appendix A sect 51
Calibration gases for the daily calibration error test and linearity tests are injected as close as possible to the probe (Part 75 App A sect 221) The calibration gas system must include controls to ensure that calibration gases are injected at the same flow rate pressure and temperature as the sample gas under normal system operation
There are two common injection locations for source level extractive systems (1) the calibration gas is injected into the in-stack probe external filter housing and is drawn into the sampling system or (2) the calibration gas may be injected into an internal filter housing between the probe and sample line at the stack flange In dilution extractive systems the calibration gas must be injected into the dilution probe housing with the calibration gas drawn through the sonic orifice In an out-of-stack dilution system the calibration is injected prior to the inlet of the critical orifice
Calibration gases are also sometimes injected at the analyzers when performing certain diagnostic tests or calibration adjustments
234 Analyzers
Gas analysis methods for extractive systems can be divided into four major categories Those categories with common Part 75 applications are shown in Table 2-1 and are briefly described below More detailed discussion of analyzer operating principles are available in the references listed in Section 27 The CEMS designer will choose the analytical method based on the overall system design (eg dilution extractive versus source-level extractive wet versus dry systems) In source level extractive systems the gas analyzers measure at stack concentrations in the ppm range while in the dilution extractive system gas analyzers read in the ppm or ppb range similar to those of ambient monitors
Part 75 Field Audit Manual ndash July 16 2003 Page 27
Part 75 CEMS Overview Section 2
Table 2-1Common Extractive Gas CEM Analytical Methods
Techniques Gas Measured
Absorption Spectroscopic Methods
Non-Dispersive Infrared (NDIR) SO2 NO CO2 H2O
Gas Filter Cell Correlation (GFCIR) SO2 NO CO2 H2O
Differential Absorption (UV) or (IR) SO2 NO CO2
Luminescence Spectroscopic Methods
Chemiluminescence NO NOx
Fluorescence SO2
Electro-Analytical Methods
Electrocatalysis O2
Paramagnetic Techniques
Magnetodynamic O2
Thermomagnetic O2
2341 Absorption Spectroscopy
Absorption spectroscopic methods measure the amount of light absorbed by a pollutant molecule The analyzer has four main components (1) radiation source to produce the light in the desired range of the spectrum (2) spectral limiters which further reduce the band width of the light to specific wave lengths (3) detectors which measure the light energy (4) optical components which direct and focus the light and (5) components to correct for interfering gases and drift (eg a reference gas cell)
Non-Dispersive Infrared (NDIR)
Non-Dispersive Infrared (NDIR) monitors are commonly used to measure CO2 in dilution extractive systems The analyzer measures the degree of absorption of infrared light by molecules in the sample gas compared to a reference cell containing gas that does not absorb infrared light in the wavelengths used by the instrument The ratio of the detector signals from the two cells is used to determine the light transmittance which is related to the CO2
concentration using calibration curves developed with known gas quantities The monitors are called non-dispersive because filters are used to narrow (not disperse) the infrared wavelength to a small range centered on the absorption peak of the molecule of interest
Gas Filter Cell Correlation (GFCIR)
Gas Filter Cell Infrared analyzers use a variation of the NDIR technique by using a reference cell that contains 100 percent concentration of the pollutant measured instead of 0 percent The reference cell will remove most of the light at the infrared wavelength absorbed
Page 28 Part 75 Field Audit Manual ndash July 16 2003
Section 2 Part 75 CEMS Overview
by the compound of interest This method is more commonly used in in-situ applications but is used in extractive systems
Differential Absorption
Differential Absorption analyzers perform measurements at two different light frequencies One frequency is absorbed by the target molecule while the other reference frequency is not The ratio of the absorption at the two wavelengths is correlated to the target gas concentration Again calibration curves are created using known gas concentrations Part 75 sources use UV non-dispersive photometers for SO2 and NOx measurements These types of instruments can be used in wet extractive systems as water vapor does not absorb light very well in the UV region There are also differential absorption analyzers that use light in the infrared region particularly for CO2 in wet source-level extractive systems
A single differential absorption analyzer may also measure a number of component gases by using multiple wavelengths of light
2342 Luminescence Spectroscopy
Luminescence spectroscopic methods measure the amount of light emitted by an excited molecule Analyzers using these methods are very specific for a given molecule and are more sensitive than absorption spectroscopy or electrochemical methods As in the absorption spectroscopic methods all of the instruments use calibration curves developed from known target gas compositions to relate the measured light energy to gas concentration
Chemiluminescence
Chemiluminescence monitors are commonly used for NOx in dilution extractive systems Chemiluminescence is the emission of light produced as a result of a chemical reaction and a chemiluminescence NO - NOx monitor measures the amount of light generated by the reaction of NO with O3 This monitor uses an ozone generator to produce O3 and a catalytic converter to reduce NO2 in the sample gas to NO before reacting with O3 The monitor can measure both NO or NOx by sequencing the NO-O3 reactions First the sample gas can bypass the converter and go directly to the reaction cell measuring the NO Then after this reaction the gas goes to the converter where the NO2 is reduced to NO and sent back to the reaction chamber to measure NOx (NO and NO2) NO2 can be determined by subtracting the NO measured by the first measurement from the total NOx (NO and NO2) measured in the second step
Fluorescence
Fluorescence analyzers are used to measure SO2 in both dilution and source-level extractive systems Fluorescence occurs when a molecule absorbs light at one wavelength as a result of the absorbed energy the molecule emits light at a different wavelength The analyzer uses light (either from a continuous or pulsed infrared light source) to irradiate the gas sample The light radiated back from the sample is measured by the sensor after filtering to select a narrow bandwidth of the fluorescent radiation
Interference from quenching is a concern for both chemiluminescence and fluorescence analyzers Quenching occurs when the excited molecules collide with other molecules losing energy as a result of the collision This changes the energy state from the level caused by the
Part 75 Field Audit Manual ndash July 16 2003 Page 29
Part 75 CEMS Overview Section 2
analyzer chemical reaction or irradiation For example in a fluorescence analyzer the excited SO2 molecule in the gas sample might collide with another molecule changing its energy state from what it would have been due to the analyzer irradiation This can be a problem if the stack gas composition changes as different molecules have different quenching affects It is also a problem if the calibration gas background concentrations change (single blend - multiblend calibration gases)
Quenching effects can be limited by using dilution extractive systems which will result in a constant background composition (the dilution air) Fluorescence analyzers can also use ultraviolet light at lower wavelengths to shorten the fluorescence time to reduce quenching probabilities Chemiluminescence systems can increase the O3 flow into the reaction chamber to provide a more constant background concentration
2343 Electro-Analytical Methods
The zirconium oxide (ZrO2) analyzer an electrocatalytic analyzer is the most common O2 analyzer used by Part 75 sources The analyzer can measure O2 on both a dry and wet basis and it is used with source level extractive systems and as an in-situ monitor
This analyzer uses a heated ceramic material (ZrO2) with a thin platinum catalytic coating as a solid electrolyte which allows the transfer of oxygen from the reference side of the cell (maintained at 21 percent O2) to the sample side (continual flow of stack gas with lower O2
concentrations eg 3 - 6 percent) The sample O2 concentration can be determined by measuring the electromotive force of the O2 transfer combined with a stable cell temperature and reference cell partial O2 pressure
The ZrO2 electolyte is heated to 850 oC At that temperature O-2 ions catalyzed by the platinum can move through the material Combustibles materials in the stack gas sample (CO hydrocarbons) can burn at the operating temperatures of the analyzer consuming sample gas O2 The combustible concentrations however are in much lower concentrations (ppm) than the O2 and have a negligible impact on O2 measured on a percentage basis
2344 Paramagnetic Techniques
Paramagnetic techniques are also used by Part 75 sources to measure O2 Analyzers using these techniques are only used in conjunction with source level extractive systems and water and particulate matter must be removed prior to the monitor
Molecules that are attracted by a magnetic field are described as paramagnetic while those repelled are called diamagnetic Most materials are diamagnetic but O2 is paramagnetic and strongly attracted to magnetic fields compared to most other gases (though NO and NO2
are also paramagnetic and may cause interference if present at high concentrations)
Magnetodynamic
A magnetodynamic analyzer makes use of the effect that O2 has on modifying a magnets magnetic field In a dumbbell type of magnetodynamic analyzer a torsion balance dumbbell with diamagnetic glass spheres is suspended in a nonuniform magnetic field The dumbbell spheres are pushed away from the strongest part of the magnetic field Oxygen alters the field causing a change in the dumbbell position A light source mirror on the dumbbell and
Page 30 Part 75 Field Audit Manual ndash July 16 2003
Section 2 Part 75 CEMS Overview
detector measure the dumbbell position Current through a wire encircling the dumbbell creates an electromagnetic counter-torque which restores the mirror to the position when O2 is not present The amount of current required to restore the dumbbell position is related to the amount of O2 present
Thermomagnetic
Thermomagnetic analyzers are often called magnetic wind analyzers and are based on the decrease in the paramagnetic attraction of O2 with increased temperature The O2 in the sample gas is drawn into a tube with a heated coil filament and magnetic field at one end The O2 enters the tube attracted by the magnetic field As the molecules are heated the paramagnetic attraction is decreased and the heated molecules are pushed out by cooler molecules with stronger paramagnetic attraction The O2 flow through the tube creates the so called wind and cools the heating coil reducing its resistance The change in resistance is measured and related to O2 concentration The monitor can be affected by changes in the gas composition which affect thermal conductivity and the filament temperature Combustible materials can also react on the heated filament changing the resistance
24 In-Situ Gas Monitors
In-situ gas monitors are far less common at Part 75 sources In-situ monitors were initially designed for high concentration combustion gas applications not for the lower pollutant gas concentrations following pollution control devices Some in-situ analyzers also had difficulty meeting EPA certification and quality assurance requirements However in-situ monitors do have some advantages over extractive systems The monitoring system measures concentrations at stack conditions and eliminates the need for the sample transport and conditioning systems required by extractive CEMS Newer designs offer a wider range of analyzer options and virtually all point and some path systems can now be calibrated with calibration gases as required by Part 75
In-situ monitors are classified as either path or point monitoring systems (See Illustration 2-6) The in-situ point CEMS measures gas concentrations at a single point in the stack much like the single probe in a gas extractive system The term point is used when the sampling is over a short path but still much less than the stack cross-section The in-situ path CEMS measures gas concentrations over an optical path equivalent to the internal stack diameter by transmitting a light through the flue gas (single pass) and sometimes back (double pass)
Part 75 Field Audit Manual ndash July 16 2003 Page 31
Part 75 CEMS Overview Section 2
Illustration 2-7In-Situ Gas CEMS (Jahnke 1992)
241 Path In-Situ CEMS
Path in-situ CEMS use spectroscopic analytical methods to measure pollutant concentrations in the flue gas The systems have the same principle components as an absorption spectroscopic analyzer described in Section 2341 (1) radiation source to produce the light in the desired range of the spectrum (2) spectral limiters which further reduce the band width of the light to specific wave lengths (3) detectors which measure the light energy and (4) optical components which direct and focus the light In addition blowers are required to keep the optics clean of stack particulate
In a single pass system a light transmitter and detector are located on opposite ends of the light path and the light makes one pass along the measurement path A double pass system has the transmitter and light source on one end of the sample path and a retroreflector at the opposite end to reflect the light back to the detector The light makes two passes along the measurement path
242 Point In-Situ CEMS
The in-situ point CEMS typically consists of a measurement probe which contains a cavity in which the sample gas can be measured either by a sensor or by light absorption The probe opening is protected by some sort of particulate filter (ceramic sintered stainless steel or Hastelloyreg filter) The sample concentrations within the cavity adjust to changing effluent concentration via diffusion through the filter
243 In-Situ Gas Analyzers
In-situ monitors use spectroscopic and electro-analytical techniques similar to extractive systems described earlier in Section 234 In extractive system spectroscopic analyzers the light interacts with the sample within the analyzer instrument For in-situ spectroscopic analyzers the light interacts with the sample in the sample probe (point in-situ) or across the
Page 32 Part 75 Field Audit Manual ndash July 16 2003
Section 2 Part 75 CEMS Overview
stack diameter (path) Analytical methods used by in-situ gas monitors at Part 75 sources are shown below in Table 2-2
Table 2-2In-Situ Gas Analyzer Methods
Techniques Gas Measured
Absorption Spectroscopic Methods
Differential Absorption (UV) SO2 NO
Gas Filter Cell Correlation (GFCIR) CO2
Second Derivative Spectroscopy (UV) SO2 NO
Electro-Analytical Methods
Electrocatalysis O2
244 System Calibration
Daily calibration error tests and linearity tests can be performed on point in-situ gas CEMS in a manner similar to extractive gas CEMS by flooding the probe with the calibration gases QA tests for path systems are more difficult Path systems can use a flow through calibration cell that is placed in the measurement path for linearity and calibration error tests The tests must use EPA Protocol gases and the calibration cell must be located so as to challenge the entire measurement system
The system consists of a calibration cell which is a flow-through gas cell for the zero and other calibration gases and a zero mirror to reflect the light back to the detector without traveling through the stack The calibration cell should be at the same temperature and pressure as stack conditions If the flow-through cell has a length shorter than that of the sample path calibration gas at high concentrations (percent levels) may be necessary For CO2 the only way to perform the daily calibration and linearity tests is to have a flow-through cell with the same path length as the sample path
A single path system can not use a zero mirror One approach for single pass systems is to use a zero pipe combined with the flow through calibration cell The zero pipe provides an optical path not affected by the stack gas
25 Flow CEMS
There are three types of flow CEMS in use today at Part 75 sources
Differential pressure flow monitors Thermal mass flow monitors and Ultrasonic flow monitors
Part 75 Field Audit Manual ndash July 16 2003 Page 33
Part 75 CEMS Overview Section 2
All of the flow monitors are in-situ monitors determining flow on a wet basis based on dynamic measurements of parameters that can be related to the stack velocity at a point or along a path within the stack
251 Sampling Location
As noted earlier in Section 22 the measurement location must provide a representative volumetric flow over all operating conditions Stratified flow profiles cyclonic flow and flow profiles that change with load all can impact the choice of measurement location Multiple measurement points or paths and the use of correction factors to calibrate the flow CEMS to the reference method (pre-RATA) may be required to meet the location requirements in Appendix A sect 12
252 Differential Pressure
Flow Monitors
Factors Affecting Flow Data Accuracy
Representative sampling points Sensormonitor accuracy and stability
(performance specifications in Appendix A sect 33)
Accuracy of secondary parameter values (gas temperature measurement path length)
Accurate duct dimensions (area calculation)
Proper calibration
Differential pressure monitors sense the difference between the impact and wake pressures at tube openings (pitot tubes or multi-point tubes) in the gas flow and a differential pressure transducer converts the pressure signals into electric current ifferential pressure is the difference between the impact and wake pressures e differential pressure is combined with stack gas temperature stack pressure and molecular weight to determine velocity using the pitot equation below olumetric flow is calculated by multiplying velocity by the stack or duct cross sectional area
where vs = stack gas velocity Kp = dimensionless constant Cp = pitot tube coefficient p = velocity pressure Ts(abs) = absolute temperature of the stack gas Ps = absolute pressure of the stack gas Ms = molecular weight of the stack gas
Usually the molecular weight of the flue gas and stack pressure are assumed to be constants and are not measured Temperature measurements are made either with a thermocouple or resistence temperature device (RTD) The temperature probe should also be placed in a location representative of the stack flow profile
The dTh
V
Page 34 Part 75 Field Audit Manual ndash July 16 2003
Section 2 Part 75 CEMS Overview
The flow CEMS differential pressure probe may measure at one point in the stack or at multiple points using a multi-point averaging probe or multiple pitot tube assembly (See Illustration 2-7)
Differential pressure monitors are sensitive to non-parallel or swirling flow If the flow is at an angle to the stack center line there will be a bias in the velocity measurement The bias is usually positive
Illustration 2-8 Example of Multiple Probe Locations (Jahnke 1994)
Quality Assurance Issues
Probe and line plugging is minimized by intermittently back purging the line and probe openings with clean air Back purging is required as a daily interference check (Part 75 Appendix A sect 2222) and prevents extreme plugging in most situations Daily calibration error tests are performed after the probe and test the pressure transducer and system electronics The pressure side of the probe or transducer is pressurized to a pre-set level to check the span and then both inputs are equalized to test the zero level Because probes are subject to corrosion and abrasion they should be visually inspected periodically in addition to these tests Part 75 requires a quarterly leak check of all sample lines for a differential pressure flow monitor
253 Thermal Mass Flow Monitors
Thermal mass flow monitors are based on the principle of thermal heat transfer due to convection Gas flowing across a heated surface tends to cool the surface The molecules of the flowing gas interact with the heated boundary layer surrounding the surface and remove heat The greater the flow rate the more heat is removed There are two types of sensors used by thermal flow monitors the constant power anemometer and the constant temperature anemometer
Both types of anemometers use two RTDs one heated and the other unheated The RTDs are usually protected by a stainless steel tube and mounted together in the stack The constant power anemometer measures the temperature difference between the RTDs at a constant current The temperature difference responds proportionally to changes in velocity The temperature difference will be high at low velocities (less cooling of the heated RTD) and
Part 75 Field Audit Manual ndash July 16 2003 Page 35
Part 75 CEMS Overview Section 2
low at high velocities (more cooling of the heated RTD) The constant temperature anemometer maintains a constant temperature difference between the RTDs by varying the current The change in current is proportional to the change in gas velocity The higher the velocity the higher the current required to maintain the heated RTD temperature conversely at lower velocities a lower current is required
The sensors can be placed at a single point if the flow profile or in a multiple point array depending on flow conditions
Illustration 2-9Thermal Mass Flow Monitor Probe (adapted from Jahnke 1992)
(Th = Temperature of Heated RTD Ta = Temperature of Unheated RTD)
The output from a thermal flow monitor (an empirical function dependent on the measured temperature difference gas composition and power to the anemometers) is proportional to mass flow Information on the flue gas density is required to convert mass flow to volumetric flow The gas density is dependent on fuel gas composition so changes in moisture or CO2 can affect the systems response
f(heat loss) f(Tv - Ts) = vsAs
where vs
f(Tv - Ts) Tv
Ts
As
= stack gas velocity= heat loss function= temperature of velocity sensor= stack temperature= gas density= stack cross sectional area
Thermal flow monitors can not be used in locations where there are entrained water droplets The water droplets evaporate on the sensor causing a dramatic temperature loss due to the heat of evaporation which would be interpreted as caused by the flowing gas Corrosion and particulate build up on the sensors can be a problem
Page 36 Part 75 Field Audit Manual ndash July 16 2003
Section 2 Part 75 CEMS Overview
Daily Interference and Calibration Error Tests
The daily interference test check requires a means to ensure on a daily basis that the probe is sufficiently clean to prevent interference (Part 75 Appendix A sect 2222) The sensors are usually cleaned by self heating at temperatures of 700oF or higher to burn off any adhering particles or chemical compounds Daily calibration error tests check that the sensors are operational and that the system electronics are functioning correctly
254 Ultrasonic Flow Monitor
Ultrasonic flow monitors measure the time required for an ultrasonic pulse to travel across a stack or duct at an angle to the stack flow The monitors are also called transit time monitors The monitor consists of downstream and upstream transducers located opposite of each other on the stack wall which send and receive ultrasonic pulses The difference in the time that it takes for the pulse to go in the different directions between the two transducers (the time it takes to go downstream is shorter than the time to go upstream) and the distance traveled are used to calculate velocity The equation for an ideal flow profile is shown below
where va = average velocity of the flue gas L = distance between the transducers = angle of inclination t1 = traverse time in upstream direction t2 = traverse time in downstream direction
The most common angle of inclination or path angle between the transducers at Part 75 sources is 45o Other angles are possible and various designs and approaches are used to optimize signal recognition for better transmission reception reliability and accuracy
Illustration 2-10 Ultrasonic Flow Monitor
Part 75 Field Audit Manual ndash July 16 2003 Page 37
Part 75 CEMS Overview Section 2
The velocity of the sound pulse through the stack gas is affected by the stack gas density so changes in the stack temperature due to load changes andor temperature variations across the sonic path will affect the flow measurement In some cases correction factors can be developed using the pre-RATA testing to account for these changes
Non-parallel flow will also affect the ultrasonic monitor measurements If the angle or pitch of the non-parallel flow is in the same direction from the stack center line as the measurement path inclination the flow measurement will have a positive bias The flow measurement will have a negative bias if the flow pitch angle and inclination angle are in opposite directions Two ultrasonic monitors measuring along different path cross sections (an x-pattern) can be used in situations with a stratified flow profile that varies with load One path is usually sufficient if the stratification is stable
Daily Interference and Calibration Error Tests
Part 75 requires a means to ensure on at least a daily basis that the probe remains sufficiently clean to prevent interference (Part 75 Appendix A sect 2222) Blowers are provided to keep the sensors clean much like on an opacity monitor The blower air is heated to the temperature of the flue gas to prevent condensation which may damage the transducer Daily calibrations of this type of flow CEMS are indirect The electronic calibration process verifies that the upstream and downstream sensors are working in both the transmitting and receiving modes The procedure also verifies that the signal to noise ratio is acceptable
26 Data Acquisition and Handling System (DAHS)
The term data acquisition and handling system (DAHS) refers to the CEMS hardware and software components that take the output from the analyzers combine it with other information and compute hourly emissions The DAHS acquires and stores the necessary data (Part 75 requires that the DAHS automatically record all emissions data and the daily calibration error checks - Appendix A sect 4) It also computes the emissions and quality assurance test results in terms of the regulatory requirements displays the data and produces the quarterly reports required by Part 75 The DAHS software for Part 75 is highly specialized to match the electronic data reporting (EDR) format
In addition to a DAHS a CEMS requires softwarehardware components for system control functions These functions include automatic calibration probe blowback analyzer sequencing for time-shared analyzers error detection diagnostic routines and similar tasks
261 CEMS Computer Systems
In general there are two approaches for a CEMS computer system In one approach a single computer handles both the CEMS control functions and the DAHS functions In the other there is a separate control system that handles the CEMS functions and may manipulate data as an interface between the analyzers and a separate DAHS computer Because of the complexity of the control and DAHS functions in Part 75 CEMS it is more typical to have separate systems for control and data acquisition and handling
System control hardware options include computers programmable logic controllers (PLCs) data loggers and embedded microprocessors Besides providing CEMS control
Page 38 Part 75 Field Audit Manual ndash July 16 2003
Section 2 Part 75 CEMS Overview
functions described above controllers also can provide some analyzer data processing prior to the DAHS These may include converting analog data to digital and performing some of the automatic correction calculations and emission calculations
The DAHS computer is most often a stand alone personal computer although some plants are using the plants distributive control system (DCS)
262 Emissions Data Processing
The analyzers may send digital signals directly to the DAHS or send analog signals that must be converted to a digital value and scaled The real time second-to-second data is first averaged (1-15 minutes) by the analyzer control interface or DAHS Corrections may be applied to the data (eg pressuretemperature compensation molecular weight flow and moisture monitoring polynomials sonic velocity correction factors NOx quenching correction factors and dilution ratio settings) and the data then converted to the proper units for the Part 75 formula calculations
The data must be averaged again to one-hour averages as required by Part 75 A valid measurement must be recorded in each quadrant of the hour except when performing required Part 75 QA testing (eg a daily calibration or quarterly linearity test) For hours in which Part 75 QA testing is performed only two quadrants of the hour need to be captured (sect 7510(d)(1)) The hourly data are then used to calculate the Part 75 emissions parameters and rates based on formulas in Part 75 Appendices D - G with the CEMS-based formulas in Appendix F A table of the required formulas is provided in the EDR v22 Reporting Instructions (August 2002)
263 QA Test Data Processing
As noted previously Part 75 requires automatic data capture and calculation of daily calibration error test results Other QA test data and results may be entered manually Automatic and manual data entry for a Part 75 DAHS are discussed further in Section 46 of this manual and in Section IIC3 of the EDR v22 Reporting Instructions
Some CEMS use the daily calibration error test results to automatically correct the analyzer data These mathematical adjustments are similar to an internal bias adjustment factor in that the DAHS evaluates the response in comparison to the reference value and assigns from that time forward an adjustment factor which is used to adjust the data for reporting
264 Part 75 Reporting
The DAHS generates the quarterly electronic data report (EDR) submitted by the source to EPAs Clean Air Markets Division The EDR is in ASCII text format with each line representing a separate record which includes plant and unit information monitoring plan information hourly monitoring data and QA test results The reports are sent directly to EPA by electronic data transfer There is more discussion of the EDR in Section 311 of this manual
Part 75 Field Audit Manual ndash July 16 2003 Page 39
Part 75 CEMS Overview Section 2
27 References
Gschwandtner G and Winkler J (2001) US EPA Acid Rain Program Continuous Emissions Monitoring Systems Reference Manual US Environmental Protection Agency Acid Rain Division
Jahnke J A (1992) APTI Course 474 Continuous Emissions Monitoring Systems Student Manual (Revised) US Environmental Protection Agency Office of Air Quality and Planning Standards
Jahnke J A (1994) An Operators Guide to Eliminating Bias in CEM Systems US Environmental Protection Agency Office of Air and Radiation EPA 430-R-94-016
Jahnke J A and Peeler J W (1997) Handbook Continuous Emission Monitoring Systems for Non-Criteria Pollutants US Environmental Protection Agency Office of Research and Development EPA625R-97001
Jahnke J A (2000) Continuous Emission Monitoring Second Edition John Wiley amp Sons Inc
Shigehara R T and Peeler J W (1998) Evaluation of Daily Calibration Techniques of Continuous Flow Monitoring Systems US Environmental Protection Agency Acid Rain Division
Page 40 Part 75 Field Audit Manual ndash July 16 2003
Section 3 Audit Preparation
Section 3 covers the data that are available to help you prepare for the field audit and explains how to use that data eparing for the audit can increase your efficiency by allowing you to target issues for auditing while at the plant lso gain credibility with plant personnel if you come prepared ection emphasizes the use of the MDC software to review quarterly electronic data
PrYou a
This s
31 Using Part 75 Electronic Data to Conduct Pre-Audit Reviews
You will have available two types of source file information in preparing for a Part 75 field audit Hardcopy file information may include correspondence petition responses portions of the monitoring plan (such as system diagrams) reports of previous inspections or audits performance test reports and permits This type of information may be similar to background file information available for other types of air compliance inspections and audits
The second type of information is the quarterly electronic report required under Part 75 This wealth of electronic data generally is not available under other programs and provides a valuable resource that you can use prior to the plant visit to conduct monitoring checks and to identify potential source monitoring problems The electronic information includes data on the units monitoring plan certification and recertification events QA tests and emissions and operating data for each hour of the quarter
This section first introduces you to the quarterly Electronic Data Report (EDR) The section then describes how to review reports that EPA sends to affected sources to provide feedback on each EDR submitted Finally the section focuses on how to use EPAs Monitoring Data Checking (MDC) software to review EDRs
The format and volume of the electronic data can be daunting at first especially for inspectors who have responsibilities for multiple air programs The MDC software will be a vital asset to help you access and analyze the EDR and you should ensure that you take advantage of this tool as you prepare for an audit
311 Quarterly Electronic Data Reports
A facility usually submits each Part 75 quarterly EDR on a unit basis so one facility may submit multiple EDRs each quarter In other cases one report may be submitted for all units that exhaust to a common monitored stack or other complex stack configuration The EDR is in ASCII text format with each line representing a separate record referred to as a record type or RT An example of the layout of information in a report line or record type is provided in Illustration 3-1 In this example a line of hourly NOx emission rate data (RT 320) is presented If you want to explore the structure and content of the EDR in more detail you should review the most up-to-date version of the EDR Reporting Instructions and Formats --see Section 15 for guidance on how to access the EDR guidance documents
Part 75 Field Audit Manual ndash July 16 2003 Page 41
Audit Preparation Section 3
Illustration 3-1Example EDR Data Format for Record Type 320
To show you the various data elements you will see in an EDR Illustration 3-2 below provides an example summary of the content of an EDR by record type The example is for two Acid Rain CEMS units monitored at a common stack A number of these record types like RT 320 in Illustration 3-1 above pertain to emissions or operating data that are reported for each hour of operation so a quarterly EDR will have many lines of data A quarterly EDR for a unit with a single stack may have over 20000 lines An EDR in text file format therefore may look overwhelming but the MDC software tool allows you to streamline your review and analysis of the data
Page 42 Part 75 Field Audit Manual ndash July 16 2003
Section 3 Audit Preparation
Illustration 3-2Example Summary Of Quarterly Report Content For Two Acid Rain
CEMS Units Emitting Through Common Stack
FACILITY INFORMATION Type 100 Record (Facility and report data)
Type 102 Record (Facility information)
COMMON STACK FOR UNITS 1 amp 2 Type 200 Records (SO2 concentration data by date and hour)
Type 201 Records (NOx concentration data by date and hour)
Type 202 Records (CO2 concentration data by date and hour)
Type 210 Records (Diluent data by date and hour)
Type 220 Records (Volumetric flow data by date and hour)
Type 230 Records (Daily calibration test data by date and hour)
Type 231 Records (Flow interference data by date and hour)
Type 300 Records (Stack operating parameters by date and hour)
Type 301 Record (Quarterly and cumulative emission data)
Type 310 Records (SO2 mass emissions data by date and hour)
Type 320 Records (NOx emission rate data by date and hour)
Type 330 Records (CO2 mass emissions data by date and hour)
Type 503 Records (For Unit 1 (Common stack definition table)) (For Unit 2 (Common stack definition table))
Type 510 Records (Monitoring systemsanalytical components table)
Type 520 Records (Formula table)
Type 530 Records (Span table)
Type 535 Records (Stack operating load data)
Type 536 Record (Range of Operation normal load and load usage)
Type 556 Records (Monitoring system recertification events)
Type 601 Records (Quarterly linearity test data) Type 602 Records (Quarterly linearity check results)
Type 603 Records (Flow quarterly leak check results)
Type 605 Records (Reference data for flow-to-load ratio or GHR evaluation)
Type 606 Records (Quarterly flow-to-load or GHR check)
Type 610 Records (RATA and bias test data)
Type 611 Records (RATA and bias test results)
Type 623 Records (On-lineOff-line calibration demonstration)
Type 699 Record (QA test extension claim based on grace period)
UNIT 1 (MONITORED AT COMMON STACK) Type 300 Records (Unit operating parameters by date and hour)
Type 301 Record (Quarterly and cumulative emission data)
Type 504 Record (Unit information)
Type 505 Record (Unitprogram information)
Type 585 Records (Monitoring methodology information)
Type 586 Record (Control equipment information)
Type 587 Record (Unit fuel type)
UNIT 2 (MONITORED AT COMMON STACK) Type 300 Records (Unit operating parameters by date and hour)
Type 301 Record (Quarterly and cumulative emission data)
Type 504 Record (Unit definition table)
Type 505 Record (Unitprogram information)
Type 585 Records (Monitoring methodology information)
Type 586 Record (Control equipment information)
Type 587 Record (Unit fuel type)
CERTIFICATIONS Type 900 Records (Certification electronic signature)
Type 901 Records (Certification statement)
Type 999 Record (Contact person information)
Part 75 Field Audit Manual ndash July 16 2003 Page 43
Audit Preparation Section 3
312 Quarterly Feedback Reports
CAMD conducts two separate automated reviews of each quarterly EDR submission The first is generated by the Emission Tracking System (ETS) as instant feedback when the source submits the file to the EPA mainframe This instant ETS feedback provides the EPA Status Code which indicates whether the file was accepted and whether any errors were identified Certain errors are considered critical and necessitate a resubmission of a corrected file Other errors are considered informational and should be corrected by the source in future quarters but need not necessarily be addressed immediately Any errors that are identified are listed in the ETS feedback report with the relevant error code description number of hours and identification of the first hour in which the error occurred ETS checks include recalculations of hourly and cumulative emission values as well as range checks for acceptable values and codes in various fields
As part of preparing for a field audit you can download the ETS feedback report from the EPA mainframe (if you have access rights) or you can request a copy of the feedback from your CAMD contact If errors were identified on the latest ETS feedback you should review this report with the source during the on-site inspection and verify that the source has corrected those errors
The second automated review is generated by the Monitoring Data Checking (MDC) software and is sent by email to a facilitys Designated Representative shortly after the quarterly EDR submission period The MDC feedback consists of monitoring plan and QA test data evaluations As with the ETS errors certain MDC errors are considered critical and must be corrected by a resubmission of the quarterly file Note that since MDC is available to sources to download from the CAMD website they can run these same evaluations on their quarterly files prior to submission The MDC software is discussed in more detail in the following sections with guidance on how you can use the software to prepare for the plant visit
313 Using MDC to Prepare
for an Audit Key Checks Using MDC to Prepare
for the Field Audit
bull Print a copy of the monitoring plan report to take with you to the plant
bull Evaluate QA Test results (eg linearity RATA flow-to-load) and check for duplicate tests Identify if the source has claimed an exemption or grace period
bull Print and review recertification reports Also print missing data reports if available
bull Check hourly emissions calculations and missing data periods using the MDC Hourly feature
3131 MDC Overview
EPA developed the MDC software to allow affected sources State agencies and EPA staff to enter analyze print and export electronic monitoring plan certification and quality assurance data and to evaluate hourly emissions data for Part 75 monitoring The software also allows industry users to submit monitoring plan and certification data to EPA through standard electronic data transfer protocols
Page 44 Part 75 Field Audit Manual ndash July 16 2003
Section 3 Audit Preparation
To prepare for an audit you can use MDC to perform the following tasks in reviewing the quarterly EDR data
View monitoring plan QA test extensionexemption and compliance certification records directly on screen
Evaluate monitoring plans quality assurance tests and extensionexemption records
Print out reports of monitoring plans QA test data or evaluations
Analyze hourly data with the MDC Hourly data module
Analyze view and chart hourly data records for SO2 CO2 O2 NOx and heat input Also calculate and display summary data for daily monthly and quarterly time periods
Check hourly emissions calculations (MDC relies on the calculation procedures identified in a units monitoring plan together with RATA test data for these calculations) You can also calculate cumulative emissions from the hourly data to compare to the quarterly and annual values that the source reports in the EDR (see RTs 301 and 307)
Check to determine the quality assurance status (with respect to RATAs and linearity tests) of measurements reported for specific hours and monitors (MDC uses the ongoing reported quality assurance test data and extensionexemption records for this analysis)
Archive hourly data calculations and QA status for quick retrieval
Use a utility in MDC to modify parameter tolerances for comparisons of reported versus calculated hourly emissions
The following subsections address these uses in greater detail
3132 Getting Started with MDC
The most current version of MDC along with instructions and training materials are available on CAMDs website Once you obtain MDC and install it on your computer the next step is to import recent EDRs for the units to be audited You will need first to obtain the quarterly EDRs which can be downloaded from CAMDs website or received on a CD from CAMD
Obtaining MDC Software
EPAs MDC Software and supporting information can be downloaded at wwwepagovairmarketsmonitoringmdc
The EDR files should be saved in the data folder of the MDC directory You may need as many as four quarters of the most recent EDRs for the units and may need to go back additional quarters depending on when the most recent RATA was performed QA tests are included in the EDR for the quarter during which the tests were performed
Part 75 Field Audit Manual ndash July 16 2003 Page 45
Audit Preparation Section 3
3133 Review and Print Electronic Portion of Monitoring Plans
The electronic portion of a monitoring plan provides important background information The plan identifies the affected units (eg type rated capacity fuels combusted) control equipment what types of monitoring systems and components are in use monitor span values DAHS formulas missing data procedures and other information (See Table 3-1)
The plan should be printed out using the MDC reports function and brought to the plant The plan printout provides a simple template and check sheet for the plant visit For example when verifying monitor serial numbers to ensure that equipment has been properly certified you may simply check off on the printed monitoring plan each monitor system component that matches and include this as a check sheet in the audit report
Table 3-1Electronic Monitoring Plan Information
Electronic Monitoring Plan Records Description
Unit Operation Information (RT 504) Unit ID Boiler Type Maximum Heat Input Areas at Flow Monitor and Stack Exit
Monitoring SystemsAnalytical (RT 510) Components
System Parameter and ID Component ID Type Sample Method Manufacturer Model Serial Number
Emission Formulas (RT 520) Parameter Formula Code Formula
Span Values (RT 530) Parameter Scale MPCMECMPF Max NOx Rate Span Value Full-Scale Range Units of Measure
Load Range (RT 535) Maximum Hourly Load
Range of Operation (RT 536) Upper and Lower Bounds of Operating Range Most Frequently Used Loads Normal Load
Monitoring Methodologies (RT 585) Parameter Methodology Fuel Type Missing Data Approach
Control Information (RT 586) Parameter Type of Control Control Dates
Fuel Type (RT 587) PrimarySecondary Fuels
Fuel Flow Meter Data (Appendix D) (RT 540)
Parameter Fuel Type Maximum Fuel Flow Initial Accuracy Test Method
Fuel Usage Qualification (Appendix E) (RT 507)
Capacity or Gas Usage Qualification Type Method
NOx Correlation Segments (Appendix E) (RT 560)
Test Date Test Number Operating Level Segment Heat Input NOx Rate Fuel Type
Page 46 Part 75 Field Audit Manual ndash July 16 2003
Section 3 Audit Preparation
3134 ts Exemptions and Extensions
The MDC program evaluates QA test data and provides detailed test reports u can view a list of the QA tests (linearity flow-to-load and RATAs) -- as well as any test grace periods and exemptions -- in the EDRs that you have imported into MDC by selecting Certification and QA Tests or Test Extensions and Exemptions from the Edit or Report pull down menus
QA Tests
MDC will evaluate QA test data and provide brief error messages if errors are found For example low medium and high gas levels are compared to the instrument span to determine if the linearity was performed at the appropriate levels The program also will re-calculate linearity and RATA results including RATA bias adjustment factors (BAF) These are the same evaluations that are performed by CAMD at the end of each quarter described above in Section 312
If you have not received a copy of CAMDs evaluation you should run QA test evaluations of all the QA tests performed in the quarters you have downloaded ke a note of errors also you can print out specific pages of the MDC evaluation report for follow up with the plant during the audit visit
In addition to the test evaluations you will want to view the list of QA tests performed by the source to see if a particular QA test (RATA or linearity) has been repeated in a quarter This would indicate a failed or aborted test that might be due to CEMS problems You should investigate these failedaborted tests during the plant visit to find out what adjustments (if any) were made to the system and why they were necessary rform this check view the list of QA tests for a source by using the Edit pull down menu in MDC An example is shown in Illustration 3-3 where the SO2 linearity test has been repeated multiple times for a unit during the second quarter of 2000
Part 75 QA Tests
In the context of Part 75 and this manual QA tests refer to quality assurance tests required by the rule The primary tests for electronic data evaluation using MDC are
bull Linearity Tests bull Relative Accuracy Test Audits
(RATAs) bull Flow-to-Load Tests
QA Tes
Yo
Ma
To pe
Part 75 Field Audit Manual ndash July 16 2003 Page 47
Audit Preparation Section 3
Illustration 3-3 MDC Screen Showing Multiple Linearity Tests in One Quarter
You should also print out copies of a number of RATA and linearity test reports to bring with you to the plant so that you may compare the results reported in the quarterly EDR to on-site test report records You should perform this check (see Section 46) to ensure that the source properly transferred QA test data not automatically recorded by a CEMS to the CEMS data acquisition and handling system (DAHS)
Extensions and Exemptions
The Part 75 rule allows for the extension of QA test deadlines and in some cases exemptions from QA test requirements based on specific unit circumstances Test extensions are available for RATAs and quarterly Appendix D fuel flowmeter accuracy tests There is also a general grace period extension for all quarterly QA tests and RATAs which allows time in which to complete the testing for a short period after the end-of-quarter deadline
Exemptions are available from the multi-load flow RATA requirement (flow RATA may be allowed at a single operating level) SO2 RATA requirement (for units burning a low sulfur fuel) and the requirement to perform a single load RATA at normal load In addition quarterly QA test exemptions are available for linearity tests leak checks and flow-to-load ratio tests in any quarter which does not qualify as a QA operating quarter (a QA operating quarter has at least 168 hours of stack or unit operation) Quarterly QA test exemptions are also available for linearity tests of one range of a dual range monitor (range not used in the quarter) linearity tests of SO2 or NOx monitors with spans of 30 ppm or less and flow-to-load ratio tests for
Page 48 Part 75 Field Audit Manual ndash July 16 2003
Section 3 Audit Preparation
complex stack configurations that have been approved by petition The EDR v22 Instructions (see sections that discuss RT 695 - RT 699) provide useful background descriptions of the available extensions and exemptions and qualification requirements A link to the EDR Instructions is provided in Section 15 of this manual
You can use MDC to determine whether the source has claimed any extensions or exemptions Select Test Extensions and Exemptions from MDCs Report pull down menu Then run an evaluation report for all of the extensions and exemptions to determine if there are any errors that require follow-up during the field audit
Extension and Exemption Record Types
bull RT 695 Single-Load Flow Rata Claim bull RT 696 owmeter Accuracy Test
Extension bull RT 697 RATA Extension or
Exemption bull RT 698 arterly QA Test Exemption
Fuel Fl
Qu
A common test exemption is the use of a 1-load level RATA for flow RATAs Generally a 2-load test is required for QA testing At least once every 5 years a 3-load test is required for quality assurance purposes In addition a 3-load test is required for certification and recertification
There are also a few situations in which a 1-load test is allowed without a special exemption (1) peaking units and bypass stacks automatically qualify (2) a source that conducts flow RATAs on a semiannual basis can alternate between a 2-load and 1-load test and (3) cement kilns and other non-load based units can conduct tests at a single level if representative of normal operations For other sources to qualify to use a 1-load level flow RATA the source must submit the results of the single load analysis required by Appendix B sect 2313(c) in RT 695 Check to make sure that flow RATAs were performed at multiple loads (or that a unit otherwise qualified for a single load test) if the MDC exemption report indicates that the source did not report RT 695
Table 3-2Summary of MDC QA Test Checks
QA Test Checks Description
QA test evaluations MDC will evaluate QA test data recalculate results and provide error messages if errors are found
Repeated QA tests Look for FailedRepeated QA Tests (multiple tests in a quarter)
Print RATA and linearity reports for comparison with on-site hardcopy data
Bring the reports to the plant to make sure the electronic data match hardcopy data or linearity tests make sure the reference cylinder gas concentrations match those on site
Extensions and grace periods Identify if the source has claimed an extension or grace period
F
(cont)
Part 75 Field Audit Manual ndash July 16 2003 Page 49
Audit Preparation Section 3
Table 3-2Summary of MDC QA Test Checks (cont)
QA Test Checks Description
Single load flow RATAs (RT 695) Check for the exemption analysis single load flow RATA claim record (RT 695) which will show the results of the single load analysis required by App B 2313(c) Make sure flow RATAs were performed at multiple load levels for units (other than peaking units) without the single load exemption request Note Non-peaking units performing RATAs semiannually can alternate between single-load and multiple-load test without requesting an exemption or reporting RT 695 Certain non-load based units (such as cement kilns) also may be exempt from multiple-level tests
3135 Recertification Events and Monitoring System Downtime Reports
Sources must report certification recertification and certain maintenance events in the quarterly EDR (RT 556) in the report for the quarter in which the event occurred The MDC report function (currently under the Reports drop down menu) can provide a printout report of recertification and maintenance events This report identifies certification recertification and maintenance events and what QA tests were required If any of these records have been reported you should print a copy of this report and bring it with you on the plant visit to compare against the plant records It is important that all monitoring components are properly certified If there have been changes to equipment proper diagnostic or recertification testing should have occurred as required by sect 7520(b) Note that MDC does not verify that all required certification recertification or diagnostic testing is included in the report EPA therefore relies on the inspector to make this verification as part of the audit
A Monitoring System Downtime or Missing Parameter Report (RT 550) may also be available though unlike the Recertification Report (RT 556) this record is optional This useful report shows the start and end time of all missing data periods by monitoring system reason for missing data and the corrective action taken You can print out a copy of this report and use the report to (1) target monitoring system problems for further investigation with plant personnel during the plant visit and (2) identify missing data periods that can be used in reviewing plant maintenance plan records or control device parameter records at the plant Alternatively if this report has not been submitted the MDC Hourly function can be used to identify missing data periods as discussed in the following section
3136 Using MDC Hourly to Check Emissions Data and Calculations
The MDC Hourly module analyzes calculates views and graphs the hourly emissions data records for SO2 CO2 O2 NOx flow and heat input It also calculates and displays summary data for daily monthly and quarterly time periods The program can analyze up to 4 quarters of calendar year data MDC Hourly was designed for use with EDR v21 Use of EDR v21 began in the second quarter of 2000
Page 50 Part 75 Field Audit Manual ndash July 16 2003
Section 3 Audit Preparation
Getting Started with MDC Hourly
In order to check the hourly calculations with MDC Hourly you will need to make sure that you have imported quarterly EDR files that include the quarter with data from the most recent pollutant and flow RATAs so that you can take full advantage of the MDC data checks If you do not import all of the historical monitoring plan and quality assurance data into MDC prior to running MDC Hourly MDC Hourly may mistake hourly data as being out of control (OOC) and will not provide any further analysis on those hours
Hourly Calculations and Error Messages
View the Detailed Emissions Data tables for the different CEMS The program recalculates emissions for each hour using the monitoring plan formula and provides an error message in the far right column if there is a discrepancy There is no need to perform the emission calculations yourself One issue is the bias adjustment factor (BAF) If a source uses the wrong BAF they could underreport emissions and undermine the integrity of the trading program This recalculation feature in MDC can assist you in spotting this problem and understand the potential magnitude of the impact on emission allowances
Error messages will also identify OOC periods which indicate that a QA test (RATA or Linearity) was expired failed or not performed MDC Hourly does not currently determine the control status of the unit with respect to daily calibrations Be careful of the out-of-control error messages you may generate when you run MDC Hourly As noted in the Getting Started discussion above you can receive these error messages if you do not import the data into MDC for the quarter in which the RATA was performed prior to running the analysis on the hourly data
Missing Data Periods
Use the filter function to identify missing data periods This is especially important if the source did not submit the optional RT 550 record described above in Section 3135 The reasons for the missing data are not provided but this information may be used to identify systems with high amounts of missing data to target during the plant visit and also to select missing data periods for an in-plant records review
Appendix D Units
For oil- or gas-fired units that use Appendix D fuel monitoring to determine heat input and SO2 emissions view and record the fuel gross caloric value (GCV) and sulfur content across quarters so that you can check these values against on-site fuel sampling and analysis results
Graphing
MDC Hourlys graphing function allows you to graph the hourly emission data as well as flow and heat input Graphing emissions data can be an invaluable tool for preparing for a field audit Graphing allows the inspector to verify that the reported emissions look reasonable for the type of unit being evaluated Abnormal emission trends can often be quickly identified and should be investigated as part of the field audit to identify if the abnormality is due to a problem with the monitoring system or to a change in the way the unit is operated An abrupt
Part 75 Field Audit Manual ndash July 16 2003 Page 51
Audit Preparation Section 3
or unusual change could indicate a modification to unit operation or the CEMS that may require recertification or diagnostic testing Consistent data with very little change (flat line) may indicate that the CEMS is not operating properly or that the unit is using a missing data routine Either situation should be investigated with the source during the on-site visit
Illustration 3-4Example MDC Hourly Graph of SO2 Concentrations
The graphing function also can be used to compare the hourly emissions or parameter (flow heat input) against the monitor span values listed in the monitoring plan You should note if the emissions or parameter exceed the relevant maximum potential concentration (MPC) maximum expected concentration (MEC) or maximum potential stack gas flow rate (MPF) The emissions should typically be between 20 and 80 percent of the monitor range identified in the monitoring plan (See Appendix A sect 21) If a majority of the emissionparameter readings are outside 20 to 80 percent of the monitoring range you should make sure that the source has performed the MPC MEC span and range checks that are required at least annually by Appendix A sect 21
Page 52 Part 75 Field Audit Manual ndash July 16 2003
Section 3 Audit Preparation
Table 3-3Summary of MDC Hourly Checks
MDC Hourly Checks Description
Check hourly calculations and error messages
Check recalculated hourly emissions for error messages which are provided for each hour in the far right column
Error messages also identify out of control periods which indicate that a QA test was failed or was not performed
Hourly error messages may need to be ignored if the most recent RATA for a parameter was not imported
Check BAFs used in hourly calculations
MDC Hourly will use the BAF in the most recent RATA to recalculate hourly emissions
Check missing data periods Use the filter function to identify missing data periods Identify systems with high amounts of missing data and to select missing data periods for in-plant records review
For oil or gas units using Appendix D note fuel GCV and sulfur content
View and record these values across quarters to check against on-site fuel sampling and analysis results
Check spans Use the graph function to compare the hourly emissions or parameter (flow heat input) against the monitor span values in the monitor plan report Follow-up with the source if emissionsparameters are higher than the span The source is required to perform a spanrange check at least annually (App A sect 21)
View graphs of data trends Use the graph function to plot emissions and flow Note any abrupt changes in the data or consistent data with no change
32 Hardcopy File Review
In addition to the electronic review of monitoring plan and quarterly report data you should also review the sources file for written correspondence and information pertaining to Part 75 monitoring These documents would include any petitions previous auditinspection reports linearity and RATA reports and the sources acid rain permit or operating permit
321 Correspondence Petitions and Previous AuditInspection Reports
Correspondence and any petitions provide background on any recent issues or unusual monitoring situations that may come up during the plant visit Previous audit or inspection reports serve the same purpose Also if a prior report identified problems that required follow-up you should confirm (either through your pre-audit review or on-site audit) that the source took appropriate corrective action
Part 75 Field Audit Manual ndash July 16 2003 Page 53
Audit Preparation Section 3
322 Linearity Test and RATA Reports
Some States require a hardcopy submittal of linearity test and RATA reports If this is the case in your State and you have access to the reports in your office you should compare the hardcopy results to those reported electronically and accessed with the MDC program as described in Sections 313 and 45 so that you will not have to conduct the comparison while at the plant You can also review the RATA test report as described in Table 3-4 The hardcopy RATA test report review should be focused on reference method documentation that can not be checked electronically (eg reference method analyzer biasdrift checks cylinder gas certifications reference method equipment calibrations traverse points etc)
Table 3-4RATA Report Review
RATA Hardcopy Review Explanation
For a NOx RATA using the instrumental method 7E is the NOx
converter efficiency documented through a performance test
The NOx converter converts NO2 to NO NO is measured by the analyzer If the NO2 concentration is greater than 5 ppm a NOx converter efficiency test (RM 20) is required
If an instrumental RM was used were cylinder gas certificates included in the test report
The calibration gas certificates should be provided in the test report and show Certified gases (EPA Protocol NIST etc see
Section 45) Concentrations which match those used in the
biasdrift check calculations Expiration date after the RATA
For instrumental methods (6C 7E 3A) were the appropriate bias and drift corrections made for the RM data
Run results are corrected for bias based on the average of the before and after bias checks
For flow reference methods is the calibration date of the pitot tube within 6 months of the RATA
The most recent calibration should have been performed within 6 months of the test
Are CEMS and RM data on same moisture basis
Make sure the comparison between the CEMS and RM are on the same basis
323 Permits
You should make sure that the source has an Acid Rain permit or NOx budget permit if required Check any relevant source specific provisions related to Part 75 monitoring in the permit and bring a copy of those provisions with you on the audit The permit conditions for Part 75 monitoring however may only list a general requirement to follow Part 75 and not be that helpful
Page 54 Part 75 Field Audit Manual ndash July 16 2003
Section 3 Audit Preparation
33 Scheduling and Coordinating the Audit
Level 2 audits require coordination with the source to obtain their schedule for performing RATA and linearity performance tests The source is required to provide written notice of the date of periodic RATAs no later than 21 days prior to the first scheduled day of testing (sect 7561(a)(5)) Written notification may be provided by mail or by facsimile and may be provided by electronic mail if the EPA Regional Office or State agency determines that electronic mail is acceptable (sect7561(a)(5)(i)) However the date can be changed and often is due to operating constraints at the plant or with the CEMS Part 75 allows performing a test on a different date as long as notice of the new date is provided as soon as practicable but no later than twenty-four (24) hours in advance of the new test date
Notice is not required prior to the quarterly linearity tests So you will need to coordinate with the facility staff to schedule your audit to coincide with a linearity test date if desired
Because the audit policy is hands-off you should review all of the inspection procedures and requirements at the time of scheduling to allow the facility the opportunity to gather the necessary information and arrange for the appropriate personnel to be available (The plant environmental contact may also not be authorized to access the CEMS) Prior knowledge of all procedures and the audit objectives will help to avoid problems and will allow the audit to proceed as planned and in a timely manner You should also check plant-specific safety requirements with the source and what safety equipment you will need
Level 1 unannounced audits of a Part 75 monitoring system are often performed as part of the overall unannounced air compliance inspection of the facility If you conduct a Level 1 audit as part of an unannounced inspection you should also go over the inspection procedures and requirements as outlined in the previous paragraph when you arrive at the facility Unannounced audits may not be as productive since the sources often rely on outside contractors or personnel from other sites to perform certain tasks It is therefore more productive to coordinate with the source before the audit to make sure that the proper personnel are present to answer any questions that might arise during the audit
34 Materials to Bring
The inspector should bring personal safety equipment (eg hard hat safety glasses safety shoes hearing protection etc) as provided by agency policy Useful materials and data sheets to bring on the field audit include
Note
Section 15 of this manual contains information to help you find related documents including regulatory text for Part 60 and Part 75 and the Parts 75 and 76 Policy Manual
MDC printout of the monitoring plan
MDC printout of linearity and RATA reports
MDC printout of recertification and missing data reports
Appropriate Part 60 reference method requirements if observing a RATA
Part 75 Field Audit Manual ndash July 16 2003 Page 55
Audit Preparation Section 3
Checklists and data entry forms (see Appendix A of this manual)
Part 75 Rule (see easy-to-use version maintained on CAMDs website)
Parts 75 and 76 Policy Manual (bring and leave in car for reference as needed)
Copy of Acid Rain permit or operating permit monitoring provisions
Page 56 Part 75 Field Audit Manual ndash July 16 2003
Section 4 On-Site CEMS Inspection
This section describes the primary on-site activities that will apply to any field audit for a Part 75 CEMS
Outline of Section 4
41 Pre-Audit Interview 42 Calibration Error Test 43 ProbeSensors Sample Lines and
Sample Conditioning Systems 44 Gas Analyzers 45 Calibration Gases 46 Flow Monitors 47 DAHS 48 Maintenance Log and Daily Checklists
Review 49 QAQC Plan Review
The field audit will consist of an initial interview (Section 41) the walk through and inspection of the various components of CEMS (Sections 42 -47) and a review of QA and maintenance records (Sections 48 and 49) If you are conducting a Level 2 audit you will also observe performance tests (Section 5) For a Level 3 audit you will conduct certain performance tests (Section 6) In each case you will complete your audit with an exit interview and final report (Section 7)
You should not consider the organization of this section as suggesting a specific order to the audit For example this section discusses conducting a walk-through visual observation of all equipment first followed by a review of the QAQC plan and recordkeeping In many audits you may go back and forth between visual observations and records review
In budgeting your time you should spend more time on items that can not be checked or verified off-site from EDR submittals or other file information In addition focus on any potential problems flagged during the pre-audit review For example focus on CEMS and time periods with the most missing data multiple failed QA tests unusual data trends or mistakes in emissions calculations If you analyzed information using MDC or MDC Hourly bring a specific list of the questions and issues based on these pre-audit activities
In conjunction with your own visual observations and records review interviews with plant staff provide important information on how the monitoring systems work and are operated as well as on compliance with Part 75 requirements You should ask the staff how they operate the equipment and perform QA activities and how the QAQC plan is used in relation to the different CEMS and quality assurance components A key auditing technique is to establish a dialogue with personnel at the source and to let them answer your questions by going through their procedures and showing you where they document the procedures
You will want to confirm that actual equipment settings monitor operations and quality assurance activities match the QAQC plan The QAQC plan is an important resource and a Part 75 requirement The QAQC plan is the document that provides detailed procedures for how the CEMS is to be operated If a source is following a complete QAQC plan that covers all of the Part 75 quality assurance requirements and the operating parameters for the monitoring systems then the data can be considered valid at all times that the system is operating within those parameters since the system is being operated as it was during the RATA If the QAQC plan is not followed or is incomplete then it is questionable whether the emissions data are of the same quality as was demonstrated during the RATA You may also
Part 75 Field Audit Manual ndash July 16 2003 Page 57
On-Site CEMS Inspection Section 4
find that the procedures currently in use are appropriate but the QAQC plan has not been updated Many of the recommended checks in this manual refer back to the QAQC plan
One critical step is to verify that the CEMS components match those in the monitoring plan If changes have been made you need to determine if the proper recertification testing or diagnostic testing has been performed Part 75 quality assurance begins with the initial certification of the CEMS and any changes since that certification need to be evaluated for their effect on CEMS data
Identifying Monitoring Hardware Recertification Issues
Recertification is required for a replacement modification or change that may significantly affect the ability of a CEMS to accurately measure monitored parameters
bull Complete System Replacement bull Analyzer Replacement bull Change in Orientation or Location of Sampling Probe or Site bull Change in Flow Monitor K factor or Polynomial
This is a key issue for audits ee Section 15 of this manual for a link to CAMDs guidance on recertification under Part 75
S
41 Pre-Audit Interview
You should conduct a pre-audit meeting when you arrive at the plant The meeting should include the plant contact the plant CEMS technician assigned to assist with the audit and may include plant management personnel At this time it is important for you to make sure the plant personnel understand the general scope of the audit and to agree upon a tentative audit schedule so that necessary personnel will be available when needed Table 4-1 identifies several items you should discuss in the interview
Page 58 Part 75 Field Audit Manual ndash July 16 2003
Section 4 On-Site CEMS Inspection
Table 4-1Pre-Audit Interview Items
Topic Purpose
Audit purpose and agenda bull Inform facility of the purpose and scope of the audit
bull Streamline subsequent activities bull Allow for meetings with necessary plant personnel
Inspection and audit techniques to be used including hands-off policy and the need for a CEMS technician
bull Streamline subsequent activities bull Identify plant contacts for different parts of the
audit
Specific areas to be observed bull Identify any constraints on visiting locations in the plant
Safety requirements bull Identify necessary safety equipment and plant safety issues
Records to be reviewed and copying needs bull Streamline subsequent activities bull Provide source an opportunity to collect information
during the other audit activities
Notify plant personnel of intent to take photographs or videos to document observed conditions
bull The inspector should ask for permission to take photographs on the plant property and explain the purpose for the photos The source can make a confidentiality claim but emission-related information is public information under the Clean Air Act You should follow your agencys policy on the treatment of confidential business information claims This is not likely to be an issue if photos or videos are limited to the CEMS components
42 Calibration Error Test
Part 75 requires a daily calibration error test This test provides a simple check of most CEMS components and can detect many but not all sources of potential error in the monitoring system
If possible you should observe routine daily calibration error tests as part of any CEMS field audit but often the tests are initiated automatically at a specific time of day Following the calibration sequence the DAHS will typically generate a calibration summary report (presenting the CEMS responses and calculated calibration error results) to record the data for each operating day Daily calibration check results are also reported electronically in the EDR
If the daily checks have occurred before you arrived at the plant review the results of the tests for that day and request the plant contact or CEMS technician to initiate a routine daily calibration test Ask for an explanation of how daily calibrations are performed how the results are used what responses will trigger adjustments and how adjustments are made The specific procedures used to conduct this calibration routine should be described in the QAQC plan available on-site Adjustments are not to be made during the calibration error test When
Part 75 Field Audit Manual ndash July 16 2003 Page 59
On-Site CEMS Inspection Section 4
adjustments are made following a calibration test another calibration error test is required after all adjustments are completed to validate that the adjustment was appropriate
The Daily Calibration Summary form included in Appendix A can be used to compile the daily calibration check data while on-site You should also request a printout from the sources DAHS and compare these values to the values you recorded from the analyzers display For each monitor
Record the gas monitor responses from the zero and upscale calibration gas injections (for dilution systems multiply the monitor data by the dilution ratio to obtain the actual concentration)
For flow monitors record the results of the electronic tests for ultrasonic and thermal flow monitors or the pressure transducer checks for differential pressure monitors
Note the start and stop times and whether the response is stable when the system records the calibration test response Also check that the time taken for the test still provides at least two valid CEMS data points per hour to meet the valid hour requirements of Part 75
Check that the calibration gas flow rates and pressure match sampling conditions
Calculate the results from the monitor data and retrieve the daily calibration error (CE) results from the daily report generated by the DAHS Compare your results to those generated by the DAHS If there is a discrepancy ask about correction factors in the DAHS such as pressure correction factors for dilution probes or similar factors
Compare the calibration error at the zero and high levels to the Part 75 data validation requirements in Appendix B sect 214(a) (see Table 4-2)
If the calibration error check is failed the data from the monitor are invalid and the monitor is out of control until it successfully passes a subsequent calibration error test Missing data routines must be used until the monitor is adjusted and successfully passes a subsequent calibration error test
Page 60 Part 75 Field Audit Manual ndash July 16 2003
Section 4 On-Site CEMS Inspection
Table 4-2 Part 75 Calibration Error Test Data Validation Requirements
Monitored Parameter Calibration Error Requirement (App B sect 214(a))
SO2 or NOx 50 of the Span Value or
5 ppm absolute value of the difference between the monitor response and the reference value if the span value of the monitor is less than 50 ppm or
10 ppm absolute value of the difference between the monitor response and the reference value if the span value of the monitor is greater than 50 ppm but less than 200 ppm
CO2 or O2 10 CO2 or O2
H2O 60 of the Span Value Moisture monitor systems composed of wet and dry O2 monitors must meet the O2 calibration error requirement of 10
Flow 60 of the span value or
002 inches of water absolute value of the difference between the monitor response and the reference value if the monitor is a differential pressure type
You should also compare the CE results you obtain to the results of the most recent automatic calibration error test that occurred earlier in the day of your audit or on previous days Previous calibration error tests usually can be brought up on the DAHS visual display screen If there is a significant shift in the CE results from that previous test ask the facility contact if they can explain the shift Were adjustments made to the monitoring system(s) that could cause the shift Does the shift indicate that adjustments are necessary
Routine adjustments of the monitor are allowed after successful calibration error tests These adjustments are to be made to bring the monitor as close as practicable to the calibration gas tag value or flow reference signal If the monitor is physically adjusted by a person a follow-up calibration error test is required to verify that the adjustment was performed properly No follow-up calibration error testing is required when only a mathematical adjustment is made automatically by the DAHS These mathematical adjustments are similar to an internal bias adjustment factor in that the DAHS evaluates the response in comparison to the reference value and assigns from that time forward an adjustment factor which is used to adjust the data for reporting If this type of adjustment is used the inspector should determine at what point the source physically adjusts the calibration of the analyzer (ie what the range of acceptable calibration error adjustment factors is) Typically sources that use the auto adjustment in this manner physically recalibrate when the mathematical adjustment exceeds 25 percent of the span The criteria that are used should be documented in the sources QAQC plan
Part 75 Field Audit Manual ndash July 16 2003 Page 61
On-Site CEMS Inspection Section 4
43 ProbeSensors Sample Lines and Sample Conditioning Systems
Most of the suggested checks of the probesensors and the sample lines do not require a visual check of the actual probesensors or lines The probesensors and sample lines may not be easily accessible and may be located in a confined space that your agencys (or the plants) safety policies prohibit you from entering Access to the gas sampling probe and flow monitor probesensors also may require climbing ladders or working at substantial heights
431 ProbeSensors
You should ensure that the probesensors are in the same location as when the unit was certifiedrecertified (as detailed in the monitoring plan) -- changes in probesensors orientation or location require recertification of a CEMS A hardcopy submittal of the monitoring plan will contain a diagram with the probesensors location A copy should have been submitted to the State agency If it is not available in your files it should be on file at the plant In addition ask how frequently the probesensors are inspected if there have been any problems (plugging for example) and if the probesensors or a component have been recently changed The change might also require recertification or diagnostic testing
Flow Monitors
In addition for flow monitors you could ask the source representative to perform a daily interference check as required by App B sect 212 or review the results of the most recent interference tests The daily interference check tests the flow monitor probe or sensors sample lines and temperature transceiver for plugging or malfunctioning
The interference test procedure should be identified in the QAQC Plan Go over the interference test procedures with the source representative and ask if there have been any recent failures and what corrective action was taken Some interference checks for various types of flow monitors are described below
Differential Pressure - Regular back purge of probe and sample lines Back purge flow or measured flow is monitored and compared to baseline values to indicate if there is a plugging problem There may also be a moisture removal system or a heated sample line
Ultrasonic - Purge air blowers may be installed to prevent particulate build up on the transceivers and purge air flow rate is monitored Units without purge air blowers can monitor signal strength to identify particulate build up
Thermal - Temperature sensors may have an auto self clean feature which heat the sensors to burn off particulate build-up and help avoid moisture condensation Another approach uses short high pressure blasts of air Interference can be tested by checking the stack temperature measured by both sensors or by comparing the sensor measurements against calibration data
Page 62 Part 75 Field Audit Manual ndash July 16 2003
Section 4 On-Site CEMS Inspection
Table 4-3ProbeSensor Check Summary
What to Check Description
All ProbeSensor Types
Is the probe in the same stack or duct location as in the monitoring plan
Visually compare probe location to location on the diagram submitted with the monitoring plan A measurement of distances from disturbances or stackduct diameter are not necessary
Has the duct or stack location been modified (Dimensions)
Ask the source representative and note during a check of CEMS maintenance logs These ductstack changes could affect CEMS measurements and may require recertification
How often are the probessensors inspected have there been problems and have the probesensors or components been changed
Ask the source and note during a check of CEMS QAQC Plan and maintenance logs
Flow Monitors
Ask the source to perform a daily interference check or review the results of the most recent interference check
Appendix B sect 212 requires a daily interference check for flow monitors Each flow monitor is to be designed to provide a means for checking interference from plugging of each sample line and sensing port and malfunction of each resistance temperature detector (RTD) transceiver or equivalent
432 Sample Lines
Extractive Gas CEMS Sample Lines
The daily calibration error test (see Section 42) provides the best check on whether gas sample line leaks are diluting the sample gas measured by the analyzer The daily calibration error test should also detect most problems from condensation However for source level extractive NOx systems that do not have an SO2 analyzer if practical you should also visually check the umbilical line as it enters the CEM shelter Look for loops or sags in the line as well as moisture droplets Because calibration gases do not have significant amounts of NO2 the daily calibration error test for a NOx monitor may not detect a negative bias from absorption of NO2 by condensed water
Differential Pressure Flow CEMS Sample Lines
Manual or automatic quarterly leak checks are required for differential pressure flow monitors (Appendix B sect 222) The test criteria are not specified by Part 75 Most often the test checks the line after the probe flange by closing the line and holding a steady pressure for a specified time Check how and when the tests were performed The test date and results (passfail) are reported in the EDRs so you can confirm the reported electronic results with on-site data If a recent test failed find out what was done to correct the problem A failed leak
Part 75 Field Audit Manual ndash July 16 2003 Page 63
On-Site CEMS Inspection Section 4
test results in out of control data until the leak is fixed and a subsequent leak check is passed (Appendix B sect 223(g))
433 Dilution Air and Gas Sample Conditioning Systems
The majority of Part 75 gas CEMS are extractive systems that transport the stack gas from the stack to an analyzer The checks described in the next two sections relate to the systems that condition the stack gas for analysis
4331 Dilution Extractive Systems
Dilution systems are frequently used for Part 75 compliance These systems dilute the stack gas with clean dry air prior to the analyzer The ratio of sample taken from the stack to dilution air is the dilution ratio and is an important parameter of a dilution system How that ratio is maintained or what mathematical compensations are made to account for changes in the ratio is important to cover during an audit
Dilution Air Ratio
The following questions may be useful for auditing dilution extractive CEMS systems
What is the dilution ratio and how is it verified This should be described in the QAQC plan
Is the dilution probe ejector pump vacuum at or below the certification value The ejector vacuum affects sample flow if it decreases below the values which creates critical flow through the orifice How often does the source check the ejector vacuum as well as the dilution air and analyzer flow settings Some systems automatically adjust the dilution air pressure from a pressure transducer signal so ask how this works Again these activities should be described in the QAQC plan
Check if any corrections are applied to the dilution ratio for changes in pressure temperature or molecular weight (See Section 2331 on gas density effects) These corrections are typically applied by the DAHS and should be described in the QAQC plan Also find out if there have been any changes in the factors since the last RATA because a RATA is required following a change in these factors
You should also ask the source if the dilution probe orifice has been changed The orifice controls the sample flow rate if the orifice has changed it may have changed the dilution ratio You can also check this during the maintenance record reviews
If the orifice has been changed ask the source if there is a procedure for doing this in the QAQC plan In addition ask what prompts making a change Replacing a dilution probe orifice with one of the same size requires diagnostic testing while replacement by a different sized orifice requires recertification Check to see that the appropriate testing has been completed
Page 64 Part 75 Field Audit Manual ndash July 16 2003
Section 4 On-Site CEMS Inspection
Dilution Air Cleaning System
The dilution air supplied to the dilution probe must be treated to remove contaminants that could interfere with the analyzers The dilution air cleaning system removes moisture CO2 particulate matter hydrocarbons and other contaminants that may be present in ambient air A good place to start is simply to ask the source representative how the system works You should also investigate maintenance practices For the air cleaning system ask the source how often the filters are changed and at what point drying agents are replaced Again this should be verified against the QAQC plan documentation You can also ask to see a copy of the filter replacement documentation in either the maintenance log or a copy of the daily checklist You can check the inlet and outlet pressures of the CO2 filter and compare to the appropriate range for the inlet and outlet pressure in the QAQC plan Find out from the source how often these pressures are checked and how these checks are documented
Table 4-4Summary of Dilution Air System Checks
What to Check Description
Has the dilution probe orifice been bull The orifice controls the sample flow rate so a change in the changed orifice will affect the dilution air ratio Ask the source
CEMS operator if the orifice has been changed since the last RATA and note maintenance records for any evidence of changes (Section 47)
bull If the orifice has been changed ask if there is a procedure for changing the orifice in the QAQC Plan what prompts a change and how is the dilution ratio verified
bull If it has been changed confirm that necessary diagnosticrecertification testing was performed
Is the dilution probe ejector pump vacuum at or below the certification value
bull Ask the CEMS operator how often they check the ejector vacuum as well as the dilution air and analyzer flow settings and ask whether the values are recorded and what are the proper settings
bull Also ask the operator to show that the pressure gauges or rotameters are set in accordance with the QAQC plan and ask how often the values are verified and documented
Are the dilution ratio and dilution air and analyzer flow settings properly set
Are correction factors applied to the dilution ratio for changes in pressure temperature or molecular weight ve these been changed since the last RATA
bull Some systems apply correction factors to the dilution ratio to account for changes in gas density nges to the correction factors should be recorded in the maintenance log and the QAQC plan should outline the procedures for changing the correction factors TA should be performed following any change
Ha
Cha
A RA
(cont)
Part 75 Field Audit Manual ndash July 16 2003 Page 65
On-Site CEMS Inspection Section 4
Table 4-4Summary of Dilution Air System Checks (cont)
What to Check Description
Check the inlet and outlet pressures of CO2 air cleaner filter
bull Ask the CEMS operator how often they check the CO2 air cleaner filter inlet and outlet pressures if the values are recorded and the proper setting
bull Also ask how often the filters are changed and at what point drying agents are replaced Again this should be verified against the QAQC plan documentation
Check CO2 air cleaner
4332 Source Level Extractive Systems
Source level extractive systems transport the stack gas to the analyzer without dilution These systems also are described as direct extractive or non-dilution systems These systems may measure emissions on either a wet or dry basis Wet systems need to maintain the extracted sample at a temperature above the dew point of the sample to avoid condensation in the umbilical lines Therefore each component of the sampling and analysis system in a wet extractive system must be heated Dry systems require some sort of moisture removal either through condensation or permeation driers as well as heating of the components upstream of the moisture removal system The daily calibration error test may show problems related with the conditioning system (except for NOx systems as noted in Section 432)
In addition to observing a daily calibration error test ask the source representative to describe what maintenance is performed on the conditioning system and check that information against the maintenance log and QAQC plan You can also check the chiller temperature if water is removed by condensation and compare the temperature to the acceptable ranges in the QAQC plan These system checks are summarized in Table 4-5
Table 4-5Summary of Source Level Extractive System Checks
What to Check Description
Observe a daily calibration error test Ask the source to perform a test This can be initiated by the source representative from the analyzer or DAHS (See Section 42)
Check the umbilical lines entering the CEM shelter for condensation
Visual check as described earlier in Section 432 Are there water droplets visible in the line
For a dry system using chillers check the chiller temperature
Ask the CEMS operator what the proper temperature range is and how often it is verified pare against the QAQC plan
Check general conditioning system maintenance practices
Ask the source representative how the conditioning system is maintained re to the QAQC plan and check the maintenance records
Com
Compa
Page 66 Part 75 Field Audit Manual ndash July 16 2003
Section 4 On-Site CEMS Inspection
44 Gas Analyzers
Analyzers for extractive systems often are located in a CEM shelter and generally will be rack-mounted and connected to the conditioning system usually with a sample manifold Inshysitu analyzers are located on the stack or duct or in the annulus between the stack and stack liner
In checking the analyzers it is important that you first verify that each analyzer in use is the same as the one thatReminder - MDC Monitoring
Plan Report
A printout of the MDC monitoring plan report can be used as a convenient check off sheet when verifying the serial numbers of CEMS components
was previously certified or recertified Analyzers may have been changed without the notification and recertification required by Part 75 (Subpart C sect 7520(b)) As noted in previous sections it is important that the source certifies the equipment actually in use
Analyzer DisplaysAlarms
Displays and alarms will vary by analyzer model You should ask the plant contact what displays and alarms are in the model that the source uses and what they indicate The displays should show that the analyzer is operating properly An alarm light may show a potential or developing problem which should be addressed as described in the QAQC plan Ask the source when an alarm last occurred and what caused the alarm This information should be recorded in the maintenance log
Flow Rate
Check the sample flow rate to each analyzer It may be displayed digitally or by a rotameter The proper flow rates should be identified in the QAQC plan
Range Settings
Ask the source what the range settings are for each analyzer and how these settings are displayed Compare the settings to the monitoring plan (RT 530 Column 49) You should also check to see if the source has conducted an annual spanrange check as required by Part 75 Appendix A sect 21 The range may need to be changed if that setting is not representative of the concentrations being measured or if the stack concentrations have changed (such as a change in fuel supply or new control equipment) The rule requires that the evaluation of the MPC MEC span and range for each gas monitor be conducted at least once a year
Span versus Range Under Part 75
bull The span is the calculated quality-assured portion of a monitors measurement range
bull The span is equal to 10 to 125 times the Maximum Potential Concentration (MPC) or Maximum Potential Stack Gas Flow Rate (MPF)
bull The range is the actual setting of the monitor
bull The range is to be set so that the majority of readings fall between 20 to 80 of the range selected
Range is always gt Span
Part 75 Field Audit Manual ndash July 16 2003 Page 67
On-Site CEMS Inspection Section 4
Correction Factors
A correction factor may be applied to NOx analyzer data to account for NOx quenching effects Corrections may also be applied to moisture monitors The correction is applied to the analyzer data by the DAHS You should ask if there have been any correction factor changes since the last RATA Any change should be recorded in the maintenance record and the procedures for making the change in the QAQC plan Verify that a RATA has been performed following the change (see sect 7520(b))
Table 4-6Summary of Analyzer Checks
What to Check Description
Have analyzers been changed without the notification and recertification required by Part 75 (Subpart C sect 7520(b))
Ask the source if there have been any changes since the last audit or certificationrecertification Document the serial numbers and compare to those in the monitoring plan
Status of the control panel lights indicators and alarms Displays should show that the analyzer is on and operating properly
The displays will vary by analyzer so ask the source what the displays are and what they mean An alarm light could indicate a potential problem that needs to be addressed (check QAQC plan)
Check range setting and whether the source has performed the annual spanrange check required by Appendix A sect 21
Ask the operator what the range settings are and how they are displayed Compare the range setting to the value in the monitoring plan (RT 530) and the results of the recent spanrange check
Check the sample flow rate Compare the sample flow rate if displayed by a rotameter or a digital reading to the QAQC plan
Have there been any changes to correction factors (NOx quenching and moisture monitors) since the last RATA
Changes to the correction factors should be recorded in the maintenance log and the QAQC plan should outline the procedures for changing the correction factors A RATA should be performed following any change QA testing may also be required (see sect 7520(b))
45 Calibration Gases
Calibration gas cylinders are used for daily zero and span calibrations andor linearity checks You should spot check a number of the calibration gases to verify that the gases in use meet protocol gas requirements in Part 75 that the calibration gas concentrations meet Part 75 quality assurance test requirements and that the values are entered correctly in the DAHS You also can visually check the delivery system
Make a note of the cylinder gas numbers (an engraved ID number stamped on the cylinder) and check the gas certificate for each ID number for the following information (the certificate should be on the cylinder on file electronically or in hardcopy at the facility)
Page 68 Part 75 Field Audit Manual ndash July 16 2003
-- ----
Section 4 On-Site CEMS Inspection
Meets Calibration Gas Certification Requirements
Expiration Date Cylinder gases are not certified after the expiration date The use of an expired cylinder is not in compliance with sect 7521(c)
Check the type of gas certification Part 75 requires the use of a calibration gas as defined in sect 722 Table 4-7 below describes the types of permissible Part 75 calibration gases
Meets Gas Concentration Requirements
Check that the zero air calibration gas concentrations are certified by the supplier to meet the concentration limits in sect 722 (See Table 4-7) Zero air material is a calibration gas that may be used to zero an SO2 NOx or CO2 analyzer Zero air material has an effective concentration of 00 for the component being zeroed (SO2 NOx and Total Hydrocarbons 01 ppm CO 1 ppm or CO2 400 ppm) and is free of certain other interfering gaseous species A zero air cylinder containing a multi-component mixture should be certified that it meets the concentrations above and that other components do not interfere with the CEMS reading For more on zero air calibration gas or zero air materials see Questions 102 and 103 in the Parts 75 and 76 Policy Manual
Determine the cylinder gas concentration values and verify that the values are in the correct range for the instrument span You also should record the concentrations to make sure the values are consistent with the values entered into the DAHS for daily calibration error and linearity tests The ranges for the low medium and high linearity points are
Low level 20 - 30 of span Mid level 50 - 60 of span High level 80 - 100 of span
Part 75 Field Audit Manual ndash July 16 2003 Page 69
--
--
On-Site CEMS Inspection Section 4
Table 4-7Part 75 Calibration Gases (Appendix A sect 51)
Calibration Gas Type Acronym Description
NIST - standard reference material
SRM Calibration gas obtained from the National Institute of Standards and Technology (NIST)
NIST - standard reference material-equivalent compressed gas primary reference material
PRM Gas mixtures listed in a declaration of equivalence in accordance with section 212 of the EPA Traceability Protocol for Assay and Certification of Gaseous Calibration Standards September 1997 EPA-600R-97121 (EPA Traceability Protocol)
NIST - traceable reference material
NTRM Calibration gas mixture tested by and certified by NIST to have a certain specified concentration of gases
NISTEPA-approved certified reference materials
CRM Calibration gas mixture that has been approved by EPA and NIST as having specific known chemical or physical property values certified by a technically valid procedure as evidenced by a certificate or other documentation issued by a certifying standard-setting body
Gas manufacturers intermediate standard
GMIS Compressed gas calibration standard that has been assayed and certified by direct comparison to an SRM an SRM-equivalent PRM a CRM or a NTRM in accordance with section 2121 of the EPA Traceability Protocol
EPA protocol gas Vendor-certified to be within 20 percent of the concentration specified on the cylinder label (tag value) using the uncertainty calculation procedure in section 218 of the EPA Traceability Protocol
Zero air material Calibration gas certified by gas vendor SO2 NOx and Total Hydrocarbons 01 ppm CO 1 ppm or CO2 400 ppm If a mixture the other components are certified not to interfere with the CEM readings for the target compound
Research gas mixture RGM Calibration gas mixture developed by agreement of a requestor and NIST that NIST analyzes and certifies as NIST traceable
In addition to the certificates you should also check the calibration gas line pressure gauges to determine the cylinder gas pressure The cylinder should not be used if the cylinder gas pressure is below 150 psi (This requirement is in the EPA Traceability Protocol for Assay and Certification of Gaseous Calibration Standards sect 2164) You should check to see if the facility checks cylinder pressure as part of its QAQC plan At what point do they replace a calibration standard Also check the outlet regulator pressure or calibration gas flow rate to see if it matches the QA test procedures in the QAQC plan
Page 70 Part 75 Field Audit Manual ndash July 16 2003
Section 4 On-Site CEMS Inspection
Table 4-8Summary of Calibration Gas Checks
What to Check Description
Check the certificates for the expiration date of the cylinder gas
Gas cylinders may have expired dates Cylinder gases are not certified after expiration date and the use of an expired cylinders is not in compliance with sect 7521(c)
Check the calibration gas type (certified EPA Protocol or other)
Gas certifications must meet the definitions in sect722 Check the type of cylinder gas against the descriptions in Table 4-7 and sect 722
Check the zero air material documentation to ensure that it is properly certified
Calibration gas used to zero a gas analyzer See Table 4-7 for the zero air material concentrations defined in sect 722 (Also see Policy Manual questions 102 and 103)
Check the concentration values for each cylinder and that the cylinder calibration tags are withing the correct concentration range for the span
Linearity test point ranges are shown below Low level 20 - 30 of span Mid level 50 - 60 of span
High level 80 - 100 of span
Record the concentration values to check against the values recorded by the DAHS for calibration error and linearity tests
This check is to ensure that the proper cylinder gas concentration values have been entered into the DAHS for calculation of daily calibration error tests
Read the cylinder regulator pressure The cylinder should not be used if the cylinder gas pressure is below 150 psi (EPA Traceability Protocol for Assay and Certification of Gaseous Calibration Standards sect 2164)
Check the regulator outlet pressure The pressure or calibration gas flow rate should be set as specified in the QA test procedures in the QAQC plan
46 Flow Monitors
In addition to the daily calibration error tests (Section 42) and daily interference tests (Section 431) there are a number of other flow monitor issues you can investigate
Flow-to-Load
There is no equivalent to a linearity test for a flow CEMS In response EPA developed a quarterly comparison of flow CEMS data to unit load data Each quarter the source must conduct a comparison of the hourly flow and load data for any hour in which the unit load is within plusmn 10 of the average load during the most recent RATA As part of your pre-audit checks you should note whether the source conducted this test as required and whether the test was passed If there are issues with the test conducted at the facility go over those issues with the source representative while on site
Part 75 Field Audit Manual ndash July 16 2003 Page 71
On-Site CEMS Inspection Section 4
TemperaturePressure Monitoring
Check to see if there are monitors for stack temperature andor stack absolute pressure associated with the flow monitor Ask the source what type of QAQC procedures are followed for these monitors (what is checked and on what schedule) and if there have been any problems with these components You can compare to the QAQC plan or maintenance records
K-factors
A k-factor refers to a correction factor or polynomial coefficient used by the DAHS to correct the flow monitor measurement for flow variables not measured by the monitoring method as well as for measured changes in stack pressure and temperature The factors are set based on a pre-RATA test in which the source correlates the monitor measurement to the RATA flow reference method results
Changing the k-factors or polynomial coefficients does not require recertification but does require that a three load RATA be performed (sect 7520(b)) as a diagnostic test event You should ask when the last time the correction factors were changed and why and check that the RATA was performed The changes should be recorded in the maintenance log and a procedure outlined in the QAQC plan
DisplaysAlarms
As in the case of gas analyzers the displays and alarms will vary by manufacturer You should ask the plant contact what displays and alarms are in the model that the source uses and what they indicate Information on alarms and corrective action should be recorded in the maintenance log
SpanRange
Ask the source what the range settings are for the flow monitor and how these settings are displayed Compare the settings to the monitoring plan (RT 530 Column 49) You should also check to see if the source has conducted an annual spanrange check as required by Part 75 Appendix A sect 21 (See the spanrange discussion in Section 44)
Page 72 Part 75 Field Audit Manual ndash July 16 2003
Section 4 On-Site CEMS Inspection
Table 4-9Summary of Flow Monitor Checks
What to Check Description
Observe andor review daily calibration error test and interference test
See Sections 42 and 431
Review any issues observed in reported results of flow-to-load tests
See Appendix B sect 225 for requirements of flow-to-load tests Make sure the test was performed and that the results were properly calculated If the source is excluding hours from the analysis as allowed for in Appendix B check to see that the exclusions meet Part 75 criteria
Identify if temperature and stack pressure are monitored and what QAQC procedures apply
Temperature and pressure may be monitored in conjunction with the flow monitor Note the QA and preventive maintenance procedures and schedule Ask if there have been any problems and corrective actions Check the QAQC plan and maintenance records
Check if there have been any changes to k-factors and polynomial coefficients since the last RATA
Changes to the correction factors should be recorded in the maintenance log and the procedures for changing the correction factor outlined in the QAQC plan A three load RATA is required following any change to flow monitor k-factors (sect 7520(b))
Status of the control panel lights indicators and alarms Displays should show that the analyzer is on and operating properly
The displays will vary by analyzer so ask the source what the displays are and what they mean An alarm light could indicate a potential or developing problem that needs to be addressed (check the QAQC plan)
Check range setting and whether the source has performed the annual spanrange check required by Appendix A sect 21
Ask the operator what the range settings are and how they are displayed Compare the range setting to the value in the monitoring plan (RT 530) and the results of the recent spanrange check
47 DAHS
The data acquisition and handling system (DAHS) consists of all the hardware and software used to comply with Part 75 electronic recordkeeping and reporting requirements It is a critical component of the monitoring system as it converts the analyzer signal to reported emissions data The on-site audit of the DAHS focuses on data handling issues that can not be checked electronically These checks fall into three areas
DAHS certification and verification of missing data routines and emission calculations Changes in correction factors Manually entered data
Part 75 Field Audit Manual ndash July 16 2003 Page 73
On-Site CEMS Inspection Section 4
471 DAHS Certification and Verification Tests
As for other components of the plants CEMS make sure that the DAHS version in use has been previously certifiedrecertified by checking against the monitoring plan report you printed out from MDC
Also you should ask to see a copy of the DAHS missing data and formula verification test results Part 75 requires a verification test for the missing data routines and emission calculation formulas as part of the initial certification (sect 7520(c)(9)) and whenever the DAHS is replaced upgraded to support a new EDR version or when the missing data algorithm has been changed (diagnostic testing under sect 7563(a)(2)(iii))
The source is not required to submit the results of the verification tests and there are no MDC or ETS electronic checks of the routines The source is however required to keep these test results on-site and available for inspection so you should note that the tests have been performed and what the results were (including any vendor certification) The missing data routines may be verified either by performing tests using a checking software or by a certification by the DAHS software developer that the software package meets all of the missing data requirements of Part 75 Question 1496 in the Parts 75 and 76 Policy Manual provides more information on the verification testing requirements
472 Changes in Correction Factors
Previous sections on dilution extractive systems analyzers and flow monitors recommended that you investigate what types of correction factors if any are applied to raw data (eg pressuretemperature compensation molecular weight flow and moisture monitoring polynomials sonic velocity correction factors NOx quenching correction factors and dilution ratio settings) In addition you should ask how changes to these correction factors are entered into the DAHS As noted earlier changes to correction factors should be recorded in the maintenance log and the QAQC plan should outline the procedures for changing the correction factors (Appendix B sect 113) Diagnostic QA testing is required for many of these changes (see sect 7520(b))
473 Manually Entered Data
Part 75 requires that the DAHS automatically record all emissions data and the daily calibration error checks (Appendix A sect 4) There are a few exceptions which allow manual entry or editing of data which are shown in the text box Check how various types of data are entered manually by asking the source to explain their procedures and by reviewing the QAQC plan and the hardcopy supporting
Manual Data Entry Allowed by Part 75
bull Negative (lt 0) emission values bull Erroneous emission values (if significant
must be approved by EPA) bull SO2 concentration lt 20 ppm bull Reference method back-up data bull RATA reference method data and RATA
results bull Leak checks 7-day calibration error tests
and cycle time tests bull Operating data (load and time) bull Missing data periods bull Add-on control equipment operation
during missing data periods
For more information on manual entry or editing see Section IIC3 of the EDR v22 Reporting Instructions (August 2002)
Page 74 Part 75 Field Audit Manual ndash July 16 2003
Section 4 On-Site CEMS Inspection
information for the manually entered data A number of areas you may emphasize are described below
QA Tests
Ask the source how the QA test results (daily calibration error test linearity test and RATAs) are entered into the DAHS If you have not compared a RATA report from the MDC program to plant hardcopy RATA results in your pre-audit review ask for a hardcopy of the report and check that the dates and time relative accuracy and bias adjustment factors (BAF) match Also if you identified problems with QA test calculations go over how that data are entered into the DAHS as well as the applicable QAQC plan procedures For example the BAF may not have been applied correctly to the emission data The BAF should be applied starting with the hour following completion of the RATA
Missing Data
Ask how the source records and reviews missing data How do they check that the substitute values appear correct (eg do the substituted values appear to be correct in view of the percent monitor data availability (PMA) and the length of the missing data period do the substitute NOx and flow rate values change when the load range changes during a missing data period are maximum potential values substituted when the PMA drops below 800 percent) Compare the procedures described to those in the QAQC plan Pick out a recent missing data period (one you may have identified in your pre-audit review) and spot check the electronic data by comparing against supporting hardcopy documentation
Optional Missing Data Routines - Units with Add-on Control Equipment
If the source is using an optional missing data routine for units with add-on control equipment you also may need to review control device parameter monitoring records There are four missing data options for units with add-on controls three of which require parameter monitoring to demonstrate the level of control achieved during the missing data period (sect 7534)
You will first need to check the QAQC plan The facility must identify add-on SO2 or NOx control equipment parameters and acceptable ranges in the plan
sect 7534 Optional Missing Data Procedures for Units with Add-On
Control Equipment
(1) Standard Missing Data Routines with Parametric Supporting Data
(2) No Parameter Data (3) Parametric Missing Data Substitution
Method (4) Parameter Data Used to Support Use of
Maximum Controlled Emission Rate
if the source is using add-on control equipment missing data options (see Part 75 Appendix B sect 111) Ask the source for the parameter monitoring records for a number of missing data periods You may have identified specific missing data periods from your pre-audit preparation Compare the parameter data to the acceptable ranges in the QAQC plan and identify any periods when the parameter range is exceeded Check how the missing data period was then flagged in the DAHS (control operating properly or not operating properly)
Part 75 Field Audit Manual ndash July 16 2003 Page 75
On-Site CEMS Inspection Section 4
Table 4-10Summary of DAHS Checks
What to Check Description
Check that DAHS verification tests have been performed for the missing data routines and calculations
Check the DAHS against the monitoring plan Verification tests for missing data routines and emissions calculations are required for initial certification and if the DAHS is replaced or there have been changes to the software Verification test results for the missing data routines and emissions calculations are required to be kept on site by sectsect 7520(c)(9) and 7563(a)(2)(iii) A vendor certification that the software meets Part 75 requirements is sufficient for missing data routines
Ask the source what type of correction factors are applied to raw data and how they are entered into the DAHS Also ask if any changes have been made
Changes to correction factors should be recorded in the maintenance log and the QAQC plan should outline the procedures for changing the correction factors (Appendix B
sect 113) QA testing may also be required (see sect 7520(b))
Ask what data are entered manually and how Spot check the electronic data with the manual hardcopy
You want to make sure there is documentation supporting the data that is added manually to the DAHS and that QAQC plan procedures are followed Procedures for manually entering data should be documented in the QAQC plan
How are data for the daily calibration linearity and RATA tests recorded Review some recent records to verify that hardcopy and electronic data match
Compare a RATA or linearity report from the MDC program to the plant hardcopy Check that the dates and time relative accuracy (or linearity error) and bias adjustment factors (BAF) if applicable match
Review parameter monitoring records for units using the optional missing data procedures for add-on control equipment
The QAQC plan will identify control equipment parameters and acceptable ranges (Appendix B sect 111 and sect 7558(b)) Compare the control equipment parameters to the ranges for a missing data period
48 Maintenance Log and Daily Checklists Review
The maintenance logs should detail any maintenance performed on the system and should reference all preventive maintenance performed Appendix B Section 113 requires the facility to keep the following maintenance records
Date time and description of any testing adjustment repair replacement or preventive maintenance action performed on any monitoring system
Records of any corrective actions associated with a monitors outage period
Any adjustment that changes a systems ability to record and report emissions data must be recorded (eg changing of flow monitor or moisture monitoring system polynomial
Page 76 Part 75 Field Audit Manual ndash July 16 2003
Section 4 On-Site CEMS Inspection
coefficients K factors or mathematical algorithms changing of temperature and pressure coefficients and dilution ratio settings) and
A written explanation of the procedures used to make the adjustment(s)
During the inspection you should begin by asking the CEMS technicians to describe what goes wrong with equipment what breaks and what maintenance is required Ask how they knew something was wrong and what they did about it Also ask what QA tests were done to show that the problem was resolved Make sure you understand what they are saying as their terminology may not always match the Part 75 rule terminology For example the plant personnel may refer to a daily calibration error test as a system cal overboard cal or span check
Then check the maintenance log book to see how the information is recorded You should point out any entries that you do not understand and explain why you do not understand the entry Compare to the QAQC plan to determine whether the source is implementing the preventive maintenance procedures You should also review the maintenance log to identify recertification events and adjustments that have been made to the systems which could affect the monitored data The maintenance log may also provide another check on handling of missing data periods and it can verify that linearity tests and RATAs were performed on the dates identified in the EDR
Some checks may include
Do the log entries sufficiently describe the action taken Are the entries understandable
Does the log show maintenance checks at the frequency identified in the QAQC plan
Are there recurring failures or malfunctions recorded in the log
Are malfunctions resolved as specified in the QAQC plan Are calibration error tests or other required QA tests performed before the CEMS is returned to service
Do events in the maintenance log correspond to reported missing data periods in the quarterly reports
Are there repeated adjustments to the zero or span
Have system parts or components been replaced If so has the proper recertification or diagnostic testing been performed
Are corrective actions recorded for malfunctions or as a result of daily calibration error tests or other performance tests
Are the nameinitials of the person performing task or logging data provided (While this is not required it is important for the log entries to be traceable to the person who makes the entry so that further questions can be answered if needed)
Part 75 Field Audit Manual ndash July 16 2003 Page 77
On-Site CEMS Inspection Section 4
49 QAQC Plan Review
The QAQC plan has been referenced throughout the previous sections At a minimum a QAQC plan should describe the detailed procedures and operations for calibration error and linearity tests calibration and linearity adjustments preventive maintenance and any adjustments to the system spare parts list a troubleshooting matrix and recordkeeping and reporting For units with add-on SO2 or NOx emission controls the QAQC plan may also contain (for missing data purposes) add-on emission control parameters and the range for each parameter representative of the normal operating conditions Required elements in the QAQC plan are summarized in Table 4-11 You should note that Part 75 allows electronic storage of the information in the QAQC plan provided that the information can be made available in hardcopy upon request during an audit The plan may also reference manufacturers operating manuals
Reviewing QAQC plan information is an important aspect of the on-site inspection activities described throughout the previous sections A recommended approach to inspecting various aspects and components of a plants CEMS QA program is to
Ask the plant staff to explain how they operate the equipment and perform QA and maintenance activities
Observe and record your own observations of procedures plant documentation and equipment settings
Compare the QAQC plan description of the equipment settings monitoring operating procedures and QA test procedures to actual operations at the plant
You should note instances where actual plant operations are different from the operations described in the QAQC plan and ask for an explanation Determine and discuss whether the actual procedure or the QA plan procedures meet Part 75 requirements In some cases the actual operations may be appropriate but the QAQC plan may need to be updated Clearly you should also note areas where the actual operations and QAQC plan match but neither meet Part 75 requirements
In addition to examining specific elements of the QAQC plan where there are discrepancies or potential problems you may also do a general review of the QAQC plan to check that the plan covers the Part 75 elements as shown in Table 4-11 Particular areas to focus on are the QA test procedures CEMS adjustment procedures and preventive maintenance procedures
Page 78 Part 75 Field Audit Manual ndash July 16 2003
Section 4 On-Site CEMS Inspection
Table 4-11 Checks for QAQC Plan Elements
What to Check Part 75 Requirement
Is there a written QAQC plan (it may be stored electronically but Appendix B sect 1 should be available) and when was it last updated
Are calibration error test and linearity test procedures outlined in the plan
Appendix B sect 121
Are calibration and linearity test adjustment procedures outlined Appendix B sect 122
Are RATA test procedures provided Appendix B sect 123
Are emissions and QA test recordkeeping and reporting procedures including missing data procedures included
Appendix B sect 112
If using add-on control equipment missing data options are control equipment parameters identified
Appendix B sect 111
Are procedures for preventive maintenance and Part 75 recordkeepingreporting identified
Appendix B sectsect 111 and 2
Part 75 Field Audit Manual ndash July 16 2003 Page 79
On-Site CEMS Inspection Section 4
[This page intentionally left blank]
Page 80 Part 75 Field Audit Manual ndash July 16 2003
Section 5 CEMS Performance Test Observation
Section 5 covers how you should observe CEMS performance tests (linearity tests and RATAs) u will generally observe a performance test in conjunction with the on-site CEMS audit activities outlined in Section 4
Yo
51 Introduction
In addition to the basic step of observing a daily calibration error test (see Section 42) EPA encourages all States and Regional Offices to conduct level 2 audits that include a RATA or linearity test observation These performance tests are a critical element of the Part 75 QA program The RATA in particular serves as the primary measurement of CEMS accuracy The presence of an agency observer can serve as an effective tool for ensuring that the source carries out the testing properly and that the results of the tests provide a valid assessment of data quality
During the performance test observation you should document any deviations from the test protocol You should provide copies to the source to avoid misunderstandings about any decisions you may make The observer should notify the tester immediately if there is a question as to whether or not any test procedures comply with Part 75 requirements so that the tester can take corrective action and if necessary restart the testing
Once the performance test is started and until it is concluded the only adjustments that may be made to the monitor are routine calibration adjustments towards the calibration gas or reference signal value that are the result of a regularly scheduled calibration error test This is more likely to occur during a RATA than during a linearity test
The source can make non-routine calibration adjustments (done by physically adjusting the instrument response using analyzer controls) before the linearity or RATA and at other times provided the QAQC plan includes specific criteria for the adjustment A calibration error test must be performed following the adjustment (Part 75 Appendix B sect 213) You should note if any adjustments were made prior to the performance test and review plant maintenance records for documentation of the adjustment (Part 75 Appendix B sect 113)
Calibration error tests are often performed prior to a linearity test or RATA As discussed earlier with respect to monitor adjustments you should ask the source if a calibration error test was performed prior to the linearity or RATA to be observed what the results were and if any adjustments were made RATA and linearity tests should not be conducted on a system that is out-of-control with respect to the calibration error requirements
Appendix A contains observer checklists to assist you in observing the performance tests You should also be familiar with the Part 75 performance test requirements in Appendix A sectsect 62 and 65 and the Part 60 reference methods used in the RATAs
Part 75 Field Audit Manual ndash July 16 2003 Page 81
Performance Test Observation Section 5
52 Linearity Test
A linearity test for a gas CEMS is conducted by challenging the CEMS with three audit gases one having a value of 20 to 30 percent a monitors span the second a value of 50 to 60 percent of span and the third a value of 80 to 100 percent of span Flow and moisture monitors are not subject to the linearity test requirements and SO2 and NOx monitors with spans 30 ppm also are exempt The source must conduct a linearity test every quarter (although exceptions for low operating hours and grace periods may apply) For a dual range analyzer the test is performed for each range used during the applicable quarter
The CEM system is challenged three times with each audit gas The same gas concentration or level is not to be run twice in succession The audit gas is injected at the gas injection port required in Part 75 Appendix A sect 221
The response to the zero and upscale gases is not immediate but approaches an asymptotic value (See Illustration 5-1) It is important that sufficient time is allowed for the concentration reading to stabilize for each injection of gas Watch the analyzers instantaneous response to see if enough time is allowed to reach a stable fully equilibrated response The time should not exceed 15 minutes Pay the most attention to SO2 since it is the most adsorptive and absorptive (this will delay the equilibration time)
Illustration 5-1Asymptotic Calibration Check Response (Jahnke 1994)
Also note the time required compared to the gas injections for the daily calibration error tests Both times should be about the same If they are not ask the source why this is the case Record the analyzers stabilized response and compare to the value recorded by the DAHS The values should be the same The average CEMS response will be taken from the DAHS as the official component for recording the CEMS data These linearity test procedures and requirements are specified in detail in Part 75 Appendix A sect 62
Page 82 Part 75 Field Audit Manual ndash July 16 2003
Section 5 Performance Test Observation
Time Shared Systems
Time shared systems use the same gas analyzers for multiple emission units or time shared systems the 15 minute maximum cycle time requirement for the analyzer gas concentration to stabilize includes the cycle time of each probe location served by the system
F
Appendix A contains an observer checklist Inspect the cylinder gases as outlined in Section 4 record the linearity test results using the checklist and calculate the linearity result for each level Compare the results to the appropriate performance specification listed in Table 5-1
Table 5-1Linearity Test Specifications
Monitored Parameter
Linearity Test Performance Specification (Part 75 Appendix A sect 32)
SO2 or NOx 50 linearity error or
5 ppm absolute value of the difference between the average of the monitor response values and the average of the reference values R-A
CO2 or O2 50 linearity error for each calibration gas concentration or
05 absolute value of the difference between the average of the monitor response values and the average of the reference values R-A
53 Relative Accuracy Test Audit (RATA)
A Relative Accuracy Test Audit (RATA) compares a units CEMS measurements to that of reference method stack tests The reference method tests yield results representative of the pollutant concentration emission rate moisture temperature and flue gas flow rate from the unit The RATA compares these results directly to CEMS measurements The RATA test is the primary measurement of CEMS accuracy for a Part 75 CEMS
Part 75 requires semi-annual or
RATA Reference Materials
Reference Methods in Part 60 Appendix A are available at the Emission Measurement Center website wwwepagovttnemc
Answers to common Part 75 RATA questions are provided in the Parts 75 and 76 Policy Manual at wwwepagovairmarkets
annual RATAs depending on the relative accuracy achieved in the preceding RATA Most units qualify for the annual RATA frequency (Appendix B sect 2312)
Gas RATAs performed at single load levels are often conducted simultaneously and may take about 7 hours The flow RATAs may be conducted at one two or three loads A
Part 75 Field Audit Manual ndash July 16 2003 Page 83
Performance Test Observation Section 5
multi-load RATA may therefore be performed over 2 to 3 days with each load of the flow RATA taking about 3 to 5 hours One load of the flow RATA testing often is conducted at the same time as the gas RATAs Part 75 requires that each RATA be completed within 168 consecutive unit or stack operating hours For multi-load flow RATAs up to 720 consecutive unit or stack operating hours are allowed to complete the testing at all load levels (Part 75 Appendix A sect 65)
Flow RATAs are conducted at load levels in the range of operation that extends from the minimum safe stable load to the maximum sustainable load hree levels apply in this range
Low First 30 of range Mid gt 300 and 600 High gt 600 of range
T
You should ensure that the source performs the RATA according to Part 75 and reference method requirements RATA issues of specific importance to Part 75 requirements include
Unit operating conditions The RATA should be performed while the unit is burning a normal fuel listed in the monitoring plan (App A sect 65(a)) Gas RATAs should be performed at normal load Check the load against the monitoring plan normal load If you have questions about the normal load identified in the plan you may also check load against the most recent load data submitted in the EDR to verify that the current load designation is representative of the loads reported Flow RATAs for peaking units or bypass stacks can always be performed at one load For all other situations the RATA for initial certification or recertification of a flow monitor must be a 3-load test A 3-load flow RATA also is required at least once every 5 years as part of the ongoing QA requirements For units that must conduct a flow RATA on an annual basis the standard QA flow RATA is a 2-load test For units that must conduct a flow RATA on a semi-annual basis the source can alternate between a 1-load and a 2-load test Finally units that operate at 1-load consistently (at least 85 percent of the time) can qualify for 1-load testing instead of the 2-load test (see Part 75 Appendix B sect 2313(c))
Check if the source conducted a daily calibration error test on the CEMS prior to the testing or pre-RATA adjustments While Part 75 allows a source to make pre-RATA non-routine adjustments adjustments may not be made between runs at a load level or between load levels except for routine adjustments as a result of the calibration error test (Part 75 Appendix B sect 213)
Has the source performed and passed a stratification test Stratification testing is required for units wishing to use fewer traverse points under the alternatives allowed in Part 75 Appendix A sect 656(a) and (b) For details on stratification testing see Part 75 Appendix A sect 6561 - 6563
Rake probes should not be used as they do not distinctly capture the required traverse points to ensure that a representative stack sample is obtained for analysis See Policy Manual Question 839
Page 84 Part 75 Field Audit Manual ndash July 16 2003
Section 5 Performance Test Observation
Moisture measurements used to correct dry basis measurements in determining emission rate may not be made using the wet bulb-dry bulb technique Wet-bulb-dry bulb measurements however may be used to determine molecular weight See Policy Manual Question 310
EPA recently promulgated new flow reference methods (2F 2G and 2H) Part 75 sources had raised concerns that Method 2 measurements could be biased high in some situations due to stratified or non-parallel flow In response Method 2F measures yaw and pitch angle adjusted velocity 2G adjusts for yaw angle and 2H accounts for wall effects A detailed observer checklist is available for these methods at CAMDs website and you should refer to that observer checklist if you are observing a flow RATA using one of these new methods Also available for downloading from the website is software (FLOW-CALC) that you can use to enter the reference method data and calculate results See httpwwwepagovairmarketsmonitoringindexhtml
Check that the traverse point locations for the reference method tests meet the requirements of Appendix A sect 656 and the sampling location dimensions Gas tests should typically use at least 3 traverse points Check Performance Specification (PS) 2 in Part 60 Appendix B Units with wet scrubbers may use a shorter measurement line than required by PS 2 if minimal stratification is demonstrated and moisture and gas systems may use a single point if the stratification test is passed (Part 75 Appendix A sect 656) The minimum number of traverse points for a flow test is 12 unless also using Reference Method 2H which requires at least 16 points (Part 60 Appendix B) A source can use more than the minimum number of sample points
Check the reference method calibration gases used for instrumental test methods The calibration gas certificate should show EPA Protocol gases or other certified gases concentrations that match those used in the biasdrift check calculations and an expiration date after the RATA The regulator gauge should show a cylinder pressure gt 150 psi
Verify the relative accuracy and reference method calculations yourself by doing the calculations on site using the raw data You should also obtain a copy or record the results of the RATA testers calculations Make sure that the CEMS and reference method data are for the same runs
Observation forms for flow and gas RATAs are provided in Appendix A The forms have more detailed checks than provided here In addition as noted above an observer checklist for flow reference methods 2F 2G and 2H is available at CAMDs website
Part 75 Field Audit Manual ndash July 16 2003 Page 85
Performance Test Observation Section 5
RATA Reference Methods (Part 75 Appendix A sect 6510)
The following methods from Appendix A to Part 60 or their approved alternatives are the reference methods for performing relative accuracy test audits
bull Method 1 or 1A for determining the appropriate test locations
bull Method 2 or its allowable alternatives including in Appendix A to Part 60 (except for Methods 2B and 2E) for stack gas velocity and volumetric flow rate
bull Methods 3 3A or 3B for O2 or CO2
bull Method 4 for moisture
bull Methods 6 6A or 6C for SO2
bull Methods 7 7A 7C 7D or 7E for NOx excluding the exception in section 512 of Method 7E ing Method 7E for measuring NOx concentration total NOx both NO and NO2 must be measured ithstanding these requirements Method 20 may be used as the reference method for relative accuracy test audits of NOx
monitoring systems installed on combustion turbines
When usNotw
Page 86 Part 75 Field Audit Manual ndash July 16 2003
Section 6 On-Site Inspection of Appendix D and Appendix E Monitoring Systems
Section 6 focuses on the on-site review of fuel monitoring and operating records that are required for units that use the excepted monitoring provisions available to gas and oil fired units ecordkeeping The audit emphasis is on verifying r
Part 75 Appendix D provides an optional monitoring protocol that may be used by gas-or oil-fired units instead of SO2 and flow CEMS It includes procedures for measuring oil or gaseous fuel flow using a fuel flowmeter and procedures for conducting sampling and analysis to determine sulfur content density and gross calorific value (GCV) of fuel oil or gaseous fuels
Part 75 Appendix E is available to qualifying gas or oil fired peaking units as an optional NOx emissions rate estimation procedure that may be used instead of a NOx CEMS Baseline stack testing is performed at four operating levels to establish a NOx rate - heat input curve with NOx rate the dependent variable
61 QAQC Plan Review
The QAQC plan provides a template for performing a review of fuel monitoring and sampling records and is the place to start the field audit for the excepted monitoring provisions of Part 75 Appendices D and E As described in Section 49 you should determine whether the QAQC plan meets the requirements of Part 75 Appendix B and whether the facility is implementing the plan Checks of the QAQC plan and rule requirements for Part 75 Appendix D are identified in Table 6-1 and the checks for Part 75 Appendix E are in Table 6-2
Table 6-1Appendix D - QAQC Plan Review
What to Check Part 75 Requirements
Review the fuel sampling methods and analysis The QAQC plan should include standardprocedures Compare the sampling methods and sampling and analysis procedures used by thefrequencies to the rule requirements outlined in source or its fuel supplier (Appendix B sect 135) the sample Appendix D field audit sheets (seeAppendix A of this manual)
Are the fuel flow meter test procedures and the transducer or transmitter accuracy test procedures outlined in the plan sk the source how often (and how) the tests are performed and compare to the plan and Part 75 requirements
Test procedures are required in the QAQC plan (Appendix B sect 132)
A
(cont)
Part 75 Field Audit Manual ndash July 16 2003 Page 87
Appendix D and Appendix E Monitoring Section 6
Table 6-1Appendix D - QAQC Plan Review (cont)
What to Check Part 75 Requirements
Check the fuel flowmeter transducer or
transmitter calibration and maintenance records Records are required by the QAQC plan provisions in Appendix B sect 133 se records are to include adjustments maintenance or repairs performed on the fuel flowmeter monitoring system as well as records of the data and results for Appendix D fuel flowmeter accuracy tests and transducer accuracy tests
Tho
Table 6-2Appendix E - QAQC Plan Review
What to Check Part 75 Requirement (App B sect 136)
Check the recommended range of QAQC parameters and hourly records of these parameters Make sure the parameters are identified and recorded
The QAQC plan must identify recommended ranges of quality assurance- and quality control-related operating parameters that are recorded each hour There are to be at least 4 parameters for turbines or reciprocating engines and oxygen for boilers (Appendix E sect 232)
Request that the source identify any parameter deviations and ensure proper missing data procedures are used for those hours
The source is required to redetermine the Appendix E correlation if a single deviation period exceeds 16 operating hours
Check written Appendix E NOx emission rate
testing procedures This is another required component of the QAQC plan The procedures should match the test requirements in Appendix E sect 21
62 DAHS and Supporting Records
Elements of the data acquisition and handling system (DAHS) for an Appendix D or Appendix E monitoring systems should be checked in a manner similar to that described under the CEMS on-site inspection in Section 4 of this manual
The DAHS consists of all the hardware and software used to comply with all electronic recordkeeping and reporting requirements Make sure that the version used is previously certifiedrecertified by checking against the monitoring plan and ask to see and check the DAHS verification test for the missing data routines The source is not required to submit these results and there are no electronic checks of the routines Verification test results for the missing data routines are required by sectsect 7520(c)(9) and 7563(a)(2)(iii) The latest test should have occurred no earlier than when the unit began using EDR v21 (or v22 when applicable)
Page 88 Part 75 Field Audit Manual ndash July 16 2003
Section 6 Appendix D and Appendix E Monitoring
Additional checks are necessary to ensure that data entered manually into the DAHS match hardcopy supporting information Fuel sampling data (sulfur content density GCV) may be entered manually into the DAHS Ask the source how these data are entered You should also compare the electronic fuel data in the DAHS to the on-site hardcopy fuel sampling and analysis data to make sure they match The source may pull the electronic data up for you using the DAHS or you may use data that you printed out from MDC Hourly
You should also investigate how emissions data missing data periods and operating parameters are recorded If data are entered by hand you should similarly spot check the electronic data with the hardcopy For Appendix E units check to see that the results from the plants copy of the Appendix E NOx emission rate tests match the curve in the monitoring plan and DAHS This should include checks on the dates and times NOx load and fuel flow values You can use MDCs Appendix E test report function to review the electronic data You should also check the sources hardcopy capacity factor documentation against the capacity factor submitted in the EDR (see Record Type 507)
Table 6-3Summary of DAHS and Supporting Records Checks
What to Check How to Check
Check that the current DAHS version is certified and that a DAHS verification test was conducted for the missing data routines
Compare the DAHS to that identified in the monitoring plan Missing data routine verification test results are required by sectsect 7520(c)(9) and 7563(a)(2)(iii) The latest test should have occurred no earlier than when the unit began using EDR v21 (or v22 when applicable)
How is fuel sampling data (sulfur content density GCV) entered Do the data match the fuel analysis results
Ask the source to pull up the fuel data in the DAHS and compare to hardcopy fuel sampling and analysis data
How are emissions data missing data periods and operating parameters recorded
If the data are entered by hand spot check the data with the hardcopy
Does the hardcopy report of the Appendix E NOx
emission rate tests match the curve in the monitoring plan and DAHS
Compare the plants copy of the test report to the Appendix E test report from the MDC program Check that dates and times NOx load and fuel flow values match
63 Appendix D Fuel Flow Monitors
If practical visually check the fuel flow monitors to verify that the fuel flow monitors match those in the monitoring plan At a minimum the monitoring plan should at least show the flowmeter component type manufacturer modelversion and serial number Some units may also report each auxiliary component (pressure and temperature transducers and transmitters) in the monitoring plan
Part 75 Field Audit Manual ndash July 16 2003 Page 89
Appendix D and Appendix E Monitoring Section 6
64 Appendix D Fuel Flow Monitor Quality Assurance
Billing meters are exempt from QA accuracy testing and other quality assurance requirements (Part 75 Appendix D sect 214) You should first ask if the monitor is used for commercial billing and has been designated as such This should be identified in the monitoring plan If it is no further checks are necessary
641 QA Testing
After the initial certification tests fuel flow monitors are to be tested once every four fuel flowmeter QA operating quarters Extensions up to 20 operating quarters are available based on quarterly fuel flow-to-load test results For these QA tests make the following checks
Are quarterly fuel flow-to-load tests performed This test is optional Test results are reported in the EDR -- you may have reviewed the data prior to the visit using MDC Verify that on-site test results match those in the electronic report
Check fuel flow monitor accuracy test reports Compare the hardcopy accuracy test results against those reported electronically MDC can provide a copy of the electronic report You can also verify the calculations Ask the source for a copy of the report which should be in a format similar to Part 75 Appendix D Table D-1 or D-2
642 Maintenance and Inspection Records
The maintenance logs should detail any maintenance performed on the system and should reference all preventive maintenance performed During the inspection you should look at the maintenance log book which is required as part of the QAQC plan The maintenance conducted should match the maintenance procedures in the plan Also verify that there have been no changes to monitoring equipment without appropriate recertification testing See Section 48 for more discussion of maintenance logs
Page 90 Part 75 Field Audit Manual ndash July 16 2003
Section 7 Reporting Audit Results
Section 7 provides a brief overview of reporting results in the exit interview and audit report ould highlight issues suggesting data invalidity so that the source can take steps to minimize allowance penalties from missing data CAMD should receive prompt notice of issues that may affect the validity of mass emissions data
The interview sh
71 Exit Interview
You should conduct an informal summary of the audit findings (exit briefing) before you leave the facility You should discuss the audit findings with reference to specific regulatory requirements or in terms of potential problems Evidence should be available to support a finding or observation although you should raise any questions on a monitoring method or rule requirement If a source disputes a finding you should give it an opportunity to provide adequate alternate information Further investigation after the meeting may be required to achieve the resolution of questioned items In such cases you should table the discussion at the briefing
If you perform the audit periodically you should address any progress or lack thereof since the previous audit This is readily done by reviewing the findings of the last audit and noting how the issues have been resolved If there has been no progress the review should emphasize the ongoing problems and stress the need for immediate resolution
72 Audit Report
The audit report organizes and coordinates information gathered during the audit in a usable manner -- it is the compilation of factual information and professional judgment resulting from the audit The report also serves to record the procedures used in gathering the data and gives factual observations and evaluations from the audit Information in the report must be accurate relevant complete objective and clear You should avoid discussions of general topics and should link all compliance issues directly to regulatory requirements Include any follow-up actions in the audit report
You also should prepare a cover letter summarizing the audit results and follow-up activities Send the cover letter and audit report to the Designated Representative or the sources contact person and a copy to the EPA Regional andor State agencies The Clean Air Markets Division should receive a copy of the cover letter If any findings are likely to affect reported mass emissions used for allowance true-up activities notify CAMD immediately You should complete the audit report within one month following the audit while observations are still fresh and to provide a quick response to any problems Notify the source if the report is delayed
Part 75 Field Audit Manual ndash July 16 2003 Page 91
Reporting Audit Results Section 7
73 Follow-up Activities
The audit team should keep documentation of any outstanding issues from the audit A follow-up review should be scheduled within a reasonable time after the audit
Page 92 Part 75 Field Audit Manual ndash July 16 2003
Section 8 Conducting Level 3 Audits
Section 8 discusses issues that an agency should consider in developing a performance testing program (a Level 3 audit capability) es single gas challenges and linearity tests
This section emphasiz
81 Overview
This section focuses on issues that an agency should consider if it chooses to develop a Level 3 audit program that includes single gas challenges and linearity testing of gas CEMS The emphasis in this section is on the calibration gases and development of a testing program rather than on a step-by-step description of how to perform a test
Agencies that currently do not perform Level 3 performance tests may have in-house expertise and experience available in the agencys ambient air monitoring staff Single gas challenges and linearity testing of Part 75 gas CEMS require the same knowledge base as calibration testing of ambient gas monitors An agency can take advantage of this existing resource in developing a Level 3 program for Part 75 audits
82 Tri-Blend or Single Blend Gases
Part 75 affected sources commonly use multi-component calibration gases Multi-component gases provide cost savings over single component gases by reducing the number of cylinder gases and the equipment necessary for calibration tests These calibration gases also allow for calibrating analyzers simultaneously The tri-blend (or triple blend) contains SO2 NO and CO2 The SO2 and NO are at relatively low concentrations in the ppm range while the CO2
concentration is in the percent range The single component (or single blend) calibration gas consists of the target compound -- SO2 NO or CO2 -- blended with N2 or air Compared to a single blend a tri-blend replaces a portion of the N2 or air with CO2 (up to 20 percent by volume for high range testing)
Tri-blends with a CO2 concentration of 11 percent (representative of most stack conditions) are recommended for agency auditors CO2 concentrations representative of stack gas conditions will minimize molecular weight or interference effects described below that can occur if the CO2 concentration in the calibration gas is different from the stack gas
Molecular Weight Effects - Dilution Systems
CO2 weighs more than N2 or air so a tri-blend calibration gas containing CO2 will be heavier than a single blend calibration gas in which the balance is either N2 or air This will impact a single gas challenge or linearity test of dilution extractive systems if the inspector uses a single blend to conduct a test on units that normally use tri-blends for calibration and quality assurance The sample flow in a dilution extractive system is controlled by the critical orifice
Molecular Weight of Major Calibration Gas
Component Compounds
bull CO2 44 bull N2 28 bull Air 29
Part 75 Field Audit Manual ndash July 16 2003 Page 93
Single Gas Challenges and Linearity Tests Section 8
which is dependent on molecular weight Dilution extractive systems therefore will produce different test results depending on whether a single blend or tri-blend gas is used Your best approach to dealing with this issue is to use a tri-blend with CO2 concentrations representative of stack conditions Table 8-1 summarizes the effects of calibration gas blend molecular weights on dilution system emission measurements and QA testing measurements
Table 8-1Effects of Gas Blends on Dilution System Measurements
(from Table 3-2 in Jahnke 1994)
Activity Performed Calibration Gas Blend
Used Possible Resulting Measurement Biases
Emissions Measurements
CEM system calibrated with CO2 triple blend
Emission measurements bias minimized (because CO2 present in both flue gas and calibration gas)
CEM system calibrated with single blend (eg SO2 in nitrogen)
Emission measurements are biased (because CO2 is present in flue gas)
Calibration Error Test and Linearity Check
CEM system calibrated with single blend
Calibration error test conducted with CO2
triple blend will show a bias Linearity check conducted with CO2 triple blends will show bias
CEM system calibrated with CO2 triple blend
Calibration error test conducted with single blend will show a bias Linearity check conducted with single blends will show bias
CEM system calibrated with single blend
RATA conducted with Reference Method 6C calibrated with a CO2 triple blend will show bias
CEM system calibrated with CO2 triple blend
RATA conducted with Reference Method 6C calibrated with a single blend will show bias
RATA CEM system calibrated with a single blend
RATA conducted with Reference Method 6C calibrated with a single blend will minimize bias
CEM system calibrated with CO2 triple blend
RATA conducted with Reference Method 6C calibrated with a CO2 triple blend will minimize bias
Interference Effects
CO2 can interfere with chemiluminescent NOX monitors (quenching) and cause a negative error in the NOx emission measurement If the auditor uses a NO single blend calibration gas without CO2 the result reported by the DAHS will be higher than the calibration gas concentration as the CEMS results are corrected to account for the CO2 concentration in
Page 94 Part 75 Field Audit Manual ndash July 16 2003
Section 8 Single Gas Challenges and Linearity Tests
the stack gas As in the case of molecular weight effects using a tri-blend with CO2
concentrations representative of stack conditions will minimize this problem
83 Hands Off Policy
EPAs hands off approach discussed in Section 141 also applies to conducting a single gas challenge or linearity test You do not need to physically handle a facilitys CEMS hardware You should ask qualified plant personnel to perform any actions with the CEMS equipment This includes connecting cylinder gases to the plant calibration gas manifolds or your gas delivery line to the CEMS calibration gas injection point and obtaining results from the DAHS
84 Test PlanProcedures
The agency should prepare standard operating procedures for performing the single gas challenge or linearity test A general outline of items to cover is provided in Table 8-2 A sample procedure for linearity testing is provided in Appendix A of this manual
Table 8-2Elements of a Standard Operating Procedure for Performance Testing
Procedure Element DescriptionPurpose
Pre-Test Survey Contact the source to schedule the test verify CEMS calibration information and review test logistics
Pre-Test Equipment Preparations Select and prepare test equipment
Pre-Test Meeting Plant meeting the day of the test Review of test procedures and any special circumstances
Equipment Set-up Outline of steps to set up the test equipment
Test Procedure Step by step procedures for the test itself including calculations
Pack-up Procedure Description of equipment breakdown after the test is completed
Post-Test Meeting Provide source with the test results
85 Single Gas Challenge
The single gas challenge uses one protocol gas to challenge the CEMS at one point in the measurement range It has a logistical advantage over performing a linearity test One trishyblend gas cylinder can cover CO2 SO2 and NOx and there is no need for a manifold or trailer The disadvantage is that only one point in the measurement range is tested EPA recommends that if a single gas challenge is performed a mid level gas be selected (~ 40 - 60 percent of span) Have the source perform a daily calibration error test so that the full scale can be evaluated This approach minimizes the resources required but most closely approximates a full linearity test
Part 75 Field Audit Manual ndash July 16 2003 Page 95
Single Gas Challenges and Linearity Tests Section 8
When you perform the single gas challenge connect your calibration gas cylinder to the sources calibration gas manifold ep in mind the hands off policy ould perform three runs For each run
Inject gas wait for the response to fully stabilize and record value from the DAHS and
Allow system to sample stack gas and equilibrate before the next run
Based on this test the percent error is calculated in the same manner as the linearity error
where
LE = Percent linearity error R = Reference value of calibration gas A = Average of monitoring system responses
86 Linearity Test
Linearity test procedures and requirements are outlined in Part 75 Appendix A sect 62 There are two approaches your agency might take with regards to the logistics of on-site linearity testing rst approach is similar to the single gas challenge in that you bring your own calibration gases to the site and have the source connect each of your three cylinder gases (low mid and high) to the plant calibration gas manifold ach is to provide your own gas delivery manifold set-up with your cylinders in a truck or trailer and have the source attach your gas delivery line to the CEMS injection point
You will challenge the CEMS three times with each audit gas s injected at the gas injection port required in Part 75 Appendix A sect 221 e same gas concentration or level is not used twice in succession Sufficient time should be allowed for the concentration reading to stabilize for each gas injection he average CEMS response will be taken from the DAHS as the official component for recording the CEMS data You then calculate the percent error using the same equation identified in Section 85 above
87 Calibration Gases
As noted earlier a tri-blend gas containing SO2 NOx and 11 percent CO2 is recommended for agency audits of SO2 and NOx monitors The number of different calibration gases that your agency will need is dependent on the spans of the CEMS installed on units in your area At least three audit gases will be needed to conduct the linearity test at a unit ne having a value 20 to 30 percent of span the second with a value of 50 to 60 percent of span and the third with a value of 80 to 100 percent of span Review the monitoring plans for the units in your area to identify which gases you will need gency should develop a standard operating procedure for maintaining the calibration gas inventory
Ke You sh
The fi
The other appro
The audit gas iTh
T
o
Your a
Page 96 Part 75 Field Audit Manual ndash July 16 2003
Section 8 Single Gas Challenges and Linearity Tests
88 Training
Table 8-3 lists available EPA training courses pertaining to gas CEMS and analyzer calibration Two of the courses APTI 435 and APTI 464 are geared to operating an ambient monitoring system but include instructions on how to calibrate gas analyzers that are directly applicable to performing a single gas challenge or linearity test on a Part 75 gas CEMS
Table 8-3Available EPA Training Courses
EPA Course Number
Course Title
APTI 435 Atmospheric Sampling
APTI 464 Analytical Methods for Air Quality Standards
APTI 450 Source Sampling for Pollutants
APTI 474 Continuous Emission Monitoring
SI 476B Continuous Emission Monitoring Systems Operation and Maintenance of Gas Monitors
Part 75 Field Audit Manual ndash July 16 2003 Page 97
- Page 1
- Page 2
- Page 3
- Page 4
- Page 5
- Page 6
- Page 7
- Page 8
- Page 9
- Page 10
- Page 11
- Page 12
- Page 13
- Page 14
- Page 15
- Page 16
- Page 17
- Page 18
- Page 19
- Page 20
- Page 21
- Page 22
- Page 23
- Page 24
- Page 25
- Page 26
- Page 27
- Page 28
- Page 29
- Page 30
- Page 31
- Page 32
- Page 33
- Page 34
- Page 35
- Page 36
- Page 37
- Page 38
- Page 39
- Page 40
- Page 41
- Page 42
- Page 43
- Page 44
- Page 45
- Page 46
- Page 47
- Page 48
- Page 49
- Page 50
- Page 51
- Page 52
- Page 53
- Page 54
- Page 55
- Page 56
- Page 57
- Page 58
- Page 59
- Page 60
- Page 61
- Page 62
- Page 63
- Page 64
- Page 65
- Page 66
- Page 67
- Page 68
- Page 69
- Page 70
- Page 71
- Page 72
- Page 73
- Page 74
- Page 75
- Page 76
- Page 77
- Page 78
- Page 79
- Page 80
- Page 81
- Page 82
- Page 83
- Page 84
- Page 85
- Page 86
- Page 87
- Page 88
- Page 89
- Page 90
- Page 91
- Page 92
- Page 93
- Page 94
- Page 95
- Page 96
- Page 97
- Page 98
- Page 99
- Page 100
- Page 101
- Page 102
- Page 103
- Page 104
- Page 105
- Page 106
- Page 107
-
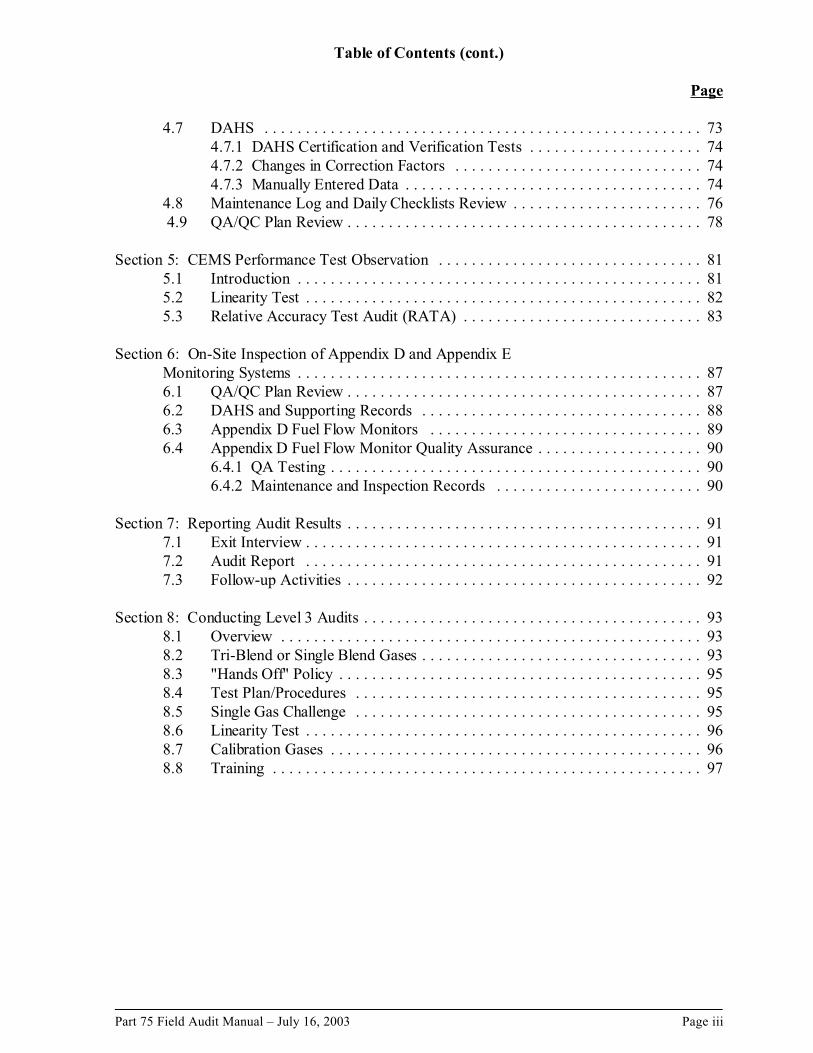
[This page intentionally left blank]
Page iv Part 75 Field Audit Manual ndash July 16 2003
List of Tables
Page
Table 1-1 Part 75 PollutantsParameters and CEMS Components 4Table 1-2 Part 75 Non-CEMS Methodologies 5Table 1-3 Levels of Field Audits 9Table 1-4 Available EPA Training Courses 12Table 2-1 Common Extractive Gas CEM Analytical Methods 28Table 2-2 In-Situ Gas Analyzer Methods 33Table 3-1 Electronic Monitoring Plan Information 46Table 3-2 Summary of MDC QA Test Checks 49Table 3-3 Summary of MDC Hourly Checks 53Table 4-1 Pre-Audit Interview Items 59Table 4-2 Part 75 Calibration Error Test Data Validation Requirements 61Table 4-3 ProbeSensor Check Summary 63Table 4-4 Summary of Dilution Air System Checks 65Table 4-5 Summary of Source Level Extractive System Checks 66Table 4-6 Summary of Analyzer Checks 68Table 4-7 Part 75 Calibration Gases (Appendix A sect 51) 70Table 4-8 Summary of Calibration Gas Checks 71Table 4-9 Summary of Flow Monitor Checks 73Table 4-10 Summary of DAHS Checks 76Table 4-11 Checks for QAQC Plan Elements 79Table 5-1 Linearity Test Specifications 83Table 6-1 Appendix D - QAQC Plan Review 87Table 6-2 Appendix E - QAQC Plan Review 88Table 6-3 Summary of DAHS and Supporting Records Checks 89Table 8-1 Effects of Gas Blends on Dilution System Measurements 94Table 8-2 Elements of a Standard Operating Procedure for Performance Testing 95Table 8-3 Available EPA Training Courses 97
Part 75 Field Audit Manual ndash July 16 2003 Page v
List of Illustrations Page
Illustration 1-1 Overview of Continuous Emission Monitoring in a Part 75 Trading Program 3
Illustration 2-1 Basic CEMS Types (Jahnke and Peeler 1997) 16Illustration 2-2 Example of Continuous Emission Monitoring Systems
at a Part 75 Unit 17Illustration 2-3 Typical Source-Level Extractive CEMS (Gschwandtner
and Winkler 2001) 21Illustration 2-4 Dilution Extractive CEMS (Gschwandtner and Winkler 2001) 23Illustration 2-5 In-Stack Dilution Probe (adapted from Jahnke 2000) 24Illustration 2-6 One Type of Out-of-Stack Dilution System (Gschwandtner
and Winkler 2001) 26Illustration 2-7 In-Situ Gas CEMS (Jahnke 1992) 32Illustration 2-8 Example of Multiple Probe Locations (Jahnke 1994) 35Illustration 2-9 Thermal Mass Flow Monitor Probe (adapted from Jahnke 1992) 36Illustration 2-10 Ultrasonic Flow Monitor 37Illustration 3-1 Example EDR Data Format for Record Type 320 42Illustration 3-2 Example Summary of Quarterly Report Content For Two Acid Rain
CEMS Units Emitting Through Common Stack 43Illustration 3-3 MDC Screen Showing Multiple Linearity Tests in One Quarter 48Illustration 3-4 Example MDC Hourly Graph of SO2 Concentration 52Illustration 5-1 Asymptotic Calibration Check Response (Jahnke 1994) 82
Page vi Part 75 Field Audit Manual ndash July 16 2003
Section 1 Introduction
After reading this Introduction the inspector (auditor) should understand the organization of the manual and the topics it covers the role of the field audit in the Part 75 compliance program the key components of the field audit and where to obtain the latest information on the regulation and on manual updates
11 Background
111 Importance of Monitoring for Emission Trading Programs
The US Environmental Protection Agency (EPA) has established monitoring requirements at 40 CFR Part 75 as part of its efforts to develop cap and trade emission reduction programs A cap and trade program is an innovative market-based approach to reducing emissions The cap sets a ceiling on emissions that is below an applicable baseline level Sources in the program receive emission allowances with each allowance authorizing a source to emit one ton of the pollutant being controlled Limiting the number of available allowances ensures the caps integrity At the end of each year every source must have enough allowances to cover its emissions for that year Unused allowances may be sold traded or saved (banked) for future use While this approach allows sources flexibility in deciding how they achieve compliance the cap ensures that the affected sources reduce emissions collectively to the desired reduction goal
The cornerstone for ensuring that sources achieve the required emission reductions is a strong monitoring program Accurate monitoring of all emissions and timely reporting ensure that a ton from one source is equal to a ton from any other source and that the integrity of the cap is maintained Under Part 75 participating sources must fully account for each ton of emissions according to stringent uniform protocols The resulting compliance information is unprecedented in its accuracy and comprehensiveness All data are publicly available on the Internet providing complete transparency
To date the Part 75 monitoring requirements are used for two separate programs Under the Acid Rain Program sources have had to meet Part 75 and emission reduction requirements since 1995 EPA has had the lead in ensuring compliance with the Acid Rain Program although EPA has teamed with State and local agencies on various aspects of implementing the Part 75 monitoring provisions
In May 2002 State agencies began to take the lead role in implementing and ensuring compliance with Part 75 for purposes of a separate nitrogen oxides (NOx) trading program that many eastern States have adopted in response to EPAs 1998 NOx SIP Call EPA believes that a strong audit program is an essential component of an effective Part 75 compliance oversight program Given the increased role of State and local agencies in Part 75 implementation EPA has prepared this manual to assist agencies in implementing Part 75 and to ensure the ongoing integrity of the new NOx trading program
The manual begins with the premise that each link in the chain of the Part 75 program is important in ensuring that the data ultimately used to measure emissions and account for the
Part 75 Field Audit Manual ndash July 16 2003 Page 1
Introduction Section 1
use of allowances in a trading program remain accurate Illustration 1-1 depicts the major links in the data quality chain for a continuous emissions monitoring system (CEMS) The process starts with ensuring that the gas standards used to calibrate and test the monitoring equipment are accurate EPA adopted the Traceability Protocol for Assay and Certification of Gaseous Calibration Standards for this purpose The source must conduct the necessary quality assurance tests following all appropriate procedures and report the results of those tests accurately These quality assurance activities are conducted initially for certification and then on an ongoing basis to maintain a measure of the systems ability to accurately determine emissions Once the data measurements are quality-assured the next step is to ensure that the measured data obtained from the CEM analyzer are accurately recorded by the data acquisition and handling system (DAHS) and appropriately reported in the quarterly electronic data reports (EDR) The EDRs are submitted quarterly to EPA so that it can review and account for the emissions data in the cap and trade program EPA provides the necessary data management systems to track emissions and allowance transfers
The integrity of the overall trading program can break down anywhere along this chain of activities therefore EPA relies on a combination of electronic and field auditing to verify overall data integrity The field audit procedures in this manual are critical for examining these links to verify proper performance of the monitoring systems and identify problems which may lead to inaccurate emissions accounting
Page 2 Part 75 Field Audit Manual ndash July 16 2003
Section 1 Introduction
Illustration 1-1Overview of Continuous Emission Monitoring in a Part 75 Trading Program
112 Structure of Part 75 Monitoring Provisions
Continuous emissions monitoring systems (CEMS) are the primary monitoring method under Part 75 The Part 75 rule includes requirements for installing certifying operating and maintaining CEMS for SO2 NOx CO2 O2 opacity and volumetric flow Appendices A and B of Part 75 provide the technical specifications for the installation and performance of CEMS including certification and quality assurance test procedures The rule also includes approved non-CEMS options for certain gas and oil fired units and procedures to account for missing data
Recordkeeping and reporting provisions require Acid Rain Program and NOx trading program affected units to submit Part 75 hourly emission data and related quality assurance data through electronic report formats to EPAs Emission Tracking System (ETS) which is operated by the Clean Air Markets Division (CAMD) The ETS data in turn are used to
Part 75 Field Audit Manual ndash July 16 2003 Page 3
Introduction Section 1
TIP
Check wwwepagovairmarkets for further regulatory information
maintain the emission allowance accounts in the Allowance Tracking System and the NOx
Allowance Tracking System
The Part 75 requirements are outlined below to introduce you to the rule and some of the terminology used in the manual can obtain copies of Part 75 and determine whether EPA has published further revisions to Part 75 issued new monitoring guidance or revised the information in this manual by checking CAMDs website ion 15 of the manual provides a list of important regulations and policy guidance documents with links to specific pages on CAMDs website you may find helpful
Monitoring Methods
The monitoring requirements for each type of unit subject to Part 75 are in Subpart B of the rule red except for some gas and oil fired units e 1-1 summarizes CEMS components that are required by pollutant while Table 1-2 summarizes the non-CEMS options
Table 1-1 Part 75 PollutantsParameters and CEMS Components
PollutantParameter
Required CEMS Components
SO2 NOx Flow Opacity Diluent Gas (O2
or CO2)
Data Acquisition
and Handling System (DAHS)
SO2 (lbhr)
NOx (lbmmBtu)1 NOx (lbhr)2 Opacity ()3 CO2 (lbhr)4 Heat Input (mmBtuhr)
You
Sect
CEMS are requi Tabl
1Heat input in mmBtuhr is also required2For units subject to NOx SIP Call trading program Can monitor with or without diluentmonitor3Required only for coal and residual oil units4Alternative mass balance method may by used to monitor CO2
Page 4 Part 75 Field Audit Manual ndash July 16 2003
Section 1 Introduction
Table 1-2Part 75 Non-CEMS Methodologies
Pollutant Parameter
Unit Type Monitoring Methodology
SO2 (lbhr) natural gas Default SO2 emission rate combined with measured fuel flow (Part 75 Appendix D)
SO2 (lbhr) gas or oil Fuel sampling and analysis combined with measured fuel flow (Part 75 Appendix D)
NOx (lbmmBtu) NOx (lbhr)
gas or oil peaking units
Estimate NOx rate by using site-specific emission correlations with measured fuel flow if measuring lbhr (Part 75 Appendix E)
SO2 CO2 NOx
(lbhr for all and lbmmBtu for NOx)
gas or oil Conservative default values for units with low mass emissions (sect 7519)
Heat Input (mmBtuhr)
gas or oil Measured fuel flow and GCV (Part 75 Appendix D)
Monitoring Certification Requirements
The implementing agency must certify an allowable monitoring method before it can be used for Part 75 monitoring The source must perform certification tests and submit the results to EPA and the appropriate State agency Part 75 performance certification testing is outlined in sect 7520 and Appendix A sect 6 Certification tests for a CEMS may include
7-day calibration error test for each monitor Linearity check for each pollutant concentration monitor Relative Accuracy Test Audit (RATA) for each monitoring system Bias test for each monitoring system Cycle time test for each pollutant concentration monitor Daily interference test for flow monitors DAHS testing
There are also certification requirements for non-CEMS methods These include accuracy tests for fuel flow monitors (sect 7520 and Appendix D sect 215) stack tests to develop NOx correlations for gas or oil peaking units (Appendix E sect 21) or unit-specific default values for low mass emissions units (sectsect 7519-7520)
Recertification may be required if the facility replaces modifies or changes a certified CEMS in a way that may significantly affect the ability of the system to accurately measure monitored parameters
Quality AssuranceQuality Control Procedures
The source is required to develop and implement a written quality assurancequality control (QAQC) plan for each monitoring system (sect 7521) The QAQC plan must include procedures for system operation as well as procedures for conducting quality assurance tests (QA tests) preventive maintenance and recordkeeping Appendices A and B to Part 75
Part 75 Field Audit Manual ndash July 16 2003 Page 5
----
Introduction Section 1
describe the technical procedures for how and when to conduct periodic QA tests which include
Daily calibration error tests Challenge a gas CEMS at a zero and high level with calibration gas
Daily interference tests for flow monitors Follow procedure to detect plugging or other problems that could interfere with a flow monitor
Quarterly linearity tests Challenge a gas CEMS at 3 levels with calibration gases Quarterly flow-to-load evaluations Compare flow monitor values to values from an
initial flow-to-load correlation as a means to check flow monitor data quality over time Semi-annual or annual RATAs Compare monitored values to values measured by an
approved EPA reference method Also use RATA results to detect and if necessary adjust for low bias
Recordkeeping and Reporting
Part 75 includes requirements for notifications recordkeeping and reporting in Subparts F and G As noted earlier most of the reporting to EPA is done electronically every quarter in a standard electronic format and much of the recording will be done automatically using the DAHS Some important records and reporting that you will want to review include
Monitoring plan Submitted electronically although some information is submitted only in hardcopy Contains information describing the unit CEMS other monitoring methodologies and specific calculation procedures
Hourly parameters including emissions flow heat input monitor availability and other information
Periodic QA test results Recertification tests Other records that are required to be kept on-site such as
Annual spanrange evaluationSO2 scrubber parameters to verify proper control operation during a missing dataperiod
Missing Data
Part 75 requires sources to account for emissions during periods when there are no valid data (missing data periods) due to the monitor not operating or operating out of control The missing data methodologies are necessary so that a source accounts for emissions during each hour of operation The missing data algorithms become increasingly conservative as monitor downtime increases so that sources have an incentive to maintain high data availability
12 What does the manual cover
This manual details recommended procedures for conducting a field audit of a Part 75 monitoring system Included are tools you can use to prepare for an audit techniques you can use to conduct the on-site inspection and review records proper methods for observing performance tests and guidelines for preparing a final report EPA has designed the audit procedures in this document so that personnel with varying levels of experience can use them
Page 6 Part 75 Field Audit Manual ndash July 16 2003
Section 1 Introduction
While the manual is written primarily for State and local agency inspectors industry personnel may find some of the material useful for their internal data quality management activities
The manual covers gas (SO2 NOx and diluent) and flow monitoring systems -- it does not cover opacity monitor audits Although Part 75 requires opacity monitors for coal-fired units subject to the Acid Rain Program opacity data and quality assurance tests are not reported to CAMD in quarterly emission data reports Moreover the source can comply with Part 75 by satisfying performance specifications in Part 60 that are generally applicable to opacity monitors and can follow a States recording and reporting requirements Thus there are no special Part 75 audit techniques for these systems
The manual is organized into eight major sections with one appendix
Section 1 introduces cap and trade programs Part 75 the role of field audits and the inspector CAMDs audit targeting role the importance of inspector training and a list of key Part 75 materials with Internet links
Section 2 provides a short introduction to the various types of CEMS and the major components of a CEMS including basic installation and operating principles
Section 3 describes preparing for an audit prior to the plant visit with emphasis on using CAMDs Monitoring Data Checking (MDC) software to review the electronic data
Section 4 covers the on-site CEMS inspection including what to look for and questions to ask during a walk through of CEMS components as well as how to review the QAQC plan and other in-plant records
Section 5 describes how to observe CEMS performance tests (linearity and relative accuracy test audits)
Section 6 outlines specific on-site review procedures for Appendix D and E monitoring systems and records
Section 7 guides you in conducting the exit interview and preparing a written audit report
Section 8 discusses issues that should be considered by a State or local agency in developing a performance testing program with an emphasis on single gas challenges and linearity tests
Appendix A to the Manual provides sample checklists for the field audit RATA and linearity observations The checklists are based on the discussions and techniques in Sections 3 through 6
Part 75 Field Audit Manual ndash July 16 2003 Page 7
Introduction Section 1
13 Part 75 Audit Program Overview
The Part 75 audit program consists of both electronic audits and field audits CAMD uses automated tools such as the Monitoring Data Checking (MDC) system to conduct automated checks of data submitted under Part 75 for potential problems Also it uses its data systems and its ability to check data through automated information systems to target units for follow-up data audits On-site field audits performed to ensure that monitoring systems are installed and operated properly are also essential in the Part 75 audit program
131 Part 75 Electronic Audit Program
CAMD performs routine electronic audits on each quarterly report submittal using the ETS and MDC software EPA may also perform targeted electronic checks to find other specific data reporting problems The electronic audits identify errors in the quarterly electronic data report the monitoring plan and the QA tests An automated ETS feedback report that focuses on the reported emissions data is sent to the source instantly upon electronic submittal by ETS EPA then uses MDC to analyze the monitoring plan and QA data and sends an MDC feedback report at the end of the quarterly submission period The reports categorize errors as critical and non-critical -- for critical errors the source must correct and resubmit the quarterly report
132 Audit Targeting
In addition to performing electronic audits EPA periodically compiles a recommended field audit target list based on a review of all of the quarterly electronic data reports This national list attempts to identify trends based on a large population of units that may not be identifiable from a smaller population at the State level alone The target list is intended to help States allocate their auditing resources on those units that are most likely to have data problems based on the findings of EPAs electronic auditing efforts States may use these recommendations to focus their audit efforts but may also choose other units for field audits through State targeting approaches or at random
133 Field Audits
EPA relies on State and local agencies to conduct field audits of monitoring systems to assess the systems performance and a sources compliance with monitoring requirements The audits also encourage good monitoring practices by raising plant awareness of monitoring requirements The field audit consists of a thorough evaluation of the CEMS via pre-audit record review on-site inspection of equipment and system peripherals record reviews test observations and interviews with the appropriate plant personnel
EPA has defined three levels (see Table 1-3) to describe field audit activities and procedures and the objective of the audit
Page 8 Part 75 Field Audit Manual ndash July 16 2003
Section 1 Introduction
Table 1-3 Levels of Field Audits
Audit Level
Records Review
On-site Inspection of CEMS
Daily Calibration Observation
Linearity or RATA
Observation
Performance Test Audit
Level 1
Level 2
Level 3
The Level 1 audit may be used to verify Part 75 recordkeeping requirements emissions data and monitoring plan information and is recommended as a follow-up to a previous audit This audit consists of an on-site inspection records review and daily calibration observation A Level 2 audit expands the audit to include a performance test observation The test observation is a critical element to ensure that CEMS are properly operating and performance test protocols are being conducted in accordance with the required standards For this reason EPA encourages agencies to perform Level 2 audits which are the focus of this manual
A Level 3 audit involves agency personnel conducting a performance test instead of merely observing the test Conducting a performance test such as a linearity test or relative accuracy test audit provides an independent assessment of the monitoring systems Because of the equipment and expertise involved EPA does not emphasize that State or local agencies perform Level 3 audits However some agencies strongly support Level 3 audit programs and Section 8 of this document provides guidance on various Part 75-related issues for those agencies that do conduct performance tests as part of their inspection program
14 Role of the Inspector
Your primary task as an inspector conducting a field audit is to document whether the monitoring at a facility is in compliance with the Part 75 requirements To carry out this task you will need to understand the Part 75 rule and have a general understanding of CEMS components and their function You will also need to ask questions carefully record your observations and compile the information necessary to determine compliance
Your role is not to provide technical advice or consulting on the operation of the monitoring equipment The source is responsible for operating the monitoring equipment and correcting any monitoring problems At the same time however the field audit is an opportunity to provide information to the source on Part 75 requirements You might for example clarify regulatory requirements and you should share with the source your observation of monitoring practices that may create regulatory problems
Part 75 Field Audit Manual ndash July 16 2003 Page 9
Introduction Section 1
Importance of Missing Data Under Part 75
Because Part 75 monitoring is used to account for total mass emissions when the monitor or monitoring system fails to record a valid hour of data Part 75 uses a conservative approach to substitute for missing data Audit findings may invalidate data and require use of substitute data so the findings could have a significant financial impact independent of any non-compliance issues
If your findings indicate that data from a monitor may be invalid which would require the source to use substitute data it is important to inform the source of the problem during the field audit Extensive missing data generally will penalize a source in allowance accounting and result in a significant monetary penalty for the source For the same reason it is important to notify CAMD quickly of the potential for invalidating data so that the issue is resolved prior to the end-of-year compliance process EPAs primary concern is to collect accurate CEM data to ensure the integrity and fairness of the trading program EPA has no interest in prolonging the length of time that a source is considered out-of-control Thus the goal of the audit should be to promptly identify
what needs to be corrected so that the source is once again reporting quality-assured verified emissions data This issue is discussed further in Section 72
141 Hands Off Approach
EPAs policy is to use a hands off approach when conducting the audit so that you do not have any physical contact with the CEMS hardware This approach avoids creating a situation in which monitoring equipment may be damaged or the inspectors actions may be questioned should the monitoring system fail to operate well during the audit You should ask authorized plant personnel to perform any actions with the CEMS equipment (for example initiating a daily calibration check or displaying analyzer range) Remember it is more important for you as the inspector to observe how the CEMS operator performs hisher duties as this will indicate whether the plant personnel are able to follow appropriate requirements and procedures and will help to identify any problems that occur Have the operator explain what heshe is doing and show you where the procedure is documented
Page 10 Part 75 Field Audit Manual ndash July 16 2003
Section 1 Introduction
142 Inspection Safety
Any type of air pollution source inspection has potential health and safety problems and inspection safety is a serious concern Appropriate safety training is imperative for all inspectors and each plant may have specialized training andor safety equipment policies Before going on site for an audit you must ensure that you have all necessary personal safety equipment Also make sure to contact the site and ask for details on plant safety requirements Once on site use the safety equipment properly adhere to your agencys safety requirements and follow plant safety requirements as well Some of the hazards you may encounter in performing CEMS audits include
Accessing CEMS equipment or platforms and working at elevations with fall hazards Electrical shock when inspecting heated lines pumps or internal areas of CEMS
cabinets and enclosures Hazards associated with use or transport of compressed gas cylinders Hazards associated with poisonous calibration gases (NO) Exposure to effluent gases Entry of confined spaces Typical hazards associated with working in an industrial environment (moving
equipment vehicles and machinery trip and fall hazards etc)
143 Recommended Training
Courses
The following table lists EPA classes that you may find helpful in developing a knowledge base for performing Part 75 CEMS field audits at stationary sources State agencies
Air Pollution Training Institute
Information on EPA courses and course schedules are available at EPAs AIR Pollution Training Institute website httpwwwepagovairoaqpseogaptihtml
regional organizations or university professional development programs may provide similar courses in your area
Part 75 Field Audit Manual ndash July 16 2003 Page 11
Introduction Section 1
Table 1-4Available EPA Training Courses
EPA Course Number
Course Title
APTI 445 Baseline Inspection Techniques
APTI 446 Inspection Safety Procedures
APTI 450 Source Sampling for Pollutants
APTI 474 Continuous Emission Monitoring
SI 476B Continuous Emission Monitoring Systems Operation and Maintenance of Gas Monitors
T008-02 Safety and the Agency Inspector
T468-02 Stack TestingStack Test Observation for Traditional and Hazardous Air Pollutants
15 Key Part 75 M aterials with Internet Links
The following is a list of key Part 75 reference materials with internet links to the webpage where the document can be found either on the EPA website or the Government Printing Office website To avoid a dead link the links in most cases are not to the document itself but to the web page where a link to the document may be found l need to survey the page to find the direct link
40 CFR Part 75 - On the CAMD website you will find an unofficial consolidated version of the Part 72 and Part 75 rules that contains the current text of Part 75 (and sectsect 721 - 723 the Acid Rain Program rule general provisions efinitions measurements abbreviations and acronyms) as amended by recent revisions may find this unofficial version a helpful tool because it has an easy-to-
Recent Part 75 Revisions
bull June 12 2002 (67 FR 40394) and
bull August 16 2002 (67 FR 53503)
You wil
purpose d
Youuse format httpwwwepagovairmarketsmonitoringconsolidatedindexhtml
While all reasonable steps have been taken to make this unofficial version accurate the Code of Federal Regulations (CFR) and Federal Register (FR) take precedence if there are any discrepancies Official versions of FR revisions are available on the EPA
Page 12 Part 75 Field Audit Manual ndash July 16 2003
Section 1 Introduction
website httpwwwepagovfedrgstr and the official CFR is available at the Government Printing Office website httpwwwaccessgpogovnaracfrcfrhtml_00Title_4040cfr75_00html
Electronic Data Report Version 22 Reporting Instructions - The instruction manual describes each data field element for the information that is recorded and reported to EPA for Part 75 and provides the field auditor with a helpful summary of Part 75 requirements The EDR v22 Instructions support the June 12 2002 revised Part 75 rule httpwwwepagovairmarketsmonitoring
Parts 75 and 76 Policy Manual - This manual contains a series of questions and answers that can be used on a nationwide basis to ensure that the Part 75 provisions are applied consistently for all sources affected by the rule It is intended to be a living document EPA will issue new questions and answers as they arise and will revise previously issued questions and answers as necessary to provide clarification EPA intends to release a revised verison of the manual in 2003 httpwwwepagovairmarketsmonitoringpolmanindexhtml
Recertification and Diagnostic Testing Policy - Recertification is required whenever a replacement modification or change in the certified continuous emissions monitoring system or continuous opacity monitoring system occurs that may significantly affect the systems ability to accurately measure or record the pollutant or parameter of interest EPA is preparing a document to clarify what types of changes to a monitoring system may be considered significant EPA expects that the document will describe various events as either recertification events or diagnostic testing events and describe the type of certification or diagnostic testing that needs to be performed You should check the wwwepagovairmarkets website for release of this policy
Monitoring Data Checking (MDC) Software - The MDC software discussed in Section 3 of this manual allows regulated industry and State agencies to enter analyze print and export electronic monitoring plan certification and quality assurance data and to evaluate hourly emissions data required by Part 75 The software also allows regulated sources to submit electronically monitoring plan and certification data to EPA via ftp The software provides a standard Windows-based mouse-driven point and click user interface and can be installed under Windows 95 (or higher) Windows NT or Windows 2000 The software and installation instructions can be downloaded from the CAMD website httpwwwepagovairmarketsmonitoringmdc
40 CFR Part 60 Appendix A Reference Methods - The RATA reference methods (and related information) are available from EPAs Emission Measurement Center website The website versions of the reference methods are the official CFR version httpwwwepagovttnemcpromgatehtml
Part 75 Field Audit Manual ndash July 16 2003 Page 13
Introduction Section 1
An Operators Guide to Eliminating Bias in CEM Systems - This EPA publication is designed for CEMS operators as a tool for diagnosing and correcting the causes of measurement bias in CEMS It is also a useful CEMS reference guide for the field auditor httpwwwepagovairmarketsmonitoring
Observers Checklists for Test Methods 2F 2G and 2H - These are detailed observer checklists that can be used when observing a flow RATA using one of these alternative flow reference methods httpwwwepagovairmarketsmonitoring
Page 14 Part 75 Field Audit Manual ndash July 16 2003
Section 2 Part 75 CEMS Overview
This section provides a brief introduction to the various types of components of continuous emission monitoring systems that facilities have installed to meet Part 75 requirements
21 Introduction
The monitoring requirements of Part 75 are performance-based requirements that generally do not require that a source use a particular type of CEMS There are several types of CEMS available The differences in how these systems are designed and operate (in terms of sample acquisition sample handling sample analysis and data recording) can be important in understanding what to look for in a field audit and how to interpret audit results
This section provides only an overview of the major concepts related to the types of CEMS and their principles of operation For further detail on these complex systems see Section 27 which provides a list of in-depth references EPA recommends that inspectors who will conduct Part 75 CEMS audits should attend EPAs Air Pollution Training Institute course on CEMS (APTI Course 474) The summary information in this section draws heavily from the manual for that course (Jahnke 1992) as well as from an EPA reference manual specifically tailored to Part 75 CEMS (Gschwandtner and Winkler 2001)
All CEMS perform the following basic functions
Locate or extract a representative sample
Analyze the sample and
Compile and record the results
CEMS are divided into two types based on the first of these basic functions An extractive system removes and transports the sample from the stack to the analyzer often conditioning the sample prior to the analyzer An in-situ system analyzes the sample directly in the stack Illustration 2-1 identifies these two main system types There are several variations on these types which Sections 23 through 25 review
Part 75 Field Audit Manual ndash July 16 2003 Page 15
Part 75 CEMS Overview Section 2
Illustration 2-1Basic CEMS Types (Jahnke and Peeler 1997)
Illustration 2-2 shows a set of typical Part 75 CEMS at a Part 75 unit The flow and opacity CEMS are examples of in-situ systems The opacity monitor measurement is taken over a path across the stack Most continuous opacity monitors are double pass (light is transmitted across the stack and back to the detector) to meet EPA quality assurance requirements The ultrasonic flow monitor in this example also provide an integrated measurement along a path across the stack Flow and opacity CEMS are always in-situ systems The gas CEMS (SO2 NOx CO2) in Illustration 2-2 are dilution extractive systems In this illustration the gas is extracted at a single point (the sampling probe) and diluted with clean dry air The diluted sample is transported through the sampling line and analyzed on a wet basis
Page 16 Part 75 Field Audit Manual ndash July 16 2003
Section 2 Part 75 CEMS Overview
Illustration 2-2Example of Continuous Emission Monitoring Systems at a Part 75 Unit
In-situ gas CEMS (not shown in Illustration 2-2) are also used by Part 75 sources sometimes in conjunction with extractive gas CEMS The use of in-situ gas CEMS for Part 75 compliance is far less common than the use of extractive systems -- in 2002 only about three percent of the gas monitors used to meet Part 75 requirements were in-situ monitors In-situ gas CEMS can measure at a point (or short path) like an extractive gas CEMS or along a path across the stack similar to an opacity monitor
The following sections begin with a discussion of Part 75 requirements for the sample measurement location and then briefly describe the three basic types of systems under Part 75 (gas extractive CEMS gas in-situ CEMS and Flow CEMS) The final CEMS component --the data acquisition and handling system (DAHS) used for electronic data and reporting -- is a critical element for Part 75 compliance and is discussed separately in Section 26 Finally Section 27 provides references that you can use to gain an in-depth understanding of how these systems operate and what their limitations are
22 Sampling Location
Whether the system is extractive or in-situ the flue gas must be monitored at a location where the pollutant concentration and emission rate measurements are directly representative of the total emissions from the affected unit Flowing gases are generally well mixed but in some cases gas stratification can be a concern for the gas measurement location Stack flow on the other hand is always stratified to some degree (lower velocities along the stack walls) Cyclonic or swirling flow (flow that is not parallel to the stack center line) also will have a negative impact on flow monitors and manual reference test methods Thus the selection of sampling points and paths is an important concern for flow monitors To obtain a
Part 75 Field Audit Manual ndash July 16 2003 Page 17
Part 75 CEMS Overview Section 2
representative measurement and avoid problems due to stratification and cyclonic flow Part 75 provides specific requirements for the CEMS sampling location in Appendix A sect 1
221 Gas Measurement Location
Part 75 requires that the representative sampling location be chosen based on the procedures in 40 CFR Part 60 Appendix B Performance Specification 2 which suggests a measurement location (1) at least two equivalent diameters downstream from the nearest control device the point of pollutant generation or at another point at which a change in pollutant concentration or rate may occur and (2) at least a half equivalent diameter upstream from the effluent exhaust or control device Other Part 75 location requirements from Appendix A are summarized below
Locate the measurement location so that the gas CEMS (pollutant and diluent monitor) passes the certification RATA (Note - while not required specifically the diluent O2 or CO2 monitor should sample at the same point as the pollutant monitor)
Point Monitors - Locate the measurement point (1) within the centroidal area of the stack or duct cross section or (2) no less than 10 meter from the stack or duct wall
Path Monitors - Locate the measurement path (1) totally within the inner area bounded by a line 10 meter from the stack or duct wall or (2) such that at least 700 percent of the path is within the inner 500 percent of the stack or duct cross-sectional area or (3) such that the path is centrally located within any part of the centroidal area
222 Flow Measurement Location
Part 75 establishes the following basic location criteria for flow monitors
The location satisfies the minimum siting criteria of Part 60 Appendix A Method 1 (ie the location is greater than or equal to eight stack or duct diameters downstream and two diameters upstream from a flow disturbance or if necessary two stack or duct diameters downstream and one-half stack or duct diameter upstream from a flow disturbance) or
The results of a flow profile study if performed are acceptable (ie there are no cyclonic (or swirling) or unacceptable stratified flow conditions) Part 75 recommends that if a flow profile study indicates unacceptable results the facility should relocate the monitor or add straightening vanes or other source modifications to correct the flow patterns
Regardless of whether these criteria are met a flow monitor can be installed in any location if the flow CEMS can meet the Part 75 performance specification requirements
223 Sampling in Stratified and Swirling Flow Conditions
Stack flow is seldom ideal and some degree of stratification and swirling flow will be present at the monitoring location Approaches to dealing with stratification swirling or cyclonic flow and changing flow profiles due to load changes are discussed below
Page 18 Part 75 Field Audit Manual ndash July 16 2003
Section 2 Part 75 CEMS Overview
Stratified Flow - Flow monitoring systems may locate a single point or path representative of the reference method determined stack flow if the stratification is fairly constant over varying loads If stratification varies with load an array of sampling points can be placed across the stack to obtain a flow average instead of one single sample point For a path monitoring system that is already averaging over a line across the stack the source can select a path that is not as sensitive to the variation or can add a monitor to provide multiple paths on the cross section
Correction Factors - Part 75 allows the source to calibrate the flow monitor to the reference method flow (pre-RATA) Sources commonly use this approach to enable a flow CEMS to pass the multi-load flow RATA at a particular measurement location A flow RATA typically is performed at three loads to account for different flow profiles at changing loads The options described above for stratified flow can include application of a correction factor for stratification based on the reference method RATA values If the source conducts a test using new Methods 2F 2G or 2H (developed to account for non-parallel flow conditions and wall effects on flow measurement) calibrating to the reference method also can account for effects due to swirling Method 2 using the s-type pitot tube will be subject to bias if swirling or stratification due to wall effects or other factors are present Calibration of flow monitors relative to Method 2 under such conditions will not account for those effects
23 Extractive Gas CEMS
There are two types of extractive gas CEMS
The source level or direct extractive system extracts gas from the stack and conveys the sample to one or more analyzers These extractive systems will include filters to remove particulates and may include conditioning to remove moisture acids condensible particulates and interfering compounds In the case of a hot wet system the sample lines and analytic components of the systems are heated to prevent condensation of the stack moisture Heated lines are also required for dry systems up to the point where conditioning occurs
A dilution extractive system filters the stack sample and dilutes the stack sample with clean dry air Dilution occurs either inside the sample probe in the stack or outside of the stack usually at the stack port Dilution systems sample the gas at flow rates much smaller than those used in source level systems Using dry air to dilute the flue gas at ratios of 501 to 3001 the dew point of the diluted sample is reduced to levels where condensation will not occur in the monitoring system As a result moisture removal systems and heated sample lines may not be incorporated into the system A dilution air cleaning system however is required to clean the dilution air and remove CO2 water and any traces of the gases that are to be monitored
231 Source Level or Direct Extractive Systems
A diagram of a source level extractive system is shown in Illustration 2-3 The illustration shows both wet (heated sampling line by-passing the conditioning system) and dry systems
Part 75 Field Audit Manual ndash July 16 2003 Page 19
Part 75 CEMS Overview Section 2
2311 Sample Probe
Probes for source level extractive systems are constructed with stainless steel or Hastelloyreg tubes A coarse filter is commonly attached at the end of the probe to filter out particulate matter before it can enter into the tube Some designs place a deflector plate or cylindrical sheath around the filter to provide protection from plugging A coarse filter can also be in-line in a housing outside of the stack prior to the sample line Sometimes a combination of filters a coarse filter at the probe opening and an in-line fine filter outside of the stack are used to ensure the removal of particulate matter
Blowback or back purging is frequently used to keep the coarse filter from plugging This involves blowing pressurized air or steam back through the filter in an opposite direction to the normal stack flow The blowback occurs at regular intervals (typically from 15 minutes to 8 hours) and typically lasts for 5 to 10 seconds
Page 20 Part 75 Field Audit Manual ndash July 16 2003
Section 2 Part 75 CEMS Overview
Illustration 2-3 Typical Source Level Extractive CEMS
(Gschwandtner and Winkler 2001)
Part 75 Field Audit Manual ndash July 16 2003 Page 21
Part 75 CEMS Overview Section 2
2312 Sample Transport and Conditioning Systems
Most source level extractive systems used in Part 75 applications are dry systems which remove moisture prior to the sample pump and analyzer In a dry system the sample line from the probe to the moisture removal system is heated to prevent water condensation If the facility uses a wet system that does not remove moisture prior to the analyzer the entire length of the sample line sample pump and analyzer must be heated The sample line is usually wrapped in a tube bundle or umbilical which includes the sample lines blowback lines calibration gas lines heating elements and electric lines
Dry source level CEMS used in conjunction with a flow CEMS for Part 75 SO2 NOx
and CO2 mass measurements must also determine the moisture content of the stack gas Illustration 2-3 shows a heated wet sample line connected to a wet O2 analyzer This wet system is used in conjunction with the dry systems dry O2 analyzer to determine moisture Another alternative is to use an in-situ wet O2 analyzer with the dry extractive O2 analyzer A less common approach is to use an H2O analyzer to measure the wet sample
Moisture Removal Systems
There are two common types of moisture removal systems condensers and permeation dryers Condensers cool the gas below the dew point (using refrigerated coils or cooled jet stream condensers) and then remove the condensed liquid water from the gas stream Water removal is performed automatically to prevent filling the condensate trap and flooding the sampling line Absorption of SO2 and NO2 in the condensate is a concern so systems are designed to minimize contact time between the dried gas and liquid
Permeation dryers are constructed using Nafionreg a material that selectively allows the mass transfer of water vapor from the sample gas through the tube membrane to dry purge gas flowing in an outer tube in the opposite direction The gas entering the permeation dryer must be heated above the dew point temperature Permeation dryers avoid the problems of condensate absorption of pollutants and do not have condensate traps However the dryers can be subject to plugging problems from condensing liquids particulates or precipitates
Pumps
Diaphragm pumps and ejector pumps are the most common pumps used in extractive systems Both operate without pump lubricating oils which can cause sample contamination Both diaphragm pumps and ejector pumps can be heated and used in a hot wet system or used ahead of a conditioning system
Fine filter
Many analyzers require removal of particulate larger than 05 m so systems will usually have an additional fine filter near the analyzer inlet There are two types (1) a surface filter usually paper or other porous material which builds up a filter cake and (2) a depth filter which consists of packed fibers of quartz wool or other material
Page 22 Part 75 Field Audit Manual ndash July 16 2003
Section 2 Part 75 CEMS Overview
232 Dilution Extractive Systems
Most coal-fired units subject to Part 75 use dilution extractive systems As noted earlier dilution ratios range from 501 to 3001 A diagram of a dilution extractive CEMS is provided below showing an in-stack dilution probe unheated sample lines and pumps air cleaning subsystem calibration gases analyzers and DAHS
Illustration 2-4
Dilution Ratio = Q1 + Q2
Q2
where
Q1 = dilution air flow rate (Lmin) Q2 = sample flow rate (Lmin)
Dilution Extractive CEMS (Gschwandtner and Winkler 2001)
Part 75 Field Audit Manual ndash July 16 2003 Page 23
Part 75 CEMS Overview Section 2
The dilution of the sample can occur in the stack using a dilution probe or outside the stack using an out-of-stack dilution system Both approaches use the same operating principles A critical orifice controls the sample gas flow rate which is drawn through the orifice by creating a vacuum at the outlet of the orifice with an ejector pump As long as a sufficient vacuum is present the sample gas flow rate through the critical orifice is independent of the downstream pressure The ejector pump also called an aspirator or an eductor pump is operated by the compressed dry clean dilution air The dilution air flow through the venturi nozzle of the pump (flow rates of 1 to 10 Lmin) creates the vacuum pressure at the orifice outlet This vacuum pulls the gas sample through the orifice at rates of 50 to 500 mLmin (limited by the orifice design) and into the ejector pump where it mixes with the dilution air
2321 Dilution Probe
The in-stack dilution probe combines a sonic orifice (a glass tube drawn to a point) with an ejector pump inside the stack probe (See Illustration 2-5) The probe opening inside the stack is screened and uses a quartz wool filter to prevent particulate matter from entering the orifice Plugging has been a problem in applications with wet saturated conditions (after a wet scrubber) due to condensation that causes wetting of the filter and plugging of the orifice In some cases heated dilution probes have been successfully used where entrained water droplets are present
Illustration 2-5In-Stack Dilution Probe (adapted from Jahnke 2000)
Page 24 Part 75 Field Audit Manual ndash July 16 2003
Section 2 Part 75 CEMS Overview
Gas Density Affects
The sonic flow of stack gas through the orifice is affected by the stack gas density and viscosity which in turn are dependent on molecular weight stack pressure and temperature A change in any of these factors will affect the sonic flow and dilution ratio The primary means for addressing theses issues include
Molecular Weight Effect - Gas density changes that result from changing molecular weight are mainly due to changes in-stack moisture or CO2 concentrations These parameters do not vary much in base load units but both can be monitored and often are as part of the Part 75 CEMS With these measurements empirical corrections can be made to the dilution ratio
The molecular weight effect is also a concern in choosing calibration gases Gases used in the initial and subsequent QA tests should have a consistent molecular weight otherwise a bias can be introduced due to the molecular weight differences
Stack Pressure - Stack pressure (absolute stack pressure which includes ambient pressure and stack static pressure) can vary due to changing load or ambient conditions Stack pressure can be monitored separately with the DAHS applying pressure related correction algorithms to the CEMS data
Temperature - Temperature also can vary with load and can be monitored separately with the DAHS correcting the data as described above Temperature correction factors have been more difficult to develop however and have not worked well in situations with temperature changes greater than 50oF (Note - Calibration checks performed when the source is not operating may not provide valid results due to the temperature effect) In response some vendors heat the dilution probe -- the heated probe is the same as shown in Illustration 2-5 except electric heating coils are placed around the probe and controlled to maintain a constant temperature Another approach for stabilizing the temperature is to use an out-of-stack dilution system described in the next section
2322 Out-of-Stack Dilution System
The out-of-stack dilution system dilutes the sample outside of the stack where it is easier to maintain a constant temperature As noted earlier dilution in out-of-stack dilution systems is performed in the same manner as with in-stack dilution probes this time with a critical orifice and ejector pump Illustration 2-6 diagrams one manufacturers out-of-stack dilution system The probe in this type of system is a simple tube similar to that used in a source level system Note that these systems are also affected by the changes in gas density described above and the use of stack moisture or CO2 corrections may be necessary
Part 75 Field Audit Manual ndash July 16 2003 Page 25
Part 75 CEMS Overview Section 2
Illustration 2-6One Type of Out-of-Stack Dilution System
(Gschwandtner and Winkler 2001)
2323 Sample Transport and Dilution Air Cleaning Systems
Sample Lines
The sample line for a dilution system as in the source extractive system is often wrapped in a tube bundle or umbilical which includes the sample lines blowback lines calibration gas lines heating elements and electric lines The sampling line often does not need to be heated after the dilution air has been added but heated freeze protect lines are used in regions of the country where sub-zero temperatures may occur or if the dilution ratio is low
Dilution Air Cleaning System
The dilution air cleaning subsystem delivers dry clean pollutant-free air to the dilution probe It consists of a series of particulate and charcoal filters dryers and scrubbers which reduce CO2 NOx SO2 moisture organic compounds and other compounds in ambient air to sub-ppm levels
The dilution air is compressed air provided by the plants utilities commonly referred to as plant air or from a compressor dedicated to the CEMS In either case the compressed air enters an air cleaning subsystem where it is further cleaned and regulated If the filters and
Page 26 Part 75 Field Audit Manual ndash July 16 2003
Section 2 Part 75 CEMS Overview
scrubbers are changed regularly and there are no leaks in the subsystem the dilution air will be dry clean and free of contaminants including CO2
The flow of pressurized dilution air through the ejector pump moves the sample to the analyzers so a separate pump is not required The dilution air pressure should be held relatively constant because changes in the pressure will affect the dilution ratio Some systems include mass flow controllers to maintain the dilution flow rate at a constant level
233 Calibration Gas System
Part 75 quality assurance requirements include daily calibration error tests and linearity tests (usually quarterly) which challenge the extractive gas CEMS with calibration gases of known concentrations The calibration gases used in the tests include a zero level gas as well as low mid and high concentration levels based on the span of the monitor The calibration gas system consists of calibration gases gas regulators valves and line filters The gases must meet the criteria specified in Part 75 Appendix A sect 51
Calibration gases for the daily calibration error test and linearity tests are injected as close as possible to the probe (Part 75 App A sect 221) The calibration gas system must include controls to ensure that calibration gases are injected at the same flow rate pressure and temperature as the sample gas under normal system operation
There are two common injection locations for source level extractive systems (1) the calibration gas is injected into the in-stack probe external filter housing and is drawn into the sampling system or (2) the calibration gas may be injected into an internal filter housing between the probe and sample line at the stack flange In dilution extractive systems the calibration gas must be injected into the dilution probe housing with the calibration gas drawn through the sonic orifice In an out-of-stack dilution system the calibration is injected prior to the inlet of the critical orifice
Calibration gases are also sometimes injected at the analyzers when performing certain diagnostic tests or calibration adjustments
234 Analyzers
Gas analysis methods for extractive systems can be divided into four major categories Those categories with common Part 75 applications are shown in Table 2-1 and are briefly described below More detailed discussion of analyzer operating principles are available in the references listed in Section 27 The CEMS designer will choose the analytical method based on the overall system design (eg dilution extractive versus source-level extractive wet versus dry systems) In source level extractive systems the gas analyzers measure at stack concentrations in the ppm range while in the dilution extractive system gas analyzers read in the ppm or ppb range similar to those of ambient monitors
Part 75 Field Audit Manual ndash July 16 2003 Page 27
Part 75 CEMS Overview Section 2
Table 2-1Common Extractive Gas CEM Analytical Methods
Techniques Gas Measured
Absorption Spectroscopic Methods
Non-Dispersive Infrared (NDIR) SO2 NO CO2 H2O
Gas Filter Cell Correlation (GFCIR) SO2 NO CO2 H2O
Differential Absorption (UV) or (IR) SO2 NO CO2
Luminescence Spectroscopic Methods
Chemiluminescence NO NOx
Fluorescence SO2
Electro-Analytical Methods
Electrocatalysis O2
Paramagnetic Techniques
Magnetodynamic O2
Thermomagnetic O2
2341 Absorption Spectroscopy
Absorption spectroscopic methods measure the amount of light absorbed by a pollutant molecule The analyzer has four main components (1) radiation source to produce the light in the desired range of the spectrum (2) spectral limiters which further reduce the band width of the light to specific wave lengths (3) detectors which measure the light energy (4) optical components which direct and focus the light and (5) components to correct for interfering gases and drift (eg a reference gas cell)
Non-Dispersive Infrared (NDIR)
Non-Dispersive Infrared (NDIR) monitors are commonly used to measure CO2 in dilution extractive systems The analyzer measures the degree of absorption of infrared light by molecules in the sample gas compared to a reference cell containing gas that does not absorb infrared light in the wavelengths used by the instrument The ratio of the detector signals from the two cells is used to determine the light transmittance which is related to the CO2
concentration using calibration curves developed with known gas quantities The monitors are called non-dispersive because filters are used to narrow (not disperse) the infrared wavelength to a small range centered on the absorption peak of the molecule of interest
Gas Filter Cell Correlation (GFCIR)
Gas Filter Cell Infrared analyzers use a variation of the NDIR technique by using a reference cell that contains 100 percent concentration of the pollutant measured instead of 0 percent The reference cell will remove most of the light at the infrared wavelength absorbed
Page 28 Part 75 Field Audit Manual ndash July 16 2003
Section 2 Part 75 CEMS Overview
by the compound of interest This method is more commonly used in in-situ applications but is used in extractive systems
Differential Absorption
Differential Absorption analyzers perform measurements at two different light frequencies One frequency is absorbed by the target molecule while the other reference frequency is not The ratio of the absorption at the two wavelengths is correlated to the target gas concentration Again calibration curves are created using known gas concentrations Part 75 sources use UV non-dispersive photometers for SO2 and NOx measurements These types of instruments can be used in wet extractive systems as water vapor does not absorb light very well in the UV region There are also differential absorption analyzers that use light in the infrared region particularly for CO2 in wet source-level extractive systems
A single differential absorption analyzer may also measure a number of component gases by using multiple wavelengths of light
2342 Luminescence Spectroscopy
Luminescence spectroscopic methods measure the amount of light emitted by an excited molecule Analyzers using these methods are very specific for a given molecule and are more sensitive than absorption spectroscopy or electrochemical methods As in the absorption spectroscopic methods all of the instruments use calibration curves developed from known target gas compositions to relate the measured light energy to gas concentration
Chemiluminescence
Chemiluminescence monitors are commonly used for NOx in dilution extractive systems Chemiluminescence is the emission of light produced as a result of a chemical reaction and a chemiluminescence NO - NOx monitor measures the amount of light generated by the reaction of NO with O3 This monitor uses an ozone generator to produce O3 and a catalytic converter to reduce NO2 in the sample gas to NO before reacting with O3 The monitor can measure both NO or NOx by sequencing the NO-O3 reactions First the sample gas can bypass the converter and go directly to the reaction cell measuring the NO Then after this reaction the gas goes to the converter where the NO2 is reduced to NO and sent back to the reaction chamber to measure NOx (NO and NO2) NO2 can be determined by subtracting the NO measured by the first measurement from the total NOx (NO and NO2) measured in the second step
Fluorescence
Fluorescence analyzers are used to measure SO2 in both dilution and source-level extractive systems Fluorescence occurs when a molecule absorbs light at one wavelength as a result of the absorbed energy the molecule emits light at a different wavelength The analyzer uses light (either from a continuous or pulsed infrared light source) to irradiate the gas sample The light radiated back from the sample is measured by the sensor after filtering to select a narrow bandwidth of the fluorescent radiation
Interference from quenching is a concern for both chemiluminescence and fluorescence analyzers Quenching occurs when the excited molecules collide with other molecules losing energy as a result of the collision This changes the energy state from the level caused by the
Part 75 Field Audit Manual ndash July 16 2003 Page 29
Part 75 CEMS Overview Section 2
analyzer chemical reaction or irradiation For example in a fluorescence analyzer the excited SO2 molecule in the gas sample might collide with another molecule changing its energy state from what it would have been due to the analyzer irradiation This can be a problem if the stack gas composition changes as different molecules have different quenching affects It is also a problem if the calibration gas background concentrations change (single blend - multiblend calibration gases)
Quenching effects can be limited by using dilution extractive systems which will result in a constant background composition (the dilution air) Fluorescence analyzers can also use ultraviolet light at lower wavelengths to shorten the fluorescence time to reduce quenching probabilities Chemiluminescence systems can increase the O3 flow into the reaction chamber to provide a more constant background concentration
2343 Electro-Analytical Methods
The zirconium oxide (ZrO2) analyzer an electrocatalytic analyzer is the most common O2 analyzer used by Part 75 sources The analyzer can measure O2 on both a dry and wet basis and it is used with source level extractive systems and as an in-situ monitor
This analyzer uses a heated ceramic material (ZrO2) with a thin platinum catalytic coating as a solid electrolyte which allows the transfer of oxygen from the reference side of the cell (maintained at 21 percent O2) to the sample side (continual flow of stack gas with lower O2
concentrations eg 3 - 6 percent) The sample O2 concentration can be determined by measuring the electromotive force of the O2 transfer combined with a stable cell temperature and reference cell partial O2 pressure
The ZrO2 electolyte is heated to 850 oC At that temperature O-2 ions catalyzed by the platinum can move through the material Combustibles materials in the stack gas sample (CO hydrocarbons) can burn at the operating temperatures of the analyzer consuming sample gas O2 The combustible concentrations however are in much lower concentrations (ppm) than the O2 and have a negligible impact on O2 measured on a percentage basis
2344 Paramagnetic Techniques
Paramagnetic techniques are also used by Part 75 sources to measure O2 Analyzers using these techniques are only used in conjunction with source level extractive systems and water and particulate matter must be removed prior to the monitor
Molecules that are attracted by a magnetic field are described as paramagnetic while those repelled are called diamagnetic Most materials are diamagnetic but O2 is paramagnetic and strongly attracted to magnetic fields compared to most other gases (though NO and NO2
are also paramagnetic and may cause interference if present at high concentrations)
Magnetodynamic
A magnetodynamic analyzer makes use of the effect that O2 has on modifying a magnets magnetic field In a dumbbell type of magnetodynamic analyzer a torsion balance dumbbell with diamagnetic glass spheres is suspended in a nonuniform magnetic field The dumbbell spheres are pushed away from the strongest part of the magnetic field Oxygen alters the field causing a change in the dumbbell position A light source mirror on the dumbbell and
Page 30 Part 75 Field Audit Manual ndash July 16 2003
Section 2 Part 75 CEMS Overview
detector measure the dumbbell position Current through a wire encircling the dumbbell creates an electromagnetic counter-torque which restores the mirror to the position when O2 is not present The amount of current required to restore the dumbbell position is related to the amount of O2 present
Thermomagnetic
Thermomagnetic analyzers are often called magnetic wind analyzers and are based on the decrease in the paramagnetic attraction of O2 with increased temperature The O2 in the sample gas is drawn into a tube with a heated coil filament and magnetic field at one end The O2 enters the tube attracted by the magnetic field As the molecules are heated the paramagnetic attraction is decreased and the heated molecules are pushed out by cooler molecules with stronger paramagnetic attraction The O2 flow through the tube creates the so called wind and cools the heating coil reducing its resistance The change in resistance is measured and related to O2 concentration The monitor can be affected by changes in the gas composition which affect thermal conductivity and the filament temperature Combustible materials can also react on the heated filament changing the resistance
24 In-Situ Gas Monitors
In-situ gas monitors are far less common at Part 75 sources In-situ monitors were initially designed for high concentration combustion gas applications not for the lower pollutant gas concentrations following pollution control devices Some in-situ analyzers also had difficulty meeting EPA certification and quality assurance requirements However in-situ monitors do have some advantages over extractive systems The monitoring system measures concentrations at stack conditions and eliminates the need for the sample transport and conditioning systems required by extractive CEMS Newer designs offer a wider range of analyzer options and virtually all point and some path systems can now be calibrated with calibration gases as required by Part 75
In-situ monitors are classified as either path or point monitoring systems (See Illustration 2-6) The in-situ point CEMS measures gas concentrations at a single point in the stack much like the single probe in a gas extractive system The term point is used when the sampling is over a short path but still much less than the stack cross-section The in-situ path CEMS measures gas concentrations over an optical path equivalent to the internal stack diameter by transmitting a light through the flue gas (single pass) and sometimes back (double pass)
Part 75 Field Audit Manual ndash July 16 2003 Page 31
Part 75 CEMS Overview Section 2
Illustration 2-7In-Situ Gas CEMS (Jahnke 1992)
241 Path In-Situ CEMS
Path in-situ CEMS use spectroscopic analytical methods to measure pollutant concentrations in the flue gas The systems have the same principle components as an absorption spectroscopic analyzer described in Section 2341 (1) radiation source to produce the light in the desired range of the spectrum (2) spectral limiters which further reduce the band width of the light to specific wave lengths (3) detectors which measure the light energy and (4) optical components which direct and focus the light In addition blowers are required to keep the optics clean of stack particulate
In a single pass system a light transmitter and detector are located on opposite ends of the light path and the light makes one pass along the measurement path A double pass system has the transmitter and light source on one end of the sample path and a retroreflector at the opposite end to reflect the light back to the detector The light makes two passes along the measurement path
242 Point In-Situ CEMS
The in-situ point CEMS typically consists of a measurement probe which contains a cavity in which the sample gas can be measured either by a sensor or by light absorption The probe opening is protected by some sort of particulate filter (ceramic sintered stainless steel or Hastelloyreg filter) The sample concentrations within the cavity adjust to changing effluent concentration via diffusion through the filter
243 In-Situ Gas Analyzers
In-situ monitors use spectroscopic and electro-analytical techniques similar to extractive systems described earlier in Section 234 In extractive system spectroscopic analyzers the light interacts with the sample within the analyzer instrument For in-situ spectroscopic analyzers the light interacts with the sample in the sample probe (point in-situ) or across the
Page 32 Part 75 Field Audit Manual ndash July 16 2003
Section 2 Part 75 CEMS Overview
stack diameter (path) Analytical methods used by in-situ gas monitors at Part 75 sources are shown below in Table 2-2
Table 2-2In-Situ Gas Analyzer Methods
Techniques Gas Measured
Absorption Spectroscopic Methods
Differential Absorption (UV) SO2 NO
Gas Filter Cell Correlation (GFCIR) CO2
Second Derivative Spectroscopy (UV) SO2 NO
Electro-Analytical Methods
Electrocatalysis O2
244 System Calibration
Daily calibration error tests and linearity tests can be performed on point in-situ gas CEMS in a manner similar to extractive gas CEMS by flooding the probe with the calibration gases QA tests for path systems are more difficult Path systems can use a flow through calibration cell that is placed in the measurement path for linearity and calibration error tests The tests must use EPA Protocol gases and the calibration cell must be located so as to challenge the entire measurement system
The system consists of a calibration cell which is a flow-through gas cell for the zero and other calibration gases and a zero mirror to reflect the light back to the detector without traveling through the stack The calibration cell should be at the same temperature and pressure as stack conditions If the flow-through cell has a length shorter than that of the sample path calibration gas at high concentrations (percent levels) may be necessary For CO2 the only way to perform the daily calibration and linearity tests is to have a flow-through cell with the same path length as the sample path
A single path system can not use a zero mirror One approach for single pass systems is to use a zero pipe combined with the flow through calibration cell The zero pipe provides an optical path not affected by the stack gas
25 Flow CEMS
There are three types of flow CEMS in use today at Part 75 sources
Differential pressure flow monitors Thermal mass flow monitors and Ultrasonic flow monitors
Part 75 Field Audit Manual ndash July 16 2003 Page 33
Part 75 CEMS Overview Section 2
All of the flow monitors are in-situ monitors determining flow on a wet basis based on dynamic measurements of parameters that can be related to the stack velocity at a point or along a path within the stack
251 Sampling Location
As noted earlier in Section 22 the measurement location must provide a representative volumetric flow over all operating conditions Stratified flow profiles cyclonic flow and flow profiles that change with load all can impact the choice of measurement location Multiple measurement points or paths and the use of correction factors to calibrate the flow CEMS to the reference method (pre-RATA) may be required to meet the location requirements in Appendix A sect 12
252 Differential Pressure
Flow Monitors
Factors Affecting Flow Data Accuracy
Representative sampling points Sensormonitor accuracy and stability
(performance specifications in Appendix A sect 33)
Accuracy of secondary parameter values (gas temperature measurement path length)
Accurate duct dimensions (area calculation)
Proper calibration
Differential pressure monitors sense the difference between the impact and wake pressures at tube openings (pitot tubes or multi-point tubes) in the gas flow and a differential pressure transducer converts the pressure signals into electric current ifferential pressure is the difference between the impact and wake pressures e differential pressure is combined with stack gas temperature stack pressure and molecular weight to determine velocity using the pitot equation below olumetric flow is calculated by multiplying velocity by the stack or duct cross sectional area
where vs = stack gas velocity Kp = dimensionless constant Cp = pitot tube coefficient p = velocity pressure Ts(abs) = absolute temperature of the stack gas Ps = absolute pressure of the stack gas Ms = molecular weight of the stack gas
Usually the molecular weight of the flue gas and stack pressure are assumed to be constants and are not measured Temperature measurements are made either with a thermocouple or resistence temperature device (RTD) The temperature probe should also be placed in a location representative of the stack flow profile
The dTh
V
Page 34 Part 75 Field Audit Manual ndash July 16 2003
Section 2 Part 75 CEMS Overview
The flow CEMS differential pressure probe may measure at one point in the stack or at multiple points using a multi-point averaging probe or multiple pitot tube assembly (See Illustration 2-7)
Differential pressure monitors are sensitive to non-parallel or swirling flow If the flow is at an angle to the stack center line there will be a bias in the velocity measurement The bias is usually positive
Illustration 2-8 Example of Multiple Probe Locations (Jahnke 1994)
Quality Assurance Issues
Probe and line plugging is minimized by intermittently back purging the line and probe openings with clean air Back purging is required as a daily interference check (Part 75 Appendix A sect 2222) and prevents extreme plugging in most situations Daily calibration error tests are performed after the probe and test the pressure transducer and system electronics The pressure side of the probe or transducer is pressurized to a pre-set level to check the span and then both inputs are equalized to test the zero level Because probes are subject to corrosion and abrasion they should be visually inspected periodically in addition to these tests Part 75 requires a quarterly leak check of all sample lines for a differential pressure flow monitor
253 Thermal Mass Flow Monitors
Thermal mass flow monitors are based on the principle of thermal heat transfer due to convection Gas flowing across a heated surface tends to cool the surface The molecules of the flowing gas interact with the heated boundary layer surrounding the surface and remove heat The greater the flow rate the more heat is removed There are two types of sensors used by thermal flow monitors the constant power anemometer and the constant temperature anemometer
Both types of anemometers use two RTDs one heated and the other unheated The RTDs are usually protected by a stainless steel tube and mounted together in the stack The constant power anemometer measures the temperature difference between the RTDs at a constant current The temperature difference responds proportionally to changes in velocity The temperature difference will be high at low velocities (less cooling of the heated RTD) and
Part 75 Field Audit Manual ndash July 16 2003 Page 35
Part 75 CEMS Overview Section 2
low at high velocities (more cooling of the heated RTD) The constant temperature anemometer maintains a constant temperature difference between the RTDs by varying the current The change in current is proportional to the change in gas velocity The higher the velocity the higher the current required to maintain the heated RTD temperature conversely at lower velocities a lower current is required
The sensors can be placed at a single point if the flow profile or in a multiple point array depending on flow conditions
Illustration 2-9Thermal Mass Flow Monitor Probe (adapted from Jahnke 1992)
(Th = Temperature of Heated RTD Ta = Temperature of Unheated RTD)
The output from a thermal flow monitor (an empirical function dependent on the measured temperature difference gas composition and power to the anemometers) is proportional to mass flow Information on the flue gas density is required to convert mass flow to volumetric flow The gas density is dependent on fuel gas composition so changes in moisture or CO2 can affect the systems response
f(heat loss) f(Tv - Ts) = vsAs
where vs
f(Tv - Ts) Tv
Ts
As
= stack gas velocity= heat loss function= temperature of velocity sensor= stack temperature= gas density= stack cross sectional area
Thermal flow monitors can not be used in locations where there are entrained water droplets The water droplets evaporate on the sensor causing a dramatic temperature loss due to the heat of evaporation which would be interpreted as caused by the flowing gas Corrosion and particulate build up on the sensors can be a problem
Page 36 Part 75 Field Audit Manual ndash July 16 2003
Section 2 Part 75 CEMS Overview
Daily Interference and Calibration Error Tests
The daily interference test check requires a means to ensure on a daily basis that the probe is sufficiently clean to prevent interference (Part 75 Appendix A sect 2222) The sensors are usually cleaned by self heating at temperatures of 700oF or higher to burn off any adhering particles or chemical compounds Daily calibration error tests check that the sensors are operational and that the system electronics are functioning correctly
254 Ultrasonic Flow Monitor
Ultrasonic flow monitors measure the time required for an ultrasonic pulse to travel across a stack or duct at an angle to the stack flow The monitors are also called transit time monitors The monitor consists of downstream and upstream transducers located opposite of each other on the stack wall which send and receive ultrasonic pulses The difference in the time that it takes for the pulse to go in the different directions between the two transducers (the time it takes to go downstream is shorter than the time to go upstream) and the distance traveled are used to calculate velocity The equation for an ideal flow profile is shown below
where va = average velocity of the flue gas L = distance between the transducers = angle of inclination t1 = traverse time in upstream direction t2 = traverse time in downstream direction
The most common angle of inclination or path angle between the transducers at Part 75 sources is 45o Other angles are possible and various designs and approaches are used to optimize signal recognition for better transmission reception reliability and accuracy
Illustration 2-10 Ultrasonic Flow Monitor
Part 75 Field Audit Manual ndash July 16 2003 Page 37
Part 75 CEMS Overview Section 2
The velocity of the sound pulse through the stack gas is affected by the stack gas density so changes in the stack temperature due to load changes andor temperature variations across the sonic path will affect the flow measurement In some cases correction factors can be developed using the pre-RATA testing to account for these changes
Non-parallel flow will also affect the ultrasonic monitor measurements If the angle or pitch of the non-parallel flow is in the same direction from the stack center line as the measurement path inclination the flow measurement will have a positive bias The flow measurement will have a negative bias if the flow pitch angle and inclination angle are in opposite directions Two ultrasonic monitors measuring along different path cross sections (an x-pattern) can be used in situations with a stratified flow profile that varies with load One path is usually sufficient if the stratification is stable
Daily Interference and Calibration Error Tests
Part 75 requires a means to ensure on at least a daily basis that the probe remains sufficiently clean to prevent interference (Part 75 Appendix A sect 2222) Blowers are provided to keep the sensors clean much like on an opacity monitor The blower air is heated to the temperature of the flue gas to prevent condensation which may damage the transducer Daily calibrations of this type of flow CEMS are indirect The electronic calibration process verifies that the upstream and downstream sensors are working in both the transmitting and receiving modes The procedure also verifies that the signal to noise ratio is acceptable
26 Data Acquisition and Handling System (DAHS)
The term data acquisition and handling system (DAHS) refers to the CEMS hardware and software components that take the output from the analyzers combine it with other information and compute hourly emissions The DAHS acquires and stores the necessary data (Part 75 requires that the DAHS automatically record all emissions data and the daily calibration error checks - Appendix A sect 4) It also computes the emissions and quality assurance test results in terms of the regulatory requirements displays the data and produces the quarterly reports required by Part 75 The DAHS software for Part 75 is highly specialized to match the electronic data reporting (EDR) format
In addition to a DAHS a CEMS requires softwarehardware components for system control functions These functions include automatic calibration probe blowback analyzer sequencing for time-shared analyzers error detection diagnostic routines and similar tasks
261 CEMS Computer Systems
In general there are two approaches for a CEMS computer system In one approach a single computer handles both the CEMS control functions and the DAHS functions In the other there is a separate control system that handles the CEMS functions and may manipulate data as an interface between the analyzers and a separate DAHS computer Because of the complexity of the control and DAHS functions in Part 75 CEMS it is more typical to have separate systems for control and data acquisition and handling
System control hardware options include computers programmable logic controllers (PLCs) data loggers and embedded microprocessors Besides providing CEMS control
Page 38 Part 75 Field Audit Manual ndash July 16 2003
Section 2 Part 75 CEMS Overview
functions described above controllers also can provide some analyzer data processing prior to the DAHS These may include converting analog data to digital and performing some of the automatic correction calculations and emission calculations
The DAHS computer is most often a stand alone personal computer although some plants are using the plants distributive control system (DCS)
262 Emissions Data Processing
The analyzers may send digital signals directly to the DAHS or send analog signals that must be converted to a digital value and scaled The real time second-to-second data is first averaged (1-15 minutes) by the analyzer control interface or DAHS Corrections may be applied to the data (eg pressuretemperature compensation molecular weight flow and moisture monitoring polynomials sonic velocity correction factors NOx quenching correction factors and dilution ratio settings) and the data then converted to the proper units for the Part 75 formula calculations
The data must be averaged again to one-hour averages as required by Part 75 A valid measurement must be recorded in each quadrant of the hour except when performing required Part 75 QA testing (eg a daily calibration or quarterly linearity test) For hours in which Part 75 QA testing is performed only two quadrants of the hour need to be captured (sect 7510(d)(1)) The hourly data are then used to calculate the Part 75 emissions parameters and rates based on formulas in Part 75 Appendices D - G with the CEMS-based formulas in Appendix F A table of the required formulas is provided in the EDR v22 Reporting Instructions (August 2002)
263 QA Test Data Processing
As noted previously Part 75 requires automatic data capture and calculation of daily calibration error test results Other QA test data and results may be entered manually Automatic and manual data entry for a Part 75 DAHS are discussed further in Section 46 of this manual and in Section IIC3 of the EDR v22 Reporting Instructions
Some CEMS use the daily calibration error test results to automatically correct the analyzer data These mathematical adjustments are similar to an internal bias adjustment factor in that the DAHS evaluates the response in comparison to the reference value and assigns from that time forward an adjustment factor which is used to adjust the data for reporting
264 Part 75 Reporting
The DAHS generates the quarterly electronic data report (EDR) submitted by the source to EPAs Clean Air Markets Division The EDR is in ASCII text format with each line representing a separate record which includes plant and unit information monitoring plan information hourly monitoring data and QA test results The reports are sent directly to EPA by electronic data transfer There is more discussion of the EDR in Section 311 of this manual
Part 75 Field Audit Manual ndash July 16 2003 Page 39
Part 75 CEMS Overview Section 2
27 References
Gschwandtner G and Winkler J (2001) US EPA Acid Rain Program Continuous Emissions Monitoring Systems Reference Manual US Environmental Protection Agency Acid Rain Division
Jahnke J A (1992) APTI Course 474 Continuous Emissions Monitoring Systems Student Manual (Revised) US Environmental Protection Agency Office of Air Quality and Planning Standards
Jahnke J A (1994) An Operators Guide to Eliminating Bias in CEM Systems US Environmental Protection Agency Office of Air and Radiation EPA 430-R-94-016
Jahnke J A and Peeler J W (1997) Handbook Continuous Emission Monitoring Systems for Non-Criteria Pollutants US Environmental Protection Agency Office of Research and Development EPA625R-97001
Jahnke J A (2000) Continuous Emission Monitoring Second Edition John Wiley amp Sons Inc
Shigehara R T and Peeler J W (1998) Evaluation of Daily Calibration Techniques of Continuous Flow Monitoring Systems US Environmental Protection Agency Acid Rain Division
Page 40 Part 75 Field Audit Manual ndash July 16 2003
Section 3 Audit Preparation
Section 3 covers the data that are available to help you prepare for the field audit and explains how to use that data eparing for the audit can increase your efficiency by allowing you to target issues for auditing while at the plant lso gain credibility with plant personnel if you come prepared ection emphasizes the use of the MDC software to review quarterly electronic data
PrYou a
This s
31 Using Part 75 Electronic Data to Conduct Pre-Audit Reviews
You will have available two types of source file information in preparing for a Part 75 field audit Hardcopy file information may include correspondence petition responses portions of the monitoring plan (such as system diagrams) reports of previous inspections or audits performance test reports and permits This type of information may be similar to background file information available for other types of air compliance inspections and audits
The second type of information is the quarterly electronic report required under Part 75 This wealth of electronic data generally is not available under other programs and provides a valuable resource that you can use prior to the plant visit to conduct monitoring checks and to identify potential source monitoring problems The electronic information includes data on the units monitoring plan certification and recertification events QA tests and emissions and operating data for each hour of the quarter
This section first introduces you to the quarterly Electronic Data Report (EDR) The section then describes how to review reports that EPA sends to affected sources to provide feedback on each EDR submitted Finally the section focuses on how to use EPAs Monitoring Data Checking (MDC) software to review EDRs
The format and volume of the electronic data can be daunting at first especially for inspectors who have responsibilities for multiple air programs The MDC software will be a vital asset to help you access and analyze the EDR and you should ensure that you take advantage of this tool as you prepare for an audit
311 Quarterly Electronic Data Reports
A facility usually submits each Part 75 quarterly EDR on a unit basis so one facility may submit multiple EDRs each quarter In other cases one report may be submitted for all units that exhaust to a common monitored stack or other complex stack configuration The EDR is in ASCII text format with each line representing a separate record referred to as a record type or RT An example of the layout of information in a report line or record type is provided in Illustration 3-1 In this example a line of hourly NOx emission rate data (RT 320) is presented If you want to explore the structure and content of the EDR in more detail you should review the most up-to-date version of the EDR Reporting Instructions and Formats --see Section 15 for guidance on how to access the EDR guidance documents
Part 75 Field Audit Manual ndash July 16 2003 Page 41
Audit Preparation Section 3
Illustration 3-1Example EDR Data Format for Record Type 320
To show you the various data elements you will see in an EDR Illustration 3-2 below provides an example summary of the content of an EDR by record type The example is for two Acid Rain CEMS units monitored at a common stack A number of these record types like RT 320 in Illustration 3-1 above pertain to emissions or operating data that are reported for each hour of operation so a quarterly EDR will have many lines of data A quarterly EDR for a unit with a single stack may have over 20000 lines An EDR in text file format therefore may look overwhelming but the MDC software tool allows you to streamline your review and analysis of the data
Page 42 Part 75 Field Audit Manual ndash July 16 2003
Section 3 Audit Preparation
Illustration 3-2Example Summary Of Quarterly Report Content For Two Acid Rain
CEMS Units Emitting Through Common Stack
FACILITY INFORMATION Type 100 Record (Facility and report data)
Type 102 Record (Facility information)
COMMON STACK FOR UNITS 1 amp 2 Type 200 Records (SO2 concentration data by date and hour)
Type 201 Records (NOx concentration data by date and hour)
Type 202 Records (CO2 concentration data by date and hour)
Type 210 Records (Diluent data by date and hour)
Type 220 Records (Volumetric flow data by date and hour)
Type 230 Records (Daily calibration test data by date and hour)
Type 231 Records (Flow interference data by date and hour)
Type 300 Records (Stack operating parameters by date and hour)
Type 301 Record (Quarterly and cumulative emission data)
Type 310 Records (SO2 mass emissions data by date and hour)
Type 320 Records (NOx emission rate data by date and hour)
Type 330 Records (CO2 mass emissions data by date and hour)
Type 503 Records (For Unit 1 (Common stack definition table)) (For Unit 2 (Common stack definition table))
Type 510 Records (Monitoring systemsanalytical components table)
Type 520 Records (Formula table)
Type 530 Records (Span table)
Type 535 Records (Stack operating load data)
Type 536 Record (Range of Operation normal load and load usage)
Type 556 Records (Monitoring system recertification events)
Type 601 Records (Quarterly linearity test data) Type 602 Records (Quarterly linearity check results)
Type 603 Records (Flow quarterly leak check results)
Type 605 Records (Reference data for flow-to-load ratio or GHR evaluation)
Type 606 Records (Quarterly flow-to-load or GHR check)
Type 610 Records (RATA and bias test data)
Type 611 Records (RATA and bias test results)
Type 623 Records (On-lineOff-line calibration demonstration)
Type 699 Record (QA test extension claim based on grace period)
UNIT 1 (MONITORED AT COMMON STACK) Type 300 Records (Unit operating parameters by date and hour)
Type 301 Record (Quarterly and cumulative emission data)
Type 504 Record (Unit information)
Type 505 Record (Unitprogram information)
Type 585 Records (Monitoring methodology information)
Type 586 Record (Control equipment information)
Type 587 Record (Unit fuel type)
UNIT 2 (MONITORED AT COMMON STACK) Type 300 Records (Unit operating parameters by date and hour)
Type 301 Record (Quarterly and cumulative emission data)
Type 504 Record (Unit definition table)
Type 505 Record (Unitprogram information)
Type 585 Records (Monitoring methodology information)
Type 586 Record (Control equipment information)
Type 587 Record (Unit fuel type)
CERTIFICATIONS Type 900 Records (Certification electronic signature)
Type 901 Records (Certification statement)
Type 999 Record (Contact person information)
Part 75 Field Audit Manual ndash July 16 2003 Page 43
Audit Preparation Section 3
312 Quarterly Feedback Reports
CAMD conducts two separate automated reviews of each quarterly EDR submission The first is generated by the Emission Tracking System (ETS) as instant feedback when the source submits the file to the EPA mainframe This instant ETS feedback provides the EPA Status Code which indicates whether the file was accepted and whether any errors were identified Certain errors are considered critical and necessitate a resubmission of a corrected file Other errors are considered informational and should be corrected by the source in future quarters but need not necessarily be addressed immediately Any errors that are identified are listed in the ETS feedback report with the relevant error code description number of hours and identification of the first hour in which the error occurred ETS checks include recalculations of hourly and cumulative emission values as well as range checks for acceptable values and codes in various fields
As part of preparing for a field audit you can download the ETS feedback report from the EPA mainframe (if you have access rights) or you can request a copy of the feedback from your CAMD contact If errors were identified on the latest ETS feedback you should review this report with the source during the on-site inspection and verify that the source has corrected those errors
The second automated review is generated by the Monitoring Data Checking (MDC) software and is sent by email to a facilitys Designated Representative shortly after the quarterly EDR submission period The MDC feedback consists of monitoring plan and QA test data evaluations As with the ETS errors certain MDC errors are considered critical and must be corrected by a resubmission of the quarterly file Note that since MDC is available to sources to download from the CAMD website they can run these same evaluations on their quarterly files prior to submission The MDC software is discussed in more detail in the following sections with guidance on how you can use the software to prepare for the plant visit
313 Using MDC to Prepare
for an Audit Key Checks Using MDC to Prepare
for the Field Audit
bull Print a copy of the monitoring plan report to take with you to the plant
bull Evaluate QA Test results (eg linearity RATA flow-to-load) and check for duplicate tests Identify if the source has claimed an exemption or grace period
bull Print and review recertification reports Also print missing data reports if available
bull Check hourly emissions calculations and missing data periods using the MDC Hourly feature
3131 MDC Overview
EPA developed the MDC software to allow affected sources State agencies and EPA staff to enter analyze print and export electronic monitoring plan certification and quality assurance data and to evaluate hourly emissions data for Part 75 monitoring The software also allows industry users to submit monitoring plan and certification data to EPA through standard electronic data transfer protocols
Page 44 Part 75 Field Audit Manual ndash July 16 2003
Section 3 Audit Preparation
To prepare for an audit you can use MDC to perform the following tasks in reviewing the quarterly EDR data
View monitoring plan QA test extensionexemption and compliance certification records directly on screen
Evaluate monitoring plans quality assurance tests and extensionexemption records
Print out reports of monitoring plans QA test data or evaluations
Analyze hourly data with the MDC Hourly data module
Analyze view and chart hourly data records for SO2 CO2 O2 NOx and heat input Also calculate and display summary data for daily monthly and quarterly time periods
Check hourly emissions calculations (MDC relies on the calculation procedures identified in a units monitoring plan together with RATA test data for these calculations) You can also calculate cumulative emissions from the hourly data to compare to the quarterly and annual values that the source reports in the EDR (see RTs 301 and 307)
Check to determine the quality assurance status (with respect to RATAs and linearity tests) of measurements reported for specific hours and monitors (MDC uses the ongoing reported quality assurance test data and extensionexemption records for this analysis)
Archive hourly data calculations and QA status for quick retrieval
Use a utility in MDC to modify parameter tolerances for comparisons of reported versus calculated hourly emissions
The following subsections address these uses in greater detail
3132 Getting Started with MDC
The most current version of MDC along with instructions and training materials are available on CAMDs website Once you obtain MDC and install it on your computer the next step is to import recent EDRs for the units to be audited You will need first to obtain the quarterly EDRs which can be downloaded from CAMDs website or received on a CD from CAMD
Obtaining MDC Software
EPAs MDC Software and supporting information can be downloaded at wwwepagovairmarketsmonitoringmdc
The EDR files should be saved in the data folder of the MDC directory You may need as many as four quarters of the most recent EDRs for the units and may need to go back additional quarters depending on when the most recent RATA was performed QA tests are included in the EDR for the quarter during which the tests were performed
Part 75 Field Audit Manual ndash July 16 2003 Page 45
Audit Preparation Section 3
3133 Review and Print Electronic Portion of Monitoring Plans
The electronic portion of a monitoring plan provides important background information The plan identifies the affected units (eg type rated capacity fuels combusted) control equipment what types of monitoring systems and components are in use monitor span values DAHS formulas missing data procedures and other information (See Table 3-1)
The plan should be printed out using the MDC reports function and brought to the plant The plan printout provides a simple template and check sheet for the plant visit For example when verifying monitor serial numbers to ensure that equipment has been properly certified you may simply check off on the printed monitoring plan each monitor system component that matches and include this as a check sheet in the audit report
Table 3-1Electronic Monitoring Plan Information
Electronic Monitoring Plan Records Description
Unit Operation Information (RT 504) Unit ID Boiler Type Maximum Heat Input Areas at Flow Monitor and Stack Exit
Monitoring SystemsAnalytical (RT 510) Components
System Parameter and ID Component ID Type Sample Method Manufacturer Model Serial Number
Emission Formulas (RT 520) Parameter Formula Code Formula
Span Values (RT 530) Parameter Scale MPCMECMPF Max NOx Rate Span Value Full-Scale Range Units of Measure
Load Range (RT 535) Maximum Hourly Load
Range of Operation (RT 536) Upper and Lower Bounds of Operating Range Most Frequently Used Loads Normal Load
Monitoring Methodologies (RT 585) Parameter Methodology Fuel Type Missing Data Approach
Control Information (RT 586) Parameter Type of Control Control Dates
Fuel Type (RT 587) PrimarySecondary Fuels
Fuel Flow Meter Data (Appendix D) (RT 540)
Parameter Fuel Type Maximum Fuel Flow Initial Accuracy Test Method
Fuel Usage Qualification (Appendix E) (RT 507)
Capacity or Gas Usage Qualification Type Method
NOx Correlation Segments (Appendix E) (RT 560)
Test Date Test Number Operating Level Segment Heat Input NOx Rate Fuel Type
Page 46 Part 75 Field Audit Manual ndash July 16 2003
Section 3 Audit Preparation
3134 ts Exemptions and Extensions
The MDC program evaluates QA test data and provides detailed test reports u can view a list of the QA tests (linearity flow-to-load and RATAs) -- as well as any test grace periods and exemptions -- in the EDRs that you have imported into MDC by selecting Certification and QA Tests or Test Extensions and Exemptions from the Edit or Report pull down menus
QA Tests
MDC will evaluate QA test data and provide brief error messages if errors are found For example low medium and high gas levels are compared to the instrument span to determine if the linearity was performed at the appropriate levels The program also will re-calculate linearity and RATA results including RATA bias adjustment factors (BAF) These are the same evaluations that are performed by CAMD at the end of each quarter described above in Section 312
If you have not received a copy of CAMDs evaluation you should run QA test evaluations of all the QA tests performed in the quarters you have downloaded ke a note of errors also you can print out specific pages of the MDC evaluation report for follow up with the plant during the audit visit
In addition to the test evaluations you will want to view the list of QA tests performed by the source to see if a particular QA test (RATA or linearity) has been repeated in a quarter This would indicate a failed or aborted test that might be due to CEMS problems You should investigate these failedaborted tests during the plant visit to find out what adjustments (if any) were made to the system and why they were necessary rform this check view the list of QA tests for a source by using the Edit pull down menu in MDC An example is shown in Illustration 3-3 where the SO2 linearity test has been repeated multiple times for a unit during the second quarter of 2000
Part 75 QA Tests
In the context of Part 75 and this manual QA tests refer to quality assurance tests required by the rule The primary tests for electronic data evaluation using MDC are
bull Linearity Tests bull Relative Accuracy Test Audits
(RATAs) bull Flow-to-Load Tests
QA Tes
Yo
Ma
To pe
Part 75 Field Audit Manual ndash July 16 2003 Page 47
Audit Preparation Section 3
Illustration 3-3 MDC Screen Showing Multiple Linearity Tests in One Quarter
You should also print out copies of a number of RATA and linearity test reports to bring with you to the plant so that you may compare the results reported in the quarterly EDR to on-site test report records You should perform this check (see Section 46) to ensure that the source properly transferred QA test data not automatically recorded by a CEMS to the CEMS data acquisition and handling system (DAHS)
Extensions and Exemptions
The Part 75 rule allows for the extension of QA test deadlines and in some cases exemptions from QA test requirements based on specific unit circumstances Test extensions are available for RATAs and quarterly Appendix D fuel flowmeter accuracy tests There is also a general grace period extension for all quarterly QA tests and RATAs which allows time in which to complete the testing for a short period after the end-of-quarter deadline
Exemptions are available from the multi-load flow RATA requirement (flow RATA may be allowed at a single operating level) SO2 RATA requirement (for units burning a low sulfur fuel) and the requirement to perform a single load RATA at normal load In addition quarterly QA test exemptions are available for linearity tests leak checks and flow-to-load ratio tests in any quarter which does not qualify as a QA operating quarter (a QA operating quarter has at least 168 hours of stack or unit operation) Quarterly QA test exemptions are also available for linearity tests of one range of a dual range monitor (range not used in the quarter) linearity tests of SO2 or NOx monitors with spans of 30 ppm or less and flow-to-load ratio tests for
Page 48 Part 75 Field Audit Manual ndash July 16 2003
Section 3 Audit Preparation
complex stack configurations that have been approved by petition The EDR v22 Instructions (see sections that discuss RT 695 - RT 699) provide useful background descriptions of the available extensions and exemptions and qualification requirements A link to the EDR Instructions is provided in Section 15 of this manual
You can use MDC to determine whether the source has claimed any extensions or exemptions Select Test Extensions and Exemptions from MDCs Report pull down menu Then run an evaluation report for all of the extensions and exemptions to determine if there are any errors that require follow-up during the field audit
Extension and Exemption Record Types
bull RT 695 Single-Load Flow Rata Claim bull RT 696 owmeter Accuracy Test
Extension bull RT 697 RATA Extension or
Exemption bull RT 698 arterly QA Test Exemption
Fuel Fl
Qu
A common test exemption is the use of a 1-load level RATA for flow RATAs Generally a 2-load test is required for QA testing At least once every 5 years a 3-load test is required for quality assurance purposes In addition a 3-load test is required for certification and recertification
There are also a few situations in which a 1-load test is allowed without a special exemption (1) peaking units and bypass stacks automatically qualify (2) a source that conducts flow RATAs on a semiannual basis can alternate between a 2-load and 1-load test and (3) cement kilns and other non-load based units can conduct tests at a single level if representative of normal operations For other sources to qualify to use a 1-load level flow RATA the source must submit the results of the single load analysis required by Appendix B sect 2313(c) in RT 695 Check to make sure that flow RATAs were performed at multiple loads (or that a unit otherwise qualified for a single load test) if the MDC exemption report indicates that the source did not report RT 695
Table 3-2Summary of MDC QA Test Checks
QA Test Checks Description
QA test evaluations MDC will evaluate QA test data recalculate results and provide error messages if errors are found
Repeated QA tests Look for FailedRepeated QA Tests (multiple tests in a quarter)
Print RATA and linearity reports for comparison with on-site hardcopy data
Bring the reports to the plant to make sure the electronic data match hardcopy data or linearity tests make sure the reference cylinder gas concentrations match those on site
Extensions and grace periods Identify if the source has claimed an extension or grace period
F
(cont)
Part 75 Field Audit Manual ndash July 16 2003 Page 49
Audit Preparation Section 3
Table 3-2Summary of MDC QA Test Checks (cont)
QA Test Checks Description
Single load flow RATAs (RT 695) Check for the exemption analysis single load flow RATA claim record (RT 695) which will show the results of the single load analysis required by App B 2313(c) Make sure flow RATAs were performed at multiple load levels for units (other than peaking units) without the single load exemption request Note Non-peaking units performing RATAs semiannually can alternate between single-load and multiple-load test without requesting an exemption or reporting RT 695 Certain non-load based units (such as cement kilns) also may be exempt from multiple-level tests
3135 Recertification Events and Monitoring System Downtime Reports
Sources must report certification recertification and certain maintenance events in the quarterly EDR (RT 556) in the report for the quarter in which the event occurred The MDC report function (currently under the Reports drop down menu) can provide a printout report of recertification and maintenance events This report identifies certification recertification and maintenance events and what QA tests were required If any of these records have been reported you should print a copy of this report and bring it with you on the plant visit to compare against the plant records It is important that all monitoring components are properly certified If there have been changes to equipment proper diagnostic or recertification testing should have occurred as required by sect 7520(b) Note that MDC does not verify that all required certification recertification or diagnostic testing is included in the report EPA therefore relies on the inspector to make this verification as part of the audit
A Monitoring System Downtime or Missing Parameter Report (RT 550) may also be available though unlike the Recertification Report (RT 556) this record is optional This useful report shows the start and end time of all missing data periods by monitoring system reason for missing data and the corrective action taken You can print out a copy of this report and use the report to (1) target monitoring system problems for further investigation with plant personnel during the plant visit and (2) identify missing data periods that can be used in reviewing plant maintenance plan records or control device parameter records at the plant Alternatively if this report has not been submitted the MDC Hourly function can be used to identify missing data periods as discussed in the following section
3136 Using MDC Hourly to Check Emissions Data and Calculations
The MDC Hourly module analyzes calculates views and graphs the hourly emissions data records for SO2 CO2 O2 NOx flow and heat input It also calculates and displays summary data for daily monthly and quarterly time periods The program can analyze up to 4 quarters of calendar year data MDC Hourly was designed for use with EDR v21 Use of EDR v21 began in the second quarter of 2000
Page 50 Part 75 Field Audit Manual ndash July 16 2003
Section 3 Audit Preparation
Getting Started with MDC Hourly
In order to check the hourly calculations with MDC Hourly you will need to make sure that you have imported quarterly EDR files that include the quarter with data from the most recent pollutant and flow RATAs so that you can take full advantage of the MDC data checks If you do not import all of the historical monitoring plan and quality assurance data into MDC prior to running MDC Hourly MDC Hourly may mistake hourly data as being out of control (OOC) and will not provide any further analysis on those hours
Hourly Calculations and Error Messages
View the Detailed Emissions Data tables for the different CEMS The program recalculates emissions for each hour using the monitoring plan formula and provides an error message in the far right column if there is a discrepancy There is no need to perform the emission calculations yourself One issue is the bias adjustment factor (BAF) If a source uses the wrong BAF they could underreport emissions and undermine the integrity of the trading program This recalculation feature in MDC can assist you in spotting this problem and understand the potential magnitude of the impact on emission allowances
Error messages will also identify OOC periods which indicate that a QA test (RATA or Linearity) was expired failed or not performed MDC Hourly does not currently determine the control status of the unit with respect to daily calibrations Be careful of the out-of-control error messages you may generate when you run MDC Hourly As noted in the Getting Started discussion above you can receive these error messages if you do not import the data into MDC for the quarter in which the RATA was performed prior to running the analysis on the hourly data
Missing Data Periods
Use the filter function to identify missing data periods This is especially important if the source did not submit the optional RT 550 record described above in Section 3135 The reasons for the missing data are not provided but this information may be used to identify systems with high amounts of missing data to target during the plant visit and also to select missing data periods for an in-plant records review
Appendix D Units
For oil- or gas-fired units that use Appendix D fuel monitoring to determine heat input and SO2 emissions view and record the fuel gross caloric value (GCV) and sulfur content across quarters so that you can check these values against on-site fuel sampling and analysis results
Graphing
MDC Hourlys graphing function allows you to graph the hourly emission data as well as flow and heat input Graphing emissions data can be an invaluable tool for preparing for a field audit Graphing allows the inspector to verify that the reported emissions look reasonable for the type of unit being evaluated Abnormal emission trends can often be quickly identified and should be investigated as part of the field audit to identify if the abnormality is due to a problem with the monitoring system or to a change in the way the unit is operated An abrupt
Part 75 Field Audit Manual ndash July 16 2003 Page 51
Audit Preparation Section 3
or unusual change could indicate a modification to unit operation or the CEMS that may require recertification or diagnostic testing Consistent data with very little change (flat line) may indicate that the CEMS is not operating properly or that the unit is using a missing data routine Either situation should be investigated with the source during the on-site visit
Illustration 3-4Example MDC Hourly Graph of SO2 Concentrations
The graphing function also can be used to compare the hourly emissions or parameter (flow heat input) against the monitor span values listed in the monitoring plan You should note if the emissions or parameter exceed the relevant maximum potential concentration (MPC) maximum expected concentration (MEC) or maximum potential stack gas flow rate (MPF) The emissions should typically be between 20 and 80 percent of the monitor range identified in the monitoring plan (See Appendix A sect 21) If a majority of the emissionparameter readings are outside 20 to 80 percent of the monitoring range you should make sure that the source has performed the MPC MEC span and range checks that are required at least annually by Appendix A sect 21
Page 52 Part 75 Field Audit Manual ndash July 16 2003
Section 3 Audit Preparation
Table 3-3Summary of MDC Hourly Checks
MDC Hourly Checks Description
Check hourly calculations and error messages
Check recalculated hourly emissions for error messages which are provided for each hour in the far right column
Error messages also identify out of control periods which indicate that a QA test was failed or was not performed
Hourly error messages may need to be ignored if the most recent RATA for a parameter was not imported
Check BAFs used in hourly calculations
MDC Hourly will use the BAF in the most recent RATA to recalculate hourly emissions
Check missing data periods Use the filter function to identify missing data periods Identify systems with high amounts of missing data and to select missing data periods for in-plant records review
For oil or gas units using Appendix D note fuel GCV and sulfur content
View and record these values across quarters to check against on-site fuel sampling and analysis results
Check spans Use the graph function to compare the hourly emissions or parameter (flow heat input) against the monitor span values in the monitor plan report Follow-up with the source if emissionsparameters are higher than the span The source is required to perform a spanrange check at least annually (App A sect 21)
View graphs of data trends Use the graph function to plot emissions and flow Note any abrupt changes in the data or consistent data with no change
32 Hardcopy File Review
In addition to the electronic review of monitoring plan and quarterly report data you should also review the sources file for written correspondence and information pertaining to Part 75 monitoring These documents would include any petitions previous auditinspection reports linearity and RATA reports and the sources acid rain permit or operating permit
321 Correspondence Petitions and Previous AuditInspection Reports
Correspondence and any petitions provide background on any recent issues or unusual monitoring situations that may come up during the plant visit Previous audit or inspection reports serve the same purpose Also if a prior report identified problems that required follow-up you should confirm (either through your pre-audit review or on-site audit) that the source took appropriate corrective action
Part 75 Field Audit Manual ndash July 16 2003 Page 53
Audit Preparation Section 3
322 Linearity Test and RATA Reports
Some States require a hardcopy submittal of linearity test and RATA reports If this is the case in your State and you have access to the reports in your office you should compare the hardcopy results to those reported electronically and accessed with the MDC program as described in Sections 313 and 45 so that you will not have to conduct the comparison while at the plant You can also review the RATA test report as described in Table 3-4 The hardcopy RATA test report review should be focused on reference method documentation that can not be checked electronically (eg reference method analyzer biasdrift checks cylinder gas certifications reference method equipment calibrations traverse points etc)
Table 3-4RATA Report Review
RATA Hardcopy Review Explanation
For a NOx RATA using the instrumental method 7E is the NOx
converter efficiency documented through a performance test
The NOx converter converts NO2 to NO NO is measured by the analyzer If the NO2 concentration is greater than 5 ppm a NOx converter efficiency test (RM 20) is required
If an instrumental RM was used were cylinder gas certificates included in the test report
The calibration gas certificates should be provided in the test report and show Certified gases (EPA Protocol NIST etc see
Section 45) Concentrations which match those used in the
biasdrift check calculations Expiration date after the RATA
For instrumental methods (6C 7E 3A) were the appropriate bias and drift corrections made for the RM data
Run results are corrected for bias based on the average of the before and after bias checks
For flow reference methods is the calibration date of the pitot tube within 6 months of the RATA
The most recent calibration should have been performed within 6 months of the test
Are CEMS and RM data on same moisture basis
Make sure the comparison between the CEMS and RM are on the same basis
323 Permits
You should make sure that the source has an Acid Rain permit or NOx budget permit if required Check any relevant source specific provisions related to Part 75 monitoring in the permit and bring a copy of those provisions with you on the audit The permit conditions for Part 75 monitoring however may only list a general requirement to follow Part 75 and not be that helpful
Page 54 Part 75 Field Audit Manual ndash July 16 2003
Section 3 Audit Preparation
33 Scheduling and Coordinating the Audit
Level 2 audits require coordination with the source to obtain their schedule for performing RATA and linearity performance tests The source is required to provide written notice of the date of periodic RATAs no later than 21 days prior to the first scheduled day of testing (sect 7561(a)(5)) Written notification may be provided by mail or by facsimile and may be provided by electronic mail if the EPA Regional Office or State agency determines that electronic mail is acceptable (sect7561(a)(5)(i)) However the date can be changed and often is due to operating constraints at the plant or with the CEMS Part 75 allows performing a test on a different date as long as notice of the new date is provided as soon as practicable but no later than twenty-four (24) hours in advance of the new test date
Notice is not required prior to the quarterly linearity tests So you will need to coordinate with the facility staff to schedule your audit to coincide with a linearity test date if desired
Because the audit policy is hands-off you should review all of the inspection procedures and requirements at the time of scheduling to allow the facility the opportunity to gather the necessary information and arrange for the appropriate personnel to be available (The plant environmental contact may also not be authorized to access the CEMS) Prior knowledge of all procedures and the audit objectives will help to avoid problems and will allow the audit to proceed as planned and in a timely manner You should also check plant-specific safety requirements with the source and what safety equipment you will need
Level 1 unannounced audits of a Part 75 monitoring system are often performed as part of the overall unannounced air compliance inspection of the facility If you conduct a Level 1 audit as part of an unannounced inspection you should also go over the inspection procedures and requirements as outlined in the previous paragraph when you arrive at the facility Unannounced audits may not be as productive since the sources often rely on outside contractors or personnel from other sites to perform certain tasks It is therefore more productive to coordinate with the source before the audit to make sure that the proper personnel are present to answer any questions that might arise during the audit
34 Materials to Bring
The inspector should bring personal safety equipment (eg hard hat safety glasses safety shoes hearing protection etc) as provided by agency policy Useful materials and data sheets to bring on the field audit include
Note
Section 15 of this manual contains information to help you find related documents including regulatory text for Part 60 and Part 75 and the Parts 75 and 76 Policy Manual
MDC printout of the monitoring plan
MDC printout of linearity and RATA reports
MDC printout of recertification and missing data reports
Appropriate Part 60 reference method requirements if observing a RATA
Part 75 Field Audit Manual ndash July 16 2003 Page 55
Audit Preparation Section 3
Checklists and data entry forms (see Appendix A of this manual)
Part 75 Rule (see easy-to-use version maintained on CAMDs website)
Parts 75 and 76 Policy Manual (bring and leave in car for reference as needed)
Copy of Acid Rain permit or operating permit monitoring provisions
Page 56 Part 75 Field Audit Manual ndash July 16 2003
Section 4 On-Site CEMS Inspection
This section describes the primary on-site activities that will apply to any field audit for a Part 75 CEMS
Outline of Section 4
41 Pre-Audit Interview 42 Calibration Error Test 43 ProbeSensors Sample Lines and
Sample Conditioning Systems 44 Gas Analyzers 45 Calibration Gases 46 Flow Monitors 47 DAHS 48 Maintenance Log and Daily Checklists
Review 49 QAQC Plan Review
The field audit will consist of an initial interview (Section 41) the walk through and inspection of the various components of CEMS (Sections 42 -47) and a review of QA and maintenance records (Sections 48 and 49) If you are conducting a Level 2 audit you will also observe performance tests (Section 5) For a Level 3 audit you will conduct certain performance tests (Section 6) In each case you will complete your audit with an exit interview and final report (Section 7)
You should not consider the organization of this section as suggesting a specific order to the audit For example this section discusses conducting a walk-through visual observation of all equipment first followed by a review of the QAQC plan and recordkeeping In many audits you may go back and forth between visual observations and records review
In budgeting your time you should spend more time on items that can not be checked or verified off-site from EDR submittals or other file information In addition focus on any potential problems flagged during the pre-audit review For example focus on CEMS and time periods with the most missing data multiple failed QA tests unusual data trends or mistakes in emissions calculations If you analyzed information using MDC or MDC Hourly bring a specific list of the questions and issues based on these pre-audit activities
In conjunction with your own visual observations and records review interviews with plant staff provide important information on how the monitoring systems work and are operated as well as on compliance with Part 75 requirements You should ask the staff how they operate the equipment and perform QA activities and how the QAQC plan is used in relation to the different CEMS and quality assurance components A key auditing technique is to establish a dialogue with personnel at the source and to let them answer your questions by going through their procedures and showing you where they document the procedures
You will want to confirm that actual equipment settings monitor operations and quality assurance activities match the QAQC plan The QAQC plan is an important resource and a Part 75 requirement The QAQC plan is the document that provides detailed procedures for how the CEMS is to be operated If a source is following a complete QAQC plan that covers all of the Part 75 quality assurance requirements and the operating parameters for the monitoring systems then the data can be considered valid at all times that the system is operating within those parameters since the system is being operated as it was during the RATA If the QAQC plan is not followed or is incomplete then it is questionable whether the emissions data are of the same quality as was demonstrated during the RATA You may also
Part 75 Field Audit Manual ndash July 16 2003 Page 57
On-Site CEMS Inspection Section 4
find that the procedures currently in use are appropriate but the QAQC plan has not been updated Many of the recommended checks in this manual refer back to the QAQC plan
One critical step is to verify that the CEMS components match those in the monitoring plan If changes have been made you need to determine if the proper recertification testing or diagnostic testing has been performed Part 75 quality assurance begins with the initial certification of the CEMS and any changes since that certification need to be evaluated for their effect on CEMS data
Identifying Monitoring Hardware Recertification Issues
Recertification is required for a replacement modification or change that may significantly affect the ability of a CEMS to accurately measure monitored parameters
bull Complete System Replacement bull Analyzer Replacement bull Change in Orientation or Location of Sampling Probe or Site bull Change in Flow Monitor K factor or Polynomial
This is a key issue for audits ee Section 15 of this manual for a link to CAMDs guidance on recertification under Part 75
S
41 Pre-Audit Interview
You should conduct a pre-audit meeting when you arrive at the plant The meeting should include the plant contact the plant CEMS technician assigned to assist with the audit and may include plant management personnel At this time it is important for you to make sure the plant personnel understand the general scope of the audit and to agree upon a tentative audit schedule so that necessary personnel will be available when needed Table 4-1 identifies several items you should discuss in the interview
Page 58 Part 75 Field Audit Manual ndash July 16 2003
Section 4 On-Site CEMS Inspection
Table 4-1Pre-Audit Interview Items
Topic Purpose
Audit purpose and agenda bull Inform facility of the purpose and scope of the audit
bull Streamline subsequent activities bull Allow for meetings with necessary plant personnel
Inspection and audit techniques to be used including hands-off policy and the need for a CEMS technician
bull Streamline subsequent activities bull Identify plant contacts for different parts of the
audit
Specific areas to be observed bull Identify any constraints on visiting locations in the plant
Safety requirements bull Identify necessary safety equipment and plant safety issues
Records to be reviewed and copying needs bull Streamline subsequent activities bull Provide source an opportunity to collect information
during the other audit activities
Notify plant personnel of intent to take photographs or videos to document observed conditions
bull The inspector should ask for permission to take photographs on the plant property and explain the purpose for the photos The source can make a confidentiality claim but emission-related information is public information under the Clean Air Act You should follow your agencys policy on the treatment of confidential business information claims This is not likely to be an issue if photos or videos are limited to the CEMS components
42 Calibration Error Test
Part 75 requires a daily calibration error test This test provides a simple check of most CEMS components and can detect many but not all sources of potential error in the monitoring system
If possible you should observe routine daily calibration error tests as part of any CEMS field audit but often the tests are initiated automatically at a specific time of day Following the calibration sequence the DAHS will typically generate a calibration summary report (presenting the CEMS responses and calculated calibration error results) to record the data for each operating day Daily calibration check results are also reported electronically in the EDR
If the daily checks have occurred before you arrived at the plant review the results of the tests for that day and request the plant contact or CEMS technician to initiate a routine daily calibration test Ask for an explanation of how daily calibrations are performed how the results are used what responses will trigger adjustments and how adjustments are made The specific procedures used to conduct this calibration routine should be described in the QAQC plan available on-site Adjustments are not to be made during the calibration error test When
Part 75 Field Audit Manual ndash July 16 2003 Page 59
On-Site CEMS Inspection Section 4
adjustments are made following a calibration test another calibration error test is required after all adjustments are completed to validate that the adjustment was appropriate
The Daily Calibration Summary form included in Appendix A can be used to compile the daily calibration check data while on-site You should also request a printout from the sources DAHS and compare these values to the values you recorded from the analyzers display For each monitor
Record the gas monitor responses from the zero and upscale calibration gas injections (for dilution systems multiply the monitor data by the dilution ratio to obtain the actual concentration)
For flow monitors record the results of the electronic tests for ultrasonic and thermal flow monitors or the pressure transducer checks for differential pressure monitors
Note the start and stop times and whether the response is stable when the system records the calibration test response Also check that the time taken for the test still provides at least two valid CEMS data points per hour to meet the valid hour requirements of Part 75
Check that the calibration gas flow rates and pressure match sampling conditions
Calculate the results from the monitor data and retrieve the daily calibration error (CE) results from the daily report generated by the DAHS Compare your results to those generated by the DAHS If there is a discrepancy ask about correction factors in the DAHS such as pressure correction factors for dilution probes or similar factors
Compare the calibration error at the zero and high levels to the Part 75 data validation requirements in Appendix B sect 214(a) (see Table 4-2)
If the calibration error check is failed the data from the monitor are invalid and the monitor is out of control until it successfully passes a subsequent calibration error test Missing data routines must be used until the monitor is adjusted and successfully passes a subsequent calibration error test
Page 60 Part 75 Field Audit Manual ndash July 16 2003
Section 4 On-Site CEMS Inspection
Table 4-2 Part 75 Calibration Error Test Data Validation Requirements
Monitored Parameter Calibration Error Requirement (App B sect 214(a))
SO2 or NOx 50 of the Span Value or
5 ppm absolute value of the difference between the monitor response and the reference value if the span value of the monitor is less than 50 ppm or
10 ppm absolute value of the difference between the monitor response and the reference value if the span value of the monitor is greater than 50 ppm but less than 200 ppm
CO2 or O2 10 CO2 or O2
H2O 60 of the Span Value Moisture monitor systems composed of wet and dry O2 monitors must meet the O2 calibration error requirement of 10
Flow 60 of the span value or
002 inches of water absolute value of the difference between the monitor response and the reference value if the monitor is a differential pressure type
You should also compare the CE results you obtain to the results of the most recent automatic calibration error test that occurred earlier in the day of your audit or on previous days Previous calibration error tests usually can be brought up on the DAHS visual display screen If there is a significant shift in the CE results from that previous test ask the facility contact if they can explain the shift Were adjustments made to the monitoring system(s) that could cause the shift Does the shift indicate that adjustments are necessary
Routine adjustments of the monitor are allowed after successful calibration error tests These adjustments are to be made to bring the monitor as close as practicable to the calibration gas tag value or flow reference signal If the monitor is physically adjusted by a person a follow-up calibration error test is required to verify that the adjustment was performed properly No follow-up calibration error testing is required when only a mathematical adjustment is made automatically by the DAHS These mathematical adjustments are similar to an internal bias adjustment factor in that the DAHS evaluates the response in comparison to the reference value and assigns from that time forward an adjustment factor which is used to adjust the data for reporting If this type of adjustment is used the inspector should determine at what point the source physically adjusts the calibration of the analyzer (ie what the range of acceptable calibration error adjustment factors is) Typically sources that use the auto adjustment in this manner physically recalibrate when the mathematical adjustment exceeds 25 percent of the span The criteria that are used should be documented in the sources QAQC plan
Part 75 Field Audit Manual ndash July 16 2003 Page 61
On-Site CEMS Inspection Section 4
43 ProbeSensors Sample Lines and Sample Conditioning Systems
Most of the suggested checks of the probesensors and the sample lines do not require a visual check of the actual probesensors or lines The probesensors and sample lines may not be easily accessible and may be located in a confined space that your agencys (or the plants) safety policies prohibit you from entering Access to the gas sampling probe and flow monitor probesensors also may require climbing ladders or working at substantial heights
431 ProbeSensors
You should ensure that the probesensors are in the same location as when the unit was certifiedrecertified (as detailed in the monitoring plan) -- changes in probesensors orientation or location require recertification of a CEMS A hardcopy submittal of the monitoring plan will contain a diagram with the probesensors location A copy should have been submitted to the State agency If it is not available in your files it should be on file at the plant In addition ask how frequently the probesensors are inspected if there have been any problems (plugging for example) and if the probesensors or a component have been recently changed The change might also require recertification or diagnostic testing
Flow Monitors
In addition for flow monitors you could ask the source representative to perform a daily interference check as required by App B sect 212 or review the results of the most recent interference tests The daily interference check tests the flow monitor probe or sensors sample lines and temperature transceiver for plugging or malfunctioning
The interference test procedure should be identified in the QAQC Plan Go over the interference test procedures with the source representative and ask if there have been any recent failures and what corrective action was taken Some interference checks for various types of flow monitors are described below
Differential Pressure - Regular back purge of probe and sample lines Back purge flow or measured flow is monitored and compared to baseline values to indicate if there is a plugging problem There may also be a moisture removal system or a heated sample line
Ultrasonic - Purge air blowers may be installed to prevent particulate build up on the transceivers and purge air flow rate is monitored Units without purge air blowers can monitor signal strength to identify particulate build up
Thermal - Temperature sensors may have an auto self clean feature which heat the sensors to burn off particulate build-up and help avoid moisture condensation Another approach uses short high pressure blasts of air Interference can be tested by checking the stack temperature measured by both sensors or by comparing the sensor measurements against calibration data
Page 62 Part 75 Field Audit Manual ndash July 16 2003
Section 4 On-Site CEMS Inspection
Table 4-3ProbeSensor Check Summary
What to Check Description
All ProbeSensor Types
Is the probe in the same stack or duct location as in the monitoring plan
Visually compare probe location to location on the diagram submitted with the monitoring plan A measurement of distances from disturbances or stackduct diameter are not necessary
Has the duct or stack location been modified (Dimensions)
Ask the source representative and note during a check of CEMS maintenance logs These ductstack changes could affect CEMS measurements and may require recertification
How often are the probessensors inspected have there been problems and have the probesensors or components been changed
Ask the source and note during a check of CEMS QAQC Plan and maintenance logs
Flow Monitors
Ask the source to perform a daily interference check or review the results of the most recent interference check
Appendix B sect 212 requires a daily interference check for flow monitors Each flow monitor is to be designed to provide a means for checking interference from plugging of each sample line and sensing port and malfunction of each resistance temperature detector (RTD) transceiver or equivalent
432 Sample Lines
Extractive Gas CEMS Sample Lines
The daily calibration error test (see Section 42) provides the best check on whether gas sample line leaks are diluting the sample gas measured by the analyzer The daily calibration error test should also detect most problems from condensation However for source level extractive NOx systems that do not have an SO2 analyzer if practical you should also visually check the umbilical line as it enters the CEM shelter Look for loops or sags in the line as well as moisture droplets Because calibration gases do not have significant amounts of NO2 the daily calibration error test for a NOx monitor may not detect a negative bias from absorption of NO2 by condensed water
Differential Pressure Flow CEMS Sample Lines
Manual or automatic quarterly leak checks are required for differential pressure flow monitors (Appendix B sect 222) The test criteria are not specified by Part 75 Most often the test checks the line after the probe flange by closing the line and holding a steady pressure for a specified time Check how and when the tests were performed The test date and results (passfail) are reported in the EDRs so you can confirm the reported electronic results with on-site data If a recent test failed find out what was done to correct the problem A failed leak
Part 75 Field Audit Manual ndash July 16 2003 Page 63
On-Site CEMS Inspection Section 4
test results in out of control data until the leak is fixed and a subsequent leak check is passed (Appendix B sect 223(g))
433 Dilution Air and Gas Sample Conditioning Systems
The majority of Part 75 gas CEMS are extractive systems that transport the stack gas from the stack to an analyzer The checks described in the next two sections relate to the systems that condition the stack gas for analysis
4331 Dilution Extractive Systems
Dilution systems are frequently used for Part 75 compliance These systems dilute the stack gas with clean dry air prior to the analyzer The ratio of sample taken from the stack to dilution air is the dilution ratio and is an important parameter of a dilution system How that ratio is maintained or what mathematical compensations are made to account for changes in the ratio is important to cover during an audit
Dilution Air Ratio
The following questions may be useful for auditing dilution extractive CEMS systems
What is the dilution ratio and how is it verified This should be described in the QAQC plan
Is the dilution probe ejector pump vacuum at or below the certification value The ejector vacuum affects sample flow if it decreases below the values which creates critical flow through the orifice How often does the source check the ejector vacuum as well as the dilution air and analyzer flow settings Some systems automatically adjust the dilution air pressure from a pressure transducer signal so ask how this works Again these activities should be described in the QAQC plan
Check if any corrections are applied to the dilution ratio for changes in pressure temperature or molecular weight (See Section 2331 on gas density effects) These corrections are typically applied by the DAHS and should be described in the QAQC plan Also find out if there have been any changes in the factors since the last RATA because a RATA is required following a change in these factors
You should also ask the source if the dilution probe orifice has been changed The orifice controls the sample flow rate if the orifice has changed it may have changed the dilution ratio You can also check this during the maintenance record reviews
If the orifice has been changed ask the source if there is a procedure for doing this in the QAQC plan In addition ask what prompts making a change Replacing a dilution probe orifice with one of the same size requires diagnostic testing while replacement by a different sized orifice requires recertification Check to see that the appropriate testing has been completed
Page 64 Part 75 Field Audit Manual ndash July 16 2003
Section 4 On-Site CEMS Inspection
Dilution Air Cleaning System
The dilution air supplied to the dilution probe must be treated to remove contaminants that could interfere with the analyzers The dilution air cleaning system removes moisture CO2 particulate matter hydrocarbons and other contaminants that may be present in ambient air A good place to start is simply to ask the source representative how the system works You should also investigate maintenance practices For the air cleaning system ask the source how often the filters are changed and at what point drying agents are replaced Again this should be verified against the QAQC plan documentation You can also ask to see a copy of the filter replacement documentation in either the maintenance log or a copy of the daily checklist You can check the inlet and outlet pressures of the CO2 filter and compare to the appropriate range for the inlet and outlet pressure in the QAQC plan Find out from the source how often these pressures are checked and how these checks are documented
Table 4-4Summary of Dilution Air System Checks
What to Check Description
Has the dilution probe orifice been bull The orifice controls the sample flow rate so a change in the changed orifice will affect the dilution air ratio Ask the source
CEMS operator if the orifice has been changed since the last RATA and note maintenance records for any evidence of changes (Section 47)
bull If the orifice has been changed ask if there is a procedure for changing the orifice in the QAQC Plan what prompts a change and how is the dilution ratio verified
bull If it has been changed confirm that necessary diagnosticrecertification testing was performed
Is the dilution probe ejector pump vacuum at or below the certification value
bull Ask the CEMS operator how often they check the ejector vacuum as well as the dilution air and analyzer flow settings and ask whether the values are recorded and what are the proper settings
bull Also ask the operator to show that the pressure gauges or rotameters are set in accordance with the QAQC plan and ask how often the values are verified and documented
Are the dilution ratio and dilution air and analyzer flow settings properly set
Are correction factors applied to the dilution ratio for changes in pressure temperature or molecular weight ve these been changed since the last RATA
bull Some systems apply correction factors to the dilution ratio to account for changes in gas density nges to the correction factors should be recorded in the maintenance log and the QAQC plan should outline the procedures for changing the correction factors TA should be performed following any change
Ha
Cha
A RA
(cont)
Part 75 Field Audit Manual ndash July 16 2003 Page 65
On-Site CEMS Inspection Section 4
Table 4-4Summary of Dilution Air System Checks (cont)
What to Check Description
Check the inlet and outlet pressures of CO2 air cleaner filter
bull Ask the CEMS operator how often they check the CO2 air cleaner filter inlet and outlet pressures if the values are recorded and the proper setting
bull Also ask how often the filters are changed and at what point drying agents are replaced Again this should be verified against the QAQC plan documentation
Check CO2 air cleaner
4332 Source Level Extractive Systems
Source level extractive systems transport the stack gas to the analyzer without dilution These systems also are described as direct extractive or non-dilution systems These systems may measure emissions on either a wet or dry basis Wet systems need to maintain the extracted sample at a temperature above the dew point of the sample to avoid condensation in the umbilical lines Therefore each component of the sampling and analysis system in a wet extractive system must be heated Dry systems require some sort of moisture removal either through condensation or permeation driers as well as heating of the components upstream of the moisture removal system The daily calibration error test may show problems related with the conditioning system (except for NOx systems as noted in Section 432)
In addition to observing a daily calibration error test ask the source representative to describe what maintenance is performed on the conditioning system and check that information against the maintenance log and QAQC plan You can also check the chiller temperature if water is removed by condensation and compare the temperature to the acceptable ranges in the QAQC plan These system checks are summarized in Table 4-5
Table 4-5Summary of Source Level Extractive System Checks
What to Check Description
Observe a daily calibration error test Ask the source to perform a test This can be initiated by the source representative from the analyzer or DAHS (See Section 42)
Check the umbilical lines entering the CEM shelter for condensation
Visual check as described earlier in Section 432 Are there water droplets visible in the line
For a dry system using chillers check the chiller temperature
Ask the CEMS operator what the proper temperature range is and how often it is verified pare against the QAQC plan
Check general conditioning system maintenance practices
Ask the source representative how the conditioning system is maintained re to the QAQC plan and check the maintenance records
Com
Compa
Page 66 Part 75 Field Audit Manual ndash July 16 2003
Section 4 On-Site CEMS Inspection
44 Gas Analyzers
Analyzers for extractive systems often are located in a CEM shelter and generally will be rack-mounted and connected to the conditioning system usually with a sample manifold Inshysitu analyzers are located on the stack or duct or in the annulus between the stack and stack liner
In checking the analyzers it is important that you first verify that each analyzer in use is the same as the one thatReminder - MDC Monitoring
Plan Report
A printout of the MDC monitoring plan report can be used as a convenient check off sheet when verifying the serial numbers of CEMS components
was previously certified or recertified Analyzers may have been changed without the notification and recertification required by Part 75 (Subpart C sect 7520(b)) As noted in previous sections it is important that the source certifies the equipment actually in use
Analyzer DisplaysAlarms
Displays and alarms will vary by analyzer model You should ask the plant contact what displays and alarms are in the model that the source uses and what they indicate The displays should show that the analyzer is operating properly An alarm light may show a potential or developing problem which should be addressed as described in the QAQC plan Ask the source when an alarm last occurred and what caused the alarm This information should be recorded in the maintenance log
Flow Rate
Check the sample flow rate to each analyzer It may be displayed digitally or by a rotameter The proper flow rates should be identified in the QAQC plan
Range Settings
Ask the source what the range settings are for each analyzer and how these settings are displayed Compare the settings to the monitoring plan (RT 530 Column 49) You should also check to see if the source has conducted an annual spanrange check as required by Part 75 Appendix A sect 21 The range may need to be changed if that setting is not representative of the concentrations being measured or if the stack concentrations have changed (such as a change in fuel supply or new control equipment) The rule requires that the evaluation of the MPC MEC span and range for each gas monitor be conducted at least once a year
Span versus Range Under Part 75
bull The span is the calculated quality-assured portion of a monitors measurement range
bull The span is equal to 10 to 125 times the Maximum Potential Concentration (MPC) or Maximum Potential Stack Gas Flow Rate (MPF)
bull The range is the actual setting of the monitor
bull The range is to be set so that the majority of readings fall between 20 to 80 of the range selected
Range is always gt Span
Part 75 Field Audit Manual ndash July 16 2003 Page 67
On-Site CEMS Inspection Section 4
Correction Factors
A correction factor may be applied to NOx analyzer data to account for NOx quenching effects Corrections may also be applied to moisture monitors The correction is applied to the analyzer data by the DAHS You should ask if there have been any correction factor changes since the last RATA Any change should be recorded in the maintenance record and the procedures for making the change in the QAQC plan Verify that a RATA has been performed following the change (see sect 7520(b))
Table 4-6Summary of Analyzer Checks
What to Check Description
Have analyzers been changed without the notification and recertification required by Part 75 (Subpart C sect 7520(b))
Ask the source if there have been any changes since the last audit or certificationrecertification Document the serial numbers and compare to those in the monitoring plan
Status of the control panel lights indicators and alarms Displays should show that the analyzer is on and operating properly
The displays will vary by analyzer so ask the source what the displays are and what they mean An alarm light could indicate a potential problem that needs to be addressed (check QAQC plan)
Check range setting and whether the source has performed the annual spanrange check required by Appendix A sect 21
Ask the operator what the range settings are and how they are displayed Compare the range setting to the value in the monitoring plan (RT 530) and the results of the recent spanrange check
Check the sample flow rate Compare the sample flow rate if displayed by a rotameter or a digital reading to the QAQC plan
Have there been any changes to correction factors (NOx quenching and moisture monitors) since the last RATA
Changes to the correction factors should be recorded in the maintenance log and the QAQC plan should outline the procedures for changing the correction factors A RATA should be performed following any change QA testing may also be required (see sect 7520(b))
45 Calibration Gases
Calibration gas cylinders are used for daily zero and span calibrations andor linearity checks You should spot check a number of the calibration gases to verify that the gases in use meet protocol gas requirements in Part 75 that the calibration gas concentrations meet Part 75 quality assurance test requirements and that the values are entered correctly in the DAHS You also can visually check the delivery system
Make a note of the cylinder gas numbers (an engraved ID number stamped on the cylinder) and check the gas certificate for each ID number for the following information (the certificate should be on the cylinder on file electronically or in hardcopy at the facility)
Page 68 Part 75 Field Audit Manual ndash July 16 2003
-- ----
Section 4 On-Site CEMS Inspection
Meets Calibration Gas Certification Requirements
Expiration Date Cylinder gases are not certified after the expiration date The use of an expired cylinder is not in compliance with sect 7521(c)
Check the type of gas certification Part 75 requires the use of a calibration gas as defined in sect 722 Table 4-7 below describes the types of permissible Part 75 calibration gases
Meets Gas Concentration Requirements
Check that the zero air calibration gas concentrations are certified by the supplier to meet the concentration limits in sect 722 (See Table 4-7) Zero air material is a calibration gas that may be used to zero an SO2 NOx or CO2 analyzer Zero air material has an effective concentration of 00 for the component being zeroed (SO2 NOx and Total Hydrocarbons 01 ppm CO 1 ppm or CO2 400 ppm) and is free of certain other interfering gaseous species A zero air cylinder containing a multi-component mixture should be certified that it meets the concentrations above and that other components do not interfere with the CEMS reading For more on zero air calibration gas or zero air materials see Questions 102 and 103 in the Parts 75 and 76 Policy Manual
Determine the cylinder gas concentration values and verify that the values are in the correct range for the instrument span You also should record the concentrations to make sure the values are consistent with the values entered into the DAHS for daily calibration error and linearity tests The ranges for the low medium and high linearity points are
Low level 20 - 30 of span Mid level 50 - 60 of span High level 80 - 100 of span
Part 75 Field Audit Manual ndash July 16 2003 Page 69
--
--
On-Site CEMS Inspection Section 4
Table 4-7Part 75 Calibration Gases (Appendix A sect 51)
Calibration Gas Type Acronym Description
NIST - standard reference material
SRM Calibration gas obtained from the National Institute of Standards and Technology (NIST)
NIST - standard reference material-equivalent compressed gas primary reference material
PRM Gas mixtures listed in a declaration of equivalence in accordance with section 212 of the EPA Traceability Protocol for Assay and Certification of Gaseous Calibration Standards September 1997 EPA-600R-97121 (EPA Traceability Protocol)
NIST - traceable reference material
NTRM Calibration gas mixture tested by and certified by NIST to have a certain specified concentration of gases
NISTEPA-approved certified reference materials
CRM Calibration gas mixture that has been approved by EPA and NIST as having specific known chemical or physical property values certified by a technically valid procedure as evidenced by a certificate or other documentation issued by a certifying standard-setting body
Gas manufacturers intermediate standard
GMIS Compressed gas calibration standard that has been assayed and certified by direct comparison to an SRM an SRM-equivalent PRM a CRM or a NTRM in accordance with section 2121 of the EPA Traceability Protocol
EPA protocol gas Vendor-certified to be within 20 percent of the concentration specified on the cylinder label (tag value) using the uncertainty calculation procedure in section 218 of the EPA Traceability Protocol
Zero air material Calibration gas certified by gas vendor SO2 NOx and Total Hydrocarbons 01 ppm CO 1 ppm or CO2 400 ppm If a mixture the other components are certified not to interfere with the CEM readings for the target compound
Research gas mixture RGM Calibration gas mixture developed by agreement of a requestor and NIST that NIST analyzes and certifies as NIST traceable
In addition to the certificates you should also check the calibration gas line pressure gauges to determine the cylinder gas pressure The cylinder should not be used if the cylinder gas pressure is below 150 psi (This requirement is in the EPA Traceability Protocol for Assay and Certification of Gaseous Calibration Standards sect 2164) You should check to see if the facility checks cylinder pressure as part of its QAQC plan At what point do they replace a calibration standard Also check the outlet regulator pressure or calibration gas flow rate to see if it matches the QA test procedures in the QAQC plan
Page 70 Part 75 Field Audit Manual ndash July 16 2003
Section 4 On-Site CEMS Inspection
Table 4-8Summary of Calibration Gas Checks
What to Check Description
Check the certificates for the expiration date of the cylinder gas
Gas cylinders may have expired dates Cylinder gases are not certified after expiration date and the use of an expired cylinders is not in compliance with sect 7521(c)
Check the calibration gas type (certified EPA Protocol or other)
Gas certifications must meet the definitions in sect722 Check the type of cylinder gas against the descriptions in Table 4-7 and sect 722
Check the zero air material documentation to ensure that it is properly certified
Calibration gas used to zero a gas analyzer See Table 4-7 for the zero air material concentrations defined in sect 722 (Also see Policy Manual questions 102 and 103)
Check the concentration values for each cylinder and that the cylinder calibration tags are withing the correct concentration range for the span
Linearity test point ranges are shown below Low level 20 - 30 of span Mid level 50 - 60 of span
High level 80 - 100 of span
Record the concentration values to check against the values recorded by the DAHS for calibration error and linearity tests
This check is to ensure that the proper cylinder gas concentration values have been entered into the DAHS for calculation of daily calibration error tests
Read the cylinder regulator pressure The cylinder should not be used if the cylinder gas pressure is below 150 psi (EPA Traceability Protocol for Assay and Certification of Gaseous Calibration Standards sect 2164)
Check the regulator outlet pressure The pressure or calibration gas flow rate should be set as specified in the QA test procedures in the QAQC plan
46 Flow Monitors
In addition to the daily calibration error tests (Section 42) and daily interference tests (Section 431) there are a number of other flow monitor issues you can investigate
Flow-to-Load
There is no equivalent to a linearity test for a flow CEMS In response EPA developed a quarterly comparison of flow CEMS data to unit load data Each quarter the source must conduct a comparison of the hourly flow and load data for any hour in which the unit load is within plusmn 10 of the average load during the most recent RATA As part of your pre-audit checks you should note whether the source conducted this test as required and whether the test was passed If there are issues with the test conducted at the facility go over those issues with the source representative while on site
Part 75 Field Audit Manual ndash July 16 2003 Page 71
On-Site CEMS Inspection Section 4
TemperaturePressure Monitoring
Check to see if there are monitors for stack temperature andor stack absolute pressure associated with the flow monitor Ask the source what type of QAQC procedures are followed for these monitors (what is checked and on what schedule) and if there have been any problems with these components You can compare to the QAQC plan or maintenance records
K-factors
A k-factor refers to a correction factor or polynomial coefficient used by the DAHS to correct the flow monitor measurement for flow variables not measured by the monitoring method as well as for measured changes in stack pressure and temperature The factors are set based on a pre-RATA test in which the source correlates the monitor measurement to the RATA flow reference method results
Changing the k-factors or polynomial coefficients does not require recertification but does require that a three load RATA be performed (sect 7520(b)) as a diagnostic test event You should ask when the last time the correction factors were changed and why and check that the RATA was performed The changes should be recorded in the maintenance log and a procedure outlined in the QAQC plan
DisplaysAlarms
As in the case of gas analyzers the displays and alarms will vary by manufacturer You should ask the plant contact what displays and alarms are in the model that the source uses and what they indicate Information on alarms and corrective action should be recorded in the maintenance log
SpanRange
Ask the source what the range settings are for the flow monitor and how these settings are displayed Compare the settings to the monitoring plan (RT 530 Column 49) You should also check to see if the source has conducted an annual spanrange check as required by Part 75 Appendix A sect 21 (See the spanrange discussion in Section 44)
Page 72 Part 75 Field Audit Manual ndash July 16 2003
Section 4 On-Site CEMS Inspection
Table 4-9Summary of Flow Monitor Checks
What to Check Description
Observe andor review daily calibration error test and interference test
See Sections 42 and 431
Review any issues observed in reported results of flow-to-load tests
See Appendix B sect 225 for requirements of flow-to-load tests Make sure the test was performed and that the results were properly calculated If the source is excluding hours from the analysis as allowed for in Appendix B check to see that the exclusions meet Part 75 criteria
Identify if temperature and stack pressure are monitored and what QAQC procedures apply
Temperature and pressure may be monitored in conjunction with the flow monitor Note the QA and preventive maintenance procedures and schedule Ask if there have been any problems and corrective actions Check the QAQC plan and maintenance records
Check if there have been any changes to k-factors and polynomial coefficients since the last RATA
Changes to the correction factors should be recorded in the maintenance log and the procedures for changing the correction factor outlined in the QAQC plan A three load RATA is required following any change to flow monitor k-factors (sect 7520(b))
Status of the control panel lights indicators and alarms Displays should show that the analyzer is on and operating properly
The displays will vary by analyzer so ask the source what the displays are and what they mean An alarm light could indicate a potential or developing problem that needs to be addressed (check the QAQC plan)
Check range setting and whether the source has performed the annual spanrange check required by Appendix A sect 21
Ask the operator what the range settings are and how they are displayed Compare the range setting to the value in the monitoring plan (RT 530) and the results of the recent spanrange check
47 DAHS
The data acquisition and handling system (DAHS) consists of all the hardware and software used to comply with Part 75 electronic recordkeeping and reporting requirements It is a critical component of the monitoring system as it converts the analyzer signal to reported emissions data The on-site audit of the DAHS focuses on data handling issues that can not be checked electronically These checks fall into three areas
DAHS certification and verification of missing data routines and emission calculations Changes in correction factors Manually entered data
Part 75 Field Audit Manual ndash July 16 2003 Page 73
On-Site CEMS Inspection Section 4
471 DAHS Certification and Verification Tests
As for other components of the plants CEMS make sure that the DAHS version in use has been previously certifiedrecertified by checking against the monitoring plan report you printed out from MDC
Also you should ask to see a copy of the DAHS missing data and formula verification test results Part 75 requires a verification test for the missing data routines and emission calculation formulas as part of the initial certification (sect 7520(c)(9)) and whenever the DAHS is replaced upgraded to support a new EDR version or when the missing data algorithm has been changed (diagnostic testing under sect 7563(a)(2)(iii))
The source is not required to submit the results of the verification tests and there are no MDC or ETS electronic checks of the routines The source is however required to keep these test results on-site and available for inspection so you should note that the tests have been performed and what the results were (including any vendor certification) The missing data routines may be verified either by performing tests using a checking software or by a certification by the DAHS software developer that the software package meets all of the missing data requirements of Part 75 Question 1496 in the Parts 75 and 76 Policy Manual provides more information on the verification testing requirements
472 Changes in Correction Factors
Previous sections on dilution extractive systems analyzers and flow monitors recommended that you investigate what types of correction factors if any are applied to raw data (eg pressuretemperature compensation molecular weight flow and moisture monitoring polynomials sonic velocity correction factors NOx quenching correction factors and dilution ratio settings) In addition you should ask how changes to these correction factors are entered into the DAHS As noted earlier changes to correction factors should be recorded in the maintenance log and the QAQC plan should outline the procedures for changing the correction factors (Appendix B sect 113) Diagnostic QA testing is required for many of these changes (see sect 7520(b))
473 Manually Entered Data
Part 75 requires that the DAHS automatically record all emissions data and the daily calibration error checks (Appendix A sect 4) There are a few exceptions which allow manual entry or editing of data which are shown in the text box Check how various types of data are entered manually by asking the source to explain their procedures and by reviewing the QAQC plan and the hardcopy supporting
Manual Data Entry Allowed by Part 75
bull Negative (lt 0) emission values bull Erroneous emission values (if significant
must be approved by EPA) bull SO2 concentration lt 20 ppm bull Reference method back-up data bull RATA reference method data and RATA
results bull Leak checks 7-day calibration error tests
and cycle time tests bull Operating data (load and time) bull Missing data periods bull Add-on control equipment operation
during missing data periods
For more information on manual entry or editing see Section IIC3 of the EDR v22 Reporting Instructions (August 2002)
Page 74 Part 75 Field Audit Manual ndash July 16 2003
Section 4 On-Site CEMS Inspection
information for the manually entered data A number of areas you may emphasize are described below
QA Tests
Ask the source how the QA test results (daily calibration error test linearity test and RATAs) are entered into the DAHS If you have not compared a RATA report from the MDC program to plant hardcopy RATA results in your pre-audit review ask for a hardcopy of the report and check that the dates and time relative accuracy and bias adjustment factors (BAF) match Also if you identified problems with QA test calculations go over how that data are entered into the DAHS as well as the applicable QAQC plan procedures For example the BAF may not have been applied correctly to the emission data The BAF should be applied starting with the hour following completion of the RATA
Missing Data
Ask how the source records and reviews missing data How do they check that the substitute values appear correct (eg do the substituted values appear to be correct in view of the percent monitor data availability (PMA) and the length of the missing data period do the substitute NOx and flow rate values change when the load range changes during a missing data period are maximum potential values substituted when the PMA drops below 800 percent) Compare the procedures described to those in the QAQC plan Pick out a recent missing data period (one you may have identified in your pre-audit review) and spot check the electronic data by comparing against supporting hardcopy documentation
Optional Missing Data Routines - Units with Add-on Control Equipment
If the source is using an optional missing data routine for units with add-on control equipment you also may need to review control device parameter monitoring records There are four missing data options for units with add-on controls three of which require parameter monitoring to demonstrate the level of control achieved during the missing data period (sect 7534)
You will first need to check the QAQC plan The facility must identify add-on SO2 or NOx control equipment parameters and acceptable ranges in the plan
sect 7534 Optional Missing Data Procedures for Units with Add-On
Control Equipment
(1) Standard Missing Data Routines with Parametric Supporting Data
(2) No Parameter Data (3) Parametric Missing Data Substitution
Method (4) Parameter Data Used to Support Use of
Maximum Controlled Emission Rate
if the source is using add-on control equipment missing data options (see Part 75 Appendix B sect 111) Ask the source for the parameter monitoring records for a number of missing data periods You may have identified specific missing data periods from your pre-audit preparation Compare the parameter data to the acceptable ranges in the QAQC plan and identify any periods when the parameter range is exceeded Check how the missing data period was then flagged in the DAHS (control operating properly or not operating properly)
Part 75 Field Audit Manual ndash July 16 2003 Page 75
On-Site CEMS Inspection Section 4
Table 4-10Summary of DAHS Checks
What to Check Description
Check that DAHS verification tests have been performed for the missing data routines and calculations
Check the DAHS against the monitoring plan Verification tests for missing data routines and emissions calculations are required for initial certification and if the DAHS is replaced or there have been changes to the software Verification test results for the missing data routines and emissions calculations are required to be kept on site by sectsect 7520(c)(9) and 7563(a)(2)(iii) A vendor certification that the software meets Part 75 requirements is sufficient for missing data routines
Ask the source what type of correction factors are applied to raw data and how they are entered into the DAHS Also ask if any changes have been made
Changes to correction factors should be recorded in the maintenance log and the QAQC plan should outline the procedures for changing the correction factors (Appendix B
sect 113) QA testing may also be required (see sect 7520(b))
Ask what data are entered manually and how Spot check the electronic data with the manual hardcopy
You want to make sure there is documentation supporting the data that is added manually to the DAHS and that QAQC plan procedures are followed Procedures for manually entering data should be documented in the QAQC plan
How are data for the daily calibration linearity and RATA tests recorded Review some recent records to verify that hardcopy and electronic data match
Compare a RATA or linearity report from the MDC program to the plant hardcopy Check that the dates and time relative accuracy (or linearity error) and bias adjustment factors (BAF) if applicable match
Review parameter monitoring records for units using the optional missing data procedures for add-on control equipment
The QAQC plan will identify control equipment parameters and acceptable ranges (Appendix B sect 111 and sect 7558(b)) Compare the control equipment parameters to the ranges for a missing data period
48 Maintenance Log and Daily Checklists Review
The maintenance logs should detail any maintenance performed on the system and should reference all preventive maintenance performed Appendix B Section 113 requires the facility to keep the following maintenance records
Date time and description of any testing adjustment repair replacement or preventive maintenance action performed on any monitoring system
Records of any corrective actions associated with a monitors outage period
Any adjustment that changes a systems ability to record and report emissions data must be recorded (eg changing of flow monitor or moisture monitoring system polynomial
Page 76 Part 75 Field Audit Manual ndash July 16 2003
Section 4 On-Site CEMS Inspection
coefficients K factors or mathematical algorithms changing of temperature and pressure coefficients and dilution ratio settings) and
A written explanation of the procedures used to make the adjustment(s)
During the inspection you should begin by asking the CEMS technicians to describe what goes wrong with equipment what breaks and what maintenance is required Ask how they knew something was wrong and what they did about it Also ask what QA tests were done to show that the problem was resolved Make sure you understand what they are saying as their terminology may not always match the Part 75 rule terminology For example the plant personnel may refer to a daily calibration error test as a system cal overboard cal or span check
Then check the maintenance log book to see how the information is recorded You should point out any entries that you do not understand and explain why you do not understand the entry Compare to the QAQC plan to determine whether the source is implementing the preventive maintenance procedures You should also review the maintenance log to identify recertification events and adjustments that have been made to the systems which could affect the monitored data The maintenance log may also provide another check on handling of missing data periods and it can verify that linearity tests and RATAs were performed on the dates identified in the EDR
Some checks may include
Do the log entries sufficiently describe the action taken Are the entries understandable
Does the log show maintenance checks at the frequency identified in the QAQC plan
Are there recurring failures or malfunctions recorded in the log
Are malfunctions resolved as specified in the QAQC plan Are calibration error tests or other required QA tests performed before the CEMS is returned to service
Do events in the maintenance log correspond to reported missing data periods in the quarterly reports
Are there repeated adjustments to the zero or span
Have system parts or components been replaced If so has the proper recertification or diagnostic testing been performed
Are corrective actions recorded for malfunctions or as a result of daily calibration error tests or other performance tests
Are the nameinitials of the person performing task or logging data provided (While this is not required it is important for the log entries to be traceable to the person who makes the entry so that further questions can be answered if needed)
Part 75 Field Audit Manual ndash July 16 2003 Page 77
On-Site CEMS Inspection Section 4
49 QAQC Plan Review
The QAQC plan has been referenced throughout the previous sections At a minimum a QAQC plan should describe the detailed procedures and operations for calibration error and linearity tests calibration and linearity adjustments preventive maintenance and any adjustments to the system spare parts list a troubleshooting matrix and recordkeeping and reporting For units with add-on SO2 or NOx emission controls the QAQC plan may also contain (for missing data purposes) add-on emission control parameters and the range for each parameter representative of the normal operating conditions Required elements in the QAQC plan are summarized in Table 4-11 You should note that Part 75 allows electronic storage of the information in the QAQC plan provided that the information can be made available in hardcopy upon request during an audit The plan may also reference manufacturers operating manuals
Reviewing QAQC plan information is an important aspect of the on-site inspection activities described throughout the previous sections A recommended approach to inspecting various aspects and components of a plants CEMS QA program is to
Ask the plant staff to explain how they operate the equipment and perform QA and maintenance activities
Observe and record your own observations of procedures plant documentation and equipment settings
Compare the QAQC plan description of the equipment settings monitoring operating procedures and QA test procedures to actual operations at the plant
You should note instances where actual plant operations are different from the operations described in the QAQC plan and ask for an explanation Determine and discuss whether the actual procedure or the QA plan procedures meet Part 75 requirements In some cases the actual operations may be appropriate but the QAQC plan may need to be updated Clearly you should also note areas where the actual operations and QAQC plan match but neither meet Part 75 requirements
In addition to examining specific elements of the QAQC plan where there are discrepancies or potential problems you may also do a general review of the QAQC plan to check that the plan covers the Part 75 elements as shown in Table 4-11 Particular areas to focus on are the QA test procedures CEMS adjustment procedures and preventive maintenance procedures
Page 78 Part 75 Field Audit Manual ndash July 16 2003
Section 4 On-Site CEMS Inspection
Table 4-11 Checks for QAQC Plan Elements
What to Check Part 75 Requirement
Is there a written QAQC plan (it may be stored electronically but Appendix B sect 1 should be available) and when was it last updated
Are calibration error test and linearity test procedures outlined in the plan
Appendix B sect 121
Are calibration and linearity test adjustment procedures outlined Appendix B sect 122
Are RATA test procedures provided Appendix B sect 123
Are emissions and QA test recordkeeping and reporting procedures including missing data procedures included
Appendix B sect 112
If using add-on control equipment missing data options are control equipment parameters identified
Appendix B sect 111
Are procedures for preventive maintenance and Part 75 recordkeepingreporting identified
Appendix B sectsect 111 and 2
Part 75 Field Audit Manual ndash July 16 2003 Page 79
On-Site CEMS Inspection Section 4
[This page intentionally left blank]
Page 80 Part 75 Field Audit Manual ndash July 16 2003
Section 5 CEMS Performance Test Observation
Section 5 covers how you should observe CEMS performance tests (linearity tests and RATAs) u will generally observe a performance test in conjunction with the on-site CEMS audit activities outlined in Section 4
Yo
51 Introduction
In addition to the basic step of observing a daily calibration error test (see Section 42) EPA encourages all States and Regional Offices to conduct level 2 audits that include a RATA or linearity test observation These performance tests are a critical element of the Part 75 QA program The RATA in particular serves as the primary measurement of CEMS accuracy The presence of an agency observer can serve as an effective tool for ensuring that the source carries out the testing properly and that the results of the tests provide a valid assessment of data quality
During the performance test observation you should document any deviations from the test protocol You should provide copies to the source to avoid misunderstandings about any decisions you may make The observer should notify the tester immediately if there is a question as to whether or not any test procedures comply with Part 75 requirements so that the tester can take corrective action and if necessary restart the testing
Once the performance test is started and until it is concluded the only adjustments that may be made to the monitor are routine calibration adjustments towards the calibration gas or reference signal value that are the result of a regularly scheduled calibration error test This is more likely to occur during a RATA than during a linearity test
The source can make non-routine calibration adjustments (done by physically adjusting the instrument response using analyzer controls) before the linearity or RATA and at other times provided the QAQC plan includes specific criteria for the adjustment A calibration error test must be performed following the adjustment (Part 75 Appendix B sect 213) You should note if any adjustments were made prior to the performance test and review plant maintenance records for documentation of the adjustment (Part 75 Appendix B sect 113)
Calibration error tests are often performed prior to a linearity test or RATA As discussed earlier with respect to monitor adjustments you should ask the source if a calibration error test was performed prior to the linearity or RATA to be observed what the results were and if any adjustments were made RATA and linearity tests should not be conducted on a system that is out-of-control with respect to the calibration error requirements
Appendix A contains observer checklists to assist you in observing the performance tests You should also be familiar with the Part 75 performance test requirements in Appendix A sectsect 62 and 65 and the Part 60 reference methods used in the RATAs
Part 75 Field Audit Manual ndash July 16 2003 Page 81
Performance Test Observation Section 5
52 Linearity Test
A linearity test for a gas CEMS is conducted by challenging the CEMS with three audit gases one having a value of 20 to 30 percent a monitors span the second a value of 50 to 60 percent of span and the third a value of 80 to 100 percent of span Flow and moisture monitors are not subject to the linearity test requirements and SO2 and NOx monitors with spans 30 ppm also are exempt The source must conduct a linearity test every quarter (although exceptions for low operating hours and grace periods may apply) For a dual range analyzer the test is performed for each range used during the applicable quarter
The CEM system is challenged three times with each audit gas The same gas concentration or level is not to be run twice in succession The audit gas is injected at the gas injection port required in Part 75 Appendix A sect 221
The response to the zero and upscale gases is not immediate but approaches an asymptotic value (See Illustration 5-1) It is important that sufficient time is allowed for the concentration reading to stabilize for each injection of gas Watch the analyzers instantaneous response to see if enough time is allowed to reach a stable fully equilibrated response The time should not exceed 15 minutes Pay the most attention to SO2 since it is the most adsorptive and absorptive (this will delay the equilibration time)
Illustration 5-1Asymptotic Calibration Check Response (Jahnke 1994)
Also note the time required compared to the gas injections for the daily calibration error tests Both times should be about the same If they are not ask the source why this is the case Record the analyzers stabilized response and compare to the value recorded by the DAHS The values should be the same The average CEMS response will be taken from the DAHS as the official component for recording the CEMS data These linearity test procedures and requirements are specified in detail in Part 75 Appendix A sect 62
Page 82 Part 75 Field Audit Manual ndash July 16 2003
Section 5 Performance Test Observation
Time Shared Systems
Time shared systems use the same gas analyzers for multiple emission units or time shared systems the 15 minute maximum cycle time requirement for the analyzer gas concentration to stabilize includes the cycle time of each probe location served by the system
F
Appendix A contains an observer checklist Inspect the cylinder gases as outlined in Section 4 record the linearity test results using the checklist and calculate the linearity result for each level Compare the results to the appropriate performance specification listed in Table 5-1
Table 5-1Linearity Test Specifications
Monitored Parameter
Linearity Test Performance Specification (Part 75 Appendix A sect 32)
SO2 or NOx 50 linearity error or
5 ppm absolute value of the difference between the average of the monitor response values and the average of the reference values R-A
CO2 or O2 50 linearity error for each calibration gas concentration or
05 absolute value of the difference between the average of the monitor response values and the average of the reference values R-A
53 Relative Accuracy Test Audit (RATA)
A Relative Accuracy Test Audit (RATA) compares a units CEMS measurements to that of reference method stack tests The reference method tests yield results representative of the pollutant concentration emission rate moisture temperature and flue gas flow rate from the unit The RATA compares these results directly to CEMS measurements The RATA test is the primary measurement of CEMS accuracy for a Part 75 CEMS
Part 75 requires semi-annual or
RATA Reference Materials
Reference Methods in Part 60 Appendix A are available at the Emission Measurement Center website wwwepagovttnemc
Answers to common Part 75 RATA questions are provided in the Parts 75 and 76 Policy Manual at wwwepagovairmarkets
annual RATAs depending on the relative accuracy achieved in the preceding RATA Most units qualify for the annual RATA frequency (Appendix B sect 2312)
Gas RATAs performed at single load levels are often conducted simultaneously and may take about 7 hours The flow RATAs may be conducted at one two or three loads A
Part 75 Field Audit Manual ndash July 16 2003 Page 83
Performance Test Observation Section 5
multi-load RATA may therefore be performed over 2 to 3 days with each load of the flow RATA taking about 3 to 5 hours One load of the flow RATA testing often is conducted at the same time as the gas RATAs Part 75 requires that each RATA be completed within 168 consecutive unit or stack operating hours For multi-load flow RATAs up to 720 consecutive unit or stack operating hours are allowed to complete the testing at all load levels (Part 75 Appendix A sect 65)
Flow RATAs are conducted at load levels in the range of operation that extends from the minimum safe stable load to the maximum sustainable load hree levels apply in this range
Low First 30 of range Mid gt 300 and 600 High gt 600 of range
T
You should ensure that the source performs the RATA according to Part 75 and reference method requirements RATA issues of specific importance to Part 75 requirements include
Unit operating conditions The RATA should be performed while the unit is burning a normal fuel listed in the monitoring plan (App A sect 65(a)) Gas RATAs should be performed at normal load Check the load against the monitoring plan normal load If you have questions about the normal load identified in the plan you may also check load against the most recent load data submitted in the EDR to verify that the current load designation is representative of the loads reported Flow RATAs for peaking units or bypass stacks can always be performed at one load For all other situations the RATA for initial certification or recertification of a flow monitor must be a 3-load test A 3-load flow RATA also is required at least once every 5 years as part of the ongoing QA requirements For units that must conduct a flow RATA on an annual basis the standard QA flow RATA is a 2-load test For units that must conduct a flow RATA on a semi-annual basis the source can alternate between a 1-load and a 2-load test Finally units that operate at 1-load consistently (at least 85 percent of the time) can qualify for 1-load testing instead of the 2-load test (see Part 75 Appendix B sect 2313(c))
Check if the source conducted a daily calibration error test on the CEMS prior to the testing or pre-RATA adjustments While Part 75 allows a source to make pre-RATA non-routine adjustments adjustments may not be made between runs at a load level or between load levels except for routine adjustments as a result of the calibration error test (Part 75 Appendix B sect 213)
Has the source performed and passed a stratification test Stratification testing is required for units wishing to use fewer traverse points under the alternatives allowed in Part 75 Appendix A sect 656(a) and (b) For details on stratification testing see Part 75 Appendix A sect 6561 - 6563
Rake probes should not be used as they do not distinctly capture the required traverse points to ensure that a representative stack sample is obtained for analysis See Policy Manual Question 839
Page 84 Part 75 Field Audit Manual ndash July 16 2003
Section 5 Performance Test Observation
Moisture measurements used to correct dry basis measurements in determining emission rate may not be made using the wet bulb-dry bulb technique Wet-bulb-dry bulb measurements however may be used to determine molecular weight See Policy Manual Question 310
EPA recently promulgated new flow reference methods (2F 2G and 2H) Part 75 sources had raised concerns that Method 2 measurements could be biased high in some situations due to stratified or non-parallel flow In response Method 2F measures yaw and pitch angle adjusted velocity 2G adjusts for yaw angle and 2H accounts for wall effects A detailed observer checklist is available for these methods at CAMDs website and you should refer to that observer checklist if you are observing a flow RATA using one of these new methods Also available for downloading from the website is software (FLOW-CALC) that you can use to enter the reference method data and calculate results See httpwwwepagovairmarketsmonitoringindexhtml
Check that the traverse point locations for the reference method tests meet the requirements of Appendix A sect 656 and the sampling location dimensions Gas tests should typically use at least 3 traverse points Check Performance Specification (PS) 2 in Part 60 Appendix B Units with wet scrubbers may use a shorter measurement line than required by PS 2 if minimal stratification is demonstrated and moisture and gas systems may use a single point if the stratification test is passed (Part 75 Appendix A sect 656) The minimum number of traverse points for a flow test is 12 unless also using Reference Method 2H which requires at least 16 points (Part 60 Appendix B) A source can use more than the minimum number of sample points
Check the reference method calibration gases used for instrumental test methods The calibration gas certificate should show EPA Protocol gases or other certified gases concentrations that match those used in the biasdrift check calculations and an expiration date after the RATA The regulator gauge should show a cylinder pressure gt 150 psi
Verify the relative accuracy and reference method calculations yourself by doing the calculations on site using the raw data You should also obtain a copy or record the results of the RATA testers calculations Make sure that the CEMS and reference method data are for the same runs
Observation forms for flow and gas RATAs are provided in Appendix A The forms have more detailed checks than provided here In addition as noted above an observer checklist for flow reference methods 2F 2G and 2H is available at CAMDs website
Part 75 Field Audit Manual ndash July 16 2003 Page 85
Performance Test Observation Section 5
RATA Reference Methods (Part 75 Appendix A sect 6510)
The following methods from Appendix A to Part 60 or their approved alternatives are the reference methods for performing relative accuracy test audits
bull Method 1 or 1A for determining the appropriate test locations
bull Method 2 or its allowable alternatives including in Appendix A to Part 60 (except for Methods 2B and 2E) for stack gas velocity and volumetric flow rate
bull Methods 3 3A or 3B for O2 or CO2
bull Method 4 for moisture
bull Methods 6 6A or 6C for SO2
bull Methods 7 7A 7C 7D or 7E for NOx excluding the exception in section 512 of Method 7E ing Method 7E for measuring NOx concentration total NOx both NO and NO2 must be measured ithstanding these requirements Method 20 may be used as the reference method for relative accuracy test audits of NOx
monitoring systems installed on combustion turbines
When usNotw
Page 86 Part 75 Field Audit Manual ndash July 16 2003
Section 6 On-Site Inspection of Appendix D and Appendix E Monitoring Systems
Section 6 focuses on the on-site review of fuel monitoring and operating records that are required for units that use the excepted monitoring provisions available to gas and oil fired units ecordkeeping The audit emphasis is on verifying r
Part 75 Appendix D provides an optional monitoring protocol that may be used by gas-or oil-fired units instead of SO2 and flow CEMS It includes procedures for measuring oil or gaseous fuel flow using a fuel flowmeter and procedures for conducting sampling and analysis to determine sulfur content density and gross calorific value (GCV) of fuel oil or gaseous fuels
Part 75 Appendix E is available to qualifying gas or oil fired peaking units as an optional NOx emissions rate estimation procedure that may be used instead of a NOx CEMS Baseline stack testing is performed at four operating levels to establish a NOx rate - heat input curve with NOx rate the dependent variable
61 QAQC Plan Review
The QAQC plan provides a template for performing a review of fuel monitoring and sampling records and is the place to start the field audit for the excepted monitoring provisions of Part 75 Appendices D and E As described in Section 49 you should determine whether the QAQC plan meets the requirements of Part 75 Appendix B and whether the facility is implementing the plan Checks of the QAQC plan and rule requirements for Part 75 Appendix D are identified in Table 6-1 and the checks for Part 75 Appendix E are in Table 6-2
Table 6-1Appendix D - QAQC Plan Review
What to Check Part 75 Requirements
Review the fuel sampling methods and analysis The QAQC plan should include standardprocedures Compare the sampling methods and sampling and analysis procedures used by thefrequencies to the rule requirements outlined in source or its fuel supplier (Appendix B sect 135) the sample Appendix D field audit sheets (seeAppendix A of this manual)
Are the fuel flow meter test procedures and the transducer or transmitter accuracy test procedures outlined in the plan sk the source how often (and how) the tests are performed and compare to the plan and Part 75 requirements
Test procedures are required in the QAQC plan (Appendix B sect 132)
A
(cont)
Part 75 Field Audit Manual ndash July 16 2003 Page 87
Appendix D and Appendix E Monitoring Section 6
Table 6-1Appendix D - QAQC Plan Review (cont)
What to Check Part 75 Requirements
Check the fuel flowmeter transducer or
transmitter calibration and maintenance records Records are required by the QAQC plan provisions in Appendix B sect 133 se records are to include adjustments maintenance or repairs performed on the fuel flowmeter monitoring system as well as records of the data and results for Appendix D fuel flowmeter accuracy tests and transducer accuracy tests
Tho
Table 6-2Appendix E - QAQC Plan Review
What to Check Part 75 Requirement (App B sect 136)
Check the recommended range of QAQC parameters and hourly records of these parameters Make sure the parameters are identified and recorded
The QAQC plan must identify recommended ranges of quality assurance- and quality control-related operating parameters that are recorded each hour There are to be at least 4 parameters for turbines or reciprocating engines and oxygen for boilers (Appendix E sect 232)
Request that the source identify any parameter deviations and ensure proper missing data procedures are used for those hours
The source is required to redetermine the Appendix E correlation if a single deviation period exceeds 16 operating hours
Check written Appendix E NOx emission rate
testing procedures This is another required component of the QAQC plan The procedures should match the test requirements in Appendix E sect 21
62 DAHS and Supporting Records
Elements of the data acquisition and handling system (DAHS) for an Appendix D or Appendix E monitoring systems should be checked in a manner similar to that described under the CEMS on-site inspection in Section 4 of this manual
The DAHS consists of all the hardware and software used to comply with all electronic recordkeeping and reporting requirements Make sure that the version used is previously certifiedrecertified by checking against the monitoring plan and ask to see and check the DAHS verification test for the missing data routines The source is not required to submit these results and there are no electronic checks of the routines Verification test results for the missing data routines are required by sectsect 7520(c)(9) and 7563(a)(2)(iii) The latest test should have occurred no earlier than when the unit began using EDR v21 (or v22 when applicable)
Page 88 Part 75 Field Audit Manual ndash July 16 2003
Section 6 Appendix D and Appendix E Monitoring
Additional checks are necessary to ensure that data entered manually into the DAHS match hardcopy supporting information Fuel sampling data (sulfur content density GCV) may be entered manually into the DAHS Ask the source how these data are entered You should also compare the electronic fuel data in the DAHS to the on-site hardcopy fuel sampling and analysis data to make sure they match The source may pull the electronic data up for you using the DAHS or you may use data that you printed out from MDC Hourly
You should also investigate how emissions data missing data periods and operating parameters are recorded If data are entered by hand you should similarly spot check the electronic data with the hardcopy For Appendix E units check to see that the results from the plants copy of the Appendix E NOx emission rate tests match the curve in the monitoring plan and DAHS This should include checks on the dates and times NOx load and fuel flow values You can use MDCs Appendix E test report function to review the electronic data You should also check the sources hardcopy capacity factor documentation against the capacity factor submitted in the EDR (see Record Type 507)
Table 6-3Summary of DAHS and Supporting Records Checks
What to Check How to Check
Check that the current DAHS version is certified and that a DAHS verification test was conducted for the missing data routines
Compare the DAHS to that identified in the monitoring plan Missing data routine verification test results are required by sectsect 7520(c)(9) and 7563(a)(2)(iii) The latest test should have occurred no earlier than when the unit began using EDR v21 (or v22 when applicable)
How is fuel sampling data (sulfur content density GCV) entered Do the data match the fuel analysis results
Ask the source to pull up the fuel data in the DAHS and compare to hardcopy fuel sampling and analysis data
How are emissions data missing data periods and operating parameters recorded
If the data are entered by hand spot check the data with the hardcopy
Does the hardcopy report of the Appendix E NOx
emission rate tests match the curve in the monitoring plan and DAHS
Compare the plants copy of the test report to the Appendix E test report from the MDC program Check that dates and times NOx load and fuel flow values match
63 Appendix D Fuel Flow Monitors
If practical visually check the fuel flow monitors to verify that the fuel flow monitors match those in the monitoring plan At a minimum the monitoring plan should at least show the flowmeter component type manufacturer modelversion and serial number Some units may also report each auxiliary component (pressure and temperature transducers and transmitters) in the monitoring plan
Part 75 Field Audit Manual ndash July 16 2003 Page 89
Appendix D and Appendix E Monitoring Section 6
64 Appendix D Fuel Flow Monitor Quality Assurance
Billing meters are exempt from QA accuracy testing and other quality assurance requirements (Part 75 Appendix D sect 214) You should first ask if the monitor is used for commercial billing and has been designated as such This should be identified in the monitoring plan If it is no further checks are necessary
641 QA Testing
After the initial certification tests fuel flow monitors are to be tested once every four fuel flowmeter QA operating quarters Extensions up to 20 operating quarters are available based on quarterly fuel flow-to-load test results For these QA tests make the following checks
Are quarterly fuel flow-to-load tests performed This test is optional Test results are reported in the EDR -- you may have reviewed the data prior to the visit using MDC Verify that on-site test results match those in the electronic report
Check fuel flow monitor accuracy test reports Compare the hardcopy accuracy test results against those reported electronically MDC can provide a copy of the electronic report You can also verify the calculations Ask the source for a copy of the report which should be in a format similar to Part 75 Appendix D Table D-1 or D-2
642 Maintenance and Inspection Records
The maintenance logs should detail any maintenance performed on the system and should reference all preventive maintenance performed During the inspection you should look at the maintenance log book which is required as part of the QAQC plan The maintenance conducted should match the maintenance procedures in the plan Also verify that there have been no changes to monitoring equipment without appropriate recertification testing See Section 48 for more discussion of maintenance logs
Page 90 Part 75 Field Audit Manual ndash July 16 2003
Section 7 Reporting Audit Results
Section 7 provides a brief overview of reporting results in the exit interview and audit report ould highlight issues suggesting data invalidity so that the source can take steps to minimize allowance penalties from missing data CAMD should receive prompt notice of issues that may affect the validity of mass emissions data
The interview sh
71 Exit Interview
You should conduct an informal summary of the audit findings (exit briefing) before you leave the facility You should discuss the audit findings with reference to specific regulatory requirements or in terms of potential problems Evidence should be available to support a finding or observation although you should raise any questions on a monitoring method or rule requirement If a source disputes a finding you should give it an opportunity to provide adequate alternate information Further investigation after the meeting may be required to achieve the resolution of questioned items In such cases you should table the discussion at the briefing
If you perform the audit periodically you should address any progress or lack thereof since the previous audit This is readily done by reviewing the findings of the last audit and noting how the issues have been resolved If there has been no progress the review should emphasize the ongoing problems and stress the need for immediate resolution
72 Audit Report
The audit report organizes and coordinates information gathered during the audit in a usable manner -- it is the compilation of factual information and professional judgment resulting from the audit The report also serves to record the procedures used in gathering the data and gives factual observations and evaluations from the audit Information in the report must be accurate relevant complete objective and clear You should avoid discussions of general topics and should link all compliance issues directly to regulatory requirements Include any follow-up actions in the audit report
You also should prepare a cover letter summarizing the audit results and follow-up activities Send the cover letter and audit report to the Designated Representative or the sources contact person and a copy to the EPA Regional andor State agencies The Clean Air Markets Division should receive a copy of the cover letter If any findings are likely to affect reported mass emissions used for allowance true-up activities notify CAMD immediately You should complete the audit report within one month following the audit while observations are still fresh and to provide a quick response to any problems Notify the source if the report is delayed
Part 75 Field Audit Manual ndash July 16 2003 Page 91
Reporting Audit Results Section 7
73 Follow-up Activities
The audit team should keep documentation of any outstanding issues from the audit A follow-up review should be scheduled within a reasonable time after the audit
Page 92 Part 75 Field Audit Manual ndash July 16 2003
Section 8 Conducting Level 3 Audits
Section 8 discusses issues that an agency should consider in developing a performance testing program (a Level 3 audit capability) es single gas challenges and linearity tests
This section emphasiz
81 Overview
This section focuses on issues that an agency should consider if it chooses to develop a Level 3 audit program that includes single gas challenges and linearity testing of gas CEMS The emphasis in this section is on the calibration gases and development of a testing program rather than on a step-by-step description of how to perform a test
Agencies that currently do not perform Level 3 performance tests may have in-house expertise and experience available in the agencys ambient air monitoring staff Single gas challenges and linearity testing of Part 75 gas CEMS require the same knowledge base as calibration testing of ambient gas monitors An agency can take advantage of this existing resource in developing a Level 3 program for Part 75 audits
82 Tri-Blend or Single Blend Gases
Part 75 affected sources commonly use multi-component calibration gases Multi-component gases provide cost savings over single component gases by reducing the number of cylinder gases and the equipment necessary for calibration tests These calibration gases also allow for calibrating analyzers simultaneously The tri-blend (or triple blend) contains SO2 NO and CO2 The SO2 and NO are at relatively low concentrations in the ppm range while the CO2
concentration is in the percent range The single component (or single blend) calibration gas consists of the target compound -- SO2 NO or CO2 -- blended with N2 or air Compared to a single blend a tri-blend replaces a portion of the N2 or air with CO2 (up to 20 percent by volume for high range testing)
Tri-blends with a CO2 concentration of 11 percent (representative of most stack conditions) are recommended for agency auditors CO2 concentrations representative of stack gas conditions will minimize molecular weight or interference effects described below that can occur if the CO2 concentration in the calibration gas is different from the stack gas
Molecular Weight Effects - Dilution Systems
CO2 weighs more than N2 or air so a tri-blend calibration gas containing CO2 will be heavier than a single blend calibration gas in which the balance is either N2 or air This will impact a single gas challenge or linearity test of dilution extractive systems if the inspector uses a single blend to conduct a test on units that normally use tri-blends for calibration and quality assurance The sample flow in a dilution extractive system is controlled by the critical orifice
Molecular Weight of Major Calibration Gas
Component Compounds
bull CO2 44 bull N2 28 bull Air 29
Part 75 Field Audit Manual ndash July 16 2003 Page 93
Single Gas Challenges and Linearity Tests Section 8
which is dependent on molecular weight Dilution extractive systems therefore will produce different test results depending on whether a single blend or tri-blend gas is used Your best approach to dealing with this issue is to use a tri-blend with CO2 concentrations representative of stack conditions Table 8-1 summarizes the effects of calibration gas blend molecular weights on dilution system emission measurements and QA testing measurements
Table 8-1Effects of Gas Blends on Dilution System Measurements
(from Table 3-2 in Jahnke 1994)
Activity Performed Calibration Gas Blend
Used Possible Resulting Measurement Biases
Emissions Measurements
CEM system calibrated with CO2 triple blend
Emission measurements bias minimized (because CO2 present in both flue gas and calibration gas)
CEM system calibrated with single blend (eg SO2 in nitrogen)
Emission measurements are biased (because CO2 is present in flue gas)
Calibration Error Test and Linearity Check
CEM system calibrated with single blend
Calibration error test conducted with CO2
triple blend will show a bias Linearity check conducted with CO2 triple blends will show bias
CEM system calibrated with CO2 triple blend
Calibration error test conducted with single blend will show a bias Linearity check conducted with single blends will show bias
CEM system calibrated with single blend
RATA conducted with Reference Method 6C calibrated with a CO2 triple blend will show bias
CEM system calibrated with CO2 triple blend
RATA conducted with Reference Method 6C calibrated with a single blend will show bias
RATA CEM system calibrated with a single blend
RATA conducted with Reference Method 6C calibrated with a single blend will minimize bias
CEM system calibrated with CO2 triple blend
RATA conducted with Reference Method 6C calibrated with a CO2 triple blend will minimize bias
Interference Effects
CO2 can interfere with chemiluminescent NOX monitors (quenching) and cause a negative error in the NOx emission measurement If the auditor uses a NO single blend calibration gas without CO2 the result reported by the DAHS will be higher than the calibration gas concentration as the CEMS results are corrected to account for the CO2 concentration in
Page 94 Part 75 Field Audit Manual ndash July 16 2003
Section 8 Single Gas Challenges and Linearity Tests
the stack gas As in the case of molecular weight effects using a tri-blend with CO2
concentrations representative of stack conditions will minimize this problem
83 Hands Off Policy
EPAs hands off approach discussed in Section 141 also applies to conducting a single gas challenge or linearity test You do not need to physically handle a facilitys CEMS hardware You should ask qualified plant personnel to perform any actions with the CEMS equipment This includes connecting cylinder gases to the plant calibration gas manifolds or your gas delivery line to the CEMS calibration gas injection point and obtaining results from the DAHS
84 Test PlanProcedures
The agency should prepare standard operating procedures for performing the single gas challenge or linearity test A general outline of items to cover is provided in Table 8-2 A sample procedure for linearity testing is provided in Appendix A of this manual
Table 8-2Elements of a Standard Operating Procedure for Performance Testing
Procedure Element DescriptionPurpose
Pre-Test Survey Contact the source to schedule the test verify CEMS calibration information and review test logistics
Pre-Test Equipment Preparations Select and prepare test equipment
Pre-Test Meeting Plant meeting the day of the test Review of test procedures and any special circumstances
Equipment Set-up Outline of steps to set up the test equipment
Test Procedure Step by step procedures for the test itself including calculations
Pack-up Procedure Description of equipment breakdown after the test is completed
Post-Test Meeting Provide source with the test results
85 Single Gas Challenge
The single gas challenge uses one protocol gas to challenge the CEMS at one point in the measurement range It has a logistical advantage over performing a linearity test One trishyblend gas cylinder can cover CO2 SO2 and NOx and there is no need for a manifold or trailer The disadvantage is that only one point in the measurement range is tested EPA recommends that if a single gas challenge is performed a mid level gas be selected (~ 40 - 60 percent of span) Have the source perform a daily calibration error test so that the full scale can be evaluated This approach minimizes the resources required but most closely approximates a full linearity test
Part 75 Field Audit Manual ndash July 16 2003 Page 95
Single Gas Challenges and Linearity Tests Section 8
When you perform the single gas challenge connect your calibration gas cylinder to the sources calibration gas manifold ep in mind the hands off policy ould perform three runs For each run
Inject gas wait for the response to fully stabilize and record value from the DAHS and
Allow system to sample stack gas and equilibrate before the next run
Based on this test the percent error is calculated in the same manner as the linearity error
where
LE = Percent linearity error R = Reference value of calibration gas A = Average of monitoring system responses
86 Linearity Test
Linearity test procedures and requirements are outlined in Part 75 Appendix A sect 62 There are two approaches your agency might take with regards to the logistics of on-site linearity testing rst approach is similar to the single gas challenge in that you bring your own calibration gases to the site and have the source connect each of your three cylinder gases (low mid and high) to the plant calibration gas manifold ach is to provide your own gas delivery manifold set-up with your cylinders in a truck or trailer and have the source attach your gas delivery line to the CEMS injection point
You will challenge the CEMS three times with each audit gas s injected at the gas injection port required in Part 75 Appendix A sect 221 e same gas concentration or level is not used twice in succession Sufficient time should be allowed for the concentration reading to stabilize for each gas injection he average CEMS response will be taken from the DAHS as the official component for recording the CEMS data You then calculate the percent error using the same equation identified in Section 85 above
87 Calibration Gases
As noted earlier a tri-blend gas containing SO2 NOx and 11 percent CO2 is recommended for agency audits of SO2 and NOx monitors The number of different calibration gases that your agency will need is dependent on the spans of the CEMS installed on units in your area At least three audit gases will be needed to conduct the linearity test at a unit ne having a value 20 to 30 percent of span the second with a value of 50 to 60 percent of span and the third with a value of 80 to 100 percent of span Review the monitoring plans for the units in your area to identify which gases you will need gency should develop a standard operating procedure for maintaining the calibration gas inventory
Ke You sh
The fi
The other appro
The audit gas iTh
T
o
Your a
Page 96 Part 75 Field Audit Manual ndash July 16 2003
Section 8 Single Gas Challenges and Linearity Tests
88 Training
Table 8-3 lists available EPA training courses pertaining to gas CEMS and analyzer calibration Two of the courses APTI 435 and APTI 464 are geared to operating an ambient monitoring system but include instructions on how to calibrate gas analyzers that are directly applicable to performing a single gas challenge or linearity test on a Part 75 gas CEMS
Table 8-3Available EPA Training Courses
EPA Course Number
Course Title
APTI 435 Atmospheric Sampling
APTI 464 Analytical Methods for Air Quality Standards
APTI 450 Source Sampling for Pollutants
APTI 474 Continuous Emission Monitoring
SI 476B Continuous Emission Monitoring Systems Operation and Maintenance of Gas Monitors
Part 75 Field Audit Manual ndash July 16 2003 Page 97
- Page 1
- Page 2
- Page 3
- Page 4
- Page 5
- Page 6
- Page 7
- Page 8
- Page 9
- Page 10
- Page 11
- Page 12
- Page 13
- Page 14
- Page 15
- Page 16
- Page 17
- Page 18
- Page 19
- Page 20
- Page 21
- Page 22
- Page 23
- Page 24
- Page 25
- Page 26
- Page 27
- Page 28
- Page 29
- Page 30
- Page 31
- Page 32
- Page 33
- Page 34
- Page 35
- Page 36
- Page 37
- Page 38
- Page 39
- Page 40
- Page 41
- Page 42
- Page 43
- Page 44
- Page 45
- Page 46
- Page 47
- Page 48
- Page 49
- Page 50
- Page 51
- Page 52
- Page 53
- Page 54
- Page 55
- Page 56
- Page 57
- Page 58
- Page 59
- Page 60
- Page 61
- Page 62
- Page 63
- Page 64
- Page 65
- Page 66
- Page 67
- Page 68
- Page 69
- Page 70
- Page 71
- Page 72
- Page 73
- Page 74
- Page 75
- Page 76
- Page 77
- Page 78
- Page 79
- Page 80
- Page 81
- Page 82
- Page 83
- Page 84
- Page 85
- Page 86
- Page 87
- Page 88
- Page 89
- Page 90
- Page 91
- Page 92
- Page 93
- Page 94
- Page 95
- Page 96
- Page 97
- Page 98
- Page 99
- Page 100
- Page 101
- Page 102
- Page 103
- Page 104
- Page 105
- Page 106
- Page 107
-
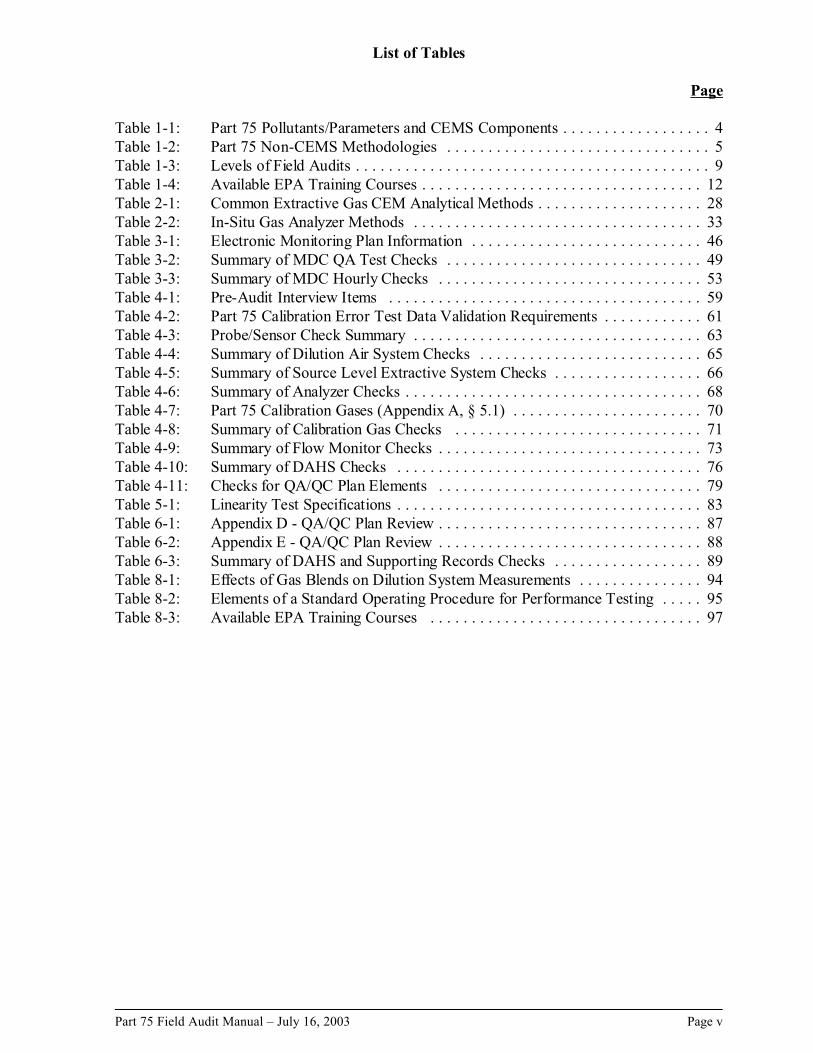