part 4 wind, waves, and water mixing in lakes - wind, waves, and... · wind, waves, and water...
TRANSCRIPT
downwind shore, so that the water level is actuallyhigher on one side of the lake than another —usually by a fraction of an inch, but sometimesmuch more in a large lake.
An extreme example of this dynamic wasseen in 1928 when hurricane winds piled waterupon Lake Okeechobee’s northern shore, causingthe city of Lake Okeechobee to flood. As waterpiled up along the north shore of the lake, watersreceded substantially along the southern shore-line. Hours later, when the hurricane force windschanged direction, lake waters then returned tothe southern shore and caused massive floodingthere as well, resulting in hundreds of deaths.This single event prompted the call for theconstruction of what is now known as theHoover Dike.
Under normal conditions however, thedifference in water elevation across a lake isminimal — just enough to generate water currents.These currents move water back to the other sideof the lake to even out the elevation difference.Sometimes the currents flow along the shore,but often the water flows as a return currentbelow the surface of the lake. Thus the wind maybe moving a surface layer of water in one direc-tion and the return current moves a layer of waterin the opposite direction. (Anglers sometimesnotice that the direction of the current changes asthey lower their baited hook down through thewater column.)
TurbulenceIn most lake currents, the water does not flow
smoothly, but rather tends to move in a more
Part 4
Wind, Waves,and Water MixingIn Lakes
ow that we’ve been introduced to someof the basic concepts and terminologyrelated to lake morphometry, we can turn
our attention toward a dynamic that is extremelyimportant to lake management and yet oftenoverlooked: wind mixing (a.k.a. water mixing) inlakes.
In the following pages, we’ll explore theinfluence that wind and waves can have on themovement and/or mixing of water within a lake,as well as the role that lake morphometry plays.
WindAs any boater soon learns while navigating
across open water, there is a strong correlationbetween wind and waves (i.e., the stronger thewind, the larger the waves). However, asidefrom wave activity on the surface, there are othertypes of water movement occurring below thewaves that we never see. For instance, underwatercurrents tend to move water particles horizontallythrough the water column. At the same time,water particles are also being distributed in anirregular swirling motion known as turbulence.It works like this:
CurrentsWinds blowing across the surface of a lake
interact with lake water and cause the water tomove in a downward direction. The resultingwater currents can move across the lake with thewind, or they can move along the shore when thewinds approach the shoreline at an angle.
If the wind blows from one direction for awhile, it can cause the water to pile up along the
20
N
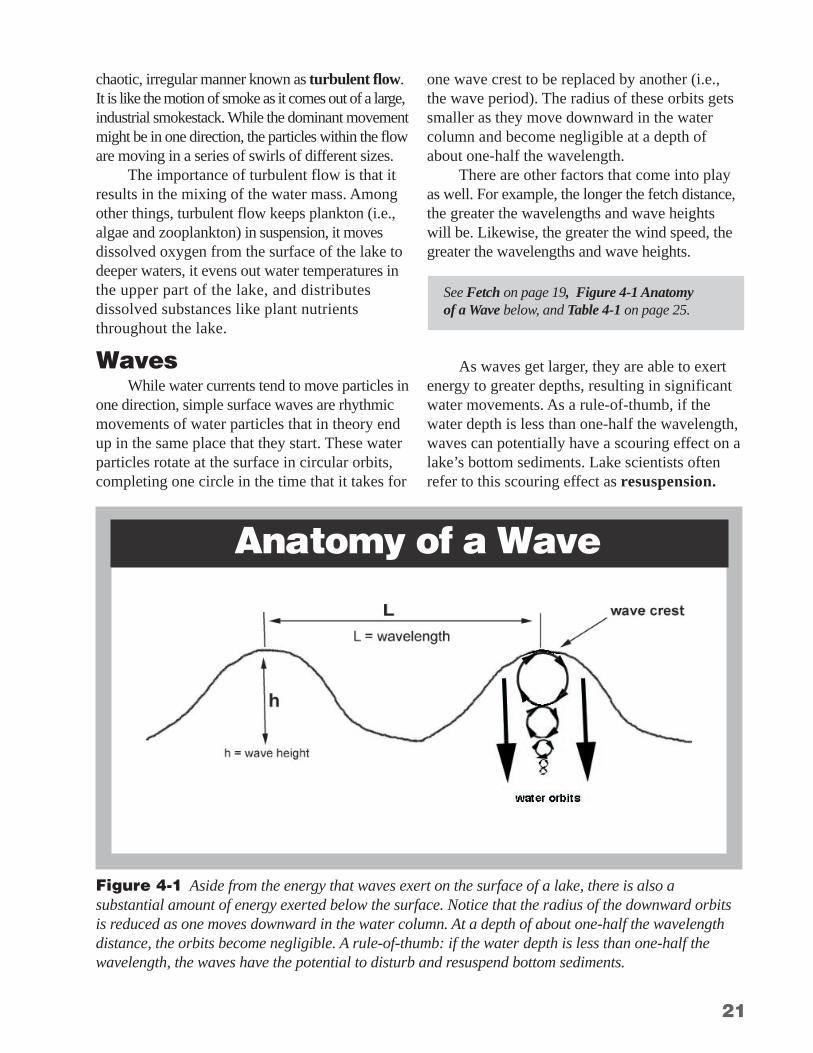
one wave crest to be replaced by another (i.e.,the wave period). The radius of these orbits getssmaller as they move downward in the watercolumn and become negligible at a depth ofabout one-half the wavelength.
There are other factors that come into playas well. For example, the longer the fetch distance,the greater the wavelengths and wave heightswill be. Likewise, the greater the wind speed, thegreater the wavelengths and wave heights.
As waves get larger, they are able to exertenergy to greater depths, resulting in significantwater movements. As a rule-of-thumb, if thewater depth is less than one-half the wavelength,waves can potentially have a scouring effect on alake’s bottom sediments. Lake scientists oftenrefer to this scouring effect as resuspension.
21
Anatomy of a Wave
chaotic, irregular manner known as turbulent flow .It is like the motion of smoke as it comes out of a large,industrial smokestack. While the dominant movementmight be in one direction, the particles within the floware moving in a series of swirls of different sizes.
The importance of turbulent flow is that itresults in the mixing of the water mass. Amongother things, turbulent flow keeps plankton (i.e.,algae and zooplankton) in suspension, it movesdissolved oxygen from the surface of the lake todeeper waters, it evens out water temperatures inthe upper part of the lake, and distributesdissolved substances like plant nutrientsthroughout the lake.
WavesWhile water currents tend to move particles in
one direction, simple surface waves are rhythmicmovements of water particles that in theory endup in the same place that they start. These waterparticles rotate at the surface in circular orbits,completing one circle in the time that it takes for
See Fetch on page 19, Figure 4-1 Anatomyof a Wave below, and Table 4-1 on page 25.
Figure 4-1 Aside from the energy that waves exert on the surface of a lake, there is also asubstantial amount of energy exerted below the surface. Notice that the radius of the downward orbitsis reduced as one moves downward in the water column. At a depth of about one-half the wavelengthdistance, the orbits become negligible. A rule-of-thumb: if the water depth is less than one-half thewavelength, the waves have the potential to disturb and resuspend bottom sediments.

Water temperature changesIn shallow lakes, water movements can keep
the temperature uniform from the surface of the laketo the bottom. In deep lakes, warm water will floaton top of the cold water isolating deeper watersfrom the atmosphere — its major source of oxygen(i.e., stratification). This can have a detrimental affecton fish by reducing the availability of oxygen,particularly after a sudden thunderstorm.
Nutrient transport within the watercolumn
Nutrients are distributed vertically by turbu-lence in much the same way that oxygen andwater temperatures are mixed. This can facilitatethe recycling of nutrients from the sediments anddeeper waters and, in some instances, result in anincrease in biological productivity.
Disruption of bottom sedimentsSeveral studies have shown that the
resuspension of sediments by wind-driven wavescan play a significant role in affecting waterquality in large shallow lakes — particularly inFlorida where shallow lakes are abundant.
Water quality problems caused bysediment resuspension
♦ Resuspended sediments increase the turbidityof the water and reduce light penetration. Thisreduces the depth at which algae and aquaticplants can grow in a lake.
♦ Nutrients stored in bottom sediments are oftenintroduced back into the water column resultingin an increase in the growth of algae. This mayor may not be desirable, depending on theintended use of the lake.
♦ In some shallow lakes, there is a layer of algaethat grows on the surface of the sediments. Thesealgae are resuspended along with the sedimentsduring strong wind events and can result in significantincreases in the amount of algae in the lake water.
♦ The resuspension process, along with theeffects of the waves themselves, can form a layerof fluid-like sediments on the lake bed that is toounstable to allow for the rooting of aquatic plants.This can prevent the reestablishment of aquaticplants in a lake that previously had plants.
22
Water MixingScientists are particularly interested in the
energy that waves set in motion below the surfacebecause they know that this type of water movementor water mixing has the potential to influenceone or more of the following processes:
Oxygen in the water columnTurbulent water movements that are generated by
waves assist the movement of oxygen from the air intothe water. In fact, this is one of the main sources ofoxygen in lakes. As mentioned earlier, it can help tomove oxygen from surface waters to deeper waters.
It should be mentioned however, that evenwith the help of turbulent water movements distrib-uting oxygen from the air, there are times when therespiration of organisms within a lake (i.e., bacteria,macrophytes, and animals) can consume so muchoxygen that a fish kill can occur. This is commonafter several consecutive calm cloudy days whenthe loss of sunlight prevents algae and macrophytesfrom making their usual contribution of oxygen tothe water column, via photosynthesis.
Based on the dynamics just described, it ispossible to use standard engineering equations tocalculate the sizes of surface waves for variouscombinations of wind speed and fetch. Once thesize of a wave is known, one can then use theone-half wavelength rule mentioned earlier todetermine the depths at which waves can be expectedto disturb or resuspend fine bottom sediments in alake. We have provided this information for quickreference in the Table 4-1 on page 25.
Note: The possibility for resuspension also dependsupon the characteristics of the sediments and theroughness of the bottom. For instance, heavy particleslike sand are less likely to be resuspended than aresmaller particles like silts and clays.
Joe
Ric
hard
23
Interaction betweenlake morphometry andbottom sediments
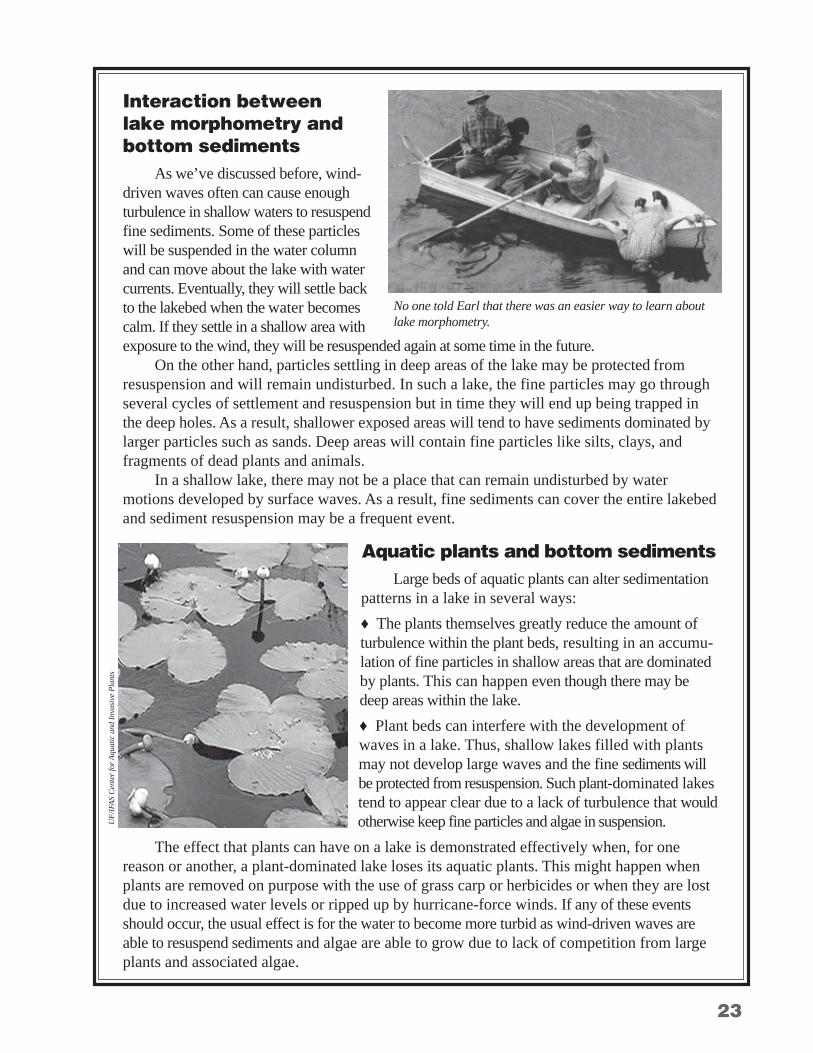
As we’ve discussed before, wind-driven waves often can cause enoughturbulence in shallow waters to resuspendfine sediments. Some of these particleswill be suspended in the water columnand can move about the lake with watercurrents. Eventually, they will settle backto the lakebed when the water becomescalm. If they settle in a shallow area withexposure to the wind, they will be resuspended again at some time in the future.
On the other hand, particles settling in deep areas of the lake may be protected fromresuspension and will remain undisturbed. In such a lake, the fine particles may go throughseveral cycles of settlement and resuspension but in time they will end up being trapped inthe deep holes. As a result, shallower exposed areas will tend to have sediments dominated bylarger particles such as sands. Deep areas will contain fine particles like silts, clays, andfragments of dead plants and animals.
In a shallow lake, there may not be a place that can remain undisturbed by watermotions developed by surface waves. As a result, fine sediments can cover the entire lakebedand sediment resuspension may be a frequent event.
Aquatic plants and bottom sedimentsLarge beds of aquatic plants can alter sedimentation
patterns in a lake in several ways:
♦ The plants themselves greatly reduce the amount ofturbulence within the plant beds, resulting in an accumu-lation of fine particles in shallow areas that are dominatedby plants. This can happen even though there may bedeep areas within the lake.
♦ Plant beds can interfere with the development ofwaves in a lake. Thus, shallow lakes filled with plantsmay not develop large waves and the fine sediments willbe protected from resuspension. Such plant-dominated lakestend to appear clear due to a lack of turbulence that wouldotherwise keep fine particles and algae in suspension.
The effect that plants can have on a lake is demonstrated effectively when, for onereason or another, a plant-dominated lake loses its aquatic plants. This might happen whenplants are removed on purpose with the use of grass carp or herbicides or when they are lostdue to increased water levels or ripped up by hurricane-force winds. If any of these eventsshould occur, the usual effect is for the water to become more turbid as wind-driven waves areable to resuspend sediments and algae are able to grow due to lack of competition from largeplants and associated algae.
No one told Earl that there was an easier way to learn aboutlake morphometry.
UF
/IFA
S C
ente
r fo
r A
quatic
and In
vasi
ve P
lants

24
How can we estimate iflake bottom sediments aresubject to resuspension?
1If we want to know if a particular spot ina lake is subject to resuspension, we can
use the information provided in Table 4-1.First, we would use a map to find the fetches
in all directions and then find the maximum fetch.Suppose the fetch was 10,000 feet in the northdirection. If we look to see the effect of a 10 mileper hour (mph) wind from the north for thatfetch in Table 4-1, we see that we might expectmixing to a depth of 6.0 feet. In other words, ifthe water depth at that point were 6 feet or lessand the sediments were of a fine consistency, wemight expect some of the sediments to be resus-pended. If the wind were say 25 mph, the tableshows a mixing depth of about 16 feet.
Note: These calculations assume that thereare no beds of aquatic plants along the fetch thatmight reduce the buildup of waves.
See Fetch on page 19, Table 4-1 on page 25 andFigure 4-1 Anatomy of a Wave on page 21.
2 If we are interested in knowing how often sediments might be disturbed at
one particular spot in a lake, we could startby finding the fetches for the four majorcompass directions.
If we know the depth of the water for thatone location, we can estimate the minimumwind velocity from each direction that couldcause sediments to be disturbed. For example,suppose our location on the lake was six feetdeep and the east fetch was 8000 feet. FromTable 4-1 we can see that a wind between 10and 12 mph (11 mph would be pretty close)would produce waves sufficient to disturb thebottom at 6 feet.
Our next step would be to use wind recordsfrom a nearby recording station (i.e., an airport)to determine how often we could expect aneasterly wind to exceed 11 mph. For example, ifan east wind blew 11 mph or more for 2% of thetime, then we would expect east winds to disturb
the bottom 2% of the time.We could then make the same calculations
for winds from a north, south, and west direction.By adding all of these individual percentagestogether, we can obtain the per cent of time thatwe would expect winds to disturb the sedimentsat that point on the lake.
3We can compare lakes for their extent ofwave disturbance by looking at several
points within a lake.For example, as shown in Figure 4-2 on
page 26, we made the above calculations forseveral points within two Florida lakes.
However, instead of using a table like theone in Table 4-1 we used engineering equationsdirectly to find the minimum velocities. Also,instead of using the four basic wind directionsmentioned earlier, we used 36 different winddirections to calculate the per cent of time thatwe would expect lake sediments to be disturbedby wind-driven waves.
The lakes used for our comparison in Figure4-2 were chosen because they are so differentfrom one another: one lake being large andshallow (Lake Istokpoga) and the other relativelysmaller and deeper (Lake Thonotosassa). Noticethat in Lake Istokpoga every single point on thelakebed is frequently disturbed by the waves (i.e.,every number is greater than 0). In contrast, LakeThonotosassa has a large area with no sedimentdisturbance (i.e., numbers are 0 or less than 1).
4 Another way to make comparisons between lakes is to summarize the
calculated percents for all points in a lake.For instance, we could determine what percent
of the points or lake locations were disturbed 90%of the time or more, followed by the percent ofpoints that were disturbed 80% of the time ormore, and so on down to the percent of pointsdisturbed 0% of the time or more.
These numbers can then be plotted on a graph,with percent of time on the horizontal axis andpercent of the lake area on the vertical axis as wedid in Figure 4-3 on page 27.
We can use the same approach to makecomparisons of different water levels within anindividual lake. For instance, the graph shown
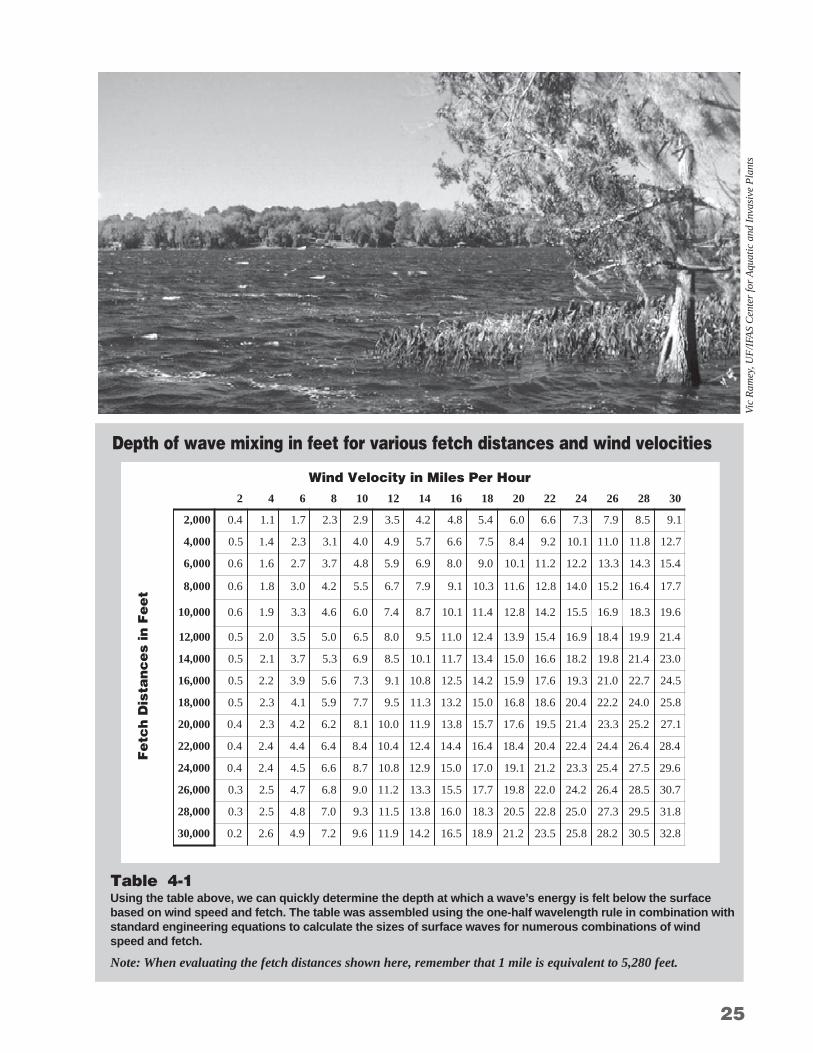
Depth of wave mixing in feet for various fetch distances and wind velocities
Table 4-1Using the table above, we can quickly determine the depth at which a wave’s energy is felt below the surfacebased on wind speed and fetch. The table was assembled using the one-half wavelength rule in combination withstandard engineering equations to calculate the sizes of surface waves for numerous combinations of windspeed and fetch.
Note: When evaluating the fetch distances shown here, remember that 1 mile is equivalent to 5,280 feet.
Vic
Ra
me
y, U
F/I
FAS
Ce
nte
r fo
r A
qu
atic
an
d I
nva
sive
Pla
nts
25
2 4 6 8 01 21 41 61 81 02 22 42 62 82 03
000,2 4.0 1.1 7.1 3.2 9.2 5.3 2.4 8.4 4.5 0.6 6.6 3.7 9.7 5.8 1.9
000,4 5.0 4.1 3.2 1.3 0.4 9.4 7.5 6.6 5.7 4.8 2.9 1.01 0.11 8.11 7.21
000,6 6.0 6.1 7.2 7.3 8.4 9.5 9.6 0.8 0.9 1.01 2.11 2.21 3.31 3.41 4.51
000,8 6.0 8.1 0.3 2.4 5.5 7.6 9.7 1.9 3.01 6.11 8.21 0.41 2.51 4.61 7.71
000,01 6.0 9.1 3.3 6.4 0.6 4.7 7.8 1.01 4.11 8.21 2.41 5.51 9.61 3.81 6.91
000,21 5.0 0.2 5.3 0.5 5.6 0.8 5.9 0.11 4.21 9.31 4.51 9.61 4.81 9.91 4.12
000,41 5.0 1.2 7.3 3.5 9.6 5.8 1.01 7.11 4.31 0.51 6.61 2.81 8.91 4.12 0.32
000,61 5.0 2.2 9.3 6.5 3.7 1.9 8.01 5.21 2.41 9.51 6.71 3.91 0.12 7.22 5.42
000,81 5.0 3.2 1.4 9.5 7.7 5.9 3.11 2.31 0.51 8.61 6.81 4.02 2.22 0.42 8.52
000,02 4.0 3.2 2.4 2.6 1.8 0.01 9.11 8.31 7.51 6.71 5.91 4.12 3.32 2.52 1.72
000,22 4.0 4.2 4.4 4.6 4.8 4.01 4.21 4.41 4.61 4.81 4.02 4.22 4.42 4.62 4.82
000,42 4.0 4.2 5.4 6.6 7.8 8.01 9.21 0.51 0.71 1.91 2.12 3.32 4.52 5.72 6.92
000,62 3.0 5.2 7.4 8.6 0.9 2.11 3.31 5.51 7.71 8.91 0.22 2.42 4.62 5.82 7.03
000,82 3.0 5.2 8.4 0.7 3.9 5.11 8.31 0.61 3.81 5.02 8.22 0.52 3.72 5.92 8.13
000,03 2.0 6.2 9.4 2.7 6.9 9.11 2.41 5.61 9.81 2.12 5.32 8.52 2.82 5.03 8.23
Wind Velocity in Miles Per Hour
Fetc
h D
ista
nces
in F
eet
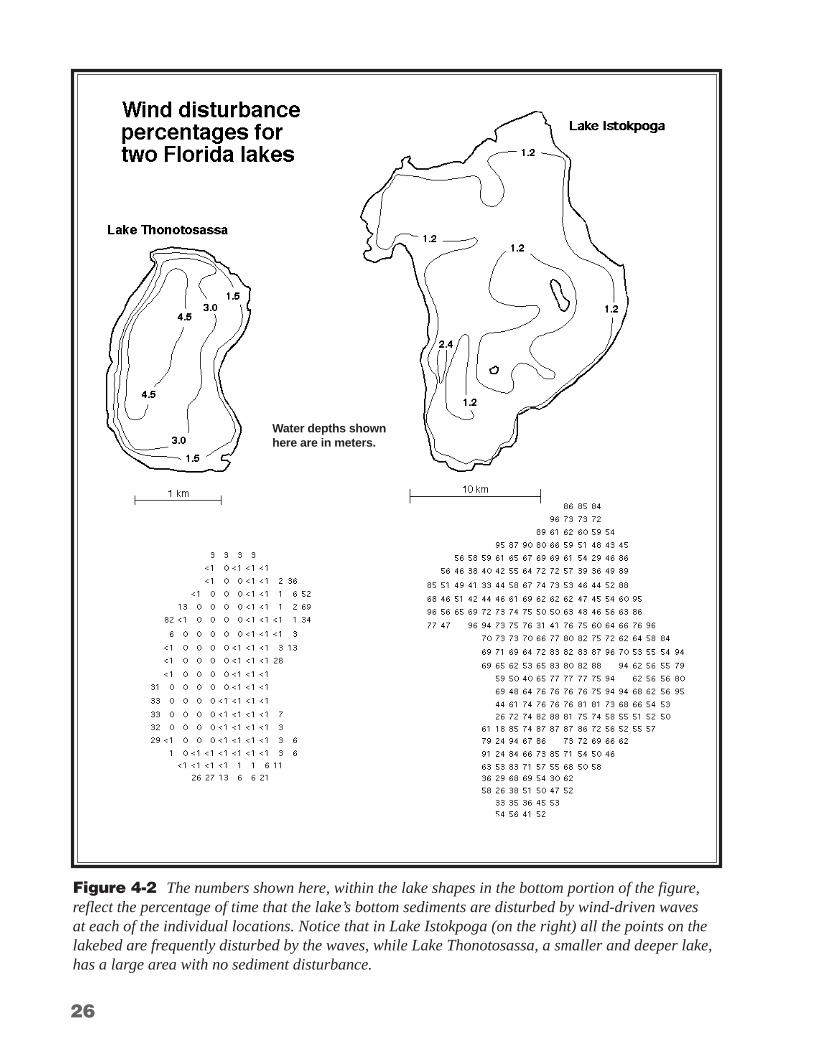
Figure 4-2 The numbers shown here, within the lake shapes in the bottom portion of the figure,reflect the percentage of time that the lake’s bottom sediments are disturbed by wind-driven wavesat each of the individual locations. Notice that in Lake Istokpoga (on the right) all the points on thelakebed are frequently disturbed by the waves, while Lake Thonotosassa, a smaller and deeper lake,has a large area with no sediment disturbance.
26
Water depths shownhere are in meters.

27
5 There is a shortcut method for estimating the impact of wave mixing on a whole lake.First, we divide the square root of the lake
area in units of square kilometers, by lake meandepth in meters. The resulting number is called adynamic ratio and was originally developed by alake scientist named Lars Håkanson for adifferent purpose. However, a recent study ofFlorida lakes found a relationship between thedynamic ratio and the percent of the lakebed thatcan be disturbed by waves.12
Lakes with dynamic ratios above 0.8 weresubject to wave disturbance at all areas of thelakebed at least some of the time.
Note: This calculation is made on the assumptionthat there were not significant amounts of aquaticplants in the lake. If plants are present in largequantities, the wind disturbance could be substantiallyless than this calculation would indicate.
Lakes with dynamic ratio values below 0.8showed a linear decrease in areas disturbed atone time or another. If for example the ratio were0.4, only about 50% of the lakebed would bedisturbed at one time or another.here in Figure 4-4 shows the calculated effects
that changes in water level might have on LakeApopka in central Florida.
Notice that changes in lake level are indicatedby the numbers in the center of the graph. The“0” curve represents Lake Apopka at its meanlake level and curves to the left of it representlake level increases in 1-foot increments. Curves tothe right of the “0” curve represent lake leveldecreases in one-foot increments.
The graph clearly illustrates that loweredlake levels can increase the extent of the lakebedthat is susceptible to wave action, while in-creases in water levels can prevent waves fromreaching the lakebed in areas where they couldunder normal lake levels. This is a good exampleof how important water level changes can be inshallow lakes.
12 Roger W. Bachmann, Mark V. Hoyer and Daniel E.Canfield, Jr. 2000. The potential for wave disturbance inshallow Florida lakes. Lake and Reservoir Management16(4): 281-291.
Figure 4-3 A comparison of lakebed disturbance for allpoints in a lake. In this example, we’ve shown the lakebeddisturbance on two Florida lakes that are quite different inboth size and mean depth. Notice the difference between thelines for the two lakes. Lake Istokpoga is a rather largeshallow lake and Lake Thonotosassa is smaller and deeper.
Perc
ent
of
the lake a
rea d
istu
rbed
Percent of time
Figure 4-4 This graph illustrates how changes in waterlevel might affect Lake Apopka in Central Florida. The plussigns indicate increases in water depth and minus signsindicate decreases in water depth.
Mixing frequency curves forLake Apopka with elevationchanges in feet
Perc
ent
of
the lake a
rea d
istu
rbed
Percent of timeStudies of several Florida lakes indicate
that the percent of lake bottom subject
to wave disturbance at one time or
another ranges from 6% to 100%.

28
In closing, we’d like to encourage anyone that is interested in learning moreabout their lake to take the time to obtain and/or make a bathymetric map ofthe waterbody. With a map, one can calculate the morphometric parametersdiscussed in this circular and then use the information as a solid basis forcomparison with other lakes. It can also serve as an invaluable tool fordeveloping a lake management plan for your lake or others in your area.
We’d further like to suggest that calculations of wave disturbancefrequencies and the dynamic ratio also be considered when working with lakes.These two relatively simple approaches can offer fresh insight into thediagnosis and management of shallow lakes in Florida and elsewhere. As onescientist observes, “This is particularly important in Florida lakes, as it hasrecently been recognized that there are important differences between howdeep lakes and shallow lakes function (Bachmann 2000).”
Bachmann, R.W., M.V. Hoyer and D.E. Canfield, Jr. 2000. The potential for wave disturbance inshallow Florida lakes. Lake and Reservoir Management. 16 (4):281-291.
Goldman, Charles R. and Alexander J. Horne. 1983. Limnology. McGraw-Hill, Inc., New York.
Håkanson, Lars. 1981. A Manual of Lake Morphometry. Springer-Verlang, Berlin, Heidelberg, New York.
Hutchinson, Evelyn G. 1957. A Treatise on Limnology. Volume I Geography, Physics, and Chemistry.Chapman and Hall, New York.
Lind, Owen T. 1979. Handbook of Common Methods in Limnology, second edition. The C.V. MosbyCompany. St. Louis, Toronto, London.
Schiffer, Donna M. 1998. Hydrology of Central Florida Lakes – A Primer: U.S. Geological SurveyCircular 1137.
Welch, Paul S. 1948. Limnological Methods. Country Life Press. Garden City, New York.
Wetzel, Robert G. and Gene E. Likens. 1979. Limnological Analyses., second edition.Springer-Verlang, Berlin, Heidelberg, New York.
White, William A. 1970. The Geomorphology of the Florida Peninsula. Geological Bulletin No. 51.Bureau of Geology. Florida Department of Natural Resources. pp 102-104. Tallahassee.
References and Recommended Readings
FC
CD
R/U
SF