part 4: nabarlek - department of the environment · part 4: nabarlek . 149 ... kkn 4.1.2...
TRANSCRIPT

147
Part 4: Nabarlek

149
Contents1
4.1 Success of revegetation
KKN 4.1.1 Revegetation assessment Vegetation monitoring techniques at Nabarlek mine site using remote sensing and ground-based studies
K Pfitzner
KKN 4.1.2 Development of revegetation monitoring method Assess a variety of spatial, spectral and temporal scaled remotely sensed data for rehabilitation assessment
K Pfitzner
4.2 Assessment of radiological, chemical and geomorphic success of rehabilitation
KKN 4.2.1 Overall assessment of rehabilitation success at Nabarlek Sediment and radionuclide fluxes from the former Nabarlek mine
GR Hancock, MK Grabham, P Martin, KG Evans & A Bollhöfer
Assessing the geomorphic stability of the rehabilitated Nabarlek mine using landform evolution modelling
JBC Lowry, DR Moliere, GS Boggs & KG Evans
Radiological impact assessment of the rehabilitated Nabarlek site
A Bollhöfer, B Ryan, P Martin & K Pfitzner
1 List of papers grouped by Key Knowledge Need.

KKN 4.1.1 Revegetation assessment
150
Vegetation monitoring techniques at Nabarlek mine site using remote sensing and ground-
based studies
K Pfitzner
Introduction Nabarlek is the first uranium mine in Australia to be rehabilitated under a contemporary regulatory regime and, hence, exemplifies many issues highly relevant to the future rehabilitation of Ranger mine. ARRTC in 2003 identified the following three key research issues with respect to the revegetation component of rehabilitation of uranium mines in the ARR that need to be addressed:
• what are the criteria for assessing revegetation success?
• what are the indicators of success and how do we monitor them?
• what can we learn from Nabarlek?
The aims of this project are to (i) develop cost-effective ground-based and remote sensing monitoring and assessment methods for vegetation that can be applied to Ranger uranium mine; and (ii) to provide a robust, quantitative assessment of the success of revegetation at Nabarlek based on a comprehensive characterisation of soils and plants across the minesite in comparison to adjacent reference or analogue sites.
Field-based transect sampling for canopy cover attributes occurred in the dry season (September 2003), and the combination of the dry and wet season (April 2004) surveys established the base line for ground cover attributes. Additionally, a base line for soil properties was established in the first dry season survey, and an assessment of nutrient cycling and the soil seed bank were undertaken in the wet season survey. In conjunction with the ground-based studies, remotely sensed data from DigitalGlobe’s Quickbird satellite platform were captured in both seasons to provide a ‘whole of landscape assessment’ to overcome under-sampling problems associated with the ground-based surveys. Another image capture was acquired in August 2004 to assess the effects of a fire that occurred on the site (July 2004). Further ground-based studies with a dGPS were undertaken aimed at sampling homogenous patches of cover for correlation with the remotely sensed data and for accuracy assessment of these results.
Progress to date Vegetation has been characterised at the Nabarlek minesite and on adjacent natural reference sites sufficiently to form the first quantitative base line for future monitoring and assessment purposes (Bayliss et al 2004a & b, Bayliss & Pfitzner 2004, Vink 2004). These results showed that revegetation so far remains unsuccessful with respect to the original objective of blending in with the surrounding woodland (Bayliss et al 2004a & b, Bayliss & Pfitzner 2004, Vink 2004).
The periodic flooding of the former Evaporation Ponds can be a hindrance to the establishment of at least Eucalyptus tetradonta and E. miniata (Vink 2004). Nutrient cycling

Vegetation monitoring techniques at Nabarlek mine site using remote sensing and ground-based studies (K Pfitzner)
151
was found to be established and not a limiting factor in the successful revegetation at the Nabarlek minesite (Manning 2004). Characterisation of the soil seed bank showed a distinct difference between the disturbed and undisturbed sites, with a high number of weed seeds present on the minesite indicating that the revegetation in its present state is not sustainable (Manning 2004). The contrast in soil and vegetation characteristics was so great that the limited ground-based sample size (n=12 transects on the minesite, 0.17% of rehabilitated area; n=6 transects on reference sites) was considered to have sufficient power for medium term monitoring purposes (Bayliss et al 2004a & b).
Expectations that the ~2.5 m multispectral Quickbird data could be integrated with the ~60 cm panchromatic data to produce a ‘pan-sharpened product’ maintaining spectral range at the smaller pixel size were false, given the data quality supplied by Sinclair Knight Merz (SKM). After discussion at the North Australian Remote Sensing and GIS Conference (Pfitzner 2005), a teleconference between the information providers (DigitalGlobe, Colorado), information resellers (SKM, Melbourne) and SSD, resulted in the agreement for DigitalGlobe to provide demonstration orthorectified data using the University of New Brunswick (UNB) pan-sharpening algorithm that produced image data maintaining the spectral range at the 60 cm pixel size. With the four spectral dimensional limitations of Quickbird data, a contextual program (eCognition) is being implemented, and these algorithms are being applied to the UNB product for each of the three data captures.
Other remotely sensed data, such as Compact Airborne Spectrographic Imager (CASI) has shown promise for revegetation assessment at Nabarlek (Pfitzner & Martin 2003, Pfitzner et al 2004), but these data have only been assessed for a one-off capture (June 2002). HyMap (September 2002) and DeBeers Hyperspectral data (June 2004) have also been acquired over Nabarlek for the purposes of assessing the suitability of high spectral resolution data for revegetation assessment.
References Bayliss P, Bellairs S, Pfitzner K & Vink S 2004a. Revegetation of Nabarlek minesite:
Preliminary characterisation of vegetation on the minesite and on adjacent natural landscapes in September 2003. Internal Report 488, October, Supervising Scientist, Darwin. Unpublished paper.
Bayliss P, Pfitzner K & Bellairs S 2004b. Revegetation of Nabarlek minesite: Seasonal comparison of groundcover vegetation on the minesite and adjacent natural reference areas (September 2003 & May 2004). Internal Report 491, October, Supervising Scientist, Darwin. Unpublished paper.
Bayliss P & Pfitzner K 2004. Revegetation research for Nabarlek and Ranger minesites Progress report: September 2004. Paper prepared for the 14th Meeting of the Alligator Rivers Region Technical Committee.
Manning J 2004. Sustainability of revegetation at Nabarlek minesite: an assessment of wet season nutrient cycling and soil seed bank. Unpublished Honours thesis, Charles Darwin University, November 2004.
Pfitzner K & Martin P 2003. Characterisation of Nabarlek minesite using CASI data. Paper presented at Spatial Sciences Conference, 22–26 September 2003, Canberra, Australia.
Pfitzner K, Martin P & Bayliss P 2004. Compact Airborne Spectrographic Imager (CASI) and ground-based spectrometer data of Nabarlek – an overview. Internal Report 482, July, Supervising Scientist, Darwin. Unpublished paper.

KKN 4.1.1 Revegetation assessment
152
Pfitzner K 2005. Remote sensing for minesite assessment – examples from eriss. North Australian Remote Sensing and GIS Conference, 4–7 July 2005, Charles Darwin University, Darwin
Vink S 2004. The revegetation of the Nabarlek uranium mine. Unpublished MSc thesis, University of Groningen, Groningen, The Netherlands.

KKN 4.1.2 Development of revegetation monitoring method
153
Assess a variety of spatial, spectral and temporal scaled remotely sensed data for
rehabilitation assessment
K Pfitzner
Introduction A variety of remotely sensed data have been acquired by SSD. Examples include: Compact Airborne Spectrographic Imager (CASI) (Nabarlek, Rum Jungle), DeBeers Hyperspectral Mapper (Ranger, Nabarlek and Rum Jungle) and temporal Quickbird data (Nabarlek). In addition, airborne gamma ray data have been acquired at varying line spacings (Nabarlek, upper South Alligator River valley, Sleisbeck). Fieldwork was undertaken with each acquisition. These data were acquired to assess the suitability of remotely sensed data for minesite assessment, both for operational and rehabilitated mine surfaces.
Until recently, identifying relationships between biophysical variables and electromagnetic radiation has been limited for minesite applications due to the disturbed nature of the mine environment and small areal extent. Recently, newer generation remote sensing data are being trialled in the mine environment, with results depending on the sensor being assessed and the localised environmental conditions. Prime applications include: revegetation and soil mapping for rehabilitation assessment; mineral mapping, such as identifying indicators of acid mine drainage (AMD) processes; and, contribution of remotely sensed data for radiological assessments. Airborne data are currently advantageous with suitable spatial, spectral and radiometric resolutions, although temporal availability is a limitation. Satellite data can be timed with field surveys, however, spectral resolution is a current limitation.
The opportunistic remotely sensed data that have been acquired to date are being assessed for their cost/benefit and suitability of spectral, spatial and temporal characteristics on a site-by-site basis. Once existing data have been analysed, this project will use an analysed ground-based spectral library database to make recommendations on suitable remotely-sensed data for minesite rehabilitation assessment; acquire simultaneously a variety of spatial, spectral and costed datasets, as seen suitable by the ground-based database; analyse and quantitatively compare such data; perform a cost-benefit analysis, and publish results.
Progress to date CASI has shown promise for both revegetation assessment at Nabarlek (Pfitzner et al 2004a, Pfitzner & Martin 2003a), and mapping mineral assemblages indicative of AMD (Pfitzner 2004, Pfitzner & Clifton 2004, Pfitzner 2005a), but these data have only been assessed for a one-off capture (June 2002). Hymap (September 2002) and DeBeers Hyperspectral data (June 2004) have also been acquired over Nabarlek and Ranger for the purposes of assessing the suitability of high spectral resolution data for revegetation assessment.
Quickbird data have been applied at Nabarlek for vegetation characterisation (Pfitzner 2005a) and at Ranger for weed mapping (Pfitzner et al 2004b, Welch et al 2004) (for details see KKN research summaries 4.4.1 and 2.5.1, respectively).
KKN 4.1.2 Development of revegetation monitoring method
154
Airborne gamma-ray analysis at the upper South Alligator River valley is complete (Pfitzner & Martin 2000, Pfitzner et al 2001a & b, Pfitzner & Martin 2003b, Bollhöfer et al 2002, Pfitzner 2005b) and a journal manuscript has been published (Pfitzner 2005c).
To make informed decisions about the most appropriate dataset for a given problem, a knowledge-base describing the relationship between spectral reflectance and the chemical and physical properties of biophysical features of interest are required. SSD aims to develop a spectral library of land cover components in order to make recommendations on suitable remotely sensed data for minesite rehabilitation assessment and monitoring. An Analytical Spectral Device (ASD) FieldSpec Pro FR unit was received on 12 April 2005. A literature review has been conducted to describe, in simple terms, the components for consideration when developing an effective field campaign and database for the storage of spectral information and associated metadata. Pfitzner et al (2005) describe the factors that affect standardised reflectance spectra and issues for consideration are presented as a conceptual model. The spectral library research design has also been presented to the Spatial Sciences Institute Northern Territory Region (‘The hype and hyper of hyperspectral remote sensing and field spectroscopy’, Survey House, Engineers Australia, Darwin, 11 May 2005) and the North Australian Remote Sensing and GIS Conference (Pfitzner 2005b).
With cooperation from Gary Cook and Rob Eager (CSIRO), Graeme Webb (Crocodylus Park), Bruce Sawyer (Berrimah Farm), Peter Hopkins (Coastal Plains Research Station), Les Huth (Beatrice Hill Agricultural Research Station), Peter Clifton (DPIFM), and Mark Gardener and Jane Addison (EWLS), sites suitable for temporal field measurement covering a range of native and weed grass and herb covers have been targeted. SSD’s Analytical Spectral Device (ASD) is being used to measure reflectance of weedy and native ground covers across the visible to shortwave-infrared (0.4–2.5 μm) region at fortnightly intervals around the sites in the greater Darwin region to capture environmental variation in reflectance.
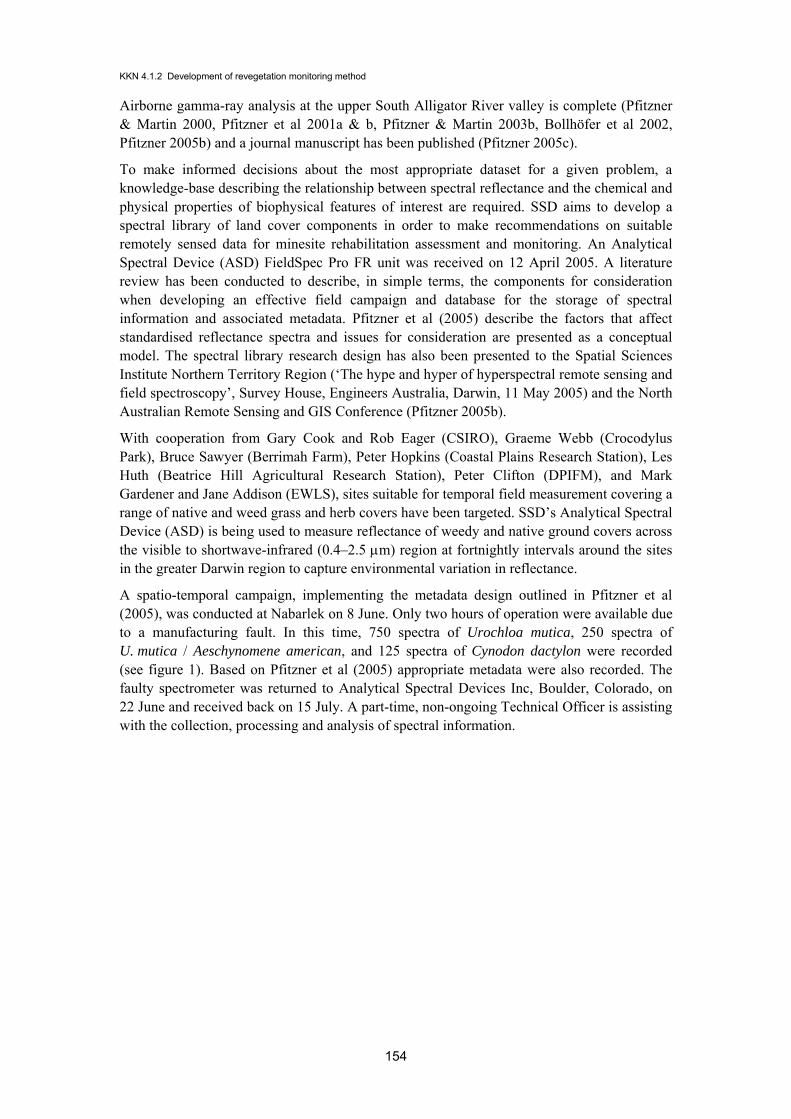
A spatio-temporal campaign, implementing the metadata design outlined in Pfitzner et al (2005), was conducted at Nabarlek on 8 June. Only two hours of operation were available due to a manufacturing fault. In this time, 750 spectra of Urochloa mutica, 250 spectra of U. mutica / Aeschynomene american, and 125 spectra of Cynodon dactylon were recorded (see figure 1). Based on Pfitzner et al (2005) appropriate metadata were also recorded. The faulty spectrometer was returned to Analytical Spectral Devices Inc, Boulder, Colorado, on 22 June and received back on 15 July. A part-time, non-ongoing Technical Officer is assisting with the collection, processing and analysis of spectral information.
Assess a variety of spatial, spectral and temporal scaled remotely sensed data for rehabilitation assessment (K Pfitzner)
155
Figure 1 Examples of spectra obtained at Nabarlek 08/06/2005
References Bollhöfer A, Ryan B, Pfitzner K & Martin P 2002. A radiation dose estimate for visitors of
the South Alligator River Valley from remnants of uranium mining and milling activities. Internal Report 386, Supervising Scientist, Darwin. Unpublished paper.
Pfitzner K 2004. Hyperpsectral remote sensing for minesite characterisation. Unpublished PhD thesis. Charles Darwin University, May 2004, Darwin.
Pfitzner K 2005a. Remote sensing for minesite assessment – examples from eriss. North Australian Remote Sensing and GIS Conference, 4–7 July 2004, Charles Darwin University, Darwin
Pfitzner K 2005b. Field-based spectroscopy – do we need it? North Australian Remote Sensing and GIS Conference (NARGIS), July 4–7 2005, Charles Darwin University, Darwin.
Pfitzner K 2005c. Mining and Exploration: Radiation Assessment, Position June/July 2005, 54–47.
Pfitzner K & Clifton R 2004. Integration of airborne CASI and gamma-ray data for minesite characterisation.
Name and brief description Averaged spectra – 25 AVERAGES /SAMPLE
U. mutica
Para grass, monoculture, 90% green, 10% senescing
U. mutica and A. american
Para grass (35% brown, 15% green) and A. Americana (50%)
C. dactylon
Couch, monoculture, 80% brown, 20% green
Note: water vapour absorption bands occur at ~1400 and 1900 nm. System noise at 2450 nm

KKN 4.1.2 Development of revegetation monitoring method
156
Pfitzner K & Martin P 2000. Airborne gamma survey of the South Alligator River valley: First report. Internal Report 353, Supervising Scientist, Darwin. Unpublished paper.
Pfitzner K & Martin P 2003a. Characterisation of Nabarlek minesite using CASI data. Spatial Sciences Conference, 22–26th September, Canberra, Australia.
Pfitzner K & Martin P 2003b. Mapping the upper South Alligator River valley using integrated datasets. Internal Report 444, July, Supervising Scientist, Darwin. Unpublished paper.
Pfitzner K, Bartolo R, Ryan B & Bollhoefer A 2005. Issues to consider when designing a spectral library database. Spatial Sciences Institute Biennial Conference (SSC2005), September 12–16, Melbourne Convention Centre, Melbourne (Submitted for double blind peer review)
Pfitzner K, Bayliss P, Welch M & Puig P 2004b. Remote sensing for weed mapping at Ranger. Internal Report 496, December, Supervising Scientist, Darwin. Unpublished paper.
Pfitzner K, Martin P & Bayliss P 2004a. Compact Airborne Spectrographic Imager (CASI) and ground-based spectrometer data of Nabarlek – an overview. Internal Report 482, July, Supervising Scientist, Darwin. Unpublished paper.
Pfitzner K, Martin P & Ryan B 2001a. Airborne gamma survey of the upper South Alligator River valley: Second Report. Internal Report 377, Supervising Scientist, Darwin. Unpublished paper.
Pfitzner K, Ryan B, Bollhöfer & Martin P 2001b. Airborne gamma survey of the upper South Alligator River valley: Third Report. Internal Report 383, Supervising Scientist, Darwin. Unpublished paper.
Welch M, Puig P & Pfitzner K 2004, Weed monitoring at Ranger and Jabiluka April–May 2004. Earth Water Life Sciences Pty Ltd for ERA Ranger Mine, Job No 644, Darwin.

KKN 4.2.1 Overall assessment of rehabilitation success at Nabarlek
157
Sediment and radionuclide fluxes from the former Nabarlek mine
GR Hancock1, MK Grabham1, P Martin2, KG Evans & A Bollhöfer
Introduction The Nabarlek mine site lies within the catchments of the Cooper Creek West (CCW) (181 ha), Buffalo Creek (BC) (575 ha) and Kadjirrikamarnda Creek (KC) (2188 ha) (fig 1). The mine disturbs 1.6%, 0.6% and 0.6% of the catchments respectively. These three catchments drain into Cooper Creek, which in turn discharges into the mouth of the East Alligator River. Cooper Creek drains 25 238 hectares at its confluence with Kadjirrikamarnda Creek.
This project used field and laboratory data and modelling techniques to determine sediment and radionuclide fluxes passing from the site to assess impacts on water quality in Cooper Creek.
Results Gross erosion occurring on the Nabarlek site was determined using the Revised Universal Soil Loss Equation (RUSLE) (Renard et al 1994). The site was initially divided into homogeneous sub-areas, or erosion units, based on visual differences identified from stereoscopic interpretation of photographs and topographic maps (fig 2). This identified changes in soil colour, vegetation cover, ripped areas and vegetation assemblage. Confirmation or alteration of boundaries was undertaken by ground truthing. Field data (permeability, soil particle size, soil structure, vegetation cover) for input parameter value derivation were collected from each unit.
The gross erosion occurring on each erosion unit was calculated and the results added to provide a gross sediment loss estimation for the site. Sediment loss from the Nabarlek site was assessed under vegetation and burnt conditions.
Soil samples collected from the main identified erosion units were analysed by high-resolution gamma-ray spectrometry. This technique gives simultaneous measurements of mass activity densities (Bq kg-1) of a number of radionuclides of the uranium and thorium radioactive decay series, as well as 40K, in the sample (table 1). These data were then multiplied by the estimates for delivery of eroded soil to the Cooper Creek system to give an estimate for the radionuclide flux passing from the site to downstream waterways from each erosion unit.
The results showed that predicted gross erosion on the Nabarlek site is higher than that occurring on natural areas of the catchment. However, the results show the site to be eroding at a rate close to that predicted by Riley (1995) using the USLE, providing confidence in our results.
1 School of Environmental & Life Sciences, The University of Newcastle, Callaghan, New South Wales 2308,
Australia. 2 Formerly SSD; now Agency’s Laboratories Seibersdorf, IAEA, A-1400, Vienna, Austria.

KKN 4.2.1 Overall assessment of rehabilitation success at Nabarlek
158
Figure 1 Catchment division on the Nabarlek mine
Figure 2 Location of erosion units (numbers) on the Nabarlek mine
This suggests that the rehabilitated landscape will maintain its integrity for the recommended design life of 1000 years (Commonwealth of Australia 1987). Furthermore, the estimated suspended sediment concentrations for unvegetated conditions do not exceed the local trigger values derived in accordance with the water quality guidelines. However, stream sediment loads in the catchments draining the Nabarlek site – Cooper-west, Buffalo and Kadjirrikamarnda Creeks – may have elevated concentrations. The increased sediment concentration predicted for these catchments were based on non-vegetated conditions and therefore represent a worst case scenario. It is highly unlikely that an entire catchment such as CCW could be razed of vegetation, giving rise to such high levels of sediment loss.
Erosion unit 7 has been identified as the dominant source of radionuclide fluxes (74%) from the site under measured (vegetated) conditions (table 1). Given the small (0.44 ha) size of this unit, it would be possible to achieve significant reduction in the fluxes from the site with a relatively modest further rehabilitation effort.
Details of this study are available in Hancock et al (2006).
References Commonwealth of Australia, Department of Arts, Sports, the Environment, Tourism and
Territories 1987. Code of Practice on the Management of Radioactive Wastes from Mining of Radioactive Ores 1982, Guidelines, AGPS, Canberra.
Hancock GR, Grabham MK, Martin P, Evans KG & Bollhöfer A 2006. A methodology for the assessment of rehabilitation success of post mining landscapes – sediment and radionuclide transport at the former Nabarlek uranium mine, Northern Territory, Australia. Science of the Total Environment 354, 103–119.
Renard KG, Laflen JM, Foster GR, McCool DK 1994. The revised universal soil loss equation. In Soil erosion research methods, 2nd edn, ed R Lal, Soil and Water Conservation Society, Ankeny, IA, 105–124.
Riley SJ 1995.Issues in assessing the long-term stability of engineered landforms at Ranger Uranium Mine, Northern Territory, Australia. Journal of the Royal Society of New South Wales 128, 67–78.

Sediment and radionuclide fluxes from the former Nabarlek mine (GR Hancock, MK Grabham, P Martin, KG Evans & A Bollhöfer
159
Table 1 Radionuclide mass activity densities1 (Bq/kg dry weight) for surface soil samples, and the estimated % contribution to the total 238U flux to the Cooper Creek system from each of the erosion units for measured conditions
Er. unit
n 238U (Bq/kg)
226Ra (Bq/kg)
226Ra range (Bq/kg)
210Pb (Bq/kg)
228Ra (Bq/kg)
40K (Bq/kg)
% flux
238U
13 3 48 (16) 67 (19) 45 − 79 110 (9) 24 (4) 18 (7) 9.1
15 3 53 (34) 58 (38) 21 − 97 90 (8) 28 (9) 61 (12) 3.1
16 7 64 (57) 60 (51) 21 − 145 78 (60) 23 (6) 83 (101) 0.07
3 2 64 (21) 92 (47) 58 − 125 108 (60) 34 (7) 123 (24) 0.7
14 6 104 (71) 101 (77) 51 − 249 117 (78) 24 (7) 62 (109) 0.14
1 3 138 (101) 292 (219) 39 − 437 292 (218) 24 (5) 48 (35) 0.4
2 3 175 (28) 192 (20) 178 − 215 191 (71) 42 (3) 211 (84) 0.01
9 2 177 (95) 168 (85) 108 − 228 177 (66) 31 (2) 110 (110) 0.3
10 4 263 (168) 330 (205) 177 − 629 348 (226) 36 (10) 130 (16) 3.2
12 6 353 (337) 340 (341) 104 − 999 340 (325) 47 (25) 281 (317) 2.0
6 2 496 (105) 497 (132) 404 − 591 538 (177) 79 (41) 790 (454) 0.6
5 4 801 (396) 767 (367) 272 − 1060 780 (324) 108 (18) 1120 (300) 0.15
8 4 1320 (880) 1540 (840) 330 − 2260 1520 (950) 83 (11) 860 (309) 0.009
4 3 2460 (610) 2540 (730) 1980 − 3370 2620 (850) 108 (25) 1120 (330) 6.1
11 6 2530 (1290) 2380 (930) 1160 − 3450 2330 (790) 100 (20) 1110 (260) 0.09
7 6 6780 (4780) 15400 (8400) 1690 − 23900 19100 (10200) 42 (16) 222 (49) 74
1 Results are given as the mean for the n samples, with the standard deviation in brackets.

KKN 4.2.1 Overall assessment of rehabilitation success at Nabarlek
160
Assessing the geomorphic stability of the rehabilitated Nabarlek mine using landform
evolution modelling
JBC Lowry, DR Moliere, GS Boggs1 & KG Evans
Introduction A joint project with Charles Darwin University (CDU) integrated the SIBERIA landform evolution model and the ArcView desktop GIS software packages through an interface known as ArcEvolve (Boggs 2003), using the the Jabiluka mine within the Ngarradj catchment as a case study. In order to ensure that the knowledge gained from this project was retained within SSD, the software was used by SSD staff to assess the geomorphic stability of the Nabarlek mine as a desktop exercise during 2004–05. The project had three aims:
1 to assess the application of ArcEvolve to a small mine-impacted catchment
2 to predict the surface stability of the catchment areas affected by the Nabarlek mine and possible future impacts; and
3 produce a detailed description of the processes and methods used, for the future application of ArcEvolve to medium-scale catchment areas.
Progress to date A detailed description of the methods used in the application of the ArcEvolve software to the Nabarlek minesite has been produced as an internal report (Lowry et al 2004).
Using the methodology described in Lowry et al (2004), the draft landform was modelled for a period of 1000 years, with hydrology parameters held constant for the entire landform and erosion parameters varied for each region of the landform representing different surface treatments. Through the GIS interface, it was possible to identify areas of potential erosion/deposition by subtracting the 1000-year modelled surface from the current surface (figure 1). Figure 1a shows the simulated erosion and deposition that occurs on the Nabarlek catchment area at 1000 y using input parameter values derived for the various surface conditions that exist on the landform. For impact assessment, this was compared to the simulated erosion and deposition on the Nabarlek landform assuming natural, undisturbed conditions (figure 1b).
A preliminary assessment was made on the surface stability of the catchment areas affected by the Nabarlek mine using ArcEvolve. The majority of the sediment movement on the rehabilitated landform over a 1000-year simulation period occurred on the evaporation ponds, the waste rock dump (WRD) and the areas adjacent to the airstrip (figure 1). However, the eroded material from these areas was deposited immediately downstream of their respective areas and, therefore, remained on the mine site. As a result, it is unlikely that there will be an immediate mine-derived increase in sediment movement downstream of the mine site. In
1 Formerly SSD; now Faculty of Education, Health & Science, Charles Darwin University, Darwin NT.

Assessing the geomorphic stability of the rehabilitated Nabarlek mine using landform evolution modelling (JBC Lowry, DR Moliere, GS Boggs & KG Evans)
161
terms of sediment movement and subsequent impacts downstream of the mine, it is considered that the rehabilitated landform is relatively stable over the long term.
Figure 1 Areas of potential erosion (dark colours) and deposition (lighter colours) on landform after
1000 years using parameters for (a) disturbed conditions; (b) natural conditions
However, as a result of this case study, we identified that the process was unable to assign different hydrology parameter values to the different surface conditions within the catchment area. Therefore, the simulation results for the Nabarlek catchment area (figure 1a) only
(a)
(b)

KKN 4.2.1 Overall assessment of rehabilitation success at Nabarlek
162
provide a preliminary assessment of likely landform stability and should not be considered reliable to provide a quantitative estimate of sediment movement in the region. As a result, a secondary aim of this project was to incorporate individual hydrological parameter values into the SIBERIA model to further refine the assessment. This issue is being addressed in the 2005–06 workplan. Specifically, it will be determined whether the above limitation is a result of a problem within the GIS interface or the SIBERIA software itself.
References Boggs GS 2003. GIS application to the assessment and management of mining impact.
Unpublished PhD thesis, Charles Darwin University, Darwin.
Lowry JBC, Moliere DR, Boggs GS & Evans KG 2004. Application of landform evolution modelling to the Nabarlek minesite. Internal Report 480, July, Supervising Scientist, Darwin. Unpublished paper.

KKN 4.2.1 Overall assessment of rehabilitation success at Nabarlek
163
Radiological impact assessment of the rehabilitated Nabarlek site
A Bollhöfer, B Ryan, P Martin1 & K Pfitzner
Introduction There is no permanent habitation close to the rehabilitated Nabarlek uranium mine site at present, but future occupancy of the site cannot be ruled out. Radiological risk assessment, including all exposure pathways, is needed for planning purposes and to achieve closeout of the site. A radiological dose assessment requires integration of sub-tasks such as:
1 Gamma dose rate surveys,
2 Radon exhalation rate and airborne radon concentration surveys,
3 Radionuclide concentration in surface soils and erosion/stability assessment,
4 Bore water uranium isotope and radium concentration measurement, and
5 Measurement of radionuclide uptake into edible plants growing on and off site.
Sub tasks 1, 2 and 3 are mostly complete, and results have been published (Bollhöfer et al 2004, 2005, Hancock et al 2005, Martin et al 2005).
Groundwater contaminant sources on the Nabarlek mine site include the irrigation areas, the previous evaporation and run off ponds, and since rehabilitation the tailings and plant material buried in the pit. An earlier study conducted by eriss has shown that radium concentration increased in bores in the vicinity of the Nabarlek land application areas during the application period (Martin & Murray 1991). This increase was thought to be caused by mobilisation of radium from adsorption sites on aquifer rocks in the vicinity of the bores rather than radium in the irrigation water.
Methods Gamma dose rates from the radiological anomalous area (RAA) south of the former pit have been surveyed using conventional Geiger-Müller tubes. The line spacing of the survey amounted to 10–15 m. Radon exhalation had been measured, using a randomised design. Charcoal canisters were deployed for ~3 days and measured for the activity of radon progeny adsorbed onto the charcoal, using a NaI(Tl) gamma spectrometer. Control and environmental sites were investigated throughout the project for quality assurance purposes.
Bore waters have been collected by DME for eriss since 1996 and aliquots for radioanalysis have been taken for and archived by the Environmental Radioactivity section. Uranium and radium analyses via alpha spectrometry of the samples began in 2004 using standard methods (Martin & Hancock 2004, Medley et al 2005). Long-term groundwater data for uranium isotopes and radium may provide information about groundwater quality, movement and
1 Formerly SSD; now Agency’s Laboratories Seibersdorf, IAEA, A-1400, Vienna, Austria.

4.2.1 Overall assessment of rehabilitation success at Nabarlek
164
sources of contamination. A collaborative project has been started with the Gunbalanya Community Rangers looking for bush foods growing on site.
Results The site has been characterised from an airborne gamma survey for the external gamma pathway and Table 1 shows the gamma dose rates determined for the various areas on site (Martin et al 2005). Dose rates from the RAA could not be resolved due to its relatively small extent and the resolution of the airborne gamma survey. Figure 1 shows external gamma dose rates in micro Grays per hour (μGy/hr) determined during a detailed gamma survey of the RAA in 2005.
Table 1 Post-mining terrestrial-origin γ-dose rate for areas of the Nabarlek site (Martin et al 2005)
Site Area (ha) D (μGy·hr-1)
Pit 4 0.51
Evaporation pond 1 6 0.48
Waste rock runoff pond 1.9 0.47
Waste rock dump 8 0.46
Evaporation pond 2 25 0.37
Plant runoff pond 1.1 0.36
Stockpile runoff pond 4 0.36
Ore stockpile 6 0.24
Plant and offices 6 0.18
Airstrip LAA 10 0.09
Forest LAA 13 0.05
Total fenced area 140 0.31
Figure 1 Gamma dose rates [μGy·hr-1] measured at the radiological anomalous area
Radiological impact assessment of the rehabilitated Nabarlek site (A Bollhöfer, B Ryan, P Martin & K Pfitzner)
165
Maximum dose rates at the RAA are higher than the averages across site, and could inflict a dose on an individual much higher than at other areas. From the field observations and results of the gamma survey it also appears that some material is eroding south east along erosion channels fanning out in a lower lying area on site, south of the former pit area. These results will aid OSS in determining soil coring sites and remediation strategies for the area.
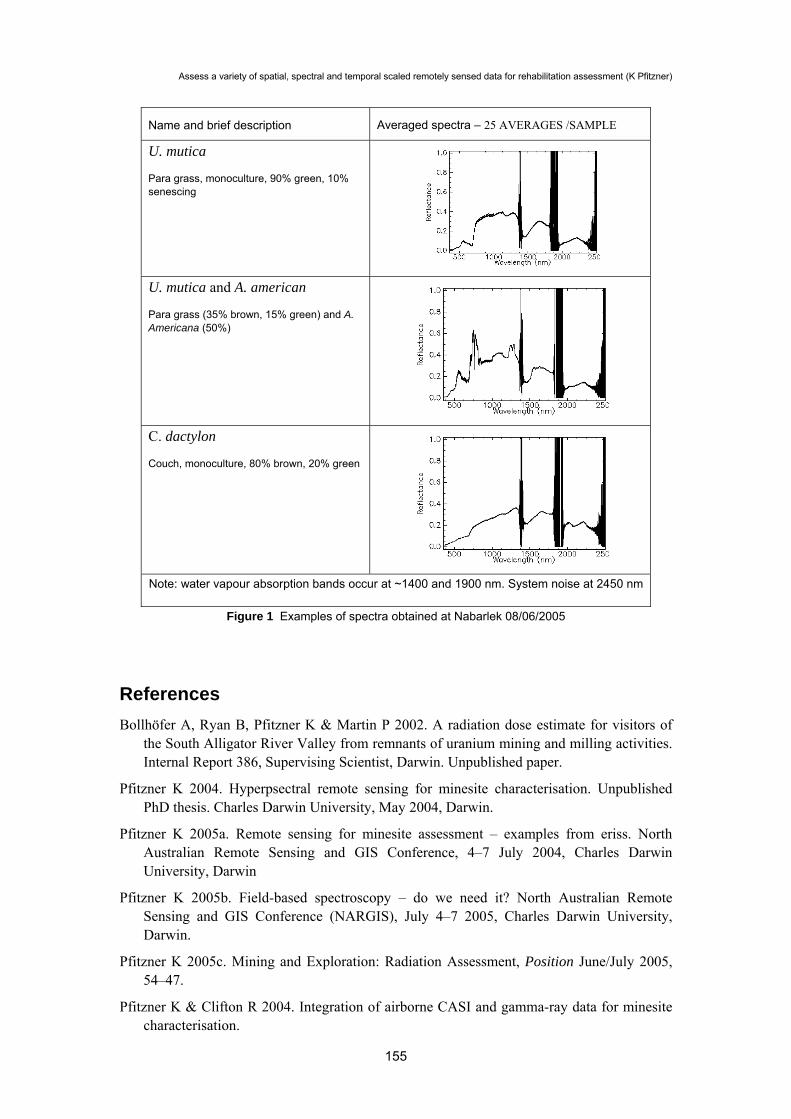
Radon exhalation has been studied in detail and figure 2 shows the results of the study (Bollhöfer et al 2005). The RAA has been identified to contribute about ¼ of the total radon flux from the rehabilitated mine site. Three years of temporal airborne radon data have been acquired and published (Bollhöfer et al 2004) and track etch detectors have been deployed to determine the spatial variation across the site.
Figure 2 Radon flux densities from surfaces of the rehabilitated Nabarlek mine (Bollhöfer et al 2005)
Bore water samples have been collected by DME in August 2004 and all archived samples have now been analysed for their uranium activity and activity ratios via alpha spectrometry. Generally, uranium activity concentrations are higher in groundwater samples from bores east of the pit and plant areas (OB10, 25, 31) and lower in samples from bores south and west of the fenced area. Interpretation of the full Nabarlek groundwater data set is currently underway.
References Bollhöfer A, Martin P, Tims S & Ryan B 2004. High sensitivity airborne radon concentration
measurements in the Alligator River Region: rehabilitated Nabarlek uranium mine. Internal Report 469, January, Supervising Scientist, Darwin. Unpublished paper.
Bollhöfer A, Storm J, Martin P & Tims S 2006. Geographic variability in radon exhalation at a rehabilitated uranium mine in the Northern Territory, Australia. Environmental Monitoring and Assessment 114. 313–330.
Hancock GR, Grabham MK, Martin P, Evans KG & Bollhöfer A 2006. An methodology for the assessment of rehabilitation success of post mining landscapes – sediment and

4.2.1 Overall assessment of rehabilitation success at Nabarlek
166
radionuclide transport at the former Nabarlek uranium mine, Northern Territory, Australia. Science of the Total Environment 354, 103–119.
Martin P & Murray AS 1991. An investigation of radium isotopes in Nabarlek borewaters. Internal report 38, Supervising Scientist for the Alligator Rivers Region, Canberra. Unpublished paper.
Martin P & Hancock GJ 2004. Routine analysis of naturally occurring radionuclides in environmental samples by alpha-particle spectrometry. Supervising Scientist Report 180, Supervising Scientist, Darwin NT.
Martin P, Tims S, McGill A, Ryan B & Pfitzner K 2005. Use of airborne γ-ray spectrometry for environmental assessment of the rehabilitated Nabarlek uranium mine, northern Australia. Environmental Monitoring and Assessment, In press.
Medley P, Bollhöfer A, Iles M, Ryan B & Martin P 2005. Barium sulphate method for radium-226 analysis by alpha spectrometry. Internal Report 501, June, Supervising Scientist, Darwin. Unpublished paper.