part 4: case studies of environmental dredging projects
TRANSCRIPT

Draft Engineering Performance StandardsPeer Review Copy
Appendix: Case Studies of Environmental Dredging Projects
October 2003
Prepared for:
U.S. Army Corps of Engineers, Kansas City DistrictUSACE Contract No. DACW41-02-D-0003 On Behalf of: U.S. Environmental Protection Agency, Region 2
Prepared by:
Malcolm Pirnie, Inc. 104 Corporate Park DriveWhite Plains, New York 10602
and
TAMS Consultants, Inc. an Earth Tech Company300 Broadacres DriveBloomfield, New Jersey 07003
Volume 4 of 4


Malcolm Pirnie/ TAMS-Earth Tech ES-1 Peer Review Draft - October 2003 Engineering Performance Standards Executive Summary
Draft Engineering Performance Standards – Peer Review Copy Hudson River PCBs Superfund Site
Executive Summary October 2003
In February 2002, the United States Environmental Protection Agency (USEPA) issued a Record of Decision (ROD) for the Hudson River PCBs Superfund Site (Site). The ROD calls for targeted environmental dredging of approximately 2.65 million cubic yards of PCB-contaminated sediment from the Upper Hudson River (approximately 40 river miles) in two phases over a six-year period, and monitored natural attenuation of the PCB contamination that remains in the river after dredging. In the ROD, USEPA identified five remedial action objectives, which are as follows:
• Reduce the cancer risks and non-cancer health hazards for people eating fish from the Hudson River by reducing the concentration of PCBs in fish;
• Reduce the risks to ecological receptors by reducing the concentration of PCBs in fish;
• Reduce PCB levels in sediments in order to reduce PCB concentrations in river (surface) water that are above applicable or relevant and appropriate requirements for surface water;
• Reduce the inventory (mass) of PCBs in sediments that are or may be bioavailable; and
• Minimize the long-term downstream transport of PCBs in the river. In selecting its cleanup remedy, USEPA required that performance standards for resuspension during dredging, production rates during dredging, and residuals after dredging (together called the “Engineering Performance Standards”) be established. This decision was made to address comments received from members of the public who expressed a wide spectrum of views on the project. Some suggested that the environmental dredging could “do more harm than good” and take much longer than stated, while others were concerned that the ROD was not sufficiently comprehensive in its requirements for the environmental cleanup. USEPA required these performance standards in its final cleanup decision to promote accountability and ensure that the cleanup meets the human health and environmental protection objectives set forth in the ROD.1 This document presents the draft Engineering Performance Standards for public review and comment. For each performance standard, it discusses the major ways performance is measured, the techniques used to assess performance, the supporting analyses for the
1 Other performance standards will address public concerns related to potential impacts of the cleanup on the surrounding community, such as air emissions, navigation, and noise. These are being developed separately.

Malcolm Pirnie/ TAMS-Earth Tech ES-2 Peer Review Draft - October 2003 Engineering Performance Standards Executive Summary
recommendations (including case studies), and some of the major interactions among the performance standards. Consistent with the ROD, the Engineering Performance Standards were developed in consultation with New York State, the National Oceanic and Atmospheric Administration and the U.S. Fish and Wildlife Service. (New York State is developing substantive water quality certification requirements for the environmental dredging pursuant to the federal Clean Water Act; USEPA will review the requirements when they become available for any implications with respect to the Engineering Performance Standards). USEPA’s consultants included a team of senior scientists and engineers who developed the standards, which then were reviewed by a separate team of recognized technical experts. General Electric Company reviewed a near-final version of the draft standards. Comments from these organizations were considered in preparing this Public Review Copy of the Draft Engineering Performance Standards. Following the close of the public comment period, the Draft Engineering Performance Standards were revised as appropriate and are now released to the public as this Draft Engineering Performance Standards – Peer Review Copy. The standards will be peer reviewed by a panel of independent experts, modified as appropriate to address the peer reviewers’ recommendations, and then implemented during the Phase 1 dredging. The results from the first season of dredging (Phase 1) will be used to evaluate the project’s progress compared to the assumptions in the ROD in order to determine whether there are any necessary adjustments to the dredging operations in the succeeding phase (Phase 2) or to the standards. The report evaluating the dredging with respect to the Phase 1 standards also will be peer reviewed. USEPA will use the peer reviewers’ recommendations to help determine whether the dredging plan is feasible in achieving the human health and environmental protection objectives of the ROD. The Engineering Performance Standards will be refined or adjusted, if necessary, for the remaining dredging seasons (Phase 2). Based on the analyses performed to develop the standards, USEPA believes that the standards are consistent with the human health and environmental protection objectives of the ROD. USEPA has determined:
• Compliance with the Resuspension Standard will limit the concentration of Total PCBs in river water one mile or more downstream of the dredging area to levels that are acceptable for potable water under the requirements of the Safe Drinking Water Act;
• Resuspension of PCBs in compliance with the Resuspension Standard will have a
negligible adverse effect on Tri+ PCB concentrations in Hudson River fish, as compared to a scenario assuming no dredging-related PCB releases;2
2 A negligible effect is defined, in this case, as a predicted Tri+ PCB concentration in Upper Hudson fish of 0.5 mg/kg or less, and in Lower Hudson River fish of 0.05 mg/kg or less, within 5 years after the completion of dredging in the Upper Hudson.

Malcolm Pirnie/ TAMS-Earth Tech ES-3 Peer Review Draft - October 2003 Engineering Performance Standards Executive Summary
• Compliance with the Control Level of the Resuspension Standard is expected to result in a Total PCB load (mass) transported downstream during remedial dredging that is similar to the range of Total PCB loads detected during recent baseline (i.e., pre-dredging) conditions, as documented by weekly measurements from 1996 to 2001;
• The Residuals Standard specified in the ROD (approximately 1 mg/kg Tri+ PCBs
prior to backfilling) is achievable based on case studies of other environmental dredging projects and can be applied in the Upper Hudson on an area-wide average basis;
• The Productivity Standard will result in completion of the dredging within the six
dredging seasons called for in the ROD, based on an example conceptual schedule for project implementation; and
• The three Draft Engineering Performance Standards, including their respective
monitoring programs, are achievable individually and in combination. The standards appropriately balance their points of interaction, allowing flexibility during design and implementation while ensuring protection of human health and the environment. For example, the requirements concerning additional dredging attempts in the Residuals Standard must consider the requirements for dredging production in the Productivity Standard.
A summary of each of the three Draft Engineering Performance Standards is presented below, followed by discussion of some of the major interactions among the Standards. Performance Standard for Dredging Resuspension Objectives The Performance Standard for Dredging Resuspension (i.e., Resuspension Standard) is designed to limit the concentration of PCBs in river water such that water supply intakes downstream of the dredging operations are protected, and to limit the downstream transport of PCB-contaminated dredged material. The attendant water quality monitoring program will be implemented to verify that the objectives of the Resuspension Standard have been met during dredging. The analytical results obtained from the water quality monitoring will be compared to the Resuspension Standard and associated lower action levels to monitor and control resuspension through appropriate actions. Such actions could include, as appropriate, expanding the monitoring program, notifying public water suppliers, implementing operational or engineering improvements, and, if necessary, temporarily halting the dredging.

Malcolm Pirnie/ TAMS-Earth Tech ES-4 Peer Review Draft - October 2003 Engineering Performance Standards Executive Summary
The ROD requires the development of a Resuspension Standard but does not set forth any framework or numerical value for the Standard. The Resuspension Standard and a series of tiered action levels were developed based on extensive modeling, review of environmental dredging case study data, and evaluation of applicable or relevant and appropriate requirements (ARARs) identified in the ROD for PCBs in river water. Statement of the Resuspension Standard
Resuspension Standard Under the Resuspension Standard, the maximum allowable Total PCB concentration in the water column is 500 nanograms per liter (ng/L) (i.e., 500 parts per trillion) at any far-field monitoring station, regardless of the source of the PCBs. This concentration is the USEPA Safe Drinking Water Act Maximum Contaminant Level (MCL) for PCBs in drinking water supplies.3 Potential sources include dredging, tender and tugboat movements, materials handling, and PCBs from upstream and non-dredging sources. Dredging is only allowed to proceed when concentration of Total PCBs in the river water at any Upper River far-field station is 500 ng/L or less.
Action Levels
Action levels were developed to help identify potential problems and to guide appropriate responses, such as preventive actions or engineering improvements, as necessary, as a means of avoiding an exceedance of the Resuspension Standard. As shown in Table ES-1 below, there are three action levels leading up to the Resuspension Standard, which are designated “Evaluation Level,” “Concern Level,” and “Control Level.” The monitoring requirements become more stringent at each level to increase the types and quantity of data available to interpret the river’s response to the dredging. If the monitoring shows an exceedance at the Evaluation or Concern Level, engineering solutions are suggested. If the monitoring shows an exceedance at the Control Level, implementation of an engineering solution is required.
3 The New York State MCL is also 500 ng/L.

Malcolm Pirnie/ TAMS-Earth Tech ES-5 Peer Review Draft - October 2003 Engineering Performance Standards Executive Summary
Table ES-1: Resuspension Standard and Action Levels
Action Level Parameter Required Action Evaluation Level
• 300 g/day Total PCB load or 100 g/day Tri+ PCB load as a 7-day running average (far-field)
• 100 mg/L 6-hour running average net suspended solids increase or average net increase in the daily dredging period if the dredging period is less than 6 hours (near-field, 300 m, River Sections 1 & 3)
• 60 mg/L 6-hour running average net suspended solids increase or average net increase in the daily dredging period if the dredging period is less than 6 hours (near-field, 300 m, River Section 2)
• 700 mg/L net suspended solids average 3-hour continuous (near field, 100 m and channel-side)
• 12 mg/L 6-hour running average net suspended solids increase or average net increase in the daily dredging period if the dredging period is less than 6 hours (far-field)
Monitoring Contingencies Engineering Evaluations (recommended) Engineering Solutions (recommended)
Concern Level
• 350 ng/L Total PCBs as a 7-day running average (far-field) • 600 g/day Total PCB load or 200 g/day Tri+ PCB load as a 7-day
running average (far-field) • 100 mg/L net suspended solids daily average for the dredging
period (greater than 6 hours) or 24 hours (near-field, 300 m, River Sections 1 & 3)
• 60 mg/L net suspended solids daily average for the dredging period (greater than 6 hours) or 24 hours (near-field, 300 m, River Section 2)
• 24 mg/L net suspended solids daily average for the dredging period (greater than 6 hours) or 24 hours (far-field)
Monitoring Contingencies Engineering Evaluations Engineering Solutions (recommended)
Control Level
• 350 ng/L Total PCBs as a 4-week running average (far-field) • 65 kg/year Total PCB or 22 kg/year Tri+ PCB load during the
Phase 1 dredging season (far-field) • 600 g/day Total PCB load or 200 g/day Tri+ PCB load as a 4-
week running average (far-field)
Monitoring Contingencies Engineering Evaluations Engineering Solutions
Resuspension Standard
500 ng/L Total PCBs (confirmed far-field occurrence) Temporarily Halt Dredging Monitoring Contingencies Engineering Evaluations Engineering Solutions
The Evaluation Level is based on PCB load (net mass loss) criteria and suspended solids concentrations. The PCB load criteria are 300 g/day Total PCBs (and 100 g/day Tri+ PCBs), which approximates the amount that could reasonably be distinguished from baseline conditions. These amounts are approximately three times the best engineering estimate of mass loss from the dredging operation at full production as reported in the ROD. The near-field suspended solids concentration criteria were derived for each River Section of the Upper Hudson to correspond to a far-field PCB concentration of 350 ng/L Total PCBs. There is a corresponding far-field suspended solids criterion derived for a far-field concentration of 500 ng/L Total PCBs, the Resuspension Standard. Consistent with the ROD, the Evaluation Level, Control Level and Concern Level each require the collection of site-specific data in Phase 1 that will be used to determine whether adjustment to the dredging operations or to the standards are needed in Phase 2. Once these data have been evaluated, it may be appropriate to eliminate the Evaluation Level in the Resuspension Standard for Phase 2.
Malcolm Pirnie/ TAMS-Earth Tech ES-6 Peer Review Draft - October 2003 Engineering Performance Standards Executive Summary
The Concern Level includes both a PCB concentration and load-based criteria. The concentration criterion is a seven-day running average exceedance of 350 ng/L Total PCBs (i.e., 70% of the 500 ng/L Resuspension Standard, which is a reasonable warning threshold). The load criteria are structured similarly, with a one-week exceedance of 600 g/day Total PCBs (and 200 g/day Tri+ PCBs). This daily load rate is based on a total project load of up to 650 kg Total PCBs over the duration of the dredging as estimated from various engineering and modeling analyses.4 The near-field suspended solids concentration criteria were derived for each River Section of the Upper Hudson to correspond to a far-field PCB concentration of 350 ng/L Total PCBs, but the threshold duration of the concentration criteria is longer. There is an associated far-field suspended solids criterion derived to correspond to a far-field PCB concentration at twice the Resuspension Standard (i.e., 1000 ng/L).5 The Control Level criteria for PCB concentration and load are similar in form to those for the Concern Level, but the threshold duration of the concentration criteria is increased. In this case, the concentration criterion is a four-week running average concentration of 350 ng/L Total PCBs. The load criteria, likewise, consist of a four-week exceedance of 600 g/day Total PCBs (and 200 g/day Tri+ PCBs). There are no increased suspended solids criteria associated with the Control Level (i.e., the Control Level is not triggered by suspended solids concentrations alone).
Near-field and Far-field Monitoring Stations The Resuspension Standard requires water quality monitoring at both “near-field” stations (located within a few hundred meters of the dredging operation) and “far-field” stations (to be established at fixed locations in the Upper and Lower Hudson River, primarily dams and bridges). Monitoring is required at all far-field stations during Phase 1 (two stations upstream of the project area, four stations in the Upper River, two stations in the Lower River and one station in the Mohawk River at Cohoes). The Resuspension Standard of 500 ng/L Total PCBs is applied to the PCB concentration data collected at any far-field station that is at least 1 mile downstream of the dredging area. The data collected at both near-field and far-field stations are compared to the action level criteria.
Water quality impacts that are detected only in the immediate dredging area, including within containment barriers that the Contractor may employ around the dredging area, are not covered by the Resuspension Standard. Some resuspension within the dredging areas is likely unavoidable regardless of the type of dredging equipment used, and is of concern only to the extent it transports PCBs downstream.
4 The daily rate is based on attainment of the recommended target cumulative volume as specified in the Productivity Standard, and should be prorated according to the production rate planned in the Production Schedule to be submitted annually to USEPA. 5 This higher level recognizes the high degree of uncertainty in the suspended solids measurement. Additional PCB sampling prompted by this level will be used to confirm compliance with the Resuspension Standard.

Malcolm Pirnie/ TAMS-Earth Tech ES-7 Peer Review Draft - October 2003 Engineering Performance Standards Executive Summary
Routine Monitoring Program6
The routine water quality monitoring program consists of PCB sampling and analysis at the far-field stations and the collection of suspended solids data at the near-field and far-field stations every three hours. The routine monitoring program is specific with respect to the details and frequency of the sample collection, potential development of continuous field monitoring techniques for suspended solids, requirements for representative discrete and composite sampling schemes at the far-field stations (Upper and Lower Hudson), and the number and configuration of near-field suspended solids sampling stations. Monitoring results will be made available to USEPA upon receipt from the laboratories. Corrective actions and analytical results will be summarized in weekly reports to USEPA.
Contingencies
Monitoring Contingencies If an action level is exceeded, monitoring contingencies are required at both near-field and far-field stations. The monitoring contingencies consist of increased sampling frequency and more rapid laboratory turn-around of analytical data at the sampling locations, compared to the routine monitoring program. The monitoring contingency is intended to provide additional data to better characterize the developing changes and trends in water quality. The Resuspension Standard allows the monitoring program to revert to routine frequencies and normal turnaround times when conditions have decreased below the action levels for specific durations.
Engineering Contingencies
If the Evaluation Level is exceeded, the Resuspension Standard suggests that an engineering evaluation be undertaken and that a range of engineering contingencies be considered. If the Concern Level is exceeded, the Resuspension Standard requires that an engineering evaluation be undertaken and suggests a range of engineering contingencies. However, at the Concern Level, implementation of an engineering solution is discretionary. If the Control Level is exceeded, the Resuspension Standard requires implementation of an engineering solution, with the exact engineering solution to depend on the specific circumstances encountered in the field and an interpretation of the monitoring data collected in connection with the action level exceedance. If the Resuspension Standard is exceeded, all dredging operations must be temporarily halted pending the results of an engineering evaluation and selection of an engineering solution in consultation with USEPA. 6 The term “routine” refers to a level of monitoring appropriate to this project to be conducted while the dredging operation is in compliance with the Resuspension Standard and all action level criteria.
Malcolm Pirnie/ TAMS-Earth Tech ES-8 Peer Review Draft - October 2003 Engineering Performance Standards Executive Summary
The suggested engineering evaluations and solutions include examination of boat traffic patterns, additional evaluation of sediment pipelines for leaks, implementation or modification of silt barriers and may include, for the Control Level, temporarily halting the dredging operations.
Public Water Supply Monitoring and Contingencies
The Resuspension Standard provides for notification to downstream public water suppliers when the Total PCB concentration at the Waterford far-field station is predicted to be 350 ng/L or greater. The monitoring and notification required by the Resuspension Standard is in addition to monitoring and notification requirements that will be developed separately for the Community Health and Safety Plan for the remedial work activities.7
Supporting Analyses and Assumptions
A large number of analyses were conducted in developing the Resuspension Standard, including the action levels. Some of the most important analyses are summarized below.
Dissolved-Phase PCB Releases Case studies regarding environmental dredging projects provide different conclusions regarding the importance of dissolved-phase PCBs in the absence of a release of suspended solids. Some data from the Fox River in Wisconsin suggest that relatively large dissolved-phase releases of PCBs are possible during dredging without an associated release of contaminated sediments (suspended solids). In contrast, field measurements of dissolved and particle-associated PCBs collected during environmental dredging at the New Bedford Harbor site in Massachusetts suggest that dissolved phase PCB releases are not significant. In developing the Resuspension Standard, analyses were conducted to evaluate possible mechanisms for dissolved-phase PCB releases during dredging of the Upper Hudson. These analyses sought to consider the likelihood and magnitude of potential dissolved-phase effects. Potential releases of dissolved-phase PCBs, via 1) release of contaminated porewater from the dredged sediment surface and 2) a release of contaminated solids into the water column, were quantitatively modeled to estimate a range of potential PCB contaminant loads that could be experienced. The modeling indicated that the amount of dissolved-phase PCBs likely to be introduced into the system is relatively small compared to baseline concentrations (i.e., without dredging).
7 The ROD requires development of a Community Health and Safety Plan to protect the community, including persons in residences and businesses, from potential exposures as a direct result of remedial work activities. The Community Health and Safety Plan will provide for community notification of ongoing health and safety issues, monitoring of contaminants and protection of the community from physical and other hazards. The plan will include a section that outlines the actions to be followed should monitoring of contaminants show contaminant levels above certain levels to be identified in the plan.

Malcolm Pirnie/ TAMS-Earth Tech ES-9 Peer Review Draft - October 2003 Engineering Performance Standards Executive Summary
Modeling USEPA’s peer-reviewed fate and transport models and bioaccumulation models (HUDTOX and FISHRAND) were used to simulate concentrations of PCBs in the water column, sediment, and fish in the Upper Hudson that could result from resuspension during the remedial dredging. The Farley model, along with FISHRAND, was used to simulate conditions in the Lower Hudson. The modeling efforts examined the impact of allowing the dredging to proceed at the action levels (both PCB concentrations in the water column and PCB mass loads). The model results indicate that the PCB water column concentrations and the PCB mass loads would have a negligible impact on PCB concentrations in Hudson River fish as compared to a scenario with no dredging-related releases (see footnote 2). Using the model results, the impact to human health and ecological receptors were calculated consistent with USEPA’s site-specific risk assessments.
Analyses of Baseline Water Quality Data In developing the Resuspension Standard, analyses were conducted using historical Hudson River water quality data to distinguish between the pre-dredging baseline concentrations of PCBs and suspended solids in the water column and PCB concentrations expected due to resuspension during dredging. Data collected since 1996 as part of GE’s ongoing weekly sampling program were statistically evaluated to derive the monthly mean concentration of PCBs and the variance for the months of the dredging season (i.e., May through November). The findings indicate maximum PCB concentrations during May and June of each year. Subsequent sensitivity analyses also indicate that the Total PCB loads specified in the Concern and Control Levels are similar to the range of existing baseline loads experienced by the river system. The baseline data to be collected prior to Phase 1 dredging will be used to refine these statistical analyses. Performance Standard for Dredging Residuals Objectives
The Performance Standard for Dredging Residuals (i.e., Residuals Standard) is designed to detect and manage contaminated sediments that may remain after initial remedial dredging in the Upper Hudson River. The ROD calls for removal of all PCB-contaminated sediments in areas targeted for dredging, and anticipates a residual of approximately 1 mg/kg Tri+ PCBs (prior to backfilling). The “residual sediments” may consist of contaminated sediments that were disturbed but escaped capture by the dredge, resuspended sediments that were redeposited/settled, or contaminated sediments remaining below the initial dredging cut elevations (e.g., due to uncertainties associated with interpolation between core nodes of the design sediment sampling program or insufficient core recovery).
The Residuals Standard requires the implementation of a post-dredging sampling and analysis program to detect and characterize PCB concentrations in the residual sediments.

Malcolm Pirnie/ TAMS-Earth Tech ES-10 Peer Review Draft - October 2003 Engineering Performance Standards Executive Summary
The post-dredging sediment data are compared to the anticipated residual of approximately 1 mg/kg Tri+ PCBs stated in the ROD and a group of statistical action levels developed for the Residuals Standard. The approach to be taken to manage the residual sediments (including re-dredging) is then selected depending on the statistical analyses of the post-dredging data. The use of statistical analyses to evaluate environmental datasets is a scientifically accepted practice. Statement of the Residuals Standard
Sampling and Analysis
The Residuals Standard requires the collection of surface sediment samples following dredging and after USEPA has confirmed that the design cut-lines have been achieved. Based on engineering judgment, the dredging is assumed to proceed within work areas that are similar to the median size of the targeted areas identified in the ROD. Therefore, a 5-acre “certification unit” was considered for the post-dredging sampling program and the subsequent statistical evaluation of the post-dredging surface sediment data. The Residuals Standard specifies that each certification unit be sampled for compliance directly after it is dredged, so that appropriate actions can be taken as the project progresses. In each 5-acre certification unit, sediment samples representing the 0-6 inch depth interval below the dredged sediment surface are to be obtained from 40 grid nodes and analyzed for Tri+ PCBs. The analytical results from those samples will be compared to the action levels in the Residuals Standard, and the required actions taken.8
Action Levels and Required Responses
The Residuals Standard requires the review of: 1) the Tri+ PCB concentrations in all 40 individual sediment samples within each 5-acre certification unit, 2) the mean Tri+ PCB concentration of the certification unit, 3) the median Tri+ PCB concentration of the certification unit, and 4) the average of the mean Tri+ PCB concentrations of a 20-acre joint evaluation area (certification unit under review and the three units within 2 mile stretch of river). The following responses are required for Phase 1 of the dredging project. Adjustments may be made before finalizing the Residuals Standard for Phase 2 based on analyses of the post-dredging sediment data collected during Phase 1. For example, if justified, the joint evaluation area may be increased to 40 acres for Phase 2.
1. Backfill (where appropriate) and Demobilize: At certification units with an arithmetic
average residual concentration less than or equal to 1 mg/kg Tri+ PCBs, no sediment sample result greater than or equal to 27 mg/kg Tri+ PCBs, and not more than one sediment sample result greater than or equal to 15 mg/kg Tri+ PCBs, backfill (where appropriate) and demobilize from the certification unit.
8 The Residuals Standard does not preclude collection of samples from deeper intervals, which may be cost-effective.

Malcolm Pirnie/ TAMS-Earth Tech ES-11 Peer Review Draft - October 2003 Engineering Performance Standards Executive Summary
2. Jointly Evaluate 20-acre Area: At a certification unit with an arithmetic average
residuals concentration greater than 1 mg/kg Tri+ PCBs and less than or equal to 3 mg/kg Tri+ PCBs, no sediment sample result greater than or equal to 27 mg/kg Tri+ PCBs, and not more than one sediment sample result greater than or equal to 15 mg/kg Tri+ PCBs, jointly evaluate a 20-acre area.
For 20-acre evaluation, if the area-weighted arithmetic average of the individual means from the certification unit under evaluation and the 3 previously dredged certification units (within 2 miles of the current unit) is less than or equal to 1 mg/kg Tri+ PCBs, backfill may be placed (with subsequent testing required). Otherwise, the certification unit must be re-dredged (see #4 below for actions required during and following re-dredging) or a sub-aqueous cap constructed. Re-dredging or capping is to be conducted at the specific areas within the certification unit that are causing the non-compliant mean concentration. If the certification unit does not comply with #1 or #2, above, after two re-dredging attempts, contingency actions may be implemented in lieu of further re-dredging attempts, as described in #5, below.
3. Re-dredge or Construct Sub-aqueous Cap: At a certification unit with an arithmetic
average residuals concentration greater than 3 mg/kg Tri+ PCBs but less than or equal to 6 mg/kg Tri+ PCBs, no single sediment sample result is greater than or equal to 27 mg/kg Tri+ PCBs, and not more than one sediment sample result is greater than or equal to 15 mg/kg Tri+ PCBs, re-dredge or construct a sub-aqueous cap. The choice of two options is provided to maintain flexibility and productivity (e.g., some areas may not be conducive to dredging). If re-dredging is chosen, the surface sediment of the re-dredged area must be sampled and the certification unit re-evaluated. If the certification unit does not meet the objectives of #1 or #2, above, following two re-dredging attempts, contingency actions may be implemented in lieu of further re-dredging attempts, as described in #5, below.
4. Re-dredging Required: For areas of elevated Tri+ PCB concentrations within a
certification unit with an arithmetic average residuals concentration greater than 6 mg/kg Tri+ PCBs or to address individual sampling point(s) with concentrations greater than or equal to 27 mg/kg Tri+ PCBs or more than one sampling point with concentrations greater than or equal to 15 mg/kg Tri+ PCBs, re-dredging is required.
Sampling at depths greater than 6 inches will be triggered by an arithmetic average residual concentration of greater than 6 mg/kg Tri+ PCBs. The spatial extent of this sampling at greater depth will be determined by the median Tri+ PCB concentration. If the median concentration in the certification unit is greater than 6 mg/kg Tri+ PCBs, collection and analysis of additional sediment samples is required from deeper intervals over the entire certification unit (e.g., 6-12 inch, 12-18 inch, etc.) as necessary to re-characterize the vertical extent of PCB contamination. If the median concentration is 6 mg/kg Tri+ PCBs or less, characterization of the vertical extent of contamination is required only in the areas within the certification unit that are

Malcolm Pirnie/ TAMS-Earth Tech ES-12 Peer Review Draft - October 2003 Engineering Performance Standards Executive Summary
contributing to the non-compliant mean concentration. Additional sampling to characterize the vertical extent of contamination is contemplated only once.
The Residuals Standard provides a mechanism for calculating the horizontal extent of re-dredging. All re-dredging attempts are to be designed to reduce the mean Tri+ PCB concentration of the certification unit to 1 mg/kg Tri+ PCBs or less. If after two re-dredging attempts, the arithmetic average Tri+ PCB concentration in the surface sediment still is greater than 1 mg/kg, then contingency actions are to be implemented as stated in #5, below.
5. Contingency Actions: At areas where two re-dredging attempts do not achieve
compliance with the residuals criteria, as verified by USEPA, construct an appropriately designed sub-aqueous cap, where conditions allow.
A flow chart illustrating implementation of the Performance Standard for Dredging Residuals is shown in Figure ES-1. The flow chart options are summarized in Table ES-2.
TABLE ES-2
SUMMARY OF DRAFT RESIDUALS STANDARD
Case
Certification Unit Mean
(mg/kg Tri+ PCBs)
No. of Sample Results where
27 > result >15 mg/kg Tri+ PCBs
No. of
Sample Results
> 27 mg/kg Tri+ PCBs
No. of Re-Dredging Attempts
Conducted
Required Action (when all conditions are met)*
A xi ≤ 1 ≤ 1 0 N/A Backfill certification unit (where appropriate); no testing of backfill required.
B N/A > 2 N/A < 2 Redredge sampling nodes and re-sample. C N/A N/A 1 or more < 2 Redredge sampling node(s) and re-sample. D 1 < xi < 3 ≤ 1 0 N/A Evaluate 20-acre average concentration. If 20-
acre average concentration < 1 mg/kg Tri+ PCBs, place and sample backfill. If 20-acre average concentration > 1 mg/kg, follow actions for Case E below.
E 3 < xi < 6 ≤ 1 0 < 2 Construct sub-aqueous cap immediately OR re-dredge.
F xi > 6 N/A N/A 0 Collect additional sediment samples to re-characterize vertical extent of contamination and re-dredge. If certification unit median > 6, entire certification unit must be sampled for vertical extent. If certification unit median < 6, additional sampling required only in portions of certification unit contributing to elevated mean concentration.
G xi > 6 N/A N/A 1 Re-dredge. H xi > 1 (and
20-acre average > 1)
> 2 > 1 2 Construct sub-aqueous cap (if any of these mean/sample result conditions are true) and two re-dredging attempts have been conducted OR choose to continue to re-dredge.
*Except for Case H, where any of the listed conditions will require cap construction.
Malcolm Pirnie/ TAMS-Earth Tech ES-13 Peer Review Draft - October 2003 Engineering Performance Standards Executive Summary
Preference for Dredging The selected remedy includes dredging of contaminated sediment, using PCB inventory as the primary means to target removal areas. The Residuals Standard of approximately 1 mg/kg Tri+ PCBs (prior to backfilling) is achievable based on case studies of other environmental dredging projects and can be applied on an area-wide average basis. However, review of case studies also indicates that, for some isolated areas, residual concentrations subsequent to the initial dredging attempt may exceed the 1 mg/kg Tri + PCB standard. The non-compliant residuals will likely be associated with difficult-to-dredge bottom conditions such as bedrock outcrops and boulder fields. As a result, in limited areas of the Upper Hudson River, it may be difficult to achieve the Residuals Standard. The capping contingency was added as an option to address this scenario. Capping of the existing PCB inventory was assessed as a remedial action alternative in the 2000 Feasibility Study, but was not selected as the most appropriate remedy, largely because it does not provide the same degree of reliability as dredging. This finding was due to the potential for defects or damage to the cap, thereby reducing its effectiveness relative to dredging while still requiring the sediment handling, processing, and disposal activities needed for dredging. The option for capping allowed in the Residuals Standard differs significantly from the remedial action alternative that was evaluated in the Feasibility Study in that the design dredging cut lines must be met and the targeted PCB inventory removed before this option can be considered (i.e., the capping contingency in the Residuals Standard is not a stand-alone remedial action alternative). Capping performed under the Residuals Standard would not be used to sequester significant PCB inventory and, because the mass of PCBs to be isolated is greatly reduced, the reliability of a cap placed for the purpose of isolating residual contamination is less critical. Were the cap breached in this situation, the potential spread of contamination would be much less because of the much lower contaminant mass and potential for mixing (dilution) with the surrounding capping material. Although application of a sub-aqueous cap has been added as an option in the Residuals Standard, there is a decided preference for dredging alone. Capping is less reliable for long-term control than dredging, and there are long-term operation and maintenance requirements associated with capping. Factors for deciding if an area should be capped and preparation of the site-specific cap design must include the river conditions (sediment texture, water depth, location in the channel, compatibility with habitat, etc.) as well as cost and impact on productivity. The option for capping is not meant to compensate for any deficiency in the dredging design or operations. USEPA will be fully apprised of the decision-making for areas to be capped in accordance with the requirements of the Standard as represented in Figure ES-1. Through the required submittal of Certification Unit-specific closure reports, USEPA will review the residual sampling data collected for the areas, confirm that the dredging cut lines have been met, review field notes, and review and approve each site-specific cap design. A limit on the amount of area that can be capped without obtaining approval from USEPA may be added to the standard for Phase 2, based on information gathered during Phase 1.

Malcolm Pirnie/ TAMS-Earth Tech ES-14 Peer Review Draft - October 2003 Engineering Performance Standards Executive Summary
Supporting Analyses and Assumptions
Certification Unit Sample Size and Sampling Grid
USEPA’s 2002 “Guidance for Choosing a Sampling Design for Environmental Data Collection” provides methods to determine the number of samples required to estimate the mean contaminant concentration of a given area. Evaluation of the 1984 Upper Hudson River sediment data (which is the most comprehensive to date), case study residuals data from other environmental dredging projects, and USEPA statistical guidance supported the use of 40 samples to characterize each 5-acre certification unit.
The 40 samples are to be collected from a regular triangular grid, which equates to a sample spacing of approximately 80 feet. The residuals sampling grid is to be offset from the design support sediment sampling grid by 40-60 percent of the grid spacing. Criteria for relocating sampling points, when necessary, are provided in the Residuals Standard. The Residuals Standard accommodates the application of the sampling grid to certification units that differ in size from the conceptual 5-acre unit. This flexibility is provided to address circumstances in which the remedial dredging may result in certification units of varying sizes (e.g., due to the installation of silt barriers, if used).
Action Level Development
The action levels originated with the statement in the ROD that anticipates a residual in dredged areas of approximately 1 mg/kg Tri+ PCBs (before backfilling). Statistical thresholds were developed to evaluate residuals sampling data and trigger responses, a common scientifically accepted practice for interpreting environmental data. The thresholds consist of action levels for the area-weighted mean concentration (upper confidence limits, or UCLs) and action levels for individual sample results (prediction limits, or PLs). Both UCLs and PLs are measures of the probability that a sample result belongs to a sample population that has a specific mean; consistent with the ROD, the desired mean for Upper Hudson River residuals is 1 mg/kg Tri+ PCBs or less).
Since no residual sediment data exist for the Upper Hudson River (and will not exist until after remedial dredging is initiated), UCLs and PLs were calculated based on residual sediment data from other environmental dredging projects. The values derived for the Residuals Standard are: 3 mg/kg Tri+ PCBs (95% UCL), 6 mg/kg Tri+ PCBs (99% UCL), 15 mg/kg Tri+ PCBs (97.5% PL), and 27 mg/kg Tri+ PCBs (99% PL). These criteria are used to evaluate the degree to which the residual of approximately 1 mg/kg Tri+ PCBs specified in the ROD is attained in a particular certification unit, and to trigger appropriate actions for managing residual sediments.
Requirement for Collection of Additional Core Samples
The Residuals Standard requires the collection of additional sediment samples where the initial mean Tri+ PCB concentration (0-6 inch interval) for the certification unit is greater than 6 mg/kg. Residual sediments with a Tri+ PCB concentration above the 99% UCL

Malcolm Pirnie/ TAMS-Earth Tech ES-15 Peer Review Draft - October 2003 Engineering Performance Standards Executive Summary
indicates the dredge was still removing material from a contaminated stratum. In this case, it is possible that additional contaminated sediment “inventory” remains to be removed. The median concentration is used as a criterion to determine whether deeper sediment samples (e.g., 6-12 inch, 12-18 inch, etc. as necessary to define the vertical extent of contamination) must be collected from all 40 sampling points in the certification unit or, as appropriate, from smaller sub-areas where isolated or clustered elevated nodes are causing the mean concentration to exceed the requirements of the standard. Following the collection and evaluation of the deeper sediment samples, new cut-lines must be established and re-dredging conducted to reduce the residual concentrations.
Required Number of Re-dredging Attempts
To maintain dredging productivity, and noting that case studies of other environmental dredging projects report diminishing returns for successive re-dredging in an attempt to obtain the remedial objectives, the number of required re-dredging attempts was set at two attempts. Re-dredging attempts are dredging efforts conducted to reduce residual concentrations, and by definition occur subsequent to the USEPA’s confirmation of attainment of the initial design cut elevations to remove inventory. The Construction Manager may also choose to conduct additional re-dredging attempts, based on cost considerations or knowledge of the dredging area, with the intent of reducing the mean Tri+ PCB concentration in the certification unit to 1 mg/kg or less Tri+ PCBs.9 Based on the Phase 1 results and the second peer review, USEPA may modify the required number of redredging attempts (or the triggers for engineering contingencies and capping, described below).
Engineering Contingencies and Capping
In the event that the dredging operations after two or more dredging attempts cannot achieve the Residuals Standard of a mean concentration of 1 mg/kg Tri+ PCBs or less, engineering contingencies must be implemented, including the construction of a sub-aqueous cap, where conditions permit, over the recalcitrant area to address the residual PCB contamination.
Where further dredging is not practicable, the sub-aqueous cap is intended to support recovery of the Hudson River ecosystem following removal of inventory, similar to the function of the backfill. The type of backfill and capping material will vary to account for the river conditions and ecological setting. This will be an important consideration for the remedial design with regard to habitat issues, and may require the design of multi-layer caps that address both residuals isolation and habitat recovery. The installation of a sub-aqueous cap is likely to further reduce residual concentrations of PCBs and may require additional dredging to accommodate the cap thickness. While not expected, should conditions encountered in the navigation channel require the installation 9 This option is limited to circumstances where no project delays affecting the ability to meet the Productivity Standard will be incurred.

Malcolm Pirnie/ TAMS-Earth Tech ES-16 Peer Review Draft - October 2003 Engineering Performance Standards Executive Summary
of a sub-aqueous cap, sufficient dredging may be required to install the cap and an upper, armored layer below the navigation depth. The armored layer would act as an indicator during future navigational dredging in the channel to prevent damage to the cap. In order to avoid delays to the remediation, prototype capping specifications for typical river conditions and ecological settings will need to be developed during the remedial design phase. These prototypes can then be readily customized for the situations encountered during remediation. General cap design criteria and relevant USEPA and USACE guidance documents for cap design are identified in the Residuals Standard. The specific design details of the capping contingency are to be addressed in the design phase of the Hudson River PCBs Site remediation. USEPA will review the submitted design for conformance with the requirements of the ROD and the engineering performance standards. The cost of cap construction and maintenance should be balanced by the Construction Manager, in consultation with USEPA, against the cost of additional re-dredging attempts and their respective impacts on the schedule. Following the completion of Phase 1, the areas capped (if any) during Phase 1 will be evaluated to review the decisions that were made given river conditions in the capped areas and impacts on productivity. Using the information gathered during Phase 1 and the data gathered during the design sampling (e.g., subbottom profiling results), a limit on the amount of area that can be capped without prior approval from USEPA may be added to the standard for Phase 2, if warranted.
Joint Evaluations and Backfill Testing
The concept of a 20-acre joint evaluation was developed to maintain flexibility where the mean residual concentrations in selected 5-acre certification units are only slightly higher than 1 mg/kg Tri+ PCBs. The size of the joint evaluation area was chosen based on USEPA’s peer-reviewed fate, transport and bioaccumulation models for the Upper Hudson River (HUDTOX and FISHRAND), which were used to evaluate recovery of the Upper Hudson following remediation. The models used river segments in the Thompson Island Pool that are similar in size to the 20-acre joint-evaluation areas. The benefits of targeted remedial dredging projected by the USEPA models hold if the mean residuals concentration is 1 mg/kg Tri+ PCBs or less on average, over 20-acre areas.
If a certification unit has a mean residuals concentration of greater than 1 mg/kg Tri+ PCBs but less than or equal to 3 mg/kg Tri+ PCBs, and the average concentration in the 20-acre joint evaluation area that contains the certification unit is 1 mg/kg Tri+ PCBs or less, backfill may be placed without a re-dredging attempt. In this case, testing of the backfill after placement is required.
The backfill testing is to be accomplished by collecting surface sediment samples (0-6 inches) of the backfill after it is placed, using the same grid spacing used for the residual sediment sampling. Each 0-6 inch backfill sample is to be analyzed for PCBs. The mean concentration of PCBs in the backfill samples must be 0.25 mg/kg Tri+ PCBs or less. If

Malcolm Pirnie/ TAMS-Earth Tech ES-17 Peer Review Draft - October 2003 Engineering Performance Standards Executive Summary
this criterion is not met, the non-compliant areas of the backfill layer must be removed via dredging, replaced, and retested until the criterion is achieved. Alternately, in some areas it may be possible to place additional backfill material. However USEPA approval is required for this option. Performance Standard for Dredging Productivity Objective The Performance Standard for Dredging Productivity (i.e., Productivity Standard) is designed to monitor and maintain the progress of the dredging to meet the schedule stated in the ROD. The project schedule stated in the ROD has a six-year duration and consists of the first dredging season designated “Phase 1” (initial dredging at a reduced scale) followed by five dredging seasons collectively designated “Phase 2” (each with dredging at full production to remove the remainder of the contaminated sediments identified for removal). The Productivity Standard specifies the cumulative volume of sediment to be dredged during each dredging season, based on the current estimate of 2.65 million cubic yards of sediment to be removed.
Statement of the Productivity Standard
Required and Recommended Cumulative Annual Dredging Volumes The Productivity Standard requires compliance with minimum cumulative volumes of sediment for each dredging season and targets larger volumes for the first five dredging seasons, as provided in Table ES-3 below. The minimum cumulative volume of sediment to be removed, processed and shipped off-site by the end of each dredging season is the quantity shown in the “Required Cumulative Volume” column. The targeted cumulative volumes allow for the work to be designed for completion at a somewhat faster rate, so that a reduced volume remains in the sixth and final dredging season. This recommended approach provides additional time to address any unexpected difficulties within the schedule called for in the ROD. The targeted cumulative dredging volumes are shown in the “Target Cumulative Volume” column.

Malcolm Pirnie/ TAMS-Earth Tech ES-18 Peer Review Draft - October 2003 Engineering Performance Standards Executive Summary
Table ES-3: Productivity Requirements and Targets
Dredging Season(1) Required Cumulative Volume (cubic yards)
Target Cumulative Volume (cubic yards)
Phase 1 (Year 1) Approx. 240,000 265,000 Phase 2 (Year 2) 720,000 795,000 Phase 2 (Year 3) 1,200,000 1,325,000 Phase 2 (Year 4) 1,680,000 1,855,000 Phase 2 (Year 5) 2,160,000 2,385,000 Phase 2 (Year 6) 2,650,000(2) 2,650,000(2)
(1) The overall completion schedule, if appropriate, should be adjusted to be consistent with the total volume of sediment to be dredged as determined by USEPA during remedial design (for example, based on the findings of the design support sediment characterization program). (2) Represents total estimated in-situ volume to be removed as per the ROD, exclusive of any amounts generated by re-dredging to meet the Residuals Performance Standard.
Monitoring and Recordkeeping
The Productivity Standard requires the Contractor managing the dredging project to track and report progress to the USEPA. The recordkeeping, in addition to and as verified by USEPA or its representatives in the field, will become the basis for measuring compliance with the Productivity Standard By March 1 of each year, the Contractor shall provide USEPA with a schedule showing cumulative volumes planned to be removed each month during the upcoming dredging season (i.e., Production Schedule). The production schedule should consider the targeted cumulative volumes and must meet or exceed the requirements of the Productivity Standard (or as revised in accordance with USEPA-approved design documents). Monthly and annual productivity progress reports shall be submitted to USEPA. Monthly productivity progress reports will be compared to the production schedule submitted by the Contractor and will be the primary tool for assessing whether the project is on schedule. Annual production progress reports, prepared at the conclusion of each dredging season, will be used to evaluate compliance with the Productivity Standard.
The monthly and annual reports will summarize daily records of the dredging locations, approximate production and number of operating hours of operation for each dredge, estimates of in-situ sediment volumes removed, and the weight of dewatered sediments and estimated mass of PCBs shipped off-site.

Malcolm Pirnie/ TAMS-Earth Tech ES-19 Peer Review Draft - October 2003 Engineering Performance Standards Executive Summary
Action Levels and Required Responses
The Productivity Standard’s action levels and responses are summarized in Table ES-4 below.
Table ES-4: Action Levels and Required Responses Action Level
Description
Response
Concern Level
Monthly production rate falls 10% below scheduled rate.
Notify USEPA and take immediate steps to erase shortfall in production over next two months.
Control Level
Production falls below scheduled production by 10% or more for two or more consecutive months.
Submit an action plan explaining the reasons for the production shortfall and describing the engineering and management actions taken or underway to increase production and erase shortfall by end of the dredging season.
Standard Annual cumulative volume fails to meet required production requirements.
Action to be determined by USEPA.
In any dredging season, if the planned monthly cumulative production falls below the scheduled amount by 10 percent or more, the Contractor shall identify the cause of the shortfall to USEPA and take immediate steps (adding equipment and crews, working extended hours, modifying the plant and equipment or approach to the work, or other) to erase the cumulative shortfall over the following two months or by the end of the dredging season, whichever occurs sooner. Any steps taken to increase production shall conform to all other Performance Standards established for the project. Significant changes to operating procedures or equipment, such as use of an entirely different dredging technology or means of processing the dredged sediments prior to shipment, will require USEPA approval. If the monthly productivity falls below the scheduled productivity by 10 percent or more for two or more consecutive months, the Contractor shall provide a written action plan to the USEPA explaining the reasons for the production shortfall and describing the engineering and management steps taken or underway to erase the shortfall in production during that dredging season. If an annual production shortfall occurs, USEPA will determine the appropriate action to address non-compliance with the Productivity Standard. USEPA will also evaluate the circumstances that led to the annual shortfall, if encountered, when assessing compliance.

Malcolm Pirnie/ TAMS-Earth Tech ES-20 Peer Review Draft - October 2003 Engineering Performance Standards Executive Summary
Supporting Analyses and Assumptions
Conceptual Project Schedule To evaluate the feasibility of the required and target cumulative annual volumes specified in the Productivity Standard (refer to Table ES-3), a detailed conceptual critical path schedule was developed using Primavera Systems, Inc. software. A number of conservative assumptions were made regarding means and methods that could be used during the dredging project in order to demonstrate that the Productivity Standard is achievable. The Productivity Standard, however, does not require that the remedial design adhere to the assumptions and work sequence used to develop the Productivity Standard conceptual schedule. The schedule output indicates that both the required and the target cumulative volumes developed for the Productivity Standard are reasonable and achievable. Selected examples of the supporting analyses and assumptions used to develop the schedule are summarized below.
Removal Volume
The Productivity Standard is based on the removal of approximately 2.65 million cubic yards of sediment, as stated in the ROD. This volume may be revised upward or downward based on the results of the design support sediment characterization program. The Productivity Standard requires adjustment if the final targeted dredging volume differs by more than 10% from the current estimate.
Construction Schedule and Dredging Season
The Productivity Standard is based on a construction period for the project of six (6) years (including Phases 1 and 2, as stated in the ROD) and assumes that there will be a minimum of 30 weeks available each year to conduct dredging operations, unconstrained by any work hours limitations. To implement this schedule, coordination would be required with the New York State Canal Corporation to extend their routine hours and season of operation.
Dredging Equipment
Both mechanical and hydraulic dredges were considered during the development of the conceptual schedule. Smaller specialty equipment was also considered for use near shorelines, in shallow water, and in difficult locations (such as shallow bedrock areas). Estimated dredging volumes were developed by river section and dredge type for the schedule. The conceptual schedule included only the use of a mechanical dredge as a conservative approach, since mechanical dredging is typically a slower process. The schedule assumes that dredging can take place in multiple river sections simultaneously, with the dredging generally progressing from upstream to downstream within each river section.
Malcolm Pirnie/ TAMS-Earth Tech ES-21 Peer Review Draft - October 2003 Engineering Performance Standards Executive Summary
Work Elements and Sequence
The conceptual schedule assumptions address the potential elements and sequence of the dredging work. The assumptions include, but are not limited to, the following: • Silt barriers, while not required by the Productivity Standard, were assumed to be
installed for all dredging work outside the navigation channel. The assumed silt barriers consist of segments of steel sheet piling installed at the upstream and downstream limits of the work area, connected by high density polyethylene (HDPE) curtains with floatation booms and weighted at the bottom. This assumption is conservative with respect to the schedule, which accounts for the time necessary to install and remove the silt barriers.
• Silt barriers are removed only after backfill and shoreline stabilization where
appropriate, has been completed. • Backfilling and shoreline stabilization at each area dredged in a particular season
is completed prior to demobilization at the end of each dredging season. • Work is conducted in a generally upstream to downstream sequence within a
given river section.
Sediment Processing/Transfer Facility The conceptual schedule of the Productivity Standard assumed the establishment of one land-based sediment processing/transfer facility, located at the northern extreme of the 40-mile long project area. Conceptual design calculations were prepared regarding railroad sidings, transportation of scows loaded with dredged sediments via the canal system, and other transportation issues to evaluate whether the dredged sediment volumes to be removed could be transferred, processed (e.g., dewatered), and shipped off-site at an appropriate rate (compared to the required and target production rates). The assumption of one facility was made to be conservative with respect to the schedule, in that it requires sufficient time for sediments removed from any location within the Upper Hudson to be transported to one location. A less conservative assumption would entail two facilities, as was assumed for purposes of evaluating engineering feasibility of the remedy. Note, however, that the assumption does not reflect a worst case based on available information, which would be one facility at or below the southern extreme of the project area. Interactions Among Performance Standards The development of the Performance Standards included consideration of the degree to which they are interrelated. Some of the major points of interaction between the Standards, and issues identified as being significant to the compliance with all the

Malcolm Pirnie/ TAMS-Earth Tech ES-22 Peer Review Draft - October 2003 Engineering Performance Standards Executive Summary
standards, are summarized below. The design of the project should be optimized in consideration of these interactions. • The Resuspension Standard controls PCB mass loss during dredging. It is
important to note that PCB mass loss is intrinsically linked to dredging productivity, in that ongoing project activities (dredging, vessel traffic, installation and removal of barriers, if used, and debris removal) will contribute to PCB mass loss. The Resuspension Standard Concern Level and Control Level are triggered if the average daily Total PCB mass loss exceeds 600 g/day for more than a one-week, or four-week stretch, respectively.10 Non-compliance with the Productivity Standard beyond the six (6) year schedule will increase the total project PCB mass loss. If unforeseen difficulties require extensions to the schedule, the daily allocation of PCB mass loss will have to be commensurately lowered during the remainder of the dredging project to maintain the PCB mass loss of 650 kg upon which the Resuspension Standard action levels are based. Achievement of the target cumulative annual volumes in the Productivity Standard is strongly encouraged to minimize the total project-related downstream transport of PCBs.
• Balancing the limits on PCB concentrations in the water column in the
Resuspension Standard and the cumulative annual volumes in the Productivity Standard requires careful planning during equipment deployment considering, for example, the impacts of the number and types of equipment selected, location of dredging areas, and the monthly baseline variation in PCB water column concentrations. This is an area where Phase 1 monitoring is expected to contribute significantly to the understanding of how to efficiently proceed with dredging and maintain compliance with the Performance Standards.
• The Residuals Standard requires characterization of residual sediments, which
may include redeposited/settled sediments. To avoid recontamination of a satisfactorily completed certification unit, the Productivity Standard assumes that dredging generally will proceed from upstream to downstream within each River Section. The Resuspension Standard modeling also indicates that the dredge may create a deposit of resuspended sediments slightly downstream of each dredging area, providing further incentive for work to proceed generally from upstream to downstream.
• The Productivity Standard includes a conceptual sequence of work and schedule
for the dredging work to validate the feasibility of the required and target cumulative annual dredging volumes. The conceptual sequence of work and schedule necessarily included, among other elements, the time needed to comply with the requirements of the Residual Standard for sampling and analysis of each certification unit, possibly two re-dredging attempts and/or sub-aqueous cap
10 The daily rate is based on attainment of the recommended target cumulative volume as specified in the Productivity Standard, and should be prorated according to the production rate planned in the Production Schedule to be submitted annually to USEPA.

Malcolm Pirnie/ TAMS-Earth Tech ES-23 Peer Review Draft - October 2003 Engineering Performance Standards Executive Summary
construction, and placement of backfill (where appropriate) prior to demobilization. For instance, USEPA conservatively assumed that re-dredging could require half of the total time spent on the initial dredging. However, if significantly more time is needed for re-dredging than was estimated in the conceptual schedule, it may affect the ability to meet the overall productivity standard. Understanding that these work elements contribute to the project duration, flexibility was designed in the Residuals Standard (e.g., provisions for 20-acre joint evaluations during Phase 1, options for immediate capping where the certification unit mean is only slightly greater than the objective of 1 mg/kg Tri+ PCBs, and provisions for successively closing portions of a certification unit as dredging progresses) to maintain productivity. The experience and information gained during Phase 1 of dredging will be the subject of the second peer review. This peer review will evaluate the project performance in Phase 1, so that any necessary refinements and adjustments can be made to the dredging operations or standards, including the Productivity Standard, prior to the second phase of dredging.

Select the nodes of concern, including nodes with
concentration > 97.5% PL, such that the arithmetic average after
re-dredging is <1 mg/kg.
Dredge to design depth and collect and analyze sediment
samples per Residuals Standard
Review sediment sample Tri+ PCB concentration results and calculate arithmetic average
(avg.) Tri+ PCB concentration for certification unit
All samples within a certification unit <1 mg/kg Tri+ PCBs?
Is 0-6” certification unit median < 99%
UCL ?
Is 0-6” certification unit arithmetic avg. <
99% UCL?
All individual
sample concentrations < 99% PL and no more than one
sample > 97.5% PL?
Is 0-6” certification unit arithmetic avg. <
95% UCL?
Certification unit
completed
Select the entire certification unit as affected area
Select the nodes of concern, including nodes with concentration > 97.5% PL, such that the arithmetic
average after re-dredging is <1 mg/kg.
Re-characterize the vertical extent of contamination and revise the cut line, as necessary (only required after
initial dredging attempt)
Calculate area-weighted avg. Tri+ PCB concentration
for 20-acre area
Is20-
acre area-weighted avg. < 1
ppm?
Backfilland sample
Backfill 0-6 inch arithmetic avg. concentration < 0.25 mg/kg Tri+
PCB?
Dredge and replace non-compliant backfill nodes and/or place additional
backfill d
Is 0-6” certification unit
arithmetic avg. < 1 mg/kg?
Have 2 re-dredging attempts been conducted?
Re-dredge and resample
Yes Yes Yes Yes Yes
Yes
YesYes
Yes
No
No No No NoNo
No
NoNo
Option 1
Option 2
Figure ES-1Residual Evaluation Flow Chart
Have 2 re-dredging attempts been conducted?
Yes
No
Cap -Construct sub-aqueous cap over non-compliant area. When possible, dredge additional depth to
accommodate cap thickness. Backfill the remaining area. c
[Additional dredging attempts may be made at the contractor’s discretion. b]
Select the area for capping such that the arithmetic avg. of the non-
capped area is < 1 mg/kg Tri+ PCBs, no sample > 99% PL, not
more than one sample > 97.5% PL.
START HERE a
END
Backfillwhere
appropriate
Notesa) Shaded figures represent primary certification path.b) Areas can be re-dredged if no delay to the project schedule will be incurred.c) Sub-aqueous caps will not be placed in areas of shallow bedrock located in the navigation channel or in areas with shallow water.d) Placement of additional backfill is contingent on sufficient water depth and USEPA approval.
Optional

Malcolm Pirnie/TAMS-Earth Tech 1 Peer Review Draft – October 2003 Engineering Performance Standards Introduction
Introduction Draft Engineering Performance Standards – Peer Review Copy
Hudson River PCBs Superfund Site Overview In February 2002, the United States Environmental Protection Agency (USEPA) issued a Record of Decision (ROD) for the Hudson River PCBs Superfund Site (Site). The ROD calls for targeted environmental dredging of approximately 2.65 million cubic yards of PCB-contaminated sediment from the Upper Hudson River (approximately 40 river miles) in two phases over a six-year period, and monitored natural attenuation of the PCB contamination that remains in the river after dredging. In the ROD, USEPA identified five remedial action objectives, which are as follows:
• Reduce the cancer risks and non-cancer health hazards for people eating fish from the Hudson River by reducing the concentration of PCBs in fish;
• Reduce the risks to ecological receptors by reducing the concentration of PCBs in fish;
• Reduce PCB levels in sediments in order to reduce PCB concentrations in river (surface) water that are above applicable or relevant and appropriate requirements for surface water;
• Reduce the inventory (mass) of PCBs in sediments that are or may be bioavailable; and
• Minimize the long-term downstream transport of PCBs in the river. In selecting its cleanup remedy, USEPA required that performance standards for resuspension during dredging, production rates during dredging, and residuals after dredging (together called the “Engineering Performance Standards”) be established. This decision was made to address comments received from members of the public who expressed a wide spectrum of views on the project. Some suggested that the environmental dredging could “do more harm than good” and take much longer than stated, while others were concerned that the ROD was not sufficiently comprehensive in its requirements for the environmental cleanup. USEPA required these performance standards in its final cleanup decision to promote accountability and ensure that the cleanup meets the human health and environmental protection objectives set forth in the ROD.1 This Public Review Copy of the Draft Engineering Performance Standards document is published in four volumes. The standards are presented in three parts, each contained in a single volume; an Appendix is contained in the fourth volume. Each part discusses one performance standard: Part 1 discusses the Performance Standard for Dredging
1 Other performance standards will address public concerns related to potential impacts of the cleanup on the surrounding community, such as air emissions, navigation and noise; these are being developed separately.

Malcolm Pirnie/TAMS-Earth Tech 2 Peer Review Draft – October 2003 Engineering Performance Standards Introduction
Resuspension, Part 2 provides the Performance Standard for Dredging Residuals, and Part 3 contains the Performance Standard for Dredging Productivity. Each of these parts includes a concise statement of the standard, discussion on the development approach, supporting analyses, and rationale used to derive the performance standard. Each part further provides a plan for refinement of the standard to account for additional data that may be obtained subsequent to publishing the standard, as well as to address evaluation of Phase 1. The Appendix contains a review of pertinent information derived from case studies of other environmental dredging projects considered in developing the draft Engineering Performance Standards. Some of the information was derived from research of the literature and public web sites, while additional information was developed from interviews with project managers and technical staff. Consistent with the ROD, the Engineering Performance Standards were developed in consultation with New York State, the National Oceanic and Atmospheric Administration and the U.S. Fish and Wildlife Service. (New York State is developing substantive water quality certification requirements for the environmental dredging pursuant to the federal Clean Water Act; USEPA will review the requirements when they become available for any implications with respect to the Engineering Performance Standards). USEPA’s consultants included a team of senior scientists and engineers who developed the standards, which then were reviewed by a separate team of recognized technical experts. General Electric Company reviewed a version of the draft standards previous to this one. Comments from these organizations were considered in preparing a Public Review Copy of the Draft Engineering Performance Standards. Following the close of the public comment period on July 14, 2003, the Draft Engineering Performance Standards was revised to create the Draft Engineering Performance Standards – Peer Review Copy. This version of the standards will be peer reviewed by a panel of independent experts, modified as appropriate to address the peer reviewers’ recommendations, and then implemented during the Phase 1 dredging. The results from the first season of dredging (Phase 1) also will be peer reviewed, and the Engineering Performance Standards will be refined or adjusted, if necessary, for the remaining dredging seasons (Phase 2). It is important to note that the standards developed herein are intended only for application to the remedial environmental dredging of the Upper Hudson River called for in USEPA’s 2002 ROD for the Hudson River PCBs Superfund Site at this juncture in time. The standards are not intended to provide general or universal guidance for environmental dredging. Other projects and locations may have specific features differing from those of the Hudson River, and the standards presented here may not be applicable to those projects. Site Background The Hudson River PCBs Superfund Site encompasses the Hudson River from the Fenimore Bridge in Hudson Falls (River Mile [RM] 197.3) to the Battery in New York Harbor (RM 0), a stretch of nearly 200 river miles (about 320 km). The Upper Hudson

Malcolm Pirnie/TAMS-Earth Tech 3 Peer Review Draft – October 2003 Engineering Performance Standards Introduction
River portion of the Site extends from the Fenimore Bridge to the Federal Dam at Troy (RM 153.9), a distance of just over 43 river miles. To facilitate effective project management and address Site complexities, the Upper Hudson River has been further divided into three major sections: River Sections 1, 2 and 3. River Section 1 extends from the former Fort Edward Dam just north of Rogers Island (RM 194.8) to the Thompson Island (TI) Dam (RM 188.5), a stretch of the river also known as the Thompson Island Pool; River Section 2 extends from the TI Dam to the Northumberland Dam (RM 183.4), which includes a 2.3-mile, non-navigable stretch of the river from the TI Dam to the Fort Miller Dam; and River Section 3 extends from the Northumberland Dam to the Federal Dam. Upstream of River Section 1 is a river segment between the Fenimore Bridge and the former Fort Edward Dam, a distance of about 2.5 river miles. During an approximately 30-year period ending in 1977, General Electric (GE) used PCBs in its capacitor manufacturing operations at its Hudson Falls and Fort Edward, NY facilities. PCB oils were discharged both directly and indirectly from these plants into the Hudson River. This included both non-permitted and permitted discharges. Even after GE received a permit in 1975, permit exceedances occurred. Estimates of the total quantity of PCBs discharged directly from the two plants into the river from the 1940s to 1977 are as high as 1,330,000 pounds (about 605,000 kg). Many of the PCBs discharged to the river adhered to sediments and accumulated downstream with the sediments as they settled in the impounded pool behind the former Fort Edward Dam, as well as other depositional areas farther downstream. Because of its deteriorating condition, the Fort Edward Dam was removed in 1973. Five areas of PCB-contaminated sediments were exposed due to the lowering of the river water level when the Fort Edward Dam was removed. These five areas are known as the Remnant Deposits. During subsequent spring floods, PCB-contaminated sediments from the Fort Edward Dam area were scoured and transported downstream. In 1984, USEPA completed a Feasibility Study (FS) and issued a Record of Decision (ROD) for the site (the 1984 ROD). The 1984 ROD contained the following components:
• An interim No Action decision with regard to PCBs in the sediments of the Upper Hudson River;
• In-place capping, containment, and monitoring of exposed Remnant Deposits (in the area of RM 195 to 196) from the former impoundment behind the Fort Edward Dam, stabilization of the associated river banks and revegetation of the areas; and
• A detailed evaluation of the Waterford Water Works treatment facilities, including sampling and analysis of treatment operations to see if an upgrade or alterations of the facilities were needed.
Although commercial uses of PCBs ceased in 1977, GE’s Fort Edward and Hudson Falls plants continue to contaminate the Hudson River with PCBs, due primarily to releases of PCBs via bedrock fractures from the GE Hudson Falls plant. In September 1991, GE

Malcolm Pirnie/TAMS-Earth Tech 4 Peer Review Draft – October 2003 Engineering Performance Standards Introduction
detected an increase in PCB concentrations at the Upper Hudson River water sampling stations being monitored as part of the construction monitoring program associated with Remnant Deposits capping. GE ultimately attributed the higher levels to the collapse of a wooden gate structure within the abandoned Allen Mill located adjacent to the river bank near the GE Hudson Falls plant. As reported by GE, the gate structure had diverted water from a tunnel that had been cut into bedrock, thereby preventing oil-phase PCBs originating at the GE Hudson Falls plant, that had migrated to the tunnel via subsurface bedrock fractures, from flowing into the river. From 1993 to 1995, GE removed approximately 45 tons of PCBs from the tunnel under NYSDEC jurisdiction. In 1994, GE documented the presence of PCB-contaminated oils in bedrock seeps at Bakers Falls adjacent to its Hudson Falls plant. GE has instituted a number of mitigation efforts that have resulted in a decline, but not cessation, of PCBs entering the river through the seeps. The 1984 ROD did not address the PCB-contaminated oil leaking through bedrock in the vicinity of the GE Hudson Falls plant, which was not known to USEPA at the time. GE is conducting remedial activities at the GE Hudson Falls Plant Site under an Order on Consent between the New York State Department of Environmental Conservation (NYSDEC) and GE. The changing upstream loading from the Hudson Falls site must be accounted for in any evaluation of PCB levels within the Hudson River. In addition, the GE Fort Edward Plant outfall area is likely a continuing source of PCBs to the Hudson River , although the Fort Edward outfall area currently is being remediated by the New York State Department of Environmental Conservation pursuant to state law. In December 1989, USEPA announced its decision to initiate a detailed Reassessment Remedial Investigation/Feasibility Study (RI/FS) of the interim No Action decision for the Upper Hudson River sediments. This was prompted by the five-year review required by the Comprehensive Environmental Response, Compensation, and Liability Act (CERCLA), technical advances in sediment dredging and treatment/destruction technologies, as well as a request by NYSDEC for a re-examination of the 1984 decision. The February 2002 ROD is the result of the Reassessment. Engineering Performance Standards Development This document presents the development of the performance standards required by the ROD and discusses the major measure(s) of performance in each case, the technique(s) used to assess performance, the supporting analyses for the recommendations (including case studies), and major possible interactions among the performance standards. To develop meaningful performance standards, it was necessary to envision a likely sequence of work for the major elements of the remediation project. It is understood that this “model sequence” may require adjustment as the remedial design is prepared. The model sequence of work outlined below is based on information in the ROD and emphasizes the points where the performance standards will interact with the work.
1. Extensive sediment sampling and analyses are conducted to identify locations where the Tri+ PCB mass per unit area (MPA) is 3 g/m2 or greater in River

Malcolm Pirnie/TAMS-Earth Tech 5 Peer Review Draft – October 2003 Engineering Performance Standards Introduction
Section 1 and 10 g/m2 or greater in River Section 2. In River Section 3, identification of target areas is based on removal of selected sediments with high concentrations of PCBs, high erosional potential and potential for uptake by biota. This information, in conjunction with other field investigation data, is used to determine target area boundaries for dredging and to delineate dredging “cut-lines.” The dredging cut-lines are to be designed to remove all PCB-contaminated sediments within a particular targeted area (i.e., the dredged bottom surface concentration is anticipated to be below 1 mg/kg).
2. Regular water column sampling and analysis is conducted to evaluate the PCB and total suspended solid (TSS) concentrations in the Hudson River prior to dredging (background concentrations).
3. Upon commencement of remediation, environmental dredging is employed to remove contaminated sediments from the targeted areas. Water quality monitoring is conducted continuously according to the requirements of the Dredging-Related Resuspension Performance Standard. Contingency actions are implemented to control resuspension releases if the action levels in the standard are contravened.
4. On completion of dredging in a particular targeted area, post-dredging sediment sampling is conducted according to the requirements of the Dredging Residuals Performance Standard to confirm that residual PCB concentrations are less than or equal to the anticipated residual concentration of approximately 1 mg/kg, as specified by the ROD. Contingency actions are implemented if sediment sample results from a particular targeted area are non-compliant. Following verification, backfill is placed where appropriate and shoreline stabilization is completed.
5. The progress of the dredging project is monitored according to the requirements of the Dredging Productivity Performance Standard. Contingency actions are implemented if the dredging production rate deviates significantly from that required by the performance standard.
6. At the completion of the first dredging construction season (Phase 1), remedial operations are assessed for compliance with the various performance standards. If necessary, adjustments to the remedial operations and performance standards are recommended, evaluated by the peer review panel, and implemented.
7. Phase 2 dredging commences and continues through project completion. Extensive monitoring (including that required to establish compliance with the performance standards) continues throughout the life of the project. Adjustments to the remedial operations and performance standards may also be implemented during Phase 2 consistent with the peer-reviewed approach.
8. Property restoration and decommissioning of the processing/transfer facility location(s) are conducted as expeditiously as practicable following completion of dredging and backfill activities. Habitat replacement and associated monitoring are performed in accordance with the approved plan.
Based on the analyses performed to develop the standards, USEPA believes that the standards are consistent with the human health and environmental protection objectives of the ROD. USEPA has determined:

Malcolm Pirnie/TAMS-Earth Tech 6 Peer Review Draft – October 2003 Engineering Performance Standards Introduction
• Compliance with the Resuspension Standard will limit the concentration of Total PCBs in river water one mile or more downstream of the dredging area to levels that are acceptable for potable water under the requirements of the Safe Drinking Water Act;
• Resuspension of PCBs in compliance with the Resuspension Standard will have a
negligible adverse effect on Tri+ PCB concentrations in Hudson River fish, as compared to a scenario assuming no dredging-related PCB releases;2
• Compliance with the Control Level of the Resuspension Standard is expected to
result in a Total PCB load (mass) transported downstream during remedial dredging that is similar to the range of Total PCB loads detected during recent baseline (i.e., pre-dredging) conditions, as documented by weekly measurements from 1996 to 2001;
• The Residuals Standard specified in the ROD (approximately 1 mg/kg Tri+ PCBs
prior to backfilling) is achievable based on case studies of other environmental dredging projects and can be applied in the Upper Hudson on an area-wide average basis;
• The Productivity Standard will result in completion of the dredging within the six
dredging seasons called for in the ROD, based on an example conceptual schedule for project implementation; and
• The three Draft Engineering Performance Standards, including their respective
monitoring programs, are achievable individually and in combination. The standards appropriately balance their points of interaction, allowing flexibility during design and implementation while ensuring protection of human health and the environment. For example, the requirements concerning additional dredging attempts in the Residuals Standard must consider the requirements for dredging production in the Productivity Standard.
Performance Standard for Dredging Resuspension The Performance Standard for Dredging Resuspension (i.e., Resuspension Standard) is designed to limit the concentration of PCBs in river water such that water supply intakes downstream of the dredging operations are protected, and to limit the downstream transport of PCB-contaminated dredged material. The attendant water quality monitoring program will be implemented to verify that the objectives of the Resuspension Standard have been met during dredging. The analytical results obtained from the water quality monitoring will be compared to the Resuspension Standard and associated lower action levels to monitor and control resuspension through appropriate actions. Such actions
2 A negligible effect is defined, in this case, as a predicted Tri+ PCB concentration in Upper Hudson fish of 0.5 mg/kg or less, and in Lower Hudson River fish of 0.05 mg/kg or less, within 5 years after the completion of dredging in the Upper Hudson.
Malcolm Pirnie/TAMS-Earth Tech 7 Peer Review Draft – October 2003 Engineering Performance Standards Introduction
could include, as appropriate, expanding the monitoring program, notifying public water suppliers, implementing operational or engineering improvements, and, if necessary, temporarily halting the dredging. The ROD requires the development of a Resuspension Standard but does not set forth any framework or numerical value for the Standard. The Resuspension Standard and a series of tiered action levels were developed based on extensive modeling, review of environmental dredging case study data, and evaluation of applicable or relevant and appropriate requirements (ARARs) identified in the ROD for PCBs in river water. Thresholds for increased monitoring and engineering controls provide a basis for design and evaluation of a contingency plan in the event of a contravention of the action levels. Once a baseline monitoring program has been finalized and implemented for the project, new water quality data will be collected and evaluated. The improved understanding of baseline conditions will be used to prepare a more thorough description of the relationships between water quality parameters and to further refine or adjust the Resuspension Standard (primarily the associated monitoring program), as necessary, based on the peer-reviewed approach. A plan is presented for refinement of the standard and the associated monitoring program, both as a result of availability of ongoing baseline monitoring data prior to Phase 1, and following completion and evaluation of Phase 1.
Performance Standard for Dredging Residuals The Performance Standard for Dredging Residuals (i.e., Residuals Standard) is designed to detect and manage contaminated sediments that may remain after initial remedial dredging in the Upper Hudson River. The ROD calls for removal of all PCB-contaminated sediments in areas targeted for dredging, and anticipates a residual of approximately 1 mg/kg Tri+ PCBs (prior to backfilling). The “residual sediments” may consist of contaminated sediments that were disturbed but escaped capture by the dredge, resuspended sediments that were re-deposited/settled, or contaminated sediments remaining below the initial dredging cut elevations (e.g., due to uncertainties associated with interpolation between core nodes of the design sediment sampling program or insufficient core recovery).
The Residuals Standard requires the implementation of a post-dredging sampling and analysis program to detect and characterize PCB concentrations in the residual sediments. The post-dredging sediment data are compared to the anticipated residual of approximately 1 mg/kg Tri+ PCBs stated in the ROD and a group of statistical action levels developed for the Residuals Standard. The approach to be taken to manage the residual sediments (including re-dredging) is then selected depending on the statistical analyses of the post-dredging data. The use of statistical analyses to evaluate environmental datasets is a scientifically accepted practice. The development of the residuals performance standard was accomplished using information from remedial dredging project case studies, and consideration and implementation of statistical data evaluation tools. The standard also encompasses

Malcolm Pirnie/TAMS-Earth Tech 8 Peer Review Draft – October 2003 Engineering Performance Standards Introduction
contingency options in the event of non-compliance, and the development of an approach to refine the standard following analysis and interpretation of Phase 1 data. Performance Standard for Dredging Productivity The Performance Standard for Dredging Productivity (i.e., Productivity Standard) is designed to monitor and maintain the progress of the dredging to meet the schedule stated in the ROD. The project schedule stated in the ROD has a six-year duration and consists of the first dredging season designated “Phase 1” (with dredging at a reduced scale) followed by five dredging seasons collectively designated “Phase 2” (each with dredging at full production to remove the remainder of the contaminated sediments identified for removal). The Productivity Standard specifies the cumulative volume of sediment to be dredged during each dredging season, based on the current estimate of 2.65 million cubic yards of sediment to be removed. Following the completion of Phase 1, the data obtained from the monitoring program will be analyzed to determine if refinements to the Productivity Standard or changes to the Phase 2 remedial program are necessary. Structure and Content of the Engineering Performance Standards As stated above, the Engineering Performance Standards are presented in three parts, one for each of the three standards. To provide a comprehensive and consistent presentation of each standard, each part is subdivided into four sections, as follows:
Section 1 – Statement of the Performance Standard This section provides a concise statement of the standard and associated lower-tier action levels with no rationale or background explanation. It simply states the standard as it is to be implemented during the dredging program.
Section 2 – Technical Basis of the Performance Standard This section contains three major subsections describing the technical basis for development of the standard.
Background and Approach The objectives, development processes, and methodology used in the development of these standards are presented in this section. A brief summary of the scope for the development of the standard is included in this section. Summaries of several case studies that are similar in nature to this project are also presented.
Supporting Analyses This section analyses the available information for its applicability to this project. This section includes the statistical evaluations and modeling required in order to derive the standard. Evaluations of baseline monitoring data or performance data from previous case

Malcolm Pirnie/TAMS-Earth Tech 9 Peer Review Draft – October 2003 Engineering Performance Standards Introduction
studies, as well as any conceptual design activities, that give substance to the derivation of the standard are provided.
Rationale for Determination of the Standard Based on the supporting analyses performed, a determination is made as to what the performance standard should be, and the rationale for this determination is discussed. Analysis of case studies, along with reasoning and explanation of decisions and judgments made to arrive at the standard is provided in this section. Section 3 – Implementation of the Performance Standard This section is a full presentation of the standard, including conceptual information to be provided to assist the user to interpret application of the standard in unforeseen circumstances. Action levels, including the standard proper, along with monitoring requirements and the basis for engineering controls and contingencies to be required at each level, are laid out in detail. Section 4 - Plan for Refinement of the Performance Standard This section contains a plan for refinement of the standard that may be appropriate due to ongoing collection of baseline data, or to discovery of additional case studies that shed new light on the development of the standard prior to implementation of Phase 1. In addition, the plan will address the means by which data developed during monitoring of Phase 1 operations and impacts will be used to refine or adjust the standard prior to and during Phase 2. Within each Section, the presentation may vary from Standard to Standard, in order to suit the needs of that particular Standard. Key Project Personnel and Roles In order to facilitate development of engineering performance standards that are consistent with the state-of-the-art dredging technologies and methods, scientific and statistical analysis, and the current level of knowledge about the Hudson River system, Malcolm Pirnie assembled a technical team of highly qualified professionals, many of whom had been involved with the Reassessment RI/FS for the site, or previous work on the river on behalf of New York State. In addition, the quality review normally conducted internally was delegated to a diverse team of technical experts assembled from a broader pool of candidates, recognized in their respective fields, and functioning independently of the technical team developing the standards. Technical Team The technical effort was divided among three teams corresponding to the three standards to be developed. Key senior members of the technical team are presented below.

Malcolm Pirnie/TAMS-Earth Tech 10 Peer Review Draft – October 2003 Engineering Performance Standards Introduction
Bruce Fidler, P.E. – Engineering Performance Standards Development Leader Mr. Fidler obtained his master’s degree in civil and sanitary engineering in 1979 and has more than 23 years experience in environmental engineering and hazardous waste remediation. He has been involved with the Hudson River PCBs Superfund Site since 1991, virtually the entire period of the Reassessment RI/FS and subsequent design-phase work. While with TAMS Consultants, Inc., Mr. Fidler led various pre-feasibility evaluations and served as Project Manager for Phase 3 of the Reassessment, including preparation of the Feasibility Study and the summary of the selected remedy presented to USEPA’s National Remedy Review Board, and the final Reassessment Responsiveness Summary incorporating over 73,000 comment documents received from the public. Having joined Malcolm Pirnie in early 2002, Mr. Fidler is now providing consultation on various aspects of the design period activities in addition to leading the engineering performance standards development effort. Edward Garvey, Ph.D., P.G. – Resuspension Standard Team Leader Dr. Garvey is a senior environmental geochemist with TAMS Consultants, Inc., an Earth Tech Company. He has over 22 years of experience in environmental geochemistry, with additional experience in human health risk assessment and hydrogeology. His educational training includes a Ph.D. in geochemistry, a M.A. in geological sciences and a B.E. in chemical engineering. Dr. Garvey is a registered geologist/geochemist in the Commonwealth of Pennsylvania. Dr. Garvey’s experience includes over 19 years of study specific to the Hudson River, including his Ph.D. dissertation and his efforts since 1991 as the chief scientist on the Hudson River PCBs Reassessment RI/FS for USEPA. For the Reassessment RI/FS, Dr. Garvey planned and directed the collection of environmental data, including extensive, multi-year sediment and water column sampling programs, coordinated the efforts of various scientists and consultants, and prepared several major reports on the investigation. His work on this project has produced several technical papers as well as many technical presentations on the fate of PCBs in the environment. In his role as the Resuspension Standard Team Leader, Dr. Garvey brings extensive experience on the geochemical interpretation of sediment contamination data and its implications for long-term PCB transport. Neven Kresic, Ph.D. – Residuals Standard Team Leader Dr. Kresic has more than 20 years of teaching, research and consulting experience in surface water and groundwater assessment, engineering and remediation for U.S. and international clients. He has designed site characterization and environmental sampling plans, and performed data analysis and evaluation of remedial design alternatives at numerous CERCLA, Resource Conservation and Recovery Act (RCRA) and other industrial sites throughout the US. His areas of expertise include subsurface modeling, geostatistical, probabilistic and stochastic analyses of spatial and time data series, and groundwater remediation. Dr. Kresic is a professional geologist and hydrogeologist, and

Malcolm Pirnie/TAMS-Earth Tech 11 Peer Review Draft – October 2003 Engineering Performance Standards Introduction
teaches short professional courses in geographic information systems (GIS), Groundwater Modeling and Groundwater Remediation for the National Ground Water Association. John Mulligan, P.E. – Productivity Standard Team Leader Mr. Mulligan earned his master’s degree in sanitary engineering from the School of Public Health at the University of North Carolina in 1967 and has over 35 years of experience in civil and environmental projects including a number of hazardous waste remediation projects involving dredging and disposal of contaminated sediments. He became involved in the Hudson River PCB project in 1974 when he served as Malcolm Pirnie’s project engineer on the design of a new water main crossing the Hudson. This was required to replace existing mains damaged by the removal of the former Fort Edward Dam, and involved removing timber cribs from the former dam pool, and stabilizing the sediment deposits left behind the old dam when the water level fell. From 1975 through 1991, he served as Malcolm Pirnie’s Project Manager for the preparation of studies and designs for the NYSDEC aimed at remediating the PCB contamination of the river sediments. In more recent years, Mr. Mulligan has designed a dredging project to remove and dewater PCB-contaminated sediments from the St. Lawrence River for General Motors Corp. and assisted in the design of the demonstration project for the remediation of PCB-contaminated sediments at Deposit N in the Fox River near Green Bay, WI. Donald J. Hayes, Ph.D., P.E. – Consulting Expert Dr. Hayes has been working with environmental aspects of dredging, dredged sediment disposal, and contaminated sediment management for over 20 years. He has published extensively in these areas. He also contributed to a number of guidance documents and authored software used to evaluate contaminated sediments management alternatives. He is especially recognized for his expertise in water quality impacts associated with dredging operations. Dr. Hayes served on the National Academies of Engineering Committee on Contaminated Marine Sediments and co-authored the resulting report. He is currently actively working on seven contaminated sediment projects and has contributed to many more projects over the past few years; many of these are Superfund projects. He previously contributed to the Reassessment Feasibility Study for this Site, as well as the final Reassessment Responsiveness Summary. Dr. Hayes worked as a research Civil Engineer at the USACE's Waterways Experiment Station for over 10 years and has been in academia for the past 11 years. Dr. Hayes received his Ph.D. in Environmental Engineering and Water Resources Planning and Management in 1990. In addition to the expertise contributed by these team members, modeling for the project was conducted by LimnoTech, Inc. (HUDTOX model) and Menzie-Cura & Associates, Inc. (FISHRAND model).

Malcolm Pirnie/TAMS-Earth Tech 12 Peer Review Draft – October 2003 Engineering Performance Standards Introduction
Quality Review Team Quality reviews for the project are being performed by a team of experts that functions independently of the technical team. Reviewers include the following: Kenneth J. Goldstein, C.G.W.P - Quality Review Team Coordinator Area of Expertise: Residuals Sampling Mr. Goldstein is a professional hydrologist/hydrogeologist at Malcolm Pirnie, with over 20 years experience in contaminant hydrogeology and contaminant fate and transport. He has designed work plans, field sampling plans and quality assurance plans and directed numerous sampling and analytical programs for physical and chemical characterization of sediments, soil and groundwater. Mr. Goldstein was responsible for the sampling and characterization of dredge spoil deposits and contaminated sediments in the Upper Hudson River through the late 1980s and early 1990s. In addition, Mr. Goldstein developed field sampling plans and performed sediment sampling on the Raritan River, Jamaica Bay, and Eastchester Bay. He has performed statistical and geospatial analysis of sediment quality data and physical characterization data. Mr. Goldstein’s current focus is on remediation of contaminated media using in-situ remedial technologies. Jonathan B. Butcher, Ph.D., P.H. Areas of Expertise: Residuals, Resuspension, Reassessment RI/FS History Dr. Jonathan Butcher is an environmental engineer and Professional Hydrologist with TetraTech, Inc., who has worked on the Reassessment RI/FS for the Hudson River PCBs Site since soon after its commencement. He has provided technical support in four key areas: (1) contaminant fate and transport modeling for PCBs within the river water and sediment; (2) predictive modeling of bioaccumulation of PCBs in fish; (3) data validation and reconciliation for historical data collection efforts, and (4) sampling design and statistical and geostatistical analyses of sample data. Dr. Butcher developed the Phase 1 PCB fate and transport model application and Phase 2 model specifications for the study, and was responsible for internal model review during the FS. He developed a bivariate bioaccumulation factor method to predict PCB burdens in fish in systems where the water column and sediment fractions are not in equilibrium, and collaborated on development of mechanistic and stochastic bioaccumulation models. He was also responsible for an innovative study of the environmental partitioning behavior of PCB congeners in Hudson River water and sediments. Dr. Butcher has taken a lead role in the review of GE’s alternative modeling analyses of PCBs in the Hudson, and has developed methods for translating historical Aroclor

Malcolm Pirnie/TAMS-Earth Tech 13 Peer Review Draft – October 2003 Engineering Performance Standards Introduction
quantitation results to a common Tri+ PCB basis. He has published several peer-reviewed papers on key scientific aspects of this work. Gregory Hartman, P.E. Areas of Expertise: Sediment Remediation, Environmental Dredging, Dredging Residuals Mr. Hartman is a licensed Professional Engineer in Oregon and Washington, and is currently a consultant with the firm of Dalton, Olmsted & Fuglevand in Kirkland, WA. Mr. Hartman has a B.S. in Civil Engineering, and an M.S. in Coastal and River Engineering. He has 34 years experience working in the Coastal and Waterway Industry. As a Civil Engineer in the Navigation Division of the Portland District USACE, he was Chief of Dredging Operations, and gained direct working experience as a dredger. Since 1978 Mr. Hartman has been a consultant, working on coastal and river projects in the United States and overseas. Mr. Hartman has taught the USACE Dredging Fundamentals Short Course every year since 1982. He has also taught courses intermittently on Dredge Cost Estimating, Dredge Contract Administration, and Dredge Inspectors Course to the USACE, and Dredge Remediation and Confined Disposal Site Design for the University of Wisconsin Short Course on Understanding Contaminated Sediment. Mr. Hartman is Past President and Past Chairman of the Board for the Western Dredging Association, and Retired Board Member of the World Dredging Association. He is on the Board of Industry Advisors for the World Dredging, Mining and Construction Magazine. Relevant experience includes the remediation of the St. Paul Waterway in Tacoma, WA and the development, design and construction oversight for the Sitcum Waterway Remediation Project in the Port of Tacoma. Mr. Hartman was Dredge Consultant for various projects including: the design and contract oversight of navigation dredging and PCB remediation on the US Navy Puget Sound Shipyard in Bremerton, WA; Pilot Study 2000, to dredge PCBs for the New Bedford, MA remediation; preliminary design for remediation of PCBs in Fox River, WI; sediment remediation in Greens Bayou, TX and; Hylebos Waterway PCB remediation design and construction in Tacoma, WA.

Malcolm Pirnie/TAMS-Earth Tech 14 Peer Review Draft – October 2003 Engineering Performance Standards Introduction
Michael R. Palermo, Ph.D., P.E. Areas of Expertise: Sediment Remediation, Environmental Dredging, Residuals Dr. Palermo is a Research Civil Engineer and Director of the Center for Contaminated Sediments at the U.S. Army Engineer Research and Development Center, Waterways Experiment Station, where he manages and conducts research and applied studies concerning dredging and dredged material disposal and remediation of contaminated sediments. He has authored numerous publications in the area of dredging and dredged material disposal technology and remediation of contaminated sediments. He was the lead author of the USACE technical guidance for dredged material capping and the lead author of the USEPA ARCS program guidance for in-situ capping for sediment remediation. Dr. Palermo also serves on several technical advisory panels for superfund projects involving contaminated sediments. Dr. Palermo is a Registered Professional Engineer and a member of the Western Dredging Association and the International Navigation Association. He is also Associate Editor for the Journal of Dredging Engineering. He received his B.S. and M.S. degrees in Civil Engineering from Mississippi State University and his Ph.D. degree in Environmental and Water Resources Engineering from Vanderbilt University. William N. Stasiuk, Ph.D., P.E. Areas of Expertise: Water Quality, Public Water Supply, Risk Assessment Dr. Stasiuk is a Licensed Professional Engineer at Malcolm Pirnie, with experience in dealing with sites contaminated with PCBs. In 1975, he helped coordinate the NYSDEC’s technical case in the original enforcement action against GE regarding Hudson River contamination. He directed the public health response to PCB contamination in the West Glens Falls, NY residential area in 1979 and the subsequent remedial action. As Director of the Center for Environmental Health within the New York State Department of Health (NYSDOH) from 1985 through 1996, Dr. Stasiuk provided direction to the Bureaus which carried out exposure investigations, risk assessments and health studies at all contaminated sites in New York State. He was directly responsible for the post-cleanup assessment and further remedial actions leading to the reoccupancy of the Binghamton State Office Building. He provided oversight of assessment, response and remedial actions at the State University at New Paltz PCB contamination incident. Also with NYSDOH in the late 1960s, Dr. Stasiuk was instrumental in development of a mathematical water quality model for the Hudson River from Corinth to the Battery. He also organized, staffed and supervised the first Toxic Substances Control Unit in NYSDOH in 1979, and assisted in development of drinking water standards for organic compounds, including PCBs. He was the NYSDOH’s representative on the NYS Superfund Management Board.
Malcolm Pirnie/TAMS-Earth Tech 15 Peer Review Draft – October 2003 Engineering Performance Standards Introduction
In addition to providing executive direction to the Bureau of Water Supply (part of the Center for Environmental Health), Dr. Stasiuk's water supply experience includes serving from 1996-2000 as Deputy Commissioner and Director of the Bureau of Water Supply in the New York City Department of Environmental Protection, which is responsible for the New York City water supply system. Quality Review Team Roles and Responsibilities The above team of experts, collectively referred to as the Quality Review Team (or QRT), was charged with reviewing and evaluating the scope of work and approach for the development effort as well as a series of draft deliverables leading up to publication of the standards for review by the public and the peer review panel. The team members performed their reviews individually, but then sought to reach consensus and provide unified guidance to the technical team to the extent possible. All comments received from the QRT were considered carefully by the technical team and implemented in consultation with USEPA. Although each of the five members of the QRT has a particular specialty (or specialties) relating to the project as indicated above, each was asked to review all three standards in the course of his work. The intention of this approach was to provide consistent review and evaluation of all standards individually and to provide evaluation of the interactions among the standards. While each of the QRT members has reviewed the standards3, and concurs with their form and content, each has been operating solely within the framework of this project and not with the intention of providing generic or universal guidance on performance standards development related to other projects or sites. Disclaimer Applicable to the Engineering Performance Standards Development As indicated above, the standards developed herein are intended only for application to remedial environmental dredging of the Upper Hudson River called for in USEPA’s 2002 ROD for the Hudson River PCBs Superfund Site at this juncture in time. The standards are not intended to provide general or universal guidance for environmental dredging. Other projects and locations may have specific features differing from those of the Hudson River, and the standards presented here may not be applicable to those projects.
3 Gregory Hartman, PE was unavailable to review later drafts of the standards documents as issued for public comment and peer review, but participated in review of the technical approach, as well as internal drafts. He also addressed specific questions and issues posed by members of the technical team during preparation of later drafts.

Malcolm Pirnie/TAMS-Earth Tech 1 Peer Review Draft � October 2003
Engineering Performance Standards Appendix: Case Studies of Environmental Dredging Projects
Table of Contents 1. Introduction............................................................................................................................. 1 2. Case Studies ............................................................................................................................ 1
Objective and Overview ............................................................................................................. 1 Case Study Tasks ........................................................................................................................ 2
Development of Questionnaire ............................................................................................... 3 Dredging Productivity ................................................................................................................ 4
Review of Recently Issued RODs....................................................................................... 6 Case Study Summary...................................................................................................................... 8
Site Location and Description .................................................................................................. 16 Containment System ................................................................................................................. 18 Resuspension Monitoring ......................................................................................................... 18
Outside the Sheet Pile (In the St. Lawrence River)....................................................................... 18 Turbidity Monitoring ............................................................................................................ 18
Water Column Sampling ............................................................................................................... 20 Inside the Sheet Pile Enclosure..................................................................................................... 20
Water Intake Monitoring....................................................................................................... 21 Site Location and Description .................................................................................................. 26
Remedial Action ................................................................................................................... 27 Containment System ................................................................................................................. 27 Resuspension Monitoring.......................................................................................................... 28
Turbidity Monitoring ............................................................................................................ 28 Water Column Sampling ............................................................................................................... 29
Water Intake Monitoring....................................................................................................... 29 Capping ................................................................................................................................. 30
Site Location and Description .................................................................................................. 31 Site Characteristics................................................................................................................ 32
Containment System ................................................................................................................. 33 Resuspension Monitoring.......................................................................................................... 34
Water Intake Monitoring....................................................................................................... 36 Correlation between TSS and Turbidity ............................................................................... 36
Site Location and Description .................................................................................................. 39 Site Characteristics................................................................................................................ 40 Remedial Action ................................................................................................................... 40
Containment System.................................................................................................................. 40 Resuspension Monitoring.......................................................................................................... 41 Site Location and Description .................................................................................................. 43
Site Characteristics................................................................................................................ 43 Remedial Action ................................................................................................................... 44
Containment System.................................................................................................................. 44 Resuspension Monitoring.......................................................................................................... 44
Grand Calumet River, Indiana ...................................................................................................... 47

Malcolm Pirnie/TAMS-Earth Tech 2 Peer Review Draft � October 2003
Engineering Performance Standards Appendix: Case Studies of Environmental Dredging Projects
Site Location and Description .................................................................................................. 47 Site Characteristics ................................................................................................................... 47 Remedial Action ........................................................................................................................ 48
Residual Verification Activities............................................................................................ 49 Restoration ............................................................................................................................ 50
Air Monitoring .......................................................................................................................... 50 Resuspension Monitoring.......................................................................................................... 51 Results and Conclusions ........................................................................................................... 55
Site Location and Description............................................................................................... 55 Remedial Action ................................................................................................................... 55 Residual Verification Activities............................................................................................ 56 Resuspension Monitoring ..................................................................................................... 56 Results and Conclusions ....................................................................................................... 56 Remedial Action ................................................................................................................... 57 Results/Conclusions.............................................................................................................. 57
Site Location and Description .................................................................................................. 57 Remedial Action ........................................................................................................................ 58 Residual Verification Activities................................................................................................. 59 Post-Dredge Monitoring ........................................................................................................... 59 Site Location and Description .................................................................................................. 60 Site Characteristics ................................................................................................................... 60 Remedial Action ........................................................................................................................ 61 Residual Verification Activities................................................................................................. 63 Resuspension Monitoring.......................................................................................................... 63 PCB Loading as a Result of Dredging...................................................................................... 64 Post-Dredge Monitoring ........................................................................................................... 64 Modeling ................................................................................................................................... 64 Results/Conclusions .................................................................................................................. 66
Site Location and Description............................................................................................... 66 Site Characteristics................................................................................................................ 66 Remedial Action ................................................................................................................... 66 Site Background and Description ......................................................................................... 70 Site Characteristics................................................................................................................ 70 Remedial Action ................................................................................................................... 71 Residual Verification Activities............................................................................................ 72 Resuspension Monitoring ..................................................................................................... 72 PCB Loading as a Result of Dredging.................................................................................. 74 Results/Conclusions.............................................................................................................. 74
Residual Verification Activities........................................................................................ 77 Resuspension Monitoring ................................................................................................. 78
PCB Loading as a Result of Dredging.................................................................................. 79 Site Description and Background ......................................................................................... 80 Site Characteristics................................................................................................................ 80

Malcolm Pirnie/TAMS-Earth Tech 3 Peer Review Draft � October 2003
Engineering Performance Standards Appendix: Case Studies of Environmental Dredging Projects
Remedial Action ........................................................................................................................ 80 Residual Verification Activities............................................................................................ 81 Resuspension Monitoring ..................................................................................................... 82 PCB Loading as a Result of Dredging.................................................................................. 83 Conclusion/Summary of Analysis ........................................................................................ 85 Site Location and Description............................................................................................... 86 Remedial Action ................................................................................................................... 86 Site Description..................................................................................................................... 88 Remedial Action ................................................................................................................... 88 Resuspension Monitoring ..................................................................................................... 90
United Heckathorn, San Francisco Bay........................................................................................ 91 Site Location and Description ...................................................................................................... 91
Remedial Action ........................................................................................................................ 92 Residual Verification Activities................................................................................................. 93 Post-Dredge Monitoring ........................................................................................................... 93
3. Hudson River Data Collection .............................................................................................. 94 4. References............................................................................................................................. 96

Malcolm Pirnie/TAMS-Earth Tech 1 Peer Review Draft � October 2003
Engineering Performance Standards Appendix: Case Studies of Environmental Dredging Projects
1. Introduction This section describes the sources of available data on which much of the performance standards are based. Completed dredging projects that provide information on upstream and downstream water column conditions, as well as on mass of contaminant removed, provide a basis for determining historical rates of loss and dredging-related recontamination. It was thought that dredging projects that have been completed or are currently in progress could provide practical information on resuspension issues. Information on water quality data, equipment used, monitoring techniques, etc., from these projects will give an insight on how to develop the performance standards. For the resuspension standard, water column monitoring results available from other sites were used to complete an analysis of the case study data. The process used to gather relevant information from dredging sites and the information obtained are included herein. It is also important to review all information that exists for the Hudson River. Available data was used to assess the existing variability in the Hudson River water quality, and can be used to estimate the water column quality during, and resulting, from the dredging operation. Descriptions of the data sets available to perform this analysis are provided herein. 2. Case Studies Objective and Overview During completion of the Hudson River Feasibility Study (FS) and the associated Responsiveness Summary (RS) (USEPA, 2002), the General Electric (GE) dredging database, the United States Environmental Agency (USEPA) website, and other online sources were researched to identify dredging projects that were relevant and similar in size and complexity to that proposed for the Hudson River. The USEPA and State agencies were contacted to gather information for each dredging project including but not limited to the following sites: New Bedford Harbor, Fox River, Saginaw River, St. Lawrence River, Commencement Bay, Cumberland Bay, Manistique River, Sheboygan River, and Grasse River. Information that were gathered and tabulated including but not limited to:
• Type of dredging equipment utilized • Contaminants of concern and associated concentrations • Stabilization method • Presence of odors • Noise issues • Problems encountered during dredging • Effectiveness of silt/barriers • Cleanup goal requirements (allowed residual) • Reduction rate in term of average concentration • Average dredge equipment productivity • Total volume to be removed

Malcolm Pirnie/TAMS-Earth Tech 2 Peer Review Draft � October 2003
Engineering Performance Standards Appendix: Case Studies of Environmental Dredging Projects
• Dredge season/period • Average depth of cut • Method of monitoring for resuspension during dredging
Final results were presented in Appendix A of the FS report and used to support statements and respond to comments on the FS report and white papers of the RS report. It was thought that additional information was needed to support the development of the performance standards. As a result, a dredging site survey (case study search) was conducted during preparation of the Hudson River performance standards to summarize remedial work conducted at various domestic dredging sites. Information related to specific removal operations, productivity, transport and sediment processing and handling, water quality monitoring and associated work plans, residual cleanup goals, post-dredge confirmation sampling, water quality modeling, and engineering contingency plans were collected from each of the sites surveyed when applicable and available. Case Study Tasks A general search was done on the Internet within each of the USEPA regional websites to identify recent dredging projects that may have been performed since the completion of the Hudson River FS and RS reports. In addition, follow-up conversations were held with dredge site contacts established during the initial survey effort conducted during preparation of the Hudson River FS and RS. The following sources were researched to locate relevant information for dredge sites described in this document:
Agencies/Organizations/Sources USEPA Regional Offices Michigan Department of Environmental Quality Wisconsin Department of Natural Resources Great Lakes National Program Office Fox River Group International Joint Commission -US and Canada Great Lakes 2000 Cleanup Fund Technical Journals GE Major Contaminated Sites Database
The GE Major Contaminated Sites database was reviewed to identify if any new sites had been added since the completion of the Hudson River RS Report (USEPA, 2002). It was concluded that there were no major additions made to this database at the time this search was conducted, and as a result, the USEPA Regional offices, among other sources identified herein, were contacted to obtain any information on new dredging projects underway since completion of the Hudson River RS report (USEPA, 2002).

Malcolm Pirnie/TAMS-Earth Tech 3 Peer Review Draft � October 2003
Engineering Performance Standards Appendix: Case Studies of Environmental Dredging Projects
The main task performed was the development of a questionnaire that identified and targeted the information needed from each dredge site. Follow-up conversations were held with past surveyed dredge site contacts to obtain recently released reports and information with regard to project performance. Records of Decision (RODs) recently issued by the USEPA were reviewed to identify additional dredging sites to contact for specific site information outlined in the questionnaire. Dredging reports obtained were reviewed for pertinent information, and a case study narrative was then prepared for each dredge site. This information was tabulated for quick reference for other team members and to allow for comparison between various dredge sites. Development of Questionnaire As a first step in the search for the information needed to support the performance standards, a list of questions was compiled by members of the residuals, resuspension, and productivity teams and assembled into an extensive questionnaire. This questionnaire served as a guide for the case study task force in soliciting information from various dredge sites. In addition, a copy of the questionnaire was available in electronic format for electronic mailing to any contact that agreed to provide specific information on a given project. This questionnaire also served as a guide for telephone conversations with project contacts to ensure all pertinent available information was obtained. Copies of the questionnaire were distributed to project personnel associated with various dredge sites and to different parties within the USEPA. The questions utilized in the case study survey are as follows:
General Site Details
• What type of dredge equipment was used, mechanical or hydraulic? • How many dredges were used in the river to meet removal goals? • How was removal of debris such as large boulders and tree limbs handled: with a
separate dredge specifically used to remove debris ahead of �removal� dredge or with the selected removal dredging equipment as encountered in the excavation area?
• What was the average dredge cycle time? • What size mechanical bucket was used or size of hydraulic cutterhead? • How much water was entrained in the mechanical bucket per cycle? • What was the depth of cut achieved per dredge bite/pass of dredge? • How long did it take to re-position the dredge? How often did the dredge require re-
positioning? • What was the dredged sediment loaded into? • What was the dredging pattern? (channel to shore and downriver? How were multiple
dredges positioned in the river?) • Was the area backfilled? What method of backfill placement was used? • Were wetlands dredged from the river? What type of equipment was used? What was the
corresponding productivity in these areas? • Was shoreline dredging required? How was this accomplished? How were the banks
stabilized following dredging?

Malcolm Pirnie/TAMS-Earth Tech 4 Peer Review Draft � October 2003
Engineering Performance Standards Appendix: Case Studies of Environmental Dredging Projects
• Were silt curtains used to create an enclosed dredging zone? How was equipment moved into and out of the area? Did this impact productivity?
• How was the dredge and scow positioned in the river? • What downtimes occurred and how often did these downtimes impact expected
productivity? • What were the main dredging limitations? What were the main limitations on
productivity?
Dredging Productivity
• What contaminants and level of contamination were removed? • Was more than one type of sediment commodity handled (for instance TSCA and Non-
TSCA)? • What was the sediment type? (Primarily cohesive, Non-cohesive, rocky) • Where was dredging conducted? (along shore, within channel, or both?) • What was the bathymetry of the river system? • What range of removal depths was required? • What was the average depth of removal required? • What volume of sediment required removal? • What season was the dredging performed? • Was the expected dredging schedule met? • What volume was removed per day or week? What was the expected volume to be
removed per day or week? Were removal goals met? • What were the main problems encountered? • Were community issues such as noise and odor a concern? If so, how were they handled? • Were residents located along shore near the target dredging area?
Residuals
• Could you provide a report discussing the dredging operation and results? • What type of dredging equipment was used? • Can you provide analytical data for all pre-dredging, post-dredging and post-backfill
sediment samples and measured parameters, including contaminant concentrations and sediment characteristics? Electronic data is preferred, if possible.
• Can you provide descriptive information for the samples including the coordinates, depth of the samples, sample method (core/grab), and time of collection? Electronic data is preferred, if possible.
• What were the characteristics of the area (presence of debris and boulder)? • How were the pre dredging, post dredging and post backfilling collection plans
developed? • Were there limits on acceptable residual concentrations? If so, how were these
boundaries determined?

Malcolm Pirnie/TAMS-Earth Tech 5 Peer Review Draft � October 2003
Engineering Performance Standards Appendix: Case Studies of Environmental Dredging Projects
• What was the spatial layout of the sampling points (e.g., a grid vs. random placement)? • How was the sample location and sampling density determined? • What was the definition of the unit area for certification? • What was the performance of backfilling? • What analytical methods were used (both field and lab techniques)? • What was the maximum number of passes? • What were the remedial options for an area with unacceptable results?
Resuspension
• How was the pre-construction variability of contaminant concentration or loads
determined as the background level? Were any statistical methods used? • What was measured as a real-time indicator of water-borne, particle-associated
contaminant concentrations? If it is turbidity /TSS, what is the correlation between these characteristics and the contaminant concentrations? Was TOC or DOC measured? Were dissolved phase concentrations measured?
• Can you provide the water column monitoring data for all measured parameters, monitoring locations, and time periods? Electronic data is preferred.
• How was the contaminant threshold value determined? What is it? • What were the characteristics of the dredged material (such as, percentage of cohesive
and non-cohesive sediment)? • Which equipments/devices were used for real-time monitoring? What was the
performance for each device? • Where are the monitoring stations located (upstream, downstream, inside or outside of
the silt curtain or barriers, by the point of dredging)? Which factors are considered in determining the location of monitoring stations?
• What was the sampling frequency of water column samples? • How frequently did accidental releases happen? What was the major cause for accidental
releases? What is the best solution to prevent accidental releases? • What was used as the best means of enforcing limits on resuspension, the contaminant
concentration, or the contaminant load per unit time? • Was short-term bio-monitoring (e.g., with caged fish) included as a component of the
resuspension monitoring? • What was the impact, if any, of resuspension on downstream water supply intakes?

Malcolm Pirnie/TAMS-Earth Tech 6 Peer Review Draft � October 2003
Engineering Performance Standards Appendix: Case Studies of Environmental Dredging Projects
Resuspension (Cont.)
• What monitoring requirements were needed to protect downstream water intakes? • What engineering controls were enforced for exceedences? • What was the resuspension rate and how was it estimated? • What dredging equipment and methods are most effective at controlling resuspension and
which are least effective?
Review of Recently Issued RODs The USEPA website was investigated for RODs issued for sites where dredging has been selected as the proposed plan in the last two years. The search was confined to the past two years because it was thought that the previous dredge site survey conducted during the development of the FS and RS included all dredge sites up to that time or the year 2000. The RODs meeting the criteria were reviewed and the relevant dredging sites were identified. Each of the USEPA regional web sites were then queried to gather all available information that existed with regard to the proposed plan, status of the project, etc. The following is a brief listing of sites identified from the listing of RODs that have relevance regarding time period and selected remedial action. It was noted that at this time, approximately 897 RODs matched the search criteria. An abbreviated list of most representative sites identified from this task is as follows, though many more sites exist than can be listed here:
• Commencement Bay � 9 dredging sub-sites • Velsicol Chemical Corporation � Pine River • Sheboygan Harbor and River • New Bedford Harbor • Saginaw River • Kalamazoo River • Grand Calumet River • Black River • Manistique River • Wyckoff Company/ Eagle Harbor • Waukegan Harbor/Outboard Marine • Pacific Sound resources • Harbor Island • United Hekathorn � San Francisco Bay • Du Pont Superfund Site- Christina River in Newport, Delaware • St. Lawrence River (Reynolds Metals and GM Massena) • Grasse River: Alcoa • New Bedford Harbor

Malcolm Pirnie/TAMS-Earth Tech 7 Peer Review Draft � October 2003
Engineering Performance Standards Appendix: Case Studies of Environmental Dredging Projects
The corresponding USEPA project managers were then contacted for more detailed site-specific information. In addition, Superfund or sediment management divisions of USEPA regions where little to no recent activity (year 2000 onward) was listed were contacted to inquire if any dredging projects had occurred or were being planned for the future. Some of the dredging projects identified above were noted to have been included in the review effort completed during the development of the FS and RS reports for the Hudson River cleanup. In these cases, the information gathered previously was reviewed, and follow-up conversations were held with the respective project managers to fill in data gaps and obtain more detailed information. These sites included:
• Fox River • Cumberland Bay • GM Massena on the St. Lawrence River • Alcoa on the Grasse River � Review of the Capping Report • Reynolds Metals on the St. Lawrence River • Manistique River • Black River
Search for Additional Information on Recently Completed Projects During preparation of the Hudson River RS in late 2001, information was gathered on a number of projects that were still underway. Some of these projects have now been completed, and additional information relating to residuals, resuspension, and productivity has become available. Recently released reports were obtained and reviewed for multiple dredge sites. The following list identifies the reports obtained and reviewed during the case study task:
• Cumberland Bay PCB Dredging Project: Final Construction report • Fox River Sediment Management Unit 56/57 Remediation- Final Report on work
completed in the year 2000. • Fox River Sediment Management Unit 56/57 Demonstration Project: Final Summary
Report on the dredging demonstration project completed in 1999. • Fox River Deposit N: Appendix to the Summary Report • Fox River Deposit N: Summary Report. • Evaluation of the Effectiveness of Remediation Dredging for The Fox River Deposit N
Demonstration Project. • Fox River Dredging Demonstration Projects at Deposit N and SMU 56/57. • St. Lawrence River PCB dredging project at former Reynolds Metals plant: Report on
dredging completed in 2001. • Report on Pilot Study of Capping PCB Contaminated Sediment in the Grasse River at
Massena, NY.

Malcolm Pirnie/TAMS-Earth Tech 8 Peer Review Draft � October 2003
Engineering Performance Standards Appendix: Case Studies of Environmental Dredging Projects
• Grand Calumet River Section 401 Water Quality Certification Work Plan for dredging to begin in November 2002.
• Five Year Review Report for dredging conducted as part of the remedial action at the United Heckathorn Superfund Site within San Francisco Bay
• The Effectiveness of Environmental Dredging: A Study of Three Sites Final Report: January 2000
• Pre-Design Field Test Final Report: New Bedford Harbor 2002 After completion of the review of the above-listed reports, information gathering efforts from conversations held with project personnel, and review of project websites, a comprehensive case study narrative was completed for each of these sites. This information was also tabulated to allow for comparison between different projects. Case Study Summary The following discussion provides an overall summary for each dredge site researched as part of this case study task. A more detailed narrative for each of these sites follows in Section 2.1: Case Study Narratives of this Appendix. Maps of several sites are provided in Figures 1 through 13. A summary table (Table 1) for selected case studies is provided. Reynolds Metals on the St. Lawrence River, New York Removal of PCB-contaminated sediment at the Reynolds Metals Company was done from April 2001 through November 2001. Dredging was completed with mechanical equipment that consisted of a Cable Arm bucket. The major components of the selected remedy included the removal of approximately 51,500 cy of sediment with polychlorinated biphenyl (PCB) concentrations above 1 ppm, polyaromatic hydrocarbon (PAH) concentrations above 10 ppm, and total dibenzofuran (TDBF) concentrations above 1 ppb. The Final Dredging Program Design Report (2000) and the Draft Interim Completion Report (2002) were obtained and reviewed. Information regarding the dredging operation and sediment processing, water quality monitoring, containment, post-dredge sampling and residual levels was gathered and analyzed in this effort. These items are discussed in greater detail in Section 2.1: Case Study Narratives. GM Massena on the St. Lawrence River, New York This project consisted of the removal of sediments from a 10-acre, PCB-contaminated area adjacent to the GM aluminum casting facility in Massena, New York. Dredging was conducted between May 1995 and January 1996. Approximately 13,800 cy of sediment were removed with a hydraulic dredge consisting of a horizontal auger. Debris, rock, and boulders were removed using a barge-mounted backhoe. It was noted that the bucket of the backhoe contained openings that allowed for debris about three inches or less in diameter to pass through. Hydraulic dredging of sediments by the horizontal auger dredge was generally conducted parallel to the shore. The work was accomplished within a sheet pile system when the designed double-silt curtain containment system was found to be ineffective due to highly variable river current speeds and variable current direction. Resuspension monitoring data was gathered in this effort, including

Malcolm Pirnie/TAMS-Earth Tech 9 Peer Review Draft � October 2003
Engineering Performance Standards Appendix: Case Studies of Environmental Dredging Projects
the collection of turbidity data, PCB water column data, and data collected from a water intake within the vicinity of the dredge area. In addition, post-dredge sediment data was collected and compared to the residual clean-up goal of 1 ppm, and the PCB mass removed was estimated and compared to the total PCB mass, which existed prior to dredging. These items are discussed in greater detail in Section 2.1: Case Study Narratives. Alcoa site on the Grasse River, New York This Non-Time-Critical Removal Action (NTCRA) involved the removal of approximately 3,000 cy of sediment and boulders that were contaminated with PCBs as a result of the operation of an ALCOA facility. Performed on only a portion of the site, the NTCRA dredging was hampered by unexpectedly rocky sub-bottom conditions and a boulder field that ran the length of the dredging area. Further information is provided in Section 2.1: Case Study Narratives. Cumberland Bay, New York Cumberland Bay is located within a small section on the west bank of Lake Champlain in New York State. Removal of PCB-contaminated sediment was completed from 1999 to 2000 with a hydraulic dredge. Sediments were conveyed to a shore-side processing facility where they were mechanically dewatered. Dredging was performed using two horizontal auger dredges within sheet piling and turbidity barriers. The Final Construction Report was obtained during this task and reviewed. Information regarding water quality monitoring, water intake monitoring, correlation between turbidity and TSS, and post-dredge sediment sample data was collected and evaluated. These items are discussed in greater detail in Section 2.1: Case Study Narratives. Housatonic River, Massachusetts The Housatonic River is located in western Massachusetts near the New York State and Massachusetts border. Cleanup on this river was divided into three segments: the first reach designated the Upper ½ Mile Reach, adjacent to the GE facility (ongoing; hotspot cleanup is complete); the next reach downstream, designated the 1½ Mile Reach; and the third river segment, the Rest of River, which includes the downstream portions of the river in Massachusetts and Connecticut. In 1997, GE excavated and disposed of 5,000 cy of heavily contaminated PCB sediment (1,534 ppm average PCB) from a 550 foot section of river and 170 feet (ft) of riverbank (the hotspot area). Sheetpile was used to divert the flow, and standard excavating equipment was used to excavate in the dry. Sediments were gravity-dewatered on a pad. In October 1999, remediation of the second phase of the first ½ mile cleanup began. Sheetpile was driven in the middle of the river channel, diverting half of the river flow. Removal was done in the dry using conventional equipment after dewatering. Targeted sediments extended to a depth of 2.5 ft. Contamination deeper than 2.5 ft will be capped with a silty sand sorptive layer and then covered by an armoring layer. Two more extensive removal actions are planned for the 1-1/2 Mile Reach segment of the river. Of interest here is the dry removal strategy and the sectioning of the project into a number of individual stages.

Malcolm Pirnie/TAMS-Earth Tech 10 Peer Review Draft � October 2003
Engineering Performance Standards Appendix: Case Studies of Environmental Dredging Projects
Further information on this site is not provided in Section 2.1: Case Study Narratives because excavation was completed in the dry and this is not similar to the planned action for the Hudson River. New Bedford Harbor, Massachusetts The New Bedford Harbor Superfund Site (site) is located in Bedford, Massachusetts, about 55 miles south of Boston. The site is contaminated with PCBs, heavy metals, and other chemicals from industrial discharges. Removal of PCB-contaminated sediments in hot spots located on the west side of the Acushnet River estuary was completed between April 1994 and September 1995. Dredging of the hot spots was performed using a hydraulic dredge, and the slurry was subsequently pumped into a confined disposal facility (CDF). Following the hot spot dredging, a pre-design field test using mechanical dredging equipment was performed in August 2000. During this case study task, the Pre-Design Field Test Final Report was obtained. This report contained detailed information regarding the dredging operation, water quality monitoring for turbidity and particulate and dissolved PCBs, threshold water column levels, and contingency plans to be put into effect in the event that the action level was detected at one of the monitoring stations. These items are discussed in greater detail in Section 2.1: Case Study Narratives. Christina River, Delaware This dredge site is located in Newport, Delaware and is part of the E.I. Du Pont site. Dredging to remove sediment containing elevated metals concentrations was completed in the year 2000. Dredging was initially planned to be conducted using hydraulic dredging equipment, however due to tidal zone influences, sheet piling was installed around the targeted area and mechanical equipment was used to meet the removal goals. During the dredging operation, turbidity was monitored upstream and downstream of the sheet piling. It was noted that turbidity measurements were not collected within the contained area. Following dredging, the area was backfilled using a clamshell bucket for placement while the sheet piling was still in place. Dredging and backfill were scheduled over a nine month period, however all work was completed at the end of the fourth month. These items are discussed in greater detail in Section 2.1: Case Study Narratives Bayou Bonofoucia, Louisiana This site is a tidal-influenced fresh water estuary that is located seven miles upstream of Lake Ponchartrain. As a result of contamination from facility operations at the American Creosote work plant, the sediment in the bayou became contaminated with polynuclear aromatic hydrocarbons (PNA). The remedial action consisted of the removal of approximately 170,000 cy of PNA-contaminated sediment using mechanical dredging equipment equipped with a 5-cy bucket and computer controlled sensors to monitor the dredge cut depth and maintain a three-inch dredge tolerance. Removed sediments were disposed of via incineration. Turbidity barriers were deployed around the dredge area. The dredged area was backfilled with a layer of sand followed by a layer of gravel. Additional reports were not obtained for this site since the bayou tidal system is not representative of the Hudson River system.

Malcolm Pirnie/TAMS-Earth Tech 11 Peer Review Draft � October 2003
Engineering Performance Standards Appendix: Case Studies of Environmental Dredging Projects
Grand Calumet River, Indiana This dredge site consists of a 5-mile stretch of river contaminated with PCBs and volatile organic compounds (VOCs), specifically benzene. The hottest area, approximately 1.5 miles in length, will be contained within sheet piling and the remainder of the contaminated area will be dredged in open water. An interesting detail from this site was that a computer program was utilized to estimate the margin of safety on slope stability. Ultimately, this program allowed the contractor to evaluate areas where too great of a slope existed to make the required dredge cut without bank stabilization prior to excavation. Information regarding the proposed dredging methods, bank stabilization details and difficulties, and the water quality monitoring work plan was obtained and reviewed as part of this task. These items are discussed in greater detail in Section 2.1: Case Study Narratives. Outboard Marine, Illinois This site is located on the west shore of Lake Michigan and is part of the Great Lakes Area of Concern. The remedial action consisted of the removal of approximately 23,000 cy of PCB-contaminated sediment. This sediment was removed with a hydraulic cutter head dredge and treated via thermal desorption. Following treatment, the sediment was placed back into the isolated slip. It was noted that PCB concentrations greater than 500 ppm were removed and treated. Clean sand was placed in the slip prior to placement of the treated sediment. Another interesting observation was that this sediment took a long time to settle out when it was replaced into the slip following treatment. As a result, a coagulant was added to the water column to help with settling of the sediment. These items are discussed in greater detail in Section 2.1: Case Study Narratives. Waukegan Harbor, Illinois This site is located on the west shore of Lake Michigan, just downstream of the Outboard Marine site, and is also part of the Great Lakes Area of Concern. Sampling activities determined that sediment in the harbor was contaminated as a result of historic activities at the Outboard Marine site and transport of contaminated sediment from the Outboard Marine site to this location. Following completion of dredging activities at the Outboard Marine site in 1992, sediment and water quality at Waukegan Harbor were monitored to determine if further action was needed. Since 1998, sand sampled from this area has proven to be suitable for beach replenishment projects. Thus it was concluded that dredging at the Outboard Marine site was successful in remediating the entire harbor system. Ashtabula River, Ohio The Ashtabula River area of concern encompasses a 2-mile stretch of river and harbor area adjacent to Lake Erie. Sediments are contaminated with PCBs, heavy metals, and organic compounds. Due to the sediment contamination and degradation of fish populations, the Ohio USEPA has determined that the river should be dredged. More detailed information was not available.

Malcolm Pirnie/TAMS-Earth Tech 12 Peer Review Draft � October 2003
Engineering Performance Standards Appendix: Case Studies of Environmental Dredging Projects
Black River, Ohio The Black River is located in north central Ohio and discharges into Lake Erie. This site is part of the Great Lakes Area of Concern. Remediation consisted of the removal of PAH-contaminated sediment over a 1-mile stretch of river from 1989-1990. Dredging was performed using a mechanical clamshell dredge. A rubber mat was fastened to the bucket to provide a lid and closure in an attempt to control dredging-related resuspension. The major difficulty encountered during dredging was in-river transport of the sediment. Ultimately, dump trucks were mounted on barges and tugged to the dredging location and loaded. Following loading, the barge was tugged back to shore where the trucks were driven off the barge to the on-site landfill. Another interesting piece of information obtained was that the landfill was designed to capture and treat water in the dredge slurry so that the dredge slurry could be placed right into the landfill. Available post-monitoring data was gathered and reviewed as well. These items are discussed in greater detail in Section 2.1: Case Study Narratives. Manistique River, Michigan The Manistique River is located on the southern shore of Michigan�s upper peninsula with an outlet into Lake Michigan. This site is part of the Great Lakes Area of Concern. Contamination of sediment is the result of paper mill operations along the river�s banks. Initially, dredging was performed in 1995 as a pilot study; the USEPA had initially selected capping as the remedial action. Due to the success of the pilot project, the ROD was revised to allow for the removal of contaminated sediment via dredging. Ultimately, contaminated sediment was removed from 1.7 miles of the river and the harbor area from 1995 to 1999. Data on water column PCB concentrations measured during dredging and PCB loading estimates resulting from the dredging operation were obtained and analyzed. Lastly, information regarding modeling and how it compared with actual measurements made during dredging was reviewed. These items are discussed in greater detail in Section 2.1: Case Study Narratives. Pine River, Michigan The Pine River is located in St. Louis, Michigan and discharges into Lake Michigan. This site is part of the Great Lakes Area of Concern. Dredging operations consisted of the removal of DDT-contaminated sediment using mechanical equipment. Dredging was completed in the dry within coffer dams. Resuspension was monitored during dredging to ensure that no sediment loss occurred. In addition, post-dredge sediment samples were collected to verify that the 5 ppm DDT residual was met. These items are discussed in greater detail in Section 2.1: Case Study Narratives. Shiawasee River, Michigan The Shiawasee River contains PCB-contaminated sediment over an 8-mile stretch of the river. The USEPA issued a proposed plan for this site in July 2001. This plan contained details regarding existing PCB concentrations in the river and what remedial cleanup goals would most likely be implemented. To date, the USEPA has not yet issued a ROD.

Malcolm Pirnie/TAMS-Earth Tech 13 Peer Review Draft � October 2003
Engineering Performance Standards Appendix: Case Studies of Environmental Dredging Projects
Kalamazoo River, Michigan The Kalamazoo River flows through Michigan and ultimately discharges into Lake Michigan. This site is part of the Great Lakes Area of Concern. PCB contamination in river sediments is present over an 80-mile stretch of river. Currently, the USEPA is conducting ARI/FS investigation. The RI/FS and proposed plan completion date is set for Spring/Summer 2003, with ROD issuance set for Summer/Fall 2003. Saginaw River, Michigan The Saginaw River is part of the Great Lakes Area of Concern. Dredging of hot spots estimated to contain a total volume of 345,000 cy of PCB-contaminated sediment began in April 2000. Dredging was scheduled for completion in November 2000, however the actual completion date was July 2001. Mechanical dredging was performed with a Cable Arm Bucket, and a GPS system, WINOPS, was used to monitor the dredging operation. It was noted in the review of this site that only one dredge was employed in the river, and that this single dredge was used when rocks and other debris were encountered. In these instances, the bucket on the dredge was switched from a Cable Arm bucket to a clamshell bucket. Productivity rates were computed for this site and are evaluated herein. Menominee River, Wisconsin The Menominee River contains 6 miles of PAH-contaminated sediment. Dredging is currently being performed in the dry by diverting the river flow. Additional information was not gathered for this site because the operation is not representative of the work to be performed in the Hudson River. Fox River Deposit N, Wisconsin Deposit N, located in the Fox River is part of the Great Lakes Area of Concern, and consists of a 3-acre area contaminated with PCBs. Dredging with a hydraulic swinging ladder dredge was conducted at Deposit N as a demonstration and evaluation of dredging technology. Removal of PCB-contaminated sediment occurred during November 1998 and December 1998 (Phase I), and continued the following year from August 1999 to November 1999 (Phase II). During Phase I, a turbidity barrier was employed to contain the dredge area. Information regarding resuspension monitoring, dredge technique and schedule, turbidity measured during dredging, and PCB loading were obtained and evaluated. It was noted that bedrock existed underneath the sediment, which caused dredging problems. Modifications were made to the hydraulic dredging equipment in an attempt to capture the residual left behind. These items are discussed in greater detail in Section 2.1: Case Study Narratives.

Malcolm Pirnie/TAMS-Earth Tech 14 Peer Review Draft � October 2003
Engineering Performance Standards Appendix: Case Studies of Environmental Dredging Projects
Fox River SMU 56/57 1999 and 2000 Dredging Projects, Wisconsin The Fox River sediment management unit (SMU) 56/57 is located along the Fox River adjacent to the Fort James Plant. This river system is part of the Great Lakes Area of Concern. Approximately 80,000 cy of PCB-contaminated sediment were targeted for removal using a hydraulic cutter head dredge. After one week of dredging activities, the dredge was switched to an IMS 5012 Versi dredge in attempt to increase the solids content of the dredge slurry. The dredge was upgraded two more times during the first month of dredging in an attempt to meet an optimum production rate of 200 cy/hr. The Fox River SMU 56/57 was divided into 100 x 100- foot subunits. Dredging was performed from August 1999 to December 1999. It was determined at the end of Phase I (December 1999) that unacceptably high residuals were left in the area dredged due to mounds of sediment left behind between dredge passes. As a result, the dredging equipment was switched to a horizontal auger dredge for Phase II, which was carried out from late August 2000 to the end of November 2000. Phase I subunits were re-dredged to meet a 1 ppm PCB residual concentration. The Final Summary Report for Sediment Management Unit 56/57 (September 2000) and the Environmental Monitoring Report (July 2000) were obtained and reviewed during this task. Information regarding water quality monitoring, PCB water column levels and loading, turbidity measurements, and post-dredge sampling data was obtained and evaluated for this site. These items are discussed in greater detail in Section 2.1: Case Study Narratives. Sheboygan River, Wisconsin The Sheboygan River contains 14 miles of PCB-contaminated sediment. A pilot-dredging program that included the removal of 4,000 cy of sediment with a mechanical dredge equipped with a clamshell bucket and backhoe was implemented. In addition, nearby deposits were covered with an armored cap. Four years following the completion of this program, the USEPA performed an investigation on the system and concluded that the armored cap had deteriorated and that little change was noted in PCB levels within fish. As a result, the USEPA completed a Feasibility Study (FS) for this site, which was followed by issuance of the ROD. This ROD called for removal of a total volume of 74,000 cy of PCB-contaminated sediment. Dredging is expected to be performed using a mechanical dredge equipped with a clamshell bucket, however no detailed information on the dredging design or start date was located during this effort. Commencement Bay: Hylebos and Thea Foss, Wheeler, Osgood Waterway, Washington Commencement Bay is located in a tidal zone on the coast of Washington State and consists of nine areas that require remediation. Sediment in this area is contaminated with VOCs. During the data collection effort, it was determined that a hot spot within the Hylebos waterway would be dredged using a Toyo pump beginning in October 2002 and that the production goal would be 600 cy/day. It was indicated that the Toyo pump was selected due to the type of contamination. It was thought that the Toyo pump would work best because it could be submerged into the sediment and directly remove sediment with minimal agitation, minimizing VOC releases to the water column. Information regarding water quality monitoring to be performed was obtained, along with details of their monitoring plan. These items are discussed in greater detail in Section 2.1: Case Study Narratives.

Malcolm Pirnie/TAMS-Earth Tech 15 Peer Review Draft � October 2003
Engineering Performance Standards Appendix: Case Studies of Environmental Dredging Projects
The plan for dredging the remaining portion of the Hylebos Waterway is currently in the design phase, with dredging scheduled to begin in July 2003. Dredging will be conducted in 50 x 50-foot dredge management cells, and is being planned as a two-pass approach: the first pass will be completed with a clamshell bucket, and the second pass will be performed with a horizontal profiler bucket that is capable of making a flat, horizontal cut. Information regarding the dredging schedule, water quality monitoring, and dredging pattern were obtained and reviewed and are discussed in greater detail in Section 2.1: Case Study Narratives. A second sub-site, the Thea Foss, Wheeler and Osgood Waterway, is schedule to begin dredging in August 2003. Dredging equipment has not yet been selected, however the USEPA project manager indicated that mechanical dredging equipment would be selected. It was noted that this project consists of the removal of approximately 525,000 cy of PAH-contaminated sediment. This project is still in the design phase, and as such, operating standards have not yet been set. However, it was indicated that a turbidity standard would be set at either 20 NTU or 50 NTU above background. Details regarding the anticipated water quality monitoring were obtained and reviewed. These items are discussed in greater detail herein in Section 2.1: Case Study Narratives. Portland Harbor, Oregon This site, located off the coast of Oregon, was just recently placed on the National Priority List (NPL) by the USEPA due to elevated levels of metals, PCBs, and petroleum products in the harbor sediments. The USEPA is currently performing a RI/FS, which began in Fall 2002. United Heckathorn on the San Francisco Bay, California This site is located in the Richmond Harbor area, which is an inlet of the San Francisco Bay. Remedial investigations conducted in the fall of 1994 indicated that 15 acres of sediment were contaminated with DDT and dieldrin. Dredging with mechanical equipment was performed from August 1996 to March 1997 to remove the contaminated sediment. Review of information gathered indicated that dredging difficulties were encountered around structures along the shoreline and in areas where steep banks existed. Because of these problems, dredging was not completed around docks, piers and steep banks and these areas were backfilled with sand in lieu of dredging. The entire dredged area was also backfilled with sand. Post-dredge data obtained indicated that the sediment and water column were cleaner immediately following dredging; however, four months after dredging, DDT and dieldrin concentrations had increased in the sediments to levels equal to or greater than pre-dredge conditions. It was suspected that this was a result of incomplete dredging along the bank and around the piers and docks. Recontamination is suspected to be occurring from the banks as the sand cover is washed away, leaving contaminated banks exposed. The USEPA project manager indicated that this project is not considered a success, and the site is not considered clean. Information regarding dredging methods, water quality monitoring, and post-dredge monitoring and data was gathered and reviewed. These issues are discussed in greater detail in Section 2.1: Case Study Narratives.

Malcolm Pirnie/TAMS-Earth Tech 16 Peer Review Draft � October 2003
Engineering Performance Standards Appendix: Case Studies of Environmental Dredging Projects
2.1 Case Study Narratives St. Lawrence River Remediation Project at the Alcoa, Inc. Massena East Smelter Plant, New York (Reynolds Metals) Site Location and Description The St. Lawrence River segment of the Reynolds Study Area was originally defined as that segment of the river between the mouth of the Grasse River in the west and the International Bridge in the east, and from the southern shoreline of the river to the southern edge of the Cornwall Island navigational channel (part of the St. Lawrence Seaway). Following additional study and evaluation, the focus of remediation activities was narrowed to an approximately 3,500-foot long segment of the river immediately north of the Reynolds Metals Company (RMC) facility, extending an average of about 450 ft from the southern shoreline into the river. The RMC St. Lawrence Reduction Plant (SLRP) is an aluminum reduction facility. Several contaminants, including PCBs, have been identified in the sediments of the St. Lawrence River north of the facility. Site Characteristics The remediation area is approximately 30 acres in size, of which approximately 22 acres underwent remediation (the remaining sections were not contaminated). The area has an average water depth of about 10 ft, with a maximum of about 27 ft. Bottom topography (bathymetry) was highly irregular due to the creation of a shallow shelf from the dumping of dredge spoil during construction of the Cornwall Island Navigation Channel. A great number of underwater obstructions were identified during surveys and sheet pile wall installation. A large navigational dredging program was performed. Despite the fact that the main river current has flow velocities of 8 feet per second (fps) or higher, most of the shelf adjacent to the RMC plant is a slow-energy system characterized by low flow velocities and little wave action. Current speeds in the near-shore shelf area were found to be mostly less than 1 fps with an average of 0.5 fps. Sediments in the project area overlay a till layer at depths ranging from 1.5 to 30 feet below the river bottom. The characteristics of the sediments varied widely, depending upon the source. Sediments above the till layer ranged from low blow count mud to relatively competent sand, gravel, and clay. Dredge spoils from construction of the St. Lawrence Seaway were deposited in some areas. In other areas more competent materials were overlain by recently deposited soft sediments. In areas where soft sediments were largely absent, gravels and cobbles were the predominant materials.

Malcolm Pirnie/TAMS-Earth Tech 17 Peer Review Draft � October 2003
Engineering Performance Standards Appendix: Case Studies of Environmental Dredging Projects
Remedial Action A ROD for the remediation of the St. Lawrence River was initially signed on September 27, 1993 by the USEPA and revised in 1998 based on the results of additional investigation and analysis. The major components of the selected remedy included:
• Dredging and/or excavation of approximately 51,500 cy of sediment with PCB concentrations above 1 ppm, PAH concentrations above 10 ppm, and TDBF concentrations above 1 ppb from contaminated area in the St. Lawrence River and the associated riverbank;
• Landfilling of all dredged and dewatered sediment with PCB concentrations between 50
and 500 ppm at an approved, offsite facility; • Consolidation of all dredged and dewatered sediment with PCB concentrations less than
50 ppm in the on-site Industrial Landfill; and • Treatment of all dredged and dewatered sediments with PCB concentrations exceeding
500 ppm. All remediation activities, including construction of containment structures, dredging, sediment handling and disposal, capping, and removal of the containment structures, were completed between April 5 and November 25, 2001. Three derrick barges equipped with Cable Arm Environmental Buckets were used to remove 86,600 cy of contaminated sediment containing an estimated 20,200 lbs of PCBs. Sediment removal was also done from the shoreline using an excavator. A total of 546 dredge passes were completed on the 268 cells; 134 cells were remediated on a single pass, while 56 cells required three or more passes. Eleven cells were dredged seven or more times. An interim cap consisting of 1-2 feet of gravel was placed over 15 cells at the end of the season after determining that further dredging was not feasible. 185 of the 268 dredge cells were remediated to < 1 ppm PCBs, and another 51 were remediated to between 1 and 2 ppm PCBs. All but 12 of the 268 dredge cells were successfully remediated to < 10 ppm PCBs, and these 12 were capped. The average PCB concentration in all three of the Evaluation Areas were well below the 5 ppm criterion specified in the design as the basis for determining when remediation requirements were complete. The site-wide average PCB concentration of 0.8 ppm represents a 98.6% reduction in PCB contaminant levels across the site. Percent reduction in PCB contamination levels in the Evaluation Areas ranged from 93.8 to 99.4 %. The majority of the PAH sampling results identified contamination well below the 10 ppm PAH cleanup goal. The post-dredging concentrations of PAHs in sediments were found not to be associated with any adverse risks to human health or the environment. Only two cells had PCDF concentrations above the 1 ppb cleanup goal following dredging, and both were associated with

Malcolm Pirnie/TAMS-Earth Tech 18 Peer Review Draft � October 2003
Engineering Performance Standards Appendix: Case Studies of Environmental Dredging Projects
PCB concentrations > 10 ppm and were covered with the interim cap. 69,000 cy of wet sediments with < 50 ppm PCBs were brought to the on-site landfill. Following stabilization, placement, and compaction, this material was reduced to an in-place volume of 50,300 cy. Sediment with ≥ 50 ppm PCBs was shipped to Model City for disposal after being stabilized with Portland cement. A total of 22,356 tons were shipped offsite, of which 5,909 tons measured > 500 ppm PCBs. The environmental monitoring during the project showed that there were no releases of contamination from the site, and that no other adverse impacts to human health or the environment resulted from the remediation activities. Containment System The containment system prevented the release of turbidity and/or suspended sediment generated during sediment removal activities. The containment system included: a steel sheet pile wall that enclosed the entire remediation area; silt curtains that provided secondary containment for the more highly contaminated Area C and isolated uncontaminated portions of Area B from the dredging area; and air gates that created an air-bubble curtain that acted as a circulation barrier while allowing for barge and tugboat access to areas enclosed by the silt curtain and sheet pile wall. Resuspension Monitoring Based on the sampling locations, resuspension monitoring activities can be divided into two groups: inside the sheet pile enclosure, and outside the sheet pile enclosure. Current velocity and direction studies were performed before and after the installation of the sheet pile to verify the proper placement of monitoring points. Outside the Sheet Pile (In the St. Lawrence River) Turbidity and water quality samples were collected from monitoring stations established in St. Lawrence River outside the sheet pile, during sheet pile installation, dredging, and during sheet pile removal. Turbidity Monitoring The action level for turbidity monitoring was based on a correlation study done by GM for the dredging work at their site downstream of the RMC remediation site. GM and the USEPA identified a downstream TSS maximum limit of 25 mg/L above background as the action limit for their dredging project. In order to use turbidity measurements as the parameter to measure compliance with the 25-mg/L-action level, GM performed bench-scale testing to establish a site-specific correlation between TSS and turbidity. Based on the regression equation developed, GM identified a turbidity action level of 28 NTU above background as their action limit for measuring compliance with the 25-mg/L TSS action limit. For this work, the action level of turbidity was set to be 25 NTU, lower and more conservative than that used by GM.

Malcolm Pirnie/TAMS-Earth Tech 19 Peer Review Draft � October 2003
Engineering Performance Standards Appendix: Case Studies of Environmental Dredging Projects
Turbidity measurements were collected using a water-borne monitoring team with a direct-reading turbidimeter (Hydrolab) that was calibrated each day in accordance with the manufacture�s specification. In addition, QC checks of the Hydrolab were conducted using a Hach turbidity measuring kit. The frequency of the QC checks varied, but averaged at least one check per station per day. Turbidity was also measured with a data-logging turbidimeter that was installed at a fixed location. A fixed background station was established upstream of the remediation area. The upstream and downstream monitoring locations were selected based on the current velocity and direction studies. Turbidity monitoring during sheet pile installation - Turbidity was monitored at three separate points relative to each derrick barge engaged in sheet pile installation: one location was situated 100 ft upstream of the active location, and two locations were situated downstream, one 200 ft from the active location and one 400 ft from the active location. The turbidity measurements were taken at two-hour intervals. Most of the Hydrolab (1770 out of 1780) data were non-detect. As verified by Hach kit results, the Hydrolab was able to quantify higher levels of turbidity, but was unable to resolve low levels of turbidity (1-2 NTU). Given that the action level was set at 25 NTU above background, this limitation on Hydrolab was not identified as a concern during the project. Turbidity monitoring during dredging � Background turbidity was collected from a fixed background station located northwest of the sheet pile enclosure. Background data was also collected from stations 100 ft upstream from each active dredge. Downstream samples were collected at three locations, 10, 150, and 300 ft from the sheet pile wall closest to the dredge being monitored. The measurements were taken at 2-hour intervals starting just prior to dredging operations and ending with the completion of work each day. Vertical turbidity contrasts were not observed. All measurements were taken at 50% of water depth. No significant turbidity was observed during any of the river monitoring activities during dredging. The Hydrolab measurements were mostly non-detect, while those from the Hach kit were typically in the range of 0.5 to 1.5 NTU. Turbidity monitoring during sheet pile removal � In response to a request from the St. Regis Mohawk Tribe, RMC lowered the turbidity action level in the St. Lawrence River from 25 to 10 NTU during sheet pile removal. A total of 1,451 turbidity measurements were collected during the 18 days of removal activities. Turbidity levels in the river were comparable to those observed during earlier phases of the work, and were predominantly in the range of 1-2 NTU. No exceedences were identified during any part of the wall removal activities.

Malcolm Pirnie/TAMS-Earth Tech 20 Peer Review Draft � October 2003
Engineering Performance Standards Appendix: Case Studies of Environmental Dredging Projects
Water Column Sampling Water column samples were collected at different stages of the project and analyzed in the laboratory using methods 8082A (PCB), 610 (PAH) and 8290A (PCDF). Water column monitoring during sheet pile installation � Water samples were collected from a downstream turbidity monitoring point (typically 200 ft downstream) and from an upstream station (100 ft upstream). The samples were collected at 50 % of river depth for PCB analysis and TSS measurement. A total of 111 water samples were collected, and all results were reported as non-detect for PCB at a detection limit of 0.065 µg/L. Water column monitoring during dredging � Water column samples were collected daily at the same monitoring stations used for turbidity monitoring. The samples were collected at 50% of river depth and analyzed for PCBs, PAHs, and PCDFs. Of the total 661 unfiltered water column samples, 40 of them were reported to have detectable levels of PCBs with concentrations ranging from 0.05 to 0.53 µg/L. All reported detections were well below the action level of 2 µg/L PCBs, which indicated that dredging did not result in the release of PCBs during the remedial action. 59 and 50 unfiltered water column samples were collected for PAH and PCDF analyses, respectively, and all results were reported as non-detect. Water column monitoring during removal of sheet pile wall � 113 PCB samples, 93 PAH samples, and 100 PCDF samples were collected and analyzed during the sheet pile wall removal. PCBs were detected in 18 samples, but none of the concentrations were above the 2 µg/L action level. PAHs were detected in three water samples, and all three of these detections were above the action level of 0.2 µg/L. Further evaluation suggested that these exceedences were probably due to localized turbidity rather than the sheet pile removal activities. PCDFs were detected in 10 samples; all detected concentrations were below the action level. Inside the Sheet Pile Enclosure Turbidity and water column samples were collected inside the sheet pile enclosure during dredging and capping in order to provide information concerning water quality and sediment resuspension. Turbidity monitoring during dredging � Daily turbidity measurements were taken at 12 to 19 different stations during a portion of the dredging operations. The number and location of the stations depended on the dredging activities occurring when the monitoring team was able to collect the measurements. As indicated by 820 turbidity measurement results, average turbidity was typically less than 25 NTU and maximum turbidity was generally below 50 NTU. The higher turbidity values were obtained in proximity to derrick barges engaged in dredging operations. A data-logging Hydrolab turbidimeter was also used to collect continuous turbidity measurements at a fixed location. The instrument was attached to a silt curtain anchor post and
Malcolm Pirnie/TAMS-Earth Tech 21 Peer Review Draft � October 2003
Engineering Performance Standards Appendix: Case Studies of Environmental Dredging Projects
monitored turbidity at a depth of 50% of the water depth. Data from the hourly measurements are available. Water column sampling during dredging � Water column samples were collected once a week during active dredging and analyzed for PCBs, PAHs, and PCDFs. Samples collected between June 20, 2001 and October 10, 2001 at one station were field filtered using a 0.45 um filter in order to limit the analysis to dissolved contaminants only. After that period, unfiltered samples were collected at several stations to investigate the contaminant level on a whole water basis. Filtered samples were reported to have total PCB concentrations of 0.2 to 0.5 µg/L, while unfiltered samples had higher levels of PCBs. PCB concentration declined rapidly once dredging was complete, and higher concentrations were observed at the stations that were associated with consistently higher turbidity. Similar phenomena were observed for PAHs and PCDFs. PCDF contamination is absorbed to particles and is less likely to accumulate in the dissolved phase of the water column. All of the results observed in the project indicate that contaminant water column concentration increased with the higher turbidity. The absence of turbidity in a sample, resulting either from field filtering the sample or by collecting a sample from clear water, generally resulted in a sample with no contamination, or least no contamination above the action levels. There was no evidence of any significant accumulation of dissolved-phase PCBs, PAHs, or PCDFs. The collected data show that if turbidity is contained, the sediment-related contamination is also contained. Turbidity monitoring during capping � During the capping operation (October 26 � November 2, 2001), turbidity was measured at five stations, all of which were located inside the sheet pile enclosure. The stations included a background station (located 100 ft upstream), a station adjacent to the Cat 350 (the derrick used for placement of the capping materials), and downstream stations located 150 and 300 ft from the capping operation. Turbidity levels measured during capping were comparable to those observed inside the wall during dredging operations. No monitoring was done outside the sheet pile wall during capping. Water Intake Monitoring Potable water intakes used by AMN (formerly SRMT) and for the GM and RMC plants were sampled during dredging and sheet pile removal to monitor for any impacts from the remediation activities on the quality of water supplies obtained from St. Lawrence River. The AMN water treatment facility is located approximately 3.9 miles downstream of the remediation area, and the GM plant intake lies approximately 0.6 miles downstream. The RMC intake lies just west of the remediation area, but is in the zone of reverse current flow, which placed the RMC intake downstream of the western part of the remediation area. Water grab samples were collected from sample ports of raw (untreated) and filtered (treated) water within the AMN Water Treatment Building, while samples of raw (untreated) water only were obtained from sampling ports inside the GM and RMC water plants. During dredging

Malcolm Pirnie/TAMS-Earth Tech 22 Peer Review Draft � October 2003
Engineering Performance Standards Appendix: Case Studies of Environmental Dredging Projects
operations involving the removal of the sediment with > 500 ppm PCBs, water samples were collected from the designated location daily. Samples were collected on a weekly basis during all other dredging activities. Daily sampling was resumed during removal of the sheet pile wall, and continued until the final week of the wall removal. The USEPA-approved water quality action levels were non-detectable PCB and PAH concentrations, with detection limits of 0.065 µg/L and 0.2 µg/L, respectively. The water intake for the Mohawk Council of Akewsasne (located downstream of AMN) was to be sampled if any of the action levels were exceeded at the AMN water intake. There were no exceedences, and thus no samples were collected from the Mohawk Council of Akewsasne. A total of 261 intake samples were collected and analyzed for PCBs. Only one sample had a reported detection of PCBs. However, this result is believed to be spurious. A total of 117 intake samples were also collected and analyzed for PAHs. PAH sampling was conducted only during dredging operations. No PAHs were detected in any of the 117 water intake samples. In summary, the remediation activities conducted in 2001 did not have any impact on downstream water supplies in the St. Lawrence River. Evaluation of Dredging Four Cable Arm environmental clamshell buckets (two 5.4-cy and two 2-cy) were specially designed and utilized on the project. Each bucket was equipped with sensors to allow the operator and marine technician to monitor its position with respect to the water-air and water-sediment interfaces. The buckets have a specialized closing system that allows for closure along a constant horizontal plane, a key feature in the determination of depth of cut. The Cable Arm buckets generally performed as expected. The large quantity of fractured rock (long, straight edges vs., rounded cobbles) associated with the dredge spoils presented a unique problem to the Cable Arm bucket. The Cable Arm bucket lacked sufficient power to shatter these rocks, and they were not easily moved through the sediment. In some cases, after removal of the overlying soft sediment, a hard bottom condition with a very thin layer of soft sediment or a mixture of rock and fine sediment remained with concentration above cleanup goals. A known limitation of the Cable Arm technology was its inability to remove sediment in area with hard bottom, such as glacial till or stiff clays. This limitation led to the use of alternative dredging method.

Malcolm Pirnie/TAMS-Earth Tech 23 Peer Review Draft � October 2003
Engineering Performance Standards Appendix: Case Studies of Environmental Dredging Projects
Three separate �evaluation areas� were defined for the remediation area, designated Evaluation Areas #1, #2, and #3. Determination that remediation requirements were complete required the following conditions:
• When the requirements of the dredging procedures and flow sheet logic were accomplished in all cells within the area.
• When the average PCB concentration of the area was less than or equal to 5 ppm; and
• When no individual grid node within the area had a PCB concentration above 10 ppm.
The 30-acre remediation area was subdivided into 4 sub-areas: A, B, C and D. The contaminated portions of each area were further divided into individual dredge cells based on the triangular sampling grids used for the Area A Sampling and Analysis Plan (July 1996). The configuration of the sampling grids was developed based on earlier statistical studies and input from the USEPA. A dredge cell was defined as a dredging area with one point (location) of the sampling grid located in its center. Verification sampling locations in Areas A, B, and D reflected a triangular grid spacing of 70 ft, while verification sampling locations in Area C were based on a triangular grid spacing of 50 feet (all eight hot spots were located in Area C). A total of 268 dredge cells were defined within the remediation area. Verification samples were initially collected using a Ponar dredge sampler operated from the ATL sampling barge. The sampling technique was changed to the spilt-spoon method when it became apparent that the Ponar dredge would not be able to generate samples representative of the 0-8 inch sediment interval. The sampling locations were determined using GPS instrumentation. Sample collection procedures were conducted in accordance with the methodology detailed in the Procedure for Surface and Subsurface Sediment Sampling, REP-002. The verification samples were analyzed using a field screening immunoassay method in accordance with Method 4020 in USEPA SW-846, Test Methods for Evaluating Solid Waste, Rev. 0., 1996. Evaluation of the immunoassay results drove decisions regarding follow-up dredging and/or additional laboratory analyses for the samples. Expanded analyses for PAHs and PCDFs were conducted on a minimum of 10% of the dredge cells. The cells for PAH and PCDF analysis were identified using a randomized sampling approach. Verification samples were collected from each of the 268 dredge cells and analyzed for PCBs. The final dataset consists of 86 immunoassay results and 182 laboratory PCB results. Post-dredging average PCB concentrations in the three evaluation areas were 0.6, 1.4, and 0.5 ppm, respectively, which are well below the 5 ppm area-wide criterion. Site-wide, the average PCB concentration was reduced from 59.1 to 0.8 ppm, corresponding to a 99% reduction in sediment PCB concentrations.

Malcolm Pirnie/TAMS-Earth Tech 24 Peer Review Draft � October 2003
Engineering Performance Standards Appendix: Case Studies of Environmental Dredging Projects
Nearly 70% (185) of the cells were remediated to less than 1 ppm. Another 51 cells, representing 19% of the total, were remediated to less than 2 ppm. Four percent of the cells had post-dredging concentration greater than 10 ppm, all of which were covered with the interim cap. Except for one cell that was capped and six cells that were designated as �Mark for Further Evaluation� (MFE), no further dredging effort was warranted on cells with 1-2 ppm PCBs. The collected data showed that there was little progress being made in the attempt to reduce the 1-2 ppm sediment PCB levels to < 1 ppm. With the USEPA�s current slope factor of 0.2 for PCBs, which is nearly 75% smaller than the one used in the baseline risk assessment and original cleanup goal calculations, a PCB concentration of 1-2 ppm corresponds to a risk level that is at least as protective as that used in the derivation of the original cleanup goals. A total of 16 dredged cells were left with PCB concentrations between 2 and 5 ppm. Two of these cells were designated as MFE, while a third was capped (due to proximity to cells with > 10 ppm PCBs). Four cells had final verification sample results with 5-10 ppm PCBs. One of these cells was capped; the other three were designated as MFE. A total of 12 cells could not be remediated to concentration below 10 ppm PCB and were covered with a 2-foot gravel layer as part of the interim capping effort. All cells with final PCB concentration > 2 ppm underwent a large number of dredge passes in order to reduce PCB concentration to the target < 1 ppm level. RMC collected samples from 43 dredge cells for PAH analysis, and USEPA sampling results were generated for an additional 53 cells. There were 16 RMC samples and ten USEPA samples that had PAH concentrations exceeding the 10 ppm cleanup goal. Five of the cells with > 10 ppm PAHs were capped. Nearly 50 % of the cells with PAHs > 10 ppm had four or more dredge passes, indicating the difficulty in remediating PAH contamination at the site. Continued dredging would not necessarily have resulted in a meaningful reduction of PAH concentrations. PAHs were removed to the extent practicable given the limits of dredging technology used at the site. An evaluation of the risk associated with residual PAH contamination determined that the post-dredging concentration of PAHs are not associated with adverse human health or ecological risk. A total of 32 final verification samples were collected for PCDF analysis. There were two cells in which the 1 ppb PCDF cleanup goal was not achieved. These cells were dredged about 6 to 7 times, resulting in the removal of a significant quantity of sediment but not in a reduction of the contaminant concentration to below the cleanup goals for PCDF. Both cells were covered with the interim gravel cap at the conclusion of the dredging operation. The site-wide average PCDF concentration was 0.197 ppb, indicating that the remediation of the site with regard to PCDFs was highly effective. RMC expended a considerable level of effort in the quest to achieve cleanup goals and remove as much of the contaminated sediment from the river as was technically feasible. About half of the dredge cells received two or more passes, and nearly one quarter of the cells received three or more passes. A total of 546 dredge passes were completed, which equates to an average of just

Malcolm Pirnie/TAMS-Earth Tech 25 Peer Review Draft � October 2003
Engineering Performance Standards Appendix: Case Studies of Environmental Dredging Projects
over two passes for all 268 dredge cells. Additional dredging did not necessarily mean that progress was made. It was observed that any dredging after about the 5th pass did not make any real progress toward attaining the cleanup goal. These additional dredge passes did, however, result in the removal of additional PCB mass from the river. It was realized that the limit of dredging technology and the bottom stratigraphy after previous dredging passes (no longer amenable to dredging) were the two major reasons for the failure to achieve the cleanup goal in dredge cells that remained contaminated. The conventional rock bucket and hydraulic clamshell of the Cat 350 were used as alternative dredges during the re-dredging of contaminated dredge cells. The decision to utilize alternative dredging methods was based on the presence of persistent contamination in these cells and the fact that previous dredging attempts had not been successful in reducing contamination levels. Such situations indicated that the limitation of the Cable Arm environmental bucket had been reached. The conventional rock bucket consisted of a 2.5 cy clamshell bucket that could be used with the lattice boom cranes on the derrick barge. The bucket was capable of digging into the more resistant hard bottom materials and was more effective in removing rocks and gravel. The disadvantages of the conventional bucket were that it did not have a venting system to allow water to pass through the opened bucket during descent, which minimizes downward water pressure and sediment disturbance, and that it did not have the regulated closing system or overlapping side seals that minimize the disturbance of sediment on the bottom and reduce sediment loss on closure. The Cat 350 had a hydraulically operated clamshell bucket with a 2.5 cy capacity. The hydraulics on this bucket provided for better closure, and also allowed it to dig into stiff sediment and rocky material. Its primary disadvantage was that the operator had to be extremely careful not to overfill. The issue of timing in the collection of verification samples is addressed in the EMP:
�Verification sampling will be conducted after sufficient time has been passed to allow for settling of suspended solids, and thus it is expected that sampling will be conducted for groups of cells that are at least somewhat removed from the active dredging area.�
It turned out that this requirement was unrealistic in the execution of the work, due primarily to the re-dredging effort required. The re-sampling effort required by USEPA identified a shift in PCB concentration in the sediment, and in general a greater number of samples with higher PCB concentrations were obtained. Sediment samples were analyzed for PCBs using Method 8082 (Method 8270 was used for some samples but its use was curtailed as directed by the USEPA). Variability existed in sediment sample results. This variability was mainly attributed to matrix variability, inter-lab variability, and analytical variability. Additional sampling and analyses did not eliminate the uncertainty associated with sediment PCB analyses.

Malcolm Pirnie/TAMS-Earth Tech 26 Peer Review Draft � October 2003
Engineering Performance Standards Appendix: Case Studies of Environmental Dredging Projects
Capping As stated in the work plan, any cell with a residual concentration > 10 ppm was capped. The cap consisted of a 6-inch separation layer, a 12-inch containment layer, and a > 9-foot armor and bioturbation layer. At the conclusion of the dredging work in 2001, a total of 15 dredge cells were covered with an interim cap. The material placed for interim capping was based on the physical isolation layer as detailed in the Remedial Action Work Plan. The design specified that the layer consist of a 6-in (minimum) layer of gravel. For the actual application, the USEPA requested that the minimum thickness of the layer be increased to 12 inches, and that the gravel be placed in two lifts. Approximately 6,717 tons of gravel was used in capping the designated area. Using a conversion factor of 1.5 tons per cubic yard, this is equivalent to 4,478 cy of materials. The capping area, including run-out, was 47,270 ft2. The average thickness of the gravel layer was calculated to be about 2.2 ft. Because of the absence of soft sediment in the areas that were capped, the bottom was not covered by geotextile prior to placement of the gravel. Observations through early May of 2002 indicated that the cap had easily withstood storms and other winter weather. Completion of the final two layers of the cap will assure that the underlying contaminated sediment remains effectively isolated from the ecosystem of the St. Lawrence River. General Motors Corporation Powertrain Facility (A.K.A. GM Massena), St. Lawrence River Remediation Project, Massena, New York Site Location and Description The site is located seven miles to the east of Massena, New York and approximately two miles to the south of Cornwall, Ontario, Canada. The facility is bordered to the north by the St. Lawrence River, to the south by Raquette River, to the east by St. Regis Mohawk Tribal Property, and to the west by Reynolds Metal Company and property owned by Conrail. PCB-containing fluids were used at the site between 1959 and 1973 in die casting machinery. In 1984 the site was placed on National Priority List. Site Characteristics The portion of the St. Lawrence River that was the focus of remediation activities consists of a shallow bay area. The bottom of the bay forms a shallow shelf extending approximately 250 feet into the river before dropping sharply to approximately 40 feet at the southern edge of the St. Lawrence Seaway shipping channel. The shelf was composed primarily of fine-grained sediments (clay, silt and sand) overlying dense, glacial till (weathered and soft at the surface). Coarser material (i.e., gravel, cobbles and large boulders) existed near the bottom of sediments within weathered till.

Malcolm Pirnie/TAMS-Earth Tech 27 Peer Review Draft � October 2003
Engineering Performance Standards Appendix: Case Studies of Environmental Dredging Projects
Flows from Lake Ontario range from 258,000 cubic feet per second (cfs) to 289,000 cfs. The normal high water elevation near the site is 156.0 ft, and the normal low water elevation is 153.0 ft. The water fluctuations in the channel near the site are generally less than one foot (154.0-155.0 ft). Local velocities in the main channel upstream of the mouth of the Raquette River ranged from 2.75 fps to 4.42 fps, and the mean velocity was 3.65 fps. Lower velocities were observed on and adjacent to the shallow bay where sediment removal activities were conducted. Remedial Action The goal of this project was the removal of sediments from a 10-acre PCB-contaminated area adjacent to the GM aluminum casting facility in Massena, New York. Between May 1995 and January 1996, approximately 13,800 cy of sediment were dredged. Sediments were removed via hydraulic dredging using a horizontal auger dredge. Debris, rock, and boulders were removed using a barge-mounted backhoe. The bucket of the backhoe-contained openings that allowed debris about three inches or less in diameter to pass through. Hydraulic dredging of sediments by the horizontal auger dredge was generally done parallel to the shore. Additional alternatives were used in Quadrant 3 where the cleanup goal was not achieved after multiple dredging passes (eight attempts were made). Alternative technologies attempted include: a vacuum dredge head (that did not contain an auger) with a metal shroud that collected sediment by negative pressure utilizing the dredge�s intake pump, a horizontal auger dredge used parallel to the shore, and mechanical removal of sediments using a barge-mounted backhoe. Typically two to six passes were required for remediation. In general, each pass commenced perpendicular to the shore or sheet pile wall, advanced at a rate of approximately 2-4 ft per minute, and made a 3 to 12 inch-deep and 8-foot wide cut. About 15 to 18 passes were required in Quadrants 1 and 3 to bring concentrations to below 500 ppm. Dredged sediment was dewatered and the resulting filtercake was stockpiled on-site for later off-site disposal. Dewatering and excavation of the cove area were not carried out as of the report date due to unsettled access issues. Containment System The work was accomplished within a sheet pile system when the designed double silt curtain containment system was found to be ineffective due to highly variable current speeds and variable current direction. Shoreline areas (less than 5 ft) were isolated with a port-a-dam and excavated in the dry. During Phase 1 dredging, limited exchange of turbid water was observed in some areas where certain sheet piles were driven below water surface. To correct this problem, filter fabric was draped over the openings and anchored with steel cable ballast. In Phase 2, many of the low sheets were raised and short lengths of steel sheeting (8-12 inches) were installed to close the openings.
Malcolm Pirnie/TAMS-Earth Tech 28 Peer Review Draft � October 2003
Engineering Performance Standards Appendix: Case Studies of Environmental Dredging Projects
It was concluded from this project that a sheet pile wall can efficiently prevent suspended solids from escaping the work areas. Resuspension Monitoring A Sampling Depth and Location Evaluation study was conducted during initial dredging operations to determine the optimum sampling locations for the measurement of turbidity and the collection of water column samples. Measurements were collected from five locations: approximately 7 ft, 15 ft and 22 ft below the water�s surface (about 25%, 50% and 74% of measured water depths), and at two locations along the outboard side of the of the control system at intervals between 200-300 ft apart. Data were collected twice daily for three consecutive days (a total of 90 data points). Sampling locations and depths that exhibited the highest values of turbidity were used for turbidity and water column sampling during dredging operations. Real-time turbidity monitoring samples were collected at a total of 13 locations during sediment removal. All monitoring stations were located outside the sheet piling. Monitoring Station 1 (MS1) served as the upstream background monitoring station that remained in the same location throughout the project. Downstream monitoring stations varied during different phases of the project. Turbidity Monitoring Turbidity measurements were collected daily at approximately two-hour intervals at three stations: one station 50 ft upstream of the western extent of control system, and two stations between 200 ft and 400 ft downstream of easternmost active installations. Measurements were collected from 50% water depth. If the real time turbidity value downstream exceeded the upstream value by 28 NTU for five minutes or more, turbidity measurements downstream continued for at least one hour or until the exceedences stopped. If the exceedences continued, water-borne remediation activities were modified until the problem was rectified. The action level was selected based on a 1994 site-specific bench-scale laboratory correlation between TSS and turbidity and experience in previous dredging projects. Based on bench-scale tests, the following correlation was developed for overall conditions including elevated TSS results (i.e., > 300 mg/L): Turbidity (NTU) = 7.3745 + (0.611058 x TSS) + (0.00094375 x TSS2), r2=0.941. Based on a regression analysis for TSS < 60 mg/L and Turbidity < 60 NTU this equation was reduced to TSS (mg/L)=[0.63x(Turbidity in NTU)] + 6.8, r2=0.43. A turbidity value of 28 NTU would correspond to a TSS of below 25 mg/L. Turbidity measurements were collected and documented using a Horiba Water Quality Tester, Model U-10. The turbidity meter was calibrated at the beginning of the day and re-checked at the end of the day using three calibration standards (0, 10, and 50 NTUs). As mentioned above, the

Malcolm Pirnie/TAMS-Earth Tech 29 Peer Review Draft � October 2003
Engineering Performance Standards Appendix: Case Studies of Environmental Dredging Projects
action level for turbidity monitoring was set to be 28 NTU higher than the background level. During sheet pile installation, turbidity measurement ranged from 0 to 13 NTU with no measurements above the action level. In 18 out of the 923 samples, the turbidity measurements were above the action level of 28 NTU above background (i.e., 31-127 NTU). These exceedences were observed at a depth of one foot below water surface (except for one measurement at 9 ft). Duration of the exceedences was generally two to eight minutes (two exceedences were as long as 15 minutes and 45 minutes). The cause of the exceedences was reported to be overflows at low steel sheets (installed as per design to assure stability of the containment system during storms and high waves). This problem was later corrected as described above under �Containment System.� Water Column Sampling Samples were collected at the same two downstream locations as the turbidity measurements. A total of 146 samples were collected and analyzed for PCBs. PCB concentrations above the action level of 2 µg/L were detected when elevated turbidity readings were observed. In the area under the protection of sheet pile, the PCB concentrations were much lower than the action level. A total of 38 samples were collected and analyzed for PAHs, and the concentrations were below detection limit. After the removal of the Phase 1 sheet pile wall, eight samples were collected inside the Phase 1 containment area. Both filtered and unfiltered samples were analyzed. The filtered water column concentrations ranged from 0.94 to 2.4 µg/L, and the unfiltered water column concentrations ranged from 4.51 to 9.84 µg/L. Water Intake Monitoring Two water treatment facilities existed within or in the vicinity of the dredging area: the GM facility and the SRMT facility. The GM treatment facility�s intake was originally in the Phase 1 dredging area, but was extended an additional 85 feet beyond the dredging area due to remedial operations. The SRMT treatment facility was located 1.5 miles downstream of GM facility. Both raw (untreated) and filtered (treated) water grab samples were collected at the SRMT water treatment building, and a treated water sample was collected from the GM facility. During dredging operations in areas where the PCB concentrations exceeded 500 ppm, sampling was done daily. During the dredging of areas where the PCB concentrations were below 500 ppm sampling was done weekly. The monitoring results for the SRMT facility indicated that in two out of 52 untreated water samples, the total PCB concentrations were 0.090 and 0.085 µg/L. The remaining samples were below the detection limit. Monitoring results for the GM facility treated water showed total PCB concentrations between 0.27 and 0.54 µg/L between June 19 and July 10, 1995. It was assumed that these detections were to due to a leak into the intake piping in dredging area. After the pipe was repaired, total PCBs were detected only in of two samples collected between July 10 and

Malcolm Pirnie/TAMS-Earth Tech 30 Peer Review Draft � October 2003
Engineering Performance Standards Appendix: Case Studies of Environmental Dredging Projects
December 22, 1995 (0.12 and 0.14 µg/L). The PAH results collected from the same monitoring locations at the two facilities were all below method detection limits. With USEPA approval, PAH testing at these facilities was discontinued after 21 days of sampling. Evaluation of Dredging The GM Massena project had a cleanup goal of 1 mg/kg total PCBs. Although over 99 % of the contaminated PCB sediment mass was removed from the St. Lawrence River, the 1 mg/kg goal was not met in some areas. In five of the six quadrants, the average post-dredging concentration was 3 mg/kg with no sample exceeding 10 mg/kg. In Quadrant 3, the average post-dredging concentration was 27 mg/kg (General Motors Powertrain, 1996). If the relatively high pre-dredging concentrations within the sub-areas were considered (208 mg/kg and 2,170 mg/kg), the reduction was estimated at 98.6 % for five quadrants and 98.8 % for Quadrant 3 (Kelly, 2001). Similar to Grasse River, the inability to reach the cleanup goal in some areas was attributed to the presence of a hard till layer beneath the targeted sediments, which limited the ability to over cut into clean material. Following sediment removal, samples were collected from the river bottom to determine the residual PCB concentration and whether or not the target cleanup goal for the river sediment had been achieved. For all areas that contained > 500 ppm PCBs, the grid spacing was approximately 50 feet by 50 feet. For other areas containing < 500 PCBs, the grid spacing was approximately 70 ft by 70 ft. Core samples were collected from the upper 6 inches of sediment using LexanTM tubes and/or stainless steel augers. Each sample was analyzed for individual Aroclors. All PCB analyses were performed by an off-site laboratory utilizing USEPA SW-846 8082 methodology and CLP procedures. Sample collection was performed a minimum of 24 hours after leaving an area to allow suspended solids to settle to the river bottom. Samples were collected from 113 locations. Final PCB concentrations in individual bottom samples did not achieve the 1 ppm goal in many instances. Final sediment sampling locations, and post-dredging PCB concentration isopleths are shown in Figure 1 and Figure 2. Capping While over 99% of the contaminated sediment mass was removed from the St. Lawrence River at the GM site, the clean up goal of 1 ppm PCBs was not met in all areas despite re-dredging efforts. A hot spot remaining in an area where the highest pre-dredging concentrations of PCBs were found (> 500 ppm), was isolated with a multi-layer engineered cap. The inability to reach the clean up goal in this area was attributed to the presence of a hard till layer underneath a thin layer of residual sediments.

Malcolm Pirnie/TAMS-Earth Tech 31 Peer Review Draft � October 2003
Engineering Performance Standards Appendix: Case Studies of Environmental Dredging Projects
Alcoa Site on the Grasse River (Hot Spot Removal), New York This NTCRA project, performed on only a portion of the site, involved the removal of approximately 3,000 cy of sediment and boulders that were contaminated with PCBs as a result of the operation of an ALCOA facility. The cost of the project was approximately $1,670 per cubic yard. Sediments were removed by means of an auger dredge. The presence of boulders significantly interfered with and reduced the efficiency of removal operations. A backhoe was used to remove boulders, and some sediment was removed by means of a diver-assisted vacuum system. Resuspension controls included silt curtains, a sheet pile wall, and oil booms. Dewatered sediment was treated with lime and disposed in an on-site landfill. The NTCRA successfully removed 27% of the contaminant inventory in the river while operating in a limited area, even though the river conditions encountered at this location included the presence of boulders, rock outcrops, and a stepped river bottom. A target residuals concentration was not specified as a project goal, but the average concentration in post-dredging samples was substantially reduced from the pre-dredging conditions. The length-weighted average concentration (LWA) of the pre-dredging cores gives a measure of the concentration removed by dredging. The depth of the pre-dredging cores varied from 12 inches to 36 inches. The average of the LWA values was 801 mg/kg PCBs with concentrations in individual samples ranging from 12 mg/kg to 11,000 mg/kg. Following dredging, the concentration in the residual layer was 80 mg/kg PCBs on average, with sample concentrations ranging from 11 mg/kg to 260 mg/kg. On average, the contaminant concentration in the targeted sediment was reduced by 90%. Alternatives for more extensive remediation of the Grasse River are under consideration. The Principal Responsible Party (PRP) has expressed a preference for a remedy that involves capping by particle broadcasting instead of dredging. Due to the fact that this project only covered a limited dredge area of 1 acre and because discharge from an outfall was not eliminated until after the NTCRA was complete (possibly leading to re-contamination), this project is not discussed in further detail herein. Cumberland Bay Wilcox Dock Sludge Bed Site, Operable Unit 1 (OU1), Town of Plattsburgh, Clinton County, New York Site Location and Description The Cumberland Bay Sludge Bed � Wilcox Dock site (Cumberland Bay Site or the site) is located in the northwest corner of Cumberland Bay in Lake Champlain, east of the City of Plattsburgh, Clinton County, New York. The site is bordered to the south by the breakwater and to the west by the shoreline of Cumberland Bay.

Malcolm Pirnie/TAMS-Earth Tech 32 Peer Review Draft � October 2003
Engineering Performance Standards Appendix: Case Studies of Environmental Dredging Projects
Site Characteristics Cumberland Bay is a small, somewhat rectangular part of the west side of Lake Champlain. Depths in the Bay can exceed 50 ft, but average water depths in the vicinity of the site do not exceed 20 ft and are generally less than 10 ft. The Cumberland Bay Site consists of an underwater sludge bed of wood pulp, wood chip debris, macerated paper, paper pulp, and other industrial wastes deposited from a variety of local industries. The sludge bed is underlain by sandy lake bottom. Aroclor 1242 is the predominant PCB compound at the site, and the main source of PCB contamination was pulping recycled waste paper, including carbonless copy paper containing PCBs. The sludge consisted of low-density silt, clay, and wood fiber (wood chips and paper pulp), and contained PCBs at concentrations up to 13,000 ppm (Mudflats/Breakwater areas: 33 ppm, Dock area: 431 ppm). Sludge thickness ranged from 0.25 to 16 ft, with the maximum thickness present in the Dock Sludge area. Remedial Action This 57-acre site consisted of underwater areas that contained PCB-contaminated sludge from paper mill operations. Based on pre- and post-dredging hydrographic surveys, 195,000 cy sludge and sediments were removed. Two dredges were used at the site for sludge bed removal. Both units were horizontal auger type dredges manufactured by ESG Manufacturing (Model Nos. MDS-177-10 and MDS-210-12). Each dredge was equipped with an 8-foot wide, 8-inch diameter auger head attachment, with dredge-mounted pump for conveying the dredge slurry to the solids separation area. The dredge employed an ultrasonic flow meter, Differential Global Positioning System (DGPS) control, and WINOPS© computerized positioning system to allow the dredge operator to control position and progress rate. One dredge was equipped with a 12-inch diameter high-density polyethylene (HDPE) dredge slurry delivery line, and the other with a 10-inch diameter HDPE dredge slurry delivery line. The length of the dredge slurry delivery lines varied depending on the work area being dredged. The lines were constructed using capped 10-inch polyvinyl chloride (PVC) pipe �pontoons� to add buoyancy to the lines. Flexible couplings were installed incrementally along the slurry delivery line to increase flexibility and allow positioning behind the mobile dredge. Each pass removed a 2-foot thick layer of sludge. Upon completion of dredging operations on a line, the dredge was relocated to the subsequent line, a distance of six feet. Since the dredges were equipped with 8-foot wide cutter heads, this represented a 2-foot overlap and thereby the formation of windrows was minimized. Removal of dry sludge or sludge in shallow water was conducted by excavation.

Malcolm Pirnie/TAMS-Earth Tech 33 Peer Review Draft � October 2003
Engineering Performance Standards Appendix: Case Studies of Environmental Dredging Projects
The specified target for the project was the complete removal of the sludge bed down to the underlying clean sand layer. Dredging continued based on visual observations until all fine sludge was removed. Following the removal of the sludge bed, samples were collected, and dredging continued until the cleanup goal of an average of 10 ppm of PCBs was achieved. A "hard crust layer" originally interpreted as natural lake bottom was found to be compacted sand, silt, and paper pulp. This layer (10-16 ft below water surface) could not be penetrated by dredging equipment during the first approach, but was later re-dredged by divers and the underlying sludge (up to 4 ft thick) was removed. An outline of the individual dredging areas is provided below. Mudflats Sludge Area: Sludge was removed from a 30.6-acre area shown on Figure 4. The Mudflats Sludge area was characterized as having a broad, relatively thin continuous layer (bed) of sludge ranging from 0.25 feet to 3 feet thick, and averaging 1.5 ft thick. The estimated in-place volume of sludge in this area was approximately 55,800 cy. The volume of material removed from this area was 49,927 cy. Dock Sludge Area: The Dock Sludge area occupied approximately 8.8 acres (Figure 4.1) and was characterized by a relatively thick, continuous layer (bed) of sludge ranging from 0.25 feet to approximately 16 ft thick, and averaging 4.3 ft thick. Lake waves and currents were dissipated in the Dock Sludge area by the presence of the temporary sheet pile wall and Wilcox Dock located on the south and east sides. The estimated in-place volume of sludge in the Dock Sludge area was approximately 50,900 cy. The volume of sludge removed from this area was 84,078 cy. Breakwater Sludge Area: The approximately 11.7 acre Breakwater Sludge area was characterized by a relatively thin sludge layer ranging from 0.25 ft to 4 ft thick, and averaging 1.5 ft thick. The estimated in-place volume of sludge in this area was approximately 23,500 cy. The volume of sludge removed from this area was 50,995 cy. Shoreline Excavation Area: The Shoreline Excavation Area was composed of sludge that was either not submerged or was in water too shallow to be hydraulically dredged. Due to the low water levels present in 1999, the shoreline excavation area, originally estimated to be 7 acres in size and to contain 15,000 cy of sludge, was in actuality approximately 9 acres in size and had 37,453 cy of sludge removed. Containment System Temporary sheet piling (1,000 linear ft, 24,000 ft2) and perimeter silt curtains (2,200 linear ft, 4-ft deep around the sheet piling) were installed to isolate the sludge bed during dredging operations. The previously planned floating boom was replaced by a silt curtain as per the US Army Corp of Engineers (USACE) permit requirement.

Malcolm Pirnie/TAMS-Earth Tech 34 Peer Review Draft � October 2003
Engineering Performance Standards Appendix: Case Studies of Environmental Dredging Projects
Resuspension Monitoring Water quality was monitored in an operational mode within each work zone, a compliance-monitoring mode around the perimeter of each work zone, and a documentation mode around the perimeter of the Site. As specified below, no good correlation existed between TSS and turbidity. Turbidity was used only as an indicator and not in association with an action level. Compliance monitoring was performed by periodic sampling and on-site testing for TSS. Operational Monitoring Work Zone monitoring was performed in the vicinity of the active dredging operation. The first aspect of this monitoring consisted of visual inspection for evidence of a suspended solids plume and use of mobile real-time OBS-3 turbidity sensors. An OBS meter was mounted to each dredge head and another OBS meter was affixed to a float that trailed behind the dredge. Sensor output was displayed real-time on the dredge's onboard computer monitor and recorded electronically. This trailing sensor was used as an operational monitor to indicate sludge resuspension immediately behind the dredge and also to complement the turbidity sensor mounted on the dredge head. The trailing sensor was initially placed approximately 25 feet behind each active dredge. The distance between the dredge and sensor was modified to 50 feet based on the type of material being dredged and the turbidity generated. Periodically, a surface water samples were collected and analyzed for PCBs by USEPA Method 8082 to assess the PCB concentrations in the water column. PCB analysis was performed at Waste Stream Technology. If the TSS results at the dredge-trailing sensor exceeded 25 mg/l above background, dredging operations were modified or suspended. Although active dredge areas sometimes exhibited high turbidity readings, the results of daily TSS and periodic PCB analyses did not indicate the continued presence of elevated PCB concentrations. The design originally called for the real-time turbidity data to be telemetered to the Contractor�s trailer, with alarms to indicate exceedences of action levels. Since no reliable correlation could be made between turbidity and TSS at the Cumberland Site, no turbidity-based action level could be established. Therefore, the data was monitored and electronically recorded on the dredge but was not telemetered to the Site trailers, as no one was regularly monitoring it at that location.

Malcolm Pirnie/TAMS-Earth Tech 35 Peer Review Draft � October 2003
Engineering Performance Standards Appendix: Case Studies of Environmental Dredging Projects
Compliance Monitoring Compliance monitoring was conducted at four OBS-3 sensor stations that changed with each active work zone. One sensor was deployed in a background location (near the breakwater) at a water depth approximating that in the work zone. The other three sensors were deployed outside the perimeter of the work zone silt curtain. An additional sensor was placed temporarily near Georgia-Pacific�s industrial water intake when dredging operations were underway in the Breakwater Area. Sensors were stationary and suspended at the mid-depth level of the water column. Data was telemetered to an onshore control station where it was recorded electronically. At the completion of work in a work zone, the sensors were moved and set up as appropriate for the following work zone. As with operational monitoring, the turbidity measured by the real-time OBS monitors was only used to alert the operators of a potential resuspension problem. No action level was associated with the turbidity monitoring. Daily turbidity and TSS samples were collected using a Kemmer sampler at each of the four sensor stations at a mid-depth level and analyzed on-site (the TSS detection limit was 4 mg/l). During 24-hour operation, one sampling event was performed in the morning and one sampling event was performed in the evening. When a TSS concentration outside the turbidity barrier exceeded the background concentration by more than 4 mg/l, dredge operations were modified. Occasionally a surface water sample was collected for PCB analysis (USEPA Method 8082). Air temperature, wind velocity, and wind direction were measured and recorded during each monitoring event. Sludge resuspension was observed in association with dredging and occasionally an elevated TSS result was detected outside the work zones. TSS results greater than 4 mg/l above background, sometimes resulting from high winds and associated waves, were not sustained for more than a few days. The generally low levels of TSS outside the work zone can be attributed to the modification of dredging operations and the effectiveness of the silt curtains. In cases where dredging was being performed near an opening in the silt curtain (for exiting or entering, or weather/current related breaches) the Contractor was required to immediately cease dredging operations, secure the silt curtain, and close off the work zone prior to resumption of dredging operations. Documentation Monitoring Documentation monitoring was performed at six fixed turbidity monitoring (TM) buoys. Initially, one sample per day was collected using a Kemmer sampler from each location at a mid-depth level, and analyzed on-site for turbidity and TSS (with a TSS detection limit of 4 mg/l). An additional sample was collected for PCB analysis by USEPA Method 8082 (with a detection limit of 0.065 ppb), on a weekly basis. During 24-hour dredging operations, one sample was collected at the beginning of each 12-hour shift using the same sampling and analysis protocol.

Malcolm Pirnie/TAMS-Earth Tech 36 Peer Review Draft � October 2003
Engineering Performance Standards Appendix: Case Studies of Environmental Dredging Projects
In the event that a TSS concentration exceeded the background concentration by more than 4 mg/l, dredging operations were evaluated and modified as necessary, depending on the extent to which weather conditions were a factor. Water Intake Monitoring A Georgia-Pacific, large-volume water intake was located at the western most point of the Breakwater area. The Georgia-Pacific water intake was monitored prior to and during dredging to document the intake water quality prior to construction and to assure that Georgia-Pacific intake water was not contaminated during dredging. Two rows of permeable silt curtains were installed in front of the Georgia-Pacific water intake to protect the intake from suspended material. During the course of dredging in the Breakwater area, Georgia-Pacific was placed on city water to eliminate the potential that PCB-contaminated suspended material could be introduced into their process. It was more cost effective to provide the city water than to construct a temporary water intake in an alternate location. Correlation between TSS and Turbidity The specifications set forth a specific numeric limit for TSS in the nearby lake water during dredging. It was anticipated that sludge resuspension would be measured real-time by monitors installed both physically trailing behind the dredge and outside the active work area silt curtains. The specifications required that the Contractor develop a site-specific correlation between TSS and turbidity so that action levels could be defined for the more easily measured parameter, turbidity, which in turn could be correlated to TSS action levels. Pre-construction bench-top testing, reported in the 1998 Pre-Design Investigation Report, indicated that development of such a correlation would be plausible for monitoring and control purposes. Earth Tech and the Contractor collaborated to perform a number of tests using lake water in an effort to develop a correlation prior to start up of sediment removal activities. During the construction phase of the work, however, Earth Tech found that a reliable TSS-turbidity correlation could not be made because of unforeseen factors, possibly including algal bloom and light refraction that appeared to affect turbidity readings in addition to TSS. It is believed that these extraneous factors caused turbidity to vary in a way that could not be directly correlated to TSS. As a practical matter, the decision was made to collect daily lake water samples during dredging and analyze them directly in an on site laboratory for TSS. This process took about 2 hours to complete, and was therefore, not real-time. As a result, the �real-time� benefits of monitoring and control using this correlation method could not be realized. A lesson learned is that the feasibility of developing a correlation between TSS and turbidity must be evaluated in the field under conditions that simulate the dredging operations.

Malcolm Pirnie/TAMS-Earth Tech 37 Peer Review Draft � October 2003
Engineering Performance Standards Appendix: Case Studies of Environmental Dredging Projects
Evaluation of Dredging Using a pre-dredge analytical dataset that contained a limited number of data points, it was determined that the average PCB concentration in the Mudflats and Breakwater areas before dredging was 33 ppm while the average concentration in the Dock area was 431 ppm. Post-excavation sampling was performed after dredging in each of the active work zones. The sampling was performed in four phases in 1999 and 2000. After dredging, 115 confirmation cores were collected. Analysis was not performed for 73 of the 115 cores as a result of either the collection point being located onshore (5 cores) or the core materials being visually verified to contain only sand (68 cores). The remaining 42 cores yielded 51 samples that were analyzed for PCBs. The results ranged from 0.04 mg/kg to 18.0 mg/kg, and averaged 5.87 mg/kg. If sand cores were included, the average residual concentration could be as low as 2.5 mg/kg (assuming the PCB concentration in the sand cores is 0 mg/kg). In all it is estimated that 20,118 pounds of PCBs were removed from the sludge bed. Phase I sampling began after dredging activities were completed in November 1999 to determine the presence of remaining consolidated sludge. The results of the Phase I sampling proved not to be representative of the remaining sludge, as it was discovered that the sampling tool used did not retain all of the sludge present during retrieval. The sampling tool penetrated the sludge and retrieved only bottom sand having low or no PCB concentrations. A second phase of sampling was conducted at the end of November 1999 to determine residual PCB concentrations in the bottom of the bay. Phase II sampling consisted of sampling the entire bottom of the work area on a 50-foot grid. At the same time, core samples were collected to obtain information about the bottom sediment. Divers assisted to retrieve samples in locations where conventional sampling equipment was not effective. Compared to Phase I sampling, more areas were identified that still contained sludge. Also, it was identified that certain areas were missed during the 1999 dredging operation. The project team conducted the Phase III sampling program in Spring 2000, using a penetrating rod and a disc to determine the depth of any remaining soft material and a coring device to determine the amount of sludge remaining. The sampling crews found one to three feet of unconsolidated material and up to seven inches of consolidated sludge in parts of Areas 1A, 2A, 5, 6, and 7. The consolidated sludge was also found in depressions scattered along the bottom of the lake in Areas 2A and 2B. In May 2000, divers were used to more extensively identify and locate remaining sludge. The divers reported the presence of additional windrows of sludge remaining after the 1999 dredging operations in Areas 2A and 7. A limited portion of Area 5 was found to contain material with PCB concentrations up to 132 ppm. The final sampling event Phase IV, took place during the summer and fall of 2000. The purpose of the Phase IV sampling was to compare the final sediment total PCB concentrations with the data generated during the Remedial Investigation and design. The results of the Phase IV core

Malcolm Pirnie/TAMS-Earth Tech 38 Peer Review Draft � October 2003
Engineering Performance Standards Appendix: Case Studies of Environmental Dredging Projects
sampling and inspection by divers indicated that several areas still needed to be dredged. These areas were dredged by divers using hand-held hydraulic dredge lines. The hand-held dredging proved effective in these areas that had been identified as difficult to dredge using the hydraulic auger. The results of the Phase IV sampling showed an average PCB concentration across the sampling grid of 6-7 ppm, with only a few areas exceeding 10 ppm and none exceeding 18 ppm. In addition, a number of confirmation samples were collected from the bottom sands and evaluated in the field. Based on data from this and previous sampling events, the native sands beneath the sludge bed contained little or no PCB-contaminated material. Consequently, these sands were not dredged. Taking into account the concentration of PCBs in the sand, the average PCB concentration across the grid was 3 ppm. Although the Contractor was required to select and operate a dredge that would minimize re-suspension or underwater �spillage� at the dredge head, not all of the disturbed bottom material was captured and removed, even after multiple passes. A thin layer of the disturbed material up to approximately 1-foot thick was left behind, virtually floating near the bottom as a relatively homogeneous, fine-grained, low solids residuum, particularly during the early stages of the project. This material, which was called �fluff� by the field crews, was typically undetectable by samplers operated from the water surface. The fluid-like material was readily displaced when disturbed by sampling devices and the dredge head. Its nature and presence was discerned only by the divers who stated that it resembled naturally occurring, mobile, low solids content organic lake bottom silts. Although analysis of diver-collected samples indicated that the fluff did not contain significant concentrations of PCBs, its presence was initially a concern. The following were noted as lessons learned during the dredging operations at this site:
• The feasibility of developing a correlation between TSS and turbidity must be evaluated in the field under conditions that simulate the dredging operations.
• It is important to quickly evaluate the effectiveness of the contractor�s dredging method
and dredge speed soon after a dredging pass is completed in a given area, even if real-time turbidity (or TSS) monitoring is implemented.
• Due to the thickness of deposits and high organic content in the Dock Sludge area, gases
of decomposition caused chunks of sludge to break away and float to the surface. This material was captured using seine nets.
• Dredging with horizontal auger causes resuspension of fine sediments. The problem is
exacerbated if the auger is rotated too rapidly, or if the equipment is advanced too quickly. The capture efficiency at the controls may have been better if provisions on the rate of auger rotation and advance were included in the specifications.

Malcolm Pirnie/TAMS-Earth Tech 39 Peer Review Draft � October 2003
Engineering Performance Standards Appendix: Case Studies of Environmental Dredging Projects
• Occasional high turbidities were observed due to backflushing of dredge slurry when dredging operations were interrupted. This could be minimized as follows: �Instead of flushing the screen with dredge slurry residing in the dredge line, lift the cutter head off the bottom, and suck in enough clear water to displace the slurry in the piping and use it for screen backwash.�
New Bedford Harbor (Pre-Design Field Test), New Bedford, Massachusetts Site Location and Description The New Bedford Harbor Superfund Site (site) is located in Bedford, Massachusetts, about 55 miles south of Boston. The site is contaminated with PCBs, heavy metals, and other chemicals originating from industrial discharges. USEPA originally divided the site into three units, with the first unit comprised of those locations on the west side of the Acushnet River estuary where PCB levels in sediments exceeded 4,000 ppm (hot spots). With assistance from the USACE, a pilot project was conducted in 1989 to establish the preferred dredging technology for sediment removal (technologies examined were cutterhead, horizontal auger, and match box dredges). The cutterhead dredge, constrained by site-specific operating procedures to limit sediment resuspension, was selected as the preferred technology. Dredging of the hot spot sediments occurred from April 1994 through September 1995. On October 1, 1998, the USEPA announced its decision for the rest of the New Bedford site. The decision called for the dredging of approximately 500,000 cy of sediment. In New Bedford�s upper harbor, sediments with a PCB concentration above 10 ppm were to be removed, and in its lower harbor, sediments with a PCB concentration above 50 ppm were to be removed. In addition, certain popular though contaminated shoreline areas were to also undergo soil/sediment removal. In August 2000 a Pre-Design Field Test (PDFT) was performed at the site to determine site-specific dredge performance values for use in developing a full-scale remediation plan. Dredge performance values were previously estimated based on results obtained from the use of conventional and alternative hydraulic dredging systems at the site in a pilot study in 1989, and for the dredging of hot spots in 1995. Due to changes in dredging technology after these activities were completed, the PDFT was done to evaluate the effectiveness of the newer technologies. The site location, and the Dredge Test Area are shown on Figure 7 and Figure 10, respectively.

Malcolm Pirnie/TAMS-Earth Tech 40 Peer Review Draft � October 2003
Engineering Performance Standards Appendix: Case Studies of Environmental Dredging Projects
Site Characteristics The sediments at the site consisted of a black organic silt surface layer underlain by a native clean gray clay layer. A core sample from a location within 100 feet of the dredge area contained 19 % sand, 53 % silt and 28 % clay. In some sub-tidal areas near the test area, some organic (rooty matter) was encountered. Based on information obtained from the USACE site representative, pre-dredging depth-averaged sediment PCB concentrations were 857 mg/kg for 0-1 foot, 147 mg/kg for 1-2 feet, and 26 mg/kg for 2-3 feet (Simeone, 2001). Remedial Action Dredging during the PDFT was performed in the summer of 2000 over a 100 x 550 ft area in the New Bedford Upper Harbor. Based on pre-dredge surveys and daily progress survey results, the total volume of in situ material removed from the PDFT area was approximately 2,308 cy. Since this was a pilot study to evaluate dredge performance and to set dredging parameters, a cleanup goal was not specified for this project. The cleanup criteria for the full-scale remediation of Upper Harbor was set as 10 ppm, and that for the Lower Harbor as 50 ppm. Bean TEC Bonacavor hydraulic excavator, which is a hybrid of mechanical and hydraulic dredges, was used for the project. On this dredge, the horizontal profiling bucket was fitted to a hydraulic excavator equipped with an onboard digital geographic positioning control and monitoring system. The excavated sediments were re-slurried and pumped to shore side ponds or cells. Based on information obtained from the USACE site representative, pre-dredging depth-averaged sediment PCB concentrations were 857 mg/kg for 0-1 ft, 147 mg/kg for 1-2 ft, and 26 mg/kg for 2-3 ft (Simeone, 2001). Based on post-demonstration samples, the average PCB concentration was reduced to 29 mg/kg in the top 1-ft layer. The reduction was calculated to be 96.5 % using the 0-1 ft pre-dredging concentration and 91.5% using the average concentration of 0-3 ft. The project goal for residual contamination was substantially higher than 1 mg/kg. Containment System No information was found in the available document on the containment system used during the PDFT.

Malcolm Pirnie/TAMS-Earth Tech 41 Peer Review Draft � October 2003
Engineering Performance Standards Appendix: Case Studies of Environmental Dredging Projects
Resuspension Monitoring The water quality monitoring program conducted for the PDFT included the following components:
• Predictive modeling to aid in the design of the water quality monitoring field program and to assess the utility of modeling for the full-scale remediation effort.
• Field monitoring and sample collection • Laboratory analysis of water samples • Correlation assessment between field and lab data
A numerical hydrodynamic and sediment transport model was included in the predictive model, and was used to predict the expected suspended sediment concentration resulting from dredging activities under a variety of transport assumptions. The monitoring program was structured to document water column conditions during dredging operations. Water samples were analyzed for TSS and dissolved and particulate PCBs. An assessment of the correlation of the turbidity and TSS as well as TSS and PCB data was also performed. A plot of Lab TSS (mg/L) vs. Field Turbidity (NTU) based on data collected during PDFT showed the following general correlation: TSS = 1.378 x Turbidity � 4.35 (r2=0.556). A general positive correlation was observed between TSS and particulate PCBs. The water column turbidity measurement was performed using an optical backscatter sensor (OBS). Turbidity was monitored prior to dredging to characterize the baseline turbidity, and the targeted distance predicted by the model was used to set up the sampling location for TSS and PCB. For the monitoring performed on August 16, stations were set at 50 ft, 100 ft, and 500 ft downstream of the dredging, as well as a reference station 1,000 ft upstream. For the monitoring performed on August 17, an additional downstream station was added, and stations were set at 50 ft, 300 ft, 700 ft, and 1,000 ft, downstream of the dredging based on a review of the previous day�s data. The following action levels were set for monitoring:
• Since the harbor background and ambient concentrations in water column exceeded the Federal surface water quality criteria, no limit was set for monitoring for PCBs. The Maximum Cumulative Transport (MCT) at Monitoring Station 2 (MS2) (at the limit of mixing zone 300 feet from the dredge) was set as 400 kg PCBs for the entire dredging project.
• The action level for turbidity was defined as 50 NTU above background at MS2 (300 ft
from the dredge). When this limit was exceeded, a MS2 bioassay test was conducted to determine if acute or chronic toxicity was occurring (i.e., Sea urchin fertilization, Mysid

Malcolm Pirnie/TAMS-Earth Tech 42 Peer Review Draft � October 2003
Engineering Performance Standards Appendix: Case Studies of Environmental Dredging Projects
48-hr mortality, Red alga 48-hr viability), and turbidity was measured at 600 ft from dredge. If the turbidity exceeded 50 NTU dredging would stop, but this was infrequent during the PDFT, and since bioassay tests did not show any ecological impact, dredging was not halted.
Upon examination of the data, the following conclusions were drawn:
• The actual dredging process (removal of sediment with the hydraulic excavator) appeared to have a limited impact on the water column.
• Activities performed in support of the dredging (operation of support vessels) appeared to
have a much greater impact on water quality than the dredging.
• Normal fluctuation in water quality occurs in the Upper Harbor (related to changing environmental conditions) that appears similar or greater in scale than the overall impacts related to the dredging operation.
Evaluation of Dredging Pre-dredging sediment core samples were collected at each of 40 stations, with 30 stations located within the original 100 x 400 ft dredge footprint of the test area and 10 stations located in the provisional test area. Post-dredging cores were collected at stations where dredging was completed, and sampling methodology was similar to that of the pre-dredge effort. Post-dredge grab samples were collected at adjacent core locations and at other locations in the test area to assess surficial sediment conditions. See Figure 9 for Post-Dredging Sampling Locations. For the grab samples, the PCB concentrations represented a composite of the 0-2 cm sediment depth. PCB concentrations were significantly higher in the grab samples than in the upper 1-foot core composites at 16 of the 18 locations where both grabs and cores were analyzed. The results indicated that approximately 97% of the PCB mass was removed within the dredging boundaries. The average sediment PCB concentration (upper 1 ft) was reduced from 857 ppm to 29 ppm over the dredged area. This met the full-scale clean up criteria of 50 ppm for the Lower Harbor, and approached the criteria of 10 ppm for the Upper Harbor. It appears that the observed average post-dredging PCB concentration (29 ppm upper 1 ft composite) can be attributed to deposition of mobilized sediments (either from the original dredged area or from adjacent areas by sloughing, tidal action, etc.), rather than inefficient or inaccurate dredging. A thin surface veneer contained all the PCB mass after dredging. The tested dredging equipment demonstrated dredge performance values exceeding that which have been achieved at the New Harbor site during hot spot dredging and the 1989 pilot study (i.e., dredge production, accuracy, and slurry solids concentration). Both the sediment removal data and PCB data indicated that the dredging technology used was very efficient and had a high probability of achieving sediment cleanup goals established for Upper New Bedford Harbor. The

Malcolm Pirnie/TAMS-Earth Tech 43 Peer Review Draft � October 2003
Engineering Performance Standards Appendix: Case Studies of Environmental Dredging Projects
study also concluded that the question of residual contamination due to sloughing or migration could be addressed by modifying certain dredging procedures during the full-scale remediation (i.e., design values were recommended such as rate of dredging for various water depths, dredging accuracies, average solids concentration of dredge slurry). It was also concluded that recontamination due to sloughing during full-scale operation can be reduced by dredging from upslope to down-slope, and gaining a better understanding of the tidal regime. Additional conclusions on dredging operation were that return sweeps, tighter overlap of bucket grabs, and slower retrieval of final bucket grab would provide a cleaner bottom surface and reduce sloughing of adjacent areas. New Bedford Harbor (Hot Spots), New Bedford, Massachusetts Site Location and Description The New Bedford Harbor Superfund Site (site) is located in Bedford, Massachusetts, about 55 miles south of Boston. The site is contaminated with PCBs, heavy metals, and other chemicals originating from industrial discharges. The USEPA originally divided the site into three units, with the first unit comprised of those locations on the west side of the Acushnet River estuary where PCB levels in sediments exceeded 4,000 ppm (hot spots). With assistance from the USACE, a pilot project was performed in 1989 to establish the preferred dredging technology for sediment removal (technologies were cutter head, horizontal auger, and match box dredges). The cutter head dredge, constrained by site-specific operating procedures to limit sediment resuspension, was selected as the preferred technology. Site Characteristics The hot spot sediments were situated in a shallow tidal estuarine area where the Acushnet River merges with upper New Bedford Harbor. These sediments are generally a fine-sandy silt with some clay, and by definition contained greater than 4,000 ppm total PCBs. Cadmium, chromium, copper and lead were also present at high levels. Removal of the hot spot sediment was estimated to result in removal of approximately 45% of the total mass of PCBs in the harbor.

Malcolm Pirnie/TAMS-Earth Tech 44 Peer Review Draft � October 2003
Engineering Performance Standards Appendix: Case Studies of Environmental Dredging Projects
Remedial Action Dredging of the hot spot sediments occurred from April 1994 through September 1995. From an area of about five acres in size, approximately 14,000 cy of sediment were hydraulically dredged and pumped via floating pipeline to an interim shoreline CDF. One of the principal goals of the hot spot dredging program was the removal of a significant percentage of the PCB mass in the upper harbor without causing significant additional risks to human health or the environment. A second objective was to avoid additional remediation in the lower harbor as a result of the dredging program (i.e., contaminant transport to less contaminated areas). Containment System Initially the selected containment system consisted of silt curtains, but they were later abandoned due to their continuous disturbance of the bottom. Resuspension Monitoring Two strategic stations were selected to limit the contaminant transport from the upper harbor to the lower harbor and Buzzards Bay: the Coggeshall St. Bridge (NBH-2) and the Hurricane Barrier (NBH-4). See Figure 8 for monitoring station locations. Station NBH-2 was positioned at the transition between the upper and lower harbor and criteria were established there to limit the net transport of PCBs to the lower harbor, and to monitor for significant PCB bioaccumulation and sub-lethal biological effects in mussels. No chemical criteria for water column samples were established at HBH-4 because an earlier pilot study indicated that when concentrations were controlled at NBH-2, no corresponding signal was observed at NBH-4. Chemical concentrations in the water column were measured only in NBH-2. Mussel bioaccumulation was quantified at NBH-4, which provided an integrated assessment of water column PCB concentration over time. Other stations for water column monitoring included NBH-1, immediately to the south of the dredging operation, and NBH-7, in the vicinity of the CDF. Sampling frequency at the monitoring stations was one sample (composite of 13 grabs) at each flood tide and one sample (composite of 13 grabs) at each ebb tide (6-inch rise and fall). Total PCB concentrations were obtained by analyzing the dissolved and particulate concentrations separately, since the analysis of Total PCBs gave relatively lower concentrations. PCBs were analyzed as 18 individual congeners. The action level of PCB water column concentration of 1.3 mg/L was determined in the 1989 pilot study. Maximum cumulative transport (MCT) of PCBs during the entire operation at station NBH-2 (transition between upper-lower harbor) was also used for monitoring. MCT was based on the mass of PCBs transported out of the upper harbor, above background concentrations, that would increase the mean lower harbor sediment concentration by more than 1 ppm. The estimated mass of lower harbor sediments within the biologically active upper 4 cm was estimated as 240x106 Kg (dry weight); thus the MCT throughout the entire dredging operations

Malcolm Pirnie/TAMS-Earth Tech 45 Peer Review Draft � October 2003
Engineering Performance Standards Appendix: Case Studies of Environmental Dredging Projects
was not to exceed 240 Kg PCBs. This mass of PCBs became the MCT decision value criteria value for NBH-2. For the entire operation, the total mass of PCBs transported under the bridge was approximately 57 kg, representing only 24 % of the MCT. Therefore, criteria for net transport were not violated during the remediation. Toxicity tests included the sea urchin sperm cell test, 7-day mysid growth survival test, red alga survival test, and 28-day bioaccumulation test (using ribbed mussels that have a greater temperature tolerance than blue mussels) at two stations (NBH-2 and NBH-4). The results showed that during remediation, there were no acute toxicity effects that could be attributed to the dredging operation. PCB accumulation in mussels was not significantly greater than pre- or post-operation deployments. Evaluation of Dredging The monitoring results showed that the hot spot dredging operation had a minimal environmental effect on New Bedford Harbor and Buzzards Bay. Christina River Newport, Delaware Site Location and Description The Christina River is part of the E.I. Du Pont superfund site in Newport, DE. This river was dredged during the year 2000 due to elevated levels of metals in the sediment. Approximately 10,000 cy of sediment within a 1½ mile stretch of the river was removed. The Record of Decision (ROD) initially stated that hydraulic dredging was to be used since it was thought that lower levels of resuspension would result with hydraulic equipment when compared to mechanical dredging equipment. In addition, the ROD indicated that silt barriers must be used. However, because the river is located in the tidal zone, it was determined during the design phase that silt barriers would not be effective. Instead, sheet piling was designed for the dredge area and employed. Once sheet piling chosen as the containment system, there was a switch to mechanical dredging equipment so a large WWTP would not be needed at the landside facility. Site Characteristics Sediment consisted primarily of fine clay. Water depth was 6 feet on average and the removal depths were two feet on average, with the deepest cuts extending to four and six feet in select areas.

Malcolm Pirnie/TAMS-Earth Tech 46 Peer Review Draft � October 2003
Engineering Performance Standards Appendix: Case Studies of Environmental Dredging Projects
Remedial Action The target areas were divided into three main areas, and each was confined within sheet piling. It was indicated that the Christina River is 300 feet wide, and in some places the sheet piling blocked more than half the river (about 200 feet from shore) for reference. Thus, other river traffic was impacted during implementation of the remedy. An open bucket clamshell was used to perform the removal. It was stated that no additional precautions regarding resuspsension were needed because of the sheet pile containment. Sediment was loaded onto a scow and the sediment was allowed to drain in the scow. The scow was then tugged to the edge of the sheet piling, where sediment was then loaded into another scow located on the outside of the sheet piling. Sediment was then tugged downstream to a CDF or an on-site landfill. The dredging was slated for completion in nine months, but the work was completed ahead of schedule. Restoration The area was backfilled following dredging. A clam shell bucket was used, and the material was dropped from the bucket above the water. Backfilling was performed while the sheet piling was still in place. Lastly, no specific bank stabilization was conducted. Backfill was placed at all locations to return the river to its pre-dredge grades and wetlands were restored along the banks in two areas. Planting was done from the water since shore access was difficult. It was indicated that no specialty equipment was used to dredge or restore the two wetland areas. Resuspension Monitoring Turbidity monitoring was performed upstream and downstream of the sheet piling for each of the three areas during dredging, but no monitoring was done within the area. In addition, no post-dredge sampling was done to verify that metals were removed to acceptable state standards sediment levels. It was indicated that extensive sampling was done to classify the area prior to dredging so the exact vertical and horizontal limits were known. It was felt that as long as the depth of the cut was accurate, all contaminated material had been removed. Bayou Bonofoucia, Louisiana Site Location and Description This was the site of a creosote works that operated from 1892 to 1970. The principal contaminants of concern were PAHs, and the contaminated media were soils, sediments, and groundwater. Included within the final remedial strategy was the dredging of approximately 170,000 cy of contaminated sediment and treatment of that material by incineration. Information provided by USEPA suggests that dredging represented less than 20% of the total cost of remediation (see Table 1 for costs).

Malcolm Pirnie/TAMS-Earth Tech 47 Peer Review Draft � October 2003
Engineering Performance Standards Appendix: Case Studies of Environmental Dredging Projects
Of particular importance is the fact that the sediment removal work was accomplished using a specially configured bucket excavator mounted on a barge. Computer controlled dredging sensors allowed a 3-inch dredge tolerance. In addition, since the contaminated sediments were relatively fine grained, multiple containment barriers (turbidity curtains) were employed to reduce migration of the sediments. Grand Calumet River, Indiana Site Location and Description The Grand Calumet River system originates in eastern Gary, Indiana and flows approximately 13 miles through Gary, Indiana, East Chicago, and Hammond. Ultimately, the river drains into Lake Michigan via the Indiana Harbor and Ship canal. Contamination of this river system begins just south of Chicago and continues through the eastern branch of the Grand Calumet River, a small segment of the western branch of the river, and within the Indiana Harbor and Ship Canal. The banks of the Grand Calumet River contain multiple industries along the entire stretch of river. Literature reviewed stated that currently, approximately 90% of the river�s flow originates as municipal and industrial effluent, cooling and process water and from storm water overflows. Approximately five to ten million cy of contaminated sediment exists in the area of concern within the Grand Calumet River. Contaminants consist of PAHs, PCBs, heavy metals, and VOCs. Contaminated sediment exists up to depths as great as 20 ft. In addition, accumulated sediment with the harbor and restrictions on sediment removal has decreased the shipping capacity within the Grand Calumet River by 15%. Remedial dredging within the Grand Calumet river is being performed by US Steel (USS) since it has been determined that sediment contamination resulted from operations at the Gary Works facility, which occupies of a 4,000-acre site along the Grand Calumet River and southern shore of Lake Michigan. Specifically, wastewater discharge containing the contaminants of concern entered the river system from outfalls located at the Gary works facility. Dredging within the 5-mile river section aims to remove 750,000 cy of sediments contaminated with PCB,VOCs, PAHs, and metals. Dredged sediment will be placed into a corrective action management unit (CAMU) for dewatering and disposal. The CAMU is located on the USS property, and is constructed in accordance with RCRA Subtitle C requirements (hazardous waste landfill). Earth Tech is the contractor hired to construct the CAMU and coordinate project implementation. All water generated from dredging will be treated in a waste treatment plant and ultimately discharged back to the river. Site Characteristics The 5-mile stretch of contaminated sediment has been divided into 36 transects. It was further indicated that transects 1 through 11 are located in front of the USS facility, where the highest concentrations of PCBs and benzene have been detected. Approximately 164,000 cy of sediments will be removed from Transects 1 through 11, which contain the greatest mass of

Malcolm Pirnie/TAMS-Earth Tech 48 Peer Review Draft � October 2003
Engineering Performance Standards Appendix: Case Studies of Environmental Dredging Projects
RCRA, and TSCA regulated material. In addition, Transect 17, Horizon 1, contains an additional 11,000 cy of TSCA-regulated sediment. Approximately 95% of the organic contamination exists within this stretch of the river. Remedial Action As a result of a 1993 sediment characterization study performed within the Grand Calumet River by USS, followed by submission of a scope of work which described work items to be performed to clean up the contamination, the USEPA issued a consent decree in 1998 in conjunction with a RCRA Corrective Action Order which stated that contaminated sediment must be removed from the Grand Calumet River. The RCRA Order also requires USS to conduct a facility-wide corrective action program to investigate soil, sediments, surface water, and groundwater at Gary Works and take appropriate action for releases, which may pose a risk to people and other ecological receptors. Dredging began in December 2002. Dredging cut lines were established to a maximum depth of 16 ft. JF Brennan is the dredging contractor hired to perform this work. It is expected that dredging will be done with an 8-inch and a 12-inch hydraulic swinging ladder dredges. The draft on the 8-inch dredge is approximately 2 to 2.5 ft and has a working reach of 45 ft at an angle of 30-degrees. In addition, an amphibious excavator will also be used to assist in the removal of sediment in shallow river sections, in and around structures, and within areas not accessible by the large swinging ladder dredge. Dredged sediment/slurry will be transported via double lined HDPE 12-inch pipelines and accompanying booster pumps to the CAMU. Booster pumps will be enclosed with engineered mufflers to reduce noise levels and impacts on the surrounding community. It was noted that expected noise levels from the dredging operation are in the range of 45-55 dBA. Dredging pipelines will be positioned in the water along the banks of the River. It is expected that the dredging operation will be performed 24 hours per day, six to seven days per week with an expected completion date of December 2003. The on-site CAMU, covering 36 acres, is capable of accepting approximately 12,000 cy of sediment per day. The PCB-contaminated sediment (approximately 125,000 cy) will be dewatered within a discrete disposal cell and the wastewater generated will be pumped to the water treatment plant and subsequently treated. Dredge slurry that does not contain PCB-contaminated sediment will be directed into a separate cell within the CAMU and subsequently dewatered. Two separate water treatment plants were designed for the treatment of site-generated wastewater from the dredging operation. The first system, a 160-gpm plant, was designed to treat PCB-contaminated wastewater through the use of a clarifier followed by activated carbon. Following confirmation of PCB removal from the wastewater, it will be conveyed to terminal lagoons and ultimately discharged to the river in accordance with a project NPDES permit. The second treatment plant, a 5,000 gpm plant, was designed to handle wastewater with metals contamination. This system was designed with a chemically assisted clarifier. It was noted that treatability studies were performed for both waste streams to determine proper treatment and contaminant removal. It should be noted that sampling was conducted within 36 transects to

Malcolm Pirnie/TAMS-Earth Tech 49 Peer Review Draft � October 2003
Engineering Performance Standards Appendix: Case Studies of Environmental Dredging Projects
determine the extent and type of contamination (PCBs, VOCs, SVOCs and metals) to allow for the dredge slurry to be directed into the correct CAMU unit/cell and treatment plant. Dredging of the most contaminated area, within transects 1 through 11, has been divided into three isolation cells (A, B, and C). Dredging in these three cells constitutes approximately 1.5 miles and will be contained within cofferdams. Within each cell, oil booms and an oil control fence will be employed to protect water quality. The River will be bypassed around the isolation cell being dredged. The remainder of the river to be dredged, approximately 3.5 miles contained within transects 12 through 36, will be dredged in open water without isolation cells. For open water dredging, two three-element water quality control systems will be used. Each system consists of a floating trash boom, a floating oil fence, and a silt curtain. Dredging will be completed to depths consistent with non-native material plus a 6-inch over-cut to ensure complete removal of contaminants. Dredging is expected to be performed up to and including the banks of the Grand Calumet River. To minimize impacts associated with dredging along the shoreline, USS has modified the dredge plan so that dredging of river banks will be conducted just below the water level to six-inches above the water level following which native seed will be hydro-seeded onto these steeper slope areas to aid in re-vegetation. A few select areas include dredging of severely steep slopes. For these areas, studies concluded that bank stabilization must be completed prior to dredging. A cost analysis performed on bank stabilization indicated that the cost of bank stabilization in such areas is more costly than the actual dredging operation. An interesting facet associated with this issue is that a model was developed which determines a factor of safety for the slope along the river. The output of this model helps in the identification of areas where the bank slopes are too steep and will require stabilization prior to dredging. Stabilization measures in the form of sheet-pile installation and partial bank grading will be completed prior to dredging. Residual Verification Activities The performance standards for this project are removal of all non-native sediment (plus about 6 inches of overdredging) and removal of �hot spot� areas containing PCBs greater than 50 ppm. Achievement of project objectives will be demonstrated by comparing pre- and post-dredging surveys and analytical sampling for PCBs at specific locations in the river. Pre-dredge surveys were conducted at 100 feet intervals along the river length. Elevation measurements of the top and bottom of the non-native sediments were obtained at each cross section at 10 ft intervals across the river. Post-dredge surveys will be performed in a similar manner. PCB confirmation sampling will be completed in transects 1 through11, and transects 20, 32, and 34. In isolation cell A, four linear transects are established at 400 ft intervals with three equally spaced sampling points along each linear transect. In isolation cell B, transects are spaced every 500 ft and in cell C, every 600 ft. If it is determined that sediment containing greater than 50 ppm PCBs still exists, dredging will be re-conducted at the exceedence locations and the area re-sampled until concentrations are less than 50 ppm. It was stated that post-dredge monitoring will be conducted

Malcolm Pirnie/TAMS-Earth Tech 50 Peer Review Draft � October 2003
Engineering Performance Standards Appendix: Case Studies of Environmental Dredging Projects
to document the increase in the health of river as a result of dredging. Specific details were not provided. Restoration Approximately 14 acres of wetlands will be impacted by the dredging work, and USS will mitigate approximately 32 acres of dune and swale to compensate for this impact. In addition, the compensatory areas will transferred in ownership to the National Park Service. In the long run, USS expects vegetation to return to the impacted wetland areas following completion of dredging activities. It is not expected that backfill will be placed over the dredged area upon the completion of the dredging work. Air Monitoring An air quality monitoring plan for air emissions and odors was prepared and approved to support and respond to public concern regarding air quality during dredging. USS expects that there is minimal potential for air emissions and odors to be generated as a result of dredging because the dredged sediment will be contained in within pipes and not exposed to air during dredging and conveyance to the CAMU. Risk based Notification and Action levels were developed for 22 chemicals (Benzene, Toluene, Xylene, Ethylbenzene, PAHs, and PCBs) with guidance from the USEPA. It was further stated that the Air Monitoring and Operation Plan is based on a study of air emissions calculations, sediment characterizations, and a field test that simulated dredging conditions and in-river sediment transport. This plan was developed for two emission sources: one within the river at the dredge site and a second at the CAMU. It was concluded that emissions would not be present during sediment transport since transport is planned to occur through closed pipelines. USS utilized conservative inputs into the analyses to provide the highest level of protection to human health and the environment. More specifically, USS assumed the highest projected exposure would occur over 24 hours. It was also noted that exposure levels are typically greatest during the summer months when, the heat causes emissions to be located closer to the surface. The analysis was performed for three types of receptors: residents, off-site industrial workers, and on-site project workers. For each of these situations, the model was applied assuming maximum exposure limits for a child with conservative estimates of frequency and exposure (24 hours per day, 365 days/year for two years). Results of this analysis indicated that there would be no unacceptable risk from project-generated emissions. According to the monitoring plan, three stations will be situated around the CAMU, and one mobile station that will be re-positioned in the river as dredging progresses. Air samples will be collected continuously over a 24-hour period at each of these stations, along with meteorological data to determine daily dispersion patterns of emissions. Grab samples will also be collected at the residential area near the CAMU. Sampling is planned for all five stages of the project: (1) baseline sampling prior to dredging; (2) at the initial stage of the project; (3) during dredging

Malcolm Pirnie/TAMS-Earth Tech 51 Peer Review Draft � October 2003
Engineering Performance Standards Appendix: Case Studies of Environmental Dredging Projects
within each containment cell (A, B, C) within transects 1 through 11; (4) during dredging in transects 12 through 36; and (5) a final round of sampling at the close of the project. Sampling frequency varies with each stage, with a greater frequency of monitoring events at initial stages of the project. Air constituent standards were set based on notification levels (most conservative risk levels) and action levels were set based on the upper bound of risk-based concentrations of (five times the notification levels). In the event of a notification level exceedence, USS is required to contact USEPA. In the event of an action level exceedence, USS is required to notify USEPA, investigate the cause of the exceedence, and propose a remedy/contingency action to be put into effect. In addition to emissions from dredging, the public questioned potential emissions from the diesel-driven booster pumps. It was stated by USS that emissions from six to eight booster pumps would be minimal since numerous diesel trucks already operate at the USS Gary Work facility, the pumps, in comparison, are much smaller than the trucks, and currently no air quality issue exists with the diesel truck operation. Another component of the air monitoring plan includes the assessment and monitoring of project-generated odors that may result from dredging and/or landside activities at the CAMU. This assessment was based on the dispersion model developed for site emissions and was conducted by collecting samples of odor emissions from field tests. This assessment concluded that odors would not be a problem for residents near the CAMU nor at the location of active dredging. To date, odors do not appear to be a problem at the dredge, however odors have been sporadically noted from the CAMU. It was further stated that contact numbers would be provided to residents for use in the event that a nuisance odor is detected. Air monitoring results have been closely monitored since dredging began in December 2002. The results show that average concentrations of all constituents at the CAMU are below established action levels. Average concentrations of benzene and naphthalene at the CAMU do exceed the notification level. From mid-May to mid-July, 2003, monitoring results showed several exceedences of the action level for benzene and naphthalene. In response, the monitoring frequency was increased and USS completed several measures to address the exceedences. These measures included constructing a covered device around the sediment discharge at the CAMU to contain any floating oils and adding powdered activated carbon to the CAMU. It is anticipated that maintenance doses of activated carbon will continue to be added to the CAMU during dredging of transects 1 through 11. Resuspension Monitoring The Section 401 Water Quality Certification Work Plan was reviewed for details regarding water quality background studies conducted prior to dredging, water quality action levels, and the water quality contingency plan in the event that monitoring is indicative of an adverse impact to the Grand Calumet River during dredging operations.
Malcolm Pirnie/TAMS-Earth Tech 52 Peer Review Draft � October 2003
Engineering Performance Standards Appendix: Case Studies of Environmental Dredging Projects
It was indicated that the Indiana Department of Environmental Management (IDEM) stated that water quality samples for chemical and biological analyses could be collected prior to the initiation of dredging to provide background water quality data, to be used as benchmarks for comparing analytical results collected during dredging operations. A minimum of 20 samples was required if background sampling was to be conducted. However USS proposed an additional water quality station to be utilized as a verification/confirmation sampling station during dredging. In the event that water quality sampling indicates an exceedence of the water quality criteria, this station would be used to collect an additional sample to determine if the exceedence is a result of the dredging operation. Hence, this station would be situated upstream of dredging. Three water quality monitoring locations are defined as the primary monitoring sites. The first location, Site A, was located mid-channel of the Grand Calumet River at Transect 4 and was re-located to Transect 2 as dredging progressed from cell A to cell B (so that it would continue to monitor water quality upstream of the dredging operation). The second station, Site B, is located mid-channel and is situated approximately 200 yards downstream of the open water dredge. Site B will be re-located with the dredge as dredging progresses through transects 12 through 36. The third station, Site C, is the downstream sample site and is located mid-channel and downstream of Transect 36 (downstream of the limit of dredging). A fourth sample location, Site D, also known as the verification sample site, will be situated 200 yards upstream of the open water dredge in Transects 12 to 36 and will be used to verify/confirm water quality exceedences and determine if the exceedence is a result of dredging or originates from a different point source. This station was proposed in lieu of background sampling prior to dredging. All water samples are equal volume composites created from a total of three samples per location. These three samples per location are taken from the water surface, at 50 % of the water depth, and at 80 % of the water depth. Three types of water quality programs were set up. These programs were identified as Level 1 Monitoring, Level 2 Monitoring, and Level 3 Monitoring. Level 1 Monitoring consisted of daily measurement of flow rates, dissolved oxygen (DO), TOC (total organic carbon), total ammonia, specific conductance, pH, sulfides, temperature, and turbidity. A multi-parameter monitoring system equipped with an automatic data logger is used to measure DO, pH, temperature, turbidity, and specific conductance. Data for these parameters will be collected four times per day and reported to the IDEM and USEPA for each 24-hour period. Level 2 Monitoring consists of integrated biological and chemical monitoring using Microtox to determine both chronic and acute toxicity to biological organisms. Microtox is a toxicity measurement technique that involves the measurement of the amount of light given off by a luminescent test organism. Toxicity is defined as the statistical difference between Site A and Site C sampling results for the mean EC50 (DEFINE), based on a 95 % confidence interval of the respective mean. Level 2 Monitoring was initiated two weeks prior to dredging activities to allow for calibration and to establish a statistical variability.

Malcolm Pirnie/TAMS-Earth Tech 53 Peer Review Draft � October 2003
Engineering Performance Standards Appendix: Case Studies of Environmental Dredging Projects
Composite samples will be collected once every other dredging day from Sites A, B, and C and analyzed for acute toxicity using standard test D5660-95 (test method for assessing the microbial detoxification of chemically contaminated water and soil using a toxicity test with a luminescent marine bacterium) immediately following sample collection. If acute toxicity is determined in these samples, then confirmatory biological sampling for acute toxicity will be done. The confirmatory biological sampling consists of the collection of additional samples from Sites A, B, C, and D. Confirmatory samples from these locations must be collected within 12 hours of the time that toxicity results were determined from the first round of samples. If toxicity is determined from the confirmation samples (second round of samples collected), then water samples from Sites A, B, and C, collected at the same time the confirmation biological sample was collected, must be analyzed for total ammonia, pH, sulfides, temperature, free cyanide, hardness, oil and grease, TSS, dissolved copper, and dissolved zinc. If results from the chemical monitoring exceed set criteria at all sites or do not exceed at all three sites, it is to be concluded that dredging is not causing the elevated concentrations and biological sampling from Level 2 will resume its normal frequency (once every other day). If, however, chemical analytical results from the water samples indicate an exceedence at Sites B and C but not at Site A (exceedences downstream of dredge but not upstream), the water sample collected at Site D, the verification location, will be analyzed for the above mentioned chemical parameters. If the chemical parameters are also exceeded at Site D, it will be concluded that dredging is not the source and normal frequency sampling (once every other day) will resume. However, if the chemical parameters are not exceeded at Site D, it will be assumed that the exceedences at Sites B and C are resulting from dredging and enhanced monitoring will be implemented. Enhanced monitoring will consist of additional sample collection at a frequency of once per week at Sites A, B, and C for the parameters of concern. When the measured concentration of the parameter of concern is less than the criteria/standard for two consecutive samples, the enhanced monitoring will be discontinued and normal frequency sampling (once every dredging day) will resume. A second aspect of the Level 2 Monitoring Program consists of chronic toxicity monitoring. Samples for chronic toxicity will be collected twice per month at Sites A, B, and C and immediately analyzed according to the Microtox Chronic toxicity testing protocol. If toxicity is not determined, sampling and analyses will continue at a frequency of twice per month. In the event that chronic toxicity is determined, confirmatory biological sampling will be conducted at Sites A, B, and C, and if these samples indicate acute toxicity, then chemical analyses will be conducted on water samples collected at the time the acute toxicity sample was collected and analyzed. Parameters are the same as those listed above for chronic toxicity chemical monitoring. If results of the chemical monitoring indicate no exceedences at Sites A, B, and C or if exceedences occur at all three of these sites, then it will be concluded that dredging is not the source and normal monitoring consisting of sampling twice per month will resume. If exceedences are detected at Sites B and C but not Site A, then the water sample collected from Site D will be analyzed and if exceedences are found with this sample, it will be concluded then dredging is not the source and normal monitoring will resume (sample collection twice per month). However, if no exceedences are found at Site D, dredging will be assumed to be the

Malcolm Pirnie/TAMS-Earth Tech 54 Peer Review Draft � October 2003
Engineering Performance Standards Appendix: Case Studies of Environmental Dredging Projects
source and enhanced monitoring (previously described) will be carried out at a frequency of one sample per week for chronic toxicity analysis. When results are below the criterion for two consecutive samples, enhanced monitoring will be discontinued. Level 3 Monitoring consists of the collection of composite water samples once per month from automatic samplers at Sites A and C and manually at Sites B and D for analysis of the following parameters: total ammonia, pH, sulfides, temperature, free cyanide, hardness, oils and grease, TSS, dissolved ammonia, dissolved copper, dissolved lead, total mercury, dissolved zinc, total acenaphthene, total 2,4-dimethylphenol, total fluoranthene, total fluorine, total naphthalene, and total PCBs. If results indicate no exceedences at Sites A, B, and C or exceedences at all three sites (A, B, and C) then it will be concluded that dredging is not the source and normal sampling will resume (once per month). If, however, results indicate exceedences at Sites B and C but not Site A, then the water sample collected at site D will be analyzed. If the sample from Site D indicates the parameters exceeded at Sites B and C are also exceeded at Site D, it will be assumed that the downstream exceedences at these sites are not a result of dredging and normal frequency sampling will resume. However, if no exceedences are found at Site D, it will be concluded that dredging is the source and enhanced monitoring, consisting of additional sample collection at Sites A, B, and C, will be implemented at a rate of three times per week. When results indicate that the parameters of concern are less than the criteria for two months of consecutive samples, enhanced monitoring will be discontinued and normal frequency monitoring will be initiated at a rate of once per month. In addition to increasing the sampling frequencies in response to exceedences determined to be due to dredging, IDEM and the USACOE will implement a response action. If it is thought that an immediate threat to human health or aquatic life exists, the required response action will be issued within 72 hours and the USS will be expected to place this action into effect as quickly as possible (with a maximum time to implementation of one week). If the USS does not meet this schedule, enhanced monitoring will be automatically implemented as described above based on the parameters exceeded and the level of monitoring under which the exceedence occurred. Possible response actions may consist of the following engineering contingencies:
• Decrease dredging operation.
• Install additional turbidity barriers or control mechanisms.
• Temporary suspension of dredging activities.
• Conduct additional monitoring.

Malcolm Pirnie/TAMS-Earth Tech 55 Peer Review Draft � October 2003
Engineering Performance Standards Appendix: Case Studies of Environmental Dredging Projects
Results and Conclusions Dredging began in December 2002 and is expected to end by December 2003. All project data and dredging progress will be posted on the USS website under the Gary Works facility web page and the subdirectory �RCRA Correction Action.� Project information is supplied to the community through bi-monthly public meetings and fact sheets that are mailed to about 2,000 people. Outboard Marine, Waukegan, Illinois Site Location and Description This site is located on the west shore of Lake Michigan. Historically, a marine products manufacturer discharged PCB-laden hydraulic fluids into the harbor area. An estimated 700,000 pounds of PCBs were released on-site and an additional 300,000 pounds into Waukegan Harbor. Navigational dredging within the Harbor had been severely hampered by the presence of highly contaminated sediments. The most contaminated sediment existed within ship slip No. 3 at the Outboard Marine facility. USEPA�s 1989 ROD called for the isolation of Slip No. 3 from the harbor area and subsequent removal and treatment of sediments with PCB concentrations in excess of 500 ppm. The slip was then to be converted into an isolated containment structure where the treated sediment and less-contaminated harbor sediments located outside of this slip would be placed following removal. Ultimately, the slip would be capped. Remedial Action Approximately 23,000 cy of sediments were removed from the isolated slip and processed by thermal desorption. In addition, approximately 27,000 cy of contaminated sediment were removed from other areas in the harbor by means of a hydraulic cutter head dredge and were placed into Slip No. 3, which was designed to act as a containment cell. Dredging was conducted during 1991 and 1992. A cut-off wall (i.e., a physical structure) was placed at Slip No. 3 to isolate it from the harbor area. Within the harbor area, bottom-anchored silt curtains were installed to control resuspension, however the silt curtains required repair on multiple occasions due to high winds and currents. Literature reviewed also noted that following dredging activities within the harbor, a coagulant was added to aid in the settling of any resuspended sediment. It was indicated that this polymer was added via the dredge discharge line to the harbor area. Sediments containing PCB concentrations in excess of 500 ppm were removed from Slip No. 3 and the area was then capped with clean sand. Sediments removed from the slip were thermally desorbed and placed back into the slip above the sand cap. In addition, sediment removed from the harbor was also placed into this isolated slip. It was noted that harbor sediments were not

Malcolm Pirnie/TAMS-Earth Tech 56 Peer Review Draft � October 2003
Engineering Performance Standards Appendix: Case Studies of Environmental Dredging Projects
thermally desorbed prior to placement in the slip. It was stated that all sediment placed into Slip No. 3 required three years to settle. The USEPA�s remedial action and target cleanup goal for the harbor area was removal of contaminated sediment, treatment via thermal desorption of all contaminated sediments to a concentration of 50 ppm PCBs, and containment/final disposal of all excavated sediment in Slip No. 3. The target clean up goal of 50 ppm PCB was derived from a site-specific modeling analysis which showed that below a 50 ppm residual sediment level, little additional PCB contamination would be discharged to Lake Michigan. The USEPA estimated that approximately 900 kg of PCBs remained in the harbor sediments following the cleanup. Since it is now thought these residual sediments are potentially being resuspended by navigational activity, an effort is underway to investigate and resolve this problem, if necessary. Residual Verification Activities The contract documents for the harbor dredging specified that removal would be completed to a stated post-dredge elevation or to a designated soil type. This approach was expected to achieve the less than 50 ppm target PCB concentration. Post-dredge confirmation samples collected by USEPA revealed PCB concentrations ranging between 3 ppm to 9 ppm PCBs. It was also reported that harbor bottom sediment samples collected in 1996 showed PCB levels less than the targeted level of 50 ppm. The samples also indicated the presence of heavy metals, which were not considered in the ROD. Resuspension Monitoring Turbidity was measured daily during dredging activities. Measurements were collected at depths of 10 feet and 20 feet from the water surface. All measurements were below the turbidity action limits. The turbidity action limit was not indicated in the documents reviewed. Results and Conclusions Additional dredging funded by the City of Waukegan and the USACE is planned for 2002. The goal is to remove PCB contamination and restore adequate navigation depths for commercial shipping within Waukegan Harbor. Waukegan Harbor, Illinois Site Location and Description This area of concern is located on the west shore of Lake Michigan. The harbor area is contaminated as a result of historic activities at the Outboard Marine site, which was discussed in the previous case study narrative. Remedial activities included the removal of 453,600 kg (1

Malcolm Pirnie/TAMS-Earth Tech 57 Peer Review Draft � October 2003
Engineering Performance Standards Appendix: Case Studies of Environmental Dredging Projects
million pounds or greater than 494 tons) of PCBs from the Outboard Marine site. Three other point sources of contamination at Waukegan Harbor consisted of land-side industries/facilities that underwent remediation at the same time as the Outboard Marine facility, but the cleanups are not yet complete. The ongoing remedial activities consist of removal of storage tanks containing paint solvents and flammable solids and excavation of asbestos contaminated soils over an area of 24 hectares. Remedial Action Since 1992 when dredging was completed, environmental sampling has been conducted in Waukegan harbor to monitor the decline in contaminants. This monitoring has shown a decline in PCB concentrations in fish tissue, specifically in carp a decline from 5.2 ppm in 1993 (57 samples) to 3.2 ppm in October 2000 (19 samples). Results/Conclusions The USACE resumed navigational dredging in the harbor area in 1998, which includes the removal of 40-50,000 cy of sand annually from the shipping channel. Samples collected from this material indicated that the dredged sand is suitable for beach replenishment projects. Thus, it has been concluded that dredging of the Outboard Marine site was successful in cleaning up the Waukegan Harbor area.
Ashtabula River, Ohio This area of concern consists of a 2-mile stretch of river extending to the Ashtabula harbor area and adjacent Lake Erie near shore. This area is contaminated with PCBs, heavy metals, and organic compounds. Studies have determined that there has been degradation in the fish population, fish and bird deformities and tumors have been detected, navigational dredging has been restricted, and fish consumption advisories have been issued. As a result, the Ashtabula River Foundation, in conjunction with the Ohio EPA, has been promoting plans to dredge the river. The web site is current for this site up to the year 2000. Additional information is being obtained from the USEPA project manager. Black River, Ohio Site Location and Description The Black River is located in north central Ohio. The east and west branches of the river join to form the main channel, which extends for 16 miles northward and ultimately discharges into Lake Erie. This river is part of the Great Lakes Area of Concern and is the only area of concern that encompasses an entire watershed. Along the banks of the main channel, USS/KOBE Steel operated a coking facility that accounted for the largest industrial discharge of wastewater (greater than 1 million gallons per day or 1 MGD) into the Black River until 1982. The USEPA

Malcolm Pirnie/TAMS-Earth Tech 58 Peer Review Draft � October 2003
Engineering Performance Standards Appendix: Case Studies of Environmental Dredging Projects
determined USS/KOBE Steel to be the main source of PAH and metal contamination within the Black River. Site Characteristics Sediments within the area of concern consisted of a fine material comprised of clays and silt with sand over an underlying layer of �hard bottom� or shale bedrock. It was determined that all sediment contamination existed within the top layer and that the hard shale material was uncontaminated. Remedial Action The final remedy selected for the site consisted of the removal of PAH- and metal-contaminated sediment from the Black River within the vicinity of the USS/KOBE steel facility. Dredging was conducted in 1989, and ultimately 45,000 cy of contaminated sediment were removed and placed in a CDF on the USS/KOBE Steel property. An average dredge cut of 6 feet was completed over the 1 mile contaminated area. It was noted that the river was approximately 500 feet wide, and that no other river traffic was present during dredging. Removal was conducted using a clamshell bucket (mechanical dredging of contaminated sediment). The clamshell bucket was customized with a lid constructed of a thick rubber mat to prevent leakage while the bucket was brought up through the water column. An oil boom was deployed in the vicinity of dredging to prevent the spread of oil in the event of an oil spill. No turbidity barriers were used to control resuspension during dredging. Dredging was conducted in open water at all locations. Literature reviewed for this site also stated that a contingency plan, in the event of a spill, was defined and environmental monitoring was conducted prior to, during, and following dredging; however, no specific details with regard to the contingency plan and environmental monitoring conducted have been obtained to date (October, 2003). The major difficulty encountered during implementation of the remedial action was the transportation of contaminated sediments to the shore-side processing facility. Alternative materials handling methods were attempted, including rolling containers off barges using a ramp leading to the shore, as well as unloading of barges using a shore-based bucket unloader. Ultimately, seven barges were welded together and large dump trucks were driven onto the barges and secured in place. The barges were then towed to the dredge site, where the dump trucks were direct loaded. Once all of the dump trucks were loaded, the barge was towed back to the land-side access area. Each truck was then driven off the barge, onto land, and unloaded into the on-site landfill. Dewatering of sediments prior to dumping was not conducted. The dredge spoils were directly placed into the on-site landfill, which was constructed with geomembrane liners and French drains to direct collected water to a pump station, where the water was then conveyed to the onsite water treatment process. It was reported that treated water was clearer than potable drinking water.

Malcolm Pirnie/TAMS-Earth Tech 59 Peer Review Draft � October 2003
Engineering Performance Standards Appendix: Case Studies of Environmental Dredging Projects
Residual Verification Activities Target clean up goals stated that sediment was to be removed at all locations to the �hard bottom� (shale bedrock). There was no specific quantitative residual goal set for this project; however, post-dredging sediment sampling was conducted to verify that elevated PAH concentrations were remediated during dredging activities. Data provided in the literature reviewed indicated that pre-dredge PAH concentrations ranged from 8.8 to 52.0 mg/kg and two years after dredging (1992), sediment PAH concentrations ranged from 1.6 to 3.7 mg/kg. Post-Dredge Monitoring Since removal of the contaminated sediment in 1989, the Black River has become part of the RAP/RAC group under the Great Lakes Area of Concern Projects. The Black River RAP has been assessing the health of the river since dredging was completed. In addition, the RAP identifies other pathways of river contamination such as combined sewer overflows and sanitary sewer line leakages. Activities performed by the Black River RAP consist of benthic and fish surveys, sediment sampling, watershed analyses, and water quality monitoring and overall beneficial use river assessments. Beginning in the fall of 1997, a one-year study of sediment, benthic organisms, and overlying water conditions was completed by WSU (Wright State University), Dr. Paul Bauman of the USGS, Ohio EPA, USEPA Great Lakes National Program Office, and the RAP group. Approximately 12 sampling locations were selected within the lower reach of the Black River, at the confluence of the east and west branches of the Black River, and at its mouth at Lake Erie. The goal of this task was to evaluate if dredging improved the quality of the Black River and to assess if improvements to the river system merit beneficial use de-listing. Analytical results of the sampling conducted over a 5-mile stretch of the lower Black River were compared to upstream reference stations. It was noted that the USACE routinely performs maintenance dredging within the channel, from the mouth of the Black River up to River Mile 2.5 at the turning basin. All sediment sampling locations for this study were situated near the riverbanks, where depositional sediments are located, and outside of the USACE dredging areas. Surficial and deeper sediments were analyzed to assess contamination gradients in the River. Benthic sampling included both laboratory and field exposures for four aquatic species (fathead minnow, water flea, amphipod, and midge). Sediment samples were collected from a minimum of 12 locations within a 5-mile area of concern. A ponar dredge was used to collect samples from depths of 0-2 centimeters and 8-10 centimeters. The samples were collected in October 1997. At the same time, a sediment core
Malcolm Pirnie/TAMS-Earth Tech 60 Peer Review Draft � October 2003
Engineering Performance Standards Appendix: Case Studies of Environmental Dredging Projects
sample was collected from each location. The upper 2 centimeters of the core were analyzed for PAHs, while the remainder of the core was frozen for potential future analysis. Sediment sampling results indicated a greater toxicity in the historic/deeper sediments. It is also thought that these deeper sediments may be exposed during resuspension events resulting from storms and associated high flow conditions, boat traffic, and channel maintenance dredging. It was concluded, however, that the sediments do not contain elevated levels of PAHs and that the remedial dredging conducted from 1989 to 1990 was effective. Results/Conclusions Bio-monitoring within the Black River following dredging indicated that fishery impacts increased immediately after dredging but then dramatically diminished as the full benefit of remediation took effect. USEPA Region 5 indicated that the sediment removal project has been considered a success because the incidence of liver tumors in brown bullhead continues to be low. Additionally, as stated above, sampling conducted in 1997 indicated that the river and its biota are healthier and do not contain elevated levels of PAHs as they did prior to dredging in 1989. Manistique River, Michigan Site Location and Description The Manistique River and Harbor is located in Manistique, Michigan on the southern shore of Michigan�s upper peninsula and its outlet into Lake Michigan. Historically, the Manistique River and Harbor was used to export lumber from numerous sawmills located along the river�s banks and a dam was installed approximately 1.4 miles upstream of Lake Michigan to support a hydroelectric facility. These industries have been determined to be the cause of the River and Harbor contamination. Investigations of both the sediment and biota detected PCBs at harmful levels. Studies determined that Aroclor 1248 and Aroclor 1254 represent more than 90% of the PCB contamination. The area of concern consists of 1.7 miles from the power station dam to Lake Michigan. This area has been divided into two hot spots in the River and one large hot spot in the harbor area before it enters Lake Michigan. The harbor area contains the largest amount of PCB contamination, with the majority of sediment in this area containing PCB-concentrations greater than 50 ppm. Site Characteristics Pre-dredging sediment sampling and characterization activities indicated that PCB concentration increased with sediment depth. Sediment cores collected were divided into 0-3 inches, 3-24 inches, and greater than 24 inches. Analytical studies indicated that the average PCB concentration in the top three inches was 16.5 ppm; 77.5 ppm in the 3-24 inch interval; and almost 200 ppm at depths greater than 24 inches, with an overall average PCB concentration of

Malcolm Pirnie/TAMS-Earth Tech 61 Peer Review Draft � October 2003
Engineering Performance Standards Appendix: Case Studies of Environmental Dredging Projects
85.5 ppm. The average thickness of sediment was measured to be three feet. In addition, pre-design sampling revealed large amounts of wood chips and saw dust embedded in the sediment from past lumber and paper mill operations. Remedial Action The USEPA, after initially planning to cap all PCB-contaminated areas with the exception of a single hot spot in the Manistique River and Harbor area, decided to dredge the entire area of concern (as a result of a pilot dredging study conducted in 1995 when the remedial action was first implemented). The pilot dredging study was conducted over a three-month period and resulted in the removal of 10,000 cy of contaminated sediment. This study concluded that dredging costs are comparable to capping costs and that dredging will minimize the long-term environmental risks and financial liability to the PRPs and the community. In addition, the pilot program demonstrated that resuspension into the River was highly unlikely. Even so, it was concluded that silt barriers would be sufficient to contain resuspended sediment, if necessary. Dredging activities occurred August through November 1995. A cofferdam and silt barriers with floating booms were placed around the perimeter of the dredge area to aid in the control of resuspension. Debris present in the area being dredged was removed prior to dredging. A hydraulic cutter head dredge was used with twin suction pumps and a modified head. It was concluded that no resuspension of sediment occurred while the hydraulic dredge operated. Project personnel confirmed this by visual observation and surface water monitoring and analysis. Following the 1995 work, dredging was conducted from 1996 through 1999, during the months of May through October. Approximately 15,000 cy of sediment were removed in 1996; 62,000 cy in 1997; 31,000 cy in 1998; and 25,050 cy in 1999. Similar to the pilot dredging project in 1995, a hydraulic cutter head dredge equipped with a dual pump system and a 10-inch vortex pump was used. The dredge was 13.5 feet wide and was moved via cables anchored to two spud barges. The dual pump system was utilized to minimize dredge downtime and to prevent backwash of the pump lines in the event of a clog in the pump line or pump shutdown. The dredge operated at 8,000 gallons per minute and generated a solids content of 5.5%. Diver assisted dredging was also utilized with a suction pump to aid in the removal of residual sediment areas and furrows that remained after removal operations to the required dredge depth. It was indicated that a single diver would guide the suction hose over the mounded material to ensure accurate removal of residuals. The sediment slurry was conveyed from the dredge into two hopper barges that were double hulled. The barges were positioned in tandem so that the first barge received the dredge slurry and the second received the overflow water pumped out of the first barge. Once full, each barge was tugged to the sediment-slurry processing area located on the upstream shore. Water and sediment was pumped into a water treatment system designed to capture solids via settling and

Malcolm Pirnie/TAMS-Earth Tech 62 Peer Review Draft � October 2003
Engineering Performance Standards Appendix: Case Studies of Environmental Dredging Projects
hydrocyclones, while the water retained during dredging was treated, sampled, and then discharged back into the Manistique River. Containment utilized from 1996 to 1999 consisted of a silt curtain positioned on the downstream edge of the downstream barge. Buoys were used to keep the top of the curtain afloat with a two-foot gap between the top of the curtain and the buoys. Weights were placed on the bottom edge of the silt curtain to keep it positioned near the river bottom. The curtain was not anchored to the river bottom so that it could rise and fall with the current. It was noted that the curtain was not placed along the mouth of the harbor so as to not restrict river traffic. In addition, project literature stated that a more extensive containment system was not employed due to the design of the dredge and pump system. The dredge was built with high torque blades capable of cutting through debris (such as wood) and equipped with a short pumping head to maintain maximum vacuum during dredging. In addition, sealing of the pumps and the dual pump design prevented complications and spills in the event of pump failure.

Malcolm Pirnie/TAMS-Earth Tech 63 Peer Review Draft � October 2003
Engineering Performance Standards Appendix: Case Studies of Environmental Dredging Projects
Residual Verification Activities Project specifications indicated that all PCB contaminated sediment must be removed to a level of 10 ppm or less. Post-dredge confirmation sampling was conducted to verify that this goal was achieved. In cases where sediment contained greater than 10 ppm of PCBs, diver-assisted dredging, as previously described, was implemented to remove residuals and furrows in the hot area. A summary of post-dredge sediment data collected after 1997 dredging activities stated that 10 sediment samples were collected. The mean PCB concentration from these 10 samples was 18.1 ppm while the median concentration of these 10 samples was 7.2 ppm. Since 1995, the FIELDS team (Field Environmental Decision Support) has been assisting with fieldwork and technical analyses of the dredging project on the Manistique River. The FIELDS team consists of USEPA Region 5 employees and research associates centered in the USEPA Region 5 Superfund division. This team assists with sediment characterization including sampling plan designs, bathymetric surveys, and PCB contamination analyses. With regard to the Manistique River, the FIELDS team developed sampling plans to determine the extent and degree of PCB contamination. The most recent residuals sampling plan designed by the FIELDS team for the Manistique River included 400 sample locations in the River and Harbor area. The samples were collected along an unaligned grid designed to verify that the site-wide average concentration of PCBs was less than or equal to 10 ppm throughout the sediment column. Sampling at these 400 locations indicated that the site cleanup goal was achieved by dredging. The average site-wide PCB concentration was determined to be 7.06 ppm. Further, the 95% confidence interval for this value ranged from 4.40 to 9.72 ppm. Thus, there is a 95% confidence that the mean PCB value in the Manistique River and harbor is between 4.40 ppm and 9.72 ppm PCBs. It should be noted that this data is representative of the top 12 inches of sediment. Resuspension Monitoring Water quality was sampled prior to dredging to establish a baseline for comparison both during and after implementation of the remedial action. Prior to dredging, four water sampling studies were conducted during the period 1980 to 1994. In 1980, the average PCB water concentration was determined to be 23.9 ng/L; however, between 1990 and 1992 PCB concentrations in the water column were determined to be non-detect. Finally, during the period 1993 to 1994, the average PCB water column concentration was recorded as 1 ng/L. Monitoring during dredging included the measurement of both turbidity and PCB concentrations. Project specifications required a suspended solids concentration of less than two times the background turbidity measurement within 50 feet of the dredge head. Literature reviewed indicated that less than two times the background turbidity was achieved within ten feet of the dredge head; no data were presented to support this statement. Water quality data was provided for dredging activities completed in 1997 and 1998. Data was compared to a pre-dredge average water column PCB concentration of 0.001 mg/L. During

Malcolm Pirnie/TAMS-Earth Tech 64 Peer Review Draft � October 2003
Engineering Performance Standards Appendix: Case Studies of Environmental Dredging Projects
dredging activities in 1997, seven water quality samples were obtained near the dredge within the harbor area, one water quality sample from an upstream/background location, six water quality samples from downstream of the dredging operations and two river samples outside of the dredge area. Results indicated that the average PCB concentration of the two river samples collected outside the dredging area was 0.37 mg/L, while the average PCB concentration of the samples collected from locations downstream of the dredge was 0.23 mg/L, including samples that were non-detect. It should be noted that the detection limit was 0.05 mg/L and that the two non-detect samples were assumed to be 0.05 mg/L when computing the average concentration. The one background sample collected contained 0.062 mg/L PCBs. In 1998, a total of 17 water quality samples were collected. Nine samples were collected upstream of the dredge and the remainder were collected from locations downstream of the dredge. Analytical results indicated that the average upstream PCB concentration was 0.093 mg/L and the average downstream PCB concentration was 0.066 mg/L. Only one non-detect sample was collected and was from a downstream location. PCB Loading as a Result of Dredging The PCB transport from the Manistique Harbor area (during dredging operations in 1997 and 1998) was determined from measured river flow rates and water column PCB concentrations detected during dredging activities. As previously stated, dredging occurred May through October each year or for six months per year. Thus, the transport time was assumed to be 24 hours per day for six months. The dredging-related PCB loss downstream was estimated to be approximately 75.8 kg PCBs in 1997 and approximately 21 kg in 1998. Post-Dredge Monitoring The Manistique River is part of the Great Lakes Area of Concern and as a result is part of the area-wide remedial action plan that is focused on improving water quality within the entire watershed. The Manistique River system is regularly monitored as part of the efforts to improve its overall quality. This includes monitoring of all benthic organisms, monitoring water quality in beach front areas, maintaining fish advisories based on fish fillet PCB concentrations, and closure or control of all combined sewer overflows (CSOs) into the river system under the National Pollution Discharge Elimination System (NPDES). The dredging project has helped to increase the quality of the entire system, and the improvements have been demonstrated via the monitoring program findings. Modeling The USACE RECOVERY model was employed to predict the temporal responses of surface water to contaminated sediment and to simulate natural recovery of the River system. Input data to the RECOVERY model consists of sediment contaminant concentration data from the sediment mixed-layer and corresponding surface water concentrations. Output data consist of

Malcolm Pirnie/TAMS-Earth Tech 65 Peer Review Draft � October 2003
Engineering Performance Standards Appendix: Case Studies of Environmental Dredging Projects
contaminant and water column concentrations over a projected period of time. For the Manistique River system, a second USACE model employed was the TGU (turbidity generating unit) model. This model projects the amount of suspended mass per unit volume that will result from dredging operations (i.e. resuspension). Typically, values of TGU range from 2 to 50 kg/m3 for various dredges and a variety of sediment bed types. This model assumes that the dredge operates within a specific volume of water and uses a mass balance to estimate the solids concentration in the water column surrounding the dredge, assuming the use of permeable vertical barriers both upstream and downstream of the dredge. This model bases its analysis on the theory that the turbidity barriers will retain all solids while allowing water to pass through the area. The model assumes that the solids must eventually settle out onto the stream body when the system reaches a steady state. Once output is generated from the TGU model, the Equilibrium Model (EQUIL) is utilized. EQUIL is a chemical release model that determines chemical equilibrium between the particle bound solid and the water column or aqueous phase. An end result of this model is an estimate of the soluble fraction partitioning from the resuspended solid and the constituent concentration in the dredged suspended sediment that settles to the river bottom. A combination of these three models was used to simulate the dredging operation at Manistique Harbor. The TGU/EQUIL models were used to predict the dredging-related water column concentration increase and the dredging-related suspended sediment deposit increase (i.e., residual from dredging). The results from the TGU/EQUIL models were set as the starting or boundary condition into the RECOVERY model to simulate the post-dredge sediment and water quality recovery. Results of the TGU/EQUIL model predicted a PCB water column concentration during dredging of 460 ng/L. In comparison, actual water quality samples collected during dredging in 1997 detected an average PCB concentration in the water column of 230 ng/L and 81 ng/L in 1998, or an overall average for these two dredge seasons of 170 ng/L. With regard to sediment concentrations within the sediment mixed-layer following dredging, the model predicted sediment PCB concentrations would increase to 30 ppm immediately following dredging. Assuming a natural depositional rate of 1 inch per year, the model further predicted a reduction in PCB concentration in the sediment to 10 ppm in the year 2000 (two years after dredging), and to 0.012 ppm by the year 2020 (22 years after dredging). As indicated previously, the average PCB concentration measured in the sediment following dredging in 1997 was 18.1 ppm, while the average sediment PCB concentration measured in the year 2000 by the FIELDS team, following the completion of all dredging activities, was 7.06 ppm. Thus, it can be concluded that the TGU/EQUIL model overestimated dredging-related resuspension and sediment residual concentrations following dredging activities.

Malcolm Pirnie/TAMS-Earth Tech 66 Peer Review Draft � October 2003
Engineering Performance Standards Appendix: Case Studies of Environmental Dredging Projects
Results/Conclusions Dredging was completed at the end of 1999. As indicated above, sediment sampling results from the FIELDS team indicated that 10 ppm or less of PCBs is present throughout the entire dredged area. This project is considered a success. Success of the project is believed to be a result of a dredge with site-specific design, operated at low speeds to produce low resuspension. Removal of residuals was successful due to diver-assisted hand operation of a suction dredge to removal furrows and sediment in residual areas. The final report on dredging is currently in the review phase at USEPA Region 5 and is to be finalized and released in the near future. Pine River, Michigan Site Location and Description The Pine River flows through St. Louis, Michigan and discharges into Lake Michigan. Approximately 260,000 cy of sediments are contaminated with DDT in this stretch of river. The ROD issued by USEPA on February 15, 1999 supported dredging. . The ROD indicated that the sediment must be remediated to 5 ppm DDT. This project is under direction of USEPA Region 5 and the Michigan Department of Environmental Quality (MDEQ). Site Characteristics Water depth in the section of the river to be dredged ranges from 7 to 10 feet. Historical sediment data are available for the years 1980, 1981, 1996, and 1997. Remedial Action The selected remedy for this site was dredging with the use of cofferdams. The cofferdams are required so that the section of the area to be dredged will be dewatered and excavated in the dry. Dredged sediment will be transported to a processing facility, where it will be stabilized with a drying agent prior to off-site transport to a RCRA Class C or Class D landfill. All water captured at the processing site will be treated in an on-site water treatment plant and subsequently discharged back into the Pine River. USEPA/MDEQ plans to monitor for resuspension during removal and perform post-removal confirmatory sediment sampling. More detailed information was not gathered since removal will be completed in the dry, which is substantially different from the dredging planned for the Upper Hudson River. Removal has not yet commenced on the River system. The work plans are currently being completed.

Malcolm Pirnie/TAMS-Earth Tech 67 Peer Review Draft � October 2003
Engineering Performance Standards Appendix: Case Studies of Environmental Dredging Projects
Shiawasee River, Michigan A proposed plan was issued by USEPA in July 2001 for the Shiawasee River Superfund Site, which includes the former Cast Forge Company property and an 8-mile stretch of the South Branch of the Shiawasee River. The MDEQ completed RI/FS activities for this site. Proposed remediation for the river includes the removal via dredging of PCB-contaminated sediments with concentrations ranging from 1 ppm to 700 ppm in the hot spot area (covering 1.5 miles of river) and approximately 1 ppm to 22 ppm PCBs over the remaining 6 miles of contaminated river. In addition, the remedial action will consist of the removal of PCB-contaminated soil in the flood plains, wetlands and forested areas along the 8 mile stretch of contaminated river. Proposed residual clean up levels are 1 ppm PCB for river sediment. The river width in the section to be remediated ranges from 20 to 45 feet. To date, a ROD has not yet been issued by USEPA for this site. Kalamazoo River Superfund Site, Michigan This area of concern includes 80 miles of river beginning at the Kalamazoo River�s confluence with Portage Creek and extending to Lake Michigan. In addition, the area of concern includes three miles of Portage Creek. As of August 2002, USEPA has assumed responsibility for the clean up of this site. Sediment contamination consists of PCBs, which are still entering the river from on-going point sources (exposed paper wastes along the riverbank). It is expected that the project will be handled on a dam-by-dam basis and remediation has been divided into two phases. Phase I consists of the Kalamazoo River from Morrow Pond Dam to Lake Allegan and Phase II consists of the Kalamazoo River from the Lake Allegan Dam to Lake Michigan. USEPA expects to complete the RI/FS and issue a proposed remediation plan by Spring/Summer 2003, with the ROD to follow by Summer/Fall 2003. Saginaw River, Michigan Site Location and Description The Saginaw River/Bay is located in Michigan. Dredging of 345,000 cy of PCB-contaminated sediment from five hot spots in the lower Saginaw River commenced the week of April 2000. The remedial action goal was to remove approximately 90% of the PCBs in the river and bay and dredging was to be completed by November 2000. The actual completion date for this project was July 2001, at which time it was reported that approximately 342,433 cy of PCB contaminated sediment had been removed from the River system.

Malcolm Pirnie/TAMS-Earth Tech 68 Peer Review Draft � October 2003
Engineering Performance Standards Appendix: Case Studies of Environmental Dredging Projects
Remedial Action Mechanical dredging with a Cable Arm bucket was used for removal of contaminated sediment. This equipment was selected since it was thought that the Cable Arm bucket would help to minimize turbidity. A conventional clamshell bucket was also utilized to remove wood debris when encountered. Turbidity and air monitoring were conducted and no particular problems (exceedences) were reported. Following removal, sediment was transported by hopper barge to a confined disposal facility (CDF) just outside the mouth of the Saginaw River. This CDF was constructed and managed by the USACE. The dredged material was off-loaded from the barges into dump trucks and subsequently placed within a sub-cell in the northeast quadrant of the CDF. Ultimately, the CDF was capped with cleaner material from the USACE�s maintenance dredging activities. The Cable Arm bucket was equipped with a modified WINOPS dredge positioning software system to guide the removal of contaminated sediment on the project. The WINOPS system provided the following capabilities:
• Positioning of the crane derrick barge in an X-Y graphic display in real time to any scale with heading in State plane coordinates;
• Providing the operator an accurate, geodetically-oriented image of the bucket footprint and crane boom during digging operations at a maximum of one-second intervals. This image was located using State plane X-Y coordinates;
• Superimposing bucket targets with individual designations over the derrick image at any scale to assist the operator in placing the bucket over each target for complete coverage;
• Providing a cross section display depicting the area template and showing the bucket depth with history in real time; and
• Logging pertinent data to allow chronological and graphical replay of the entire job, showing the X-Y-Z position of the bucket at any point.
The WINOPS PC-based dredge software provided the crane operator with a geodetic image of the crane barge, spuds, derrick circle, boom and bucket and was used with three DGPS receivers to complete derrick positioning and orientation. WINOPS also was used to provide the operator with a precise image and orientation of the bucket during real time dredging operations. In addition, a radial dig pattern (RDP), created by entering the bucket footprint, boom angle and angular separation between bucket targets, was used. RDPs were developed by superimposing individually numbered bucket targets over the derrick image to give the operator a concise picture of each bucket position. A two-foot side-to-side and set overlap was the required input into the RDP to provide complete coverage of the removal area. The Saginaw River remediation project did not achieve the production rates required to meet the dredge schedule. Dredging took half a season (4 months) longer then expected. This is a result of

Malcolm Pirnie/TAMS-Earth Tech 69 Peer Review Draft � October 2003
Engineering Performance Standards Appendix: Case Studies of Environmental Dredging Projects
the equipment utilized, the overall dredge pattern, metrological conditions, and river vessel traffic. Only one mechanical dredge was deployed in the river and this dredge was used for both debris removal and production dredging. Productivity attained at the Saginaw River Superfund site can be computed from project available data and compared/contrasted with productivity estimates for the Hudson River to evaluate if productivity estimates for the Hudson River are reasonable and achievable. By one estimate, the mechanical system employed at the Saginaw River (a conventional crane-mounted clamshell) was able to remove, on average, 981 cy of sediment daily or about 41 cy/hr. Assuming this estimate is accurate, it should be noted that only one dredging unit was employed for all work at this site, both dredging and debris removal. In addition, debris removal (on the Upper Hudson River) is expected to be accomplished by another piece of equipment, so that work by the main dredges will proceed, as much as possible, unimpeded. It is clear from documents reviewed that productivity on the Saginaw River would have been considerably greater if a separate piece of equipment had been dedicated to pulling piles, an operation that did not contribute to sediment removal, but did consume time that could have otherwise been used for dredging work (personal communication, William Rito, USACE, Project Manager). Another inefficiency related to using only a single dredge on the Saginaw River site involved the six different size buckets that were employed (4, 5, 8, and 10 cubic yard conventional buckets and 6 and 16 cubic yard cable arm buckets). Every bucket changeover that occurred (some changes were due to space limitations) required a complete shut down of in-river production. It is assumed that multiple pieces of equipment would be used on the Upper Hudson River, so that loss of a single unit would not result in complete shutdown. Finally, as mentioned above, the average production rate of the dredge equipment at the Saginaw River was approximately 41 cy/hr. The average removal rate for the Upper Hudson River, based on equipment estimates in the FS report, could be approximately 54.5 cy/hr, which does not vary greatly from the 41 cy/hr rate calculated for the Saginaw River. Considering that only one dredge was employed on the Saginaw River and that this machine was used for both debris removal and production dredging, the production estimates for the Upper Hudson River mechanical dredging equipment are most likely underestimated, and a higher productivity could be achieved during implementation of the Upper Hudson remedy. Resuspension Monitoring Turbidity and water quality were closely monitored during dredging. Each of the five targeted areas were fully enclosed with silt curtains extending from the water surface to the river bed where they were anchored, prior to the start of dredging. Three monitoring stations were established for each targeted area. These stations were located halfway between the shoreline and the Federal Channel limit. One station was located 300 feet upstream from the boundary of the silt curtain in the area being dredged to allow for collection of background turbidity measurements and water samples. The other two stations were located at 300 feet and 600 feet

Malcolm Pirnie/TAMS-Earth Tech 70 Peer Review Draft � October 2003
Engineering Performance Standards Appendix: Case Studies of Environmental Dredging Projects
downstream from the downstream boundary of the silt curtain (downstream of the dredging operation). Turbidity measurements were collected at both downstream stations while water samples for PCBs were collected daily only at the first downstream station (300 feet station). After the first week of dredging, water samples for PCB analysis were collected only when/if the turbidity action level was reached (or at the lead Agency's discretion). It was stated in the construction specifications for dredging that if the downstream turbidity measurement exceeded the upstream background turbidity measurement by 50% or more, the contractor was required to cease dredging and introduce corrective procedures. Menominee River, Wisconsin This area of concern consists of a six-mile stretch of river that contains PAH-contaminated sediments. Remediation is currently underway and is being conducted by diverting the river flow to allow excavation of the contaminated sediment in the dry. More detailed information was not obtained since this project is not relevant to the remedial action proposed for the Upper Hudson River, which will not be conducted in the dry. Fox River, Wisconsin, Deposit N and O (1998 and 1999), Wisconsin Site Background and Description Deposit N is one of 34 PCB hotspots identified along the Fox River. It is a three-acre deposit and is situated in waters that are approximately 8 feet deep, on average. The average PCB concentration of Deposit N is 45 ppm. The objective of the demonstration project was to, among other matters, validate dredging using hydraulic dredging equipment. During the late 1998 work period (work was halted by severe weather conditions), about 4,200 cy of sediment was removed which contained approximately 100 pounds of PCBs. Work resumed in August of 1999 on Deposit N and dredging of a second area, Deposit O, was initiated. The total amounts removed were 7,160 cy from Deposit N and 1,030 cy from Deposit O. Site Characteristics Sediments within Deposit N consist of 1% gravel, 54% sand, 27% silt and 18% clay. Generally, this sediment is classified as a silty clay and sandy loam with 37% solids, on average. The highest PCB concentrations were present in the silty clay while the sandy loam contains a lesser degree of PCB contamination. The sediment depth is 3 feet in most locations, and the sediment overlies fractured bedrock. The average river velocity through Deposit N ranged from 0.09 ft/sec to 0.87 ft/sec with an average velocity of 0.47 ft/sec at 20% depth and an average velocity of 0.59 ft/sec at 80% depth.

Malcolm Pirnie/TAMS-Earth Tech 71 Peer Review Draft � October 2003
Engineering Performance Standards Appendix: Case Studies of Environmental Dredging Projects
Remedial Action The sediment was dredged with a hydraulic swinging ladder dredge (Moray Ultra Dredge). The sediment was conveyed through an 8-inch HDPE double-walled pipeline for a distance of approximately 1/4 mile to the shore-side processing facility. It should be noted that double-casing of the dredge line was not utilized during the 1999 dredge season. Approximately 11,000 cy of contaminated sediment were present in Deposit N; however, only 65% or 7,1500 cy of sediment was targeted for removal due to the presence of bedrock. As previously stated, a total volume of 7,149 cy was removed from Deposit N. In instances where additional dredging attempts were needed to re-dredge contaminated sediment, the same dredging equipment was utilized; however, the suction pipe was extended inside the dredge head to decrease the area of the mouth by 15% and to increase the dredge head vacuum pressure. This was initiated to create a greater suction pressure to remove residual sediment. Bench scale tests were performed to establish the dewatering system design. The target sediment water content corresponded to a minimum compressive strength of 0.4 tons/ft2. The dewatering processing train produced a filter cake of 45% solids. Bench scale tests were also conducted to determine sediment resuspension and settling rates. This test was conducted by placing a 1-ft thick aliquot of Deposit N sediment under 5 feet of river water. The system was then agitated by introducing forced air. Water samples were collected for turbidity and TSS, and sediment settling rates were observed within this system. The results of this study produced the following relationship between turbidity and TSS: y = TSS = (-1.27) + 1.313x, where x = turbidity. This relationship is based on an r2 value of 0.98. As a result of this relationship, TSS was predicted in the field during dredging based on real-time turbidity measurements. During dredging, turbidity from the dredge was controlled with an 80 mil HDPE turbidity barrier. This barrier was installed and fastened to the river bottom with railroad ties and enclosed the perimeter of Deposit N. A silt curtain was then deployed within Deposit N in the vicinity of dredging. For Phase II dredging in Deposit N during 1999, the perimeter turbidity barrier was not used. Instead, a silt curtain was deployed at a distance of 150 feet or less downstream of the dredge. There were no accidental releases documented from dredging. Phase IV dredging of Deposit O during the period October 15, 1999 through November 3, 1999, located on the opposite bank of the Fox River, occurred 12 hours per day and ultimately removed approximately 1,026 cy of PCB contaminated sediment or 0.4 pounds of PCBs. Two turbidity monitoring stations were used during dredging activities. One station, M-7, was situated upstream of dredging and the second station, M-8, was located downstream of the dredge. This adjunct project indicated that in-river mobilization of dredge equipment to a different target area did not result in a large impact to project productivity and schedule.

Malcolm Pirnie/TAMS-Earth Tech 72 Peer Review Draft � October 2003
Engineering Performance Standards Appendix: Case Studies of Environmental Dredging Projects
Residual Verification Activities Sediment samples were collected from the Fox River by a certified diving contractor prior to and following dredging. Sampling locations were based on the location of pre-dredge samples and were field-located by surveyors and subsequently marked with a buoy. Divers manually collected sediment core samples to refusal. Collected samples were segmented and analyzed from 0-4 inches, 4-12 inches, and 12 inches to refusal. Ponar grab samples were used for thinner sediment layers. Sediment samples were analyzed for PCB Aroclors, mercury, TOC, particle size, density, and water content. In addition, 13 randomly selected samples were analyzed for PCB congeners. Project specifications did not require either total removal of the sediment or removal to a specific PCB sediment concentration as these sediments rested on a fractured bedrock surface, preventing a dredge cut into a clean underlying layer. Removal was completed to 3 inches over bedrock in Phase I within the west lobe (during 1998 dredging activities) and to 6 inches above bedrock for Phase II and Phase III dredging within the east lobe (1999 dredging of Deposit N). It should be noted that the west lobe contained the highest PCB concentrations. As a result, it was anticipated that PCB concentrations of the sediment after dredging would be similar to pre-dredge sediment concentrations. Using the 1998 post-dredge sediment data, collected just prior to dredging in Phase II, the average PCB sediment concentration in Deposit N was 16 ppm PCBs, with a maximum concentration of 160 ppm PCBs. The post-dredge average PCB sediment concentration in Deposit N following completion of dredging within Phase II was 14 ppm PCBs, with a maximum of 130 ppm PCBs. Resuspension Monitoring To measure possible sediment resuspension during dredging, turbidity meters were placed in the river and within the water intake stream of Inter Lake Papers. The meters recorded turbidity and produced a digital signal, which was transmitted to the on-shore treatment site. Throughout the project, turbidity results were generated at 15-minute intervals from the monitoring stations. The average hourly turbidity value was then computed and reported for each station and compared to the hourly allowable turbidity threshold value. It should be noted that the threshold was not stated in the literature reviewed. Turbidity was measured at 50% depth at each monitoring station. During 1998 dredging operations, turbidity monitoring occurred at six stations, M-1 through M-6. Station M-1 was located upstream of dredging, M-2 on one side of the dredging location, and M-3 downstream of dredging. Station M-4 was located in the intake stream of Inter Lake Papers, and M-5 was located at a post-water treatment location within Inter Lake Papers. Station M-6 was located inside the turbidity containment barrier.

Malcolm Pirnie/TAMS-Earth Tech 73 Peer Review Draft � October 2003
Engineering Performance Standards Appendix: Case Studies of Environmental Dredging Projects
In 1999, slight changes were made to the turbidity monitoring plan. Since the containment curtain was not used, station M-6 was deleted. Similar to 1998, stations M-1, M-2 and M-3 were located upstream, side stream and downstream, respectively, of the dredge. Station M-4 was located in the intake stream of Inter Lake Papers and M-5 was located at the post-water treatment location at Inter Lake Papers. Overall in 1998, the river downstream of the dredging site was very similar to the upstream background. In 1999, the river downstream of the dredge had a slightly higher average turbidity reading than values recorded at the upstream stations. The differences in both years was slight, on the order of 2 to 4 Nephelometric Turbidity Units (NTU), and within the range of the turbidity meter accuracy. It was also observed that the range of values, or vertical spread, for data points representing times of dredging and non-dredging were similar, which indicates a natural variability of turbidity in the river. The range of positive and negative values were as wide (spread) for times when no dredging was occurring as for times when dredging was occurring. Overall, based on these turbidity data and construction observations, it appears that the contractor was successful in minimizing construction-induced resuspension and off-site loss of sediment. This conclusion is further validated by monitoring performed by the paper mill adjacent to the site, as the mill reported no degradation of water quality in their river water intake at any time during the dredging operation. Water column samples were also collected and analyzed for PCB concentrations during Phase I dredging (1998) and Phase II and III dredging (1999) of Deposit N by WDNR. Measured values were compared to average pre-dredge PCB water column concentrations. Samples collected during dredging were also compared on a basis of upstream versus downstream of the dredge. Generally, the average pre-dredge PCB water column concentrations were similar upstream and downstream of Deposit N. An average pre-dredge PCB concentration upstream and downstream of Deposit N of 15 ng/L was reported. It should be noted that the average pre-dredge PCB concentration for two water samples collected closest to the commencement of dredging in 1998 was 4.2 ng/L upstream and 5.0 ng/L downstream of Deposit N. During dredging in 1998 (Phase I), the upstream average reported PCB water column concentration was 3.2 ng/l compared to the average downstream PCB water column concentration of 11 ng/L. The variation between the upstream PCB water column concentration and the downstream PCB water column concentration measured during dredging reflects an average increase downstream of 3.6 times the upstream value. Similar water column PCB results were obtained during Phase II and III in the 1999 dredge season. For the 1999 dredge period, the average upstream PCB water column concentration was 14 ng/L compared to the average downstream PCB water column concentration of 24 ng/L. This variation represents an increase of 1.7 times the upstream reported value. It can be concluded from this data that dredging caused an increase in PCB concentrations downstream of the dredge site.

Malcolm Pirnie/TAMS-Earth Tech 74 Peer Review Draft � October 2003
Engineering Performance Standards Appendix: Case Studies of Environmental Dredging Projects
PCB Loading as a Result of Dredging The PCB load resulting from Deposit N dredging operations was computed as a function of the flow rate and the measured PCB water column concentrations discussed previously. The average daily river flow was measured at the USGS Appleton gauging station (#04084445). Daily PCB loads were computed only for days in which PCB water column data was measured/available. The average daily upstream PCB load was computed to be 31 grams/day and the average daily downstream PCB load was computed to be 106 grams/day, representing a net loss of 75 grams/day from the dredge site. The total PCBs load to the river during dredging was computed by multiplying the average daily load by the 30 day Phase I dredging duration (1998 season). This results in an estimate of 2.3 kg of PCBs added to the River as a result of dredging. A similar computation was performed to determine the PCB load during the 1999 dredge season at Deposit N. The average upstream PCB load was computed to be 59 grams/day and the average downstream PCB load was computed to be 100 grams/day, representing a PCB loss rate from dredging of 41 grams/day. This load was the multiplied by the 45 day dredging duration to estimate that 1.9 kg of PCBs was lost to the river as a result of dredging in 1999. In summary, dredging of Deposit N resulted in a total PCB load of 4.2 kg of PCBs (sum of loads from 1998 and 1999) to the Fox River system. Results/Conclusions The goal of dredging within Deposit N was to demonstrate that sediments could be removed from the Fox River in accordance with set project specifications and designed work plans. These specifications included dredging, dewatering, water treatment, and community relations. At the completion of Deposit N dredging in 1999, it was concluded that sediment was effectively removed with hydraulic dredging equipment to meet project contract specifications (with regard to the average remaining thickness of sediment above bedrock). It was also noted that removal above the overlying bedrock was difficult and time consuming and that it was not possible to remove the 3 inches of residual sediment effectively with the dredge equipment being utilized. Different removal techniques would need to be implemented to capture this sediment at other dredge sites with similar conditions. With regard to the water quality impacts of dredging, it was concluded that dredging can be conducted adjacent to a water intake structure without adversely impacting the quality of the intake water. Turbidity and sediment resuspension results from water quality monitoring during dredging indicated that resuspension and sediment downstream transport were insignificant and resulted in little impact to water quality. It was also stated that no real correlation existed between PCB water column concentrations and TSS/turbidity data collected during dredging. Lastly, this project demonstrated that sediment-dewatering technologies were capable of meeting stringent requirements specified by landfills. In addition, a local landfill was capable of meeting

Malcolm Pirnie/TAMS-Earth Tech 75 Peer Review Draft � October 2003
Engineering Performance Standards Appendix: Case Studies of Environmental Dredging Projects
regulatory and technical requirements to accept and dispose of non-TSCA PCB contaminated sediments. The treatment system was capable of treating water separated from dredge solids to acceptable levels for disposal back into the river in accordance with WPDES permits. Fox River SMU 56/57 Phase I (1999), Wisconsin Site Background and Description Dredging of a nine-acre area containing PCB-contaminated sediment, identified as sediment management unit 56/57 (SMU 56/57), was conducted on the Fox River adjacent to the Fort James Plant. Dredging began in the year 1999 (Phase I) and continued through the year 2000. Approximately 80,000 cy of contaminated sediment were targeted for removal with a hydraulic dredging system (horizontal auger). Depths of removal were established based on a PCB residual concentration following dredging of 1 ppm PCB. The total mass of PCBs within SMU 56/57 was estimated to range between 4,600 pounds and 6,600 pounds of PCBs. The entire dredge area was divided into 100 x 100 foot subunits. Each subunit was assigned a depth to dredge using GIS, based on sediment data characterizing the vertical delineation of PCBs. Site Characteristics Sediment within SMU 56/57 consists of high plasticity organic silts with some sand and gravel overlying low to medium consolidated native clay. The average PCB concentration was 53 ppm and ranged from depths of 2 to 16 feet. Water depths within SMU 56/57 ranged from 2 feet near the shore to 14 feet at the outer edge of the dredge area. The most contaminated sediment was located at a depth of 4 inches to 7 feet. Annual flow velocities at this location ranged between +/- 2.5ft/sec, based on data from the USGS gauge station. It should be noted that the negative velocity represents flow reversal from strong winds that come from the northeast. River velocities measured within the dredge area during dredging ranged from 0 ft/sec to 0.6 ft/sec. Remedial Action Hydraulic dredging with a round cutter head dredge was initially selected as the removal technology due to the small amount of debris and obstructions that existed within SMU 56/57. It should be noted that little debris was expected since a trackhoe was used prior to dredging to remove debris and loosen sediment. In addition, it was thought that the hydraulic dredge would operate more efficiently within the shallow water depths. After one week of dredging, this dredge was replaced with an IMS 4010 Versi Dredge equipped with a 10-inch pump discharge. The change in equipment was made to increase the solids content in the dredge slurry. This dredge was again upgraded one week later to utilize a 12-inch pump discharge and a larger booster pump. This upgraded dredge had a six-cylinder diesel engine rated at 250 HP and 2,200 rpm. The dredge pump was equipped with a 9.75 inch diameter intake and a 19.25-inch diameter impeller. The flow rate was 5,000 gpm at 850 ft. vertical head with a speed of 800 rpm. The booster pump was an 8-inch MXT Pekor Pump rated at 250 HP. One month into dredging, the
Malcolm Pirnie/TAMS-Earth Tech 76 Peer Review Draft � October 2003
Engineering Performance Standards Appendix: Case Studies of Environmental Dredging Projects
IMS 5012 Versi Dredge with 12-inch pump was upgraded again with the addition of a nine-foot wide horizontal auger cutter head. This configuration was used for the remainder of dredging. Dredging was carried out over a period of 15 weeks between August and December 1999. Prior to dredging, optimum productivity rates were established to be 200 cy/hr assuming one dredge would take 12 years to remove 11 million cy of sediment, operating at 80% available time with 20% down-time for eight months per year. During dredging, the average achieved production rate was 294 cy/day or 60 cy/hr. Dredging was conducted in an east to west direction, perpendicular to the shoreline, from the northern limit of the target area southward. The dredge was situated on a spud barge and was repositioned as it moved from deeper water toward the shoreline using a travel cable windlass. This cable was stretched between a second cable anchored on shore and a third cable anchored east of the dredge area, forming an �I� configuration. The reported depth of cut per dredge pass ranged between one to 24 inches with an average cut of one foot per dredge pass. It was stated that multiple passes were required at each location to meet the target dredge depths/elevations and that the dredge moved at a rate of 0.5 to 4 ft/min. Bathymetric surveys were conducted to verify that the dredge was meeting target elevations. The first survey indicated that the target elevation was not being achieved. Many ridges of un-dredged sediment were being left behind between dredge cuts. As a result, production dredging was halted and the dredge was re-positioned in the previously dredged area to remove the ridges and meet the required target elevations. Dredge slurry removed from the Fox River was conveyed to the shore side processing facility where it was directed through a series of holding tanks and then processed by means of flocculation, settling, and activated carbon. Treated wastewater was then discharged back into the Fox River in accordance with a WPDES permit. A total volume of 75,256,500 gallons of water was treated in the system, which had an optimal operating capacity of 900 gallons per minute. Solids removed from the water treatment process were mixed with lime and then mechanically dewatered in a series of plate and frame filter presses, which had a capacity of 800 cf. The dewatered filter cake contained approximately 55% solids. The slurry processing train proved to be a constraint on achieving desired productivity rates. To improve the situation, additional filter presses were added to the slurry processing system. Dewatered solids were then transported and disposed in a sub-cell at the Fort James industrial landfill, under permit modification from WDNR. A woven geotextile perimeter permeable silt curtain was used to control turbidity. The silt curtain was placed around SMU 56/57 and was anchored to the river and the shore. Buoys and lights were placed on the curtain to aid navigation in accordance with Coast Guard requirements. At the conclusion of Phase I, it was stated that the curtain functioned well under typical river velocity conditions ranging between 2 and 3 feet per second. However, the barrier system experienced some damage during a storm event when velocities approached 4.5 feet per second. At the end of Phase I, this curtain was left in place over the winter season.

Malcolm Pirnie/TAMS-Earth Tech 77 Peer Review Draft � October 2003
Engineering Performance Standards Appendix: Case Studies of Environmental Dredging Projects
By the end of Phase I, dredging was completed in 4 subunits. At this time, an additional cleanup pass was made in each completed sub-unit to remove an additional 6 inches of sediment to clean up residuals and to meet target elevation requirements. The project was planned this way. It was thought that all sub units would be dredged to their target depth minus 6 inches. Then, at the end of the project, the final pass would be made. One post-dredge sample was then collected from each sub unit and an average thickness of 8 inches of sand was placed over all of SMU 56/57 at the end of Phase II (year 2000 dredging); no backfill was placed at winter shutdown at the end of Phase I. Residual Verification Activities Monitoring before and after dredging included bathymetric surveys and sediment core sampling. A single-beam sonar was used to collect water depths on range lines spaced at 50-ft intervals in directions parallel and perpendicular to the shoreline across the Project area. Before the USACE pre-dredge survey and installation of the silt curtain, pre-dredge cores were collected at the center of most of the subunits. Post-dredge cores were collected in the subunits where dredging had occurred, as close as possible to the pre-dredge core locations. The post-dredge sediment elevation was computed, and was compared to the pre-dredge sediment elevation. If the difference was more than approximately 1 ft, a post-dredge core was collected. Cores were collected through a center well in a 16-ft long, flat-bottom aluminum boat. Sampling tubes of 4- in. diameter Schedule 40 PVC were manually pushed into the sediment until refusal, and then were driven a few more inches with a sleeve hammer to seat the bottom of the tubes in firmer sediment. A piston assembly inside the sample tubes aided in sample recovery. Core samples were processed in descending intervals from the top of 0 to 4 in., 4 to 12 in., and 1 ft intervals thereafter. The samples were sent to EnChem for analyses of PCBs (SW846 8082), mercury (SW846 7471A), percent solids (SM 2540G Mod), and total organic carbon (SW 846 9060M). Post-dredge surface PCB concentrations were measured within about two weeks after dredging ended, while the silt curtain still enclosed the Project dredge area. Pre-dredge surface PCB concentrations averaged 4 mg/kg, and the highest measured concentration of all cores in the work area was 650 mg/kg. Surface PCB concentrations in post-dredge samples (range of non-detectable to 2.0 mg/kg) were less than pre-dredge concentrations (2.3 to 3.3 mg/kg) in three of the four locations where a dredge cleanup pass was performed. In the fourth location where a cleanup pass was performed, the post-dredge PCB concentrations (4.5 to 17 mg/kg) were elevated compared to the measured pre-dredge concentration (2.7 mg/kg). In areas where the cleanup pass was not performed, surface PCB concentrations were higher, as expected, because the dredging was incomplete in these areas (i.e., dredging did not reach target elevations).

Malcolm Pirnie/TAMS-Earth Tech 78 Peer Review Draft � October 2003
Engineering Performance Standards Appendix: Case Studies of Environmental Dredging Projects
Resuspension Monitoring Real-time turbidity monitoring was conducted at six locations following deployment of the silt curtain: These six stations were situated as follows:
• Upstream of the dredge area outside the silt curtain (USO).
• Upstream of the dredge area inside the silt curtain (USI).
• Side stream of the dredge area outside the silt curtain (SSO).
• Downstream of the dredge area outside the silt curtain (DSO).
• Downstream of the dredge area inside the silt curtain (DSI).
• Fort James water intake (FJI).
A YSI 6820 self-cleaning turbidity sensor was installed at each location, suspended inside a perforated PVC pipe at approximately 0.5 to 0.6 of the river depth. The turbidity sensors were connected to a YSI 6200 data collection platform. The two upstream turbidity sensors shared a common data collection platform installed at USO via cabling on floats to USI. The two downstream sensors were installed in the same fashion. SSO and FJI had their own data collection platforms. Each data collection platform included a solar panel and battery, two-way radio transceiver, and directional antenna. Data collected in the river was transmitted by radio to an antenna and YSI 6250 base station unit at Montgomery Watson�s trailer. The base station transmitted the data to a personal computer, where it was stored on the hard drive and displayed in real time using YSI�s EcoWatch software. Values were recorded at 15-minute intervals whether or not dredging was occurring. In summary, the evaluation of manually collected turbidity data generally showed that turbidity downstream of the dredge was higher than upstream of the dredge. On the other hand, the evaluation of extensive real-time turbidity data within and outside the silt curtain showed inconsistent, and generally insignificant, differences. The data indicates dredge-induced turbidity was minimal to negligible at a distance tens of feet to a few hundred feet from the dredge. Often the dredge-induced turbidity near the silt curtain could not be readily discerned from the background variability of turbidity during non-dredge periods. Water samples were collected by USGS for PCB analysis during dredging. These samples were collected at the upstream and downstream monitoring stations. Because the daily seiche in Green Bay can reverse the flow direction on occasion, USGS attempted to collect PCB water samples at times when the flow was not reversed and it was in a predominantly downstream direction to minimize this influence. Results were compared between upstream and downstream direction.

Malcolm Pirnie/TAMS-Earth Tech 79 Peer Review Draft � October 2003
Engineering Performance Standards Appendix: Case Studies of Environmental Dredging Projects
Generally, average PCB water column concentrations before dredging began were similar at the upstream and downstream stations (53 ng/L and 52 ng/L, respectively) and, on average, were higher downstream then the upstream during dredging (51 ng/l and 90 ng/L, respectively). This data indicates that downstream water column PCB concentrations were 2.6 times greater than upstream concentrations. PCB Loading as a Result of Dredging The PCB load resulting from SMU 56/57 Phase I dredging operations was computed as a function of the flow rate and the measured PCB water column concentrations discussed previously. The average daily river flow was measured at the USGS Oil Tank Depot gauging station (#040851385), which is located at the river�s mouth. The average daily river flows during dredging was 1,956 cfs, with a range of �409 cfs (due to seiche and reverse flow) to 5,930 cfs, as recorded at the USGS station. Daily PCB loads were computed only for days in which PCB water column data was measured/available. The average daily upstream PCB load was computed to be 186 grams/day and the average daily downstream PCB load was computed to be 415 grams/day, representing a net loss of 229 grams/day from the dredge site. The total PCBs load to the river during dredging was computed by multiplying the average daily load by 96 days (Phase I dredging duration). This results in an estimate of 22 kg of PCBs added to the river as a result of dredging. Results/Conclusions Phase I dredging provided important information with regard to dredge productivity and operation. The optimum productivity rate was never achieved, even though the dredging equipment was switched three times. It was thought that the percent solids achieved in the dredge slurry, 4.4% -7.5%, could have been increased with a different dredge such as a swinging ladder dredge or if a larger dredge pump could have been installed. It is thought that these modifications may have increased the production rate and helped to make the project goals attainable. It was also noted that the need to conduct a clean up pass resulted in a large amount of water to be treated when compared to the additional six inches of sediment obtained. Turbidity monitoring indicated little change in turbidity inside and outside the silt curtain. This indicates that it may not be cost effective to employ silt curtains due to the time and cost per linear footage for deployment. Additionally, this silt curtain required repair when storms and high flows caused damage. It was thought that a different anchoring system consisting of piling or larger concrete dead men may be more effective at holding the curtain in place during such conditions. The spacing of the curtain can be varied to help the curtain withhold changing lateral river forces from the river current. Also, the integrity of the curtain needs to be inspected frequently to prevent tears and possible sediment transport through holes.

Malcolm Pirnie/TAMS-Earth Tech 80 Peer Review Draft � October 2003
Engineering Performance Standards Appendix: Case Studies of Environmental Dredging Projects
By the end of Phase I, approximately 31,346 cy of sediment was removed, compared to the anticipated 80,000 cy. Both USEPA and WDNR believed residual sediment left behind still contained unacceptably high PCB concentrations. Fox River SMU 56/57 Phase II (2000), Wisconsin Site Description and Background Dredging for Phase II utilized a horizontal auger dredge. Three dredges were available for use during the project. Each dredge was equipped with a submersible pump. Dredging was designed to re-dredge sub units from Phase I (1999) and then, based on success in achieving 1 ppm PCBs in dredged areas and meeting the required side slopes and production requirements, the project would progress into the remaining sub units located within SMU 56/57, pending WDNR and USEPA approval. Dredging began in late August and was completed by late November. Approximately 50,000 cy of contaminated sediment was removed and it was stated that the project was completed 2 weeks ahead of schedule. Site Characteristics Sediment within SMU 56/57 consists of high plasticity organic silts with some sand and gravel overlying low to medium consolidated native clay. The average PCB concentration was 53 ppm and ranged from depths of 2 to 16 feet. Water depths within SMU 56/57 ranged from 2 feet near the shore to 14 feet at the outer edge of the dredge area. The most contaminated sediment was located at a depth of 4 inches to 7 feet. Annual flow velocities at this location ranged between +/- 2.5ft/sec, based on data from the USGS gauge station. It should be noted that the negative velocity represents flow reversal from strong winds that come from the northeast. River velocities measured within the dredge area during dredging ranged from 0 ft/sec to 0.6 ft/sec. Remedial Action Prior to the commencement of dredging, a new perimeter silt curtain was placed around SMU 56/57. This curtain was anchored in place with sheet piles, screw anchors, and chains. Three additional silt curtains were employed within the perimeter silt curtain. These curtains were installed sequentially as dredging progressed from north to south. These curtains were used to divide up the dredge area into four work sections and provided additional protection for completed work areas. Dredging began in late August and was done 24 hours per day, 7 days per week for a total of 69 days. The average daily productivity rate was 723 cy/day and a high production rate occurred in late October when 1,599 cy/day was removed. It was noted that the production goal set for this project was 833 cy/day to meet a 60-day dredging cycle.

Malcolm Pirnie/TAMS-Earth Tech 81 Peer Review Draft � October 2003
Engineering Performance Standards Appendix: Case Studies of Environmental Dredging Projects
Debris removal was done prior to dredging within a sub-site. Debris removal was accomplished with the use of divers and a backhoe mounted on a barge. Divers were used to mark out debris and subsequently the extended arm backhoe removed the debris. Debris consisted of logs and concrete weights. All debris was disposed with dredged sediment. Dredged slurry was conveyed through a pipeline to the shore-side processing plant. The slurry passed through a vibrating shaker screen, hydrocyclones, and an agitated pump tank. Separated solids were then conveyed to plate and frame filter presses. At this time, polymer was added to the solids to aid in dewatering. Sediment requirements were 50% solids and 0.4 tons per square foot strength for disposal. Following mechanical dewatering, the sediment was placed into 1,000 cy piles on an asphalt pad until solids and free liquid testing was completed. This material was then loaded into dump trucks, transported and off-loaded into cell 12A of the Fort James facility landfill. It should be noted that trucks were only allowed to travel on a pre-approved route and only during day light hours for 6 to 7 days per week. Water separated from the solids passed through a water surge tank, clothe bag filters, sand filters, a carbon adsorption system and a final set of cloth bag filters. The effluent was then sampled and ultimately discharged back to the Fox River in accordance with the WPDES permit. Following the completion of dredging and post-dredge confirmation sampling, backfill consisting of sand was placed to a minimum thickness of six inches over the entire dredge area. Residual Verification Activities Confirmation sampling of river bottom sediment was performed after dredging had been completed to target elevation to determine if cleanup objectives had been achieved. Five separate sampling events comprised the sediment confirmation work. Prior to sediment sampling, bathymetric surveys were conducted to document that target elevations had been achieved. At some locations dense native river bottom (clay) was encountered at elevations above the target elevations. In those instances, dredging was terminated since project data had shown the native clay was not contaminated with PCBs. Post-dredge sediment sampling locations were developed by further dividing each subunit into 20 ft by 20 ft grids. Since the subunits were 100 ft by 100 ft, this resulted in 25 grid cells per each subunit. One primary and four secondary grid cells were chosen in each subunit to be the primary and secondary sample locations, using a random number generator. A 16-ft long aluminum, flat-bottomed boat was used to sample the river bottom sediment. The sampling boat was maneuvered to each sample location and anchors were placed to stabilize the boat. The boat was then maneuvered precisely into place using a geodimeter with 360-degree prism by adjusting the anchor lines. Sampling locations were recorded to the nearest 0.1ft. After the boat was secured at each sampling location, the depth of water was measured and recorded using a graduated rod with a 1 ft by 1 ft rigid Plexiglas plate on the bottom end. The sediment

Malcolm Pirnie/TAMS-Earth Tech 82 Peer Review Draft � October 2003
Engineering Performance Standards Appendix: Case Studies of Environmental Dredging Projects
core sampling device (sampler) consisted of a WildcoTM stainless steel hand corer with 2-in diameter CAB core tubes. The sediment cores were received and processed in the on-site Foth and Van Dyke lab. A Dremel saw was used to vertically cut open the CAB liners to expose the sediment. The sample was then segmented into discrete units consisting of the top 4 inches of sediment and 6 inch segments thereafter. Each segment was homogenized and sent to laboratory for analysis. PCB concentrations in the top 4 inches of post-dredging sediment ranged from "non-detect" to 9.5 ppm, with an average concentration of 2.2 ppm PCBs. Eleven out of 28 samples (about 40%) were less than 1 ppm PCB and 24 of the 28 samples (86%) were below 4 ppm PCBs. Restoration Sand placement began on September 23, 2000 following the receipt of PCB sediment data. The sand backfill was placed using a clamshell bucket located on a barge. The sand was placed in a radial pattern around each barge set-up. The sand was released at the water surface and divers viewed the placement and directed the placement to the extent and thickness required. The depth of backfill placement was measured by recording the depth of water above the sand with a graduated rod and then by pushing the rod into the sand until refusal. The rod was then pulled out with a recovered sand core sample in the tube. The thickness of the sand within the rod was then measured. A minimum of four sand thickness verification measurements were completed per 100 x 100 ft subunit. In addition, USEPA performed Ponar dredge sampling of the sand cover. This sampling was used to verify that sand was placed over the entire SMU 56/57 dredge area. By the end of the project, a volume of 13,500 cy of sand backfill was placed over 7.4 acres at an average thickness of 8 inches, with a range from 6 to 14 inches. Resuspension Monitoring Turbidity was measured using both portable and stationary turbidity meters. During dredging, river turbidity monitoring was conducted in the river at three locations. The three locations included M1, the Fort James water intake (upstream); M2, 10 ft downstream (north); and M3, 50 ft downstream (north) of the perimeter silt curtain. The upstream location (M1) was measured with a stationary meter (YSI, Model 6820), while the downstream locations (M2 and M3) were measured using a portable turbidity meter (YSI, Model 6820) from a 16-ft long aluminum, flat bottom boat. During seiche periods, the upstream location was used as the downstream monitoring point. A reduction in the frequency of monitoring occurred as dredging progressed, from twice daily to twice a day, every other day. In addition, throughout the project, USEPA representatives took a

Malcolm Pirnie/TAMS-Earth Tech 83 Peer Review Draft � October 2003
Engineering Performance Standards Appendix: Case Studies of Environmental Dredging Projects
considerable number of turbidity readings at various river locations and had not reported elevated turbidity readings due to dredging. The monitoring locations were marked with buoys. The action level for turbidity was reached or exceeded if the downstream turbidity reading was two or more times higher than the upstream reading and the cause of the increase was determined to be dredging. If the action level was exceeded, the dredge contractor was to be notified and dredging operations modified to minimize resuspension of sediment. In reality, the upstream and downstream turbidity values never varied by a factor of two or more. Therefore, the turbidity monitoring data showed that dredging activities did not cause significant sediment resuspension. Also, it should be noted that turbidity was not monitored inside the silt curtain enclosure. PCB Loading as a Result of Dredging In accordance with the approved monitoring plan, river water quality testing for PCBs was not performed since there were no exceedences of turbidity as a result of dredging Results/Conclusions At the beginning of this project, mid-September 2000, the contractor was not meeting the 833 cy/day production goal. The contractor determined that dredge downtime and mechanical dewatering of sediment at the shore-side processing facility were the limiting factors. As a result, the contractor brought another dredge on site and replaced the smallest press (94 cu ft) with two larger presses (220 cu ft). Within two weeks of adding the second dredge and increasing the press capacities, project production rates increased and a high production rate of 1,599 cy/day was achieved at the end of October. Approximately 51,613 tons of dewatered sediment were transported to the Ft. James landfill. This dewatered sediment had an average percent solid of 59%. This volume of sediment corresponded to the removal of approximately 670 pounds of PCBs from SMU 56/57 during Phase II dredging in 2000. Combining the 1999 and 2000 dredging operations, a total mass of 2,111 pounds of PCBs was ultimately removed from SMU 56/57. Fox River Deposit N and SMU 56/57: Analysis of PCB Loading to the Water Column. Source: USGS. 2000. A Mass Balance Approach for Assessing PCN Movement during Remediation of a PCB-Contaminated deposit on the Fox River, Wisconsin. USGS Water-resources Investigations Report 00-4245, December. Abstract Suspended sediment and PCB concentrations in the water column were measured upstream and downstream of the dredging operations as part of a larger PCB mass balance study for both the Deposit N and SMU 56/57 dredging projects. Both studies were carried out for a three month duration and generated impressive data sets. Composite suspended solids samples were collected at four to five stations across Fox River cross- sections upstream and downstream of the

Malcolm Pirnie/TAMS-Earth Tech 84 Peer Review Draft � October 2003
Engineering Performance Standards Appendix: Case Studies of Environmental Dredging Projects
dredging area; equal volumes of water at 20 percent and 80 percent depths were composited from each station to form a single sample later analyzed for TSS concentration. A single PCB composite sample for the entire cross section was obtained by compositing equal volumes from the same depths at all locations; i.e., 8 or 10 equal volume samples were combined to obtain a single PCB composite sample for the cross section. The resulting data set included 22 data pairs (TSS and PCB) from Deposit N and 36 data pairs from SMU 56/57 during dredging operations. The average of the Deposit N data pairs show a TSS loss across the area of 1.7 percent and a PCB gain of 10.6 percent (FRRAT 2000). USGS (2000) reports that similar results from SMU 56/57 show a TSS loss across the area (a specific rate is not mentioned) and a PCB gain of 2.2 percent. Discussion of Analysis Analysis of the reported PCB loads presents the following issues:
• The load-gain estimate is based on a cross-section that is located too close to the dredging area. The cross-section is also located in an area that is a likely backwater (it is in a turning basin, with a nearby coal boat canal). It should be noted that sampling activities during boat activity showed higher PCB concentrations and were included in estimates of releases. Thus, flows through the cross-section are unlikely to be consistent. The proximity of the cross-section to the dredging area also increases the likelihood that the sampling will not be representative of the total load, since the input from dredging will be poorly mixed.
• The sample compositing strategy, designed to reduce the number and cost of PCB
analyses, was contrary to the mass flux analysis attempted. The equal volume composites do not allow consideration of flow variation across the cross-section. USGS (2000) states that stagnant areas and even reversed flows were observed during sampling operations, confirming the errors associated with the composite PCB samples. The TSS sample composites induce less error and provide a more accurate estimate of downstream TSS flux, yet they showed an unexplained decrease in suspended sediment across the dredging operation. The decrease is almost certainly an artifact of errors associated with compositing equal volume samples from 20 percent and 80 percent depth. Even though it has long been established that velocity measurements from these depths represent the average velocity in an open channel, there is no justification for suggesting that a composite sample from these depths represents the average concentration along the profile. This is particularly true in deeper water where the two samples represent 25 feet or more of water depth.
• The method of PCB collection is not documented, but it appears that it inaccurately
represents the dissolved and suspended matter fractions, based on the lack of change in PCB pattern across the dredging area. The load gain is attributed to a large gain in

Malcolm Pirnie/TAMS-Earth Tech 85 Peer Review Draft � October 2003
Engineering Performance Standards Appendix: Case Studies of Environmental Dredging Projects
dissolved PCBs, but this is inconsistent with the PCB congener pattern. A large dissolved-phase PCB contribution from the sediments, either by pore water displacement or sediment-water exchange, should yield a gain whose pattern is similar to the filter supernatant. The fact that the congener pattern is unchanged across the study area would suggest a direct sediment addition. Yet the suspended solids data documents no increase in suspended sediments.
• Similarly, the total PCB concentration of the suspended matter doubles, yet there is no
change in the suspended matter loading. Given the proximity of the downstream sampling cross-section to the source area, it is unlikely that the majority of the TSS in the river could be directly affected by dredging induced resuspension.
• A review of the PCB loading over the dredging period shows that PCB loads were
relatively low for the first 2.5 months of operation, when dredging took place at the more upstream end of the targeted area. During this period, the estimated release was only 3 kg or about 1.2 kg/month. This changed dramatically during the last month of operation, when the loading rate increased to about 13.5 kg/month. During this latter period, the dredging took place at the downstream end of the targeted area, very close (the closest station less than 80') to the sampling cross-section, near areas with higher PCB concentrations. Another significant factor, as discussed in the USGS paper, that may have caused elevated PCB concentrations in the downstream profile was increased water flow velocities. Proximity of dredging to the deposit or water flow could have been significant contributing factors for increased PCB concentrations observed in the downstream profile. To conclude that observed increases are only related to dredging fails to consider these and other potential influences. Additionally, a lack of comparable transect data for PCB water column concentrations for pre-dredging (i.e., �natural�), and during dredging also contributes to the uncertainty evaluating dredging surface water contributions.
• The fact that significant loss of PCBs only occurred when the dredging area was close to
the sampling cross-section suggests that settling of any resuspended matter occurs within a short distance of the dredging operation. Only when the monitoring location was close to the dredging could this signal be found. This suggests that the loads obtained by this study do not represent PCB released for long-distance transport. Rather, the PCBs appear to be quickly removed from the water column a short distance downstream. As such, it is inappropriate to use these results to estimate downstream transport from a dredging site.
Conclusion/Summary of Analysis Although substantial data sets resulted from the Fox River dredging demonstration projects at both Deposit N and SMU 56/57, the sampling approach and compositing strategy induced errors that mask the results. A close review shows the study results can only be considered inconclusive and should not be used as the basis for estimating resuspension for any future dredging operations.
Malcolm Pirnie/TAMS-Earth Tech 86 Peer Review Draft � October 2003
Engineering Performance Standards Appendix: Case Studies of Environmental Dredging Projects
Sheboygan River, Wisconsin Site Location and Description Approximately 14 miles of the Sheboygan River sediments became contaminated when soils, used to construct a flood protection dike, eroded. The soils had been contaminated with PCBs by historical industrial activities. After conducting a RI/FS, the PRP proposed and implemented a pilot program to remove certain sediment deposits (4,000 cy) closest to their facility and to armor additional nearby deposits via capping. Remedial Action The removal was accomplished using mechanical dredging equipment that consisted of a sealed clamshell bucket and a backhoe. The armoring for the cap consisted of placing a geotextile fabric over the deposit followed by one foot of gravel and then another layer of geotextile. The top geotextile fabric was anchored in place with gabions and then covered with rip-rap. In-river testing was conducted both before and after the pilot remedial work. Results of the program were inconclusive with some parameters improving somewhat (sediment loads) and others showing little observable trend (fish levels). Approximately four years after remedial work was completed, observations were also made of the physical condition of the armoring cap system. Armoring along the banks appeared to be stable. Armoring systems within the river experienced a loss of riprap and gravel in some cases. It was concluded by the WDNR (Wisconsin Department of Natural Resources) that the condition of in-river armoring systems was difficult to ascertain and that their overall performance and longevity raised numerous questions. Observed damage to the armoring system and continued water column PCB levels were factors in WDNR�s negative assessment. The USEPA subsequently issued its FS report for the overall river PCB contamination problem in 1998. The proposed plan for this site was issued in May 1999 followed by issuance of the ROD in May 2000. The ROD called for the removal of approximately 21,000 cy of sediment from the Upper River and 53,000 cy from the Inner Harbor, which totals 14 river miles from the Sheboygan Falls Dam to and including the Inner Harbor Area. The USEPA, using health and ecological risk methods, initially determined that the selected alternative should remove sufficient river sediment to provide a residual sediment PCB level of 1 ppm after 30 years. However, the ROD was revised to state that the required clean up level/residual concentration must be 0.5 ppm PCBs, with the lower 1 mile of the River to be dredged to a depth of 2 ft and to include bank to bank removal (from the Pennsylvania Avenue bridge to the 8th Street bridge). Total costs for remediation within the river are estimated to be approximately $35 million. A 30-year monitoring plan of sediment and fish tissue concentrations is planned following implementation of the remedy.
Malcolm Pirnie/TAMS-Earth Tech 87 Peer Review Draft � October 2003
Engineering Performance Standards Appendix: Case Studies of Environmental Dredging Projects
A dredging technology has not yet been selected for removal of river sediments but USEPA anticipates using a clamshell dredge for removal work and then stabilizing the sediments before they are hauled to final disposal. The USEPA project manager has been contacted for more detailed information with regard to dredging equipment, schedule, and productivity and current status but updated information has not been obtained to date. Commencement Bay, Washington Site Location This Superfund site consists of nine sub-sites located on the coast of the State of Washington where remedial dredging or capping has occurred or is planned for the future. The USEPA project manager for remediation in the Sitcum Waterway and for remediation of a hot spot within the Hylebos Waterway was contacted. Mechanical dredging was conducted in the Sitcum waterway previously but an environmental bucket (closed bucket) was not used. This project was completed in 1995 and was listed and summarized in Appendix A of the Hudson River FS report. Additional information was not obtained specifically for this sub-site since environmental dredging will be employed in the Hudson River. It was noted that water quality monitoring was conducted for heavy metals to verify that resuspsension levels were not exceeded during dredging within the Sitcum waterway. However, more details were not available from the USEPA manager contacted. Hylebos Waterway Hot Spot Dredging: Commencement Bay Site Background and Remedial Action Dredging work is expected to begin in October 2002 at a hot spot in the Hylebos Waterway. This dredging will be conducted with a Toyo pump. This equipment was selected instead of mechanical or hydraulic dredging equipment due to the nature of the contaminants. The sediment contains elevated levels of VOCs and it was thought that mechanical or hydraulic equipment would cause releases directly into the water column as the dredge makes its cut. The Toyo pump is submersed into the river bottom and simply sucks up the sediment directly into a pipeline with no turning motion. In addition, the Toyo pump was selected over a cutter head hydraulic dredge due to the high solids content in the pump effluent. Thus, a smaller water treatment system would be required on the other end of the operation. Another factor in selection of the Toyo pump was its low resuspension rate and high production rate. It was also noted that dredging is being conducted in the open without the deployment of silt barriers or sheet piling. The target production removal rate for this hot spot dredging is 600 cy/day with work expected to begin on October 1, 2002 and last for a duration of approximately 3 months. The only foreseeable problem/limiting factor in meeting the target removal rate as indicated by the USEPA project manager is sediment processing at the transfer facility.

Malcolm Pirnie/TAMS-Earth Tech 88 Peer Review Draft � October 2003
Engineering Performance Standards Appendix: Case Studies of Environmental Dredging Projects
Resuspension Monitoring Once dredging begins, TSS, DO, and metals will be monitored in the water column at the edge of the mixing zone and within the mixing zone. The mixing zone is a discrete area surrounding the dredge where environmental impacts are permitted. Typically, the mixing zone represents an area surrounding the dredge that is 300 feet from the dredge head (i.e., radius of 300 feet). Monitoring will be conducted near the dredge and 300 feet distant and downstream of the dredge, along the boundary of the mixing zone. Allowable resuspension levels were established based on allowable DO and turbidity surface water criteria and marine water quality standards for heavy metals as defined by State surface water regulations. The contingency plans to be put in effect if resuspension levels are unacceptably elevated are: (1) Decrease the rate of dredging; (2) Increase the size of the mixing zone (this would change the location where turbidity, DO, and metals are being measured in the water column to a distance farther from the dredge); and (3) Analyze the daily period in which the dredge/Toyo pump is operating and alter based on the tidal schedule since this waterway is tidal (thus dredge before and after tide changes but not during). Hylebos Waterway Full-Scale Removal: Commencement Bay Site Description A larger dredging project is planned for the Hylebos Waterway in 2003 and consists of removal of approximately 850,000 cy of PCB-, PAH-, metal- and organic-contaminated sediment. Removal operations are divided into two tasks or sub-projects for this waterway. The first task consists of removal of 400,000 cy beginning in the year 2003. USEPA anticipates the removal of 200,000 cy of sediment in the first dredge season (2003) followed by removal of the remainder of the sediment in the year 2004. Remedial Action Dredging for the first task is to be conducted with an open bucket, clamshell mechanical dredge. It was indicated that 90% of the design is complete for this part of the project. The second task, currently in the design phase, also consists of the removal of PCB-, PAH-, metal- and organic-contaminated sediment. The design is 30% complete at the current time (November 2002). The design is being completed by the dredge contractor, Bean, and the PRP. Dredging is expected to begin in July 2003. Sediments removed are to be disposed in a local landfill. It was explained that the design initially called for removal with a clamshell bucket with a two-foot tolerance with regard to meeting the required dredge cut. However, since local landfilling was selected as the final option for the handling of the dredged material, project personnel decided to minimize the amount of extra sediment removed to allow for disposal cost minimization. To accomplish this goal, a mechanical dredge with an environmental bucket that is

Malcolm Pirnie/TAMS-Earth Tech 89 Peer Review Draft � October 2003
Engineering Performance Standards Appendix: Case Studies of Environmental Dredging Projects
hydraulically controlled and has a digitized GPS system was selected, since it has been proven that this piece of equipment can meet the required dredge cut with a tolerance of one to two inches. It was indicated that the use of this equipment will reduce the dredged volume of sediment by 900-1,000 cy. Dredging will be completed in 50 x 50-foot dredge management units. It was stated that these dredge management areas are located in a narrow waterway that is 100 feet wide, on average. This section of the waterway is characterized by thick sedimentation and shoaling along the banks. Dredging is planned in a two-pass approach. The first pass will utilize a clamshell bucket to remove accumulated sediments along the banks and within the shoals. The second pass will be completed with the hydraulically controlled mechanical dredge described above. The two dredges are expected to be utilized simultaneously. Site cleanup levels were site-specific and established for each contaminant of concern. It was indicated that since issuance of the ROD and establishment of the site-specific cleanup standards, the State of Washington has established generic sediment cleanup criteria. The dredging construction season within the Hylebos Waterway consists of 6 months, due to constraints set by the Endangered Species Act. Project goals for the second task, utilizing the two pass dredge approach with the hydraulic excavator designed by Bean, include completing removal of 450,000 cy of material in one construction season. Bean has been brought on board for the design phase of this project to ensure this schedule is achieved. Dredging will consist of the following:
• Removal/active dredging 24 hours per day, 7 days per week
• 30-day allowance for down times associated with equipment repairs, repositioning, etc.
• 10 days assumed for project mobilization
• 10 days assumed for project demobilization
• 153 days of actual dredging to remove the 450,000 cy of contaminated sediment
This schedule currently meets a seven-month program. The contractor and the design group are currently evaluating ways to complete the project one month ahead of schedule. Once dredged sediment is removed from the Waterway, it is to be placed in barges and brought to a berthing area where the material will be unloaded from the barges and directly loaded into rail cars. It was explained that dewatering prior to placement in the rail cars is not required based on landfill requirements. The material is being disposed of at the Eastern Washington landfill. It was explained that this landfill is very dry and needs the extra water with regard to methane generation and/or control. Thus, the additional water entrained in the sediments will be accepted by the disposal facility. It was indicated that the land-based transfer site already has a rail spur to transport the wastes, thereby speeding project mobilization.

Malcolm Pirnie/TAMS-Earth Tech 90 Peer Review Draft � October 2003
Engineering Performance Standards Appendix: Case Studies of Environmental Dredging Projects
It is anticipated that Bean, along with the design group, will either add an additional dredge or increase the productivity, as possible, while meeting resuspension/water quality guidelines, to remove one month from the above described schedule and allow work to be completed in one construction season. Resuspension Monitoring Dredging will not be conducted in a contained area. The State of Washington regulates the majority of their dredging projects by use of an identified monitoring area called a mixing zone. The mixing zone establishes the boundary for water column monitoring. Typically the mixing zone consists of a 300-foot area surrounding the dredge. In this case, monitoring is conducted at the dredge head and at the limit of the mixing zone or 300 feet from the dredge. It should be noted that other dredge projects completed or in the planning phase utilize this concept of the 300-foot mixing zone. For this project, the USEPA project manager indicated that they are currently trying to get approval for the entire dredge area to be defined as the mixing zone. This is desired so that flexibility will exist with regard to the location of the dredge. Because dredging is planned in 50 x 50-foot areas and the Waterway is very narrow and utilized significantly by large ships, it is thought that the dredge will need to be repositioned periodically based on ship movements. It is anticipated that in the event the dredge needs to relocate, it will move to a different 50 x 50-foot dredge management area. Monitoring could continue at the perimeter of the entire dredge area as opposed to 300 feet from the dredge head. Generally, project personnel hope to use an adaptive management practice in the field with best management practices to ensure completion of the project in accordance with set residual and water quality guidelines. This would allow for continuous monitoring of all open areas. Water Quality concerns are focused around turbidity and dissolved oxygen levels for this project. The waterway currently has low dissolved oxygen concentrations and USEPA does not want the system to become further depressed as a result of dredging. Regarding turbidity, standards are being evaluated and will be set at either 50 NTU or 20 NTU over background levels. Background water quality levels are currently being established with sensors set up in the Waterway. Thea Foss, Wheeler and Osgood Waterway, Commencement Bay Site Background and Description The USEPA project manager for this sub-site was contacted with regard to dredging expected to begin in 2003. It was indicated that dredging is on schedule to begin in August 2003 and includes the removal of 525,000 cy of PAH-contaminated sediment. The project is currently in the conditional approval phase where the contractor is selecting the dredging equipment and preparing the construction work plan and associated technical specifications.

Malcolm Pirnie/TAMS-Earth Tech 91 Peer Review Draft � October 2003
Engineering Performance Standards Appendix: Case Studies of Environmental Dredging Projects
It is not known at this point if mechanical or hydraulic dredging equipment will be selected. However, it is thought that mechanical dredging equipment will be used. Resuspension will be monitored with a 300-ft mixing zone, as defined above. This monitoring will occur near the dredge and at a maximum distance of 300 ft from the dredge, based on the location of the dredge within the mixing zone. The resuspension monitoring plan (water quality monitoring plan) is currently being prepared. It was indicated that dredging is not being conducted �to �clean� sediment,� but that the required cleanup goal is equivalent to/dictated by allowable PAH concentrations in sediment promulgated by the State of Washington. Thus, dredging will be completed to levels below the authorization limit. Additional information was not available at this time since the project is still in the design phase. Wyckoff Company/Eagle Harbor, Washington and Pacific Sound Resources, Washington Site Location and Description This harbor area is located in Seattle, Washington and consists of contamination resulting from wood treatment and shipyard operations at industries located along the shore of the harbor. A 500-acre site was contaminated with 40,000 gallons of creosote, which resulted in PAH and heavy metal contamination in the harbor sediments. In 1994, 54 acres of the harbor were capped by USACE and USEPA. Capping was completed in the year 2001. Literature available for this site on the Internet stated that a portion of the harbor would be dredged. The USEPA project manager indicated that dredging was not done and that the entire contaminated area was capped. Since capping began, monitoring has revealed a return of benthic organisms and aquatic species that implies an improvement in the health of the aquatic water system. The remediation has been considered a success as a result of the return of the aquatic community. Portland Harbor, Oregon This site was added to the NPL (National Priorities List) on December 1, 2000 due to elevated levels of PCBs, metals, and petroleum products detected in harbor sediment. Currently, USEPA is performing the RI/Fs for this site. RI activities are expected to begin in Fall 2002. United Heckathorn, San Francisco Bay Site Location and Description The United Heckathorn Superfund Site is located in the Richmond Harbor area, an inlet of the San Francisco Bay. Approximately 15 acres of sediment are contaminated with DDT and dieldrin from past operations at the United Heckathorn facility. Operations at the United Heckathorn facility consisted of the receipt of technical grade pesticides from chemical manufacturers, grinding and mixing of these pesticides with other materials and packaging and final shipment off site. Documentation available from previous site visits while the facility was

Malcolm Pirnie/TAMS-Earth Tech 92 Peer Review Draft � October 2003
Engineering Performance Standards Appendix: Case Studies of Environmental Dredging Projects
in operation indicated that pesticides were observed to be leaking from drums and pipelines, and spilled during facility operations and waste discharges into the Lauritzen Channel. Site Characteristics
Remedial investigations (RI) conducted in 1994 determined that the contaminated sediment consisted of two geologic units: a younger bay mud consisting of very soft to soft clay, silt, and fine-grained sand with a high water content, which was overlying the older bay mud that consisted of dry, consolidated silts and clays with some sand. Sampling of the marine sediments indicated that the underlying older bay mud has not been affected by DDT and dieldrin contamination. Remedial Action The final selected remedy issued by USEPA for the contaminated marine sediments called for dredging of all soft bay mud from the Lauritzen Channel and the Parr Canal. The clean up goal in the sediments for DDT was established at 590 ug/kg. Following the completion of dredging, USEPA ordered the placement of six inches of clean fill and subsequent five year monitoring of water, biota, and sediment to verify the effectiveness of the remedy. The clean up goal of 590 ug/kg DDT in the sediment was based on the National Academy of Science action level for DDT in fish and to ensure protection of fish-eating birds, including endangered species. Dredging commenced in the Parr Canal, a shipping inlet, in August 1996. By the end of August 1996, a total volume of 2,620 cy of sediment was removed from the Parr Canal. A silt barrier was placed at the mouth of the canal to isolate this area from the Santa Fe Channel and ultimately the San Francisco Bay. The younger bay mud was removed with two excavators mounted on each side of the shore. The excavators worked in tandem northward toward the head of canal. Following completion of excavation, approximately 18 inches of clean sand was placed over the entire excavation area to promote vegetation re-growth and restore the ecosystem. DDT sediment concentrations decreased from 840 ug/kg to 200 ug/kg following dredging. Removal within the Lauritzen Channel, another shipping inlet, began in September 1996 and was carried out through March 1997 with the use of the Cable Arm bucket wherever possible. A silt curtain was placed at the mouth of the Lauritzen Channel and it was noted that the curtain was damaged and replaced multiple times throughout the course of the project. It was further indicated that dredging was suspended at times when the silt curtain was under repair. Generally, dredging was conducted from the outer to the inner part of the channel to minimize contamination of clean areas. A large problem encountered during dredging was the amount of buried debris. Debris including buried barges, storage tanks and cables along with approximately 187 tons of metal was

Malcolm Pirnie/TAMS-Earth Tech 93 Peer Review Draft � October 2003
Engineering Performance Standards Appendix: Case Studies of Environmental Dredging Projects
recovered. The amount of unexpected debris encountered resulted in damage to the dredging equipment and unexpected downtime and a low overall project productivity. Sediment removed from the channel was placed into barges and towed to the landside processing facility. Initially, the plan was to pump the sediment from the barge; however, the large amount of debris encountered resulted in broken pumps and made this system unpractical. As a result, the barges were unloaded with a clamshell bucket. Sediment was then dewatered with a stabilization agent that consisted of sodium silicate and Portland cement. Subsequently, the stabilized sediment was loaded into rail cars. It was noted that dredging was halted on numerous occasions due to rail car unavailability, which was a result of complications in tracking rail cars leaving the site for the ECDC facility in Utah. At the completion of dredging within the Lauritzen Channel, a total volume of 105,000 cy of sediment was removed and equated to approximately 3 tons of DDT. Pre-dredge DDT sediment concentrations were 47,000 ug/kg, on average, and following dredging the average DDT concentration was 263 ug/kg. The entire channel was backfilled with sand to a thickness of 18 inches. Backfill was placed underwater from a hydraulic pump. Residual Verification Activities Following completion of removal activities in the Lauritzen canal, a post-dredge survey and investigation was conducted to verify that all younger bay mud had been removed and that the new surface consisted of the older bay mud. Sediment samples were collected from the upper 10 cm of the sediment to verify that the DDT residual concentration of 590 ug/kg was achieved. Remote locations were found to exceed the 590 ug/kg DDT residual goal and to not have been dredged to the older bay mud. Subsequently, these areas were re-dredged and then backfilled. Post-Dredge Monitoring Following the completion of dredging, monitoring of water quality, sediment and biota was conducted. Sediment samples collected 4 months after completion of dredging indicated the deposition of fine silt and clay and an increase in DDT concentrations. A 40-fold difference/increase in DDT sediment concentrations was determined over this four-month period. This difference has been attributed to the transport and deposition of fine-grained contaminated sediment into the dredged area. In addition, post-dredge monitoring has revealed that sediment contamination is highest/hottest in deeper sediments. Sediment samples collected by USEPA at the completion of dredging represented the interval of 0-10 centimeters while sediment samples collected four months following dredging were collected from the interval 0-2 centimeters.

Malcolm Pirnie/TAMS-Earth Tech 94 Peer Review Draft � October 2003
Engineering Performance Standards Appendix: Case Studies of Environmental Dredging Projects
Results/Conclusions The remedial action implemented for the marine sediments as part of the United Heckathorn Superfund Site has been considered unsuccessful. It is thought that the lack of reduction in DDT concentrations over the entire dredge area over time is a result of incomplete dredging and removal of contaminated sediment. Due the presence of debris, docks, and pilings, not all areas were dredged as initially planned. These areas not dredged were capped with sand; however, the integrity of this cap was not tested, monitored or evaluated prior to placement. Sand as a capping material was planned for habitat restoration only, not contaminant immobilization. In addition, dredging was completed within the center of the channel but not along the banks where docks and pilings existed. This left a steep slope of contaminated sediment behind and it is thought that the placement of sand may not have been effective in covering this steep slope. As a result, contaminated sediments from these banks may be sloughing off into the center of the channel, resulting in the accumulation of fine-grained material over the sand cap and an increase in DDT sediment concentrations. 3. Hudson River Data Collection Hudson River water quality data provide the backdrop for evaluation of the impacts of dredging via resuspension. The data available must be used to assess the inherent variability in water quality conditions prior to any dredging operation so that the impacts of dredging, if any, can be quantitated. Dredging will add to the existing loads and concentrations in the water column but its magnitude will likely be of the same scale or smaller than the existing conditions. Thus, resolution of the dredging-related releases relies on knowing the underlying �baseline� condition well. Water quality data has been compiled for use in the performance standard development analyses. The data from the USEPA Hudson River Database, last released in October 2000 (USEPA, 2000) has been supplemented with new monitoring data. The June 2001 release of the General Electric (GE) data was used in place of the GE data in the October 2000 release. This will allow any changes that were made to the GE data since the version of the data that was included in the October 2000 release of the USEPA Hudson River Database to be reflected in these analyses. Discharge and water quality data have been requested from USGS, but because of the delay in receiving these data, the data available on the USGS website has been downloaded for use in the analyses. Finally, the most recent database release of fish monitoring data from the NYSDEC was selected for use in the data analysis. Descriptions of the data are given below.
Malcolm Pirnie/TAMS-Earth Tech 95 Peer Review Draft � October 2003
Engineering Performance Standards Appendix: Case Studies of Environmental Dredging Projects
Data Descriptions and Collection GE The dataset collected by General Electric for the water column-monitoring program is an important component of the analysis for the performance standard because it gives a measure of the contaminant variability in the river. Table 1 lists the range of dates for each of the monitoring locations and the number of analyses for each analyte. PCB congeners and water column measurements of total suspended solids are the parameters of interest. The latest database release from GE was used (GE, 2001). PCB congener data is available from April 1991 to May 2000. The largest number of samples was collected at the Thompson Island Dam station with 580 PCB congener analyses. The samples which were taken during construction activities near the GE plants prior to the implementation of effective source controls, may not be used in the analysis, however, there is still a substantial amount of data that can be used for the performance standards development.
USGS Flow USGS flow data will be used to calculate contaminant loads and determine the flow dependencies of contaminants in the water column. The data from the last release of the Hudson River database (USEPA, 2000) will be used and supplemented with data downloaded from the USGS website (USGS, 2002). Table 2 lists the number of flow measurements per year at each station. Data for the entire range of dates for PCB congener data (1991 to 2001) is available some of the water column monitoring stations including Fort Edward and Stillwater. The discharge rate for stations that are not monitored by the USGS will be estimated. This analysis will be included in the final report. NYSDEC Sediment NYSDEC has released a draft report of trace metals and dioxin contamination in the Hudson River (NYSDEC, 2001). This report has an analysis of six coring locations in the Upper Hudson. Table 3 lists the number of analyses per river mile. These high resolution cores were dated using cesium-137 concentrations, which allows the concentrations of the post-excavation sediments for these compounds to be examined relative to the concentration of the pre-excavation surface sediments and the average contamination in the sediments to be removed. NYSDEC Fish NYSDEC has a large set of fish concentration data from monitoring programs in the Hudson River. The latest release of the database from NYSDEC was reviewed (NYSDEC, 2002). This data will be used to get an indication of the non-PCB contaminant concentrations in the water column. Table 4 lists the number of measurements for parameters of interest for stations located in the Upper Hudson River. The most measurements are for mercury, which was measured at

Malcolm Pirnie/TAMS-Earth Tech 96 Peer Review Draft � October 2003
Engineering Performance Standards Appendix: Case Studies of Environmental Dredging Projects
almost all stations. There are measurements at some of the stations for a group of metals, with the exception of chromium and zinc. PCDD/Fs were measured in a smaller number of samples (2 to 9 measurements per station). 4. References BBL Environmental Services, Inc. 1996. St. Lawrence River Sediment Removal Project Remedial Action Completion Report, General Motors Powertrain, Massena, New York. Prepared for General Motors Powertrain. June 1996. BBL Environmental Sciences, Inc. 1995. Non-Time Critical Removal Action Documentation Report, Volume 1. Grasse River Study Area Massena, New York and Aluminum Company of America, Massena, New York. December 1995. Bechtel Associates Professional Corporation/Bechtel Environmental, Inc. 2002. Draft Interim Completion Report for the St. Lawrence River Remediation Project at the Alcoa, Inc., Massena East Smelter Plant, New York, Volume 1, Revision 0. Prepared for Alcoa. March 2002 Bechtel Environmental, Inc./Metcalf and Eddy, Inc. 2000. Final Dredging Program Design Report for the River Remediation Project at the Reynolds Metals Company, St. Lawrence Reduction Plant, Massena, New York, Revision 3. Prepared for Reynolds Metals Company. May 2000. Earth Tech, Inc. 2002. Grand Calumet River Section 401 Water Quality Certification Work Plan. Prepared for US. Steel. July 2002. Fox River Group, 2000. Fox River Dredging Demonstration Projects at Sediment Deposit N and Sediment Management Unit 56/57 Environmental Monitoring Report. Prepared by BBL Environmental Services. July 2000. General Electric (GE), 2001. Database Release. Personal communication from John Haggard (GE) to Ed Garvey (TAMS). June 2001. New York State Department of Environmental Conservation (NYSDEC). 2002. Draft Final Construction Certification Report, Cumberland Bay Sludge Bed Removal and Disposal Contract (OU1), April 1999 � July 2001. Prepared by Earth Tech, Latham, New York. April 2002. NYSDEC. 2002. Draft Report, Hudson River Sediment Consultation, Trace Metal and Dioxin Analyses of Dated Sediment Samples from the Upper Hudson River. Prepared by Edward Shuster, Richard Bopp and Erika Zamek, Rensselaer Polytechnic Institute, Department of Earth and Environmental Sciences, March 2002.
Malcolm Pirnie/TAMS-Earth Tech 97 Peer Review Draft � October 2003
Engineering Performance Standards Appendix: Case Studies of Environmental Dredging Projects
NYSDEC. 2002 Database Release. Personal communication from M. Keane (NYSDEC) to Ed Garvey (TAMS/Earth Tech). May 2002. Thibodeaux, Louis J. of the South and Southwest Center for Hazardous Waste Research Louisiana State University. 2000. The Effectiveness of Environmental Dredging: A Study of Three Sites Final Report. Prepared for Environmental Science and Technology Development Environmental Health Sciences Services North America ALCOA. January 2000. U. S. Army Corps of Engineers (USACE). 2001. Final Pre-Design Field Test Dredge Technology Evaluation Report, New Bedford Harbor Superfund Site, New Bedford, Massachusetts. Prepared by Foster Wheeler Environmental Corporation, Boston, Massachusetts. August 2001. Wisconsin Department of Natural Resources, 2000. Summary Report Fox River Deposit N. Prepared by Foth and Van Dyke. April 2000. Wisconsin Department of Natural Resources and Fox River Group of Companies. Final Summary Report Sediment Management Unit 56/57 Demonstration Project Fox River, Green Bay, Wisconsin. Prepared By Montgomery Watson. September 2001. Wisconsin Department of Natural Resources and United States Environmental Protection Agency, 2001. Final Report 2000 Sediment Management Unit 56/57 Project Lower Fox River, Green Bay, Wisconsin. Prepared by Fort James Corporation, Foth and Van Dyke and Hart Crowser, Inc. January 2001. United States Environmental Protection Agency (USEPA). 2000. Hudson River Database Release. October 2000. USGS. 2000. A Mass Balance Approach for Assessing PCN Movement during Remediation of a PCB-Contaminated deposit on the Fox River, Wisconsin. USGS Water-resources Investigations Report 00-4245, December. United States Geological Survey (USGS). 2002. Data downloaded from www.usgs.gov. September 2002.

Table 1. Case StudiesResidual Data for Case Studies
Summary of Post-Dredging SamplesNumber of Samples Location of Samples Method of sample
Location in FieldType of Samples Collected (depth, core, and grab)
Time of Collection
Goodness of Spatial Distribution Analysis
Black River, Ohio Removal of PAH contaminated sediment over a 1-mile stretch of river in 1989
No set quantitative goal; removal to be conducted to the hard shale bottom (removal of all sediment)
Data not available immediately following dredging; one year study performed 7-years after dredging (1997) consisted of 12 sampling locations
Not indicated immediately following dredging; for one year study (1997), samples located over 5-mile stretch of river near banks where depositional sediment is located with one upstream location for background
Not indicated Sediment Core samples for depth of 0 to 10 cm. Analyzed upper 2-cm for PAH and froze remainder for historical analysis if needed in the future
Not Known following dredging; one year study (1997) conducted in October 1997)
Not known- there was no figure provided to identify sampling locations
No set residual concentrations: PAH concentrations after dredging ranged from 1.6 to 3.7mg/kg.
PAH analyzed for sediment
Not stated in literature reviewed
Not stated if any residual sediment existed since all sediment removed to reveal the hard shale bottom
Hard shale rock bottom
Residuals not measured; dredged to hard shale bottom
Not Applicable; dredged to hard shale bottom
No backfill placed following dredging
Dredging to be completed to the hard shale bottom
None 1997 one year study analyzed sediment, overlying water, and biota- results indicated that dredging was a success. A greater toxicity was found in historic sediments however it is thought that deeper sediments are exposed during resuspension events resulting from storms, high flow and heavy boat traffic but levels are much lower than PAH levels measured prior to dredging.
Manistique River, Michigan
Removal of PCB contaminated sediment over 1.7 miles from 1995 to 1999. Dredging in 1995 was completed as a pilot study because EPA initially planned to cap hot spots however dredging proved successful and cost-effective ROD revised; Dredging from 1995-
10 ppm or less in sediment
Data provided for post-confirmation dredging conducted after 1997 dredge season- for this period, 10 samples collected; Following completion of dredging in 1999, FIELDS team collected 400 samples to verify 10ppm or less met throughout area
Literature reviewed did not indicate where 10 samples were located following dredging in 1997. For FIELDS study, 400 samples located throughout entire river and harbor in unaligned grid
Not indicated Sediment core sample collected from top 12-inches of sediment by FIELDS team
Not indicated in literature reviewed
Not know for 1997 sampling period; sampling by FIELDS team covered dredged area extensively
10ppm or less to be acceptable otherwise diver-assisted dredging occurred to remove residual to this level
PCB Aroclors Not stated in literature reviewed
Not stated- all residual removed with diver assisted dredging
Not stated sediment core sample from top 12-inches
Not stated No backfill placed following dredging
None stated Diver assisted dredging with suction pump
Pre-dredge sediment concentrations were 16.5ppm from 0-3inches; 77.5ppm from 3-24inches; 200ppm at depths greater than 24inches with an overall average of 85.5ppm; sampling following 1997 indicated sediment concentrations of 18.1ppm PCB (mean) and 7.2ppmPCB (median). Sediment data from the FIELDS team (1999) indicated an average site-wide PCB concentration of 7.06ppm with a 95% confidence interval from 4.40 to 9.72ppm.
Fox River: Kimberly, Wisconsin
Deposit N: Removal of PCB contaminated sediment from Nov. 1998 - Oct. 1999 (Phase I)
No set objective for post-dredge sediment bottom
30 Same as pre-dredge location; marked with a buoy; inside and outside the dredged area (within turbidity barrier as well as dredged area)
Collected both sediment core and grab samples to refusal
Not known See Figure 10: 10 samples on grid in eastern lobe and 20 samples on grid in western lobe
No set residual limit for project; not objective of the project
PCB Aroclors, mercury, TOC, particle size, density, and water content; 13 random samples analyzed for PCB congeners (10 samples during design/pre-dredge)
Silty-sand overlying native clay - characteristic of Fox River
Divers used to collect core samples to refusal; sample segmented to 0-4, 4-12, and 12-refusal; Ponar grab samplers used for thinner sediment layers
None stated None stated None
Fox River: Green Bay, Wisconsin
SMU 56/57 - Phase I- 1999
1 ppm PCBs to depths ranging from 2 to 16-feet
13 (although 38 pre-dredge samples collected in this area); targeted subunits where majority dredging occurred; attempted take post-dredge sample in same location as pre-dredge sample
Located within 100 x 100 ft grided subunits- sample taken from center of the area
Differential GPS used to mark pre-dredge core locations (within 5-ft) in subunits where dredging occurred
Collected sediment core samples to refusal (0-4,", 4-12", 1-ft sections to refusal);
Not known Sample locations associated with coordinates; in grid system; samples collected from center of each subunit (each subunit represents 100 x 100 sq. ft. area)
Set depth to dredge so all PCBs > 1ppm were targeted for removal; performed post-dredge survey and sampling at end of dredging
PCB Aroclors, mercury, density, TOC, %solids, and particle size
Lab Methods: PCBs (SW846 8082); mercury (SW846 7471A); % solids (SM 2540G Mod); TOC (SW846 9060M)
Silty-sand overlying native clay- characteristic of Fox River
Sampling tubes with 4-inch diameter Schedule 40 PVC manually pushed into sediment until refusal and then used sleeve hammer to drive tube a few more inches into firmer sediment
Four subunits required additional passes with dredge due to unacceptable PCB conc. from sample; conducted in 30 x 30 sq. ft. areas
None at this time; ultimately capped dredged area at conclusion of Phase II with 8-inches sand on average
Planned to re-dredge to remove any high residuals
None; Although dredging was halted due to winter, high residuals left behind since time not available to perform the clean-up pass as initially planned for (go back over entire dredge area at end and remove 6-inches of sediment)
Initially planned for a clean up pass following completion of production dredging to remove top 6-inches that may have been contaminated from any resuspended sediment that settled out
Analysis Conducted
Site Name and Location
Project Description and Year Work Conducted
Residual Target Clean-up Level
Acceptable Residual Concentrations
Thickness of Residual Sediment
Description of Bottom Layer (soft, rocky, etc.)
Sampling Technique to measure residuals (grab, core, probe)
Analytical Methods (Field and Lab)
Comments/Special Observations from Project
Number of Passes made to be meet acceptable residual level
Type of Backfill/capping, if any
Engineering Contingency Plan Implemented
Special Equipment Used to Reduce Residual Levels
Malcolm Pirnie/TAMS-Earth Tech Engineering Performance Standards Page 1 of 3
Peer Review Draft - October 2003Volume 4: Appendix: Case Studies of Environmental Dredging Projects

Table 1. Case StudiesResidual Data for Case Studies
Summary of Post-Dredging SamplesNumber of Samples Location of Samples Method of sample
Location in FieldType of Samples Collected (depth, core, and grab)
Time of Collection
Goodness of Spatial Distribution Analysis
Analysis Conducted
Site Name and Location
Project Description and Year Work Conducted
Residual Target Clean-up Level
Acceptable Residual Concentrations
Thickness of Residual Sediment
Description of Bottom Layer (soft, rocky, etc.)
Sampling Technique to measure residuals (grab, core, probe)
Analytical Methods (Field and Lab)
Comments/Special Observations from Project
Number of Passes made to be meet acceptable residual level
Type of Backfill/capping, if any
Engineering Contingency Plan Implemented
Special Equipment Used to Reduce Residual Levels
Fox River: Green Bay, Wisconsin
SMU 56/57 - Phase II- 2000
Remove sediment to verified post-dredge elevation and sample and if- (1) [PCB]<1 ppm complete; (2) [PCB] 1 ppm-10 ppm, place 6" sand; (3) [PCB] >10 ppm, re-dredge until [PCB] <10 ppm and then cap as above
28 Collected 5-samples from 25 cells located within each 100x100 sf area
Graphically displayed on site map; used 16-ft aluminum boat and anchored in location of subunit; used geodimeter with 360-degree prism to adjust boat into 0.1 ft of sample location
Measured water depth at each location with graduated rod with 1ft by 1ft plexi glass plate on bottom; then sediment sampled with a Wildco stainless steel hand corer with 2-inch diameter CAB core tubes ; collected homogenized sample from 0-4inches and 6-inch segments thereafter
Not known Divided each 100x100sf area into 25 cells, each 20 x 20 sf; used random number generator to determine one primary and four secondary units to be sampled
Remove PCBs to conc. 10 ppm or less; All post-dredge samples ranged from non-detect to 9.5 ppm PCB; 11 out of 28 samples (40%) < 1ppm PCB; 24 out of 28 samples (86%) < 4ppm PCB
PCBs Samples cut open with dremmel saw and homogenized in steel bowls with steel spoons and placed in lab jar for analysis; Lab used USEPA SW 846 reference method 8082 to measure samples for PCBs
Not stated in report Not stated in report however report indicated if clay present and post-dredge bathymetric survey indicated target depth not obtained, area not dredged anymore since clay native and all project data stated native clay not contaminated with PCB
Collected sediment cores with a Wildco stainless steel hand corer with 2-icnh diam. CAB core tubes
Residuals met after required depth sediment removed; 0 extra passes needed
13,500 cy of sand was placed at a range of 6-14 inches over the entire dredged area (8-inch on avg). More sand was placed in locations where PCB residual was greater. Placed with a clamshell from above water surface, used divers to assist in even placement; placed radially; verified depth of placement in minimum of 4-locations per subunit (100 x 100 sf area)
Residual conc. Set up so that backfill depth was dependent upon residual conc.; if residuals exceeded 10ppm, then re-dredging was required until a conc. <10ppm PCBs was reported
None
Reynolds Metals: St. Lawrence River, Massena. NY
Removal of PCB-contaminated sediment at Reynolds Metals Company from April 2001 through November 2001
removal of sediment containing greater than 1 ppm PCBs, 10 ppm PAHS, and 1 ppb PCDFs
A total of 532 immunoassay analyses and 566 lab analyses for PCB in sediment. 546 dredge passes in 268 cells. Verification samples were collected in the dredged cell after each dredge pass. Samples were also collected from "no-dredge cell" in order to verify that they were not impacted by nearby dredging.RMC collected samples from 43 dredge cells for PAH analyses and EPA sampled additional 53 cells for PAH analyses.A total of 32 final verification samples were collected for PCDF analyses.
Verification sampling locations in Area A and D were based on a triangular grid spacing of 70 ft; location in Area C were based on a triangular grid of 50 ft. The triangular grid was used to define contaminant baseline conditions in Areas A, B, and C in previous study.
It is mentioned in the Completion Report that the configuration of sampling grids was developed on the basis of earlier statistical studies and input from EPA (Bechtel, 1996). Is trying to obtain a copy of that report from Dino.
Verification samples were initiallycollected using a Ponar dredge sampler operated from the ATL sampling barge. The sampling technique was changed to the split-spoon method when it became apparent that the Ponar would not be able to generate samples representative of the 0-8 in. sediment interval.
The EMP stated that sampling will occur after "sufficient time" has elapsed to allow for settling of suspended solids, but does not specify a minimum time. Actually, some of the cells were dredged 3 days prior to sampling while other cells were dredged 2 days or 1 day prior. The redredging activities make the issue more complex than planned.
Sampling locations were obtained by digitizing Figure 3-46 in Completion Report. Thus, dataset is good for spatial analyses.
The remediation area was separated into three "evaluation areas". In each area, three conditions were required to complete the remediation requirements: (1) Requirements of the dredging procedures and flow sheet logic have been accomplished in all cells within the area;(2) The average PCB concentration of the area is less than or equal to 5 ppm, and (3) No individual grid within the area has PCB concentrations greater than 10 ppm.
PCB, PAHs and PCDFs
Immunoassay method for field d screening, in accordance with Method 4020 in EPA SW-846, using the EhviroGardTM PCB Soil Test Kit. PCB was analyzed in Alcoa Lab using SW-846 method 8082.
not stated in report Sediment overlays a till layer at depths of ranging from 1.5 to 30 ft below river bottom. Sediment above the till layer ranged from low blow count mud to relatively competent sand, gravel, and clay.
Multiple, maximum of 10, passes were made in some cells in order to meet the acceptable residual level, 134 cells were remediated on a single pass while 56 cells required 3 or more passes. Eleven cells were dredged 7 or more times. It was found that no improvement occurred on residual PCB concentration after 5 passes.
As stated in the plan, any cell with the residual concentration greater than 10 ppm are capped. The cap is consisted of 6" separation layer, 12" containment layer, and >9' armor and bioturbation layer. By 2001, only the separation (gravel) layer was placed. Dividing the total volume of gravel placed over the area, the average thickness of the gravel layer was calculated to be about 2.2 ft.
Geotextile is included as contingency measure to control sediment resuspension and mixing during capping. Given the absence of soft sediment in the area to be capped, the bottom was not covered by geotextile prior to placement of gravel.
The conventional rock bucket and hydraulic clamshell of the Cat 350 were used as alternative dredge to dig the more resistant hard bottom material and remove rocks and gravel.
Cleanup goals were not attained in several cells as the limits of the dredging technology (given site condition) were reached.
GM Massena: St. Lawrence River, Massena, NY
Removal of PCB-contaminated sediment at General Motors-Massena Superfund site from May (March) 1995 through December 1995 (January 1996). Dewatering and excavation of the cove area were not carried out as of the report date due to unsettled access issues.
1 ppm 113 See Fig. 2 6-inch core samples Minimum 24 hrs after finishing work at an area.
Core samples in areas exceeding 500 ppm: 50 ft x 50 ft grid; below 500 ppm: 70 ft x 70 ft
Average PCB conc.: 3 ppm Max.: 10 ppm (except for Quadrant 3 which was capped: avg.. 27 ppm max. 100 ppm)
Individual Aroclors EPA 8080 Sediments containinggravel, cobbles and large boulders at the bottom, underlain by glacial till.
Core and grab Typically 2 to 6 passes (perpendicular to the shore and sheet pile wall, advancing ~ 2-4 feet per minute, making a 3 to 12 inch-deep and 8-foot wide cut on each pass). 15 to 18 passes in Quadrants 1 and 3 to bring concentrations to below 500 ppm.
Sediment capping in Quadrant 3.
Malcolm Pirnie/TAMS-Earth Tech Engineering Performance Standards Page 2 of 3
Peer Review Draft - October 2003Volume 4: Appendix: Case Studies of Environmental Dredging Projects
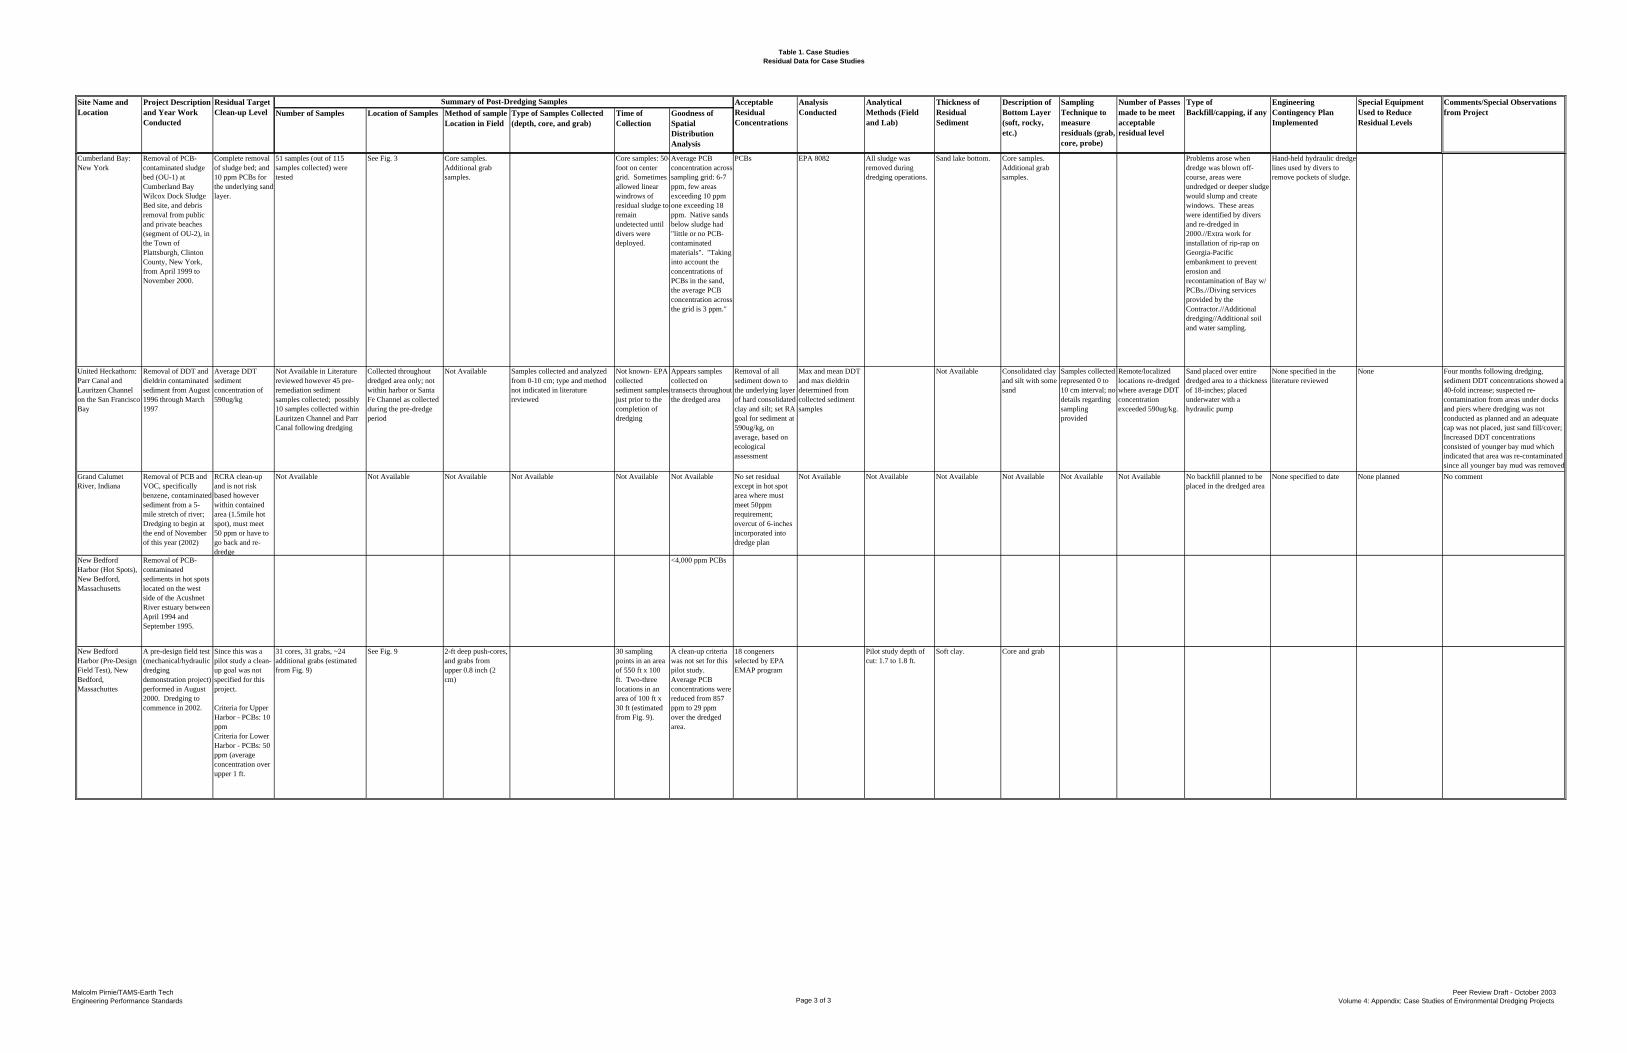
Table 1. Case StudiesResidual Data for Case Studies
Summary of Post-Dredging SamplesNumber of Samples Location of Samples Method of sample
Location in FieldType of Samples Collected (depth, core, and grab)
Time of Collection
Goodness of Spatial Distribution Analysis
Analysis Conducted
Site Name and Location
Project Description and Year Work Conducted
Residual Target Clean-up Level
Acceptable Residual Concentrations
Thickness of Residual Sediment
Description of Bottom Layer (soft, rocky, etc.)
Sampling Technique to measure residuals (grab, core, probe)
Analytical Methods (Field and Lab)
Comments/Special Observations from Project
Number of Passes made to be meet acceptable residual level
Type of Backfill/capping, if any
Engineering Contingency Plan Implemented
Special Equipment Used to Reduce Residual Levels
Cumberland Bay: New York
Removal of PCB-contaminated sludge bed (OU-1) at Cumberland Bay Wilcox Dock Sludge Bed site, and debris removal from public and private beaches (segment of OU-2), in the Town of Plattsburgh, Clinton County, New York, from April 1999 to November 2000.
Complete removal of sludge bed; and 10 ppm PCBs for the underlying sand layer.
51 samples (out of 115 samples collected) were tested
See Fig. 3 Core samples. Additional grab samples.
Core samples: 50-foot on center grid. Sometimes allowed linear windrows of residual sludge to remain undetected until divers were deployed.
Average PCB concentration across sampling grid: 6-7 ppm, few areas exceeding 10 ppm one exceeding 18 ppm. Native sands below sludge had "little or no PCB-contaminated materials". "Taking into account the concentrations of PCBs in the sand, the average PCB concentration across the grid is 3 ppm."
PCBs EPA 8082 All sludge was removed during dredging operations.
Sand lake bottom. Core samples. Additional grab samples.
Problems arose when dredge was blown off-course, areas were undredged or deeper sludge would slump and create windows. These areas were identified by divers and re-dredged in 2000.//Extra work for installation of rip-rap on Georgia-Pacific embankment to prevent erosion and recontamination of Bay w/ PCBs.//Diving services provided by the Contractor.//Additional dredging//Additional soil and water sampling.
Hand-held hydraulic dredge lines used by divers to remove pockets of sludge.
United Heckathorn: Parr Canal and Lauritzen Channel on the San Francisco Bay
Removal of DDT and dieldrin contaminated sediment from August 1996 through March 1997
Average DDT sediment concentration of 590ug/kg
Not Available in Literature reviewed however 45 pre-remediation sediment samples collected; possibly 10 samples collected within Lauritzen Channel and Parr Canal following dredging
Collected throughout dredged area only; not within harbor or Santa Fe Channel as collected during the pre-dredge period
Not Available Samples collected and analyzed from 0-10 cm; type and method not indicated in literature reviewed
Not known- EPA collected sediment samples just prior to the completion of dredging
Appears samples collected on transects throughout the dredged area
Removal of all sediment down to the underlying layer of hard consolidated clay and silt; set RA goal for sediment at 590ug/kg, on average, based on ecological assessment
Max and mean DDT and max dieldrin determined from collected sediment samples
Not Available Consolidated clay and silt with some sand
Samples collected represented 0 to 10 cm interval; no details regarding sampling provided
Remote/localized locations re-dredged where average DDT concentration exceeded 590ug/kg.
Sand placed over entire dredged area to a thickness of 18-inches; placed underwater with a hydraulic pump
None specified in the literature reviewed
None Four months following dredging, sediment DDT concentrations showed a 40-fold increase; suspected re-contamination from areas under docks and piers where dredging was not conducted as planned and an adequate cap was not placed, just sand fill/cover; Increased DDT concentrations consisted of younger bay mud which indicated that area was re-contaminated since all younger bay mud was removed
Grand Calumet River, Indiana
Removal of PCB and VOC, specifically benzene, contaminated sediment from a 5-mile stretch of river; Dredging to begin at the end of November of this year (2002)
RCRA clean-up and is not risk based however within contained area (1.5mile hot spot), must meet 50 ppm or have to go back and re-dredge
Not Available Not Available Not Available Not Available Not Available Not Available No set residual except in hot spot area where must meet 50ppm requirement; overcut of 6-inches incorporated into dredge plan
Not Available Not Available Not Available Not Available Not Available Not Available No backfill planned to be placed in the dredged area
None specified to date None planned No comment
New Bedford Harbor (Hot Spots), New Bedford, Massachusetts
Removal of PCB-contaminated sediments in hot spots located on the west side of the Acushnet River estuary between April 1994 and September 1995.
<4,000 ppm PCBs
New Bedford Harbor (Pre-Design Field Test), New Bedford, Massachuttes
A pre-design field test (mechanical/hydraulic dredging demonstration project) performed in August 2000. Dredging to commence in 2002.
Since this was a pilot study a clean-up goal was not specified for this project.
Criteria for Upper Harbor - PCBs: 10 ppmCriteria for Lower Harbor - PCBs: 50 ppm (average concentration over upper 1 ft.
31 cores, 31 grabs, ~24 additional grabs (estimated from Fig. 9)
See Fig. 9 2-ft deep push-cores, and grabs from upper 0.8 inch (2 cm)
30 sampling points in an area of 550 ft x 100 ft. Two-three locations in an area of 100 ft x 30 ft (estimated from Fig. 9).
A clean-up criteria was not set for this pilot study. Average PCB concentrations were reduced from 857 ppm to 29 ppm over the dredged area.
18 congeners selected by EPA EMAP program
Pilot study depth of cut: 1.7 to 1.8 ft.
Soft clay. Core and grab
Malcolm Pirnie/TAMS-Earth Tech Engineering Performance Standards Page 3 of 3
Peer Review Draft - October 2003Volume 4: Appendix: Case Studies of Environmental Dredging Projects

Table 2Summary of General Electric Water Column Data
Number of Samples for Each Analyte
Location
Ranges of Sample Collection Dates for
PCB CongenersPCB
Congeners
Total Dissolved
Solids
Total Organic Carbon
Total Organic Carbon
(Filtered)
Total Suspended Solids
B.F.Br 4/12/91 11/17/99 98 69 89 69 518BFI AREA 4/7/92 10/28/93 87 26 89BOATLAUNCH 12/11/96 5/10/00 158 160HRM 194.2E 4/22/92 4/4/00 58 5 60HRM 196.8 3/18/92 9/4/96 152 208PLUNGEPOOL 7/10/96 11/3/99 145 186Rt.197 Br. 4/5/91 4/26/00 391 133 154 135 622Rt.29 Br. 4/5/91 5/10/00 219 65 85 68 250Rt.4 Br. 4/5/91 6/18/92 90 135 151 137 154S.W.Br. 4/5/91 6/18/92 58 69 88 72 88TID-PRW2 10/9/97 5/10/00 112 121TID-WEST 4/5/91 5/10/00 570 135 158 135 633
Malcolm Pirnie/TAMS-Earth TechEngineering Performance Standards
Peer Review Draft - October 2003 Volume 4: Appendix: Case Studies of Environmental Dredging Projects

Table 3USGS Discharge Number of Measurements by Year
Stations 1991 1992 1993 1994 1995 1996 1997 1998 1999 2000 2001 2002BOND 0 0 0 0 0 0 0 0 0 0 0 0CORINTH 92 274 0 92 365 366 347 21 0 0 0 0FTEDWD 365 366 365 365 365 366 365 365 365 355 324 245GREENIS 365 253 365 365 358 358 265 74 15 47 0 0HADLEY 0 92 273 92 365 366 353 365 365 345 365 240HOOSIC 365 366 365 365 365 359 337 365 365 366 365 92KAYADER 365 366 365 365 90 0 0 0 0 0 0 0LHPETER 365 366 365 365 365 283 358 11 0 0 0 0LOCK1 365 366 365 365 365 274 30 363 365 245 37 108MOHAWK 92 366 365 365 365 364 365 365 365 366 365 245SACANDAGA 92 274 0 92 365 366 358 365 365 366 365 245SCHUYLER 0 0 0 0 0 0 0 0 0 0 0 0STILLWATER 365 366 365 365 365 366 365 365 365 366 273 0BATTENKILL 0 0 0 0 0 0 0 275 365 366 365 245GLOWWN 365 366 365 365 365 366 365 365 365 366 273 0WATERFD 365 366 365 365 365 366 365 365 365 366 365 245
Malcolm Pirnie/TAMS-Earth TechEngineering Performance Standards
Peer Review Draft - October 2003Volume 4: Appendix: Case Studies of Environmental Dredging Projects

Table 4NYSDEC Metals and Dioxin Cores Number of Measurements
River Mile Number of Samples for Each AnalyteCopper Cadmium Lead Zinc Chromium Mercury PCDD/F
202.7 and 202.8 11 11 11 11 0 3 3193.8 21 21 21 21 0 0 0188.5 26 24 24 26 21 0 0188.6 9 9 9 9 9 3 13177.6 0 0 0 0 0 0 6163.6 37 44 44 39 39 4 12
152.6 and 157.7 32 35 35 29 29 3 9
Malcolm Pirnie/TAMS-Earth TechEngineering Performance Standards
Peer Review Draft - October 2003Volume 4: Appendix: Case Studies of Environmental Dredging Projects

Table 5NYSDEC Biota Number of Samples with Measurement for Metals and Dioxins
Station RM Cd Cr Cu Pb Hg Zn Ni PCDD/FWaterford 155.1 59Below Lock Campbell Island 157.6 14 3Stillwater Above Lock C4 West Side Near Admls Marina 167.7 36 3Stillwater East Side Just Above Lock C4 167.7 31Saratoga NHS Property 172.6 5 5 5 5Stillwater-Coveville 176 8 85 6Coveville Channel Area 176.2 8 8 8Coveville Marsh Area 176.7 20 20 20Rt 4 Near Coveville-Roadside 176.7 2 2 2Fort Miller 185.1 2Thompson Island 187.6 8Griffin Island / Saratoga Co. 189.1 3 109 9Griffin Island East Side Of River 189.4 51Special Area 13 Boat Launch Ramp @ W River Rd Marina 192.7 5 5 5 5Fort Edward Below GE 193.3 25Remnant 4 0.2 Miles Upstream From North End Of Deposit 195.3 5 5 5 5Bakers Falls 196 4Ciba-Geigy Plant At Station 2 197.1 4 4 4 4 4Ciba-Geigy Plant At Station 3 197.2 10 10 10 10 10Ciba-Geigy Plant At Station 4 197.3 3 3 3 3 3Ciba-Geigy Plant At Station 6 197.4 6 6 6 6 6Ciba-Geigy Plant At Station 7 197.5 15 15 15 15 15Ciba-Geigy Plant At Station 8 197.6 2 2 2 2 2Glens Falls 198.1 7Ciba-Geigy Plant At Station 1 198.2 19 19 19 19 19Ciba-Geigy Plant At Station 5 198.3 22 22 22 22 22Below Feeder Dam 200 22Above Feeder Dam 201.1 5 132 2Above Feeder (Ciba Control) 201.3 14 14 14 14 14Sherman Isl Pool Near Water Intake, Above Dam - Loc #3 209.5 16Queensbury At Site - Location #1 210 30Sherman Isl Pool, Across River Fr. Qnsbry Site - Loc #2 210.1 33Above Spier Falls Dam (Sfa) = Spier Falls Pool 211 16Below Boat Launch - Sherman Isl Pool - Loc #4 211.2 11Above Boat Launch - Sherman Isl Pool - Loc #5 212 15Below Luzerne State Boat Launch 219 44Lake Luzerne 222 10North Creek 259 4Blue Ledge 273 20
Malcolm Pirnie/TAMS-Earth TechEngineering Performance Standards
Peer Review Draft - October 2003Volume 4: Appendix: Case Studies of Environmental Dredging Projects

Malcolm Pirnie/TAMS-Earth Tech Peer Review Draft – October 2003Engineering Performance Standards Volume 4: Appendix: Case Studies of Environmental Dredging Projects
Note: Figure is from BBL Environmental Services, Inc. 1996. St. Lawrence River Sediment Removal Project Remedial Action
Completion Report, General Motors Powertrain, Massena, New York. Prepared for General Motors Powertrain. June 1996.
Figure 1. GM Massena Post-Dredging Isopleths

Malcolm Pirnie/TAMS-Earth Tech Peer Review Draft – October 2003Engineering Performance Standards Volume 4: Appendix: Case Studies of Environmental Dredging Projects
Note: Figure is from BBL Environmental Services, Inc. 1996. St. Lawrence River Sediment Removal Project Remedial Action
Completion Report, General Motors Powertrain, Massena, New York. Prepared for General Motors Powertrain. June 1996.
Figure 2. GM Massena Final Sediment Sampling Analytical Results – Dry Weight

Malcolm Pirnie/TAMS-Earth Tech Peer Review Draft – October 2003Engineering Performance Standards Volume 4: Appendix: Case Studies of Environmental Dredging Projects
Note: Figure is from New York State Department of Environmental Conservation (NYSDEC). 2002. Draft Final Construction
Certification Report, Cumberland Bay Sludge Bed Removal and Disposal Contract (OU1), April 1999-July 2001. Prepared by Earth Tech, Latham, New York. April 2002.
Figure 3. Cumberland Bay Pre-/Post –Operations Soil Sampling Locations, East Side – Wilcox Dock

Malcolm Pirnie/TAMS-Earth Tech Peer Review Draft – October 2003Engineering Performance Standards Volume 4: Appendix: Case Studies of Environmental Dredging Projects
Note: Figure is from New York State Department of Environmental Conservation (NYSDEC). 2002. Draft Final Construction
Certification Report, Cumberland Bay Sludge Bed Removal and Disposal Contract (OU1), April 1999-July 2001. Prepared by Earth Tech, Latham, New York. April 2002.
Figure 4. Cumberland Bay Work Areas and 1999 Work Zones

Malcolm Pirnie/TAMS-Earth Tech Peer Review Draft – October 2003Engineering Performance Standards Volume 4: Appendix: Case Studies of Environmental Dredging Projects
Note: Figure is from New York State Department of Environmental Conservation (NYSDEC). 2002. Draft Final Construction
Certification Report, Cumberland Bay Sludge Bed Removal and Disposal Contract (OU1), April 1999-July 2001. Prepared by Earth Tech, Latham, New York. April 2002.
Figure 5. Cumberland Bay Work Areas and 2000 Work Zones

Malcolm Pirnie/TAMS-Earth Tech Peer Review Draft – October 2003Engineering Performance Standards Volume 4: Appendix: Case Studies of Environmental Dredging Projects
Note: Figure is from New York State Department of Environmental Conservation (NYSDEC). 2002. Draft Final Construction
Certification Report, Cumberland Bay Sludge Bed Removal and Disposal Contract (OU1), April 1999-July 2001. Prepared by Earth Tech, Latham, New York. April 2002.
Figure 6. Cumberland Bay Phase IV Core Samples Results

Malcolm Pirnie/TAMS-Earth Tech Peer Review Draft – October 2003Engineering Performance Standards Volume 4: Appendix: Case Studies of Environmental Dredging Projects
Note: Figure is from U.S. Army Corps of Engineers (USACE). 2001. Final Pre-Design Field Test Dredge Technology Evaluation
Report, New Bedford Harbor Superfund Site, New Bedford, Massachusetts. Prepared by Foster Wheeler Environmental Corporation, Boston, Massachusetts. August 2001.
Figure 7. New Bedford Harbor Site Location Map

Malcolm Pirnie/TAMS-Earth Tech Peer Review Draft – October 2003Engineering Performance Standards Volume 4: Appendix: Case Studies of Environmental Dredging Projects
Note: Figure is from U.S. Army Corps of Engineers (USACE). 2001. Final Pre-Design Field Test Dredge Technology Evaluation
Report, New Bedford Harbor Superfund Site, New Bedford, Massachusetts. Prepared by Foster Wheeler Environmental Corporation, Boston, Massachusetts. August 2001.
Figure 8. New Bedford Harbor Monitoring Stations
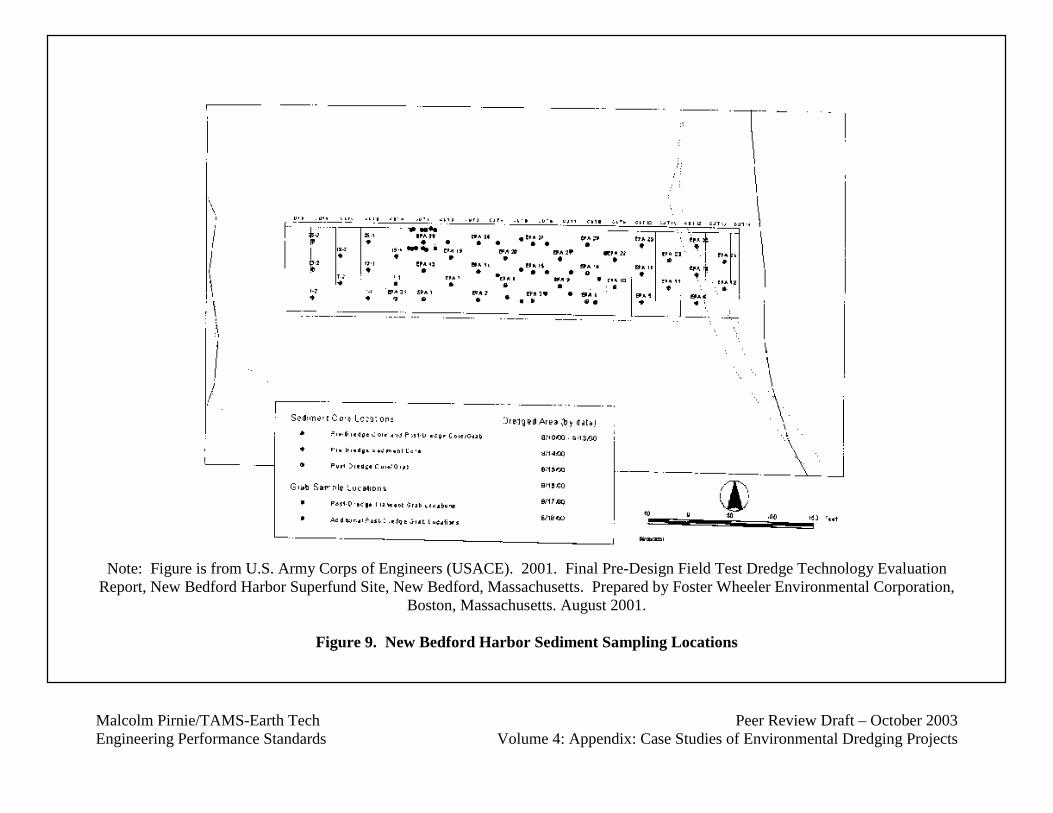
Malcolm Pirnie/TAMS-Earth Tech Peer Review Draft – October 2003Engineering Performance Standards Volume 4: Appendix: Case Studies of Environmental Dredging Projects
Note: Figure is from U.S. Army Corps of Engineers (USACE). 2001. Final Pre-Design Field Test Dredge Technology Evaluation
Report, New Bedford Harbor Superfund Site, New Bedford, Massachusetts. Prepared by Foster Wheeler Environmental Corporation, Boston, Massachusetts. August 2001.
Figure 9. New Bedford Harbor Sediment Sampling Locations

Malcolm Pirnie/TAMS-Earth Tech Peer Review Draft – October 2003Engineering Performance Standards Volume 4: Appendix: Case Studies of Environmental Dredging Projects
U.S. Army Corps of Engineers (USACE). 2001. Final Pre-Design Field Test Dredge Technology Evaluation Report, New Bedford
Harbor Superfund Site, New Bedford, Massachusetts. Prepared by Foster Wheeler Environmental Corporation, Boston, Massachusetts. August 2001.
Figure 10. New Bedford Harbor Pre-Design Field Test Dredge Test Area

Malcolm Pirnie/TAMS-Earth Tech Peer Review Draft – October 2003Engineering Performance Standards Volume 4: Appendix: Case Studies of Environmental Dredging Projects
Note: Figure is from Grand Calumet Section 401 Water Quality Certification Work Plan. July 2002.
Prepared for US Steel Corporation. Prepared by Earth Tech, Inc. 2002.
Figure 11. Grand Calumet Water Quality Sampling Sites

Malcolm Pirnie/TAMS-Earth Tech Peer Review Draft – October 2003Engineering Performance Standards Volume 4: Appendix: Case Studies of Environmental Dredging Projects
Wisconsin Department of Natural Resources, 2000. Summary Report Fox River Deposit N. Prepared by Foth and Van Dyke. April 2000.
Figure 12. Fox River Deposition N PCB Mass – Phase I (Postdredge) IDW

Malcolm Pirnie/TAMS-Earth Tech Peer Review Draft – October 2003Engineering Performance Standards Volume 4: Appendix: Case Studies of Environmental Dredging Projects
Note: Figure is from Wisconsin Department of Natural Resources and United States Environmental Protection Agency, 2001. Final
Report 2000 Sediment Management Unit 56/57 Project Lower Fox River, Green Bay, Wisconsin. Prepared by Fort James Corporation, Foth & Van Dyke and Hart Crowser, Inc. January 2001.
Figure 13. Fox River SMU 56/57Post-Dredge Sediment Sampling Results