part 1: how to construct a podium ... type of presentation that is expected 2) who you are...
TRANSCRIPT

PART 1: HOW TO
CONSTRUCT A PODIUM
PRESENTATION USING POWERPOINT
Vanderbilt University Medical Center Nursing Research Office

Objective
The objective of this presentation is to
outline steps for creating an effective
podium presentation.
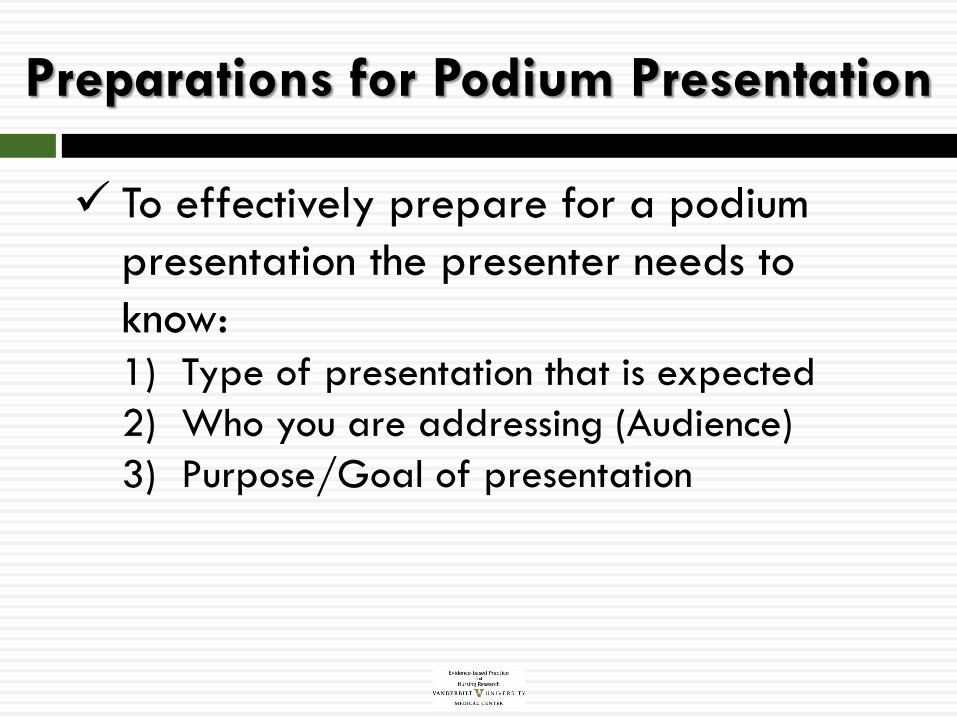
Preparations for Podium Presentation
To effectively prepare for a podium
presentation the presenter needs to
know: 1) Type of presentation that is expected
2) Who you are addressing (Audience)
3) Purpose/Goal of presentation
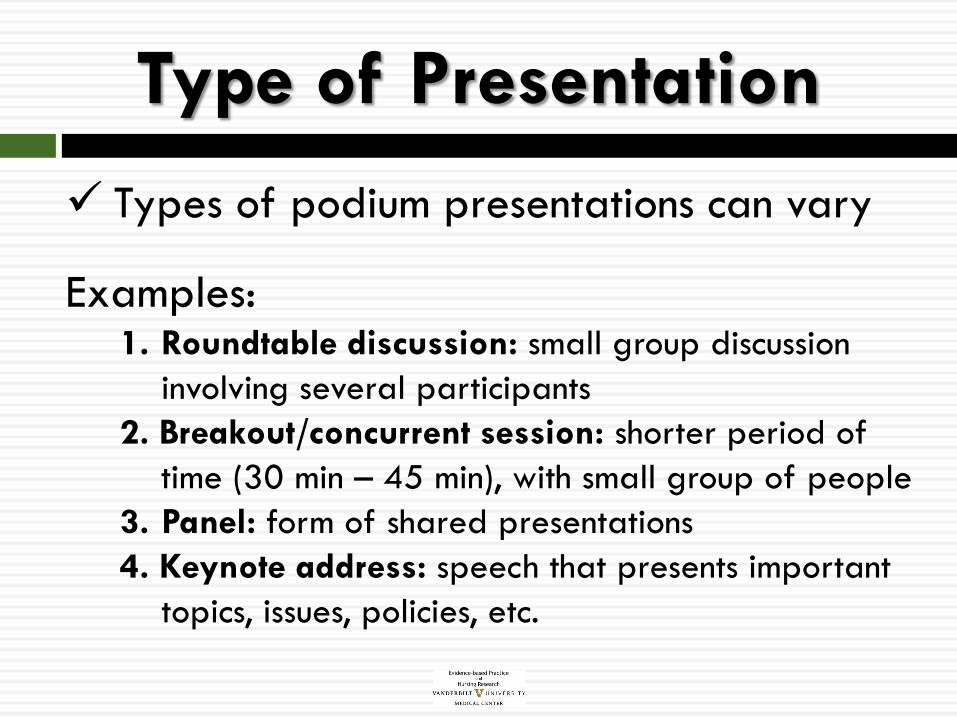
Type of Presentation
Types of podium presentations can vary
Examples: 1. Roundtable discussion: small group discussion
involving several participants
2. Breakout/concurrent session: shorter period of
time (30 min – 45 min), with small group of people
3. Panel: form of shared presentations
4. Keynote address: speech that presents important
topics, issues, policies, etc.

Type of Presentation (cont.)
Consider the type of presentation when
preparing your materials. PowerPoint slides – would be appropriate for a
keynote address or breakout session
Handouts – might be helpful for a roundtable or
panel discussion
Audience
Know who you are addressing:
Examples: Staff nurses, administrators, nurse
practitioners, legislators, or physicians
Presentation needs to be relevant to
your audience

Where to Start
Objectives of presentation
Outline of presentation
PowerPoint layout (if applicable)
Font (if applicable)
Things to consider

Objectives
Identify the objective(s) of your
presentation:
- What do you want the audience to get out
of your presentation?
- Use action verbs
- 25 words or less
- One or two points
- Keep simple
Objectives (cont.)
Examples:
- Identify the process for choosing co-
authors.
- Develop a manuscript that is suitable for
publication in a professional journal.
- Create an online survey using the
REDCap survey tool.

Outline of Presentation
Develop an outline of the information you
will present.
Check presentation guidelines/instructions
if provided with your acceptance letter.
Identify the topics you want to address
and a few points for each topic.

1 slide for every minute (Example: 15 slides for a 15 minute presentation)
Topic Number
of Slides
Notes
Title 1 • Title of presentation
• Name and title
• Organization
Acknowledgement (if
needed)
1 • Placed at the beginning or end
Background 1 • A few words about the content of work
• Statement of hypothesis
Purpose 1 • Primary aim of research
Methods 1-3 • Study design
• Measures
• Sample(s)
Results 4-6 • Key variables
• Descriptive results
• Hypothesis-Testing
Conclusion 1-2 • Limitations
• Important findings
• Provide websites and/or resources
Future 1 • Next steps
Example Outline For Research Study
Note: Allow 1 minute per slide.

PowerPoint Layout
VUMC templates can be downloaded
from the Interactive, Web and Design
website
Contrasting colors (light background with
dark text)
Avoid yellow background color

Font
Font that is easy to read:
- Arial
- Times New Roman - Courier
Avoid red text
Do not use all CAPTIAL LETTERS
Use the same font throughout your
presentation

Font (cont.)
Bigger is Better
44 pt. – title lines
32 pt. – major text
28 pt. – minor text
Things to Consider
Use short phrases, not full sentences
Use bullet points
No more than 5 points per slide
No more than 7 words per line
When presenting data use graphs

Things to Consider (cont.) Do not include everything you plan to say on your slides. Only list main
points/ideas that you plan to speak about.
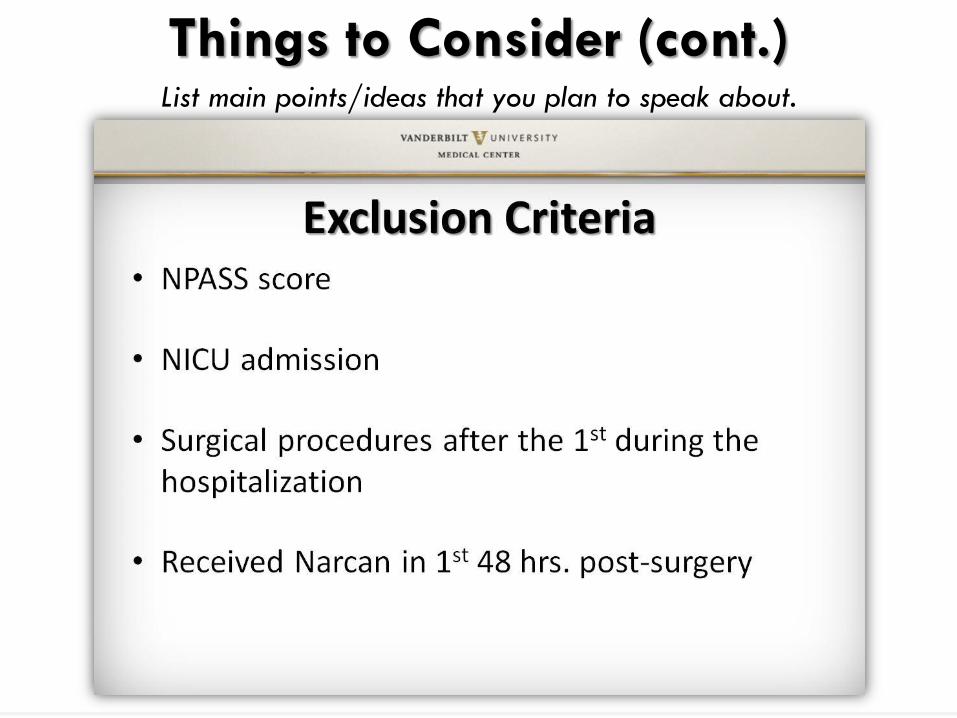
Things to Consider (cont.) List main points/ideas that you plan to speak about.
Graphics
Graphs
Charts
Photographs

Graphs
Bar graph:
comparing 2 or 3
groups
Line graph:
displaying change
over time
0
2
4
6
8
10
Jan Feb Mar Apr May Jun Jul Aug Sep Oct Nov Dec
PICO Questions (submitted through website)
2011
2012
2013

Charts
Pie chart: represent
numerical
proportions of the
“whole”
Scatter chart:
relationship between
two variables
Relationship Between Re-assessment & Pain Relief
No, 10%
Yes, 90%
Accessed VPNPP Website
(N = 80)

Things to Consider
Use colors that are bold and clear
Use colors consistently
Example: Yes = green; No = black on all data slides
Use large font for titles
Mark axes clearly
Use legends

Photographs
Only use high quality photos
Choose photos that are in focus
Photos that include patients can only be
used if you obtained a consent from the
patient.

Next Steps
If you need assistance with your PowerPoint
slides or the outline of your presentation we can
help:
Nursing Research Office
S-2413 MCN
3.2992
www.VanderbiltNursingEBP.com
After your slides are constructed see:
Part 2: Podium Presentation Skills
References
1) Houser, J. (2012). Communicating Research Findings, In
Nursing Research: Reading, Using, and Creating Evidence (2nd
ed.). Sudbury, MA.
2) Zerwic, J.J., Grandfield, K., Kavanaugh, K. et al. Tips for
Better Visual Elements in Poster and Podium Presentations.
Educ Health (Abingdon), 23(2), 267.