parrotfish population from the marianas islands, with a of ... · parrotfish population dynamics...
TRANSCRIPT

`
Parrotfish population dynamics from the Marianas Islands, with a
description of the demographic and reproductive characteristics of
Chlorurus sordidus
Final Report to the Western Pacific Regional Fishery Management Council
J.L. McILwain, Ph.D and B.M. Taylor, MSc
University of Guam Marine Lab, Mangilao, Guam,
Submitted 31 March 2009
Photo credit: M
ark Priest

`
Table of Contents FIGURES...................................................................................................................................................3
TABLES.................................................................................................................................................3
Acknowledgements.............................................................................................................................4
INTRODUCTION.......................................................................................................................................5
Objectives............................................................................................................................................6
MATERIALS AND METHOD......................................................................................................................7
Sampling methods ..............................................................................................................................7
Otolith processing and validation ...........................................................................................................7
Reproductive determination...................................................................................................................8
Microscopic .....................................................................................................................................8
Abundance estimates .............................................................................................................................8
Creel Survey Data................................................................................................................................9
Data analysis ...........................................................................................................................................9
RESULTS ................................................................................................................................................18
Age and Growth ................................................................................................................................18
Comparison of size structure between visual census and biological samples .............................18
Length weight relationships..........................................................................................................18
Otolith interpretation and relationship with age .........................................................................18
Age distributions ...........................................................................................................................18
Growth Models .............................................................................................................................19
Mortality estimates.......................................................................................................................19
Reproduction ....................................................................................................................................19
Gonad stages.................................................................................................................................19
Maturation and sex change ..........................................................................................................20
Reproductive potential .................................................................................................................20
Distribution and Abundance .............................................................................................................20
Size distribution of Chlorurus sordidus.........................................................................................20
Biomass of Chlorurus sordidus .....................................................................................................21
Patterns of abundance and other variables..................................................................................21
Abundance of other parrotfish species.........................................................................................21
Creel survey data ..............................................................................................................................22
DISCUSSION...........................................................................................................................................58
REFERENCES ..........................................................................................................................................60

Final Report – Parrotfish Population Dynamics
FIGURES 1. Photo of Chlorurus sordidus terminal and initial phase adults 2. Location of study sites where collections of Chlorurus sordidus took place 3. Location of study sites where visual surveys of parrotfish were conducted 4. Size frequency distributions of UVC vs collections 5. Sections of sagittal otoliths of Chlororus sordidus 6. Relationship between otolith weight and age 7. Age frequency distributions for Guam and Saipan 8. Age frequency distribution of C.sordidus inside and outside the Marine Preserves 9. VBGF curves fitted to C.sordidus length‐at‐age data 10. Age‐based catch curves C.sordidus 11. Micrographs of histological preparations for male and female C.sordidus 12. Maturation schedules for female C.sordidus 13. Size at sex change for C.sordidus 14. Total spawner biomass at all Guam sites 15. Relationship between ovary weight and length 16. Mean cumulative GSI for mature active C.sordidus 17. Gonad weight by length for primary and secondary males 18. Mean gonad weight for IP (Primary), TP (Primary) and TP (Secondary males) 19. Size frequency distributions among reef slope zones 20. Size frequency distributions of C.sordidus from the east and west coasts of Guam 21. Size frequency distributions of C.sordidus among sites around Guam 22. Size frequency distributions of C.sordidus among sites around Rota 23. Size frequency distributions of C.sordidus among sites around Saipan 24. Mean size of C.sordidus from Guam, Rota and Saipan 25. Mean biomass of C.sordidus from Guam, Rota and Saipan 26. Size frequency distributions grouped across Marine Preserves 27. Abundance of parrotfish >40 cm at all sites 28. NMDS plots of total parrotfish abundance by a) exposure and b) protection
TABLES 1. Sites where samples of C.sordidus were taken 2. Development stages using macrostaging techniques 3. Development stages using histological techniques 4. Sites where visual census took place 5. Results of the length/weight relationship for C.sordidus 6. Results of otolith weight/age relationship for C.sordidus 7. Summary of VBGF parameters 8. Summary of mortality estimates 9. Distribution of C.sordidus by size class 10. Matrix comparing macro and microstaging of gonads 11. Results of Multiple Regression Analysis 12. Summary of parrotfish abundance around Guam, Rota and Saipan 13. Ratio of IP to TP C.sordidus at each survey site 14. Change in mean size for select parrotfish species on Guam

Final Report – Parrotfish Population Dynamics
Acknowledgements Special thanks to the technical support provided by Jo Cummings and Jason Miller, both of whom drove the UOG Marine Lab boats and helped with the collections on Guam. The Coastal Resources Management team on Saipan in particular John Starmer helped enormously with logistics support for field work on Rota and Saipan. Special thanks to Mark “Sparky” Priest for access to the photos used in this report and help with the collections.

Final Report – Parrotfish Population Dynamics
INTRODUCTION Parrotfish (family Scaridae) are an important group of fish both from a commercial and ecological perspective. As well as supporting numerous artisanal and commercial fisheries worldwide, parrotfish play a critical role in the food chain of coral reef ecosystems. They have been implicated in several important processes on reefs by providing the link for energy flow to other reef consumers, as well as influencing the distribution and rates of production of marine plats (Choat 1991). More recently it has been realised large bodied parrotfish like Chlorurus microrhinos are important to bioerosion on coral reefs, and have been shown to be a critical factor in determining the rate of sedimentation in the Indo‐Pacific (Bellwood 1995; Alwany et al. 2009). Numerous exclusion experiments have also demonstrated their importance in exerting top‐down control on the standing stock of algae (Mumby et al. 2006). In a system where parrotfish are unexploited, a substantial part of the reef is permanently grazed by scraping dead coral surfaces thereby facilitating settlement of scleractinian corals (Mumby et al. 2006; Lokrantz et al 2008). However when overfishing of these important grazers occurs, biomass of macroalgae increases dramatically causing a phase shift towards algal dominated reefs. In the absence of fishing an increase in grazing pressure allows for the regeneration and maintenance of these same reefs (Bellwood et al. 2004). Understanding population processes in coral reef fisheries is critical to both life history studies and fisheries managers (Gust et al. 2002). Implicit in these processes is an improved knowledge of demographic variation within a population. After more than two decades of dedicated research on reef fish demographics, it is well documented that most species deposit regular increments on their otoliths which can be used to infer size at age (Choat and Robertson 1975; Choat et al. 1996). As our understanding of reef fish demographics improves, multiscale differences are becoming apparent at distances spanning latitudinal gradients (Adams et al. 2000; Choat and Roberson 2001; Choat et al. 2003; Williams et al. 2004) to distances of tens of kilometres (Gust, 2004). Such differences can be attributed to anthropogenic influences (e.g. fishing, Adams et al. 2000; Williams et al. 2004) or different biological processes (Gust et al. 2002). Quantifying these demographic differences (regardless of scale) is becoming increasingly important due to the increased interest in using spatial closures and MPA’s as a reef fisheries management tool (Russ, 2002; Williams, 2003). In implementing such tools, the assumption that life‐histories are homogeneous across populations could lead to spurious yield estimates. Chlrorus sordidus is reportedly one of the most abundant and widespread scarid species throughout the Indo‐Pacific (Randall et al 1990). It occupies a variety of habitat types although prefers the shallow slopes of coral reefs (Bellwood and Choat 1985). Like many labroid fishes that are dichromatic, there are distinct colour patterns representing initial and terminal phases (Robertson and Choat 1975). Chlororus sordidus feeds by excavating the substrate and therefore belongs to the small group of functional “excavators”, which also include C.microrhinos (Bellwood 1995). Both large and small scale demographic differences have been observed in this species. On outer‐shelf reefs of the Great Barrier Reef, C.sordidus had reduced life spans and lower size at age profiles compared with adjacent mid‐shelf reefs less than 20 km apart (Gust et al. 2002). Larger, longitudinal differences on

Final Report – Parrotfish Population Dynamics
both sides of the equator mimic these patterns. For example along the Western Australian coast, longevity and size at age in C.sordidus increases with increasing distance away from the equator (J.Choat unpub. data). a) b)
Figure 1: Photo of Chlorurus sordidus a) terminal phase and b) initial phase (Photo: M.Priest)
Objectives In the past 15 years Guam has experienced significant declines in parrotfish landings, particularly the large‐bodied species such as Bolbometopon muricatum and Chlororus microrhinos (B.Tibbetts pers.comm.). For these and other species like C.sordidus that exhibit complex reproductive traits such as sex‐change are challenging for fisheries managers, particularly those in developing countries where life‐history information is rarely collected (Polunin et al. 1996), mostly from lack of funding. It may also explain why traditional fisheries management practices have failed, even for those sectors that are regulated, and why many of these stocks are now considered overexploited (Coleman et al. 2000). Critical information for these populations such as determining the size and age at which sex change takes place is therefore lacking. It is now apparent that incorporating hermaphroditisim into traditional stock assessment models is essential. Failing to do so violates the principal assumption of constant recruitment in per‐recruit models because of a lack of individuals from one sex. Likewise, growth spurts, which have been found to precede sex change, when ignored in yield models, can provide over‐estimates of maximum yield and optimal effort and thus have severe, negative effects on the targeted fish populations. Observations during the initial sampling stage revealed the species chosen for this study Chlorurus sordidus does not form classic spawning aggregations. Instead large, terminal phase (TP) males establish temporary home ranges, in which they display lek‐like spawning behaviour. This was confirmed by a detailed study of the spawning behaviour of this species at Asan, Guam during 2007‐2008 by another research group at the UOG Marine Lab (K.Chop unpub.data). This same study revealed C.sordidus spawn on a daily basis and throughout the year with no clear seasonal patterns. A detailed demographic study was therefore conducted by representatively sampling from numerous sites around Guam and Saipan to determine: a) if the smallest female C.sordidus are actively participating in spawning and b) whether the largest females are making a disproportionate contribution to the reproductive output of the population. Demographic

Final Report – Parrotfish Population Dynamics
data collected from the otoliths of the same individuals provided valuable information on c) the size and age these species begin to participate in spawning, d) the age structure of the populations, e) possible age and sex differences in growth rates at different sites, f) individual age and sex specific reproductive output and g) a comparison of the age structure and growth rates of individuals both on Guam and neighbouring islands. Sampling within Guam’s Marine Preserves added another important component allowing us to determine if there has been significant build‐up of the older age classes in the time since their closure in 2000. As a supplement to the demographic and reproductive data, detailed surveys were conducted on the distribution and abundance of C.sordidus and all other parrotfish species around Guam, Rota and Saipan. This provided valuable data on the spatial composition of this important group of herbivores. Lastly, a detailed analysis of the creel survey harvest data (collected by Division of Aquatic and Wildlife Resources ‐ DAWR) was also performed on these species to examine if any had experienced declines in mean size over several decades. This lengthy time series offers a unique opportunity to look at fishing and other impacts on individual fish species. MATERIALS AND METHOD
Sampling methods Between June 2007 and October 2008, a total of 406 individual Chlorurus sordidus were collected from numerous sites around Guam and Saipan by free‐diving with handspears and spearguns (Figure 2, Table 1). To collect a representative sample, fish were collected without preference for phase (IP vs TP) or body size. Special scientific permits, issued by Division of Aquatic and Wildlife Resources (DAWR) in 2008 enabled sampling to take place inside two Marine Preserves on Guam; Tumon Bay (n=54) and Achang (n=66). Fish were kept on ice until processing, which involved taking the total length (TL) (nearest mm) and the total weight (TW)(nearest g). Following dissection, gutted whole weights (GW) were also taken. Gonads, including the ovaries or testes were removed, weighed (to the nearest 0.01 g) and macroscopically staged using a modified classification system (Table 2). These were preserved in 10% formalin solution for later histological preparation. Sagittal otoliths were removed, blotted clean on absorbent paper and stored dry for subsequent age determination. Otolith processing and validation Prior to preparation, one sagittal otolith was weighed (to the nearest 0.001 g), then set in Crystalbond© resin on the edge of a glass microscope slide. Using a modified grinding wheel, the otolith was ground to the nucleus using P600 wet and dry paper (Choat et al. 2003). The otolith half was then repositioned in the middle of the slide, polished side face‐down and ground to the nucleus. The age of each individual was determined by counting the annual increments using transmitted light at 15‐25x magnification. Using the double‐blind method, all otoliths were read twice (Russ et al. 1998). If the two readings disagreed by more than one increment, the otolith was read a third time. The otolith was eliminated from the analysis if the third reading still differed. Validation of the annual increments was attempted using the oxy‐tetracycline (OTC) labeling technique. Twelve individual Chlorurus sordidus were caught using a drive net deployed on

Final Report – Parrotfish Population Dynamics
the reef slope at Western Shoals, Apra Harbour and returned to the UOG Marine Lab. Each fish was injected with Terramycin solution (oxytetracycline dihydrate 200mg/mL) at a dosage rate of 50 mL/kg fish body weight (Cappo et al. 2000), tagged with a numbered T‐bar anchor tag just below the dorsal fin, then kept in flow‐through aquaria. Problems with the seawater system at the Marine Lab coupled with difficulties in finding appropriate food, resulted in 100% mortality within 2 months. However validation of annual increments has been achieved for this species from independent studies conducted on the Great Barrier Reef (Choat et al.1996) and Hawaii (Anon 2008), suggesting increment formation for C.sordidus in the Pacific is indeed annual. Reproductive determination
Microscopic Following preservation, gonads were subject to standard histological preparations to assign a sexual and maturity stage to individual fish (West 1990a). A thin, transverse section was taken from one gonad lobe and dehydrated in a Thermo Shandon Citadell 1000 processor, embedded in wax, sectioned at 5‐7 µm, mounted on a slide and stained with Haematoxylin‐Eosin stains. Each gonad was assigned to a sex (female, male or transitional) and one of the following developmental stages; Immature Female (IM), Resting Female (RE), Ripe or Developed Mature Female (RI), Running Ripe or Hydrated Female (RR), Spent Female (SP), Primary Male (PM), Secondary Male (SM) and Transitional (TRN) (Table 3). The ovaries were classified by the presence of the most advanced oocyte, regardless of its abundance (West 1990). Maturity schedules for female fish were calculated by plotting the percent frequency of both mature active and inactive females by 3‐mm size classes and age groups for the entire sampling period. Ideally, effective maturity estimates are preferred, which includes only females that are sexually active during the spawning period (Pears et al. 2006). However, this was not possible because very few active females were sampled during the spawning months. A logistic curve was fitted to the data in the form of:
P = 1/( 1 + exp [‐r (L‐Lm)]) Where r is the slope of the curve fitted to ln[(1‐P)/P] vs TL, P is the proportion of mature fish and Lm is the mean length at sexual maturity. The size, L50 and age, t50 at first maturity was estimated to be the intercept point at which 50% of individual fish were mature. The relationship between gonad weight and total length and age was explored to determine if there was a disproportionate increase in gonad weight above size and age at first maturity, as seen in other reef fish species like Lethrinus harak (Taylor 2008). Abundance estimates Between July 2008 and November 2009, underwater visual census was used to determine the size, abundance and distribution of C.sordidus and all other species of parrotfish at multiple sites around Guam, Rota and Saipan (Figure 3; Table 4). At each site, eight transects were completed along the depth contour of the reef slope; four at 9‐12 m and four at 3‐6 m. Transects were stratified accordingly to determine if the distribution of different parrotfish species was related to depth. A total of 256 transects were completed; eighteen sites around Guam, seven on Rota and seven on Saipan. For each island, at least one site

Final Report – Parrotfish Population Dynamics
encompassed a Marine Preserve (Table 4). In order to minimise disturbance and increase the probability of encountering larger parrotfish species which are wary of divers (e.g. Scarus rubrioviolaceous) transects were comprised of timed swims thereby eliminating the need for fibreglass tapes. Each transect was the equivalent of a 5 minute swim (average 80‐100 m linear distance) that had a fixed width of 5 m. A gap of 15‐20 m was left between each replicate transect. Individual parrotfish (>9 cm) encountered within the transect were identified to species level, classified as either initial phase or terminal phase (for species that were sexually dimorphic) and their total length estimated and assigned to a 3 cm size class. At each site all eight transects were completed by the same observer (JMc) during a single dive (average time 75 mins). On completion of the fish counts, the following physical attributes associated with each transect was qualitatively assessed; percent live coral cover, rugosity and slope. Percent live coral cover was scored according to the following categories 1 (0‐10%), 2 (11‐30%), 3 (31‐50%), 4 (51‐75%) and 5 (>75%) following a modified version of English et al. (1997). Rugosity was scored on a scale of 1‐5 as was the slope (1‐5). Before the start of the surveys the observer was trained in estimating fish size underwater using wooden fish models (Bell et al 1985).
Creel Survey Data Creel survey harvest data for all parrotfish species on Guam for the period 1982 to 2009 was obtained from the Division of Aquatic and Wildlife Resources (DAWR). Records included date of capture, fishing method, sector where fish were harvested, species name, number of individuals caught, and total weight of the catch for each species. Data analysis The relationship between total length (TL) and gonad‐free body weight (GW) was estimated for 376 fish using linear regression analysis. To linearize the power curve (GW = aTLb) that best described this relationship, both variables were transformed using loge x. The line of best fit for the linear relationship was described by logeGW = logea + logeTL. The von Bertalanffy growth function (VBGF) where Lt = L∞ (1‐e
‐K(t‐t0)) was fitted to length at age data separately for males and females. This was done by fitting a nonlinear least‐squares regression of TL on age; Lt = L∞ (1‐e
‐K(t‐t0)), where Lt = TL at age t, L∞ = mean asymptotic TL, K = growth coefficient, t0 = the age at which theoretical TL is zero. As estimates of the VBGF parameters are sensitive to a lack of smaller, younger fish (Kritzer 2002), the regression was constrained to a size at settlement (15 mm). Growth parameters for each sex and between primary and secondary males were compared by plotting 95% confidence regions (confidence ellipses) for K and L∞ . The degree of overlap determined if these were significant. The annual instantaneous rate of mortality (Z) was estimated for all sexes combined using the age‐based catch curve technique (Beverton & Holt 1957; Ricker 1975). The natural logarithm of the number of fish per age class was plotted against age with the slope of the line of best fit, b equal to the annual instantaneous rate of total mortality or Z. The first age classes, which represented fish not fully vulnerable to the fishing gear, were not included in

Final Report – Parrotfish Population Dynamics
the analysis. Natural mortality (M) was calculated using the equation of Pauly (1980), which incorporates water temperature and the VBGF growth parameters L∞ and K. The mean annual water temperature for Guam is 28oC (J.McIlwain unpub data). The instantaneous rate of fishing mortality (F) was estimated by subtracting the estimate of natural mortality (M) from total mortality (Z) estimated as the absolute value of the regression slope (F = Z – M). An estimate of exploitation (E) was calculated as E = F/Z . Annual percentage survivorship, S, was calculated as S = exp (‐Z)*100. An ANCOVA was used to compare the relationship between otolith weight (g) and age (years) among sex, with age as the dependent variable, otolith weight as the covariate and sex as the categorical variable (Zar 1996). Multiple regression analyses were performed on the abundance of Chlorurus sordidus and numerous physical variables (average depth, rugosity, slope and % coral cover) plus the abundance of Acanthurus lineatus. Colinearity among habitat and physical variables was tested by following the guidelines set out by Graham (2003). Variables found to be collinear were selectively eliminated during the stepwise multiple regression analyses. To increase linearity in variable relationships, several transformations were performed. Stepwise multiple linear regression was used to predict the best models which explained C.sordidus abundance. The dependent variables were tested for normality using the Kolmogorov‐Smirnov and Shapiro‐Wilk statistics in SPSS v14 and by examining residual plots. Clustering and non‐metric multidimensional scaling (nMDS) were used to compare the parrotfish assemblages at each of the three islands, Guam, Rota and Saipan. The similarity matrices underlying these analyses were calculated using the Bray‐Curtis similarity coefficient after transformation (logx+1) (Bray & Curtis 1957). This was necessary to normalise the dataset and downweight the influence of the most abundant species. Hierarchical clustering was performed on the similarity matrices using group‐average linking. The major patterns in the data were identified by examining the dendrogram and ordination produced during the analyses.

Final Report – Parrotfish Population Dynamics
Figure 2: Locations within the Marianas Island where samples of Chlororus sordidus were taken.

Final Report – Parrotfish Population Dynamics
Table 1: Summary of the number of Chlorurus sordidus samples collected from Guam and Saipan at each site, the size range of total length (mm) and the total number of terminal phase (TP) fish in the sample. Gray area denotes Marine Preserves
Island Code Site Specimens collected
Size range (mm)
Number of terminal phase
GUAM 1 Double Reef 32 124‐239 21 2 Shark's Hole 6 180‐239 4 3 Tanguisson 21 168‐231 4
4 Tumon Bay Marine Preserve 54 158‐256 21
5 Governors 10 126‐210 0 6 Asan 18 146‐240 5 7 Western Shoals 6 159‐237 2 8 Orote Point 2 139‐206 1 9 Cocos Lagoon 68 125‐265 22 10 Achang Marine Preserve 66 150‐251 36 11 Malojloj 3 206‐224 3 12 Ipan 9 180‐233 3 13 Talafofo 1 199 1 14 Ylig 4 132‐242 0 15 Pago Bay 10 140‐212 0 16 Hawaiian Rock 10 209‐260 6 17 Harnom 35 158‐241 16 SAIPAN 18 North Garapan 8 166‐194 1 19 Grand Hotel 4 147‐191 1 20 Coral Ocean Point 27 136‐243 7 21 Boy Scout 11 145‐202 3 22 Lau Lau Beach 1 185 0

Final Report – Parrotfish Population Dynamics
Table 2: Maturity stages for individual Chlorurus sordidus based on macroscopic staging or a description of the gonad morphology.
Sex Developmental Stage
Description of Gonad Morphology
FEMALE 1 ‐ Immature Gonad, very small, transparent with small volume. Eggs cannot be distinguished with the naked eye.
2 ‐ Maturing Gonad no longer transparent, but pinkish in appearance. Relatively small and compact, sometimes rich in blood vessels. Volume is approximately half of the maximum length of gonad.
3 ‐ Mature Gonad has increased in size considerably. Colour can vary from dark pinkish to orange. Not all the oocytes are yolked, so no evidence of hydration. No extrusion of oocytes when lightly pushed.
4 – Running Ripe Gonad very large. Hydrated oocytes visible through gonad wall. When light pressure is applied to gonad, eggs are readily extruded.
5 ‐ Spent Size of gonad has decreased considerably with walls very loose and folded. Traces of ripe eggs are sometimes evident.
MALE 1 ‐ Mature Gonad whitish or pale yellow in colour and strap‐like in shape.
2 ‐ Spent Size of gonad has decreased considerably with walls loose and folded.

Final Report – Parrotfish Population Dynamics

Final Report – Parrotfish Population Dynamics
Table 3: Developmental stages for individual Chlororus sordidus, based on microscopic histological preparations. Symbols in the Oocyte Stage description column correspond with labels on micrographs of gonad sections (Figure 11).
Sex Developmental Stage Oocyte Stage/ Spermatocyte Stage
Oocyte Stage description Other Criteria
Female 1‐ Immature Female (IM) Stage I, II and III oocytes Pre‐vitellogenic oocytes • Oogonia, oo • Chromatin nucleolus, cns • Early perinucleolus, eps • Late perinucleolus, lps
• No brown bodies • Thin gonad wall • Compact, lamellae well packed
Female 2‐Resting Female (RE) Stage I, II and III Pre‐vitellogenic oocytes (as above)
• Brown bodies common but not always present
• Thick gonad wall • Lamellae not compact,
often vacuolated Female 3‐Ripe or Developed Mature
Female (RI) Stage I, II, III and IV oocytes Vitellogenic oocyte:
• Yolk vesicles, yy • Migratory nucleus stage, mns
• May have atretic oocytes, post‐ovulatory follicles or bb from previous spawning
Female 4‐ Running Ripe or Hydrated Female (RR)
Stage V oocytes Hydrated oocytes, hy Post‐ovulatory follicles and atretic oocytes may be present
Female 5‐ Spent Female (SP) Ovulatory follicles present: Very early (pof1) Early (pof2) Mid (pof3) Post (pof4)
The gonad consisted of 50% or more Post‐ovulatory follicles. In some samples, the ovary was distended, with many empty follicles and degenerated stage III and IV oocytes.
Male 1‐ Primary Male (PM) Spermatids, Primary and Secondary Spermatocytes
Large testes with centrally located sperm ducts. No signs of female gonia.
Male 2‐ Secondary Male (SM) Spermatid and Spermatocytes
Lobate in appearance, central lumen and peripheral sperm ducts present.
Transitional 3‐ Transitional (TRN) Spermatid and Oocytes Functional females having sperm crypts and/or functional males having atretic eggs or immature oocytes.

Final Report – Parrotfish Population Dynamics
Table 4: Summary of the sites where underwater visual census of the parrotfish community was conducted. Protected sites are those where fishing for parrotfish has been banned.
Island Code Site Status Shallow Deep
GUAM 1 Double Reef Fished 4 4 2 Tumon Gun Protected 4 4 3 Tumon Marriot Protected 4 4 4 Governors Fished 4 4 5 Asan Fished 4 4 6 Piti North Protected 4 4 7 Piti South Protected 4 4 8 Cocos channel Fished 4 4 9 Cocos Island Fished 4 4 10 Talafofo Fished 4 4 11 Togcha channel Fished 4 4 12 Pago Bay Fished 4 4 13 Hawaiian Rock Fished 4 4 14 Harnom 1 Fished 4 4 15 Harnom 2 Fished 4 4 16 Patti Point 1 Fished 4 4 17 Patti Point 2 Fished 4 4 18 Patti Point 3 Fished 4 4 ROTA 19 Iota North Fished 4 4 20 ROT6 Fished 4 4 21 West Harbour Fished 4 4 22 Sasanhaya Fished 4 4 23 Coral Gardens Protected 4 4 24 Mayor's Beach Fished 4 4 25 Okgok Fished 4 4 SAIPAN 26 Wing Beach Fished 4 4 27 Outer Managahan Protected 4 4 28 Grand Hotel Fished 4 4 29 Coral Ocean Point Fished 4 4 30 Boy Scout Fished 4 4 31 Lau Lau Beach Fished 4 4 32 Bird Island Protected 4 4

Final Report – Parrotfish Population Dynamics
Figure 3: Locations within the Marianas Island where underwater visual surveys of Chlororus sordidus and other parrotfish species were taken.

Final Report – Parrotfish Population Dynamics
RESULTS
Age and Growth
Comparison of size structure between visual census and biological samples For Guam, there were considerable differences in the size structures estimated by the visual surveys and collection of specimens (Figure 4). It would appear the smaller size classes, the 10 and 13 cm initial phase individuals which dominate the reef slopes of Guam, were under sampled during the collections. Instead there was a clear bias towards sampling larger individuals >19 cm. This was not the case on Saipan where the two size structures were in fact very similar.
Length weight relationships For all individual C.sordidus sampled, the minimum and maximum TL recorded was 124 mm (IP Female) and 265 mm (TP Male) collected from Double Reef and Cocos Lagoon respectively (Table 5). The largest IP was a primary male (254 mm) also collected from Cocos Lagoon. The smallest TP was a secondary male (180 mm) from Achang Channel. The slopes of the length‐weight regressions differed significantly between the two phases (ANCOVA; F 1,390=44069.8; P<0.001). TP fish attained a greater weight for a given size compared with the smaller IP individuals.
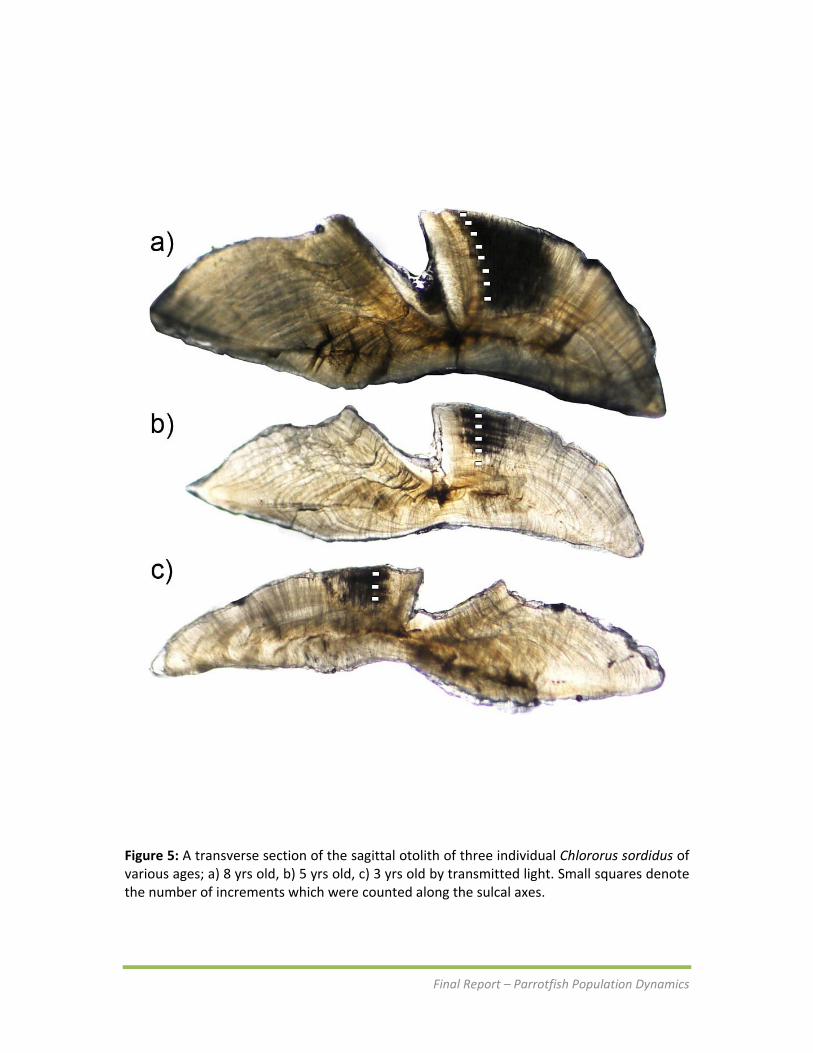
Otolith interpretation and relationship with age The sectioned sagittae of C.sordidus when viewed under transmitted light showed regular increments with opaque zones darker than adjacent translucent ones (Figure 5). The first increment was difficult to discern in some individuals. There was reasonable reproducibility between the first and second readings which matched 75‐80% of the time. Of the 363 otolith readings included in the analysis, ages ranged between 1 and 9 years. The positive linear relationship between age and otolith weight estimated using least squares regressions reveal sagittal otoliths increase in weight over the entire lifetime of this species. However the slopes of otolith weight and age were significantly different between sexes (ANCOVA; F 1,363 = 688.6; P<0.001)(Figure 6). Approximately 84% and 75% of the variability in otolith weight could be attributed to age for female and male C.sordidus respectively (Table 6).
Age distributions For both Guam and Saipan there was a clear pattern of exponential decay in frequency with age beyond three years (Figure 7a,b). The larger sample size from Guam returned a more complete age structure, with all age classes represented. Saipan on the other hand exhibited a strong modal age class due to the greater number of year 2 fish (Figure 7b). When all sites were combined, females dominated the younger year classes comprising 100% of year 1 and 75% of year 2 fish (Figure 7c). Beyond 4 years, the ratio of males to females was similar for each year class with the exception of the oldest individual in the sample which was a 9 yr old female. Surprisingly, the Marine Preserves, which have been closed for nearly 9 years, showed no significant build‐up of older individuals compared with areas open to fishing (χ = 8.25, d.f. = 8; P‐0.410)(Figure 8a). Consequently there were similar ratios (protected vs fished) in the frequency of individuals in all age classes. This was further

Final Report – Parrotfish Population Dynamics
supported by no differences in the mean age of males and females between the marine preserves and fished areas (Males ‐ F 1,139 = 3.91; P=0.602; Females ‐ F 1,179 = 1.44; P=0.232)(Figure 8b).
Growth Models The growth curves for both sexes (all sites combined) exhibit a typical rapid initial growth (both K values greater than 1.0; Table 7) followed by a pronounced asymptote after 3‐4 years (Figure 9). Overall females reached a smaller L∞ which was nearly 35 mm less than that of males. Males attained a larger size for a given age compared with females which resulted in a significant difference in growth trajectories between sexes. This was confirmed from the confidence ellipses which did not overlap.
Mortality estimates Estimates of total mortality, Z, were reasonably high at 0.519 yr‐1 and 0.623 yr‐1 from the Marine Preserves and areas open to fishing respectively (Table 8)(Figure 10). This corresponded to 59% and 54% annual survivorship.
Reproduction The gonads of 309 C. sordidus were examined using histological techniques (Table 9). These individuals ranged from 124 to 242 mm TL and 1 to 9 years for females (n = 173) and from 173 to 265 mm TL and 1 to 7 years for males (n = 123). Transitional fish (n = 13) ranged from 196 to 242 mm TL and 2 to 8 years although 85% of these were 2 or 3 years old.
Gonad stages The ovarian development and maturation of female C. sordidus was classified into five stages: immature; resting; ripe or developed mature; running ripe or hydrated; and spent (Table 3, Figure 11a‐e). Of the 173 females examined, 24 were immature, 8 were resting mature, 68 were ripe or developed mature, 24 were running ripe or hydrated, and 49 were spent. Male gonads were not classified by stage due to the difficulty in determining development in testes. Instead they were classified as primary or secondary males based on gonad morphology to describe the functional reproductive history of an individual. Primary male testes typically lack signs of female gonia and contain centrally located sperm ducts (Figure 11g) whereas secondary male testes have a remnant ovarian lumen and peripheral sperm ducts (Figure 11h, Table 3). Transitional individuals were represented by functional females with proliferating sperm crypts and/or functional males with atretic oocytes (Figure 11f). A comparison of macroscopic and microscopic examination methods reveals that macroscopic sex determination was highly accurate, with 100% agreement between males and females staged using the two techniques (Table 10). Macroscopic female staging however was variable (Table 10). Most importantly, it was not possible to identify transitional individuals without histology. Four combinations of colour phase and sexual development were identified in C. sordidus: initial phase (IP) females, initial phase (IP) primary males, terminal phase (TP) primary males, and terminal phase (TP) secondary males. A breakdown of the number of samples per size class for each type is provided in Table 10. Of the 13 transitional fish, 12 were terminal phase (TP), indicating that colour phase change is likely completed before the completion of sex change.

Final Report – Parrotfish Population Dynamics
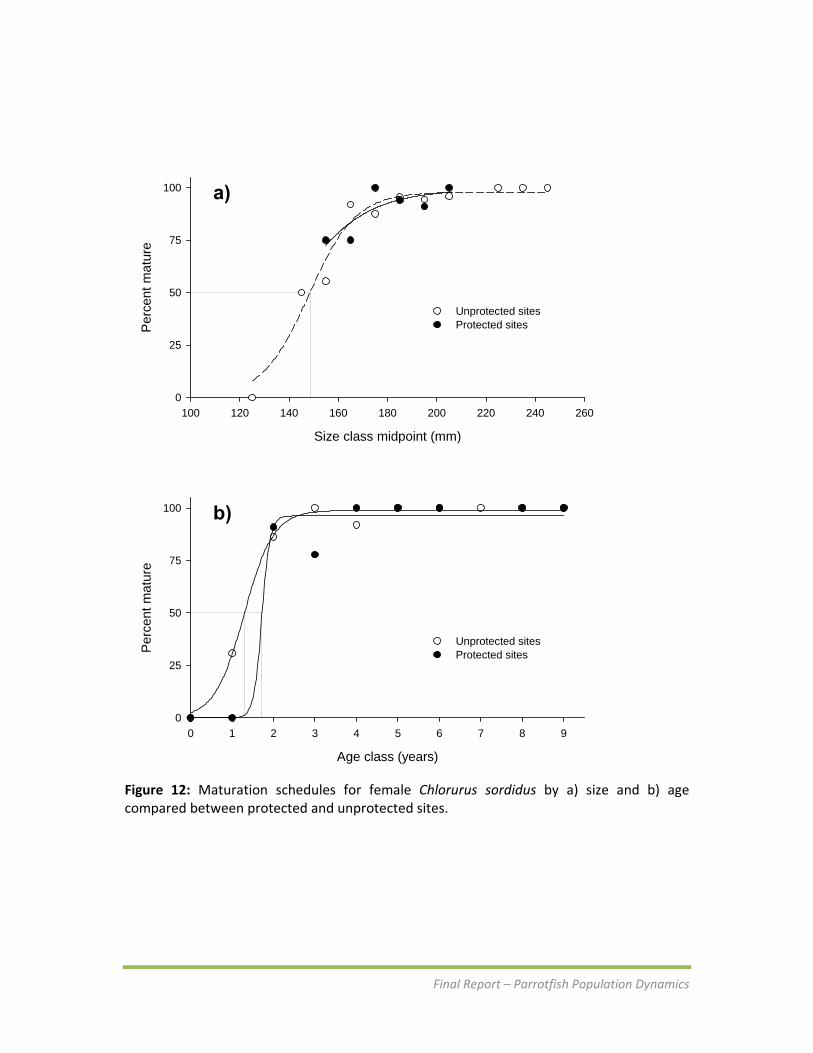
Maturation and sex change Female C. sordidus reach 50% maturity at 148 mm TL (L50) and 1.3 years (t50). Maturation schedules were compared among protected and unprotected sites on Guam to determine if protection from fishing has affected the onset of reproductive maturity (Figure 12). Given that immature individuals were very rare in samples from protected sites, size at maturity could not be compared (Figure 12a). However, there was some indication that females within protected sites reach t50 at an older age (Figure 12b). Size at sex change was determined by plotting the percent of secondary males in the population by size class. Primary males were excluded from the analysis as they do not represent individuals who have or may change sex. The length at 50% sex change for C. sordidus was approximately 207 mm TL. There was very little difference in size at sex change between protected and fished sites (Figure 13). It was difficult to determine age at sex change using this method because many females never undergo sex change, resulting in high numbers of females in older age classes.
Reproductive potential Spawner biomass estimates from visual surveys (total biomass of individuals ≥ 16 cm size class) showed variable trends with protection status across the three islands. On Guam, spawner biomass was relatively high in Tumon and Patti Point Marine Preserves while it was lower in Piti Marine Preserve (Figure 14a). On Rota, the single protected area, Coral Gardens, contained a much greater value of spawner biomass than all other sites (Figure 14b). On Saipan, however, there was no apparent pattern of spawner biomass build‐up within protected sites (Figure 14c). Regressions of ovary weight and length for active mature females at protected and unprotected sites were highly significant (Figure 15; Achang ‐ F1,16 = 17.3, p < 0.001; Tumon ‐ F1,11 = 15.8, p < 0.01; Unprotected ‐ F1,49 = 45.6, p < 0.001). The greater proportion of hydrated individuals sampled from Tumon Marine Preserve is likely the reason for the discrepancy for the ovary weight/ size relationship. Furthermore, plotting the mean gonadosomatic index (GSI) values by age for mature active females reveals that the relative reproductive contribution of C. sordidus increases rapidly after maturation, but becomes stable around age 3 (Figure 16). For male gonads, an interesting relationship exists. While initial phase (IP) primary males are generally smaller in size than terminal phase (TP) males, they consistently have much larger gonads (Figures 17 and 18). This discrepancy in gonad size is clearly driven by colour phase rather than sexual development (i.e., primary versus secondary males) because no difference is identifiable between primary and secondary terminal phase males.
Distribution and Abundance
Size distribution of Chlorurus sordidus An examination of the UVC data showed little difference in the size structure of C.sordidus between shallow (3‐6 m) and deep (9‐12 m) parts of the reef slope on Guam (Figure 19). Clearly, this species has very little habitat preference below 3 m depth contour.

Final Report – Parrotfish Population Dynamics
Consequently all transects both shallow and deep will be considered for subsequent analysis of the populations using this technique. A comparison of the size frequency distributions for sites along the east and west coasts of Guam reveal a striking pattern (Figure 20). There was a significant shift in the size structure; the modal size class on the east coast was 16 cm compared with 13 cm on the west coast. This is further supported when the size distribution is examined at the site level (Figure 21a). Along the west coast of Guam, easily accessible sites, which are subject to high fishing pressure (e.g. Governors Complex and Asan) were dominated by very small initial phase individuals. At these same sites, terminal phase adults were rare and when present much smaller than nearby sites within the Tumon Marine Preserve. Interestingly, a similar pattern of small individual initial and terminal phase fish was also evident within the Piti Marine Preserve, a site adjacent to Asan. Double Reef and the Cocos sites, accessible only by boat had a greater proportion of large individuals of both phases. On the east coast, a similar pattern emerged whereby inaccessible sites had large initial and terminal phase fish (Figure 21b). These included sites along the northeast coasts such as Hawaiian Rock, Harnom 1 and 2 and the three sites within Patti Point Marine Preserve. Pago Bay, the most accessible site on the east coast which suffers the greatest fishing pressure, was dominated by small fish, with larger terminal phase adults almost completely absent. On Rota and Saipan, the mean size of initial phase adults was significantly greater than Guam at 18.6 and 17.7 cm respectively (Figure 24). Although there was a higher proportion of larger terminal phase adults at these two islands, overall their mean size was not significantly different to that of Guam. Sites such as Grand Hotel on Saipan, which are subject to greater fishing pressure were dominated by small initial phase fish, a pattern also seen on Guam (Figure 22). Of the 3 islands, Rota’s sites contained the largest initial phase adults, supported by the size frequency distributions at each site where the modal size was centred around 19 cm (Figure 23).
Biomass of Chlorurus sordidus There was a clear pattern of greater biomass build‐up of Chlororus sordidus within the Marine Preserves of Guam and Rota with 3000 and 4700 g per transect respectively (Figure 25). Within fished sites, biomass dropped considerably to 2010 and 1500 g per transect in sites open to fishing. On Saipan there was no significant difference in the mean biomass of this species at sites open and closed to fishing. A similar result was evident for size frequency distributions at each of the 3 island sites (Figure 26).
Patterns of abundance and other variables The variables of rugosity slope, % coral cover, depth and abundance of Acanthurus lineatus were used as predictors of C.sordidus abundance. The model which best described variation in abundance of this species from the shallow transects was % coral cover and A.lineatus abundance (Table 11b).
Abundance of other parrotfish species A total of 18 species of scarids were encountered during the visual surveys of the three islands (Table 12). One of these, the undescribed Scarid species A (Myers 1998) was found at

Final Report – Parrotfish Population Dynamics
only one site, within the Coral Gardens Fish Sanctuary on Rota. Chlorurus sordidus dominated the community, accounting for more than 55% of total parrotfish abundance on Guam compared with 34% and 36% for Rota and Saipan respectively. The other two common species, Scarus psitticus and Scarus schlegeli, varied considerably in their numerical abundance at sites on all three islands. Only 9 of the 18 sites on Guam contained large‐bodied parrotfish (> 40 cm)(Figure 27). Of these only 4 were sites open to fishing, with the remainder classified as Marine Preserves. Conversely large parrotfish were recorded at all sites on Rota and 5 of the 7 sites on Saipan. Potential relationships between the parrotfish community (biomass) and exposure and degree of protection from fishing were investigated using NMDS ordination plots. When these plots were labelled according to degree of exposure (exposed vs protected) strong clustering of sites occurred, a pattern consisted across all three islands (Figure 8). With the exception of Coral Ocean Point, all sites on the exposed sides of Guam, Rota and Saipan formed a tight cluster which was separate from protected sites. When sites were relabelled according to degree of protection from fishing, no such pattern was evident.
Creel survey data Trends in mean weight per individual harvested over time were examined for 15 parrotfish species from Guam (Figure 29). Significant declines in the mean weight of harvested individuals existed for six species: Calotomus carolinus, Cetoscarus bicolor, Chlorurus microrhinos, Scarus altipinnis, Scarus frenatus, and Hipposcarus longiceps. For five of these species, longevities exceeded 12 years whereas there was no age information available for the sixth species, Calotomus carolinus (Table 13). Conversely, species that experienced no temporal decline in mean weight for which longevity data was available had a maximum age of nine years. Trends in total catch per year could not be derived from the creel survey data as we had no effort data for standardization.

Final Report – Parrotfish Population Dynamics
Table 5: Results of the linear regression analysis describing the length weight relationship for Initial Phase (IP), Terminal Phase (TP) and both combined. Table 6: The relationship between age (years) and otolith weight (g) for female, male C.sordidus and both sexes combined. Data were analyses using least squares regression analyses.
Parameter n a b r2 TLmin‐max (mm) TWmin‐max (g) Av TL (SE) Av TW (SE)
Initial phase (IP) 226 8x10‐6 3.204 0.96 124‐254 36‐396 181.4 (1.47) 144.8 (3.74)
Terminal phase (TP) 150 5x10‐5 2.868 0.91 180‐265 132‐484 222.1 (1.33) 261.7 (4.73)
Combined 376 1x10‐5 3.130 0.97 124‐265 36‐484 197.7 (1.45) 191.4 (4.16)
Sex n Equation r2
Female 212 Age = 360.9*OtoWt ‐ 1.22 0.84
Male 151 Age = 326.5*OtoWt ‐ 1.34 0.75
Combined 363 Age = 323.1*OtoWt ‐ 1.03 0.78

Final Report – Parrotfish Population Dynamics
Table 7: Growth parameters from the VBGF (±C.I.) calculated using length‐at‐age data. Data have been separated by a) Sex; b) Status; c) Male development and d) Location.
Parameter n L∞ CI K CI t0 r2 Sex Male 141 230.4 224.9, 236.5 1.04 0.89, 1.26 ‐0.06 0.24 Female 218 196.4 192.3, 200.6 1.15 1.04, 1.28 ‐0.07 0.54 Status Protected Male 58 234.0 225.5, 243.7 0.95 0.77, 1.25 ‐0.07 0.34 Female 54 196.1 189.5, 203.1 1.21 1.00, 1.57 ‐0.07 0.42 Unprotected Male 83 228.0 221.1, 236.0 1.08 0.87, 1.45 ‐0.06 0.21 Female 128 199.4 194.2, 204.8 1.10 0.99, 1.25 ‐0.07 0.64 Male Development Primary 21 222.2 206.0, 243.4 0.83 0.51, 2.11 ‐0.08 0.30 Secondary 94 236.6 230.0, 244.1 0.95 0.80, 1.16 ‐0.07 0.34 Location Guam Male 141 234.9 229.6, 240.7 0.96 0.84, 1.12 ‐0.07 0.36 Female 182 198.9 194.8, 202.9 1.13 1.02, 1.25 ‐0.07 0.61 Saipan Male 11 223.6 ‐ 1.35 ‐ ‐0.05 0.09 Female 37 181.0 ‐ 1.64 ‐ ‐0.05 0.13

Final Report – Parrotfish Population Dynamics
Table 8: Estimates of instantaneous rates of total mortality (Z), survivorship (S), natural mortality (M), Fishing mortality (F) and rates of exploitation (E).
Parameter Z (yr‐1) S (%) M (yr‐1) F (yr‐1) E
MPA 0.519 59.51 0.519 ‐ ‐
Fished 0.623 53.63 0.248 0.375 0.602
Combined
Table 9: The distribution of Chlorurus sordidus samples by size class for each phase, initial (IP) and terminal (TP). For TP males, sexual development has been determined as either primary (10) or secondary (20).
TL (mm) IP‐♀ IP‐1°♂ TP‐1°♂
TP‐2°♂ TRANS
120 to 149 8 150 to 179 62 2 180 to 209 89 8 17 9 210 to 239 13 6 71 3 240 to 269 1 1 4 13 1
Total 173 11 10 101 13

Final Report – Parrotfish Population Dynamics

Final Report – Parrotfish Population Dynamics
Table 10: Matrix comparing results of the two techniques (Macrostage and Microstage) used for maturity stages in male and female C.sordidus.
Micro stage
PHASE Macro stage
Female immature
Female resting
Female ripe/dvlp
Female hydrated
Female spent
Primary Male
Secondary Male
TransitionalGrand Total
Initial phase F1 15 3 1 19 F2 3 2 2 7 F3 1 20 3 22 46 F4 7 2 10 19 F5 8 8 F6 1 1 1 3 M3 3 3 M4 3 3 M6 1 1 Terminal phase M1 6 2 8 M2 1 12 13 M3 2 16 1 19 M6 2 17 3 22 Grand Total 19 5 29 13 35 11 51 8 171

Final Report – Parrotfish Population Dynamics
Table 11a: Results of Multiple Regression analysis; dependent variable ln C.sordidus abundance; independent variables %coral cover, ln Abundance of Acanthurus lineatus Table 11ba: Analysis of variance table for Multiple Regression model
Variable Estimate Std. Err. Tstat P‐value
Intercept ‐0.16461502 0.0063 ‐26.116 <0.0001
CORAL 0.15007871 0.0053 28.085 <0.0001
A.lineatus abundance 1.0801286 0.0244 44.297 <0.0001
Source DF SS MS F‐stat P‐value
Model 2 7.5634513 3.7817256 19596.527 <0.0001
Error 26 0.0050174636 1.9297938E‐4
Total 28 7.568469

Final Report – Parrotfish Population Dynamics
Table 12: Total abundance of all parrotfish species encountered during visual census at each site on Guam, Rota and Saipan. Grey fill denotes sites within a Marine Preserve.
C.bicolor
C.carolinus
C.frontalis
C.microrhinos
C.sordidus
H.longiceps
S.alltipinnis
S.cham
eleon
S.festivus
S.forsteni
S.ghobban
S.globiceps
S.niger
Scarus oviceps
S.psitticus
S.rubrio
violaceo
us
S.schlegeli
Scarus sp
A
GUAMDBL_REEF 0 1 0 15 150 1 2 0 0 3 0 3 0 0 6 7 46 0TUMON_GUNBCH 0 15 0 6 165 0 5 0 0 14 0 5 0 0 40 1 31 0TUMON_MARRIOT 2 7 0 2 396 0 1 0 0 1 0 2 0 0 55 30 85 0GOV_COMPLEX 0 4 0 0 500 0 26 0 0 0 0 3 0 0 1 0 123 0ASAN 0 4 0 1 389 0 28 0 0 0 1 7 0 0 4 0 136 0PITI_NORTH 0 1 5 18 404 1 99 0 0 0 0 5 0 0 131 2 187 0PITI_SOUTH 0 0 1 7 473 0 2 0 0 0 0 0 0 0 66 0 128 0COCOS_CHANNEL 0 5 0 0 359 0 1 0 0 5 0 5 0 0 152 0 150 0COCOS_IS_CHANNEL 0 0 0 0 264 0 8 0 0 2 0 2 0 0 114 0 159 0TALOFOFO_BAY_STH 0 12 4 1 183 2 0 0 0 0 0 1 0 0 71 9 55 0TOGCHA_CHANNEL 4 6 2 1 173 0 3 0 0 0 0 0 0 0 24 4 15 0PAGO 1 16 4 0 197 0 0 0 0 0 1 0 0 0 86 0 24 0HARNOM_1 0 5 3 2 66 0 1 0 0 7 0 1 0 0 144 17 0 0HARNOM_2 0 8 1 7 93 0 30 0 0 7 0 2 0 0 70 21 3 0HAWAIIAN_ROCK 0 25 12 1 83 0 0 0 0 3 0 0 0 0 115 0 2 0PATTI_POINT_1 0 1 15 10 123 9 0 0 0 3 0 0 0 0 93 66 1 0PATTI_POINT_2 1 12 30 8 170 5 0 0 0 30 0 10 0 1 63 60 43 0PATTI_POINT_3 0 18 118 9 113 1 1 0 0 3 0 1 0 0 72 41 10 0TOTAL 10 140 195 88 4301 19 207 0 0 78 2 47 0 1 1307 256 1198 0#occurrences 4 16 11 14 18 6 13 0 0 11 2 13 0 1 18 11 17 0% Total 0.1 1.8 2.5 1.1 54.8 0.2 2.6 0.0 0.0 1.0 0.0 0.6 0.0 0 .0 16.7 3.3 15.3 0.0ROTAIOTA_NORTH 0 12 0 25 108 0 0 4 0 15 0 3 0 0 50 6 6 0ROT6 0 7 5 8 24 0 0 4 0 6 0 0 0 0 60 24 1 0WEST_HARBOUR 0 0 0 20 51 0 244 0 0 20 0 24 0 2 42 28 9 0SASANHAYA 0 0 0 26 65 0 105 1 0 7 0 10 1 0 49 14 4 0CORAL_GARDENS 0 1 0 35 258 0 18 0 0 29 0 22 5 1 5 22 7 3OKGOK 0 4 2 12 65 0 15 0 0 50 0 2 0 0 43 41 22 0MAYORS_BEACH 0 0 3 19 110 0 3 0 0 41 0 1 0 0 30 34 12 0TOTAL 0 24 10 145 681 0 385 9 0 168 0 62 6 3 279 169 61 3# occurrences 0 4 3 7 7 0 5 3 0 7 0 6 2 2 7 7 7 1%Total 0 1.2 0.5 7.2 34.0 0.0 19.2 0.4 0.0 8.4 0.0 3.1 0.3 0 .1 13.9 8.4 3.0 0.1SAIPANWING_BEACH 0 6 0 0 23 0 11 0 1 2 0 0 0 0 123 34 0 0OUTER_MANAGAHAN 0 8 0 16 146 0 12 0 0 33 1 4 0 0 171 3 12 0GRAND_HOTEL 0 0 0 0 204 1 0 0 0 0 0 3 0 0 83 0 20 0CORAL_OCEAN_PT 0 13 2 1 144 1 0 0 0 1 0 1 0 0 444 6 4 0BOY_SCOUT 0 3 0 0 291 0 1 0 0 0 15 6 0 1 106 1 178 0LAULAU_1 0 5 0 53 81 0 0 0 0 3 0 0 0 1 51 7 12 0BIRD_IS 0 8 1 4 8 4 5 0 0 0 0 0 0 0 44 49 7 0TOTAL 0 43 3 74 897 6 29 0 1 39 16 14 0 2 1022 100 233 0# occurrences 0 6 2 4 7 3 4 0 1 4 2 4 0 2 7 6 6 0%Total 0 0.0 0.0 0.0 0.4 0.0 0.0 0.0 0.0 0.0 0.0 0.0 0.0 0 .0 0.4 0.0 0.1 0.0

Final Report – Parrotfish Population Dynamics
Table 13: The ratio of initial phase to terminal Chlorurus sordidus for each site at each island location. Grey denotes areas closed to fishing.
ISLAND Site RatioGUAM Double Reef 5.82 Tumon_Gun 10.79 Tumon_Mar 7.25 Gov 18.27 Asan 18.45 Piti N 17.36 Piti S 17.19 Cocos Ch 16.95 Cocos Is 23 Talafofo 7 Togcha 13.42 Pago 64.67 Hawaiian Rock 8.22 Harnom1 5.6 Harnom2 4.17 Patti3 4.65 Patti2 5.07 Patti1 4.59ROTA Iota Nth 14.43 Rota 6 3 West Harbour 2.19 Sasanhaya 3.64 Coral Gardens 6.82 Mayors Bch 5.86 Okgok 1.6SAIPAN Wing Bch 3.6 Outer Managahan 6.3 Grand Hotel 7.16 Coral Ocean 6.58 Boy Scout 18.4 Lau Lau 7.1 Bird Island 1.67

Final Report – Parrotfish Population Dynamics
Table 14: Summary table showing the trend in mean weight per individual for 15 common parrotfish species landed by fishermen on Guam. Demographic data such as Lmax, Max age and K are also included and taken from the literature.
Species Trend in Mean
Weight Individual‐1
L∞ (mm) Max. Age
Growth (K)
Calotomus carolinus* Signif. decline ‐ ‐ ‐ Cetoscarus bicolor* Signif. decline 421 21 0.255 Chlorurus frontalis No change ‐ ‐ ‐ Chlorurus microrhinos* Signif. decline 430 15 0.301 Chlorurus sordidus Slight increase 229 9 1.083 Scarus altipinnis* Signif. decline 377 13 0.253 Scarus festivus Slight increase ‐ ‐ ‐ Scarus forsteni Slight increase ‐ ‐ ‐ Scarus frenatus* Signif. decline 232 19 0.844 Scarus ghobban Slight decline ‐ ‐ ‐ Scarus globiceps Slight increase ‐ 4 ‐ Scarus psitticus Slight decline 175 5 1.505 Scarus rubrioviolaceus No change 410 9 ‐ Scarus schlegeli Slight decline 239 8 0.403 Hipposcarus longiceps* Signif. decline 350 12 0.278

Final Report – Parrotfish Population Dynamics
a) Guam
Freq
uenc
y 0.4
0.3
0.2
0.1
0.0
0.1
0.2
0.3
0.4
b) Saipan
Size class midpoint (mm TL)
10 13 16 19 22 25 28 310.4
0.3
0.2
0.1
0.0
0.1
0.2
0.3
0.4
Figure 4: Size frequency distributions of collected specimens using handspears (open bars) and underwater visual surveys (grey bars).
Final Report – Parrotfish Population Dynamics
Figure 5: A transverse section of the sagittal otolith of three individual Chlororus sordidus of various ages; a) 8 yrs old, b) 5 yrs old, c) 3 yrs old by transmitted light. Small squares denote the number of increments which were counted along the sulcal axes.

Final Report – Parrotfish Population Dynamics
Figure 6: Relationship between otolith weight (g) and age (years) for each sex. Data from Guam and Saipan have been combined.
Otolith weight (g)
0.000 0.005 0.010 0.015 0.020 0.025 0.030
Age
(yea
rs)
0
1
2
3
4
5
6
7
8
9 Females (n = 212; r2 = 0.84)Males (n = 151; r2 = 0.75)

Final Report – Parrotfish Population Dynamics
a) Guam (n = 335)
1 2 3 4 5 6 7 8 90.00
0.05
0.10
0.15
0.20
0.25
0.30
0.35b) Saipan (n = 48)
Age class (years)
1 2 3 4 5 6 7 8 9
Freq
uenc
y
0.0
0.1
0.2
0.3
0.4
0.5
0.6
0.7
c) Both sexes
Age class (years)
1 2 3 4 5 6 7 8 9
Freq
uenc
y
0.00
0.05
0.10
0.15
0.20
0.25
0.30
Female (n = 212)Male (n = 151)
Figure 7: Age frequency distribution of C.sordidus for a) Guam and b) Saipan and c) Both sexes (islands and sites combined).

Final Report – Parrotfish Population Dynamics
b)
Status
MPA FISHED
Mea
n ag
e (y
rs)
0
1
2
3
4
5FemalesMales
a)
Age class (yrs)
1 2 3 4 5 6 7 8 9
Freq
uenc
y
0.00
0.05
0.10
0.15
0.20
0.25
0.30
0.35MPA (n = 114)Fished (n = 179)
Figure 8: a) Age frequency distribution of C.sordidus sampled from Guam only within two Marine Preserves (MPA) and areas where fishing is permitted (Fished); b) Mean age for male and female C.sordidus sampled inside the Marine Preserves (MPA) and in areas open to fishing.

Final Report – Parrotfish Population Dynamics
a)
Age class (years)
0 1 2 3 4 5 6 7 8 9
Tota
l len
gth
(mm
)
0
50
100
150
200
250
300
FemaleMale
Age class (years)
0 1 2 3 4 5 6 7
Tota
l len
gth
(mm
)
0
50
100
150
200
250
300
Primary MalesSecondary Males
K0.8 1.0 1.2 1.4
L - i
nfin
ity
180
200
220
240
K0.4 0.8 1.2 1.6 2.0 2.4
L - i
nfin
ity
200
220
240
260
b)
Figure 9: von Bertalanffy growth curves fitted to C.sordidus length‐at‐age data for a) males and females and b) primary and secondary males. Embedded graphics for each are the 95% confidence regions for the parameters K and L∞

Final Report – Parrotfish Population Dynamics
Age class (yrs)
0 1 2 3 4 5 6 7 8 9
LN fr
eque
ncy
0
1
2
3
4
5
MPA y = -0.519x + 4.89 r2 = 0.94FISHED y = -0.623x + 5.67 r2 = 0.94
Figure 10: Age‐based catch curves for C.sordidus using annuli counts of otoliths from fish sampled within the Marine Preserves (MPA) and areas open to fishing (FISHED). Age 1 fish were not included in the analysis. Total instantaneous mortality rate, Z, is estimated as the absolute value of the slope.

Final Report – Parrotfish Population Dynamics
Figure 11: Micrograph of histological preparations for female C.sordidus; a) Immature; b) Resting; c) Ripe; Developed; e) Running ripe; Male; f) Primary male; h) Secondary male.
Final Report – Parrotfish Population Dynamics
Size class midpoint (mm)
100 120 140 160 180 200 220 240 260
Per
cent
mat
ure
0
25
50
75
100
Unprotected sitesProtected sites
Age class (years)
0 1 2 3 4 5 6 7 8 9
Per
cent
mat
ure
0
25
50
75
100
Unprotected sitesProtected sites
a)
b)
Figure 12: Maturation schedules for female Chlorurus sordidus by a) size and b) age compared between protected and unprotected sites.

Final Report – Parrotfish Population Dynamics
Size class midpoint (mm)
130 150 170 190 210 230 250 270
Per
cent
age
of m
ales
0
25
50
75
100
Protected sitesUnprotected sites
Figure 13: Size at 50% sex change for Chlorurus sordidus compared between protected and unprotected sites.

Final Report – Parrotfish Population Dynamics
a) GUAM
Double Reef
Tumon_Gun
Tumon_Mar
Governor'sAsan
Piti NPiti S
Cocos Ch
Cocos Is
TalafofoTogcha
Pago Bay
Hawaiian Rock
Harnom 1
Harnom 2Patti 1
Patti 2Patti 3
Spa
wne
r bio
mas
s (g
)
0
10000
20000
30000
40000
50000
b) ROTA
Iota NorthROT6
West Harbour
Sasanhaya Bay
Coral Gardens
Okgok
Mayor's Beach
Spa
wne
r bio
mas
s (g
)
0
10000
20000
30000
40000
c) SAIPAN
Wing Beach
Outer Managahan
Grand Hotel
Coral Ocean
Boy Scout
Laulau
Bird Island
Spa
wne
r bio
mas
s (g
)
0
10000
20000
30000
40000
Figure 14: Total spawner biomass (total biomass of individuals ≥ 16 cm size class) at each site for a) Guam, b) Rota, and c) Saipan from underwater visual surveys. Sites with grey bars represent marine protected areas.

Final Report – Parrotfish Population Dynamics
Total length (mm)
160 180 200 220
Ova
ry w
eigh
t (g)
-2
0
2
4
6
8
10
12
14
Unprotected sitesAchang Marine PreserveTumon Marine Preserve
r2 = 0.59
r2 = 0.48
r2 = 0.52
r2 = 0.97
Age class (years)
0 1 2 3 4 5 6 7 8 9
Mea
n G
SI
0.0
0.5
1.0
1.5
2.0
2.5
Figure 15: Length by ovary weight regressions for active mature Chlorurus sordidus females on Guam from unprotected sites and protected sites (Achang and Tumon Bay). Figure 16: Mean cumulative GSI by age class for mature active female Chlorurus sordidus. Error bars represent standard error.

Final Report – Parrotfish Population Dynamics
Total length (mm)
140 160 180 200 220 240 260 280 300 320
Gon
ad w
eigh
t (g)
0
2
4
6
8
10
IP - Primary malesTP - Primary malesTP - Secondary males
Male developmental stage
IP - Primary TP - Primary TP - Secondary
Gon
ad w
eigh
t (g)
0
2
4
6
8
10
Figure 17: Plot of individual gonad weight by total length for initial phase primary males, terminal phase primary males, and terminal phase secondary males. Figure 18: Mean gonad weight for initial phase primary males, terminal phase primary males, and terminal phase secondary males.

Final Report – Parrotfish Population Dynamics
Size class midpoint (mm TL)
10 13 16 19 22 25
Freq
uenc
y (%
)
40
30
20
10
0
10
20
30
40
n = 1819
n = 2482
Shallow
Deep
Figure 19: Size frequency distributions among 2 reef slope zones from Guam using underwater visual surveys. White bars (shallow) are depths 3‐6 m and grey bars (deep) are 9‐12 m.

Final Report – Parrotfish Population Dynamics
a) East Coast - GUAM
10 13 16 19 22 25 28 31
Freq
uenc
y
0.0
0.1
0.2
0.3
0.4
b) West Coast - GUAM
Size class (cm)
10 13 16 19 22 25 28 310.0
0.1
0.2
0.3
0.4
Initial phaseTerminal phase
Figure 20: Size frequency distributions of Chlorurus sordidus separated by initial phase (IP) (black bars) and terminal phase (TP) (gray bars) for sites along the a) East coast and b) West coasts of Guam.

Final Report – Parrotfish Population Dynamics

Final Report – Parrotfish Population Dynamics
Double Reef
10 13 16 19 22 25 28 310.0
0.1
0.2
0.3
0.4
0.5
0.6
IPTP
Tumon Gun Beach
10 13 16 19 22 25 28 310.0
0.1
0.2
0.3
IPTP
Tumon Marriott
10 13 16 19 22 25 28 310.0
0.1
0.2
0.3
0.4
IPTP
Governor's Complex
10 13 16 19 22 25 28 31
Freq
uenc
y
0.0
0.1
0.2
0.3
0.4
0.5
IPTP
Asan Bay
10 13 16 19 22 25 28 310.0
0.1
0.2
0.3
0.4
0.5
IPTP
Piti MP North
10 13 16 19 22 25 28 310.0
0.1
0.2
0.3
0.4
0.5
0.6
IPTP
Piti MP South
10 13 16 19 22 25 28 310.0
0.1
0.2
0.3
0.4
0.5
0.6
IPTP
Cocos Channel
Size class (cm)
10 13 16 19 22 25 28 310.0
0.1
0.2
0.3
0.4
IPTP
Cocos Island
10 13 16 19 22 25 28 310.0
0.1
0.2
0.3
0.4
IPTP
Figure 21a: Size frequency distributions of Chlorurus sordidus separated by initial phase (IP) (black bars) and terminal phase (TP) (gray bars) for sites around Guam

Final Report – Parrotfish Population Dynamics
Talafofo Bay
10 13 16 19 22 25 28 310.0
0.1
0.2
0.3
0.4
0.5
0.60.7
IPTP
Togcha Bay
10 13 16 19 22 25 28 310.0
0.1
0.2
0.3
0.4
IPTP
Pago Bay
10 13 16 19 22 25 28 310.0
0.1
0.2
0.3
0.4
0.5
IPTP
Hawaiian Rock
10 13 16 19 22 25 28 31
Freq
uenc
y
0.0
0.1
0.2
0.3
0.4
0.5
0.6
IPTP
Harnom 1
10 13 16 19 22 25 28 310.0
0.1
0.2
0.3
0.4
0.5
0.6
0.7
IPTP
Harnom 2
10 13 16 19 22 25 28 310.0
0.1
0.2
0.3
0.4
0.5
IPTP
Patti Point 3
10 13 16 19 22 25 28 310.0
0.1
0.2
0.3
0.4
IPTP
Patti Point 2
Size class (cm)
10 13 16 19 22 25 28 310.0
0.1
0.2
0.3
0.4
IPTP
Patti Point 1
10 13 16 19 22 25 28 310.0
0.1
0.2
0.3
0.4
0.5
IPTP
Figure 21b: Size frequency distributions of Chlorurus sordidus separated by initial phase (IP) (black bars) and terminal phase (TP) (gray bars) for sites around Guam.

`
Grand Hotel
10 13 16 19 22 25 28 310.0
0.1
0.2
0.3
0.4IPTP
Outer Managahan
10 13 16 19 22 25 28 310.0
0.1
0.2
0.3
0.4
IPTP
Wing Beach
10 13 16 19 22 25 28 310.0
0.1
0.2
0.3
0.4
IPTP
Bird Island
10 13 16 19 22 25 28 310.0
0.1
0.2
0.3
IPTP
Boy Scout
10 13 16 19 22 25 28 310.0
0.1
0.2
0.3
0.4
0.5
IPTP
Coral Ocean
10 13 16 19 22 25 28 31
Freq
uenc
y
0.0
0.1
0.2
0.3
0.4
IPTP
Laulau
10 13 16 19 22 25 28 310.0
0.1
0.2
0.3
0.4
IPTP
Size class (cm)
Figure 22: Size frequency distributions of Chlorurus sordidus separated by initial phase (IP) (black bars) and terminal phase (TP) (gray bars) for sites around Saipan.

51
Final Report – Parrotfish Population Dynamics
Sasanhaya Bay
Size class (cm)
10 13 16 19 22 25 28 310.0
0.1
0.2
0.3
0.4
IPTP
West Harbour
10 13 16 19 22 25 28 310.0
0.1
0.2
0.3
0.4
IPTP
Iota North
10 13 16 19 22 25 28 310.0
0.1
0.2
0.3
0.4
0.5
IPTP
Coral Gardens
10 13 16 19 22 25 28 310.0
0.1
0.2
0.3
0.4
IPTP
Mayor's Beach
10 13 16 19 22 25 28 31
Freq
uenc
y
0.0
0.1
0.2
0.3
0.4
0.5
IPTP
Okgok
10 13 16 19 22 25 28 310.0
0.1
0.2
0.3
0.4
IPTP
ROT6
10 13 16 19 22 25 28 310.0
0.1
0.2
0.3
0.4
IPTP
Figure 23: Size frequency distributions of Chlorurus sordidus separated by initial phase (IP) (black bars) and terminal phase (TP) (gray bars) for sites around Rota

52
Final Report – Parrotfish Population Dynamics
Island
GUAM ROTA SAIPAN
Mea
n TL
(cm
) +S
E
10
12
14
16
18
20
22
24
26
Initial phaseTerminal phase
Island
GUAM ROTA SAIPAN
Mea
n bi
omas
s (g
) tra
nsec
t-1
0
1000
2000
3000
4000
5000
6000
7000
MPAFished
Figure 24: Mean size of Chlorurus sordidus initial and terminal phase adults from the underwater visual surveys at Guam, Rota and Saipan. Figure 25: Mean biomass of Chlorurus sordidus for sites within protected areas (MPA’s) and areas open to fishing (Fished) calculated from the underwater visual surveys at Guam, Rota and Saipan.

53
Final Report – Parrotfish Population Dynamics
a) GUAM MPA
10 13 16 19 22 25 28 310.0
0.1
0.2
0.3
0.4b) GUAM FISHED
10 13 16 19 22 25 28 310.0
0.1
0.2
0.3
0.4
c) ROTA MPA
10 13 16 19 22 25 28 31
Freq
uenc
y
0.0
0.1
0.2
0.3
0.4 d) ROTA FISHED
10 13 16 19 22 25 28 310.0
0.1
0.2
0.3
0.4
e) SAIPAN MPA
Size class midpoint (cm)
10 13 16 19 22 25 28 310.0
0.1
0.2
0.3
0.4Initial phaseTerminal phase
f) SAIPAN FISHED
Size class midpoint (cm)
10 13 16 19 22 25 28 310.0
0.1
0.2
0.3
0.4Initial phaseTerminal phase
Figure 26: Size frequency distributions of C.sordidus from Guam (a,b), Rota (c,d) and Saipan (e,f) grouped across Marine Preserve (MPA) sites and those open to fishing (FISHED). Data were collected using underwater visual surveys.

54
Final Report – Parrotfish Population Dynamics
GUAM
Double Reef
Tumon_Gun
Tumon_Mar
Governor'sAsan
Piti NPiti S
Cocos Ch
Cocos Is
TalafofoTogcha
Pago
Hawaiian Rock
Harnom1
Harnom2Patti1
Patti2Patti3
No.
sca
rids
> 40
cm
0
5
10
15
20
ROTA
Iota NorthROT6
West Harbour
Sasanhaya Bay
Coral Gardens
Okgok
Mayor's Beach
No.
sca
rids
> 40
cm
0
5
10
15
20
SAIPAN
Wing Beach
Outer Managahan
Grand Hotel
Coral Ocean
Boy Scout
Laulau
Bird Island
No.
sca
rids
> 40
cm
0
5
10
15
20
Figure 27: Abundance of parrotfish >40 cm at all sites around Guam, Rota and Saipan

55
Final Report – Parrotfish Population Dynamics
a) b) Figure 28: NMDS plots of total parrotfish biomass labeled by a) degree of exposure and b) degree of protection against fishing

56
Final Report – Parrotfish Population Dynamics
Calotomus carolinusr2 = 0.29***
1980 1985 1990 1995 2000 2005 20100.1
0.2
0.3
0.4
0.5
0.6
0.7
Chlorurus frontalisr2 < 0.01
1980 1985 1990 1995 2000 2005 2010
0.5
1.0
1.5
2.0
2.5
Chlorurus sordidusr2 = 0.06
1980 1985 1990 1995 2000 2005 2010
Mea
n w
eigh
t of i
ndiv
idua
ls h
arve
sted
(kg)
0.2
0.3
0.4
0.5
0.6
0.7
Scarus festivusr2 = 0.05
1980 1985 1990 1995 2000 2005 20100.0
0.2
0.4
0.6
0.8
1.0
1.2
1.4
Scarus frenatusr2 = 0.53***
Year1980 1985 1990 1995 2000 2005 2010
0.0
0.2
0.4
0.6
0.8
1.0
1.2
1.4
Cetoscarus bicolorr2 = 0.35***
1980 1985 1990 1995 2000 2005 20100.0
0.5
1.0
1.5
2.0
2.5
3.0
3.5
Chlorurus microrhinosr2 = 0.43***
1980 1985 1990 1995 2000 2005 2010
0.4
0.8
1.2
1.6
2.0
Scarus altipinnisr2 = 0.27***
1980 1985 1990 1995 2000 2005 2010
Mea
n w
eigh
t of i
ndiv
idua
ls h
arve
sted
(kg)
0.4
0.6
0.8
1.0
1.2
1.4
1.6
Scarus forstenir2 = 0.03
1980 1985 1990 1995 2000 2005 20100.0
0.5
1.0
1.5
2.0
Scarus ghobbanr2 = 0.05
Year1980 1985 1990 1995 2000 2005 2010
0.2
0.3
0.4
0.5
0.6
0.7
0.8
0.9
Figure 29a: Changes in mean size of ten key parrotfish species from creel survey data collected by DAWR since 1982.

57
Final Report – Parrotfish Population Dynamics
Scarus globicepsr2 = 0.02
1980 1985 1990 1995 2000 2005 20100.0
0.1
0.2
0.3
0.4
0.5
0.6
Scarus psitticusr2 = 0.11
1980 1985 1990 1995 2000 2005 2010
0.1
0.2
0.3
0.4
0.5
0.6
Scarus rubrioviolaceusr2 < 0.01
1980 1985 1990 1995 2000 2005 2010
Mea
n w
eigh
t of i
ndiv
idua
ls h
arve
sted
(kg)
0.5
1.0
1.5
2.0
2.5
3.0
3.5
Scarus schlegelir2 = 0.05
1980 1985 1990 1995 2000 2005 2010
0.2
0.4
0.6
0.8
1.0
Hipposcarus longicepsr2 = 0.58***
Year1980 1985 1990 1995 2000 2005 2010
0.4
0.6
0.8
1.0
1.2
1.4
1.6
1.8
2.0
Figure 29a: Changes in mean size of five key parrotfish species from creel survey data collected by DAWR since 1982.

58
Final Report – Parrotfish Population Dynamics
DISCUSSION The data collected during this project provided valuable information on the demography, reproductive capacity and distribution patterns of the common bullethead parrotfish Chlorurus sordidus. Successful otolith analysis confirmed earlier work by Choat et al. (1995) that C.sordidus is short lived attaining a maximum age of 9 yrs with rapid initial growth. There were significant differences in the growth rates between sexes; males grew faster, and attained a larger maximum size compared with females. Sampling within Guam’s Marine Preserves revealed an unexpected result with little or no significant build‐up of older age classes in these areas closed to fishing. Chlorurus sordidus reached first maturity rapidly and within the first 18 months of age. Diandric protogyny was confirmed using histological techniques. Males have two sexual pathways, developing from mature females (secondary males) or directly from immature fish (primary males). Sex change takes place above 200 mm. On Guam the spawner biomass was greatest within the Tumon Marine Preserve, which had a higher proportion of large IP individuals. Mature active females reach their maximum reproductive potential rapidly and within the first 3 years of age or >160 mm total length. Initial phase, primary males had disproportionately larger gonads than either primary or secondary terminal phase males. A comparison of size frequency distributions across all sites revealed this species showed no apparent preference for habitat between 3 and 12 m. However multiple regression analysis suggests the abundance of this species in shallow areas is driven largely by the presence of the “farming” surgeonfish, Acanthurus lineatus. On the Great Barrier Reef, differences in feeding rates among sites were attributed to not only habitat differences but also the presence of A.lineatus which aggressively evicts C.sordidus from its territories (Bellwood 1995). Two species Chlorurus microrhinos and C.sordidus have been identified as the dominant group of bioeroders and producers of sediment in the Indo‐Pacific (Bellwood 1995 MEPS). They erode material from the reef, modify the sediment size and transport it away from the reef proper (Bellwood 1995 MEPS). For larger excavator species like C.microrhinos, sedimentation is directly removed from the reef through defecation in deeper areas. Smaller eroding and scraping species like C.sordidus that defecate in their own feeding areas, however reworked material (particularly smaller size sediment) is returned to the reef then lost through hydrological processes. The reduction in the mean size of parrotfish, observed from the creel survey data has wider implications beyond a loss of biomass and reproductive potential. A reduction in mean body size also impacts ecosystem function because of the non‐linear relationship between parrotfish body size and function performance (Lokrantz et al 2008). In the western Indian Ocean, larger individuals of C.sordidus and the congeneric species of C.microrhinos, C.strongylocephalus had higher bite rates per minute compared with smaller fish, which increased markedly above 15‐20 cm (Lokrantz et al 2008). The authors suggest these species become functionally more mature upon reaching a (species specific) key size. They argue that body size is an equally if not more important variable to consider than abundance and biomass when ecosystem‐level effects of overfishing are investigated. It is likely that on Guam a reduction of both the mean size and biomass (through overfishing) of important

59
Final Report – Parrotfish Population Dynamics
excavating species such as Cetoscarus bicolour, Chlorurus microrhinos and Scarus altipinnus has probably lead to significant loss of ecosystem function.

60
Final Report – Parrotfish Population Dynamics
REFERENCES Adams, S., et al. Geographic variation in the sex ratio, sex specific size, and age structure of
Plectropomus leopardus (Serranidae) between reefs open and closed to fishing on the Great Barrier Reef. Canadian Journal of Fisheries and Aquatic Sciences [ (2000): 1448‐58.
Alwany,M., Thaler,E., Stachowitsch, M. Parrotfish bioerosion on Egyptian Red Sea reefs. Journ.Exp. Mar.Bio.Ecol. 371,170‐176. 2009
Bell, J. D., Craik, G. J. S., Pollard, D., and Russell, B. C. Estimating length frequency distributions of large reef fish underwater. Coral Reefs 4, 41‐44. 1985.
Bellwood,D.R.Carbonate transport and within‐reef patterns of bioerosion and sediment release by parrotfishes (family Scaridae) on the Great Barrier Reef. Mar Ecol. Prog. Ser. 117:127‐136.1995
Beverton, R. J. H. and S. J. Holt. On the Dynamics of Exploited Fish Populations. London: Chapman and Hall, 1957.
Bray, J. R. and J. T. Curtis. An ordination of the upland forest communities of southern Wisconsin. Ecological Monographs 27.4 (1957): 325‐47.
Cappo, M., et al. A new approach to validation of periodicity and timing of opaque zone formation in the otoliths of eleven species of Lutjanus from the central Great Barrier Reef. Fish.Bull. 98 (2000): 474‐88.
Choat, J. H., L. M. Axe, and D. C. Lou. Growth and longevity in fishes of the family Scaridae.Marine Ecology Progress Series 145 (1996): 33‐41.
Choat, J. H. and D. R. Bellwood. Interactions amongst herbivorous fishes on a coral reef: influence of spatial variation. Marine Biology 89 (1985): 221‐34.
Choat, J. H. and D. R. Robertson. Age‐Based Studies.Coral Reef Fishes: Dynamics and diversity in a complex ecosystem. Ed. P. F. Sale. San Diego: Academic Press, 2002. 57‐80.
Choat, J. H., et al. An age‐based demographic analysis of the Caribbean stoplight parrotfish Sparisoma viride. Marine Ecology Progress Series 246 (2003): 265‐77.
English, S., Wilkinson, C., and Baker, V. J. Survey manual for tropical marine resources. (1997).
Graham, N. A. J., et al. Dynamic fragility of oceanic coral reef ecosystems. Proceedings of the National Academy of Sciences 103.22 (2006): 8425‐29.
Gust, N. Variation in the population biology of protogynous coral reef fishes over tens of kilometres. Can J Fish Aquat Sci 61 (2004): 205‐18.
Gust, N., J. H. Choat, and J. L. Ackerman. Demographic plasticity in tropical reef fishes. Marine Biology 140 (2002): 1039‐51.

61
Final Report – Parrotfish Population Dynamics
Lokrantz,J.,Nystrom,M.,Thyresson,M.,Johansson,C. The non‐linear relationshp between body size and function in parrtofishes. Coral Reefs. (2009)
Mumby, P. J., et al. Fishing, trophic cascades and the process of grazing on coral reefs. Science 311 (2006): 98‐101.
Pears, R. J., et al. Demography of a large grouper, Epinephelus fuscoguttatus, from Australia's Great Barrier Reef: implications for fishery management. Marine Ecology Progress Series 307 (2006): 259‐72.
Randall, J. E., G. R. Allen, and R. C. Steene. Fishes of the Great Barrier Reef and Coral Sea. Ed. J. E. Randall, G. R. Allen, and R. Steene. Bathurst, Australia: Crawford House Press, 1990.
Ricker, W. E. Computation and interpretation of biological statistics of fish populations. Bull.Fish.Res.Bd.Can 191 (1975): 382.
Russ, G. R. Marine Reserves As Reef Management Tools: Yet Another Review. Ed. P. F. Sale. Academic Press, 2002.
Russ, G. R., Dong, C. L., Higgs, J. B., and Ferreira, B. P. Mortality rate of a cohort of the coral trout,Plectropomus leopardus,in zones of the Great Barrier Reef Marine Park closed to fishing. Mar Freshwater Res 49, 507‐11. 1998.
West, G. Methods of Assessing Ovarian Development in Fishes: a Review. Aust J Mar Freshwat Res 41 (1990): 199‐222.
Williams, A. J., et al. Scales of spatial variation in demography of a large coral reef fish ‐ an exception to the typical model? Fisheries Bulletin 101 (2003): 673‐83.
Zar, J. H. Biostatistical Analysis. 3 ed. London: Prentice‐Hall International, 1996.