parlemeter 2016 - european parliament...june 2009 eb71.3 oct.-nov. 2009 eb72.4 may 2010 eb73.4 may...
TRANSCRIPT

STUDY Public Opinion Monitoring Series
Directorate-General for Communication
Author: Jacques Nancy, Public Opinion Monitoring Unit
Published by EPRS | European Parliamentary Research Service
PE 589.762 - November 2016
Parlemeter 2016
Socio-demographic focus
Special Eurobarometer of the European Parliament


3
TABLE OF CONTENTS
INTRODUCTION ................................................................................................................ 5
A. MEMBERSHIP AND BENEFITS OF BEING A MEMBER OF THE EUROPEAN UNION ........... 9
I. MEMBERSHIP OF THE EUROPEAN UNION ....................................................................... 9
1) Focus on age ......................................................................................................................... 10
2) Focus on gender .................................................................................................................... 12
3) Focus on occupational groups .............................................................................................. 14
II. BENEFITS OF MEMBERSHIP .......................................................................................... 17
1) Focus on age ......................................................................................................................... 18
2) Focus on gender .................................................................................................................... 20
3) Focus on occupational groups .............................................................................................. 22
B. THE VOICE OF EUROPEAN CITIZENS ..........................................................................25
I. MY VOICE COUNTS IN THE EU ...................................................................................... 25
1) Focus on age ......................................................................................................................... 26
2) Focus on gender .................................................................................................................... 30
3) Focus on occupational groups .............................................................................................. 34
II. MY VOICE COUNTS IN OUR COUNTRY .......................................................................... 37
1) Focus on age ......................................................................................................................... 38
2) Focus on gender .................................................................................................................... 42
3) Focus on occupational groups .............................................................................................. 46
C. THE EUROPEAN PARLIAMENT .................................................................................. 49
I. INFORMATION ABOUT THE EUROPEAN PARLIAMENT ................................................... 49
1.1. Media recall ................................................................................................................................ 49
1) Focus on age ......................................................................................................................... 50
2) Focus on gender .................................................................................................................... 54
3) Focus on occupational groups .............................................................................................. 58
1.2. Feeling informed about the European Parliament’s activities ................................................... 61
1) Focus on age ......................................................................................................................... 62
2) Focus on gender .................................................................................................................... 66
3) Focus on occupational groups .............................................................................................. 69
II. IMAGE AND ROLE OF THE EUROPEAN PARLIAMENT ..................................................... 73
2.1. General image of the European Parliament ............................................................................... 73
1) Focus on age ......................................................................................................................... 74
2) Focus on gender .................................................................................................................... 78
3) Focus on occupational groups .............................................................................................. 81
2.2. Role of the European Parliament in the future .......................................................................... 85
1) Focus on age ......................................................................................................................... 86
2) Focus on gender .................................................................................................................... 88
3) Focus on occupational groups .............................................................................................. 90
4
III. KNOWLEDGE OF THE EUROPEAN PARLIAMENT ............................................................ 93
3.1. How the European Parliament works......................................................................................... 93
1) Focus on age ......................................................................................................................... 94
2) Focus on gender .................................................................................................................... 96
3) Focus on occupational groups .............................................................................................. 98
3.2. The decision-making procedure of the European Parliament.................................................. 101
1) Focus on age ....................................................................................................................... 102
2) Focus on gender .................................................................................................................. 104
3) Focus on occupational groups ............................................................................................ 106
5
Age groups Gender Occupation
INTRODUCTION
An analysis of the results in accordance with the gender, age and occupational category of Europeans
reveals a number of trends. Overall:
- The feeling of membership to the EU is more widespread among young Europeans than among older people. People aged 15-24 years are also more likely to consider that their country has benefited from EU membership, and that their country’s voice counts in the EU;
- Men are more likely to remember having recently seen, read or heard something about the EP in the media than women. They also feel more informed about the EP’s activities and have a better knowledge of the way in which the European Parliament works than women. Women are more likely to have a neutral image of the EP;
- Some variations can be seen between occupational categories: managers are more likely
to consider that the membership of their country to the EU is a “good thing” and that it has benefited of membership than housepersons and manual workers. European Parliament conjures up a better image among managers, who also are more knowledgeable about the EP than other categories. Conversely, manual workers, housepersons and unemployed people feel less informed about the EP’s activities, and are more likely to have a negative image about the EP.

6
In detail:
Membership and benefits of being a member of the EU
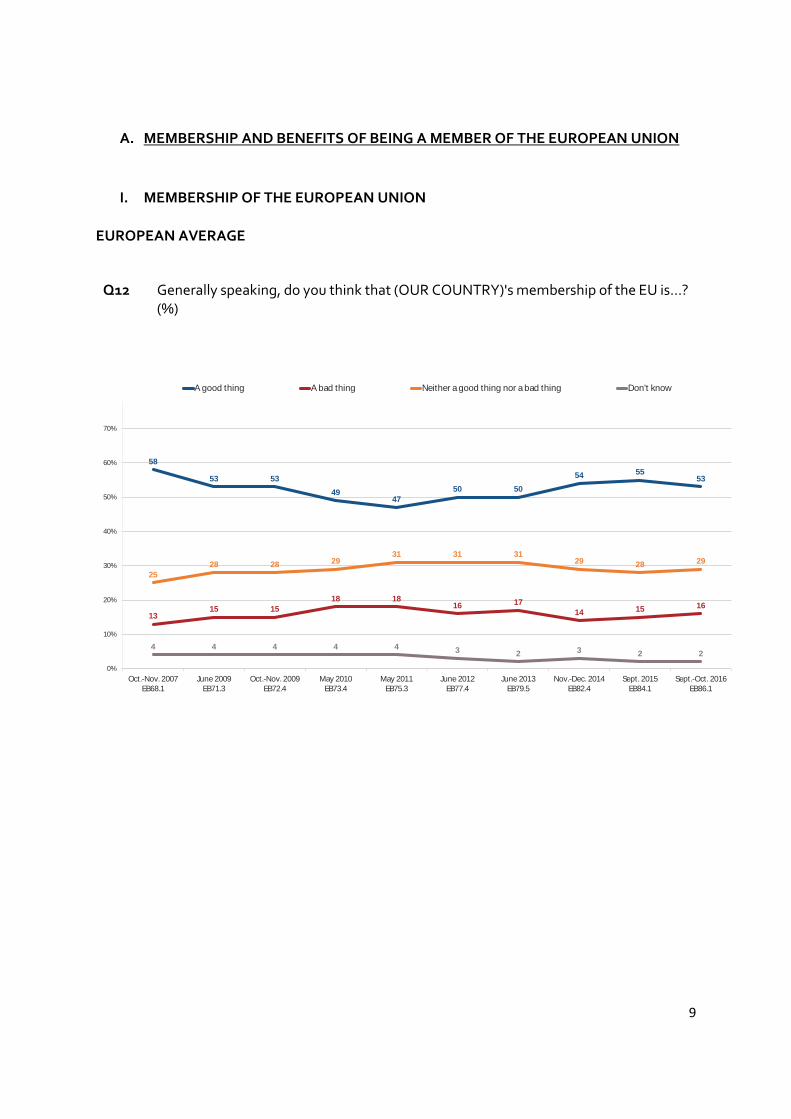
- More than half of men (54%), women (52%), and respondents aged less than 55 years consider that their country’s membership of the EU is “a good thing” (53% at EU level). This opinion is also the view of just below 50% of those aged 55+, though also forming a clear majority (49% “a good thing”, 19% “a bad thing” and 29% “neither a good thing nor a bad thing”).
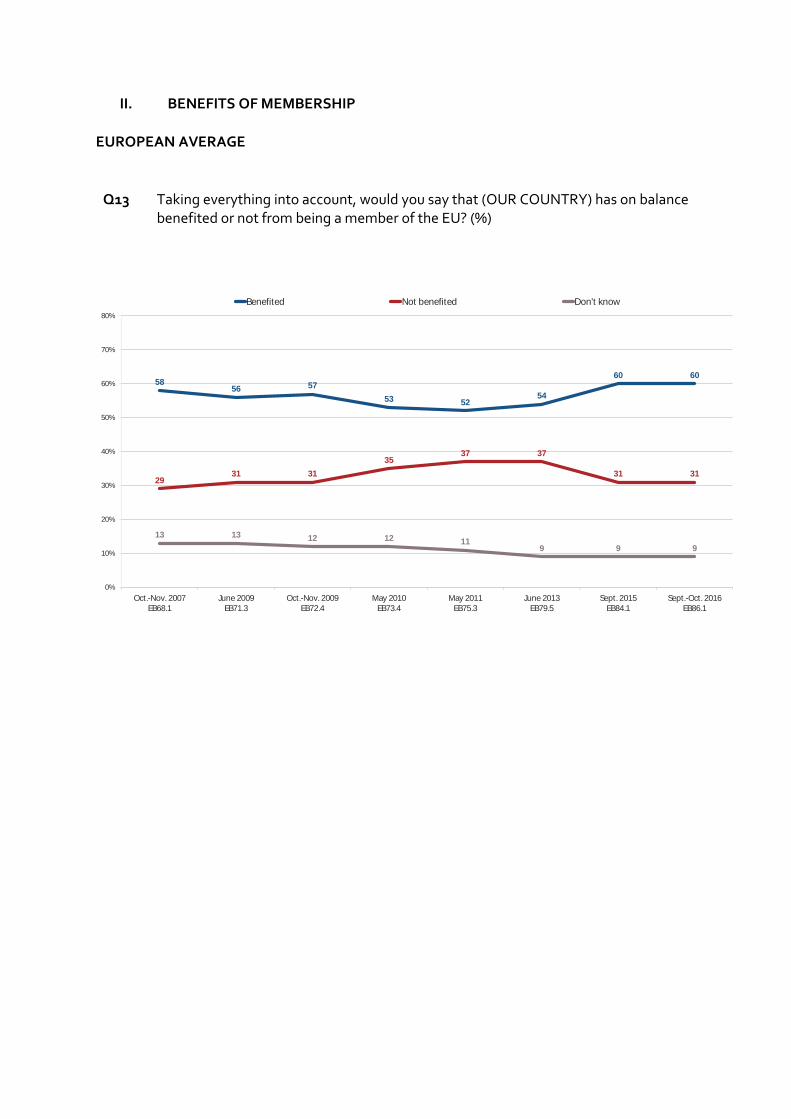
- The feeling that their country has benefited from being a member of the EU (60% at EU level) is predominant in all categories, and is most widespread among men (61%) and respondents aged 15-24 years (68%) and 25-39 years (65%).
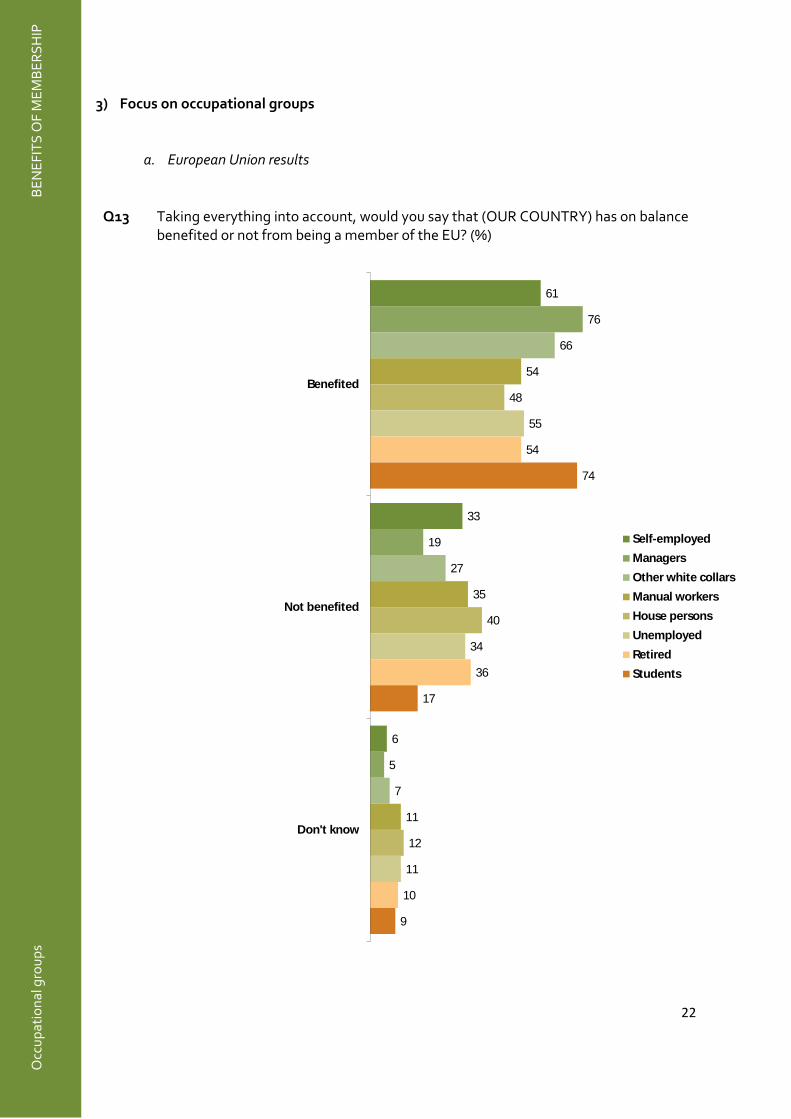
- Majorities of respondents in all occupational categories consider that membership is a good
thing, and that their country has benefited from its membership. However, large variations
exist between occupational categories, with proportions of “a good thing” ranging from 44%
for housepersons, to 69% for managers; and from 48% for housepersons to 76% for managers
for the answer “benefited”.
- In all categories, the main reason why respondents consider that their country has benefited of its membership is that the EU contributes to the economic growth in their country (35% at EU level). This opinion is more widespread among men (38%), respondents aged less than 40 years (37%) and managers (43%), than among women (32%), 55+ (34%) and housepersons (32%). The opinion that the EU contributes to maintaining peace and strengthening security is more mentioned by respondents aged 55+ (32%) and managers (33%), while “the EU brings [national] people new work opportunities” is more cited by those aged 15-24 years (34%) and students (34%).
7
The voice of the European citizens
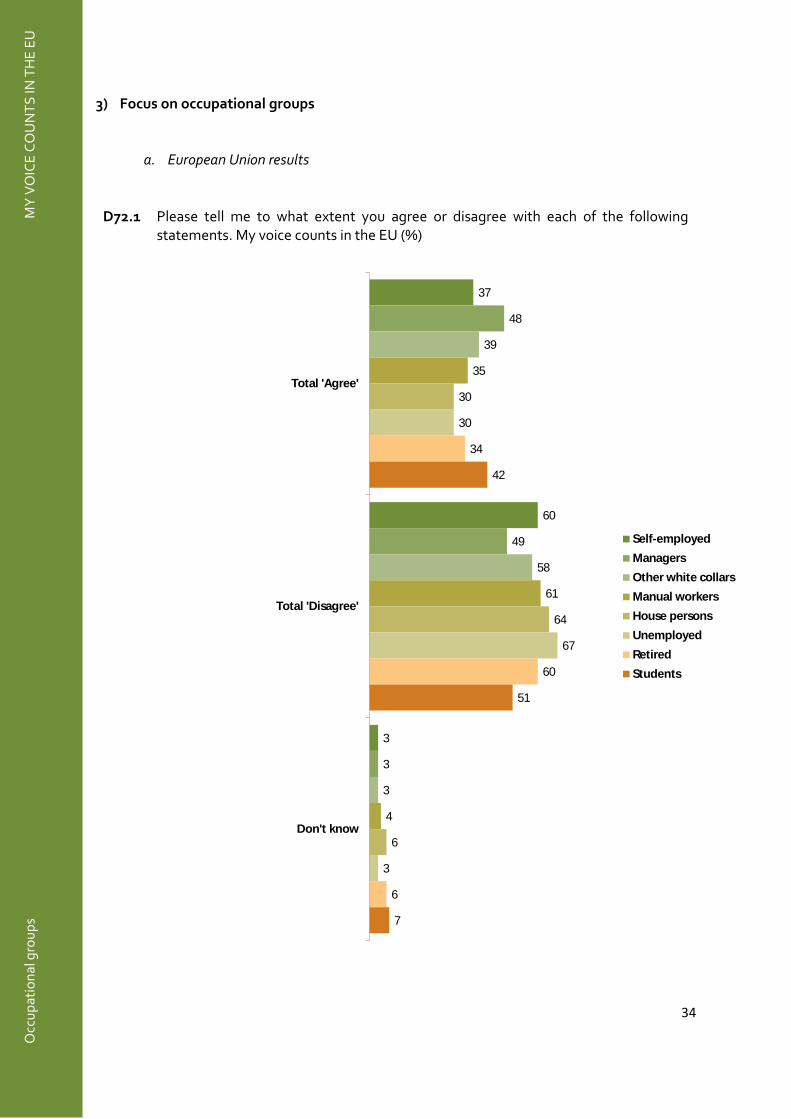
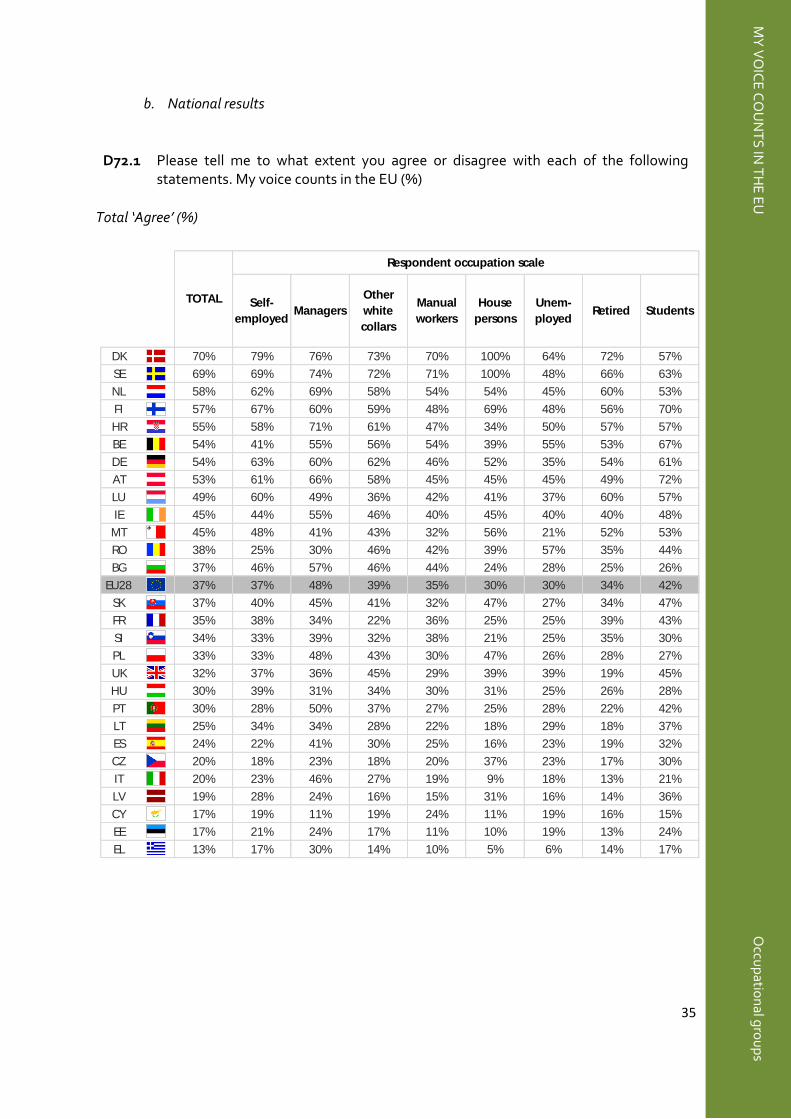
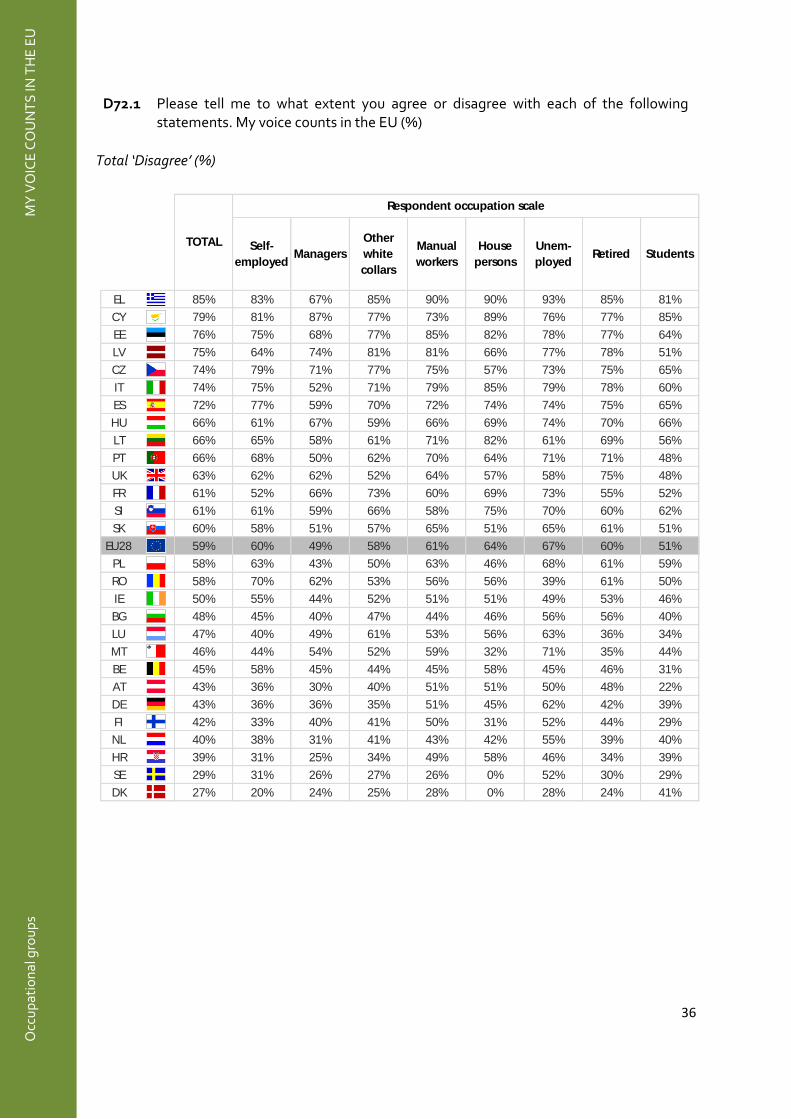
- On the one hand, a majority of respondents in all categories believe that their voice does not count in the EU (59% at EU level). While there are few variations between men and women, this feeling is slightly more widespread among respondents aged 40-54 years (60%) and 55+ (59%) than among respondents aged 15-24 years (54%). Differences are more pronounced between the occupational categories: around two-thirds of unemployed people (67%) and housepersons (64%) disagree that their voice count in the EU, whereas less than half of managers think so (49% “disagree” vs. 48% “agree”).
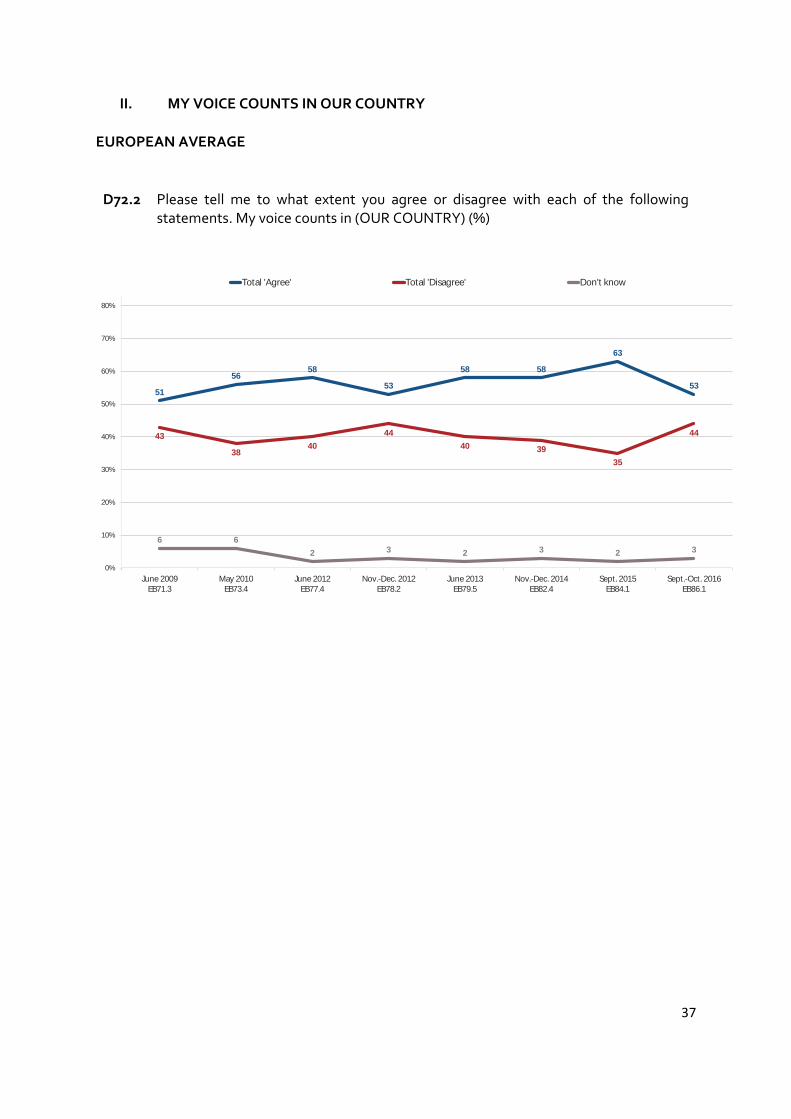
- On the other hand, a majority of respondents think that their voice does count in their country (53% at EU level): More than half of men, women, and respondents of the different age groups agree that their voice counts in their country. Important differences can be seen between the different occupational groups: the feeling that their voice counts in their country is predominant among most categories, but ranges from 51% for manual workers and 52% of self-employed people up to 66% among managers. However, only minorities of housepersons (44% “agree” vs. 52%) and unemployed (42% vs. 56%) share the same opinion. Only few variations exist between men and women and the different age groups.
Information about the European Parliament
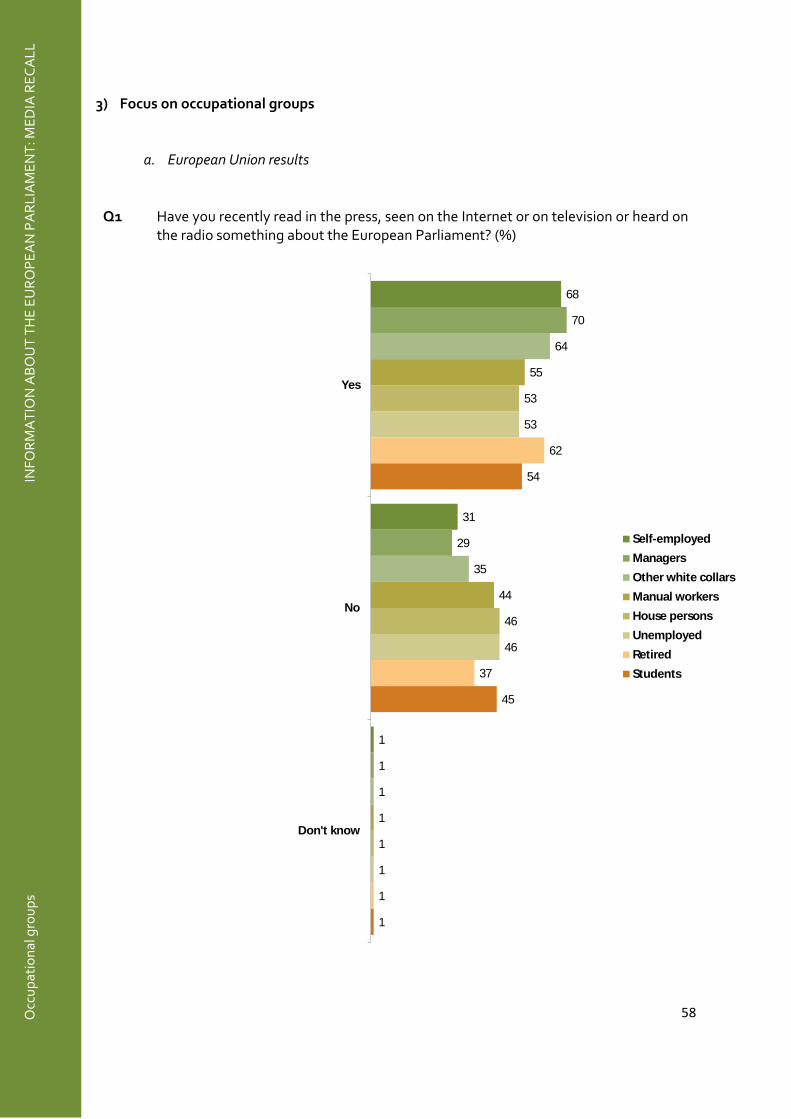
- Majorities of respondents remember having recently seen, read or heard something about the EP in the media (60% at EU level): media recall increases with the age of the respondents, from 50% among the 15-24 year-olds, up to 63% among those aged 40 and above. Close to two-thirds of men remember having recently encountered information about the EP (64%) compared with 57% of women. While just above half of housepersons (53%), unemployed (53%) and students (54%) remember
information about the EP, this proportion reaches 64% for other with collars, 68% of self-
employed and 70% of managers.
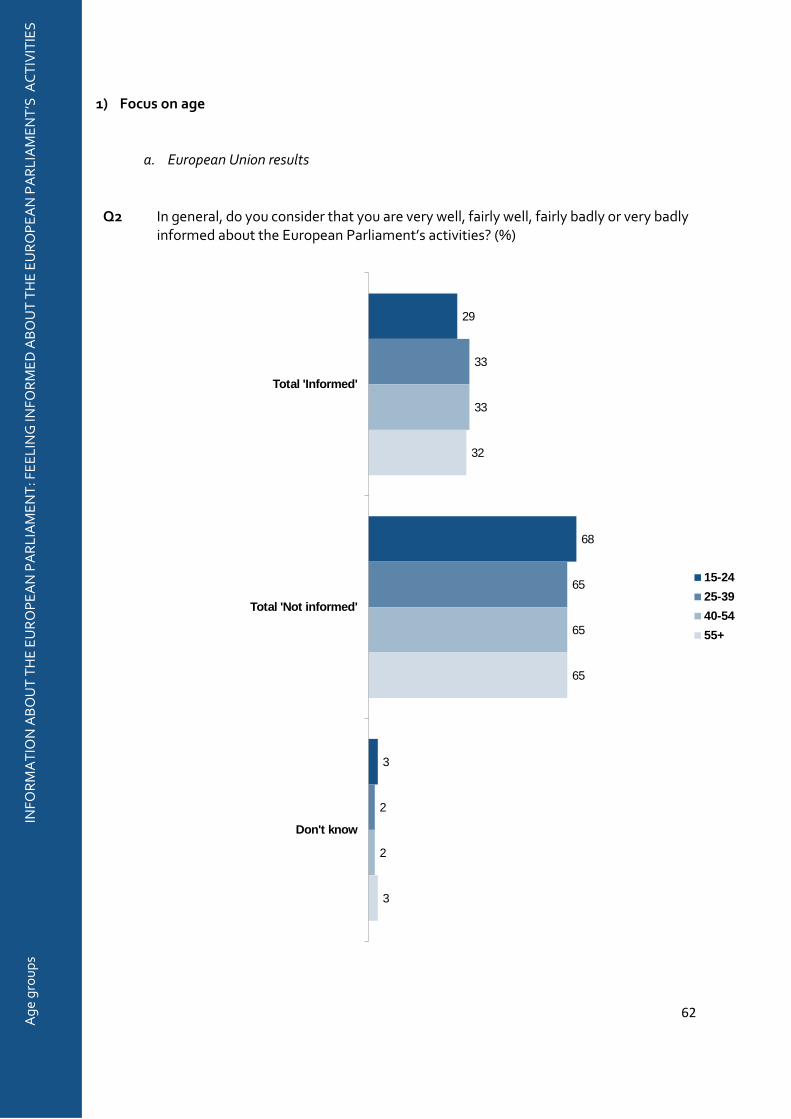
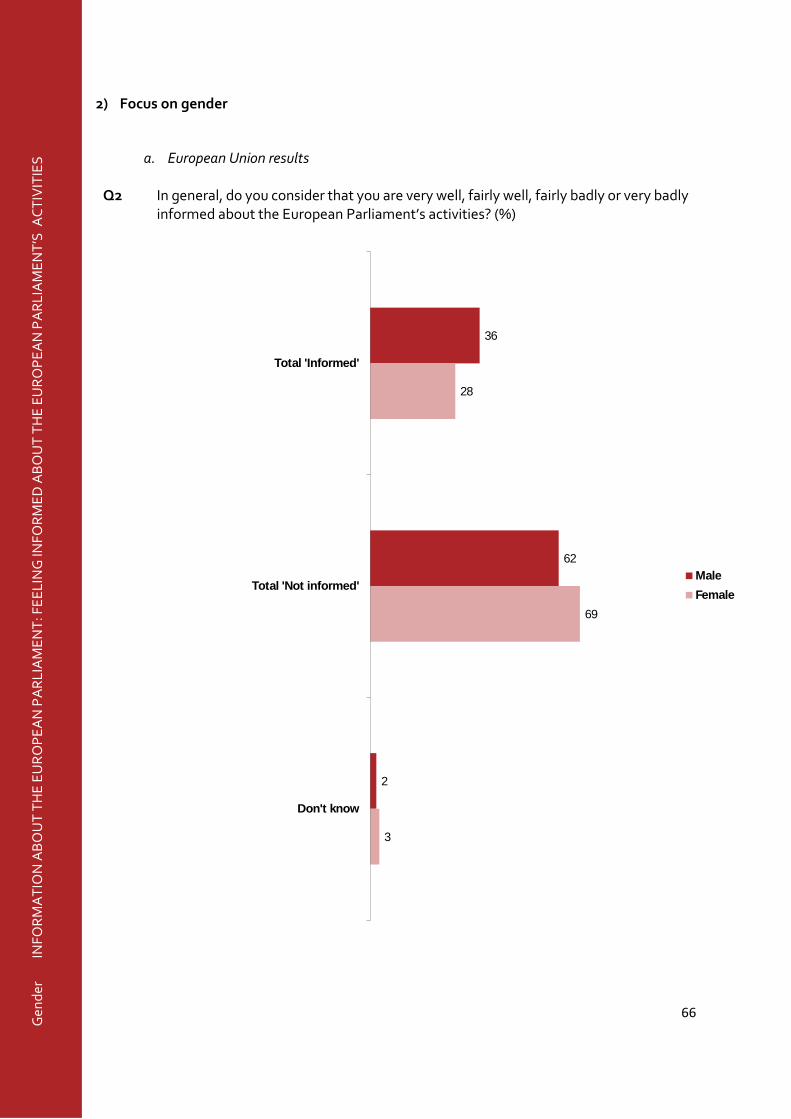
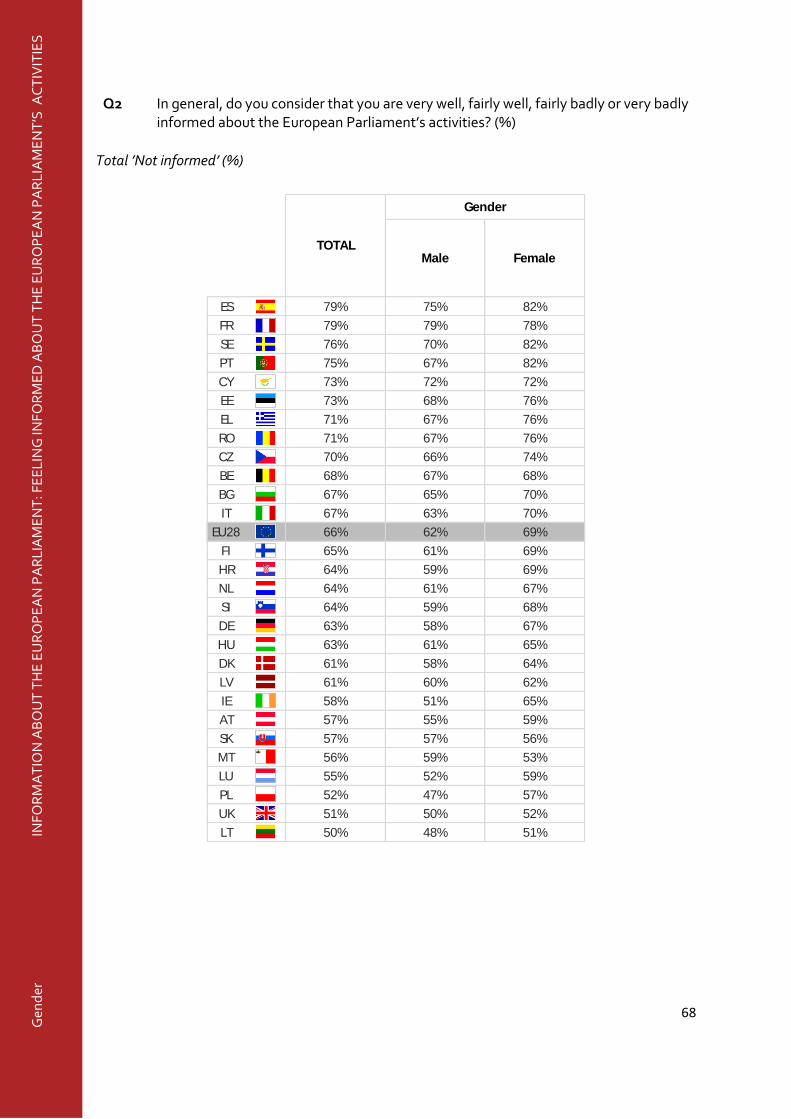
- Majorities of respondents feel “badly informed” about the European Parliament’s activities (66% at EU level) in the different categories of gender, age, and occupation: this feeling is more widespread among women (69%), young people aged 15-24 years (68%), unemployed (71%) and housepersons (75%), than among men (62%), respondents aged 25+ (65%) and managers (55%).
8
Image and role of the European Parliament
- The EP conjures up a neutral image and should play a more important role than it currently does for a majority of respondents in all categories. This neutral image (44% at EU level) is more widespread among respondents under 40 (48%),
women (46%), students (48%) and manual workers (47%). While proportions of positive and
negative perceptions of the EP are the same among women (25% vs. 25%), negative
perceptions outweigh positive ones among men, respondents aged 40+, manual workers,
unemployed, retired, housepersons and self-employed. Conversely, positive perceptions are
predominant among managers (30% “positive” vs. 23% “negative”) and other white collars
(29% vs. 25%).
- Majorities of respondents (46% at EU level) would like the EU to play a more important role than it currently does among men, women, the different age groups and occupational categories. This feeling is more widespread among those aged 15-24 years (52%) and 25-39 years (50%), than among 55+ (43%). Variations are slightly more pronounced between students (56% of answers “more important”)
and housepersons and retired (both 43%). In all categories analysed, less than a third would like
the EP to play a role “less important” than it currently does.
Knowledge of the European Parliament
- Majorities of respondents know that MEPs sit in the EP according to their political affinities (47% at EU level), this opinion being predominant among men, women, the different age groups and occupational categories. It is more widespread among men (51%), self-employed people (51%) and managers (51%). The incorrect opinion that MEPs sit according their nationality is more widespread among other white collars (42%), managers (39%) and respondents aged 25-39 years (38%).
- In most categories, majorities of respondents consider that EP’s decisions are adopted “according to the political affinities of the MEPs” (43% at EU level): this opinion is most widespread among men (46%), respondents aged 40-54 years (45%), self-employed people (46%) and managers (45%).
Other employees are equally divided: 42% think that the European Parliament’s decisions are
adopted above all “according to the interests of the Member States from which the MEPs
come”, and the same proportion thinks that they are “according to the political affinities of the
MEPs”.
As for students, they are the only category where a majority think that decisions are taken
according to the interests of the Member States (41% vs. 40%).
9
A. MEMBERSHIP AND BENEFITS OF BEING A MEMBER OF THE EUROPEAN UNION
I. MEMBERSHIP OF THE EUROPEAN UNION
EUROPEAN AVERAGE
Q12 Generally speaking, do you think that (OUR COUNTRY)'s membership of the EU is...?
(%)
58
53 53
4947
50 50
54 5553
1315 15
18 1816 17
14 15 16
25
28 28 2931 31 31
29 28 29
4 4 4 4 4 3 2 3 2 2
0%
10%
20%
30%
40%
50%
60%
70%
Oct.-Nov. 2007
EB68.1
June 2009
EB71.3
Oct.-Nov. 2009
EB72.4
May 2010
EB73.4
May 2011
EB75.3
June 2012
EB77.4
June 2013
EB79.5
Nov.-Dec. 2014
EB82.4
Sept. 2015
EB84.1
Sept.-Oct. 2016
EB86.1
A good thing A bad thing Neither a good thing nor a bad thing Don't know

10
1) Focus on age
a. European Union results
Q12 Generally speaking, do you think that (OUR COUNTRY)'s membership of the EU is...?
(%)
Ag
e g
rou
ps
M
EM
BE
RS
HIP
AN
D B
EN
EFI
TS
OF
BE
ING
A M
EM
BE
R O
F T
HE
EU
RO
PE
AN
UN
ION
60
10
28
2
56
13
29
2
51
17
30
2
49
19
29
3
A good thing
A bad thing
Neither a good thing
nor a bad thing
Don't know
15-24
25-39
40-54
55+

11
b. National results
Q12 Generally speaking, do you think that (OUR COUNTRY)'s membership of the EU is...?
(%)
Total ‘A good thing’ (%)
15-24 25-39 40-54 55 +
LU 81% 77% 75% 78% 89%
IE 74% 79% 75% 74% 72%
NL 72% 76% 74% 73% 69%
DE 71% 77% 68% 67% 72%
LT 67% 73% 70% 67% 63%
BE 65% 71% 67% 63% 64%
SE 64% 70% 68% 62% 62%
EE 63% 69% 66% 65% 59%
DK 62% 71% 59% 63% 60%
PL 61% 55% 65% 61% 61%
FI 60% 60% 60% 58% 61%
MT 58% 68% 56% 55% 57%
ES 55% 71% 57% 50% 51%
SK 54% 63% 52% 53% 54%
EU28 53% 60% 56% 51% 49%
RO 53% 47% 57% 53% 51%
BG 49% 70% 59% 50% 36%
FR 48% 54% 48% 46% 47%
LV 48% 67% 56% 37% 43%
HU 47% 53% 43% 45% 48%
PT 47% 67% 54% 47% 37%
UK 47% 60% 61% 45% 34%
HR 46% 55% 44% 49% 42%
SI 46% 56% 41% 43% 48%
AT 37% 57% 38% 32% 33%
CY 34% 29% 24% 47% 37%
IT 33% 39% 42% 34% 27%
CZ 32% 39% 35% 29% 31%
EL 31% 40% 30% 29% 30%
TOTAL
Age
WH
AT
BR
ING
S E
UR
OP
EA
N C
ITIZ
EN
S T
OG
ET
HE
R IS
MO
RE
IMP
OR
TA
NT
TH
AN
WH
AT
SE
PA
RA
TE
S T
HE
M
Gen
der g
rou
ps
ME
MB
ER
SH
IP A
ND
BE
NE
FITS
OF B
EIN
G A
ME
MB
ER
OF T
HE
EU
RO
PE
AN
UN
ION
A
ge
gro
up
s

12
2) Focus on gender
a. European Union results
Q12 Generally speaking, do you think that (OUR COUNTRY)'s membership of the EU is...?
(%)
Gen
der
ME
MB
ER
SH
IP A
ND
BE
NE
FIT
S O
F B
EIN
G A
ME
MB
ER
OF
TH
E E
UR
OP
EA
N U
NIO
N
54
17
27
2
52
15
31
2
A good thing
A bad thing
Neither a good thing
nor a bad thing
Don't know
Male
Female

13
b. National results
Q12 Generally speaking, do you think that (OUR COUNTRY)'s membership of the EU is...?
(%)
Total ‘A good thing’ (%)
Male Female
LU 81% 81% 80%
IE 74% 74% 74%
NL 72% 75% 70%
DE 71% 71% 70%
LT 67% 71% 64%
BE 65% 69% 62%
SE 64% 67% 61%
EE 63% 67% 61%
DK 62% 63% 62%
PL 61% 63% 60%
FI 60% 58% 62%
MT 58% 56% 59%
ES 55% 58% 51%
SK 54% 58% 51%
EU28 53% 54% 52%
RO 53% 51% 54%
BG 49% 49% 48%
FR 48% 52% 45%
LV 48% 51% 45%
HU 47% 48% 46%
PT 47% 49% 46%
UK 47% 46% 49%
HR 46% 48% 43%
SI 46% 53% 40%
AT 37% 36% 39%
CY 34% 37% 32%
IT 33% 34% 33%
CZ 32% 35% 30%
EL 31% 30% 32%
TOTAL
Gender
ME
MB
ER
SH
IP A
ND
BE
NE
FITS
OF B
EIN
G A
ME
MB
ER
OF T
HE
EU
RO
PE
AN
UN
ION
G
end
er

14
3) Focus on occupational groups
a. European Union results
Q12 Generally speaking, do you think that (OUR COUNTRY)'s membership of the EU is...?
(%)
Occ
up
atio
nal
gro
up
s
ME
MB
ER
SH
IP A
ND
BE
NE
FIT
S O
F B
EIN
G A
ME
MB
ER
OF
TH
E E
UR
OP
EA
N U
NIO
N
55
17
26
2
69
10
20
1
55
15
29
1
46
17
34
3
44
20
31
5
48
18
32
2
49
18
30
3
66
8
25
1
A good thing
A bad thing
Neither a good thing
nor a bad thing
Don't know
Self-employed
Managers
Other white collars
Manual workers
House persons
Unemployed
Retired
Students

15
b. National results
Q12 Generally speaking, do you think that (OUR COUNTRY)'s membership of the EU is...?
(%)
Total ‘A good thing’ (%)
Self-
employedManagers
Other
white
collars
Manual
workers
House
persons
Unem-
ployedRetired Students
LU 81% 81% 84% 80% 73% 68% 82% 90% 75%
IE 74% 77% 81% 80% 73% 63% 68% 72% 81%
NL 72% 80% 76% 75% 60% 64% 76% 69% 78%
DE 71% 75% 80% 71% 62% 62% 63% 69% 88%
LT 67% 84% 81% 73% 62% 58% 53% 61% 78%
BE 65% 64% 78% 71% 63% 60% 57% 61% 75%
SE 64% 74% 72% 67% 53% 30% 25% 61% 81%
EE 63% 72% 78% 67% 55% 51% 43% 59% 74%
DK 62% 65% 79% 65% 51% 100% 61% 59% 66%
PL 61% 56% 74% 73% 55% 65% 62% 59% 49%
FI 60% 64% 75% 55% 51% 54% 37% 61% 67%
MT 58% 55% 64% 53% 48% 54% 36% 62% 78%
ES 55% 59% 81% 51% 50% 41% 50% 58% 70%
SK 54% 53% 75% 59% 46% 45% 54% 55% 65%
EU28 53% 55% 69% 55% 46% 44% 48% 49% 66%
RO 53% 52% 67% 63% 55% 39% 54% 51% 48%
BG 49% 59% 61% 60% 47% 56% 43% 34% 73%
FR 48% 49% 65% 48% 42% 39% 38% 47% 62%
LV 48% 64% 61% 52% 38% 48% 35% 41% 76%
HU 47% 43% 49% 50% 42% 52% 48% 49% 49%
PT 47% 42% 64% 51% 45% 30% 54% 37% 66%
UK 47% 49% 62% 51% 43% 43% 44% 37% 68%
HR 46% 45% 50% 48% 43% 57% 41% 42% 62%
SI 46% 39% 58% 42% 37% 36% 35% 49% 57%
AT 37% 53% 49% 35% 27% 21% 31% 32% 75%
CY 34% 40% 36% 43% 30% 33% 29% 36% 30%
IT 33% 46% 51% 42% 21% 26% 38% 21% 49%
CZ 32% 42% 41% 34% 27% 34% 30% 27% 41%
EL 31% 26% 57% 31% 24% 28% 28% 32% 42%
TOTAL
Respondent occupation scale
ME
MB
ER
SH
IP A
ND
BE
NE
FITS
OF B
EIN
G A
ME
MB
ER
OF T
HE
EU
RO
PE
AN
UN
ION
Occu
patio
nal g
rou
ps

16
II. BENEFITS OF MEMBERSHIP
EUROPEAN AVERAGE
Q13 Taking everything into account, would you say that (OUR COUNTRY) has on balance benefited or not from being a member of the EU? (%)
5856 57
53 5254
60 60
2931 31
3537 37
31 31
13 13 12 12 119 9 9
0%
10%
20%
30%
40%
50%
60%
70%
80%
Oct.-Nov. 2007
EB68.1
June 2009
EB71.3
Oct.-Nov. 2009
EB72.4
May 2010
EB73.4
May 2011
EB75.3
June 2013
EB79.5
Sept. 2015
EB84.1
Sept.-Oct. 2016
EB86.1
Benefited Not benefited Don't know

18
1) Focus on age
a. European Union results
Q13 Taking everything into account, would you say that (OUR COUNTRY) has on balance
benefited or not from being a member of the EU? (%)
Ag
e g
rou
ps
B
EN
EFI
TS
OF
ME
MB
ER
SH
IP
68
21
11
65
27
8
58
34
8
54
35
11
Benefited
Not benefited
Don't know
15-24
25-39
40-54
55+

19
b. National results
Q13 Taking everything into account, would you say that (OUR COUNTRY) has on balance
benefited or not from being a member of the EU? (%)
Total ‘Benefited’ (%)
15-24 25-39 40-54 55 +
LT 86% 94% 88% 88% 79%
LU 85% 88% 80% 85% 89%
IE 84% 88% 82% 84% 85%
MT 84% 91% 85% 79% 84%
PL 81% 80% 86% 81% 78%
EE 80% 83% 83% 82% 76%
SK 79% 83% 81% 79% 76%
DK 77% 78% 82% 77% 74%
NL 75% 84% 76% 72% 74%
BE 73% 87% 79% 67% 70%
FI 69% 73% 76% 70% 63%
DE 66% 70% 68% 64% 65%
LV 64% 75% 68% 57% 63%
RO 64% 61% 64% 66% 63%
SI 64% 67% 66% 59% 65%
PT 63% 78% 66% 68% 54%
HU 62% 69% 59% 63% 62%
SE 62% 83% 67% 61% 57%
CZ 61% 64% 64% 57% 61%
EU28 60% 68% 65% 58% 54%
HR 60% 72% 66% 61% 51%
UK 56% 72% 67% 54% 42%
ES 55% 74% 55% 52% 52%
FR 54% 60% 61% 54% 49%
BG 49% 69% 58% 51% 37%
AT 48% 62% 51% 45% 43%
CY 44% 43% 41% 53% 39%
EL 44% 50% 46% 43% 42%
IT 38% 44% 51% 40% 30%
TOTAL
Age
WH
AT
BR
ING
S E
UR
OP
EA
N C
ITIZ
EN
S T
OG
ET
HE
R IS
MO
RE
IMP
OR
TA
NT
TH
AN
WH
AT
SE
PA
RA
TE
S T
HE
M
Gen
der g
rou
ps
BE
NE
FITS
OF M
EM
BE
RS
HIP
A
ge
gro
up
s

20
2) Focus on gender
a. European Union results
Q13 Taking everything into account, would you say that (OUR COUNTRY) has on balance
benefited or not from being a member of the EU? (%)
Gen
der
B
EN
EFI
TS
OF
ME
MB
ER
SH
IP
61
32
7
58
31
11
Benefited
Not benefited
Don't know
Male
Female

21
b. National results
Q13 Taking everything into account, would you say that (OUR COUNTRY) has on balance
benefited or not from being a member of the EU? (%)
Total ‘Benefited’ (%)
Male Female
LT 86% 89% 83%
LU 85% 86% 84%
IE 84% 84% 85%
MT 84% 80% 88%
PL 81% 82% 80%
EE 80% 81% 79%
SK 79% 79% 80%
DK 77% 80% 74%
NL 75% 80% 71%
BE 73% 76% 71%
FI 69% 69% 69%
DE 66% 65% 67%
LV 64% 66% 63%
RO 64% 63% 64%
SI 64% 71% 57%
PT 63% 65% 62%
HU 62% 64% 61%
SE 62% 67% 58%
CZ 61% 62% 60%
EU28 60% 61% 58%
HR 60% 62% 57%
UK 56% 55% 56%
ES 55% 61% 50%
FR 54% 60% 49%
BG 49% 50% 48%
AT 48% 45% 51%
CY 44% 45% 43%
EL 44% 43% 46%
IT 38% 39% 38%
TOTAL
Gender
BE
NE
FITS
OF M
EM
BE
RS
HIP
Gen
der
22
3) Focus on occupational groups
a. European Union results
Q13 Taking everything into account, would you say that (OUR COUNTRY) has on balance
benefited or not from being a member of the EU? (%)
Occ
up
atio
nal
gro
up
s
BE
NE
FIT
S O
F M
EM
BE
RS
HIP
61
33
6
76
19
5
66
27
7
54
35
11
48
40
12
55
34
11
54
36
10
74
17
9
Benefited
Not benefited
Don't know
Self-employed
Managers
Other white collars
Manual workers
House persons
Unemployed
Retired
Students

23
b. National results
Q13 Taking everything into account, would you say that (OUR COUNTRY) has on balance
benefited or not from being a member of the EU? (%)
Total ‘Benefited (%)
Self-
employedManagers
Other
white
collars
Manual
workers
House
persons
Unem-
ployedRetired Students
LT 86% 93% 91% 93% 84% 81% 84% 78% 95%
LU 85% 94% 84% 82% 78% 86% 100% 90% 89%
IE 84% 90% 85% 84% 84% 79% 80% 85% 92%
MT 84% 93% 92% 86% 70% 83% 79% 85% 94%
PL 81% 67% 93% 87% 76% 89% 83% 80% 78%
EE 80% 90% 90% 82% 72% 81% 72% 74% 90%
SK 79% 83% 93% 84% 79% 81% 67% 76% 84%
DK 77% 66% 87% 82% 70% 100% 64% 73% 84%
NL 75% 77% 85% 78% 57% 57% 77% 73% 87%
BE 73% 82% 85% 80% 73% 58% 66% 65% 90%
FI 69% 82% 87% 73% 63% 85% 38% 60% 83%
DE 66% 71% 82% 70% 57% 64% 51% 59% 82%
LV 64% 72% 77% 66% 59% 78% 56% 59% 74%
RO 64% 57% 76% 75% 62% 56% 75% 62% 59%
SI 64% 66% 73% 65% 60% 60% 51% 63% 68%
PT 63% 61% 79% 75% 58% 49% 65% 55% 78%
HU 62% 59% 60% 65% 62% 60% 55% 62% 70%
SE 62% 63% 75% 68% 55% 30% 43% 55% 75%
CZ 61% 69% 75% 59% 58% 61% 53% 57% 67%
EU28 60% 61% 76% 66% 54% 48% 55% 54% 74%
HR 60% 58% 58% 65% 61% 55% 60% 54% 73%
UK 56% 66% 70% 66% 47% 52% 57% 41% 81%
ES 55% 54% 86% 58% 50% 39% 56% 57% 75%
FR 54% 55% 72% 63% 50% 27% 48% 49% 71%
BG 49% 54% 63% 61% 52% 40% 43% 33% 72%
AT 48% 62% 59% 48% 38% 42% 31% 43% 84%
CY 44% 43% 41% 60% 43% 34% 42% 39% 46%
EL 44% 42% 76% 49% 32% 39% 34% 45% 53%
IT 38% 48% 53% 49% 28% 28% 48% 27% 53%
TOTAL
Respondent occupation scale
BE
NE
FITS
OF M
EM
BE
RS
HIP
Occu
patio
nal g
rou
ps

24

25
B. THE VOICE OF EUROPEAN CITIZENS
I. MY VOICE COUNTS IN THE EU
EUROPEAN AVERAGE
D72.1 Please tell me to what extent you agree or disagree with each of the following statements. My voice counts in the EU (%)
38
34
42
34
3941
3937
5355 54
5957
53
56
59
911
4
7
46 5 4
0%
10%
20%
30%
40%
50%
60%
70%
June 2009
EB71.3
May 2010
EB73.4
June 2012
EB77.4
Nov.-Dec. 2012
EB78.2
June 2013
EB79.5
Nov.-Dec. 2014
EB82.4
Sept. 2015
EB84.1
Sept.-Oct. 2016
EB86.1
Total 'Agree' Total 'Disagree' Don't know

26
1) Focus on age
a. European Union results
D72.1 Please tell me to what extent you agree or disagree with each of the following
statements. My voice counts in the EU (%)
Ag
e g
rou
ps
M
Y V
OIC
E C
OU
NT
S IN
TH
E E
U
40
54
6
40
57
3
37
60
3
35
59
6
Total 'Agree'
Total 'Disagree'
Don't know
15-24
25-39
40-54
55+

27
b. National results
D72.1 Please tell me to what extent you agree or disagree with each of the following
statements. My voice counts in the EU (%)
Total ‘Agree’ (%)
15-24 25-39 40-54 55 +
DK 70% 66% 67% 73% 73%
SE 69% 70% 70% 72% 68%
NL 58% 52% 55% 61% 62%
FI 57% 54% 65% 57% 54%
HR 55% 53% 50% 57% 57%
BE 54% 58% 56% 48% 55%
DE 54% 57% 53% 51% 55%
AT 53% 59% 59% 52% 49%
LU 49% 49% 37% 48% 61%
IE 45% 38% 48% 50% 41%
MT 45% 48% 36% 40% 52%
RO 38% 42% 43% 39% 35%
BG 37% 30% 45% 42% 31%
EU28 37% 40% 40% 37% 35%
SK 37% 42% 38% 34% 34%
FR 35% 36% 33% 35% 36%
SI 34% 29% 39% 29% 37%
PL 33% 38% 40% 30% 29%
UK 32% 42% 45% 28% 22%
HU 30% 35% 30% 31% 26%
PT 30% 30% 37% 32% 25%
LT 25% 41% 26% 28% 18%
ES 24% 32% 22% 28% 20%
CZ 20% 25% 21% 21% 17%
IT 20% 18% 26% 21% 16%
LV 19% 32% 21% 17% 15%
CY 17% 15% 23% 17% 14%
EE 17% 22% 22% 16% 12%
EL 13% 15% 17% 11% 12%
TOTAL
Age
MY
VO
ICE
CO
UN
TS
IN T
HE
EU
Ag
e g
rou
ps

28
D72.1 Please tell me to what extent you agree or disagree with each of the following statements. My voice counts in the EU (%)
Total ‘Disagree’ (%)
15-24 25-39 40-54 55 +
EL 85% 84% 82% 88% 86%
CY 79% 83% 74% 82% 79%
EE 76% 66% 71% 81% 79%
LV 75% 61% 75% 78% 79%
CZ 74% 70% 76% 73% 76%
IT 74% 69% 69% 75% 78%
ES 72% 66% 78% 71% 71%
HU 66% 62% 66% 64% 70%
LT 66% 54% 69% 63% 69%
PT 66% 63% 62% 64% 69%
UK 63% 50% 52% 68% 73%
FR 61% 59% 65% 62% 58%
SI 61% 63% 59% 66% 59%
SK 60% 53% 59% 64% 61%
EU28 59% 54% 57% 60% 59%
PL 58% 55% 53% 61% 61%
RO 58% 54% 54% 59% 60%
IE 50% 54% 48% 46% 53%
BG 48% 44% 43% 47% 54%
LU 47% 44% 59% 49% 36%
MT 46% 50% 60% 53% 33%
BE 45% 41% 43% 51% 44%
AT 43% 35% 38% 45% 47%
DE 43% 41% 44% 46% 42%
FI 42% 43% 35% 43% 46%
NL 40% 41% 43% 39% 37%
HR 39% 45% 43% 37% 36%
SE 29% 23% 28% 27% 29%
DK 27% 34% 31% 26% 23%
TOTAL
Age
Ag
e g
rou
ps
M
Y V
OIC
E C
OU
NT
S IN
TH
E E
U

29
WH
AT
BR
ING
S E
UR
OP
EA
N C
ITIZ
EN
S T
OG
ET
HE
R IS
MO
RE
IMP
OR
TA
NT
TH
AN
WH
AT
SE
PA
RA
TE
S T
HE
M
Gen
der g
rou
ps

30
2) Focus on gender
a. European Union results
D72.1 Please tell me to what extent you agree or disagree with each of the following
statements. My voice counts in the EU (%)
Gen
der
M
Y V
OIC
E C
OU
NT
S IN
TH
E E
U
37
60
3
37
57
6
Total 'Agree'
Total 'Disagree'
Don't know
Male
Female

31
b. National results
D72.1 Please tell me to what extent you agree or disagree with each of the following
statements. My voice counts in the EU (%)
Total ‘Agree’ (%)
Male Female
DK 70% 68% 73%
SE 69% 74% 64%
NL 58% 57% 60%
FI 57% 56% 59%
HR 55% 55% 55%
BE 54% 53% 56%
DE 54% 53% 55%
AT 53% 53% 54%
LU 49% 50% 49%
IE 45% 45% 45%
MT 45% 39% 52%
RO 38% 41% 36%
BG 37% 37% 37%
EU28 37% 37% 37%
SK 37% 36% 36%
FR 35% 33% 36%
SI 34% 35% 33%
PL 33% 28% 38%
UK 32% 31% 33%
HU 30% 29% 29%
PT 30% 32% 29%
LT 25% 28% 24%
ES 24% 23% 24%
CZ 20% 20% 21%
IT 20% 21% 18%
LV 19% 21% 17%
CY 17% 17% 17%
EE 17% 19% 15%
EL 13% 14% 12%
TOTAL
Gender
MY
VO
ICE
CO
UN
TS
IN T
HE
EU
Gen
der

32
D72.1 Please tell me to what extent you agree or disagree with each of the following statements. My voice counts in the EU (%)
Total ‘Disagree’ (%)
Male Female
EL 85% 85% 86%
CY 79% 80% 79%
EE 76% 73% 78%
LV 75% 74% 77%
CZ 74% 76% 72%
IT 74% 74% 75%
ES 72% 75% 71%
HU 66% 68% 66%
LT 66% 64% 66%
PT 66% 65% 66%
UK 63% 66% 61%
FR 61% 64% 59%
SI 61% 62% 61%
SK 60% 61% 60%
EU28 59% 60% 57%
PL 58% 65% 52%
RO 58% 56% 59%
IE 50% 50% 49%
BG 48% 50% 47%
LU 47% 48% 45%
MT 46% 52% 40%
BE 45% 47% 43%
AT 43% 44% 42%
DE 43% 45% 41%
FI 42% 43% 41%
NL 40% 41% 39%
HR 39% 40% 38%
SE 29% 25% 32%
DK 27% 30% 24%
TOTAL
Gender
Gen
der
MY
VO
ICE
CO
UN
TS
IN T
HE
EU

33
34
3) Focus on occupational groups
a. European Union results
D72.1 Please tell me to what extent you agree or disagree with each of the following
statements. My voice counts in the EU (%)
Occ
up
atio
nal
gro
up
s
M
Y V
OIC
E C
OU
NT
S IN
TH
E E
U
37
60
3
48
49
3
39
58
3
35
61
4
30
64
6
30
67
3
34
60
6
42
51
7
Total 'Agree'
Total 'Disagree'
Don't know
Self-employed
Managers
Other white collars
Manual workers
House persons
Unemployed
Retired
Students
35
b. National results
D72.1 Please tell me to what extent you agree or disagree with each of the following
statements. My voice counts in the EU (%)
Total ‘Agree’ (%)
Self-
employedManagers
Other
white
collars
Manual
workers
House
persons
Unem-
ployedRetired Students
DK 70% 79% 76% 73% 70% 100% 64% 72% 57%
SE 69% 69% 74% 72% 71% 100% 48% 66% 63%
NL 58% 62% 69% 58% 54% 54% 45% 60% 53%
FI 57% 67% 60% 59% 48% 69% 48% 56% 70%
HR 55% 58% 71% 61% 47% 34% 50% 57% 57%
BE 54% 41% 55% 56% 54% 39% 55% 53% 67%
DE 54% 63% 60% 62% 46% 52% 35% 54% 61%
AT 53% 61% 66% 58% 45% 45% 45% 49% 72%
LU 49% 60% 49% 36% 42% 41% 37% 60% 57%
IE 45% 44% 55% 46% 40% 45% 40% 40% 48%
MT 45% 48% 41% 43% 32% 56% 21% 52% 53%
RO 38% 25% 30% 46% 42% 39% 57% 35% 44%
BG 37% 46% 57% 46% 44% 24% 28% 25% 26%
EU28 37% 37% 48% 39% 35% 30% 30% 34% 42%
SK 37% 40% 45% 41% 32% 47% 27% 34% 47%
FR 35% 38% 34% 22% 36% 25% 25% 39% 43%
SI 34% 33% 39% 32% 38% 21% 25% 35% 30%
PL 33% 33% 48% 43% 30% 47% 26% 28% 27%
UK 32% 37% 36% 45% 29% 39% 39% 19% 45%
HU 30% 39% 31% 34% 30% 31% 25% 26% 28%
PT 30% 28% 50% 37% 27% 25% 28% 22% 42%
LT 25% 34% 34% 28% 22% 18% 29% 18% 37%
ES 24% 22% 41% 30% 25% 16% 23% 19% 32%
CZ 20% 18% 23% 18% 20% 37% 23% 17% 30%
IT 20% 23% 46% 27% 19% 9% 18% 13% 21%
LV 19% 28% 24% 16% 15% 31% 16% 14% 36%
CY 17% 19% 11% 19% 24% 11% 19% 16% 15%
EE 17% 21% 24% 17% 11% 10% 19% 13% 24%
EL 13% 17% 30% 14% 10% 5% 6% 14% 17%
TOTAL
Respondent occupation scale
MY
VO
ICE
CO
UN
TS
IN T
HE
EU
O
ccup
ation
al gro
up
s
36
D72.1 Please tell me to what extent you agree or disagree with each of the following statements. My voice counts in the EU (%)
Total ‘Disagree’ (%)
Self-
employedManagers
Other
white
collars
Manual
workers
House
persons
Unem-
ployedRetired Students
EL 85% 83% 67% 85% 90% 90% 93% 85% 81%
CY 79% 81% 87% 77% 73% 89% 76% 77% 85%
EE 76% 75% 68% 77% 85% 82% 78% 77% 64%
LV 75% 64% 74% 81% 81% 66% 77% 78% 51%
CZ 74% 79% 71% 77% 75% 57% 73% 75% 65%
IT 74% 75% 52% 71% 79% 85% 79% 78% 60%
ES 72% 77% 59% 70% 72% 74% 74% 75% 65%
HU 66% 61% 67% 59% 66% 69% 74% 70% 66%
LT 66% 65% 58% 61% 71% 82% 61% 69% 56%
PT 66% 68% 50% 62% 70% 64% 71% 71% 48%
UK 63% 62% 62% 52% 64% 57% 58% 75% 48%
FR 61% 52% 66% 73% 60% 69% 73% 55% 52%
SI 61% 61% 59% 66% 58% 75% 70% 60% 62%
SK 60% 58% 51% 57% 65% 51% 65% 61% 51%
EU28 59% 60% 49% 58% 61% 64% 67% 60% 51%
PL 58% 63% 43% 50% 63% 46% 68% 61% 59%
RO 58% 70% 62% 53% 56% 56% 39% 61% 50%
IE 50% 55% 44% 52% 51% 51% 49% 53% 46%
BG 48% 45% 40% 47% 44% 46% 56% 56% 40%
LU 47% 40% 49% 61% 53% 56% 63% 36% 34%
MT 46% 44% 54% 52% 59% 32% 71% 35% 44%
BE 45% 58% 45% 44% 45% 58% 45% 46% 31%
AT 43% 36% 30% 40% 51% 51% 50% 48% 22%
DE 43% 36% 36% 35% 51% 45% 62% 42% 39%
FI 42% 33% 40% 41% 50% 31% 52% 44% 29%
NL 40% 38% 31% 41% 43% 42% 55% 39% 40%
HR 39% 31% 25% 34% 49% 58% 46% 34% 39%
SE 29% 31% 26% 27% 26% 0% 52% 30% 29%
DK 27% 20% 24% 25% 28% 0% 28% 24% 41%
TOTAL
Respondent occupation scale
Occ
up
atio
nal
gro
up
s
M
Y V
OIC
E C
OU
NT
S IN
TH
E E
U
37
II. MY VOICE COUNTS IN OUR COUNTRY
EUROPEAN AVERAGE
D72.2 Please tell me to what extent you agree or disagree with each of the following statements. My voice counts in (OUR COUNTRY) (%)
51
5658
53
58 58
63
53
43
3840
44
40 39
35
44
6 6
2 3 2 3 2 3
0%
10%
20%
30%
40%
50%
60%
70%
80%
June 2009
EB71.3
May 2010
EB73.4
June 2012
EB77.4
Nov.-Dec. 2012
EB78.2
June 2013
EB79.5
Nov.-Dec. 2014
EB82.4
Sept. 2015
EB84.1
Sept.-Oct. 2016
EB86.1
Total 'Agree' Total 'Disagree' Don't know

38
1) Focus on age
a. European Union results
D72.2 Please tell me to what extent you agree or disagree with each of the following
statements. My voice counts in (OUR COUNTRY) (%)
Ag
e g
rou
ps
MY
VO
ICE
CO
UN
TS
IN O
UR
CO
UN
TR
Y
53
42
5
54
44
2
52
46
2
52
44
4
Total 'Agree'
Total 'Disagree'
Don't know
15-24
25-39
40-54
55+

39
b. National results
D72.2 Please tell me to what extent you agree or disagree with each of the following
statements. My voice counts in (OUR COUNTRY) (%)
Total ‘Agree’ (%)
15-24 25-39 40-54 55 +
DK 92% 89% 91% 94% 93%
SE 92% 87% 91% 94% 92%
FI 86% 82% 88% 84% 85%
NL 83% 79% 85% 84% 84%
AT 77% 69% 81% 80% 75%
DE 73% 71% 69% 72% 76%
HR 70% 64% 70% 73% 72%
BE 66% 74% 68% 61% 65%
FR 62% 64% 59% 60% 66%
IE 61% 59% 58% 62% 63%
MT 59% 68% 59% 61% 57%
LU 57% 59% 50% 49% 68%
SK 54% 63% 56% 50% 52%
EU28 53% 53% 54% 52% 52%
UK 53% 52% 58% 49% 53%
PL 52% 55% 56% 49% 49%
SI 52% 55% 50% 46% 56%
CZ 45% 44% 43% 44% 45%
PT 43% 39% 51% 42% 38%
HU 40% 37% 42% 45% 36%
BG 39% 27% 45% 40% 37%
EE 35% 36% 36% 37% 32%
LV 35% 46% 41% 33% 29%
ES 33% 35% 30% 36% 30%
RO 32% 34% 36% 32% 29%
IT 25% 28% 29% 28% 20%
CY 24% 13% 32% 24% 24%
LT 23% 38% 17% 27% 18%
EL 17% 16% 21% 13% 17%
TOTAL
Age
MY
VO
ICE
CO
UN
TS
IN O
UR
CO
UN
TR
Y
Ag
e g
rou
ps

40
D72.2 Please tell me to what extent you agree or disagree with each of the following statements. My voice counts in (OUR COUNTRY) (%)
Total ‘Disagree’ (%)
15-24 25-39 40-54 55 +
EL 82% 82% 79% 86% 81%
CY 72% 80% 63% 76% 72%
LT 71% 57% 79% 68% 74%
IT 70% 59% 67% 69% 74%
ES 65% 63% 70% 63% 66%
RO 65% 61% 61% 67% 67%
LV 62% 48% 57% 65% 67%
EE 60% 54% 57% 61% 63%
HU 58% 63% 55% 52% 61%
PT 54% 55% 49% 55% 58%
CZ 53% 52% 56% 53% 53%
BG 51% 50% 46% 54% 52%
SI 45% 38% 48% 51% 42%
EU28 44% 42% 44% 46% 44%
UK 44% 43% 39% 50% 43%
PL 43% 40% 40% 45% 46%
SK 43% 35% 41% 48% 45%
LU 38% 31% 46% 43% 31%
MT 36% 26% 40% 37% 35%
FR 35% 33% 40% 38% 30%
IE 35% 36% 36% 35% 33%
BE 33% 26% 31% 39% 35%
HR 27% 34% 27% 24% 25%
DE 25% 25% 28% 27% 22%
AT 21% 25% 18% 18% 24%
NL 16% 15% 15% 16% 15%
FI 14% 15% 12% 16% 15%
SE 8% 10% 9% 6% 8%
DK 7% 11% 9% 5% 5%
TOTAL
Age
Ag
e g
rou
ps
MY
VO
ICE
CO
UN
TS
IN O
UR
CO
UN
TR
Y

41
WH
AT
BR
ING
S E
UR
OP
EA
N C
ITIZ
EN
S T
OG
ET
HE
R IS
MO
RE
IMP
OR
TA
NT
TH
AN
WH
AT
SE
PA
RA
TE
S T
HE
M
Gen
der g
rou
ps

42
2) Focus on gender
a. European Union results
D72.2 Please tell me to what extent you agree or disagree with each of the following statements. My voice counts in (OUR COUNTRY) (%)
Gen
der
MY
VO
ICE
CO
UN
TS
IN O
UR
CO
UN
TR
Y
53
45
2
52
44
4
Total 'Agree'
Total 'Disagree'
Don't know
Male
Female
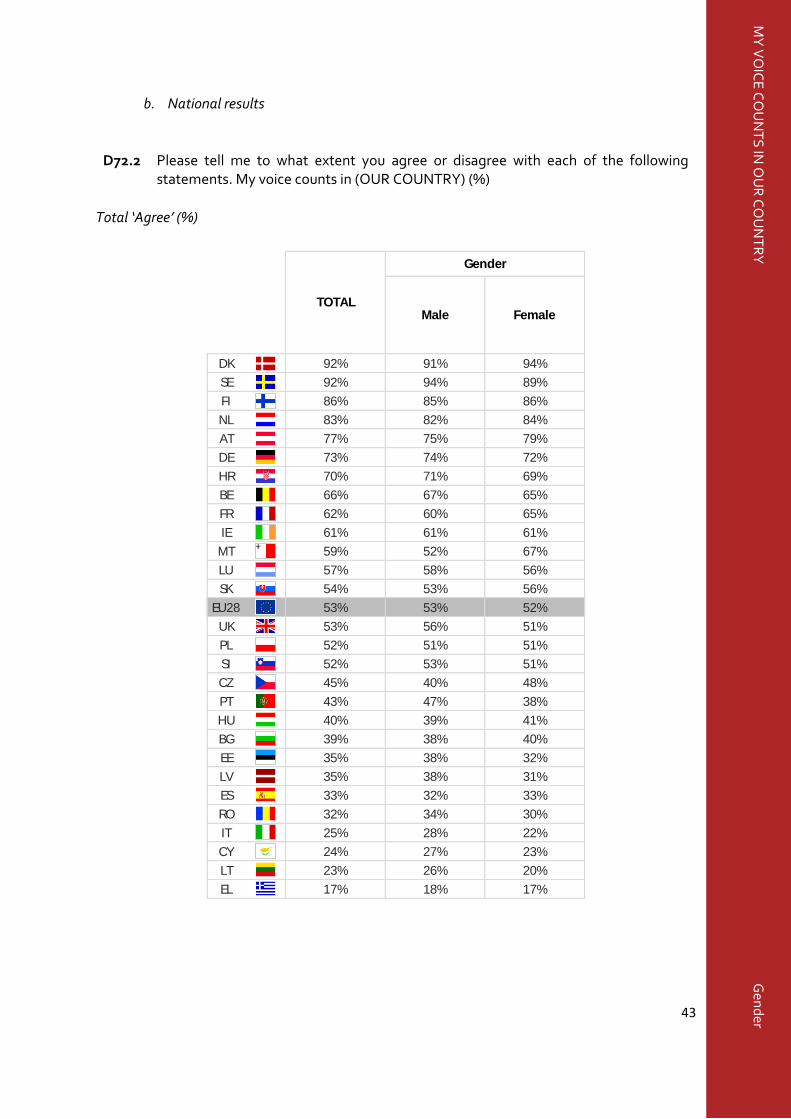
43
b. National results
D72.2 Please tell me to what extent you agree or disagree with each of the following
statements. My voice counts in (OUR COUNTRY) (%)
Total ‘Agree’ (%)
Male Female
DK 92% 91% 94%
SE 92% 94% 89%
FI 86% 85% 86%
NL 83% 82% 84%
AT 77% 75% 79%
DE 73% 74% 72%
HR 70% 71% 69%
BE 66% 67% 65%
FR 62% 60% 65%
IE 61% 61% 61%
MT 59% 52% 67%
LU 57% 58% 56%
SK 54% 53% 56%
EU28 53% 53% 52%
UK 53% 56% 51%
PL 52% 51% 51%
SI 52% 53% 51%
CZ 45% 40% 48%
PT 43% 47% 38%
HU 40% 39% 41%
BG 39% 38% 40%
EE 35% 38% 32%
LV 35% 38% 31%
ES 33% 32% 33%
RO 32% 34% 30%
IT 25% 28% 22%
CY 24% 27% 23%
LT 23% 26% 20%
EL 17% 18% 17%
TOTAL
Gender
MY
VO
ICE
CO
UN
TS
IN O
UR
CO
UN
TR
Y
Gen
der

44
D72.2 Please tell me to what extent you agree or disagree with each of the following statements. My voice counts in (OUR COUNTRY) (%)
Total ‘Disagree’ (%)
Male Female
EL 82% 81% 81%
CY 72% 71% 72%
LT 71% 69% 73%
IT 70% 67% 72%
ES 65% 66% 65%
RO 65% 64% 66%
LV 62% 59% 65%
EE 60% 56% 63%
HU 58% 59% 56%
PT 54% 51% 58%
CZ 53% 57% 50%
BG 51% 53% 49%
SI 45% 45% 45%
EU28 44% 45% 44%
UK 44% 42% 45%
PL 43% 45% 43%
SK 43% 44% 42%
LU 38% 38% 38%
MT 36% 44% 27%
FR 35% 38% 32%
IE 35% 34% 34%
BE 33% 33% 34%
HR 27% 26% 27%
DE 25% 25% 25%
AT 21% 23% 19%
NL 16% 15% 16%
FI 14% 14% 14%
SE 8% 6% 10%
DK 7% 8% 5%
TOTAL
Gender
Gen
der
MY
VO
ICE
CO
UN
TS
IN O
UR
CO
UN
TR
Y

45

46
3) Focus on occupational groups
a. European Union results
D72.2 Please tell me to what extent you agree or disagree with each of the following
statements. My voice counts in (OUR COUNTRY) (%)
Occ
up
atio
nal
gro
up
s
MY
VO
ICE
CO
UN
TS
IN O
UR
CO
UN
TR
Y
52
46
2
66
32
2
54
44
2
51
47
2
44
52
4
42
56
2
52
44
4
55
39
6
Total 'Agree'
Total 'Disagree'
Don't know
Self-employed
Managers
Other white collars
Manual workers
House persons
Unemployed
Retired
Students

47
b. National results
D72.2 Please tell me to what extent you agree or disagree with each of the following
statements. My voice counts in (OUR COUNTRY) (%)
Total ‘Agree’ (%)
Self-
employedManagers
Other
white
collars
Manual
workers
House
persons
Unem-
ployedRetired Students
DK 92% 95% 94% 94% 93% 100% 88% 92% 88%
SE 92% 93% 95% 94% 92% 100% 73% 91% 88%
FI 86% 92% 90% 83% 81% 100% 80% 85% 86%
NL 83% 85% 92% 82% 79% 71% 90% 82% 77%
AT 77% 82% 83% 81% 75% 75% 61% 75% 79%
DE 73% 80% 78% 76% 68% 72% 51% 74% 74%
HR 70% 80% 79% 79% 62% 67% 71% 71% 66%
BE 66% 61% 77% 68% 66% 48% 64% 62% 77%
FR 62% 66% 60% 63% 62% 62% 47% 68% 61%
IE 61% 61% 69% 66% 54% 51% 45% 66% 68%
MT 59% 54% 59% 66% 52% 67% 21% 59% 75%
LU 57% 46% 56% 52% 51% 47% 68% 67% 61%
SK 54% 62% 62% 57% 50% 61% 40% 53% 69%
EU28 53% 52% 66% 54% 51% 44% 42% 52% 55%
UK 53% 62% 57% 56% 51% 53% 45% 51% 54%
PL 52% 55% 59% 59% 47% 61% 46% 48% 51%
SI 52% 44% 60% 45% 52% 42% 37% 56% 58%
CZ 45% 44% 59% 42% 36% 49% 38% 45% 52%
PT 43% 40% 60% 48% 41% 30% 40% 36% 47%
HU 40% 41% 43% 40% 44% 45% 32% 37% 38%
BG 39% 49% 53% 42% 43% 25% 33% 35% 27%
EE 35% 44% 51% 27% 28% 33% 39% 30% 37%
LV 35% 45% 45% 32% 33% 49% 31% 27% 47%
ES 33% 23% 43% 36% 32% 24% 29% 36% 38%
RO 32% 25% 32% 37% 35% 34% 50% 27% 32%
IT 25% 32% 47% 32% 22% 15% 19% 16% 31%
CY 24% 24% 32% 20% 34% 14% 21% 26% 12%
LT 23% 24% 30% 18% 19% 22% 26% 18% 37%
EL 17% 20% 31% 16% 14% 14% 11% 19% 17%
TOTAL
Respondent occupation scale
MY
VO
ICE
CO
UN
TS
IN O
UR
CO
UN
TR
Y
O
ccup
ation
al gro
up
s

48
D72.2 Please tell me to what extent you agree or disagree with each of the following statements. My voice counts in (OUR COUNTRY) (%)
Total ‘Disagree’ (%)
Self-
employedManagers
Other
white
collars
Manual
workers
House
persons
Unem-
ployedRetired Students
EL 82% 80% 66% 83% 86% 82% 89% 80% 81%
CY 72% 76% 68% 76% 59% 86% 77% 69% 80%
LT 71% 76% 67% 73% 78% 72% 65% 73% 56%
IT 70% 66% 51% 66% 76% 81% 78% 76% 50%
ES 65% 76% 57% 64% 66% 73% 69% 61% 59%
RO 65% 71% 62% 61% 64% 64% 46% 69% 61%
LV 62% 53% 55% 65% 65% 43% 68% 69% 42%
EE 60% 52% 44% 67% 70% 57% 61% 64% 54%
HU 58% 59% 55% 57% 54% 55% 63% 60% 62%
PT 54% 56% 40% 52% 57% 67% 59% 58% 45%
CZ 53% 52% 41% 56% 61% 51% 58% 54% 43%
BG 51% 45% 44% 54% 50% 51% 58% 53% 42%
SI 45% 52% 39% 54% 43% 58% 61% 42% 34%
EU28 44% 46% 32% 44% 47% 52% 56% 44% 39%
UK 44% 38% 42% 44% 44% 43% 53% 45% 43%
PL 43% 45% 36% 35% 49% 28% 50% 47% 40%
SK 43% 37% 34% 40% 49% 39% 53% 44% 29%
LU 38% 46% 37% 44% 44% 46% 25% 31% 30%
MT 36% 44% 38% 30% 46% 28% 47% 33% 25%
FR 35% 26% 39% 34% 36% 33% 51% 29% 36%
IE 35% 35% 30% 33% 37% 45% 43% 31% 28%
BE 33% 39% 23% 32% 34% 49% 36% 37% 23%
HR 27% 14% 19% 19% 37% 27% 27% 25% 30%
DE 25% 19% 20% 22% 31% 25% 46% 23% 23%
AT 21% 15% 16% 17% 22% 22% 38% 24% 15%
NL 16% 14% 7% 18% 21% 28% 10% 17% 16%
FI 14% 8% 10% 17% 17% 0% 20% 15% 13%
SE 8% 7% 5% 6% 8% 0% 27% 9% 8%
DK 7% 5% 5% 5% 7% 0% 7% 6% 12%
TOTAL
Respondent occupation scale
Occ
up
atio
nal
gro
up
s
MY
VO
ICE
CO
UN
TS
IN O
UR
CO
UN
TR
Y

49
C. THE EUROPEAN PARLIAMENT
I. INFORMATION ABOUT THE EUROPEAN PARLIAMENT
1.1. Media recall
EUROPEAN AVERAGE
Q1 Have you recently read in the press, seen on the Internet or on television or heard on the radio something about the European Parliament? (%)
4244
36
6259
69
64
47
58
66
60
54 53
60
3739
30
34
50
40
33
39
4 3 41 2 1 2 3 2 1 1
0%
10%
20%
30%
40%
50%
60%
70%
80%
Oct.-Nov. 2007
EB68.1
Oct. 2008
EB70.1
Jan.-Feb. 2009
EB71.1
Jan.-Feb. 2010
EB73.1
Nov.-Dec. 2010
EB74.3
Nov. 2011
EB76.3
Nov.-Dec. 2012
EB78.2
June 2013
EB79.5
Nov.-Dec. 2014
EB82.4
Sept. 2015
EB84.1
Sept.-Oct. 2016
EB86.1
Yes No Don't know

50
1) Focus on age
a. European Union results
Q1 Have you recently read in the press, seen on the Internet or on television or heard on
the radio something about the European Parliament? (%)
Ag
e g
rou
ps
IN
FOR
MA
TIO
N A
BO
UT
TH
E E
UR
OP
EA
N P
AR
LIA
ME
NT
: ME
DIA
RE
CA
LL
50
49
1
58
41
1
63
36
1
63
36
1
Yes
No
Don't know
15-24
25-39
40-54
55+

51
b. National results
Q1 Have you recently read in the press, seen on the Internet or on television or heard on
the radio something about the European Parliament? (%)
’Yes’ (%)
15-24 25-39 40-54 55 +
LT 81% 72% 80% 83% 84%
SE 76% 74% 63% 69% 85%
EE 75% 62% 69% 81% 78%
SK 75% 71% 70% 80% 78%
FI 74% 53% 67% 75% 84%
LU 73% 61% 71% 71% 82%
NL 73% 50% 69% 74% 82%
LV 72% 58% 67% 76% 77%
SI 72% 68% 65% 69% 80%
DE 70% 57% 63% 73% 77%
UK 69% 53% 69% 73% 74%
EL 68% 66% 69% 72% 66%
MT 68% 61% 50% 68% 81%
PT 67% 59% 67% 75% 63%
DK 62% 43% 48% 62% 76%
ES 62% 50% 61% 67% 63%
PL 62% 61% 61% 69% 60%
EU28 60% 50% 58% 63% 63%
HU 60% 52% 55% 66% 64%
AT 59% 43% 57% 66% 60%
BE 57% 54% 56% 56% 59%
CZ 57% 48% 47% 58% 66%
HR 57% 46% 55% 65% 58%
RO 54% 37% 55% 58% 58%
IT 52% 48% 63% 60% 43%
CY 51% 45% 40% 68% 53%
IE 50% 39% 47% 53% 56%
BG 49% 33% 51% 55% 50%
FR 35% 32% 30% 29% 42%
TOTAL
Age
INFO
RM
AT
ION
AB
OU
T T
HE
EU
RO
PE
AN
PA
RL
IAM
EN
T: M
ED
IA R
EC
AL
L
Ag
e g
rou
ps

52
Q1 Have you recently read in the press, seen on the Internet or on television or heard on the radio something about the European Parliament? (%)
‘No’ (%)
15-24 25-39 40-54 55 +
FR 64% 68% 70% 70% 57%
IE 50% 61% 53% 47% 44%
BG 49% 67% 48% 44% 48%
CY 49% 55% 60% 32% 47%
IT 47% 51% 36% 40% 56%
RO 45% 62% 45% 42% 42%
BE 42% 46% 43% 44% 40%
HR 42% 53% 44% 34% 42%
CZ 41% 52% 50% 41% 30%
AT 39% 55% 40% 33% 38%
EU28 39% 49% 41% 36% 36%
HU 39% 47% 44% 33% 36%
ES 38% 50% 39% 33% 37%
DK 37% 53% 52% 37% 23%
PL 37% 39% 39% 31% 38%
PT 33% 41% 33% 25% 37%
EL 32% 34% 31% 28% 34%
MT 32% 39% 50% 31% 19%
UK 30% 46% 31% 27% 25%
SI 28% 32% 35% 31% 20%
DE 27% 41% 33% 25% 20%
LU 27% 39% 28% 29% 18%
LV 27% 41% 32% 24% 20%
NL 27% 48% 30% 26% 18%
FI 26% 47% 33% 24% 16%
EE 24% 38% 29% 18% 21%
SE 24% 26% 37% 30% 14%
SK 24% 29% 30% 19% 21%
LT 19% 28% 20% 17% 15%
TOTAL
Age
Ag
e g
rou
ps
INFO
RM
AT
ION
AB
OU
T T
HE
EU
RO
PE
AN
PA
RL
IAM
EN
T: M
ED
IA R
EC
AL
L

53
WH
AT
BR
ING
S E
UR
OP
EA
N C
ITIZ
EN
S T
OG
ET
HE
R IS
MO
RE
IMP
OR
TA
NT
TH
AN
WH
AT
SE
PA
RA
TE
S T
HE
M
Gen
der g
rou
ps

54
2) Focus on gender
a. European Union results
Q1 Have you recently read in the press, seen on the Internet or on television or heard on the radio something about the European Parliament? (%)
Gen
der
IN
FOR
MA
TIO
N A
BO
UT
TH
E E
UR
OP
EA
N P
AR
LIA
ME
NT
: ME
DIA
RE
CA
LL
64
35
1
57
42
1
Yes
No
Don't know
Male
Female

55
b. National results
Q1 Have you recently read in the press, seen on the Internet or on television or heard on
the radio something about the European Parliament? (%)
‘Yes’ (%)
Male Female
LT 81% 83% 80%
SE 76% 75% 77%
EE 75% 78% 71%
SK 75% 76% 75%
FI 74% 79% 70%
LU 73% 77% 70%
NL 73% 78% 68%
LV 72% 74% 71%
SI 72% 77% 68%
DE 70% 75% 67%
UK 69% 74% 65%
EL 68% 70% 66%
MT 68% 64% 71%
PT 67% 71% 63%
DK 62% 68% 56%
ES 62% 63% 61%
PL 62% 68% 57%
EU28 60% 64% 57%
HU 60% 64% 58%
AT 59% 61% 56%
BE 57% 63% 51%
CZ 57% 60% 53%
HR 57% 60% 55%
RO 54% 56% 52%
IT 52% 53% 52%
CY 51% 55% 48%
IE 50% 57% 43%
BG 49% 52% 46%
FR 35% 41% 29%
TOTAL
Gender
INFO
RM
AT
ION
AB
OU
T T
HE
EU
RO
PE
AN
PA
RL
IAM
EN
T: M
ED
IA R
EC
AL
L
Gen
der

56
Q1 Have you recently read in the press, seen on the Internet or on television or heard on the radio something about the European Parliament? (%)
‘No’ (%)
Male Female
FR 64% 58% 71%
IE 50% 43% 57%
BG 49% 47% 52%
CY 49% 45% 52%
IT 47% 46% 48%
RO 45% 43% 48%
BE 42% 37% 48%
HR 42% 39% 44%
CZ 41% 38% 44%
AT 39% 38% 42%
EU28 39% 35% 42%
HU 39% 35% 42%
ES 38% 37% 39%
DK 37% 31% 43%
PL 37% 31% 42%
PT 33% 29% 37%
EL 32% 30% 34%
MT 32% 35% 29%
UK 30% 26% 34%
SI 28% 23% 32%
DE 27% 23% 30%
LU 27% 22% 30%
LV 27% 25% 27%
NL 27% 22% 31%
FI 26% 21% 30%
EE 24% 21% 27%
SE 24% 25% 22%
SK 24% 24% 24%
LT 19% 17% 19%
TOTAL
Gender
Gen
der
IN
FOR
MA
TIO
N A
BO
UT
TH
E E
UR
OP
EA
N P
AR
LIA
ME
NT
: ME
DIA
RE
CA
LL

57
58
3) Focus on occupational groups
a. European Union results
Q1 Have you recently read in the press, seen on the Internet or on television or heard on
the radio something about the European Parliament? (%)
Occ
up
atio
nal
gro
up
s
IN
FOR
MA
TIO
N A
BO
UT
TH
E E
UR
OP
EA
N P
AR
LIA
ME
NT
: ME
DIA
RE
CA
LL
68
31
1
70
29
1
64
35
1
55
44
1
53
46
1
53
46
1
62
37
1
54
45
1
Yes
No
Don't know
Self-employed
Managers
Other white collars
Manual workers
House persons
Unemployed
Retired
Students

59
b. National results
Q1 Have you recently read in the press, seen on the Internet or on television or heard on
the radio something about the European Parliament? (%)
‘Yes’ (%)
Self-
employedManagers
Other
white
collars
Manual
workers
House
persons
Unem-
ployedRetired Students
LT 81% 88% 89% 79% 79% 69% 71% 84% 76%
SE 76% 67% 72% 68% 80% 100% 34% 87% 65%
EE 75% 82% 73% 86% 74% 65% 67% 77% 61%
SK 75% 86% 86% 81% 74% 61% 57% 77% 73%
FI 74% 82% 71% 80% 76% 34% 63% 83% 57%
LU 73% 87% 77% 82% 56% 87% 93% 82% 52%
NL 73% 78% 77% 78% 56% 81% 67% 84% 50%
LV 72% 80% 78% 76% 71% 74% 65% 74% 53%
SI 72% 76% 64% 73% 65% 72% 69% 80% 67%
DE 70% 86% 77% 75% 64% 66% 44% 74% 67%
UK 69% 81% 82% 74% 58% 57% 55% 74% 63%
EL 68% 78% 77% 73% 70% 62% 65% 60% 71%
MT 68% 60% 72% 71% 51% 70% 43% 87% 59%
PT 67% 80% 80% 79% 63% 44% 60% 64% 56%
DK 62% 72% 71% 56% 52% 71% 48% 73% 45%
ES 62% 56% 70% 68% 60% 59% 64% 63% 63%
PL 62% 75% 68% 67% 55% 72% 73% 59% 57%
EU28 60% 68% 70% 64% 55% 53% 53% 62% 54%
HU 60% 75% 59% 65% 58% 63% 46% 63% 58%
AT 59% 68% 62% 54% 57% 46% 48% 63% 58%
BE 57% 65% 63% 54% 56% 41% 45% 58% 60%
CZ 57% 60% 66% 50% 51% 63% 49% 66% 45%
HR 57% 75% 67% 53% 58% 64% 40% 59% 54%
RO 54% 62% 74% 54% 54% 44% 63% 56% 36%
IT 52% 63% 61% 68% 52% 40% 63% 38% 52%
CY 51% 69% 58% 52% 45% 41% 50% 54% 44%
IE 50% 66% 56% 57% 42% 45% 38% 54% 47%
BG 49% 53% 68% 59% 51% 20% 37% 47% 36%
FR 35% 17% 40% 30% 33% 17% 29% 44% 29%
TOTAL
Respondent occupation scale
INFO
RM
AT
ION
AB
OU
T T
HE
EU
RO
PE
AN
PA
RL
IAM
EN
T: M
ED
IA R
EC
AL
L
O
ccup
ation
al gro
up
s

60
Q1 Have you recently read in the press, seen on the Internet or on television or heard on the radio something about the European Parliament? (%)
‘No’ (%)
Self-
employedManagers
Other
white
collars
Manual
workers
House
persons
Unem-
ployedRetired Students
FR 64% 80% 60% 70% 67% 83% 69% 55% 71%
IE 50% 33% 44% 43% 58% 55% 62% 46% 53%
BG 49% 46% 32% 40% 47% 80% 62% 50% 64%
CY 49% 31% 42% 48% 55% 59% 50% 46% 56%
IT 47% 37% 39% 32% 47% 60% 37% 61% 45%
RO 45% 38% 26% 46% 45% 56% 37% 44% 62%
BE 42% 35% 37% 45% 43% 59% 55% 41% 40%
HR 42% 25% 32% 47% 40% 36% 59% 40% 45%
CZ 41% 35% 33% 49% 47% 37% 51% 29% 55%
AT 39% 31% 36% 45% 42% 48% 44% 35% 42%
EU28 39% 31% 29% 35% 44% 46% 46% 37% 45%
HU 39% 21% 41% 35% 42% 37% 51% 36% 40%
ES 38% 44% 30% 32% 40% 41% 36% 37% 37%
DK 37% 28% 28% 43% 47% 29% 52% 27% 51%
PL 37% 25% 31% 32% 44% 28% 27% 39% 43%
PT 33% 20% 20% 21% 37% 56% 39% 36% 44%
EL 32% 22% 23% 27% 30% 38% 35% 40% 29%
MT 32% 34% 28% 29% 49% 30% 57% 12% 41%
UK 30% 19% 17% 26% 41% 38% 45% 26% 37%
SI 28% 24% 36% 27% 34% 28% 31% 20% 33%
DE 27% 13% 20% 22% 33% 29% 54% 23% 33%
LU 27% 13% 23% 18% 43% 13% 7% 18% 48%
LV 27% 20% 21% 24% 29% 26% 31% 24% 45%
NL 27% 22% 23% 22% 43% 19% 33% 16% 48%
FI 26% 18% 29% 20% 24% 66% 36% 17% 43%
EE 24% 17% 25% 14% 26% 35% 30% 21% 39%
SE 24% 32% 27% 31% 20% 0% 65% 13% 35%
SK 24% 14% 13% 19% 25% 39% 43% 22% 27%
LT 19% 12% 11% 21% 21% 31% 29% 15% 24%
TOTAL
Respondent occupation scale
Occ
up
atio
nal
gro
up
s
INFO
RM
AT
ION
AB
OU
T T
HE
EU
RO
PE
AN
PA
RL
IAM
EN
T: M
ED
IA R
EC
AL

61
1.2. Feeling informed about the European Parliament’s activities
EUROPEAN AVERAGE
Q2 In general, do you consider that you are very well, fairly well, fairly badly or very badly informed about the European Parliament’s activities? (%)
62
1) Focus on age
a. European Union results
Q2 In general, do you consider that you are very well, fairly well, fairly badly or very badly
informed about the European Parliament’s activities? (%)
Ag
e g
rou
ps
INFO
RM
AT
ION
AB
OU
T T
HE
EU
RO
PE
AN
PA
RL
IAM
EN
T: F
EE
LIN
G IN
FOR
ME
D A
BO
UT
TH
E E
UR
OP
EA
N P
AR
LIA
ME
NT
’S A
CT
IVIT
IES
29
68
3
33
65
2
33
65
2
32
65
3
Total 'Informed'
Total 'Not informed'
Don't know
15-24
25-39
40-54
55+

63
b. National results
Q2 In general, do you consider that you are very well, fairly well, fairly badly or very badly
informed about the European Parliament’s activities? (%)
Total ’Informed’ (%)
15-24 25-39 40-54 55 +
LT 47% 48% 49% 52% 44%
UK 45% 36% 54% 47% 42%
LU 43% 28% 34% 46% 55%
MT 43% 51% 30% 41% 48%
AT 42% 36% 41% 46% 42%
IE 41% 34% 39% 39% 47%
PL 41% 47% 45% 48% 32%
SK 41% 38% 35% 45% 44%
DK 38% 32% 27% 39% 47%
LV 37% 32% 28% 33% 46%
HU 36% 27% 38% 39% 36%
NL 36% 36% 26% 35% 41%
SI 36% 27% 31% 36% 42%
DE 35% 33% 28% 34% 42%
FI 35% 8% 30% 37% 45%
HR 35% 24% 34% 35% 38%
EU28 32% 29% 33% 33% 32%
BE 31% 25% 29% 32% 35%
IT 31% 25% 40% 36% 26%
BG 30% 20% 36% 32% 29%
EL 29% 19% 35% 35% 24%
RO 28% 20% 29% 25% 31%
CZ 27% 33% 24% 28% 25%
EE 26% 27% 22% 22% 30%
CY 24% 10% 26% 35% 24%
PT 24% 20% 28% 31% 18%
SE 24% 23% 18% 24% 27%
ES 20% 26% 19% 20% 19%
FR 18% 19% 17% 14% 21%
TOTAL
Age
INFO
RM
AT
ION
AB
OU
T T
HE
EU
RO
PE
AN
PA
RL
IAM
EN
T: FE
EL
ING
INFO
RM
ED
AB
OU
T T
HE
EU
RO
PE
AN
PA
RL
IAM
EN
T’S
AC
TIV
ITIE
S
A
ge
gro
up
s

64
Q2 In general, do you consider that you are very well, fairly well, fairly badly or very badly informed about the European Parliament’s activities? (%)
Total ’Not informed’ (%)
15-24 25-39 40-54 55 +
ES 79% 74% 81% 79% 80%
FR 79% 76% 78% 85% 76%
SE 76% 77% 82% 76% 73%
PT 75% 79% 71% 69% 80%
CY 73% 83% 73% 63% 73%
EE 73% 71% 76% 77% 69%
EL 71% 81% 65% 65% 76%
RO 71% 79% 71% 74% 69%
CZ 70% 64% 72% 67% 73%
BE 68% 75% 69% 67% 64%
BG 67% 75% 61% 65% 70%
IT 67% 74% 59% 64% 71%
EU28 66% 68% 65% 65% 65%
FI 65% 92% 70% 63% 54%
HR 64% 73% 63% 64% 61%
NL 64% 64% 74% 65% 58%
SI 64% 72% 69% 63% 58%
DE 63% 66% 70% 64% 57%
HU 63% 73% 62% 60% 63%
DK 61% 68% 73% 60% 52%
LV 61% 67% 70% 65% 52%
IE 58% 64% 60% 61% 52%
AT 57% 63% 58% 53% 58%
SK 57% 60% 62% 51% 54%
MT 56% 49% 69% 58% 51%
LU 55% 69% 64% 53% 44%
PL 52% 47% 50% 45% 60%
UK 51% 58% 42% 50% 54%
LT 50% 52% 47% 45% 53%
TOTAL
Age
Ag
e g
rou
ps
INFO
RM
AT
ION
AB
OU
T T
HE
EU
RO
PE
AN
PA
RL
IAM
EN
T: F
EE
LIN
G IN
FOR
ME
D A
BO
UT
TH
E E
UR
OP
EA
N P
AR
LIA
ME
NT
’S A
CT
IVIT
IES

65
WH
AT
BR
ING
S E
UR
OP
EA
N C
ITIZ
EN
S T
OG
ET
HE
R IS
MO
RE
IMP
OR
TA
NT
TH
AN
WH
AT
SE
PA
RA
TE
S T
HE
M
Gen
der g
rou
ps
66
2) Focus on gender
a. European Union results
Q2 In general, do you consider that you are very well, fairly well, fairly badly or very badly informed about the European Parliament’s activities? (%)
Gen
der
IN
FOR
MA
TIO
N A
BO
UT
TH
E E
UR
OP
EA
N P
AR
LIA
ME
NT
: FE
EL
ING
INFO
RM
ED
AB
OU
T T
HE
EU
RO
PE
AN
PA
RL
IAM
EN
T’S
AC
TIV
ITIE
S
36
62
2
28
69
3
Total 'Informed'
Total 'Not informed'
Don't know
Male
Female

67
b. National results
Q2 In general, do you consider that you are very well, fairly well, fairly badly or very badly
informed about the European Parliament’s activities? (%)
Total ’Informed’ (%)
Male Female
LT 47% 50% 46%
UK 45% 47% 43%
LU 43% 47% 39%
MT 43% 40% 46%
AT 42% 44% 41%
IE 41% 48% 34%
PL 41% 47% 36%
SK 41% 41% 41%
DK 38% 41% 36%
LV 37% 38% 36%
HU 36% 39% 34%
NL 36% 39% 33%
SI 36% 41% 32%
DE 35% 40% 31%
FI 35% 39% 31%
HR 35% 39% 30%
EU28 32% 36% 28%
BE 31% 33% 30%
IT 31% 34% 29%
BG 30% 33% 27%
EL 29% 33% 24%
RO 28% 33% 23%
CZ 27% 31% 23%
EE 26% 30% 23%
CY 24% 26% 24%
PT 24% 32% 18%
SE 24% 30% 18%
ES 20% 24% 17%
FR 18% 20% 16%
TOTAL
Gender
INFO
RM
AT
ION
AB
OU
T T
HE
EU
RO
PE
AN
PA
RL
IAM
EN
T: FE
EL
ING
INFO
RM
ED
AB
OU
T T
HE
EU
RO
PE
AN
PA
RL
IAM
EN
T’S
AC
TIV
ITIE
S
G
end
er
68
Q2 In general, do you consider that you are very well, fairly well, fairly badly or very badly informed about the European Parliament’s activities? (%)
Total ’Not informed’ (%)
Male Female
ES 79% 75% 82%
FR 79% 79% 78%
SE 76% 70% 82%
PT 75% 67% 82%
CY 73% 72% 72%
EE 73% 68% 76%
EL 71% 67% 76%
RO 71% 67% 76%
CZ 70% 66% 74%
BE 68% 67% 68%
BG 67% 65% 70%
IT 67% 63% 70%
EU28 66% 62% 69%
FI 65% 61% 69%
HR 64% 59% 69%
NL 64% 61% 67%
SI 64% 59% 68%
DE 63% 58% 67%
HU 63% 61% 65%
DK 61% 58% 64%
LV 61% 60% 62%
IE 58% 51% 65%
AT 57% 55% 59%
SK 57% 57% 56%
MT 56% 59% 53%
LU 55% 52% 59%
PL 52% 47% 57%
UK 51% 50% 52%
LT 50% 48% 51%
TOTAL
Gender
Gen
der
IN
FOR
MA
TIO
N A
BO
UT
TH
E E
UR
OP
EA
N P
AR
LIA
ME
NT
: FE
EL
ING
INFO
RM
ED
AB
OU
T T
HE
EU
RO
PE
AN
PA
RL
IAM
EN
T’S
AC
TIV
ITIE
S

69
3) Focus on occupational groups
a. European Union results
Q2 In general, do you consider that you are very well, fairly well, fairly badly or very badly
informed about the European Parliament’s activities? (%)
INFO
RM
AT
ION
AB
OU
T T
HE
EU
RO
PE
AN
PA
RL
IAM
EN
T: FE
EL
ING
INFO
RM
ED
AB
OU
T T
HE
EU
RO
PE
AN
PA
RL
IAM
EN
T’S
AC
TIV
ITIE
S
Occu
patio
nal g
rou
ps
35
64
1
44
55
1
35
62
3
28
69
3
23
75
2
27
71
2
31
66
3
32
65
3
Total 'Informed'
Total 'Not informed'
Don't know
Self-employed
Managers
Other white collars
Manual workers
House persons
Unemployed
Retired
Students

70
b. National results
Q2 In general, do you consider that you are very well, fairly well, fairly badly or very badly
informed about the European Parliament’s activities? (%)
Total ’Informed’ (%)
Self-
employedManagers
Other
white
collars
Manual
workers
House
persons
Unem-
ployedRetired Students
LT 47% 56% 59% 62% 42% 24% 40% 45% 47%
UK 45% 48% 59% 44% 43% 37% 41% 41% 40%
LU 43% 57% 46% 49% 34% 39% 35% 51% 28%
MT 43% 35% 46% 50% 31% 36% 24% 52% 56%
AT 42% 48% 58% 43% 40% 22% 25% 38% 47%
IE 41% 35% 50% 44% 32% 35% 29% 49% 39%
PL 41% 48% 51% 44% 41% 53% 45% 28% 52%
SK 41% 41% 65% 51% 35% 16% 29% 41% 43%
DK 38% 52% 43% 28% 32% 35% 28% 44% 37%
LV 37% 25% 42% 45% 33% 32% 28% 41% 32%
HU 36% 37% 46% 44% 32% 32% 35% 35% 28%
NL 36% 37% 37% 30% 21% 45% 25% 43% 40%
SI 36% 38% 31% 38% 31% 44% 36% 41% 30%
DE 35% 42% 44% 32% 25% 26% 28% 41% 32%
FI 35% 39% 42% 36% 28% 35% 18% 46% 14%
HR 35% 32% 47% 34% 35% 35% 20% 37% 32%
EU28 32% 35% 44% 35% 28% 23% 27% 31% 32%
BE 31% 47% 41% 30% 23% 19% 25% 34% 30%
IT 31% 34% 64% 47% 22% 15% 40% 22% 32%
BG 30% 37% 51% 42% 31% 17% 14% 25% 24%
EL 29% 40% 47% 35% 34% 20% 20% 22% 23%
RO 28% 25% 40% 29% 25% 21% 29% 31% 22%
CZ 27% 35% 36% 25% 23% 22% 32% 22% 32%
EE 26% 25% 26% 25% 23% 20% 20% 28% 36%
CY 24% 41% 30% 32% 26% 16% 22% 23% 13%
PT 24% 21% 47% 35% 21% 7% 24% 19% 18%
SE 24% 29% 25% 22% 17% 7% 19% 27% 21%
ES 20% 20% 31% 22% 16% 16% 21% 20% 34%
FR 18% 6% 19% 11% 19% 20% 9% 22% 17%
TOTAL
Respondent occupation scale
Occ
up
atio
nal
gro
up
s
INFO
RM
AT
ION
AB
OU
T T
HE
EU
RO
PE
AN
PA
RL
IAM
EN
T: F
EE
LIN
G IN
FOR
ME
D A
BO
UT
TH
E E
UR
OP
EA
N P
AR
LIA
ME
NT
’S A
CT
IVIT
IES

71
Q2 In general, do you consider that you are very well, fairly well, fairly badly or very badly informed about the European Parliament’s activities? (%)
Total ’Not informed’ (%)
Self-
employedManagers
Other
white
collars
Manual
workers
House
persons
Unem-
ployedRetired Students
ES 79% 80% 69% 76% 84% 82% 79% 79% 66%
FR 79% 91% 80% 82% 79% 79% 86% 74% 77%
SE 76% 71% 75% 78% 83% 93% 81% 73% 79%
PT 75% 76% 53% 64% 79% 93% 75% 80% 82%
CY 73% 59% 68% 67% 74% 77% 78% 73% 76%
EE 73% 72% 73% 75% 76% 80% 80% 70% 62%
EL 71% 60% 53% 65% 66% 80% 80% 78% 77%
RO 71% 73% 60% 71% 74% 78% 71% 69% 77%
CZ 70% 63% 64% 72% 68% 78% 66% 75% 66%
BE 68% 53% 58% 68% 75% 81% 71% 66% 70%
BG 67% 61% 46% 53% 68% 83% 82% 73% 71%
IT 67% 65% 36% 53% 77% 84% 59% 74% 66%
EU28 66% 64% 55% 62% 69% 75% 71% 66% 65%
FI 65% 61% 58% 64% 72% 65% 82% 54% 86%
HR 64% 66% 51% 66% 63% 63% 78% 62% 67%
NL 64% 63% 63% 70% 79% 55% 75% 56% 60%
SI 64% 61% 69% 61% 69% 56% 64% 59% 68%
DE 63% 58% 55% 63% 73% 71% 71% 57% 65%
HU 63% 61% 54% 55% 67% 68% 65% 64% 72%
DK 61% 48% 57% 72% 67% 65% 72% 55% 63%
LV 61% 71% 57% 51% 65% 65% 71% 58% 68%
IE 58% 65% 49% 56% 66% 63% 68% 51% 60%
AT 57% 52% 40% 57% 59% 76% 72% 62% 53%
SK 57% 55% 33% 48% 62% 82% 67% 56% 54%
MT 56% 65% 52% 50% 69% 63% 68% 46% 44%
LU 55% 39% 54% 51% 64% 57% 65% 48% 68%
PL 52% 48% 43% 50% 51% 39% 51% 64% 38%
UK 51% 48% 40% 53% 49% 59% 55% 56% 55%
LT 50% 44% 39% 36% 55% 76% 54% 52% 53%
TOTAL
Respondent occupation scale
INFO
RM
AT
ION
AB
OU
T T
HE
EU
RO
PE
AN
PA
RL
IAM
EN
T: FE
EL
ING
INFO
RM
ED
AB
OU
T T
HE
EU
RO
PE
AN
PA
RL
IAM
EN
T’S
AC
TIV
ITIE
S
Occu
patio
nal g
rou
ps

72

73
II. IMAGE AND ROLE OF THE EUROPEAN PARLIAMENT
2.1. General image of the European Parliament
EUROPEAN AVERAGE
Q3 In general, does the European Parliament conjure up for you a very positive, fairly positive, neutral, fairly negative or very negative image? (%)
39
34
26
27
30 30
2425
4143
4543
4243
4644
1517
26
28
2523
2728
56
32
34
3 3
0%
10%
20%
30%
40%
50%
60%
Oct.-Nov. 2007
EB68.1
Oct. 2008
EB70.1
Nov. 2011
EB76.3
Nov.-Dec. 2012
EB78.2
June 2013
EB79.5
Nov.-Dec. 2014
EB82.4
Sept. 2015
EB84.1
Sept.-Oct. 2016
EB86.1
Total 'Positive' Neutral Total 'Negative' Don't know

74
1) Focus on age
a. European Union results
Q3 In general, does the European Parliament conjure up for you a very positive, fairly
positive, neutral, fairly negative or very negative image? (%)
Ag
e g
rou
ps
IM
AG
E A
ND
RO
LE
OF
TH
E E
UR
OP
EA
N P
AR
LIA
ME
NT
: GE
NE
RA
L IM
AG
E O
F T
HE
EU
RO
PE
AN
PA
RL
IAM
EN
T
28
48
20
4
27
48
22
3
24
44
30
2
23
41
31
5
Total 'Positive'
Neutral
Total 'Negative'
Don't know
15-24
25-39
40-54
55+

75
b. National results
Q3 In general, does the European Parliament conjure up for you a very positive, fairly
positive, neutral, fairly negative or very negative image? (%)
Total ‘Positive’ (%)
15-24 25-39 40-54 55 +
BG 38% 44% 51% 39% 29%
IE 38% 39% 38% 39% 40%
RO 38% 33% 42% 38% 36%
LU 35% 28% 28% 32% 47%
MT 35% 50% 28% 31% 36%
HR 31% 29% 32% 33% 29%
PL 31% 32% 28% 33% 32%
SE 31% 33% 34% 24% 33%
IT 30% 38% 40% 31% 23%
DK 29% 20% 28% 25% 34%
PT 28% 35% 33% 31% 22%
SK 28% 39% 25% 28% 26%
CY 27% 27% 23% 33% 27%
DE 27% 34% 24% 25% 28%
LT 26% 30% 33% 25% 22%
NL 26% 42% 30% 22% 23%
EU28 25% 28% 27% 24% 23%
HU 25% 27% 26% 24% 25%
AT 24% 28% 30% 21% 21%
BE 24% 30% 28% 18% 25%
FI 23% 23% 26% 18% 25%
UK 23% 27% 31% 18% 17%
SI 21% 24% 18% 18% 24%
EE 18% 18% 21% 16% 18%
ES 18% 19% 18% 18% 18%
CZ 17% 23% 19% 15% 15%
EL 17% 15% 18% 18% 16%
LV 14% 18% 16% 10% 15%
FR 12% 12% 9% 14% 14%
TOTAL
Age
IMA
GE
AN
D R
OL
E O
F TH
E E
UR
OP
EA
N P
AR
LIA
ME
NT
: GE
NE
RA
L IM
AG
E O
F TH
E E
UR
OP
EA
N P
AR
LIA
ME
NT
Ag
e g
rou
ps

76
Q3 In general, does the European Parliament conjure up for you a very positive, fairly positive, neutral, fairly negative or very negative image? (%)
Total ‘Negative’ (%)
15-24 25-39 40-54 55 +
EL 41% 30% 37% 41% 47%
FR 35% 28% 29% 35% 40%
CZ 34% 27% 30% 39% 38%
AT 32% 25% 22% 32% 41%
IT 32% 28% 26% 32% 36%
UK 31% 20% 12% 37% 47%
BE 28% 15% 21% 38% 30%
ES 28% 17% 34% 30% 26%
EU28 28% 20% 22% 30% 31%
NL 27% 16% 21% 31% 30%
SI 26% 19% 26% 26% 29%
SK 25% 13% 25% 27% 29%
DE 24% 15% 23% 29% 24%
PT 24% 10% 18% 25% 30%
BG 21% 13% 17% 21% 25%
LV 21% 9% 14% 20% 28%
PL 21% 20% 22% 19% 23%
HU 20% 23% 13% 25% 20%
LU 20% 19% 25% 21% 15%
RO 20% 21% 16% 19% 21%
SE 20% 4% 17% 20% 25%
CY 19% 17% 13% 20% 24%
DK 19% 15% 15% 23% 21%
FI 19% 17% 6% 22% 23%
IE 19% 14% 16% 19% 24%
HR 17% 15% 12% 14% 22%
EE 13% 3% 8% 19% 15%
LT 13% 12% 7% 14% 17%
MT 10% 2% 11% 10% 12%
TOTAL
Age
Ag
e g
rou
ps
IM
AG
E A
ND
RO
LE
OF
TH
E E
UR
OP
EA
N P
AR
LIA
ME
NT
: GE
NE
RA
L IM
AG
E O
F T
HE
EU
RO
PE
AN
PA
RL
IAM
EN
T

77
WH
AT
BR
ING
S E
UR
OP
EA
N C
ITIZ
EN
S T
OG
ET
HE
R IS
MO
RE
IMP
OR
TA
NT
TH
AN
WH
AT
SE
PA
RA
TE
S T
HE
M
Gen
der g
rou
ps

78
2) Focus on gender
a. European Union results
Q3 In general, does the European Parliament conjure up for you a very positive, fairly positive, neutral, fairly negative or very negative image? (%)
Gen
der
I
MA
GE
AN
D R
OL
E O
F T
HE
EU
RO
PE
AN
PA
RL
IAM
EN
T: G
EN
ER
AL
IMA
GE
OF
TH
E E
UR
OP
EA
N P
AR
LIA
ME
NT
24
42
31
3
25
46
25
4
Total 'Positive'
Neutral
Total 'Negative'
Don't know
Male
Female

79
b. National results
Q3 In general, does the European Parliament conjure up for you a very positive, fairly
positive, neutral, fairly negative or very negative image? (%)
Total ‘Positive’ (%)
Male Female
BG 38% 38% 38%
IE 38% 39% 39%
RO 38% 38% 37%
LU 35% 35% 36%
MT 35% 33% 37%
HR 31% 32% 29%
PL 31% 28% 33%
SE 31% 33% 29%
IT 30% 29% 32%
DK 29% 31% 26%
PT 28% 31% 26%
SK 28% 27% 28%
CY 27% 31% 23%
DE 27% 26% 28%
LT 26% 29% 25%
NL 26% 29% 24%
EU28 25% 24% 25%
HU 25% 24% 26%
AT 24% 23% 24%
BE 24% 28% 22%
FI 23% 23% 24%
UK 23% 20% 25%
SI 21% 22% 20%
EE 18% 20% 17%
ES 18% 20% 16%
CZ 17% 18% 17%
EL 17% 17% 17%
LV 14% 15% 14%
FR 12% 14% 11%
TOTAL
Gender
IMA
GE
AN
D R
OL
E O
F TH
E E
UR
OP
EA
N P
AR
LIA
ME
NT
: GE
NE
RA
L IM
AG
E O
F TH
E E
UR
OP
EA
N P
AR
LIA
ME
NT
Gen
der

80
Q3 In general, does the European Parliament conjure up for you a very positive, fairly positive, neutral, fairly negative or very negative image? (%)
Total ‘Negative’ (%)
Male Female
EL 41% 42% 39%
FR 35% 39% 31%
CZ 34% 39% 30%
AT 32% 34% 31%
IT 32% 32% 31%
UK 31% 35% 28%
BE 28% 29% 27%
ES 28% 30% 26%
EU28 28% 31% 25%
NL 27% 28% 26%
SI 26% 29% 24%
SK 25% 29% 22%
DE 24% 28% 20%
PT 24% 28% 21%
BG 21% 23% 18%
LV 21% 23% 19%
PL 21% 28% 16%
HU 20% 21% 19%
LU 20% 21% 19%
RO 20% 21% 18%
SE 20% 18% 23%
CY 19% 22% 17%
DK 19% 23% 16%
FI 19% 21% 16%
IE 19% 23% 15%
HR 17% 16% 18%
EE 13% 15% 11%
LT 13% 16% 11%
MT 10% 14% 6%
TOTAL
Gender
Gen
der
I
MA
GE
AN
D R
OL
E O
F T
HE
EU
RO
PE
AN
PA
RL
IAM
EN
T: G
EN
ER
AL
IMA
GE
OF
TH
E E
UR
OP
EA
N P
AR
LIA
ME
NT

81
3) Focus on occupational groups
a. European Union results
Q3 In general, does the European Parliament conjure up for you a very positive, fairly
positive, neutral, fairly negative or very negative image? (%)
IMA
GE
AN
D R
OL
E O
F TH
E E
UR
OP
EA
N P
AR
LIA
ME
NT
: GE
NE
RA
L IM
AG
E O
F TH
E E
UR
OP
EA
N P
AR
LIA
ME
NT
O
ccup
ation
al gro
up
s
28
40
30
2
30
46
23
1
29
44
25
2
20
47
29
4
22
40
29
9
22
44
30
4
23
42
31
4
31
48
18
3
Total 'Positive'
Neutral
Total 'Negative'
Don't know
Self-employed
Managers
Other white collars
Manual workers
House persons
Unemployed
Retired
Students

82
b. National results
Q3 In general, does the European Parliament conjure up for you a very positive, fairly
positive, neutral, fairly negative or very negative image? (%)
Total ’Positive’ (%)
Self-
employedManagers
Other
white
collars
Manual
workers
House
persons
Unem-
ployedRetired Students
BG 38% 49% 51% 52% 39% 53% 31% 25% 39%
IE 38% 34% 43% 55% 36% 33% 29% 39% 39%
RO 38% 23% 49% 53% 41% 27% 42% 35% 34%
LU 35% 34% 35% 36% 28% 28% 33% 47% 24%
MT 35% 25% 36% 25% 31% 38% 15% 36% 57%
HR 31% 40% 42% 38% 29% 31% 19% 27% 35%
PL 31% 30% 28% 36% 28% 33% 29% 31% 32%
SE 31% 29% 31% 36% 28% 63% 11% 33% 32%
IT 30% 33% 49% 41% 25% 22% 29% 20% 46%
DK 29% 41% 32% 24% 18% 35% 36% 35% 25%
PT 28% 23% 48% 35% 26% 15% 33% 20% 35%
SK 28% 26% 41% 38% 19% 26% 25% 27% 39%
CY 27% 34% 26% 30% 31% 26% 19% 27% 27%
DE 27% 31% 32% 26% 20% 24% 22% 26% 39%
LT 26% 37% 42% 37% 21% 12% 23% 22% 25%
NL 26% 28% 31% 20% 22% 23% 21% 22% 48%
EU28 25% 28% 30% 29% 20% 22% 22% 23% 31%
HU 25% 27% 30% 31% 19% 17% 24% 28% 25%
AT 24% 22% 39% 26% 15% 18% 15% 21% 43%
BE 24% 40% 19% 27% 18% 16% 23% 24% 37%
FI 23% 32% 32% 24% 15% 0% 21% 25% 19%
UK 23% 25% 28% 25% 19% 22% 29% 16% 32%
SI 21% 17% 27% 14% 12% 4% 22% 25% 29%
EE 18% 17% 25% 21% 11% 6% 22% 18% 23%
ES 18% 20% 24% 21% 12% 19% 19% 21% 18%
CZ 17% 26% 29% 16% 15% 23% 17% 13% 19%
EL 17% 21% 36% 18% 13% 19% 8% 14% 18%
LV 14% 14% 18% 20% 10% 22% 7% 13% 23%
FR 12% 12% 18% 11% 10% 10% 14% 14% 11%
TOTAL
Respondent occupation scale
Occ
up
atio
nal
gro
up
s
IM
AG
E A
ND
RO
LE
OF
TH
E E
UR
OP
EA
N P
AR
LIA
ME
NT
: GE
NE
RA
L IM
AG
E O
F T
HE
EU
RO
PE
AN
PA
RL
IAM
EN
T

83
Q3 In general, does the European Parliament conjure up for you a very positive, fairly positive, neutral, fairly negative or very negative image? (%)
Total ’Negative’ (%)
Self-
employedManagers
Other
white
collars
Manual
workers
House
persons
Unem-
ployedRetired Students
EL 41% 48% 17% 39% 55% 47% 36% 41% 31%
FR 35% 28% 27% 29% 37% 48% 39% 38% 25%
CZ 34% 41% 27% 29% 42% 34% 34% 37% 25%
AT 32% 22% 16% 32% 37% 39% 45% 41% 11%
IT 32% 34% 21% 24% 33% 42% 35% 37% 22%
UK 31% 33% 31% 27% 25% 28% 24% 46% 17%
BE 28% 29% 27% 22% 34% 22% 22% 34% 11%
ES 28% 27% 24% 34% 30% 19% 33% 30% 22%
EU28 28% 30% 23% 25% 29% 29% 30% 31% 18%
NL 27% 33% 23% 32% 22% 40% 20% 30% 14%
SI 26% 32% 19% 28% 28% 24% 32% 29% 13%
SK 25% 31% 15% 25% 29% 11% 22% 29% 15%
DE 24% 29% 18% 22% 30% 25% 36% 24% 11%
PT 24% 31% 16% 21% 26% 21% 18% 32% 5%
BG 21% 19% 16% 19% 24% 13% 17% 25% 9%
LV 21% 16% 18% 12% 20% 8% 20% 31% 5%
PL 21% 25% 20% 20% 27% 4% 18% 22% 15%
HU 20% 33% 16% 14% 22% 7% 30% 20% 11%
LU 20% 18% 30% 17% 14% 34% 0% 17% 25%
RO 20% 34% 10% 8% 17% 27% 11% 22% 22%
SE 20% 11% 19% 15% 19% 7% 59% 26% 4%
CY 19% 20% 12% 10% 25% 25% 20% 24% 16%
DK 19% 15% 20% 23% 20% 0% 20% 20% 15%
FI 19% 18% 12% 16% 18% 0% 29% 21% 17%
IE 19% 23% 14% 16% 18% 21% 19% 27% 12%
HR 17% 17% 13% 15% 13% 4% 22% 23% 13%
EE 13% 10% 8% 12% 18% 6% 20% 15% 3%
LT 13% 9% 11% 8% 14% 13% 12% 16% 12%
MT 10% 14% 8% 4% 11% 10% 16% 14% 6%
TOTAL
Respondent occupation scale
IMA
GE
AN
D R
OL
E O
F TH
E E
UR
OP
EA
N P
AR
LIA
ME
NT
: GE
NE
RA
L IM
AG
E O
F TH
E E
UR
OP
EA
N P
AR
LIA
ME
NT
O
ccup
ation
al gro
up
s

84

85
2.2. Role of the European Parliament in the future
EUROPEAN AVERAGE
Q4 Would you personally like to see the European Parliament play a more important or
less important role than it currently does? (%)
48
44
48
55
52
45
54
4947
4446
1214
16
19
22
20
21
20
27
21
28
2224
22
17 16
24
16
12
25
13
1818
14
9 10 119
11
14
10
0%
10%
20%
30%
40%
50%
60%
70%
Oct.-Nov. 2007
EB68.1
Oct. 2008
EB70.1
Jan.-Feb. 2009
EB71.1
Jan.-Feb. 2010
EB73.1
Nov.-Dec. 2010
EB74.3
Nov. 2011
EB76.3
Nov.-Dec. 2012
EB78.2
June 2013
EB79.5
Nov.-Dec. 2014
EB82.4
Sept. 2015
EB84.1
Sept.-Oct. 2016
EB86.1
More important Less important The same (SPONTANEOUS) Don't know

86
1) Focus on age
a. European Union results
Q4 Would you personally like to see the European Parliament play a more important or
less important role than it currently does? (%)
Occ
up
atio
nal
gro
up
s
IM
AG
E A
ND
RO
LE
OF
TH
E E
UR
OP
EA
N P
AR
LIA
ME
NT
: RO
LE
OF
TH
E E
UR
OP
EA
N P
AR
LIA
ME
NT
IN T
HE
FU
TU
RE
52
21
12
15
50
26
13
11
45
30
14
11
43
31
12
14
More important
Less important
The same (SPONTANEOUS)
Don't know
15-24
25-39
40-54
55+

87
b. National results
Q4 Would you personally like to see the European Parliament play a more important or
less important role than it currently does? (%)
‘More important’ (%)
15-24 25-39 40-54 55 +
CY 76% 65% 80% 75% 79%
MT 69% 77% 67% 69% 66%
ES 68% 69% 68% 69% 66%
BE 64% 68% 69% 56% 65%
LU 63% 64% 53% 61% 72%
LT 62% 72% 67% 64% 55%
RO 61% 55% 59% 63% 62%
PT 59% 60% 57% 63% 57%
LV 56% 73% 60% 50% 52%
SI 54% 55% 44% 49% 62%
EL 53% 56% 55% 57% 49%
IE 51% 56% 55% 50% 46%
FR 49% 57% 53% 46% 47%
FI 47% 53% 53% 41% 45%
NL 47% 53% 51% 41% 46%
SK 47% 63% 46% 43% 43%
EU28 46% 52% 50% 45% 43%
HR 45% 47% 47% 48% 43%
IT 44% 52% 54% 43% 39%
DE 42% 52% 38% 38% 43%
SE 42% 57% 44% 35% 41%
BG 41% 45% 42% 40% 39%
EE 40% 47% 43% 44% 33%
HU 40% 31% 43% 39% 42%
UK 37% 48% 50% 38% 24%
AT 36% 45% 41% 32% 34%
CZ 34% 35% 40% 31% 31%
PL 34% 36% 35% 35% 31%
DK 29% 30% 33% 32% 25%
TOTAL
Age
WH
AT
BR
ING
S E
UR
OP
EA
N C
ITIZ
EN
S T
OG
ET
HE
R IS
MO
RE
IMP
OR
TA
NT
TH
AN
WH
AT
SE
PA
RA
TE
S T
HE
M
Gen
der g
rou
ps
IMA
GE
AN
D R
OL
E O
F TH
E E
UR
OP
EA
N P
AR
LIA
ME
NT
: RO
LE
OF T
HE
EU
RO
PE
AN
PA
RL
IAM
EN
T IN
TH
E FU
TU
RE
Occu
patio
nal g
rou
ps

88
2) Focus on gender
a. European Union results
Q4 Would you personally like to see the European Parliament play a more important or
less important role than it currently does? (%)
Gen
der
IMA
GE
AN
D R
OL
E O
F T
HE
EU
RO
PE
AN
PA
RL
IAM
EN
T: R
OL
E O
F T
HE
EU
RO
PE
AN
PA
RL
IAM
EN
T IN
TH
E F
UT
UR
E
46
31
12
11
46
25
14
15
More important
Less important
The same (SPONTANEOUS)
Don't know
Male
Female

89
b. National results
Q4 Would you personally like to see the European Parliament play a more important or
less important role than it currently does? (%)
‘More important’ (%)
Male Female
CY 76% 81% 72%
MT 69% 66% 71%
ES 68% 69% 66%
BE 64% 63% 65%
LU 63% 62% 63%
LT 62% 63% 62%
RO 61% 59% 62%
PT 59% 63% 55%
LV 56% 52% 60%
SI 54% 57% 51%
EL 53% 58% 49%
IE 51% 52% 50%
FR 49% 49% 50%
FI 47% 48% 46%
NL 47% 47% 46%
SK 47% 46% 47%
EU28 46% 46% 46%
HR 45% 47% 44%
IT 44% 46% 43%
DE 42% 44% 40%
SE 42% 44% 40%
BG 41% 40% 42%
EE 40% 43% 37%
HU 40% 37% 42%
UK 37% 33% 42%
AT 36% 36% 37%
CZ 34% 34% 33%
PL 34% 31% 36%
DK 29% 30% 29%
TOTAL
Gender
IMA
GE
AN
D R
OL
E O
F TH
E E
UR
OP
EA
N P
AR
LIA
ME
NT
: RO
LE
OF T
HE
EU
RO
PE
AN
PA
RL
IAM
EN
T IN
TH
E FU
TU
RE
Gen
der

90
3) Focus on occupational groups
a. European Union results
Q4 Would you personally like to see the European Parliament play a more important or
less important role than it currently does? (%)
Occ
up
atio
nal
gro
up
s
I
MA
GE
AN
D R
OL
E O
F T
HE
EU
RO
PE
AN
PA
RL
IAM
EN
T: R
OL
E O
F T
HE
EU
RO
PE
AN
PA
RL
IAM
EN
T IN
TH
E F
UT
UR
E
48
29
13
10
48
28
15
9
47
29
14
10
45
30
12
13
43
25
17
15
49
24
12
15
43
30
12
15
56
20
12
12
More important
Less important
The same (SPONTANEOUS)
Don't know
Self-employed
Managers
Other white collars
Manual workers
House persons
Unemployed
Retired
Students
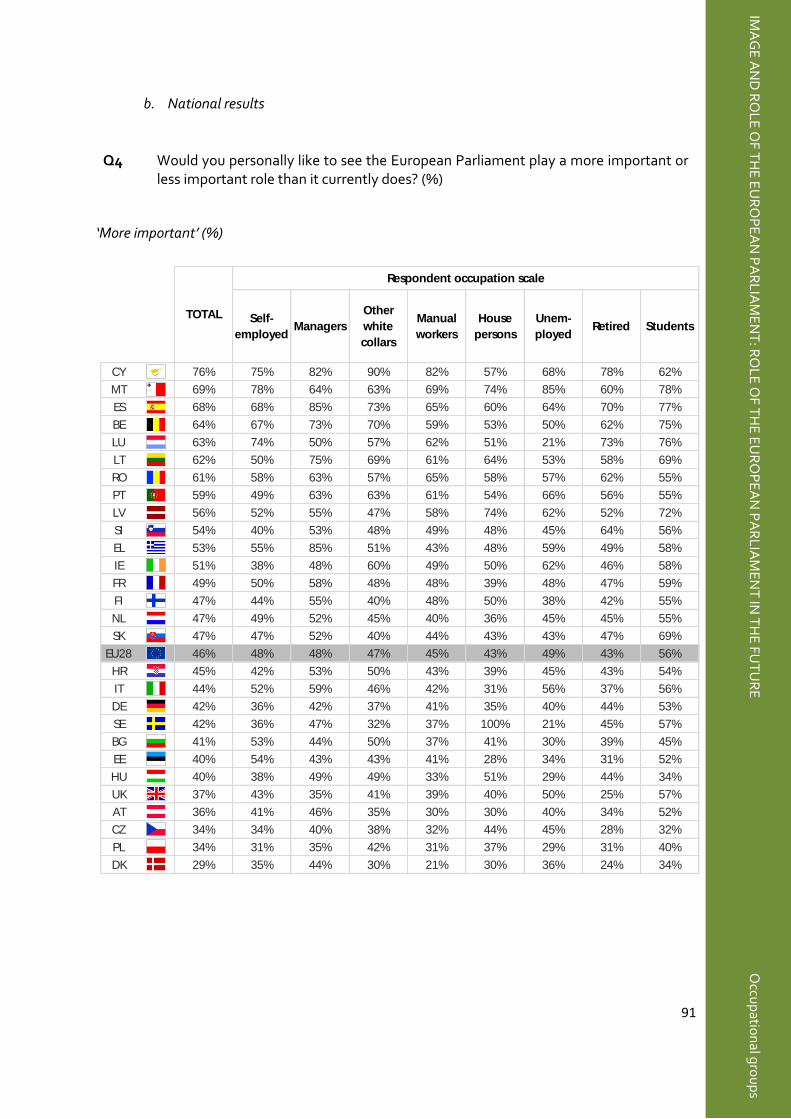
91
b. National results
Q4 Would you personally like to see the European Parliament play a more important or
less important role than it currently does? (%)
‘More important’ (%)
Self-
employedManagers
Other
white
collars
Manual
workers
House
persons
Unem-
ployedRetired Students
CY 76% 75% 82% 90% 82% 57% 68% 78% 62%
MT 69% 78% 64% 63% 69% 74% 85% 60% 78%
ES 68% 68% 85% 73% 65% 60% 64% 70% 77%
BE 64% 67% 73% 70% 59% 53% 50% 62% 75%
LU 63% 74% 50% 57% 62% 51% 21% 73% 76%
LT 62% 50% 75% 69% 61% 64% 53% 58% 69%
RO 61% 58% 63% 57% 65% 58% 57% 62% 55%
PT 59% 49% 63% 63% 61% 54% 66% 56% 55%
LV 56% 52% 55% 47% 58% 74% 62% 52% 72%
SI 54% 40% 53% 48% 49% 48% 45% 64% 56%
EL 53% 55% 85% 51% 43% 48% 59% 49% 58%
IE 51% 38% 48% 60% 49% 50% 62% 46% 58%
FR 49% 50% 58% 48% 48% 39% 48% 47% 59%
FI 47% 44% 55% 40% 48% 50% 38% 42% 55%
NL 47% 49% 52% 45% 40% 36% 45% 45% 55%
SK 47% 47% 52% 40% 44% 43% 43% 47% 69%
EU28 46% 48% 48% 47% 45% 43% 49% 43% 56%
HR 45% 42% 53% 50% 43% 39% 45% 43% 54%
IT 44% 52% 59% 46% 42% 31% 56% 37% 56%
DE 42% 36% 42% 37% 41% 35% 40% 44% 53%
SE 42% 36% 47% 32% 37% 100% 21% 45% 57%
BG 41% 53% 44% 50% 37% 41% 30% 39% 45%
EE 40% 54% 43% 43% 41% 28% 34% 31% 52%
HU 40% 38% 49% 49% 33% 51% 29% 44% 34%
UK 37% 43% 35% 41% 39% 40% 50% 25% 57%
AT 36% 41% 46% 35% 30% 30% 40% 34% 52%
CZ 34% 34% 40% 38% 32% 44% 45% 28% 32%
PL 34% 31% 35% 42% 31% 37% 29% 31% 40%
DK 29% 35% 44% 30% 21% 30% 36% 24% 34%
TOTAL
Respondent occupation scale
IMA
GE
AN
D R
OL
E O
F TH
E E
UR
OP
EA
N P
AR
LIA
ME
NT
: RO
LE
OF T
HE
EU
RO
PE
AN
PA
RL
IAM
EN
T IN
TH
E FU
TU
RE
Occu
patio
nal g
rou
ps

92

93
III. KNOWLEDGE OF THE EUROPEAN PARLIAMENT
3.1. How the European Parliament works
EUROPEAN AVERAGE
Q5 And, in your opinion, do members of the European Parliament sit in the European
Parliament according to…? (%)
33
36
4342
4344
43
48 4847
44
36
3938
36 36
39
35
38
35
23
28
1820
2120
1817
14
18
0%
10%
20%
30%
40%
50%
60%
Oct.-Nov. 2007
EB68.1
Jan.-Feb. 2009
EB71.1
Jan.-Feb. 2010
EB73.1
Nov.-Dec. 2010
EB74.3
Nov. 2011
EB76.3
Nov.-Dec. 2012
EB78.2
June 2013
EB79.5
Nov.-Dec. 2014
EB82.4
Sept. 2015
EB84.1
Sept.-Oct. 2016
EB86.1
Their political affinities Their nationality Don't know

94
1) Focus on age
a. European Union results
Q5 And, in your opinion, do members of the European Parliament sit in the European
Parliament according to…? (%)
Occ
up
atio
nal
gro
up
s
K
NO
WL
ED
GE
OF
TH
E E
UR
OP
EA
N P
AR
LIA
ME
NT
: HO
W T
HE
EU
RO
PE
AN
PA
RL
IAM
EN
T W
OR
KS
46
35
19
47
38
15
48
36
16
47
32
21
Their political affinities
Their nationality
Don't know
15-24
25-39
40-54
55+

95
b. National results
Q5 And, in your opinion, do members of the European Parliament sit in the European
Parliament according to…? (%)
‘Their political affinities’ (%)
15-24 25-39 40-54 55 +
FI 64% 53% 57% 62% 72%
BE 63% 60% 64% 66% 62%
CY 63% 69% 60% 61% 64%
SI 62% 56% 62% 61% 65%
EE 58% 50% 52% 64% 60%
ES 58% 60% 53% 60% 58%
NL 57% 50% 49% 57% 64%
SE 57% 53% 55% 56% 60%
PT 54% 51% 57% 57% 50%
RO 54% 55% 57% 50% 54%
FR 52% 52% 57% 47% 52%
LV 52% 50% 44% 51% 58%
LU 51% 50% 52% 54% 47%
MT 51% 37% 44% 62% 55%
HR 50% 49% 46% 48% 54%
DE 47% 51% 44% 49% 46%
DK 47% 41% 43% 49% 52%
EU28 47% 46% 47% 48% 47%
LT 47% 48% 43% 52% 47%
EL 46% 55% 42% 43% 48%
PL 46% 39% 46% 47% 47%
HU 44% 38% 42% 44% 47%
SK 40% 29% 40% 38% 47%
AT 39% 44% 37% 35% 41%
IE 39% 42% 33% 36% 46%
UK 39% 37% 36% 40% 41%
IT 38% 38% 42% 44% 33%
CZ 35% 42% 33% 35% 36%
BG 32% 12% 36% 37% 32%
TOTAL
Age
WH
AT
BR
ING
S E
UR
OP
EA
N C
ITIZ
EN
S T
OG
ET
HE
R IS
MO
RE
IMP
OR
TA
NT
TH
AN
WH
AT
SE
PA
RA
TE
S T
HE
M
Gen
der g
rou
ps
KN
OW
LE
DG
E O
F TH
E E
UR
OP
EA
N P
AR
LIA
ME
NT
: HO
W T
HE
EU
RO
PE
AN
PA
RL
IAM
EN
T W
OR
KS
Occu
patio
nal g
rou
ps

96
2) Focus on gender
a. European Union results
Q5 And, in your opinion, do members of the European Parliament sit in the European
Parliament according to…? (%)
Gen
der
KN
OW
LE
DG
E O
F T
HE
EU
RO
PE
AN
PA
RL
IAM
EN
T: H
OW
TH
E E
UR
OP
EA
N P
AR
LIA
ME
NT
WO
RK
S
51
34
15
44
35
21
Their political affinities
Their nationality
Don't know
Male
Female

97
b. National results
Q5 And, in your opinion, do members of the European Parliament sit in the European
Parliament according to…? (%)
‘Their political affinities’ (%)
Male Female
FI 64% 68% 60%
BE 63% 67% 60%
CY 63% 63% 63%
SI 62% 66% 59%
EE 58% 60% 57%
ES 58% 62% 53%
NL 57% 59% 55%
SE 57% 58% 56%
PT 54% 56% 52%
RO 54% 55% 53%
FR 52% 55% 49%
LV 52% 50% 54%
LU 51% 51% 51%
MT 51% 48% 54%
HR 50% 50% 50%
DE 47% 55% 40%
DK 47% 51% 44%
EU28 47% 51% 44%
LT 47% 49% 47%
EL 46% 47% 45%
PL 46% 49% 43%
HU 44% 46% 41%
SK 40% 41% 39%
AT 39% 42% 36%
IE 39% 40% 39%
UK 39% 43% 35%
IT 38% 42% 35%
CZ 35% 40% 32%
BG 32% 34% 30%
TOTAL
Gender
KN
OW
LE
DG
E O
F TH
E E
UR
OP
EA
N P
AR
LIA
ME
NT
: HO
W T
HE
EU
RO
PE
AN
PA
RL
IAM
EN
T W
OR
KS
Gen
der

98
3) Focus on occupational groups
a. European Union results
Q5 And, in your opinion, do members of the European Parliament sit in the European
Parliament according to…? (%)
Occ
up
atio
nal
gro
up
s
KN
OW
LE
DG
E O
F T
HE
EU
RO
PE
AN
PA
RL
IAM
EN
T: H
OW
TH
E E
UR
OP
EA
N P
AR
LIA
ME
NT
WO
RK
S
51
35
14
51
39
10
45
42
13
46
36
18
43
32
25
47
32
21
47
30
23
49
36
15
Their political affinities
Their nationality
Don't know
Self-employed
Managers
Other white collars
Manual workers
House persons
Unemployed
Retired
Students

99
b. National results
Q5 And, in your opinion, do members of the European Parliament sit in the European
Parliament according to…? (%)
‘Their political affinities’ (%)
Self-
employedManagers
Other
white
collars
Manual
workers
House
persons
Unem-
ployedRetired Students
FI 64% 64% 72% 56% 56% 69% 68% 70% 49%
BE 63% 58% 63% 66% 62% 57% 79% 64% 55%
CY 63% 68% 53% 66% 61% 53% 73% 60% 67%
SI 62% 58% 60% 73% 53% 57% 67% 65% 59%
EE 58% 58% 67% 56% 57% 41% 57% 61% 43%
ES 58% 50% 56% 59% 59% 56% 58% 57% 64%
NL 57% 60% 53% 54% 54% 62% 50% 65% 49%
SE 57% 69% 53% 53% 52% 100% 49% 62% 55%
PT 54% 46% 57% 59% 58% 38% 58% 52% 42%
RO 54% 57% 59% 49% 51% 68% 52% 54% 49%
FR 52% 51% 55% 44% 51% 48% 55% 53% 52%
LV 52% 40% 49% 47% 54% 47% 47% 60% 46%
LU 51% 55% 40% 46% 62% 54% 73% 47% 51%
MT 51% 45% 57% 52% 45% 55% 57% 52% 45%
HR 50% 44% 53% 51% 48% 32% 52% 54% 42%
DE 47% 61% 57% 38% 47% 31% 38% 46% 49%
DK 47% 60% 61% 48% 38% 35% 30% 48% 42%
EU28 47% 51% 51% 45% 46% 43% 47% 47% 49%
LT 47% 62% 42% 42% 53% 51% 41% 47% 47%
EL 46% 46% 41% 34% 50% 40% 53% 50% 56%
PL 46% 49% 51% 43% 45% 45% 43% 47% 40%
HU 44% 54% 40% 39% 45% 58% 41% 46% 30%
SK 40% 45% 45% 40% 38% 44% 33% 45% 28%
AT 39% 37% 41% 40% 39% 31% 29% 40% 42%
IE 39% 45% 36% 36% 36% 38% 29% 45% 50%
UK 39% 44% 41% 39% 33% 40% 36% 38% 55%
IT 38% 49% 40% 45% 34% 37% 42% 30% 43%
CZ 35% 41% 41% 29% 36% 22% 32% 36% 45%
BG 32% 43% 39% 39% 33% 13% 32% 30% 11%
TOTAL
Respondent occupation scale
KN
OW
LE
DG
E O
F TH
E E
UR
OP
EA
N P
AR
LIA
ME
NT
: HO
W T
HE
EU
RO
PE
AN
PA
RL
IAM
EN
T W
OR
KS
Occu
patio
nal g
rou
ps

100

101
3.2. The decision-making procedure of the European Parliament
EUROPEAN AVERAGE
Q6 Would you say that the European Parliament’s decisions are adopted above all…? (%)
25
29
37 37
37
4038
4341
3436
39
38
32
35
15
18
13
1312
8
20
9
19 19
14 14
10
13
0%
10%
20%
30%
40%
50%
Oct.-Nov. 2007
EB68.1
Oct. 2008
EB70.1
Nov. 2011
EB76.3
Nov.-Dec. 2012
EB78.2
June 2013
EB79.5
Nov.-Dec. 2014
EB82.4
Sept. 2015
EB84.1
Sept.-Oct. 2016
EB86.1
According to the political affinities of the MEPs
According to the interests of the Member States from which the MEPs come
Both (SPONTANEOUS)
Don't know

102
1) Focus on age
a. European Union results
Q6 Would you say that the European Parliament’s decisions are adopted above all…? (%)
Ag
e g
rou
ps
KN
OW
LE
DG
E O
F T
HE
EU
RO
PE
AN
PA
RL
IAM
EN
T: T
HE
DE
CIS
ION
-MA
KIN
G P
RO
CE
DU
RE
OF
TH
E E
UR
OP
EA
N P
AR
LIA
ME
NT
40
37
9
14
43
38
8
11
45
36
8
11
43
32
9
16
According to the political affinities
of the MEPs
According to the interests
of the Member States from
which the MEPs come
Both (SPONTANEOUS)
Don't know
15-24
25-39
40-54
55+
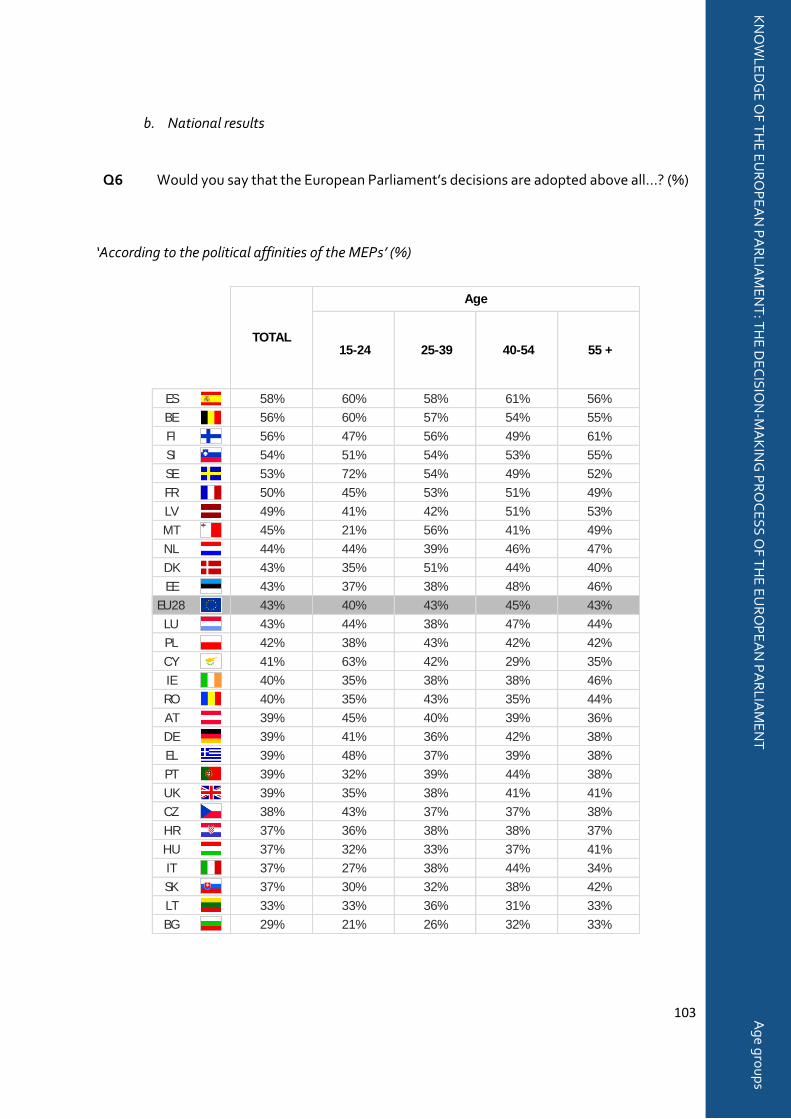
103
b. National results
Q6 Would you say that the European Parliament’s decisions are adopted above all…? (%)
‘According to the political affinities of the MEPs’ (%)
15-24 25-39 40-54 55 +
ES 58% 60% 58% 61% 56%
BE 56% 60% 57% 54% 55%
FI 56% 47% 56% 49% 61%
SI 54% 51% 54% 53% 55%
SE 53% 72% 54% 49% 52%
FR 50% 45% 53% 51% 49%
LV 49% 41% 42% 51% 53%
MT 45% 21% 56% 41% 49%
NL 44% 44% 39% 46% 47%
DK 43% 35% 51% 44% 40%
EE 43% 37% 38% 48% 46%
EU28 43% 40% 43% 45% 43%
LU 43% 44% 38% 47% 44%
PL 42% 38% 43% 42% 42%
CY 41% 63% 42% 29% 35%
IE 40% 35% 38% 38% 46%
RO 40% 35% 43% 35% 44%
AT 39% 45% 40% 39% 36%
DE 39% 41% 36% 42% 38%
EL 39% 48% 37% 39% 38%
PT 39% 32% 39% 44% 38%
UK 39% 35% 38% 41% 41%
CZ 38% 43% 37% 37% 38%
HR 37% 36% 38% 38% 37%
HU 37% 32% 33% 37% 41%
IT 37% 27% 38% 44% 34%
SK 37% 30% 32% 38% 42%
LT 33% 33% 36% 31% 33%
BG 29% 21% 26% 32% 33%
TOTAL
Age
WH
AT
BR
ING
S E
UR
OP
EA
N C
ITIZ
EN
S T
OG
ET
HE
R IS
MO
RE
IMP
OR
TA
NT
TH
AN
WH
AT
SE
PA
RA
TE
S T
HE
M
Gen
der g
rou
ps
KN
OW
LE
DG
E O
F TH
E E
UR
OP
EA
N P
AR
LIA
ME
NT
: TH
E D
EC
ISIO
N-M
AK
ING
PR
OC
ES
S O
F TH
E E
UR
OP
EA
N P
AR
LIA
ME
NT
Ag
e g
rou
ps

104
2) Focus on gender
a. European Union results
Q6 Would you say that the European Parliament’s decisions are adopted above all…? (%)
Gen
der
K
NO
WL
ED
GE
OF
TH
E E
UR
OP
EA
N P
AR
LIA
ME
NT
: TH
E D
EC
ISIO
N-M
AK
ING
PR
OC
ED
UR
E O
F T
HE
EU
RO
PE
AN
PA
RL
IAM
EN
T
46
34
9
11
40
36
9
15
According to the political affinities
of the MEPs
According to the interests
of the Member States from
which the MEPs come
Both (SPONTANEOUS)
Don't know
Male
Female

105
b. National results
Q6 Would you say that the European Parliament’s decisions are adopted above all…? (%)
‘According to the political affinities of the MEPs’ (%)
Male Female
ES 58% 60% 57%
BE 56% 59% 53%
FI 56% 57% 54%
SI 54% 57% 51%
SE 53% 52% 55%
FR 50% 53% 47%
LV 49% 49% 49%
MT 45% 44% 46%
NL 44% 48% 41%
DK 43% 47% 39%
EE 43% 44% 43%
EU28 43% 46% 40%
LU 43% 45% 41%
PL 42% 47% 37%
CY 41% 40% 41%
IE 40% 42% 38%
RO 40% 38% 42%
AT 39% 43% 35%
DE 39% 45% 33%
EL 39% 41% 37%
PT 39% 37% 41%
UK 39% 44% 35%
CZ 38% 40% 36%
HR 37% 37% 37%
HU 37% 39% 36%
IT 37% 41% 34%
SK 37% 37% 36%
LT 33% 35% 32%
BG 29% 34% 26%
TOTAL
Gender
KN
OW
LE
DG
E O
F TH
E E
UR
OP
EA
N P
AR
LIA
ME
NT
: TH
E D
EC
ISIO
N-M
AK
ING
PR
OC
ES
S O
F TH
E E
UR
OP
EA
N P
AR
LIA
ME
NT
Gen
der

106
3) Focus on occupational groups
a. European Union results
Q6 Would you say that the European Parliament’s decisions are adopted above all…? (%)
Occ
up
atio
nal
gro
up
KN
OW
LE
DG
E O
F T
HE
EU
RO
PE
AN
PA
RL
IAM
EN
T: T
HE
DE
CIS
ION
-MA
KIN
G P
RO
CE
DU
RE
OF
TH
E E
UR
OP
EA
N P
AR
LIA
ME
NT
46
34
9
11
45
40
9
6
42
42
7
9
44
35
8
13
39
31
9
21
44
33
9
14
42
31
10
17
40
41
8
11
According to the political affinities
of the MEPs
According to the interests
of the Member States from
which the MEPs come
Both (SPONTANEOUS)
Don't know
Self-employed
Managers
Other white collars
Manual workers
House persons
Unemployed
Retired
Students
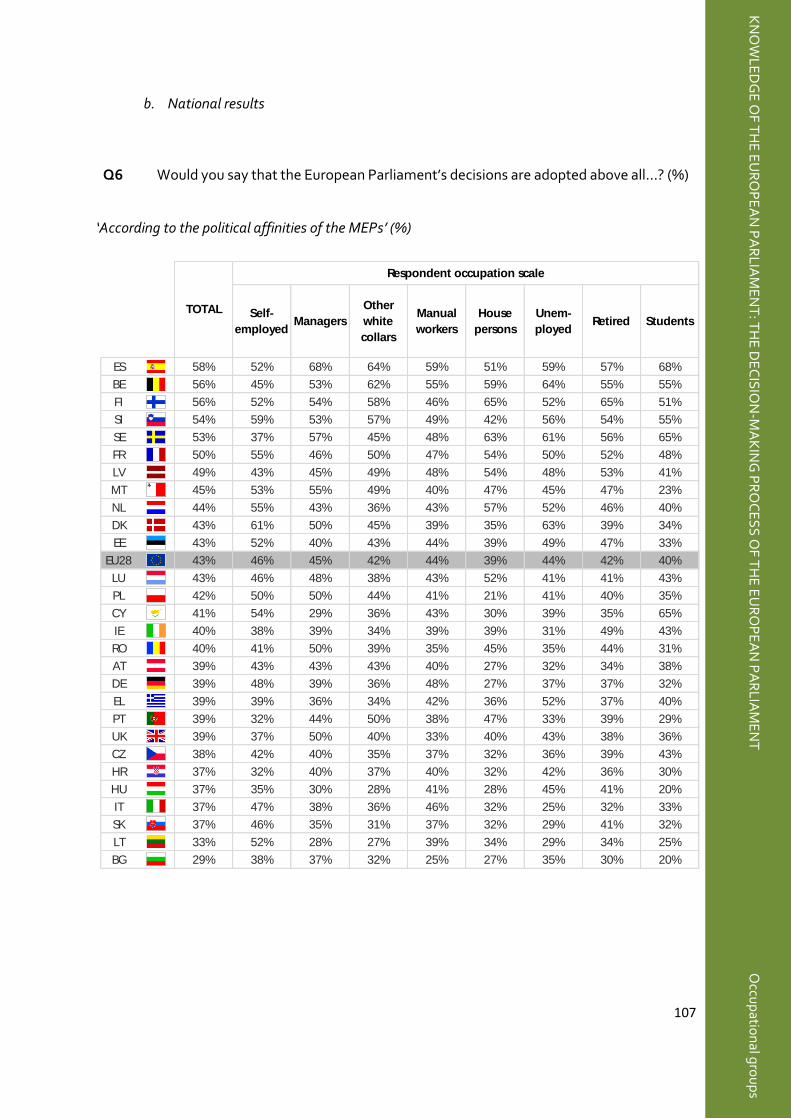
107
b. National results
Q6 Would you say that the European Parliament’s decisions are adopted above all…? (%)
‘According to the political affinities of the MEPs’ (%)
Self-
employedManagers
Other
white
collars
Manual
workers
House
persons
Unem-
ployedRetired Students
ES 58% 52% 68% 64% 59% 51% 59% 57% 68%
BE 56% 45% 53% 62% 55% 59% 64% 55% 55%
FI 56% 52% 54% 58% 46% 65% 52% 65% 51%
SI 54% 59% 53% 57% 49% 42% 56% 54% 55%
SE 53% 37% 57% 45% 48% 63% 61% 56% 65%
FR 50% 55% 46% 50% 47% 54% 50% 52% 48%
LV 49% 43% 45% 49% 48% 54% 48% 53% 41%
MT 45% 53% 55% 49% 40% 47% 45% 47% 23%
NL 44% 55% 43% 36% 43% 57% 52% 46% 40%
DK 43% 61% 50% 45% 39% 35% 63% 39% 34%
EE 43% 52% 40% 43% 44% 39% 49% 47% 33%
EU28 43% 46% 45% 42% 44% 39% 44% 42% 40%
LU 43% 46% 48% 38% 43% 52% 41% 41% 43%
PL 42% 50% 50% 44% 41% 21% 41% 40% 35%
CY 41% 54% 29% 36% 43% 30% 39% 35% 65%
IE 40% 38% 39% 34% 39% 39% 31% 49% 43%
RO 40% 41% 50% 39% 35% 45% 35% 44% 31%
AT 39% 43% 43% 43% 40% 27% 32% 34% 38%
DE 39% 48% 39% 36% 48% 27% 37% 37% 32%
EL 39% 39% 36% 34% 42% 36% 52% 37% 40%
PT 39% 32% 44% 50% 38% 47% 33% 39% 29%
UK 39% 37% 50% 40% 33% 40% 43% 38% 36%
CZ 38% 42% 40% 35% 37% 32% 36% 39% 43%
HR 37% 32% 40% 37% 40% 32% 42% 36% 30%
HU 37% 35% 30% 28% 41% 28% 45% 41% 20%
IT 37% 47% 38% 36% 46% 32% 25% 32% 33%
SK 37% 46% 35% 31% 37% 32% 29% 41% 32%
LT 33% 52% 28% 27% 39% 34% 29% 34% 25%
BG 29% 38% 37% 32% 25% 27% 35% 30% 20%
TOTAL
Respondent occupation scale
KN
OW
LE
DG
E O
F TH
E E
UR
OP
EA
N P
AR
LIA
ME
NT
: TH
E D
EC
ISIO
N-M
AK
ING
PR
OC
ES
S O
F TH
E E
UR
OP
EA
N P
AR
LIA
ME
NT
O
ccup
ation
al gro
up
s
108
This 2016 Parlemeter of the European Parliament (EP/EB 86.1) was conducted in the 28 Member States of the European Union, from 24 September until 3 October 2016, by Kantar Public (previously TNS opinion). This socio-demographic focus aims at presenting the national socio-demographic details for a selection of key findings of this survey: the feeling of membership to the EU, the voice of the European citizens, information and knowledge about the European Parliament, its image and role.
The content of this document is the sole responsibility of the author and any opinions expressed therein do not necessarily represent the official position of the European Parliament. It is addressed to the Members and staff of the EP for their parliamentary work.
© European Union 2016
PE 589.762 ISBN 978-92-846-0203-2 doi 10.2861/362012 QA-04-16-952-EN-N
This is a publication of the Public Opinion Monitoring Unit Directorate-General for Communication, European Parliament