paris, february 10, 2021 outstanding performance from the
TRANSCRIPT

PRESS RELEASE AND MANAGEMENT REPORT
Paris, February 10, 2021
Outstanding performance from the Group in 2020 that demonstrates the strength of its business model:
Significant contribution to the fight against covid-19
Sales resilience, significant margin improvement and net profit growth
Well positioned for future growth
Key Figures (in millions of euros) FY 2020 2020/2019 as
published 2020/2019
comparable (a)
Group Revenue 20,485 -6.5% -1.3%
of which Gas & Services 19,656 -6.6% -1.2%
Operating Income Recurring (OIR) 3,790 -0.1% +3.6%
Group OIR Margin 18.5% +120 bps
Variation excluding energy +80 bps
Gas & Services OIR Margin 20.4% +130 bps
Variation excluding energy +90 bps
Net Profit (Group Share) 2,435 +8.6%
Net Profit Recurring (Group Share) (b) 2,341 +1.5%
Earnings per Share (in euros) 5.16 +8.5%
2020 proposed Dividend per Share (in euros) 2.75 +1.9%
Cash flow from operating activities before changes in net working capital 4,932 +1.5%
Net Debt €10.6 bn
Return on Capital Employed after tax - ROCE 9.0% +60 bps
Recurring ROCE (c) 8.6% -
(a) Change excluding the currency, energy (natural gas and electricity) and significant scope impacts, see reconciliation in appendix. (b) Excluding exceptional and significant transactions that have no impact on the operating income recurring, see reconciliation in appendix. (c) Based on the recurring net profit, see reconciliation in appendix.
Commenting on the results for 2020, Benoît Potier, Air Liquide Chairman and CEO, stated:
“The Group was fully mobilized to serve its customers and patients in 2020, which was an out of the ordinary year, whilst being resolutely committed to the fight against covid-19.
I want to recognize the exceptional work accomplished by all the Air Liquide’s teams.
The Group‘s performance was outstanding in this environment: sales resilience, significant margin improvement, net profit growth and investment decisions continued at a very high level. This performance illustrates the solidity of our business model. It also perfectly positions the Group for future growth and enables it to already benefit from the acceleration seen in healthcare, energy transition, and the increasing presence of technologies, in particular digital, in all sectors.
Over the full year, 2020 sales were practically stable on a comparable basis, with business back to growth in the fourth quarter. The Gas & Services sales, which account for 96% of Group revenue, held up well, as did Global Markets & Technologies which retained their momentum. On a comparable basis, business was supported by strong sales growth in Healthcare and Electronics. Geographically, the situation was extremely varied with Europe faring well, driven by demand in Healthcare, and a solid performance from the developing economies, particularly China, and Eastern European and Latin American countries.
The Group’s operating margin improvement plan, combined with exceptional cost containment measures relating to the situation in 2020, resulted in a marked improvement in the margin of +80 bps excluding energy impact. The

Air Liquide - FY 2020 Performance
PAGE 2/36
structural efficiencies stood at 441 million euros. Operating cash flows were high and the debt-to-equity ratio was reduced significantly. The Group’s balance sheet confirms its strength.
The Group has achieved, as of 2019, the sales and efficiencies objectives of its NEOS 2020 company program. As for the ROCE of 10%+, it is maintained, with target achievement by 2023-2024 to take into account the impact of the covid-19 crisis as well as the pro-active investment policy in the current favorable context. In 2020, investment decisions thus stood at the extremely high level of 3.2 billion euros, indicative of future growth.
In an environment marked by global recovery plans and commitment to energy transition, the Group still has numerous investment opportunities of which 44% are projects related to the fight against climate change, including the development of Hydrogen Energy.
In 2021, in a context of limited local lockdowns in the first half of the year and recovery in the second half, Air Liquide is confident in its ability to further increase its operating margin and to deliver recurring net profit (1) growth, at constant exchange rates. ”
(1) Recurring net profit: Excluding exceptional and significant items that have no impact on the operating income recurring. Excluding the impact of any US tax reform in 2021.
2020 Highlights
■ Crisis management:
Rapid adaptation to the crisis for the entire organization: implementation of strict health standards allowing business continuity, development of homeworking. Increased attention on our stakeholders: employees, customers, shareholders and suppliers.
Exceptional Group mobilization against Covid-19.
Implementation of a temporary cost containment plan enabling immediate alignment with the activity level.
■ Healthcare:
Mobilization of Air Liquide Healthcare teams worldwide to deal with the increased demand for medical oxygen resulting from the pandemic. Tripling of the production of intensive care ventilators in France. Success of the consortium of industrial companies led by Air Liquide to manufacture 10,000 ventilators in record time. Tripling of the production of CryopAL’s medical oxygen tanks.
In Home Healthcare, strengthening the home healthcare offer with support for diabetic patients in Germany and the Benelux.
Air Liquide Foundation support for 10 scientific projects and 25 emergency social support projects as part of its Covid-19 initiative.
■ Industry:
Finalization of the acquisition agreement with Sasol for the world’s largest oxygen production facility, in Secunda, South Africa, for approximately 440 million euros, with a CO2 emissions reduction target of at least 30%. This operation remains subject to the usual conditions precedent, in particular the authorization of the South African Competition Authority.
Numerous long-term contracts and investments in Large Industries, in the United States with Eastman Chemical Company and Steel Dynamics Inc, in Europe with BASF in Belgium, KGHM Polska Miedź in Poland and in the port of Moerdijk in the Netherlands, in Russia with NLMK, in China in the port area of Tianjin and in Taiwan.
Major contracts in Electronics, particularly in China (BOE) and Taiwan.
Continuation of the Group’s digital transformation with the worldwide roll-out of its program to digitize the liquid gas supply chain, IBO (Integrated Bulk Operations), in Industrial Merchant.
■ Climate and energy transition:
Carbon-free hydrogen: Start-up of the world’s largest Proton Exchange Membrane (PEM) electrolyzer in Bécancour, Quebec (Canada). In January 2021, the company acquired a 40% stake in the French company H2V Normandy with a view to building an electrolyzer complex powered by low-carbon energy with a capacity of up to 200 MW.
Projects supporting hydrogen mobility for trucks: announcement of the construction of the first high-

FY 2020 Performance - Air Liquide
PAGE 3/36
pressure hydrogen refueling station in Europe, in Fos-sur-Mer in France, and launch of an initiative with the Port of Rotterdam to develop infrastructure which will allow 1,000 hydrogen-powered trucks to travel between the Netherlands, Belgium and Western Germany by 2025.
Publication of a study on the competitiveness of hydrogen solutions by the Hydrogen Council, which now has 109 members, compared with 81 in mid-January 2020 and 13 when it was created in 2017.
Acceleration of biomethane activities: launch in Italy with the construction of two production units and a distribution station for local transport companies, acceleration in the United Kingdom with a contract with the Asda retail group for the installation and operation of six Bio-NGV distribution stations.
Signing of a long-term renewable electricity purchase contract, representing 15% of the current consumption of the Group’s activities in Spain.
■ Corporate:
Sale of schülke to private equity firm EQT. Sale of CryoPDP to French private equity firm Hivest Capital Partners.
Acquisition of 80% of the capital of the French company Cryoconcept, specialized in dilution refrigeration.
Sale of Air Liquide entities in the Czech Republic and Slovakia.
Successful launch of a double long-term bond issue for a total of 1 billion euros.
First General Meeting held in closed session and livestreamed, generating 40,000 views via livestream and replay.
Group revenue for 2020 totaled 20,485 million euros, almost flat on a comparable basis compared with 2019, at -1.3%, in a context of global health and economic crisis. The business model thus demonstrated its robustness, supported by the Group’s global presence and the diversity and balance of its portfolio between growth businesses and resilient sectors. Engineering & Construction consolidated revenue, which was down -23% over the year, enjoyed a strong +24.1% increase in the 4th quarter. Global Markets & Technologies was up +6.0%, with a dynamic momentum in biogas with the start-up of new units. Group revenue as published was down -6.5% due to negative currency (-2.0%), energy (-1.8%), and significant scope (-1.4%) impacts.
Gas & Services revenue totaled 19,656 million euros, very close to 2019 on a comparable basis, at -1.2%. Sales as
published were down -6.6% in 2020, affected by unfavorable currency (-2.1%), energy (-1.9%) and significant scope
(-1.4%) impacts. The significant scope impact mainly reflects the disposal of Schülke in Healthcare.
■ Gas & Services revenue in the Americas totaled 7,799 million euros in 2020, a decline of -3.7% on a comparable basis. In North America, sales started improving sequentially in the 3rd quarter but remained down compared with 2019. Sales were up markedly in Latin America in 2020, mainly driven by a start-up in Large Industries in Argentina and strong demand for medical oxygen. Large Industries revenue in the region was up +1.4%. Industrial Merchant saw a strong sequential recovery over the 2nd half of the year, but annual revenue remained down by -7.1%. Healthcare is still fully committed to the fight against the pandemic notably with the supply of medical oxygen, and posted annual sales growth of +7.7%. Electronics posted solid growth of +5.2%.
■ With comparable growth up +1.3% in 2020, sales in Europe reached 6,826 million euros. Industrial activities, which were particularly affected by the public health crisis from mid-March, started to recover from the beginning of May and markedly accelerated its recovery during the second half of the year. Large Industries sales were down by -1.0% over the year. Industrial Merchant recovered during the 2nd half of the year, but its annual revenue, which was down -5.6%, remains impacted by the crisis. Healthcare activities were strongly mobilized in the fight against Covid-19, and posted revenue growth of +9.7% over the year.
■ Revenue in Asia-Pacific remained stable (-0.1%) in 2020 on a comparable basis, and stood at 4,467 million euros, with all industrial activities posting growth during the 4th quarter. China (+3.4%) brought a strong contribution thanks to a quick recovery across all activities. The recovery was slower in the rest of the region. Large Industries (+0.2%) was driven by the ramp-up of a unit in South Korea. Industrial Merchant (-3.6%) remained sluggish, despite the strong recovery in sales in China during the 2nd half of the year. Electronics (+3.6%) momentum was very dynamic with growth exceeding +10% over the year excluding Equipment & Installation sales.

Air Liquide - FY 2020 Performance
PAGE 4/36
■ Comparable growth was down -2.6% in 2020 in the Middle East and Africa, and revenues reached 564 million
euros. Following a customer turnaround at the beginning of the year, Large Industries sales were up during the
2nd half of the year. Industrial Merchant revenue, which was strongly hit by the Covid-19 crisis during the 2nd quarter,
saw a return to growth during the 4th quarter. Healthcare is committed to the fight against Covid-19 and posted
strong growth across the region.
Healthcare was fully committed to ensuring the supply of oxygen to hospitals to treat Covid-19 patients and posted significant comparable growth of +8.5% for 2020. Electronics also recorded a very solid growth of +3.9% and +7.9% excluding Equipment & Installations sales. Large Industries sales remained stable in 2020 at -0.1% despite the public health context. Industrial Merchant sales were down -6.3% on a comparable basis, negatively impacted by the crisis but supported by solid pricing impacts of +2.6% and growth in several developing economies.
Consolidated Engineering & Construction revenue stood at 250 million euros for 2020, with a sharp increase of +24%
in the 4th quarter. Third-party customer sales were down -23% over the year, reflecting the slowdown due to the public
health crisis whereas total sales saw a more moderate decline of -9% for the year. Order intake for 2020 reached
820 million euros.
Global Markets & Technologies revenue for 2020 reached 579 million euros, representing growth of +6.0% during a
period marked by the public health crisis, driven by the biogas activity. Order intake for Group projects and third-party
customers totaled 598 million euros, representing a dynamic increase of +14.3%.
Structural Efficiencies reached 441 million euros for 2020 and largely exceeded the annual objective which had been
set at more than 400 million euros. Moreover, exceptional cost reductions under the public health crisis response plan
were due to the low level of activity and are not, due to their nature, sustainable in the long-term.
The Group’s operating income recurring (OIR) amounted to 3,790 million euros in 2020, stable as published (-0.1%)
but up +3.6% on a comparable basis versus 2019. The operating margin (OIR to revenue) stood at 18.5%, marking a
strong improvement of +120 basis points compared with 2019 and of +80 basis points excluding the energy impact.
Gas & Services operating margin as published stood at 20.4%, an improvement of +130 basis points compared with
2019, and of +90 basis points excluding the energy impact.
Despite the pandemic, net profit (Group share) amounted to 2,435 million euros in 2020, a significant increase of
+8.6% as published and of +11.2% excluding the currency impact. Net earnings per share at 5.16 euros, were up
significantly (+8.5%) compared with 2019, in line with the increase in net profit (Group share).
Cash flow from operating activities before changes in net working capital totaled 4,932 million euros, representing
an increase of +1.5% despite a slowdown in activity due to the public health crisis, and once again underlining the
resilience of the business model. This corresponds to a record high of 24.1% of sales, a marked improvement of
+190 basis points compared with 2019. Working capital requirement (WCR) decreased significantly, by 364 million
euros compared with December 31, 2019.
Gross industrial capital expenditure reached 2,630 million euros and was stable overall compared with 2019. This
represented 12.8% of sales, reflecting strong project developments despite the public health crisis. Proceeds from
sale of assets were exceptionally high in 2020 at 800 million euros and notably included the disposal of the Schülke.
The net debt-to-equity ratio stood at 55.8%, a marked decrease compared with the end of 2019.
Industrial investment decisions were higher than 3.0 billion euros for the second year in a row despite the challenging
public health context. The 12-month portfolio of investment opportunities stood at 3.1 billion euros at the end of
December, with several new entries during the 4th quarter. The type of opportunities has changed significantly and the
energy transition represents 44% of the portfolio.

FY 2020 Performance - Air Liquide
PAGE 5/36
The additional contribution to sales of unit start-ups and ramp-ups totaled 191 million euros in 2020 despite the
public health crisis. The additional contribution to 2021 sales of unit start-ups and ramp-ups should reach around
250 million euros. The 16 units that are currently being acquired in South Africa should bring an additional contribution
estimated at around 100 million euros for 2021 in a first phase, sales should then exceed 400 million euros per year
during a second phase, when energy management will be fully integrated, without any significant impact on operating
income.
The return on capital employed after tax (ROCE) was 9.0% in 2020. Recurring ROCE(1) stood at 8.6%, stable compared
with 2019 despite the decline in business due to the public health crisis.
Air Liquide’s Board of Directors, which met on February 9, 2021, approved the audited financial statements for the
2020 fiscal year. The Statutory Auditors are in the process of issuing a report with an unqualified opinion.
At the next Annual General Meeting, the Board of Directors will propose the payment of a dividend of 2.75 euros per share, up +1.9% compared to prior year and in line with the recurring net profit growth. The ex-dividend date has been set for May 17, 2021 and the payment is scheduled for May 19, 2021. In addition, the Board of Directors has decided to allot again one free share for every 10 shares. This allotment is considered for June 2022.
The Board of Directors also approved the draft resolutions that will be submitted for a vote by the General Meeting on
May 4, 2021, notably in order to:
■ renew, for a period of four years, the term of office of Mr. Xavier Huillard, an independent Director since 2017, Chairman of the Remuneration Committee and member of the Appointments and Governance Committee. Mr. Huillard will continue to provide the Board of Directors with the benefit of his experience as the head of a large international company and his extensive knowledge of the construction business.
■ appoint Mr. Pierre Breber, Mr. Aiman Ezzat and Mr. Bertrand Dumazy as Directors, for a period of four years:
- Pierre Breber is an American citizen and Vice-President and Chief Financial Officer of Chevron, where he has held several management positions spanning a career of over 30 years. He will bring to the Board his strong operational and financial skills, and his very international profile.
- As Chief Executive Officer of Capgemini, Aiman Ezzat will bring to the Board his extensive experience in the digital sector, his financial expertise, his knowledge of many industrial sectors, and the perspective of a chief executive from a major international group.
- Bertrand Dumazy, Chairman and Chief Executive Officer of Edenred, will bring to the Board his managerial skills acquired at several companies in both the industrial and service sectors, together with his experience in digital transformation and change management.
The Board stated that it considered Mr. Pierre Breber, Mr. Aiman Ezzat and Mr. Bertrand Dumazy to be independent.
Concerning Mr. Thierry Peugeot, whose term of office as Director is due to expire at the close of the General Meeting
of May 2021, the Board, in agreement with Mr. Peugeot who will total 16 years of office on the Board of Directors,
agreed, as part of good governance practices, that the renewal of his office will not be proposed to the General Meeting.
Mr Peugeot was very warmly thanked for his contribution to the work of the Board of Directors of which he has been a
member since 2005, and to the work of Audit and Accounts Committee of which he has been a member since 2012.
At the close of the General Meeting of May 4, 2021, the Board of Directors would accordingly be composed of
15 members: 13 elected members (the vast majority of whom are independent (i.e. 92% of independent Directors), 6
of whom would be women (i.e. 46%) and 7 would be foreign members), and 2 Directors representing the employees.
Finally, the Board of Directors will submit for the vote of the General Meeting the elements of Mr. Benoît Potier’s
remuneration for 2020, in his capacity as Chairman and Chief Executive Officer, together with the information relating
to the remuneration of all the corporate officers. The General Meeting will also be asked to decide upon the
remuneration policy for corporate officers applicable to Mr. Benoît Potier and to the Company’s Directors.
1 See reconciliation in Appendix

Air Liquide - FY 2020 Performance
PAGE 6/36
Table of Contents
PERFORMANCE ...................................................................................................................... 7
Key Figures ....................................................................................................................................................................... 7
Income Statement ............................................................................................................................................................ 8
2020 Cash Flow and Balance Sheet ............................................................................................................................ 17
Environment and Society .............................................................................................................................................. 19
INVESTMENT CYCLE AND FINANCING .................................................................................. 20
Investments ................................................................................................................................................................... 20
2020 Financing .............................................................................................................................................................. 21
CLOSURE OF THE NEOS PROGRAM ...................................................................................... 24
2020 OUTLOOK ..................................................................................................................... 25
APPENDICES ......................................................................................................................... 26
Performance indicators ................................................................................................................................................ 26
Calculation of performance indicators (Year) ............................................................................................................. 27
Calculation of performance indicators (Quarter) ........................................................................................................ 31
4th quarter 2020 revenue ............................................................................................................................................... 31
Geographic and segment information ......................................................................................................................... 32
Consolidated income statement .................................................................................................................................. 32
Consolidated balance sheet ......................................................................................................................................... 33
Consolidated cash flow statement .............................................................................................................................. 34
FY 2020 Performance - Air Liquide
PAGE 7/36
PERFORMANCE
Unless otherwise stated, all variations in revenue outlined below are on a comparable basis, excluding currency, energy
(natural gas and electricity) and significant scope impacts.
Key Figures
(in millions of euros) FY 2019 FY 2020 2020/2019
published change
2020/2019
comparable
change (a)
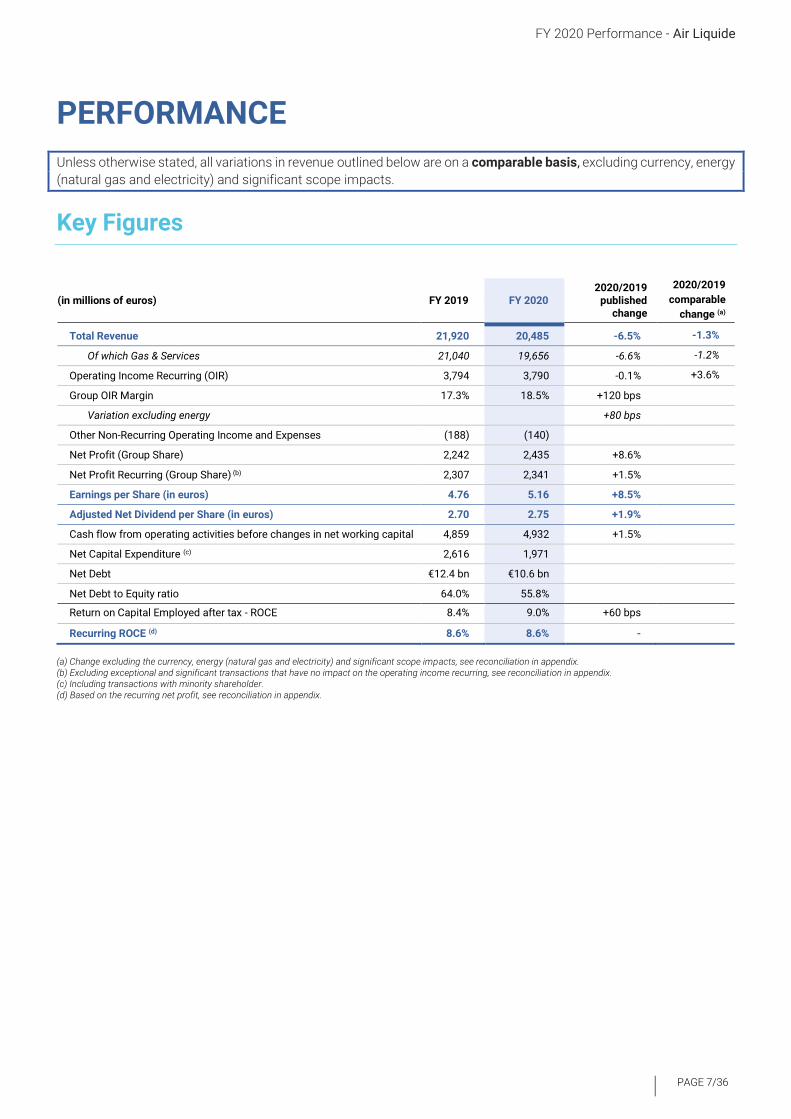
Total Revenue 21,920 20,485 -6.5% -1.3%
Of which Gas & Services 21,040 19,656 -6.6% -1.2%
Operating Income Recurring (OIR) 3,794 3,790 -0.1% +3.6%
Group OIR Margin 17.3% 18.5% +120 bps
Variation excluding energy +80 bps
Other Non-Recurring Operating Income and Expenses (188) (140)
Net Profit (Group Share) 2,242 2,435 +8.6%
Net Profit Recurring (Group Share) (b) 2,307 2,341 +1.5%
Earnings per Share (in euros) 4.76 5.16 +8.5%
Adjusted Net Dividend per Share (in euros) 2.70 2.75 +1.9%
Cash flow from operating activities before changes in net working capital 4,859 4,932 +1.5%
Net Capital Expenditure (c) 2,616 1,971
Net Debt €12.4 bn €10.6 bn
Net Debt to Equity ratio 64.0% 55.8%
Return on Capital Employed after tax - ROCE 8.4% 9.0% +60 bps
Recurring ROCE (d) 8.6% 8.6% -
(a) Change excluding the currency, energy (natural gas and electricity) and significant scope impacts, see reconciliation in appendix. (b) Excluding exceptional and significant transactions that have no impact on the operating income recurring, see reconciliation in appendix. (c) Including transactions with minority shareholder. (d) Based on the recurring net profit, see reconciliation in appendix.
Air Liquide - FY 2020 Performance
PAGE 8/36
Income Statement
REVENUE
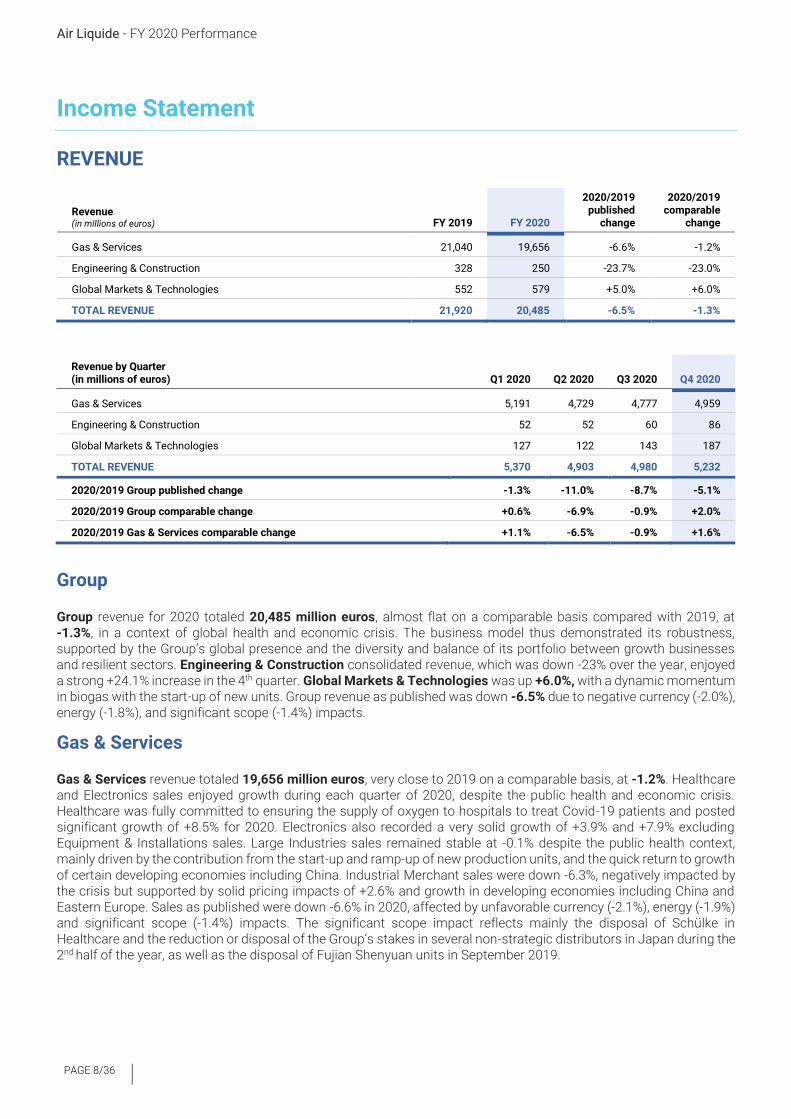
Revenue (in millions of euros) FY 2019 FY 2020
2020/2019 published
change
2020/2019 comparable
change
Gas & Services 21,040 19,656 -6.6% -1.2%
Engineering & Construction 328 250 -23.7% -23.0%
Global Markets & Technologies 552 579 +5.0% +6.0%
TOTAL REVENUE 21,920 20,485 -6.5% -1.3%
Revenue by Quarter (in millions of euros) Q1 2020 Q2 2020 Q3 2020 Q4 2020
Gas & Services 5,191 4,729 4,777 4,959
Engineering & Construction 52 52 60 86
Global Markets & Technologies 127 122 143 187
TOTAL REVENUE 5,370 4,903 4,980 5,232
2020/2019 Group published change -1.3% -11.0% -8.7% -5.1%
2020/2019 Group comparable change +0.6% -6.9% -0.9% +2.0%
2020/2019 Gas & Services comparable change +1.1% -6.5% -0.9% +1.6%
Group
Group revenue for 2020 totaled 20,485 million euros, almost flat on a comparable basis compared with 2019, at -1.3%, in a context of global health and economic crisis. The business model thus demonstrated its robustness, supported by the Group’s global presence and the diversity and balance of its portfolio between growth businesses and resilient sectors. Engineering & Construction consolidated revenue, which was down -23% over the year, enjoyed a strong +24.1% increase in the 4th quarter. Global Markets & Technologies was up +6.0%, with a dynamic momentum in biogas with the start-up of new units. Group revenue as published was down -6.5% due to negative currency (-2.0%), energy (-1.8%), and significant scope (-1.4%) impacts.
Gas & Services
Gas & Services revenue totaled 19,656 million euros, very close to 2019 on a comparable basis, at -1.2%. Healthcare and Electronics sales enjoyed growth during each quarter of 2020, despite the public health and economic crisis. Healthcare was fully committed to ensuring the supply of oxygen to hospitals to treat Covid-19 patients and posted significant growth of +8.5% for 2020. Electronics also recorded a very solid growth of +3.9% and +7.9% excluding Equipment & Installations sales. Large Industries sales remained stable at -0.1% despite the public health context, mainly driven by the contribution from the start-up and ramp-up of new production units, and the quick return to growth of certain developing economies including China. Industrial Merchant sales were down -6.3%, negatively impacted by the crisis but supported by solid pricing impacts of +2.6% and growth in developing economies including China and Eastern Europe. Sales as published were down -6.6% in 2020, affected by unfavorable currency (-2.1%), energy (-1.9%) and significant scope (-1.4%) impacts. The significant scope impact reflects mainly the disposal of Schülke in Healthcare and the reduction or disposal of the Group’s stakes in several non-strategic distributors in Japan during the 2nd half of the year, as well as the disposal of Fujian Shenyuan units in September 2019.

FY 2020 Performance - Air Liquide
PAGE 9/36
Revenue by geography and business line (in millions of euros) FY 2019 FY 2020
2020/2019 published
change
2020/2019 comparable
change
Americas 8,460 7,799 -7.8% -3.7%
Europe 7,172 6,826 -4.8% +1.3%
Asia-Pacific 4,794 4,467 -6.8% -0.1%
Middle East & Africa 614 564 -8.2% -2.6%
GAS & SERVICES REVENUE 21,040 19,656 -6.6% -1.2%
Large Industries 5,629 4,972 -11.7% -0.1%
Industrial Merchant 9,754 8,959 -8.2% -6.3%
Healthcare 3,693 3,724 +0.8% +8.5%
Electronics 1,964 2,001 +1.9% +3.9%
Americas
Gas & Services revenue in the Americas totaled 7,799 million euros in 2020, a decline of -3.7%. In North America, after
being strongly hit by the pandemic during the 2nd quarter, sales started improving sequentially in the 3rd quarter but
remained down compared with 2019. Sales were up markedly in Latin America in 2020, mainly driven by a start-up in
Large Industries in Argentina and strong demand for medical oxygen. Large Industries revenue in the region was up
+1.4%. Industrial Merchant saw a strong sequential recovery over the 2nd half of the year, but annual revenue remained
down by -7.1%. Healthcare is still fully committed to the fight against the pandemic notably with the supply of medical
oxygen, and posted annual sales growth of +7.7%. Electronics posted solid growth of +5.2%.
Americas Gas & Services 2020 Revenue
■ Large Industries revenue was up +1.4% over 2020. In the
United States, following a substantial decline during the
2nd quarter, air gas volumes and, to a lesser extent,
hydrogen volumes, saw a marked sequential recovery
starting in the 3rd quarter but closed 2020 at lower levels
than in 2019. Sales were up significantly in Latin America in
2020, mainly driven by the start-up of a unit in Argentina and
strong air gas demand during the 4th quarter in Brazil and
Argentina.
■ Industrial Merchant sales (-7.1%) were impacted by the
public health crisis, but enjoyed a strong sequential
improvement starting in the 3rd quarter. The slowdown was
partly offset by high pricing impacts of +3.6% over the year.
The contribution from helium gradually declined and
represented less than 15% of pricing impacts during the 4th quarter. Sales were up in the Food, Pharmaceuticals,
Research, and Retail & Craftsmen markets during the 4th quarter, whereas sales in industrial sectors such as Metal
Fabrication and Automotive remained down despite a gradual recovery during the 2nd half of the year. In the United
States and Canada, gas volumes, in particular cylinders, were up markedly during the 2nd half of the year following
a major decline during the 2nd quarter at the peak of the public health crisis. In Latin America, revenues were up
over the year with a good momentum for liquid gas sales in Brazil and Argentina during the 4th quarter, notably to
the Metal Fabrication sector.
■ Healthcare revenue was up +7.7% in 2020 with medical liquid oxygen and hospital installations sales up
significantly across the region, in particular during the 2nd wave of the Covid-19 pandemic in the 4th quarter. In the
United States, proximity care recovered quickly following a marked decline during the 2nd quarter due to the
interruption of elective care at the peak of the pandemic. In 2020, Home Healthcare enjoyed strong growth in Latin
America across all therapies and recovered gradually in Canada following a material slowdown during the
2nd quarter.
Air Liquide - FY 2020 Performance
PAGE 10/36
■ Electronics revenue was up +5.2% over the year, with an increase in Carrier Gases sales and excellent momentum
for Equipment & Installation sales.
Americas
■ Air Liquide announced a long-term supply agreement with Eastman Chemical Company to provide additional gaseous oxygen, nitrogen and syngas supporting Eastman’s growth and production in Longview, Texas. Air Liquide will invest more than 160 million U.S. dollars to modernize existing assets and build a new Air Separation Unit (ASU) and Partial Oxidation Unit (POX).
Europe
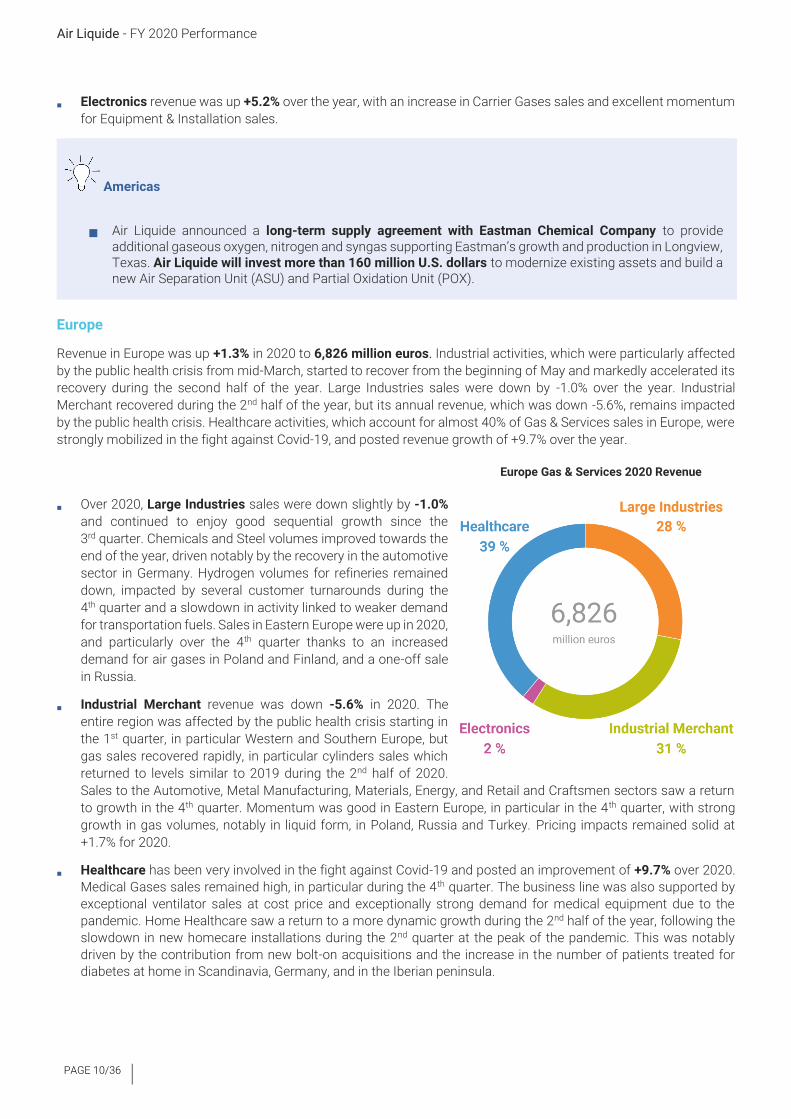
Revenue in Europe was up +1.3% in 2020 to 6,826 million euros. Industrial activities, which were particularly affected
by the public health crisis from mid-March, started to recover from the beginning of May and markedly accelerated its
recovery during the second half of the year. Large Industries sales were down by -1.0% over the year. Industrial
Merchant recovered during the 2nd half of the year, but its annual revenue, which was down -5.6%, remains impacted
by the public health crisis. Healthcare activities, which account for almost 40% of Gas & Services sales in Europe, were
strongly mobilized in the fight against Covid-19, and posted revenue growth of +9.7% over the year.
Europe Gas & Services 2020 Revenue
■ Over 2020, Large Industries sales were down slightly by -1.0%
and continued to enjoy good sequential growth since the
3rd quarter. Chemicals and Steel volumes improved towards the
end of the year, driven notably by the recovery in the automotive
sector in Germany. Hydrogen volumes for refineries remained
down, impacted by several customer turnarounds during the
4th quarter and a slowdown in activity linked to weaker demand
for transportation fuels. Sales in Eastern Europe were up in 2020,
and particularly over the 4th quarter thanks to an increased
demand for air gases in Poland and Finland, and a one-off sale
in Russia.
■ Industrial Merchant revenue was down -5.6% in 2020. The
entire region was affected by the public health crisis starting in
the 1st quarter, in particular Western and Southern Europe, but
gas sales recovered rapidly, in particular cylinders sales which
returned to levels similar to 2019 during the 2nd half of 2020.
Sales to the Automotive, Metal Manufacturing, Materials, Energy, and Retail and Craftsmen sectors saw a return
to growth in the 4th quarter. Momentum was good in Eastern Europe, in particular in the 4th quarter, with strong
growth in gas volumes, notably in liquid form, in Poland, Russia and Turkey. Pricing impacts remained solid at
+1.7% for 2020.
■ Healthcare has been very involved in the fight against Covid-19 and posted an improvement of +9.7% over 2020.
Medical Gases sales remained high, in particular during the 4th quarter. The business line was also supported by
exceptional ventilator sales at cost price and exceptionally strong demand for medical equipment due to the
pandemic. Home Healthcare saw a return to a more dynamic growth during the 2nd half of the year, following the
slowdown in new homecare installations during the 2nd quarter at the peak of the pandemic. This was notably
driven by the contribution from new bolt-on acquisitions and the increase in the number of patients treated for
diabetes at home in Scandinavia, Germany, and in the Iberian peninsula.

FY 2020 Performance - Air Liquide
PAGE 11/36
Europe
■ Air Liquide announced a 40% stake acquisition in the capital of the French company H2V Normandy, which aims to build a large-scale electrolyzer complex of up to 200 MW for the production of renewable and low-carbon hydrogen in France. This strategic investment demonstrates Air Liquide’s long-term commitment to hydrogen energy and its ambition to be a major player in the supply of renewable and low-carbon hydrogen, in order to contribute to the decarbonization of the industry and mobility markets.
■ Air Liquide announced an investment of 125 million euros in July to build the first world-scale Air Separation Unit (ASU) for oxygen production with an energy storage system that helps facilitate more renewable energy on the electricity grid due to its grid stabilizing capability. This highly efficient plant, with circa 10% less electricity consumption, will have a production capacity of 2,200 tons of oxygen per day, and will be built in Port of Moerdijk in the Netherlands. This project illustrates Air Liquide’s strategy to grow in strategic industrial basins, and the Group’s ability to design and implement innovative solutions contributing to the energy transition, in line with its Climate Objectives.
Asia-Pacific
Revenue in Asia-Pacific remained stable (-0.1%) in 2020 and stood at 4,467 million euros, with all industrial activities
displaying growth during the 4th quarter. China (+3.4%) contributed strongly to growth for the region thanks to a rapid
recovery across all activities following the Covid-19-related decline seen during the 1st quarter. The pick-up in business
was slower in the rest of the region, impacted by the public health crisis. Large Industries (+0.2%) was driven by the
strength of its business model and the ramp-up of a unit in South Korea. Industrial Merchant (-3.6%) remained sluggish,
despite the strong recovery in sales in China during the 2nd half of the year. Electronics (+3.6%) momentum was
excellent with growth exceeding +10% over the year excluding Equipment & Installation sales.
Asia-Pacific Gas & Services 2020 Revenue
■ Large Industries sales were up slightly over the year
(+0.2%), driven mainly by strong demand in oxygen for
Steel and Chemicals in China in the 2nd half and the
ramp-up of a hydrogen unit in South Korea. At the end
of the year, oxygen volumes in China were higher than
in 2019 but the recovery was slower in the rest of the
region, in particular in Japan where volumes remained
weak. In the 4th quarter, hydrogen and carbon
monoxide sales were impacted by customer
maintenance turnarounds in China. This was partially
offset by strong demand for hydrogen for refining in
Singapore.
■ Industrial Merchant revenue was down -3.6% over the
year, due to the impact of the Covid-19 pandemic. The
region saw a return to growth during the 4th quarter.
This was driven by China which posted a strong sales increase of +9.9% over the quarter and of +3.6% for the year,
with a marked increase in cylinder gas sales and gas produced on site in particular. Momentum across the rest of
the region remained slower due to the public health crisis, in particular in Japan and Singapore, but has seen a
sequential improvement during the second half of the year. Sales were up in the Research, Metal Manufacturing,
and Retail & Craftsmen markets in the region and pricing impacts were stable across the year.

Air Liquide - FY 2020 Performance
PAGE 12/36
■ Electronics sales for 2020, which were up +3.6%, posted marked growth of +10.7% excluding
Equipment & Installation sales, which had been particularly high during the 1st half of 2019. This growth was driven
by Advanced Materials and Carrier Gases with, in particular, the ramp-up of an Advanced Materials supply contract
in South Korea and of several Carrier Gases production plants in China, Japan, Taiwan and Singapore.
Asia-Pacific
■ Air Liquide and BASF have signed a contract in South Korea’s Yeosu National Industrial Complex to extend the term of their existing agreements over the long term. Within this context, Air Liquide leveraged the start-up in 2020 of its fourth hydrogen and carbon monoxide unit in this major industrial complex to increase by 20% the contractual volumes dedicated to BASF.
Middle East and Africa
Revenue in the Middle East and Africa reached 564 million euros, down -2.6% over 2020. Following a customer
turnaround at a large hydrogen production unit at the beginning of the year, Large Industries sales were up during the
2nd half of the year, in particular in Saudi Arabia, Egypt and South Africa. Industrial Merchant revenue, which was
strongly hit by the Covid-19 crisis during the 2nd quarter, recovered during the 3rd quarter and saw a return to growth
during the 4th quarter driven by good momentum in India and Egypt. Africa remained sluggish. Healthcare is committed
to the fight against Covid-19 and posted strong growth across the region.
Engineering & Construction
Consolidated Engineering & Construction revenue stood at 250 million euros for 2020, supported by a substantial
+24% increase in the 4th quarter driven by the sale of technology licenses and the progress of major third-party projects.
Third-party customer sales were down -23% over the year, reflecting the slowdown due to the public health crisis and
the allocation of resources to internal projects in Large Industries and Electronics. Total sales, which includes intra-
group sales, saw a more moderate decline of -9% for the year.
Order intake for the 4th quarter increased markedly and reached 820 million euros in 2020, an amount comparable to
2019. This confirms the efforts made by the sales teams and the postponement until the end of the year of certain
projects due to the public health crisis. More than half of orders are for projects in Asia. These mainly relate to Air
Separation Units and ultra-pure nitrogen production units, with orders for the Group very slightly exceeding those for
third-party customers.
Global Markets & Technologies
Global Markets & Technologies revenue for 2020 reached 579 million euros, representing growth of +6.0% during a
period marked by the public health crisis. The biogas activity was strong, with the start-up and ramp-up of production
units in the United States and markedly higher biomethane sales for transport in Europe. Technology equipment sales
were stable for 2020 as a whole, despite being affected by the public health crisis during the 2nd quarter.
Order intake for Group projects and third-party customers totaled 598 million euros, representing a dynamic increase
of +14.3%. They included in particular major contracts for helium cryogenic refrigerators, Turbo-Brayton LNG
reliquefaction units and, in the 4th quarter, hydrogen stations for China and South Korea.

FY 2020 Performance - Air Liquide
PAGE 13/36
Global Markets & Technologies
■ One of the leading retailers in the United Kingdom, ASDA, has contracted Air Liquide to install and operate six biomethane (BioNGV) distribution stations to refuel trucks on its sites. Alongside other investments to increase Air Liquide’s production and distribution capacities, this major contract marks a significant acceleration in the Group’s development of its biomethane activity in the UK.
■ Air Liquide announced the construction of its first two biomethane production units in Italy, recycling organic material from agricultural and livestock activities to convert it into biomethane, a renewable energy source. These investments to support the circular economy are in line with Air Liquide's Climate Objectives, and contribute to the development of a low carbon society.
OPERATING INCOME RECURRING
Operating income recurring before depreciation and amortization totaled 5,928 million euros, stable (-0.1%)
compared with 2019. Personnel costs were down -3.9% and -1.3% excluding currency and scope impacts, mainly due
to workforce reduction in mature economies, in particular at Airgas. Purchases were down markedly by -11.7%, thanks
to energy purchases, which benefited notably from a decrease in market prices, and purchases of other raw materials
and equipments such as hardgoods. Other operating expenses and income were down -8.9% and included a steep
reduction in subcontracting costs and travel expenses. Operating costs relating to the Covid-19 pandemic and in
particular idle-capacity costs, are included in operating expenses. Depreciation and amortization reached
2,138 million euros, stable compared with 2019, with scope effects, contract renewals, the end of the depreciation
and amortization of certain assets, and currency effects offsetting the start-up of new units in 2020.
The Group’s operating income recurring (OIR) amounted to 3,790 million euros in 2020, stable as published (-0.1%)
but up +3.6% on a comparable basis versus 2019. The operating margin (OIR to revenue) stood at 18.5%, marking a
strong improvement of +120 basis points compared with 2019 and of +80 basis points excluding the energy impact.
Ongoing efficiency programs and the exceptional cost containment plan launched by the Group in response to the
Covid-19 crisis contributed significantly to performance improvement despite a decline in business. The exceptional
cost containment plan is estimated to contribute around +20 basis points out of the +80 basis points of margin
improvement.
Efficiencies(2) reached 441 million euros for 2020. They increased slightly by +1.8% compared with 2019, despite the
decline in volumes due to the public health crisis, and largely exceeded the annual objective which had been set at
more than 400 million euros. These efficiencies represent cost savings of 2.8%. Industrial efficiencies accounted for
close to 50%, supported by investment in efficiency projects, notably the optimization of the supply chain in Industrial
Merchant, and energy efficiencies in Large Industries. The implementation of digital tools aimed at the Group’s
transformation continued, with the acceleration of the roll-out of remote operation centers for Large Industries
production units (Smart Innovative Operations, SIO), new optimization tools for delivery routes in Industrial Merchant
(Integrated Bulk Operations, IBO), and the introduction of a remote patient monitoring platform in Healthcare.
Moreover, exceptional cost reductions under the public health crisis response plan were due to the low level of activity
and are not, due to their nature, sustainable in the long-term.
Portfolio and pricing management also contributed to margin improvement.
2 See definition in Appendix.

Air Liquide - FY 2020 Performance
PAGE 14/36
Efficiencies
■ Air Liquide is deploying at a global scale its bulk gases supply chain digitalization program, IBO (Integrated Bulk Operations). Digital technology enables the improvement of operational performance and in particular a reduction in the carbon footprint, in line with the Group’s Climate Objectives. The deployment of IBO in its Industrial Merchant business line will further accelerate Air Liquide’s digital transformation for an always better customer experience.
Gas & Services
Gas & Services 2020 Operating Income Recurring
Gas & Services operating income recurring totaled 4,016 million
euros, down just -0.3% as published compared with 2019, but up
+3.1% on a comparable basis, despite the decline in activity due to
the public health crisis. The operating margin as published stood at
20.4%, an improvement of +130 basis points compared with 2019,
and of +90 basis points excluding the energy impact.
Selling prices were up +1.3% in 2020, driven mainly by Industrial
Merchant where prices were up markedly (+2.6%) due in particular to
pricing campaigns launched at the beginning of the year, in particular
in the United States, coupled with contributions from helium, notably
over the first three quarters.
Gas & Services Operating margin (a) FY 2019 FY 2020
FY 2020 excluding energy
impact
2020/2019 excluding energy
impact
Americas 18.2% 19.6% 19.4% +120 bps
Europe 20.0% 20.6% 19.9% -10 bps
Asia-Pacific 19.8% 22.0% 21.6% +180 bps
Middle East & Africa 17.9% 16.9% 16.7% -120 bps
TOTAL 19.1% 20.4% 20.0% +90 bps
(a) Operating income recurring / revenue as published
Operating income recurring for the Americas region reached 1,530 million euros in 2020, stable compared with 2019 (-0.4%). Excluding the energy impact, the operating margin stood at 19.4%, marking a significant increase of +120 basis points compared with 2019. The exceptional cost-cutting plan launched in response to the public health crisis was implemented rapidly and efficiently across the region, in particular at Airgas. This was in addition to the good performance of the efficiencies plan across all business lines (and more specifically in Industrial Merchant), strong price management with increases applied at the beginning of the year, as well as favorable mix effects. The combination of these effects were reflected in the marked increase in margins for the region, driven notably by the performance of Airgas.
Operating income recurring for Europe reached 1,405 million euros, a slight decrease of -1.8% compared with 2019. Excluding the energy impact, the operating margin was 19.9%, down just -10 basis points. The improvement in the Healthcare operating margin, due to volume effects, efficiencies generated and pricing impacts which were stable over the year, did not fully offset the impact of the slowdown on other businesses, and in particular on Large Industries

FY 2020 Performance - Air Liquide
PAGE 15/36
which has the highest margin level. Moreover, the load rates of Large Industries production units, which were high in 2019, were impacted by irregular and slower customer demand which generated additional costs. Industrial Merchant’s operating margin proved resilient thanks to efficiency efforts, exceptional costs reduction plan, and price management.
Operating income recurring for Asia Pacific totaled 985 million euros, an increase of +3.6%. The operating margin was 21.6% excluding the energy impact, up by a significant +180 basis points. Structural efficiency and exceptional cost containment measures made a major contribution to improving the margin. Moreover, in Electronics, the mix effect had a significant positive impact on the operating margin thanks to the excellent growth momentum of Carrier Gases and Advanced Materials sales, whereas Equipment & Installation sales were weaker. Finally, the Group’s active business portfolio management, which included the disposal of the Fujian Shenyuan units in 2019 and the reduction or disposal of the Group’s stakes in several distributors in Japan, also contributed to this improvement.
Operating income recurring for the Middle East and Africa was 95 million euros, down -12.9% compared with 2019.
Excluding the energy impact, the operating margin totaled 16.7%, down -120 basis points as a result of the major
decline in activity across the region due to the public health crisis, notably in Industrial Merchant in Africa, that cost
reduction measures could not compensate for.
Operating performance - divestitures
■ Air Liquide closed in mid-August the divestiture of its subsidiary Schülke & Mayr GmbH, a global leader in infection prevention and hygiene, to global investment firm EQT. This sale illustrates Air Liquide’s strategy to review its business portfolio regularly and to focus on its core gases and healthcare businesses, thereby enhancing Air Liquide’s performance.
■ Air Liquide announced in early August the divestment of its subsidiary CryoPDP that has more than 250 employees in 12 countries to French private equity firm Hivest Capital Partners. CryoPDP provides global innovative temperature-controlled logistics solutions to the Clinical Research and Cell & Gene Therapy Communities.
■ Air Liquide closed the divestiture of Czech Republic and Slovakia entities to Messer early-May.
Engineering & Construction
Operating income recurring for Engineering & Construction was 12.8 million euros in 2020. The operating margin
stood at 5.1%, with a marked improvement during the 2nd half of the year due to the pick-up in business and an
exceptional allowance relating to the relocation of a production site in China.
Global Markets & Technologies
Operating income recurring for Global Markets & Technologies amounted to 78 million euros with an operating
margin of 13.5% for 2020, representing a +130 basis point increase compared with 2019.
Corporate Costs and Research & Development
Corporate costs and Research & Development expenses, which increased slightly despite the public health context,
stood at 317 million euros, up +2.1% compared with 2019.
Air Liquide - FY 2020 Performance
PAGE 16/36
NET PROFIT
Other operating income and expenses showed a net balance of -140 million euros. They notably included costs
relating to the realignment plans implemented in various countries and businesses and exceptional expenses of around
65 million euros associated with the management of the Covid-19 public health crisis. They also included the capital
gain on the disposal of the Schülke subsidiary during the 2nd half of the year. Moreover, some asset impairments were
recorded on certain markets and geographies as part of the strategic review of the Group’s asset portfolio, taking into
account certain post-crisis strategic changes.
The financial result amounted to -440 million euros, due mainly to the cost of net debt which stood at -353 million
euros (representing a decrease of -2.4% compared with 2019). This cost included the impact of the early redemption
in December 2020 of bonds (“senior notes”) issued by Airgas before its acquisition by Air Liquide. The average cost of
net debt, excluding the early redemption of the Airgas senior notes, was 2.8%, lower than in 2019 due notably to the
decrease in US dollar and emerging market-denominated debt which carries a higher cost. Other financial income and
expenses amounted to -87 million euros compared with -106 million euros in 2019.
Income tax expense stood at 678 million euros, corresponding to an effective tax rate of 21.1% in 2020, a marked
exceptional decline, from 25.5% in 2019, due to the reduced tax rate on the capital gain on the disposal of Schülke.
The share of profit of associates amounted to -4 million euros. The share of minority interests in net profit reached
93 million euros, representing a slight decline of -3.3% due to the slowdown of activity at subsidiaries with minority
shareholders.
Despite the pandemic and the resulting decline in business, net profit (Group share) amounted to 2,435 million euros
in 2020, a significant increase of +8.6% as published and of +11.2% excluding the currency impact. Recurring net
profit(3) (Group share) reached 2,341 million euros, up +1.5% and +4.4% excluding the currency impact.
Net earnings per share at 5.16 euros, were up significantly (+8.5%) compared with 2019, in line with the increase in
net profit (Group share). The average number of outstanding shares used for the calculation of net earnings per share
as of December 31, 2020 was 471,603,408.
Change in the number of shares
FY 2019 FY 2020
Average number of outstanding shares 471,214,966 471,603,408
DIVIDEND
At the Annual General Meeting on May 4, 2021, the payment of a dividend of 2.75 euros per share will be proposed to
shareholders for the fiscal year 2020. The proposed dividend is up +1.9% compared with prior year, in line with the
recurring net profit growth. The total estimated pay-out taking into account share buybacks and cancellations would
amount to 1,337 million euros, representing a pay-out ratio of 55% of the published net profit. The ex-dividend date
has been set for May 17, 2021 and the payment is scheduled for May 19, 2021. In addition, the Board of Directors has
decided to allot again one free share for every 10 shares. This allotment is considered for June 2022.
3 See definition and reconciliation in Appendix.

FY 2020 Performance - Air Liquide
PAGE 17/36
2020 Cash Flow and Balance Sheet
(in millions of euros) 2019 2020
Cash flow from operating activities before changes in net working capital 4,859 4,932
Changes in working capital (37) 364
Other cash items (111) (91)
Net cash flows from operating activities 4,712 5,206
Dividends (1,237) (1,387)
Purchase of property, plant and equipment and intangible assets, net of disposals(a) (2,616) (1,971)
Proceeds from issues of share capital 39 44
Purchase of treasury shares (148) (50)
Lease liabilities repayments and net interests paid on lease liabilities (287) (282)
Impact of exchange rate changes and net indebtedness of newly consolidated
companies & restatement of net finance costs (302) 203
Change in net debt 162 1,764
Net debt as of December 31 (12,373) (10,609)
Debt-to-equity ratio as of December 31 64.0% 55.8%
(a) Including transactions with minority shareholders
NET CASH FLOW FROM OPERATING ACTIVITIES AND CHANGES IN
WORKING CAPITAL REQUIREMENT
Cash flow from operating activities before changes in net working capital totaled 4,932 million euros, representing
an increase of +1.5% despite a slowdown in activity due to the public health crisis, and once again underlining the
resilience of the business model. This corresponds to a record high of 24.1% of sales, a marked improvement of
+190 basis points compared with 2019.
Working capital requirement (WCR) decreased significantly, by 364 million euros compared with December 31, 2019.
This was due to the slowdown in activity relating to the public health crisis, active inventory control (in particular for
hardgoods), specific attention to debt recovery, and the grace period introduced by the US authorities during the
pandemic for the payment of payroll taxes. The WCR excluding taxes to sales ratio improved to 2.3% from 4.4% in
2019.
Net cash flows from operating activities after changes in working capital requirement, amounted to 5,206 million
euros, i.e., a marked increase of +10.5% compared with the end of 2019.
CAPITAL EXPENDITURE
(in millions of euros)
Industrial Investments
Financial Investments (a)
Total capital expenditures (a)
2016 2,259 12,180 14,439
2017 2,183 144 2,327
2018 2,249 131 2,380
2019 2,636 568 3,205
2020 2,630 145 2,775
(a)Including transactions with minority shareholders.

Air Liquide - FY 2020 Performance
PAGE 18/36
Gross capital expenditure totaled 2,775 million euros in 2020, including transactions with minority shareholders.
Gross industrial capital expenditure reached 2,630 million euros and was stable overall compared with 2019. This
represented 12.8% of sales, reflecting strong project developments despite the public health crisis. For Gas & Services,
this expenditure totaled 2,416 million euros and its breakdown by region is presented in the table below.
Gas & Services
(in millions of euros) Europe Americas Asia Pacific Middle East
and Africa Total
2019 815 946 588 62 2,411
2020 873 914 577 53 2,416
Financial investments totaled 129 million euros and compared with the high amount of 537 million euros in 2019
which included, in particular, the acquisition of Tech Air in the United States. A total of 23 acquisitions were completed
in 2020.
Proceeds from sale of assets were exceptionally high in 2020 at 800 million euros and underlined the Group’s
commitment to maintaining its active business portfolio management. These notably included the disposal of the
Schülke and CryoPDP subsidiaries, as well as the disposal of businesses in Slovakia and the Czech Republic.
Net capital expenditure(4) amounted to 1,971 million euros.
Over the past 3 years, 60% of the 14 billion euros cumulative cash flow were reinvested in the Group's activities, mainly
through industrial investments but also acquisitions. Shareholder remuneration represented 30% of 2018-2020 cash
flow use, and the remaining was allocated notably to manage working capital requirement or reduce net debt.
NET DEBT
Net debt at December 31, 2020 reached 10,609 million euros. Despite the high level of investment, net debt was down
significantly by 1,764 million euros compared with December 31, 2019 due to the increase in the Group’s cash flow
from operating activities, the decrease in working capital requirement, a favorable currency impact, and the disposal
of Schülke. The net debt-to-equity ratio stood at 55.8%, a marked decrease compared with the end of 2019 (64.0%)
and a return to pre-Airgas acquisition levels.
ROCE
The return on capital employed after tax (ROCE) was 9.0% in 2020. Recurring ROCE(5) stood at 8.6%, stable compared
with 2019 despite the decline in business due to the public health crisis.
4 Including transactions with minority shareholders. 5 See reconciliation in Appendix

FY 2020 Performance - Air Liquide
PAGE 19/36
Environment and Society
SAFETY
Employees lost time accident frequency rate(6) improved and reached 0.9 at the end of 2020 compared to 1.2 in 2019.
This represents the lowest lost time accident frequency rate of the last 20 years.
CLIMATE
Air Liquide announced its Climate objectives on November 30, 2018, including in particular the reduction of its carbon
intensity by 30% between 2015 and 2025. As part of its global approach to climate, the Group not only seeks to reduce
the carbon intensity of its assets, but also to act with its customers towards a sustainable industry and to contribute
to the development of a low-carbon society.
In 2020, the Group’s carbon intensity(7) improved to 4.4 kg of CO2 equivalent per euro of EBITDA, at the level of the
initial objective planned for 2025, representing a 30% decrease over the past 5 years.
On March 23, 2021, the group hosts a “Sustainability Day” during which it will present its new climate, social, and
societal objectives as well as its ambition on new hydrogen markets.
HUMAN RESOURCES
As part of its NEOS program, the Group has set objectives that promote age and gender diversity among its employees.
With this in mind, the Group targets to hire 33% of young graduates among managers and professionals by 2025. In
2020, Air Liquide reported 30% of women among managers and professionals compared to 29% in 2019, and aims to
reach 35% by 2025.
Environment and Society
■ Air Liquide signed a long-term power purchase agreement (PPA) to source renewable electricity equivalent to 15% of the Group's current consumption for its activities in Spain. This contract is the first PPA for renewable energy in Europe and illustrates Air Liquide's commitment to lower its carbon footprint, in line with the Group’s Climate Objectives to increase purchase of renewable electricity by nearly 70% by 2025 (in comparison with 2015).
6 Number of lost-time accidents with at least one lost day per million hours worked by Group employees 7 See reconciliation in appendix

Air Liquide - FY 2020 Performance
PAGE 20/36
INVESTMENT CYCLE AND FINANCING
Investments
INVESTMENT DECISIONS AND INVESTMENT BACKLOG
(in billions of euros)
Industrial investment decisions
Financial investment decisions (acquisitions)
Total investment decisions
2016 2.0 12.2 14.2
2017 2.4 0.2 2.6
2018 3.0 0.2 3.1
2019 3.2 0.6 3.7
2020 3.0 0.1 3.2
In 2020, industrial and financial investment decisions reached an exceptionally high level of 3,170 million euros,
despite the public health crisis. This comes after the record high of 3.7 billion euros in 2019, which included the
acquisition of Tech Air in the United States for more than 300 million euros. Decisions for 2020 did not include the
acquisition of the 16 Air Separation Units from Sasol in South Africa, as the deal has not yet been officially closed.
Industrial investment decisions were higher than 3.0 billion euros for the second year in a row despite the challenging
public health context. Electronics achieved a record level of investment, in particular thanks to the signing of new units
for Advanced Materials in Singapore and for Carrier Gases in Taiwan, as well as decisions made during the 4th quarter
in Japan and China. Business development was also strong in Large Industries with the signature of the takeover of
sites in Kazakhstan and Russia, as well as new Air Separation Units in Russia, Poland and, during the 4 th quarter,
Germany. Investment decisions relating to the production of biogas for Global Markets & Technologies were also
high, in particular in Italy and the United States. More than 20% of industrial decisions contribute to the Climate
objectives and 13% support margin improvement (efficiencies).
Financial investment decisions reached 148 million euros in 2020 for more than twenty bolt-on acquisitions, in
particular in Home Healthcare in Europe, Industrial Merchant in North America and China, and in Engineering &
Construction in the United States. This compares with a high level of 580 million euros in 2019 which included the
acquisition of Tech Air in the United States.
The investment backlog reached 3.1 billion euros representing an increase of almost 300 million euros compared
with the end of 2019. Large Industries projects for Chemicals customers represented the highest share of the backlog,
the share of Electronics projects was at a record high, and the Oil and Gas market only represented around 10% of the
total backlog. These investments should lead to a future contribution to annual sales of approximately 1.0 billion euros
per year after the full ramp-up of the units, an increase compared to 0.9 billion euros at the end of 2019.
START-UPS
There were 20 major start-ups during 2020. These notably included several Electronics units in Asia and new
hydrogen production units for Large Industries, including one to supply the pipeline network of a major industrial basin
in South Korea and another one to meet growing refining needs in Argentina. These also included biomethane
production units in the United States and United Kingdom for Global Markets & Technologies and a nitrous oxide
production unit for Industrial Merchant and Healthcare needs in the United States. In the 4th quarter, the Group has
also started up the world’s largest PEM (Proton Exchange Membrane) electrolyzer (20 megawatts), producing
renewable hydrogen in Bécancour, Canada.

FY 2020 Performance - Air Liquide
PAGE 21/36
The additional contribution to sales of unit start-ups and ramp-ups totaled 191 million euros in 2020 despite the
public health crisis, which was 11 million euros more than forecast in the 3rd quarter.
The additional contribution to 2021 sales of unit start-ups and ramp-ups should reach around 250 million euros, with
an additional contribution from the 16 units that are currently being acquired in South Africa representing an estimated
amount of around 100 million euros for 2021, as Air Liquide will not initially be responsible for managing the energy.
Sales should exceed 400 million euros per year during the second phase, when energy management will be fully
integrated, without any significant impact on operating income.
Investment
■ Air Liquide has now entered into a business purchase agreement with Sasol for Air Liquide to acquire the largest oxygen production site in the world located in Secunda, South Africa. In addition to the benefits this would bring in terms of safety, reliability and efficiency, the solution provided by Air Liquide would allow, in coordination with Sasol, a targeted reduction of 30% to 40% in CO2 emissions arising from the oxygen production by 2030. The amount of the initial investment would be approximately 8.5 billion South African Rand (circa 440 million euros).
INVESTMENT OPPORTUNITIES
The 12-month portfolio of investment opportunities stood at 3.1 billion euros at the end of December, with several
new entries during the 4th quarter offsetting investment decisions and the removal from the portfolio of several projects
that were either postponed beyond 12 months or awarded to the competition.
The type of opportunities has changed significantly and the energy transition represents 44% of the portfolio, notably
with low-carbon hydrogen production projects through electrolysis, as well as the capture and storage of carbon
dioxide (“CCS”) in Large Industries. These projects may, however, be subject to accessing subsidies. The share of
Electronics projects is also up significantly compared with 2019.
Europe, where the majority of energy transition projects are based, has therefore become the leading region in the
portfolio and has reached a record level with close to 40% of opportunities. This region is followed closely by Asia
which represents more than one-third of the portfolio, driven by Electronics projects, followed by the Americas and the
Middle East and Africa which have similar levels of opportunities.
2020 Financing
“A” CATEGORY FINANCIAL RATING CONFIRMED
Air Liquide is rated by two main rating agencies, Standard & Poor’s and Moody’s. The long-term rating from Standard
& Poor’s is “A-” and from Moody’s is “A3”. These are in line with the Group’s strategy. Moreover, the short-term ratings
are “A2” for Standard & Poor’s and “P2” for Moody’s. Standard & Poor’s confirmed its ratings on July 24, 2020 and
maintained its positive outlook. Moody’s confirmed its ratings on July 7, 2020 and maintained its stable outlook.
DIVERSIFYING AND SECURING FINANCIAL SOURCES
As of December 31, 2020, Group financing through capital markets accounted for 93% of the Group’s total debt, for a
total amount of outstanding bonds of 11.3 billion euros including all types of bonds, and 0.2 billion euros of
commercial paper.
Air Liquide - FY 2020 Performance
PAGE 22/36
The total amount of credit facilities was stable at 3.6 billion euros. The second one-year extension option was applied
to this syndicated credit facility on November 6, 2020. The extension covers an unchanged amount of 2.5 billion euros
and now matures in December 2025. Since 2019, this facility includes an indexation mechanism between its financial
costs and three of the Group’s CSR targets in the areas of carbon intensity, gender diversity, and safety.
The amount of total debt maturing in the next 12 months is 2.2 billion euros, an increase of 0.4 billion euros compared
with December 31, 2019.
2020 ISSUES AND REDEMPTIONS
In March 2020, the Group issued a five-year private placement for an amount of 100 million euros.
In March 2020, under its EMTN program, the Group issued a public bond in two tranches of 500 million euros each,
maturing in five and ten years.
Financing
■ On March 26, 2020, Air Liquide successfully launched a €1 billion long term bond issuance. Proceeds from this issuance allowed the Group to refinance its June 2020 bond maturities in advance and will secure financing to support long term profitable growth. This issue will be rated « A- » by Standard & Poor’s and « A3 » by Moody’s.
In June 2020, two bond issues for a total amount of 500 million euros each were redeemed.
In December 2020, the last two bond issues held by Airgas, for 250 and 300 million US dollars (for a total equivalent of
448 million euros), were redeemed early. As of December 31, 2020, Airgas no longer held any bond debt.
At the end of 2020, outstanding bonds issued under the EMTN program amounted to 6.9 billion euros (nominal
amount).
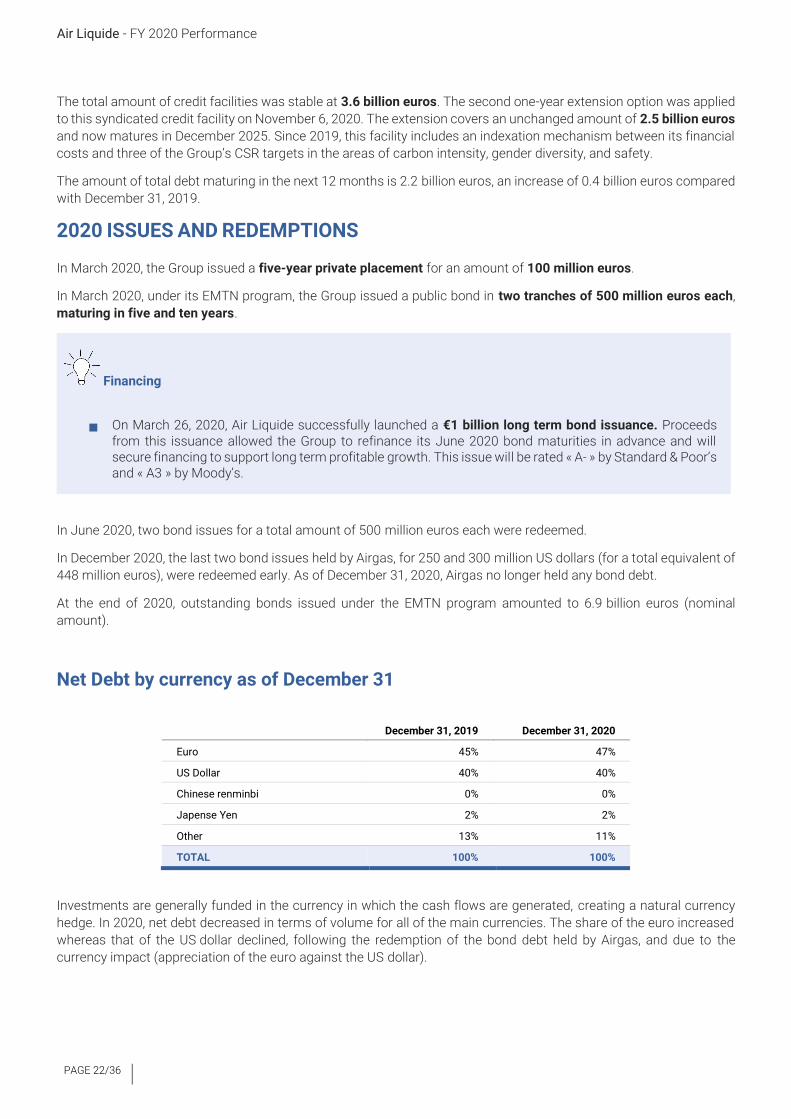
Net Debt by currency as of December 31
December 31, 2019 December 31, 2020
Euro 45% 47%
US Dollar 40% 40%
Chinese renminbi 0% 0%
Japense Yen 2% 2%
Other 13% 11%
TOTAL 100% 100%
Investments are generally funded in the currency in which the cash flows are generated, creating a natural currency
hedge. In 2020, net debt decreased in terms of volume for all of the main currencies. The share of the euro increased
whereas that of the US dollar declined, following the redemption of the bond debt held by Airgas, and due to the
currency impact (appreciation of the euro against the US dollar).

FY 2020 Performance - Air Liquide
PAGE 23/36
CENTRALIZATION OF CASH AND FUNDING
Air Liquide Finance pools the cash balances of Group entities.
At December 31, 2020, Air Liquide Finance had granted to Group subsidiaries, directly or indirectly, the equivalent of
13.3 billion euros in loans and received 3.3 billion euros in excess cash as deposits from them. These transactions
were denominated in 29 currencies (primarily the euro, US dollar, Japanese yen, Chinese renminbi and Singapore
dollar). Approximately 400 subsidiaries are included in the Group cash pooling, directly or indirectly (including
subsidiaries where cash pooling is carried out locally before being centralized at Air Liquide Finance).
DEBT MATURITY AND SCHEDULE
The average of the Group’s debt maturity was 5.8 years at December 31, 2020, a decrease compared to December 31,
2019. Thanks to the generation of net cash flow in 2020, bond issues reached maturity or were redeemed early in 2020
without the need for refinancing.
The following chart shows the Group’s debt maturity schedule. The single largest annual maturity represents
approximately 11% of total debt.

Air Liquide - FY 2020 Performance
PAGE 24/36
CLOSURE OF THE NEOS PROGRAM Due to the public health crisis and the unprecedented economic environment in 2020 which has had a major impact
on sales growth as well as on costs and investment management, the Group believes that including 2020 results in
the assessment of its medium-term performance is not relevant.
As a result, the achievement of the financial objectives set out in the NEOS program initially planned to cover the
2016–2020 period was terminated early at the end of 2019, except for the ROCE target which had been set for a
longer period of time. Over 2016–2019, all of the objectives were achieved.
The compound average annual growth rate (CAGR) of revenue(8) over the 2016–2019 period was +6.5% and +7.8%
excluding the currency impact, of which +2% was related to the Airgas acquisition. This was in line with the target of
+6% to +8% between 2016 and 2020 including the Airgas impact.
The initial target of 300 million US dollars in cumulated synergies relating to the Airgas acquisition was reached during
the first quarter of 2019, one year before the initial date. Furthermore, in 2019, the Group raised its initial target of
300 million euros in efficiencies to 400 million euros. More than 1.1 billion euros in cumulated efficiencies were
therefore achieved over 2017–2019, largely exceeding the initial target.
Air Liquide maintained its “A” rating for the entire period. The net debt-to-equity ratio, which was initially above 150%
following the Airgas acquisition, stood at 64.0% at the end of 2019. This sharp reduction in debt was recognized by the
Standard & Poors rating agency which published a positive outlook on the Group.
Moreover, the Group also maintained its level of investment at between 10% and 12% of sales during the period, in
line with guidance.
The Group had set a ROCE target of more than 10% for 2021–2022, but the Covid-19 pandemic is very likely to have
an impact of more than one year on net profit growth. Furthermore, in preparation for future growth, Air Liquide has
decided to step up its investments despite the public health crisis, in particular those related to the energy transition.
The Group therefore maintains its ROCE target of more than 10% and has rescheduled its achievement to 2023 or
2024, depending on when the Covid-19 crisis will end.
A new five-year company program should be announced during the first quarter of 2022 and will cover the
2021–2025 period, using 2021 as its reference year.
8 See reconciliation in Appendix

FY 2020 Performance - Air Liquide
PAGE 25/36
2020 OUTLOOK The Group was fully mobilized to serve its customers and patients in 2020, which was an out of the ordinary year,
whilst being resolutely committed to the fight against covid-19.
The Group‘s performance was outstanding in this environment: sales resilience, significant margin improvement,
net profit growth and investment decisions continued at a very high level. This performance illustrates the solidity
of our business model. It also perfectly positions the Group for future growth and enables it to already benefit from
the acceleration seen in healthcare, energy transition, and the increasing presence of technologies, in particular
digital, in all sectors.
Over the full year, 2020 sales were practically stable on a comparable basis, with business back to growth in the
fourth quarter. The Gas & Services sales, which account for 96% of Group revenue, held up well, as did Global Markets
& Technologies which retained their momentum. On a comparable basis, business was supported by strong sales
growth in Healthcare and Electronics. Geographically, the situation was extremely varied with Europe faring well,
driven by demand in Healthcare, and a solid performance from the developing economies, particularly China, and
Eastern European and Latin American countries.
The Group’s operating margin improvement plan, combined with exceptional cost containment measures relating
to the situation in 2020, resulted in a marked improvement in the margin of +80 bps excluding energy impact. The
structural efficiencies stood at 441 million euros. Operating cash flows were high and the debt-to-equity ratio was
reduced significantly. The Group’s balance sheet confirms its strength.
The Group has achieved, as of 2019, the sales and efficiencies objectives of its NEOS 2020 company program. As
for the ROCE of 10%+, it is maintained, with achievement by 2023-2024 to take into account the impact of the
covid-19 crisis as well as the pro-active investment policy in the current favorable context. In 2020, investment
decisions thus stood at the extremely high level of 3.2 billion euros, indicative of future growth.
In an environment marked by global recovery plans and commitment to energy transition, the Group still has numerous
investment opportunities of which 44% are projects related to the fight against climate change, including the
development of Hydrogen Energy.
In 2021, in a context of limited local lockdowns in the first half of the year and recovery in the second half,
Air Liquide is confident in its ability to further increase its operating margin and to deliver recurring net profit (1)
growth, at constant exchange rates.
(1) Recurring net profit: Excluding exceptional and significant items that have no impact on the operating income recurring.
Excluding the impact of any US tax reform in 2021.

Air Liquide - FY 2020 Performance
PAGE 26/36
APPENDICES
Performance indicators
Performance indicators used by the Group that are not directly defined in the financial statements have been prepared
in accordance with the AMF position 2015-12 about alternative performance measures.
The performance indicators are the following:
● Group revenues Compound Annual Growth Rate (CAGR) 2016-2019
● Currency, energy and significant scope impacts
● Comparable sales change and comparable operating income recurring change
● Operating margin and operating margin excluding energy
● Operating income recurring before depreciation and amortization excluding IFRS16 at 2015 exchange rate
● Recurring net profit Group share
● Recurring net profit excluding currency effect
● Net Profit Excluding IFRS16
● Net Profit Recurring Excluding IFRS16
● Efficiencies
● Return on Capital Employed (ROCE)
● Recurring ROCE
DEFINITION OF CURRENCY, ENERGY AND SIGNIFICANT SCOPE IMPACTS
Since industrial and medical gases are rarely exported, the impact of currency fluctuations on activity levels and results is limited to euro translation impacts with respect to the financial statements of subsidiaries located outside the euro zone. The currency effect is calculated based on the aggregates for the period converted at the exchange rate for the previous period.
In addition, the Group passes on variations in the cost of energy (electricity and natural gas) to its customers via indexed invoicing integrated into their medium and long-term contracts. This indexing can lead to significant variations in sales (mainly in the Large Industries Business Line) from one period to another depending on fluctuations in prices on the energy market.
An energy impact is calculated based on the sales of each of the main subsidiaries in Large Industries. Their consolidation allows the determination of the energy impact for the Group as a whole. The foreign exchange rate used is the average annual exchange rate for the year N-1. Thus, at the subsidiary level, the following formula provides the energy impact, calculated for natural gas and electricity respectively:
Energy impact = Share of sales indexed to energy year (N-1) x (Average energy price in year (N) - Average energy price in year (N-1)) This indexation effect of electricity and natural gas does not impact the operating income recurring.
The significant scope effect corresponds to the impact on sales of all acquisitions or disposals of a significant size for the Group. These changes in scope of consolidation are determined:
● for acquisitions during the period, by deducting from the aggregates for the period the contribution of the acquisition,
● for acquisitions during the previous period, by deducting from the aggregates for the period the contribution of the acquisition between January 1 of the current period and the anniversary date of the acquisition,
● for disposals during the period, by deducting from the aggregates for the previous period the contribution of the disposed entity as of the anniversary date of the disposal,
● for disposals during the previous period, by deducting from the aggregates for the previous period the contribution of the disposed entity.

FY 2020 Performance - Air Liquide
PAGE 27/36
GROUP REVENUES COMPOUND ANNUAL GROWTH RATE (CAGR) 2016-2019
(in millions of euros) 2016 2019 CAGR
(A) Group revenues 18,135 21,920 +6.5%
(B) Currency impact (2016) (787)
(A) - (B) = Group revenues excluding currency impact (2016) 18,135 22,707 +7.8%
Calculation of performance indicators (Year)
COMPARABLE SALES CHANGE AND COMPARABLE OPERATING INCOME
RECURRING CHANGE
Comparable changes for sales and operating income recurring exclude the currency, energy and significant scope
impacts described above. For 2020, the calculations are the following:
(in millions of euros)
FY 2020
FY 2020/2019 Published
Growth Currency
impact Natural gas
impact Electricity
impact
Significant scope
impact
FY 2020/2019 Comparable
Growth
Revenue
Group 20,485 -6.5% (442) (318) (87) (303) -1.3%
Impacts in % -2.0% -1.4% -0.4% -1.4%
Gas & Services 19,656 -6.6% (434) (318) (87) (303) -1.2%
Impacts in % -2.1% -1.5% -0.4% -1.4%
Operating Income Recurring
Group 3,790 -0.1% (98) - - (40) +3.6%
Impacts in % -2.6% - - -1.1%
Gas & Services 4,016 -0.3 % (97) - - (40) +3.1%
Impacts in % -2.4% - - -1.0%
OPERATING MARGIN AND OPERATING MARGIN EXCLUDING ENERGY
The operating margin is the ratio of the operating income recurring divided by revenue. The operating margin excluding
energy corresponds to the operating income recurring, not affected by the indexation effect of electricity and natural
gas, divided by revenue excluding the energy impact.
FY 2020 Natural gas
impact
Electricity
impact
FY 2020,
excluding energy
impact
Revenue Group 20,485 (314) (88) 20,887
Gas & Services 19,656 (314) (88) 20,058
Operating Income Recurring Group 3,790 - - 3,790
Gas & Services 4,016 - - 4,016
Operating Margin Group 18.5% 18.1%
Gas & Services 20.4% 20.0%

Air Liquide - FY 2020 Performance
PAGE 28/36
OPERATING INCOME RECURRING BEFORE DEPRECIATION AND
AMORTIZATION EXCLUDING IFRS16 AT 2015 EXCHANGE RATE
2015 2020 2015/2020 change
(A) Operating income recurring before depreciation and amortization 4,033 5,928
(B) Currency impact (2015) (667)
(C) IFRS16 Impact(1) 279
(A) - (B) - (C) = (D) EBITDA used for Carbon Intensity calculation 4,033 6,315
(E) CO2 equivalent emissions (Scopes 1 + 2) in thousands of tonnes 25,268 27,496
Carbon Intensity (D) / (E) 6.3 4.4 -30% (1)The IFRS16 impact on operating income recurring before depreciation and amortization includes the neutralisation of rental expenses, which are then reintegrated
into depreciation and amortisation and other financial expenses booked in relation to IFRS16.
RECURRING NET PROFIT GROUP SHARE AND RECURRING NET PROFIT
GROUP SHARE EXCLUDING CURRENCY IMPACT
The recurring net profit Group share corresponds to the net profit Group share excluding exceptional and significant
transactions that have no impact on the operating income recurring.
FY 2019 FY 2020 2020/2019 Change
(A) Net Profit (Group Share) - As Published 2,241.5 2,435.1 +8.6%
(B) Exceptional and significant transactions after-tax with no impact on OIR
- After-tax loss on the Fujian Shenyuan divestment (65.9)
- Exceptional expenses linked to the management of the Covid-19 pandemic (48.6)
- Strategic review of asset portfolio (300.3)
- Capital gain on Schülke divestiture 473.2
- Early reimbursement cost of Airgas senior notes (30.3)
(A) - (B) = Net Profit Recurring (Group Share) 2,307.4 2,341.1 +1.5%
(C) Currency impact (66.8)
(A) - (B) - (C) = Net Profit Recurring (Group Share) excluding currency impact 2,407.9 +4.4%

FY 2020 Performance - Air Liquide
PAGE 29/36
NET PROFIT EXCLUDING IFRS16 AND NET PROFIT RECURRING EXCLUDING
IFRS16
FY 2019 FY 2020
(A) Net Profit as Published 2,337.6 2,528.0
(B) = IFRS16 Impact(1) (14.4) (13.2)
(A) - (B) = Net Profit excluding IFRS16 2,352 2,541.2
(1)The IFRS16 impact includes the reintegration of leasing expenses less depreciation and other financial expenses booked in relation to IFRS16
FY 2019 FY 2020
(A) Net Profit as Published 2,337.6 2,528.0
(B) Exceptional and significant transactions after-tax with no impact on OIR (65.9) 94.0
(A) - (B) = Net Profit recurring 2,403.5 2,434.0
(C) IFRS16 Impact(1) (14.4) (13.2)
(A) - (B) - (C) = Net Profit recurring excluding IFRS16 2,417.9 2,447.2
(1)The IFRS16 impact includes the reintegration of leasing expenses less depreciation and other financial expenses booked in relation to IFRS16
EFFICIENCIES
Efficiencies represent a sustainable cost reduction resulting from an action plan on a specific project. Efficiencies are
identified and managed on a per project basis. Each project is followed by a team composed in alignment with the
nature of the project (purchasing, operations, human resources...).
RETURN ON CAPITAL EMPLOYED - ROCE
Return on capital employed after tax is calculated based on the Group’s consolidated financial statements, by applying
the following ratio for the period in question.
For the numerator: net profit excluding IFRS16 - net finance costs after taxes for the period in question.
For the denominator: the average of (total shareholders' equity excluding IFRS16 + net debt) at the end of the past
three half-years.
FY 2019 H1 2020 FY 2020 ROCE Calculation (in millions of euros) (a) (b) (c)
Numerator (c)
Net Profit Excluding IFRS16 2,541.2 2,541.2
Net Finance costs (352.8)
Effective Tax Rate (1) 26.5%
Net Finance costs after tax (259.3) (259.3)
Net Profit - Net financial costs after tax 2,800.5 2,800.5
Denominator ((a)+(b)+(c))/3
Total Equity Excluding IFRS16 19,338.8 18,777.5 19,032.2 19,049.5
Net Debt 12,373.3 13,175.7 10,609.3 12,052.8
Average of (total equity + net debt) 31,712.1 31,953.2 29,641.5 31,102.3
ROCE 9.0%
(1) excluding non-recurring tax impact

Air Liquide - FY 2020 Performance
PAGE 30/36
RECURRING ROCE
The recurring ROCE is calculated in the same manner as the ROCE using the recurring net profit excluding IFRS16 for
the numerator.
FY 2019 H1 2020 FY 2020 Recurring
ROCE Calculation (in millions of euros) (a) (b) (c)
Numerator (c)
Net Profit Recurring Excluding IFRS16 2,447.2 2,447.2
Net Finance costs (352.8)
Effective Tax Rate(1) 26.5%
Net Finance costs after tax (259.3)
Neutralizing Airgas "senior notes" from Net Finance Costs after tax(2) (30.3)
Net Finance costs after tax excluding Airgas senior notes(2) (229.0) (229.0)
Recurring Net Profit Excluding IFRS16
- Net financial costs after tax excluding Airgas senior notes(2) 2,676.2 2,676.2
Denominator ((a)+(b)+(c))/3
Total Equity Excluding IFRS16 19,338.8 18,777.5 19,032.2 19,049.5
Net Debt 12,373.3 13,175.7 10,609.3 12,052.8
Average of (total equity + net debt) 31,712.1 31,953.2 29,641.5 31,102.3
Recurring ROCE 8.6%
(1) excluding non-recurring tax impact
(2) The impact of the reimbursement of Airgas senior notes is removed from Net Finance costs after tax as it is already excluded in the calculation of Net Profit
Recurring in numerator
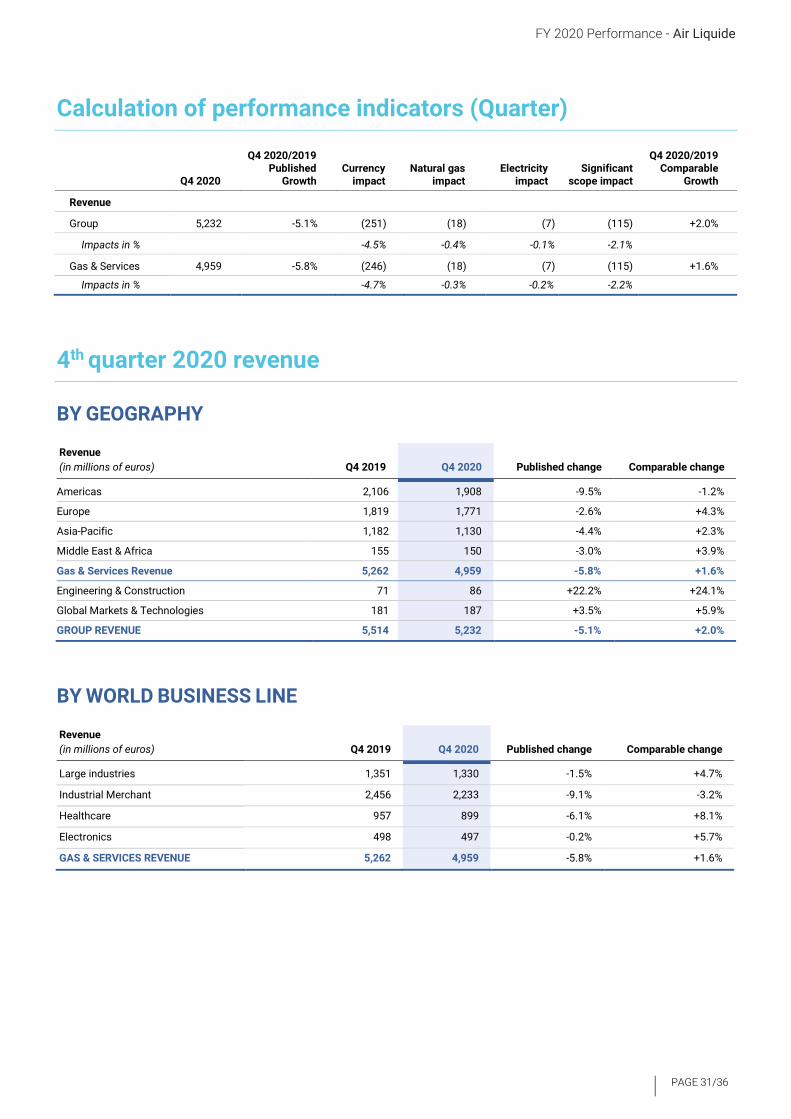
FY 2020 Performance - Air Liquide
PAGE 31/36
Calculation of performance indicators (Quarter)
Q4 2020
Q4 2020/2019 Published
Growth Currency
impact Natural gas
impact Electricity
impact Significant
scope impact
Q4 2020/2019 Comparable
Growth
Revenue
Group 5,232 -5.1% (251) (18) (7) (115) +2.0%
Impacts in % -4.5% -0.4% -0.1% -2.1%
Gas & Services 4,959 -5.8% (246) (18) (7) (115) +1.6%
Impacts in % -4.7% -0.3% -0.2% -2.2%
4th quarter 2020 revenue
BY GEOGRAPHY
Revenue
(in millions of euros) Q4 2019 Q4 2020 Published change Comparable change
Americas 2,106 1,908 -9.5% -1.2%
Europe 1,819 1,771 -2.6% +4.3%
Asia-Pacific 1,182 1,130 -4.4% +2.3%
Middle East & Africa 155 150 -3.0% +3.9%
Gas & Services Revenue 5,262 4,959 -5.8% +1.6%
Engineering & Construction 71 86 +22.2% +24.1%
Global Markets & Technologies 181 187 +3.5% +5.9%
GROUP REVENUE 5,514 5,232 -5.1% +2.0%
BY WORLD BUSINESS LINE
Revenue
(in millions of euros) Q4 2019 Q4 2020 Published change Comparable change
Large industries 1,351 1,330 -1.5% +4.7%
Industrial Merchant 2,456 2,233 -9.1% -3.2%
Healthcare 957 899 -6.1% +8.1%
Electronics 498 497 -0.2% +5.7%
GAS & SERVICES REVENUE 5,262 4,959 -5.8% +1.6%

Air Liquide - FY 2020 Performance
PAGE 32/36
Geographic and segment information
FY 2019 FY 2020
(in millions of euros and %) Revenue
Operating
income
recurring OIR margin Revenue
Operating
income
recurring OIR margin
Americas 8,460 1,537 18.2% 7,799 1,530 19.6%
Europe 7,172 1,431 20.0% 6,826 1,405 20.6%
Asia-Pacific 4,794 951 19.8% 4,467 985 22.0%
Middle East and Africa 614 110 17.9% 564 95 16.9%
Gas & Services 21,040 4,028 19.1% 19,656 4,016 20.4%
Engineering and Construction 328 9 2.7% 250 13 5.1%
Global Markets & Technologies 552 67 12.2% 579 78 13.5%
Reconciliation - (311) - - (317) -
TOTAL GROUP 21,920 3,794 17.3% 20,485 3,790 18.5%
Consolidated income statement
(in millions of euros) 31 December
2019 31 December
2020
Revenue 21,920.1 20,485.2
Other income 200.9 216.1
Purchases (8,153.9) (7,197.7)
Personnel expenses (4,410.9) (4,239.8)
Other expenses (3,624.7) (3,336.3)
Operating income recurring before depreciation and amortization 5,931.5 5,927.5
Depreciation and amortization expenses (2,137.7) (2,137.9)
Operating income recurring 3,793.8 3,789.6
Other non-recurring operating income 1.5 481.2
Other non-recurring operating expenses (189.0) (620.7)
Operating income 3,606.3 3,650.1
Net finance costs (361.6) (352.8)
Other financial income 8.4 6.9
Other financial expenses (114.5) (94.0)
Income taxes (801.7) (678.2)
Share of profit of associates 0.7 (4.0)
PROFIT FOR THE PERIOD 2,337.6 2,528.0
- Minority interests 96.1 92.9
- Net profit (Group share) 2,241.5 2,435.1
Basic earnings per share (in euros) 4.76 5.16
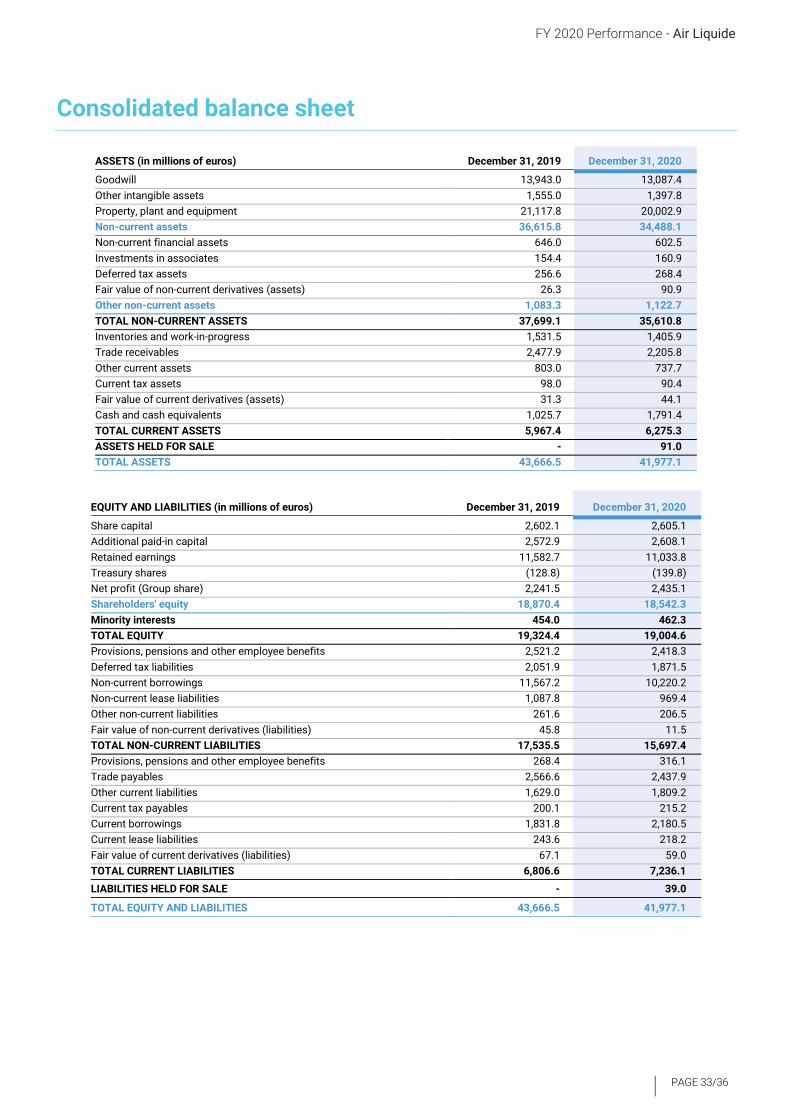
FY 2020 Performance - Air Liquide
PAGE 33/36
Consolidated balance sheet
ASSETS (in millions of euros) December 31, 2019 December 31, 2020
Goodwill 13,943.0 13,087.4
Other intangible assets 1,555.0 1,397.8
Property, plant and equipment 21,117.8 20,002.9
Non-current assets 36,615.8 34,488.1
Non-current financial assets 646.0 602.5
Investments in associates 154.4 160.9
Deferred tax assets 256.6 268.4
Fair value of non-current derivatives (assets) 26.3 90.9
Other non-current assets 1,083.3 1,122.7
TOTAL NON-CURRENT ASSETS 37,699.1 35,610.8
Inventories and work-in-progress 1,531.5 1,405.9
Trade receivables 2,477.9 2,205.8
Other current assets 803.0 737.7
Current tax assets 98.0 90.4
Fair value of current derivatives (assets) 31.3 44.1
Cash and cash equivalents 1,025.7 1,791.4
TOTAL CURRENT ASSETS 5,967.4 6,275.3
ASSETS HELD FOR SALE - 91.0
TOTAL ASSETS 43,666.5 41,977.1
EQUITY AND LIABILITIES (in millions of euros) December 31, 2019 December 31, 2020
Share capital 2,602.1 2,605.1
Additional paid-in capital 2,572.9 2,608.1
Retained earnings 11,582.7 11,033.8
Treasury shares (128.8) (139.8)
Net profit (Group share) 2,241.5 2,435.1
Shareholders' equity 18,870.4 18,542.3
Minority interests 454.0 462.3
TOTAL EQUITY 19,324.4 19,004.6
Provisions, pensions and other employee benefits 2,521.2 2,418.3
Deferred tax liabilities 2,051.9 1,871.5
Non-current borrowings 11,567.2 10,220.2
Non-current lease liabilities 1,087.8 969.4
Other non-current liabilities 261.6 206.5
Fair value of non-current derivatives (liabilities) 45.8 11.5
TOTAL NON-CURRENT LIABILITIES 17,535.5 15,697.4
Provisions, pensions and other employee benefits 268.4 316.1
Trade payables 2,566.6 2,437.9
Other current liabilities 1,629.0 1,809.2
Current tax payables 200.1 215.2
Current borrowings 1,831.8 2,180.5
Current lease liabilities 243.6 218.2
Fair value of current derivatives (liabilities) 67.1 59.0
TOTAL CURRENT LIABILITIES 6,806.6 7,236.1
LIABILITIES HELD FOR SALE - 39.0
TOTAL EQUITY AND LIABILITIES 43,666.5 41,977.1
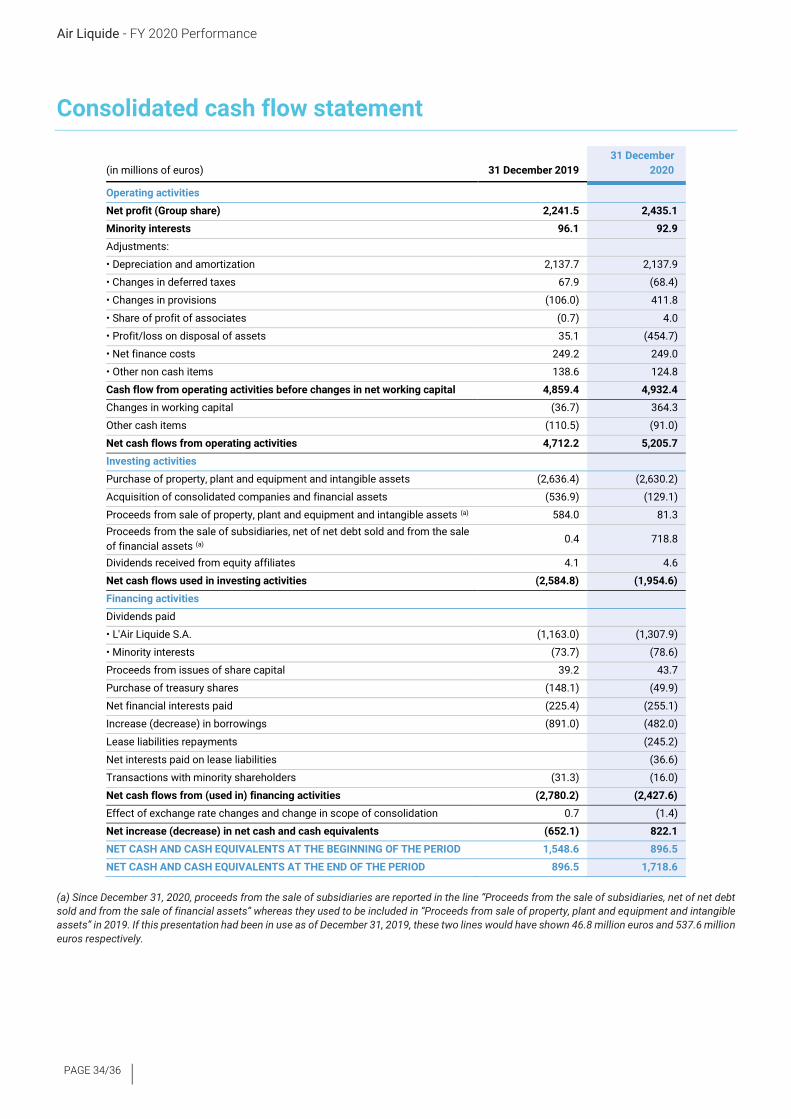
Air Liquide - FY 2020 Performance
PAGE 34/36
Consolidated cash flow statement
(in millions of euros) 31 December 2019
31 December
2020
Operating activities
Net profit (Group share) 2,241.5 2,435.1
Minority interests 96.1 92.9
Adjustments:
• Depreciation and amortization 2,137.7 2,137.9
• Changes in deferred taxes 67.9 (68.4)
• Changes in provisions (106.0) 411.8
• Share of profit of associates (0.7) 4.0
• Profit/loss on disposal of assets 35.1 (454.7)
• Net finance costs 249.2 249.0
• Other non cash items 138.6 124.8
Cash flow from operating activities before changes in net working capital 4,859.4 4,932.4
Changes in working capital (36.7) 364.3
Other cash items (110.5) (91.0)
Net cash flows from operating activities 4,712.2 5,205.7
Investing activities
Purchase of property, plant and equipment and intangible assets (2,636.4) (2,630.2)
Acquisition of consolidated companies and financial assets (536.9) (129.1)
Proceeds from sale of property, plant and equipment and intangible assets (a) 584.0 81.3
Proceeds from the sale of subsidiaries, net of net debt sold and from the sale
of financial assets (a) 0.4 718.8
Dividends received from equity affiliates 4.1 4.6
Net cash flows used in investing activities (2,584.8) (1,954.6)
Financing activities
Dividends paid
• L'Air Liquide S.A. (1,163.0) (1,307.9)
• Minority interests (73.7) (78.6)
Proceeds from issues of share capital 39.2 43.7
Purchase of treasury shares (148.1) (49.9)
Net financial interests paid (225.4) (255.1)
Increase (decrease) in borrowings (891.0) (482.0)
Lease liabilities repayments (245.2)
Net interests paid on lease liabilities (36.6)
Transactions with minority shareholders (31.3) (16.0)
Net cash flows from (used in) financing activities (2,780.2) (2,427.6)
Effect of exchange rate changes and change in scope of consolidation 0.7 (1.4)
Net increase (decrease) in net cash and cash equivalents (652.1) 822.1
NET CASH AND CASH EQUIVALENTS AT THE BEGINNING OF THE PERIOD 1,548.6 896.5
NET CASH AND CASH EQUIVALENTS AT THE END OF THE PERIOD 896.5 1,718.6
(a) Since December 31, 2020, proceeds from the sale of subsidiaries are reported in the line “Proceeds from the sale of subsidiaries, net of net debt
sold and from the sale of financial assets” whereas they used to be included in “Proceeds from sale of property, plant and equipment and intangible
assets” in 2019. If this presentation had been in use as of December 31, 2019, these two lines would have shown 46.8 million euros and 537.6 million
euros respectively.

FY 2020 Performance - Air Liquide
PAGE 35/36
The analysis of net cash and cash equivalents at the end of the period is as
follows:
(in millions of euros) December 31, 2019 December 31, 2020
Cash and cash equivalents 1,025.7 1,791.4
Bank overdrafts (included in current borrowings) (129.2) (72.8)
NET CASH AND CASH EQUIVALENTS 896.5 1,718.6
Net debt calculation
(in millions of euros) December 31, 2019 December 31, 2020
Non-current borrowings (11,567.2) (10,220.2)
Current borrowings (1,831.8) (2,180.5)
TOTAL GROSS DEBT (13,399.0) (12,400.7)
Cash and cash equivalents 1,025.7 1,791.4
TOTAL NET DEBT AT THE END OF THE PERIOD (12,373.3) (10,609.3)
Statement of changes in net debt
(in millions of euros) Year 2019 Year 2020
Net debt at the beginning of the period (12,534.9) (12,373.3)
Net cash flows from operating activities 4,712.2 5,205.7
Net cash flows used in investing activities (2,584.8) (1,954.6)
Net cash flows used in financing activities excluding changes in borrowings (1,663.8) (1,690.5)
Total net cash flows 463.6 1,560.6
Effect of exchange rate changes, opening net debt of newly acquired companies and others (62.4) 443.1
Adjustment of net finance costs (239.6) (239.7)
Change in net debt 161.6 1,764.0
NET DEBT AT THE END OF THE PERIOD (12,373.3) (10,609.3)
Air Liquide - FY 2020 Performance
PAGE 36/36
Benoît Potier also comments the Group’s 2020 results in a video interview, available in French and English at www.airliquide.com.
The slideshow that accompanies this release is available as of 9:00 am (Paris time) at www.airliquide.com.
Throughout the year, follow Air Liquide on Twitter: @AirLiquideGroup.
CONTACTS Media Relations
Investor Relations
UPCOMING EVENTS
Sustainability day
March 23, 2021
2021 1st Quarter Revenue
April 23, 2021
A world leader in gases, technologies and services for Industry and Health, Air Liquide is present in 78 countries with approximately 64,500
employees and serves more than 3.8 million customers and patients. Oxygen, nitrogen and hydrogen are essential small molecules for
life, matter and energy. They embody Air Liquide’s scientific territory and have been at the core of the company’s activities since its
creation in 1902.
Air Liquide’s ambition is to be a leader in its industry, deliver long term performance and contribute to sustainability - with a strong
commitment to climate change and energy transition at the heart of its strategy. The company’s customer-centric transformation
strategy aims at profitable, regular and responsible growth over the long term. It relies on operational excellence, selective investments,
open innovation and a network organization implemented by the Group worldwide. Through the commitment and inventiveness of its
people, Air Liquide leverages energy and environment transition, changes in healthcare and digitization, and delivers greater value to all
its stakeholders.
Air Liquide’s revenue amounted to more than 20 billion euros in 2020. Air Liquide is listed on the Euronext Paris stock exchange
(compartment A) and belongs to the CAC 40, EURO STOXX 50 and FTSE4Good indexes.