parental leave legislation and women™s work: a story … · sari pekkala kerr wellesley college...
TRANSCRIPT
Parental Leave Legislation and Women’s Work: A Story of
Unequal Opportunities
Sari Pekkala Kerr∗
Wellesley College
June 11, 2013
U.S. federal and state family leave legislation requires employers to provide job protected parental leave for
new mothers covered under the legislation. In most cases the leave is unpaid, and rarely longer than 12
weeks in duration. This study evaluates disparities in parental leave eligibility, access and usage across the
family income distribution in the United States. It also describes the links between leave taking and women’s
labor markeet careers. The focus is especially on low-income families, as their leave coverage and ability to
afford taking unpaid leave is particularly poor. This study shows that the introduction of both state and
federal legislation increased overall leave coverage, leave provision and leave taking. The new policies did
not, however, reduce gaps between low- and high-income families’eligibility, leave taking or leave length.
In addition, the FMLA effects on leave taking were not stronger in states without prior leave legislation,
nor for women who met the eligibility criteria, as these women were already relatively well covered by other
parental leave arrangements. The increased leave taking does not have significant effects on womens’wages,
earnings, employment or promotions. The small career effects may partly be due to the very limited leave
length in the United States.
JEL: I3, J13, J18, J21, J31, M51
Keywords: Family leave legislation, parental leave, eligibility, low-income families, career, NLSY, CPS
∗Corresponding author. Contact address: Wellesley Centers for Women, Wellesley College, 106 Central Street,Wellesley MA 02481. Email: [email protected]. This work has been funded by the 35th Anniversary Fund ofWellesley Centers for Women. I am grateful to Meaghan Maher and Meredith Stoner for excellent research assistance.
1
I. Introduction
The United States is one of the few developed countries that does not have a universal parental
leave legislation covering all employees. Furthermore, even those employees that are covered by
the existing legislation are typically not guaranteed paid leave, or a leave exceeding 12 weeks. The
generosity of parental leave policies depends on the state of residence, tenure and work hours with
the employer as well as the size of the employer firm. Covered employees are guaranteed 12 weeks of
unpaid leave under the federal Family and Medical Leave Act (FMLA). Paid family leave mandates
are currently limited to California and New Jersey which recently passed the Paid Family Leave
Insurance program.1 Some states have specific mandates above and beyond the coverage of the
FMLA, extending coverage to smaller firms or employees with a shorter tenure.
This study evaluates disparities in parental leave eligibility, access and usage across the family
income distribution in the United States. In addition, it describes the effects of the leave policies on
women’s usage of parental leave, and its connection to their labor market careers with a particular
emphasis on low-income women. Parental leave is often applauded for its beneficial effects on the
wellbeing of both the child and the mother.2 It is also argued that mandated parental leave improves
women’s economic position by allowing them to retain their former employment during and after
pregnancy. While previous research has evaluated the effects of parental leave on female labor
market participation and employment, few studies have conducted careful empirical evaluations
on leave usage and the effects accruing to economically disadvantaged populations. Indeed, both
recent academic research and popular press articles, such as Anne-Marie Slater’s highly debated
2012 account in the Atlantic, have focused on highly educated career women while ignoring the
realities facing the majority of working mothers.3
Better career progress, greater earnings and job retention are related to human capital and labor
market experience. Women’s labor market histories, however, display gaps in participation during
years of family building: women are more likely than men to interrupt their work careers for family
1. The FMLA passed in 1993 covers full-time workers working at least for one year in companies with more than50 employees. California PFL (commencing in 2004) provides 6 weeks of partially paid leave to the participants ofthe State Disability Insurance. New Jersey PFL (commencing in 2008) similarly provides 6 weeks of partially paidleave to employees working for firms that are subject to the NJ Unemployment Compensation Law.
2.While outside of the scope of the current study, several previous studies have evaluated the effects of parentalleave on child outcomes. See for example Berger et al., 2005; Chatterji et al., 2011; Gregg and Waldfogel, 2005;Ruhm, 2005; Tanaka, 2005; and so on.
3. See e.g. Anne-Marie Slater "Why women still can’t have it all", the Atlantic July/August 2012.
2
reasons. These gaps reduce the amount of labor market experience women can accrue relative to
men, a factor contributing to the gender wage gap.4 With mandated, job-protected parental leave
employers are obligated to re-employ the new mothers to their earlier positions, and hence the
existence of leave mandates might be beneficial to women’s work careers. In that case, women
would not lose their jobs, but instead be re-employed at their previous wage level and previous
position in the career-ladder, meaning that they could retain the benefit from their tenure with the
same employer. Low-income women may be more adversely affected by child bearing, depending
on their eligibility to job protected parental leave and their ability to afford taking them.
This paper will specifically focus on economically disadvantaged employees with low family
income. This group is the least likely to be covered by the parental leave legislation and also most
vulnerable in terms of their job security. The aim is to test whether the leave eligibility, probability
of taking any family leave, and the length of leave taken is systematically related to the economic
status of the new mothers. Also, this study will take a look at these women’s labor market careers.
In particular, the economic outcomes of interest include a) women’s return to employment post-
birth, b) risk of unemployment, c) short- and long term growth in hourly wages and earnings,
and d) incidence of promotions. Together these economic outcomes offer an extensive view of the
women’s labor market careers in the United States.
The analysis of NLSY and CPS data finds that there are indeed sizeable differences in the
incidence and length of parental leaves across the family income distribution that are at least
partly related to the legal eligibility and employer provision of leaves. In addition, while the state
and federal policies have affected leave taking on average, they have not done anything to reduce
the disparities across family income quartiles. Due to the FMLA criteria related to job tenure and
firm size, it does not provide very good coverage for women in low-income families. Instead, it
focuses coverage to women in steady jobs that likely already provide parental leave arrangements
through company policies. Finally, the additional leave taking induced by the FMLA does not
appear to be adversely related to women’s career outcomes, at least at the currently mandated
length.
The rest of this paper is structured as follows. Section II provides some background on the
4. There is a vast literature on gender wage gap, an issue that remains beyond the scope of the current study.Some of the most relevant studies include Arulampalam et al., 2007; Blau and Kahn, 1992, 1994 and 2003; Waldfogel,1998b.
3
economic issues related to parental leave and describes the relevant empirical literature. Section
III presents the state and federal family leave policies, and the data used in the analysis. Section
IV outlines the empirical framework and discusses the validity of the research design. Section V
presents the empirical findings, and Section VI concludes with an international comparison.
II. Related Academic Literature on Parental Leave
To date, there is scant evidence on parental leave coverage and usage in relation to family
economic status: Few studies have evaluated the feasibility and effects of family leave for low-
income families. One related study looked at the expansion of Canadian paid family leave and
found that most of the leave benefits accrued to women in relatively advantaged population groups
rather than disadvantaged families (Hanratty and Trzcinski, 2009).5 The most directly related
analysis comes from a master’s thesis by Conover (2007), who uses data from the 2006 March
Current Population Survey (CPS) to test whether women with higher income levels are more likely
to take parental leave under the FMLA than women with lower income levels. She finds that income
indeed positively affects the probability of leave taking, and suggests that paid leave policies are
required to promote leave-taking along the whole income distribution. Klerman and Leibowitz
(1994) also show that access to paid leave is positively related to "market skills" such as schooling
and work experience. Survey evidence supports the notion that many women who would have liked
to take a parental leave (or a longer leave) were unable to afford it (e.g. A Workable Balance:
Report to Congress on Family and Medical Leave Policies, 1996, cited in Waldfogel, 2001).
In addition, a few studies report statistics on the access to paid or unpaid family leave by income
level. Recent BLS reports show that low earners are only half as likely to have access to paid family
leave relative to the average private sector employee (5% and 11%, respectively).6 According to
those reports access to unpaid leave is currently available to 85% of all workers, yet for only 77%
of the lowest 25% of earners. Comparing the recent BLS reports to more historical publications
also gives an interesting insight into the evolution of parental leave coverage in the U.S.. While
5. They did not find any effects on returns to employment or relative employment.6. BLS (2011) National Compensation Survey: Employee Benefits in the United States, March 2011. Clemens-
Cope et al. (2008) show that low-income families are also much less likely to have access to paid sick leave to takecare of their children, and consequently less likely to use sick leave for family needs.
4

access to paid leave is still very far from universal, the overall family leave situation has certainly
improved in the last 20 years: in 1992 only 2% of workers had paid leave available, and unpaid
leave was available for 15% of employees in small firms and 37% in medium and large firms.7
Previous research has demonstrated that interruptions in women’s employment hinder their
career progress, and parental leave in particular has negative effects on earnings that may last
longer than those associated with other types of leave.8 In contrast, other studies argue any
negative effects of family leave disappear after returning to work, and those taking parental leave
eventually catch up with employees who did not take leave.9 In countries without universal parental
leave coverage, such as the U.S., women are also often hesitant to take leave due to the perceived
negative consequences.10
Earlier research on the U.S. Family and Medical Leave (FMLA) has largely concentrated on its
effects on female labor supply, instead of addressing the wider question of female labor market ca-
reers.11 Waldfogel (1999a and 199b) finds that the FMLA increased leave coverage and encouraged
leave taking, but she did not observe any significant effects on wages and employment. Conversely,
Baum (2003) studied the FMLA as well as state level parental leave policies, and argued that family
leave legislation did not affect leave taking, although it did increase women’s return to employment
after child birth.12 Berger and Waldfogel (2004) agreed that those women with parental leave cov-
erage were more likely to return to employment after 12 weeks. In fact, a third of the US women
return to work within 3 months of child birth, while over a half of women have returned within
6 months.13 In her dissertation Kane (1998) analyzed the pre-FMLA state policies, finding that
they improved women’s access to parental leave, increased female employment but reduced their
7. Bureau of Labor Statistics (1994) Employee Benefits in Small Private Establishments, 1992; BLS (1993) Em-ployee Benefits in Small Private Establishments, 1991. See also Bureau of Labor Statistics (1998) Employee Benefitsin Medium and Large Private Establishments, 1995; Bureau of Labor Statistics (1999) Employee Benefits in SmallPrivate Establishments, 1996.
8. Joshi et al. (1996), Buligescku et al. (2008), Manchester et al. (2010).9.Waldfogel (1998).10. Hochchild (1997), Crittenden (2001), Glass (2004), Bardasi and Gornick (2008).11. Some studies have looked at the effects of parental leave on children and family well-being. As these issues are
outside of the scope for the current study, that research is left out of this review.12. Baum (2003) evaluated the effect of FMLA by comparing those who were legally eligible to those who were
not eligible, according to the FMLA criteria. The legal eligibility is not, however, a good characterization for actualleave availability, as many who are not eligible nevertheless work for employers who offer paid or unpaid leave. Forexample, according to the NLSY data, after the FMLA 66% of legally non-eligible workers worked for an employerwho offered paid leave to at least some of their workers.13. The majority of mothers who work when their child is 12 months old have returned by 3 months (Klerman and
Leibowitz, 1994).
5
wages.14 15
Finally, a recent study provides an interesting perspective on parental leave and the careers of
high-powered women. Bertrand et al. (2010) studied MBAs who graduated from top U.S. business
schools in 1990-2006, and found that the male-female pay gap grows rapidly soon after the MBAs
start their careers. Much of this increase can be attributed to career interruptions and shorter
working hours of the women, mostly related to the presence of children. The authors have also
examined the "Harvard & Beyond"-alumni project and found similar, if somewhat smaller, child
related career costs for female MDs, JDs and PhDs. The career costs of child birth are therefore
not limited to women working in low-skilled occupations and those with lower earnings, but are
apparent even for women with the highest educational qualifications.
III. Description of the Policies, Research Design, and Data
The United States is one of the few countries that does not mandate a paid parental leave that
would cover all employees. Figure 1 shows a comparison of parental leave mandates by type and
length across a selection of developed countries. The Family and Medical Leave (FMLA) legislation
enacted in 1993 created for the first time a national mandate for medium-size and large companies
to offer family leave for those new parents covered under the legislation. The history of parental
leave legislation in the United States is discussed below.
14. In Sweden, Albrecht et al. (1999) find that family related career interruptions do not harm womens’wagegrowth, whereas they do reduce wages for men. Ronsen and Sunstrom (1996) compare family policies in Sweden andNorway, and find that access to paid parental leave speeds up women’s return to work. Ruhm (1999) notes that rightsto job-protected parental leave increase women’s labor market participation and employment in Europe, but longmandated leave duration increases the gender pay gap. Zweglich et al. (2003) show that maternity benefits increasedwomens’labor inputs in Taiwan. Waldfogel (1995) finds that UK legislation extending rights to job protected leavereduced the pay gap between working mothers and other women. Baker and Milligan (2008) find that, in Canada,leave mandates of up to 18 weeks do not affect women’t probability of returning to employment, while longer leavesreduce returning to work.15. Very little research exists on the relationship between taking parental leave and the incidence of promotions.
Studies evaluating promotion differences by gender include e.g. Groot et al (1996, and Blau and DeVaro (2006).Winter-Ebmer and Zweimuller (1997) evaluate gender differences in promotion rates in the context of women’s higherlikelihood of quitting their job entirely, and find that expected fertility and past career interruptions negatively affectwomen’s progress on the career ladder in Austria.
6

III.A. State Reforms
State parental leave reforms have taken place over the last 40 years, beginning in Massachusetts
where the legislation was established in 1972. The Massachusetts legislation required private firms
with at least 6 employees to offer 8 weeks of unpaid family leave for employees who had at least 3
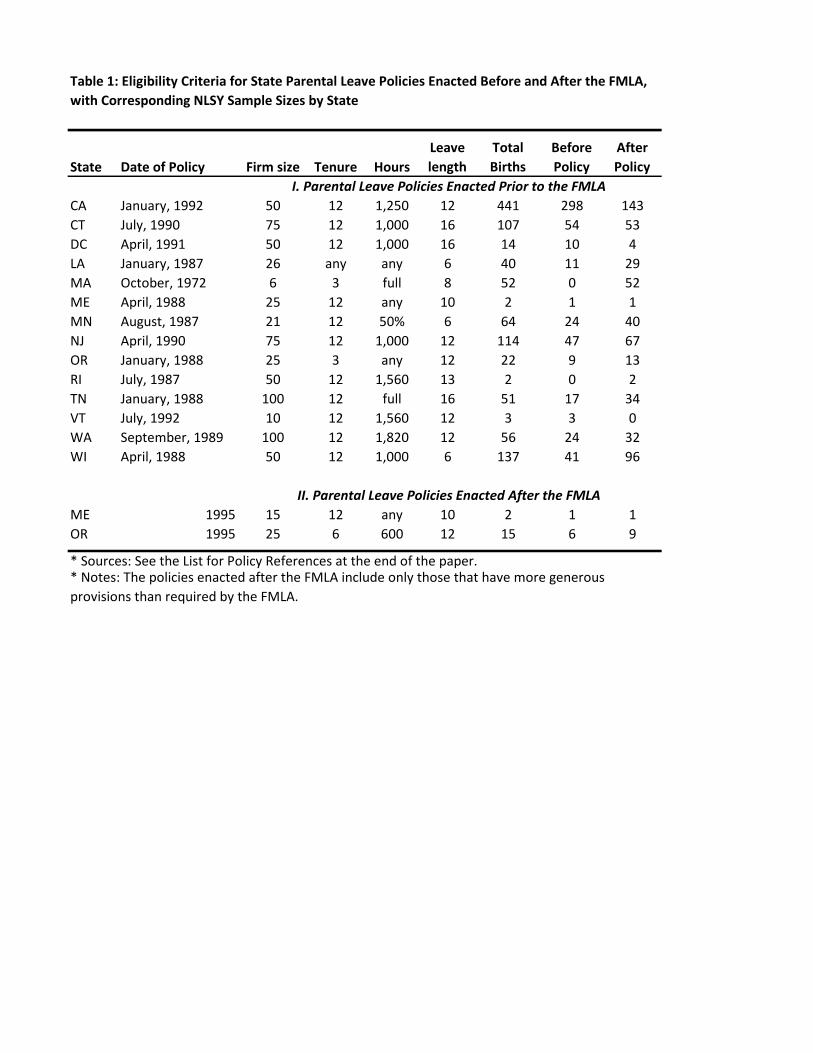
months of tenure. By 1993 altogether 13 states and the District of Columbia had passed some form
of parental leave legislation. The timing of the state reforms and the rules for coverage are shown
in table 1. It should be noted that even after 1993 some states have a more extensive leave coverage
than required by the FMLA, for example extending the coverage to smaller firms or for employees
who have a shorter tenure or fewer work hours than necessary for the FMLA coverage. In addition,
a few states (RI, CA and DC) have mandated a leave length longer than 12 weeks. The state
policies have changed over time, and the data collected for this study follows these changes from
year to year. The sources for the state policy changes are reported in a separate list of references.
According to my calculations based on the National Longitudinal Study of Youth (NLSY), the
state mandates made roughly 35% of women working in the private sector in the covered states
legally eligible for parental leave. The eligibility varies across the income distribution, reaching
up to 41% for those in the highest 25% of the family income distribution, and falling as low as
25% for the bottom 25%.16 Similar calculations were made using the Current Population Survey
(CPS), and the estimates match the patterns found in the NLSY. According to the January CPS,
approximately 42% of women working in the private sector in the covered states would have been
made legally eligible for parental leave as a result of the state policy reforms. The share ranges
from 34% to 45% by quartile of the family income distribution.17
III.B. The FMLA
The FMLA guarantees 12 weeks of job protected parental leave for those employees who meet
the eligibility criteria. Legally eligible employees are those who work for private companies that
have at least 50 employees, and have worked for the company at least 12 months for a total of
16. This calculation includes years 1991-92 for the states that implemented a policy prior to 1993. All women aged26-35 working for private companies are included, whether they had children or not. Of men, 42 percent would havebeen legally eligible for parental leave based on the state policy criteria in 1991-92.17. Data on job tenure are available only in scattered CPS supplements prior to 1996. This calculation uses the
1991 January supplement. All women aged 20-40 working for private companies are included, whether they hadchildren or not.
7

1,250 hours per year. Public sector employees are covered by the FMLA regardless of employer
size. Importantly, the FMLA does not guarantee paid leave, the provision of which is left at the
discretion of the employer.
While the FMLA created a uniform policy framework across all states, the coverage it created
is far from universal. Based on the Bureau of Labor Statistics publications on Employee Benefits
in Medium and Large Establishments, and Employee Benefits in Small Private Industry Establish-
ment, the passage of the FMLA significantly increased the parental leave availability in the U.S.
Prior to the FMLA, under 40 percent of full time employees in medium and large establishments
(i.e. establishments with more than 100 employees) were offered either paid or unpaid parental
leave, while only 20 percent of employees in small establishments (less than 100 employees) were
offered such leave. After the FMLA was passed in 1993, the share of full time employees with
family leave availability in large and medium enterprises increased to 95 percent, while it remained
somewhat lower, at 50 percent, in the small establishments. Most of the covered employees were
offered an unpaid leave of exactly 12 weeks. I am not aware of any studies conducted around the
FMLA introduction (or later) that would dissect parental leave availability by family income.
In the nationally representative NLSY data, the FMLA marginally increased the share of legally
eligible women to 40% in those states that already had previous parental leave mandates and made
38% of female employees eligible in states that did not have a prior mandate. Again, eligibility
varies greatly across the family income distribution. Those in the lowest 25% are much less likely
to be covered (26%) than those in the top 25% (45%).18 Actual leave availability can of course
be greater than this, as it partly depends on employer policies (as shown by the BLS numbers
above). It should be noted that calculating actual leave availability (i.e. whether the employer
offers job protected parental leave to a specific person) is complicated in the NLSY as it only
asks whether paid parental leave is provided by the employer. A more detailed analysis of the
leave availability and incidence is presented in section 5. A similar calculation was made using
the Current Population Survey (CPS), where data on job tenure and other FMLA criteria are
collected in the January supplement biannually after 1996. The post-FMLA eligibility estimates
fall relatively close to those found for the NLSY: 45% of female employees were made eligible in
18. This calculation includes years 1994-98. All women aged 29-41 working for private companies are included,whether they had children or not. For men, the FMLA similarly made about 39 percent legally eligible for parentalleave in 1994-98.
8
states that did not have a prior mandate, and 46% in those states that already had a leave policy
in place. These shares vary from 34% to 52% by the family income quartile.19
The implementation of the FMLA means that there are several groups of women who would
potentially be most affected by the newly available parental leave, and whose leave taking would
therefore be impacted by the reform. For example, women who fulfill the eligibility criteria could
be expected to benefit most from the mandated leave, especially if they live in states that did
not previously have any leave mandate in place. Alternatively, women whose employer did not
previously offer any job protected family leave might be more likely to take advantage of the new
arrangement allowed by the FMLA. Changes in leave taking around these and other likely margins
are evaluated in section 5 below.
III.C. Data Sets and Samples
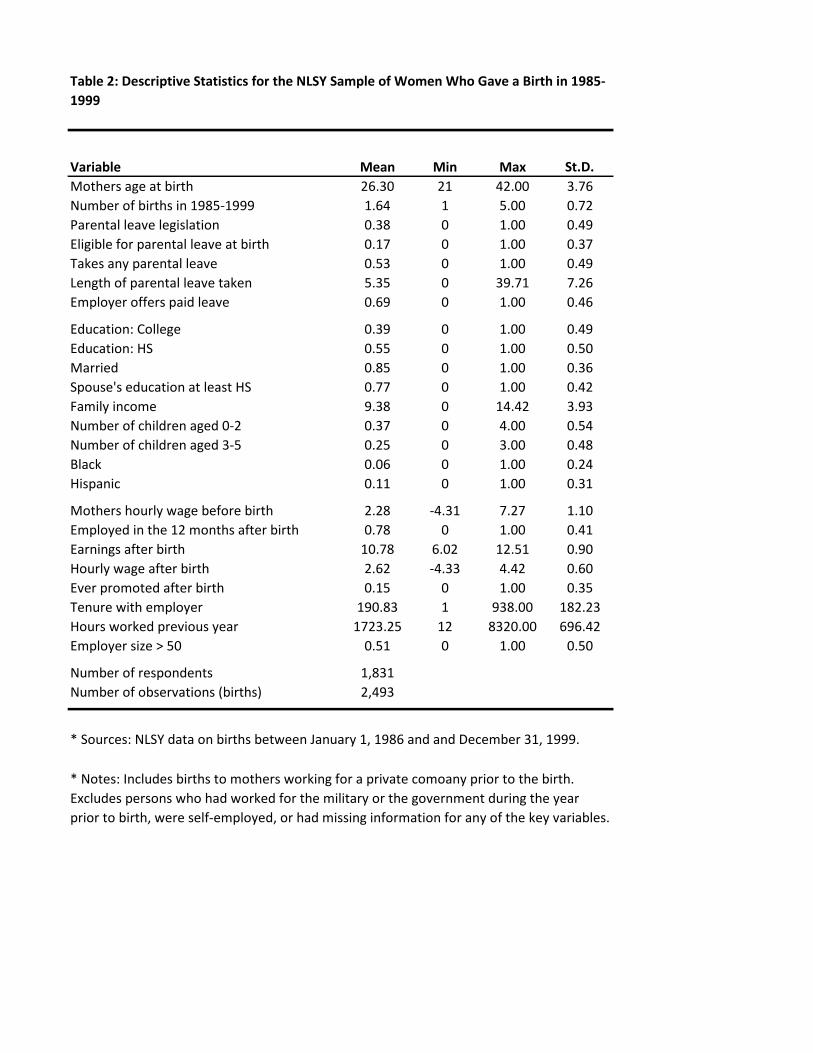
Table 2 summarizes the key demographic and work history variables, along with the employment
and earnings outcomes for the NLSY1979 sample.20 The NLSY contains questions on a wide range
of issues including: 1) employment, wages, promotions, and employer characteristics, 2) fertility,
care giving, and families, and 3) fringe benefits such as employer provided parental leave. The
sample used for the current analysis includes mothers who gave birth between 1985 and 1999, and
were working in the private sector prior to giving birth. Mothers who worked for the military or
were self-employed in the two years immediately prior to birth are excluded, as are those who had
a non-interview at that time. Likewise employees of local, state or federal government are excluded
from the final sample as they are subject to different parental leave policies. Multiple births are
included per mother, as the unit of observation is a birth. After excluding observations that have
missing values for key variables the total sample size is 2,493 births, and all respondents are followed
until 2008. While the NLSY is a nationally representative sample, it oversamples Black, Hispanic
and economically disadvantaged persons. Customized sample weights are used to adjust for this
oversampling when calculating the descriptive statistics.21
19. This calculation includes years 1996 and 1998. All women aged 20-40 working for private companies are included,whether they had children or not.20. The NLSY was initiated in 1979 with 12,686 respondents aged 14 to 22. The follow-up interviews took place
annually from 1979 through 1993, and then biennially from 1994 through 2008.21. Alternative data sources include the CPS or the NICHD, of which neither is ideally suited for the current study.
The CPS does not follow the same individuals from year to year, and does not have a firm size cut-off at 50 employees.
9
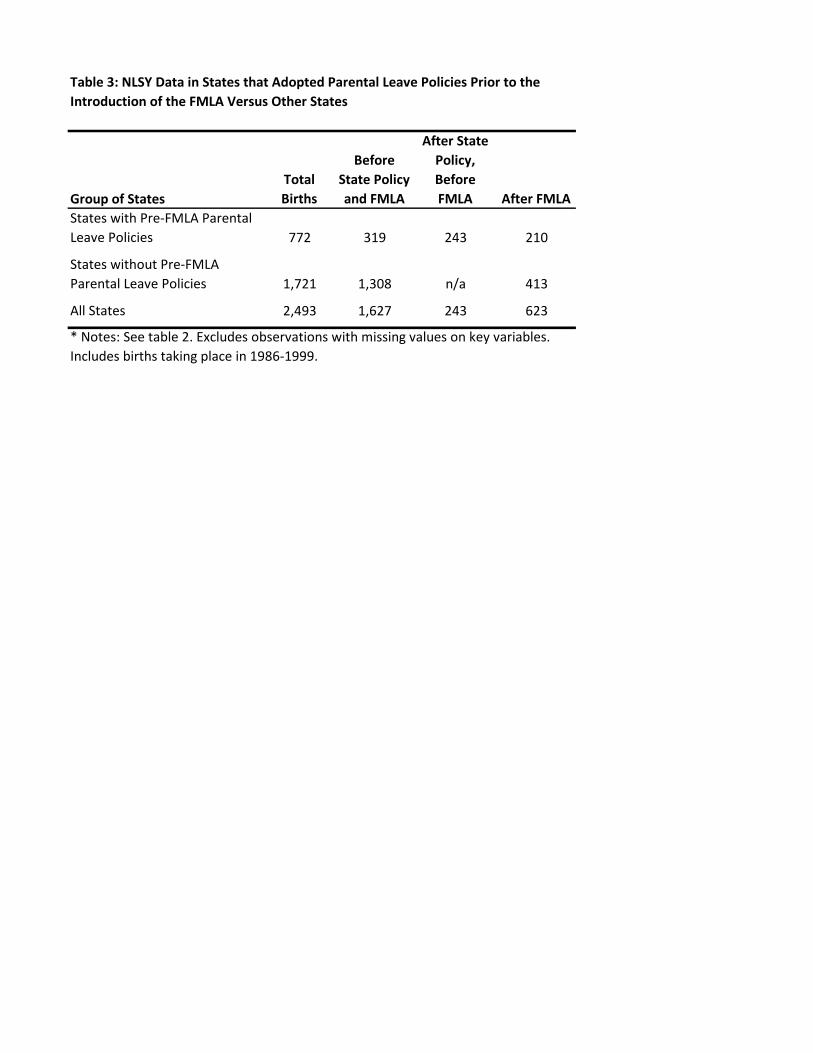
For estimation purposes data are needed on births taking place before and after the policy
changes. As state and federal parental leave mandates are separately evaluated, the states and
time periods are grouped as follows. The states are classified into those with and without pre-
FMLA parental leave mandates. For the states that had an earlier mandate (prior to 1993), the
births are divided into those taking place prior the state mandate, those between the state mandate
and the FMLA, and those taking place after the FMLA. For states without prior mandates, births
are simply classified as taking place before or after the FMLA. Table 3 shows the sample sizes
within these cells.
In 1985, the youngest mother in the data was 20 years old and the oldest was 28. Even though
the sample period covers the peak fertility years for most of these women, it cannot be claimed that
the sample is representative of overall birth rates for that period. The data will also not capture
all births for these mothers. In 1985, for example, 13 percent of all births were for mothers aged
less than 20 and 6 percent for those aged 35 or more (NCHS data).22
In addition to the NLSY, comparisons are provided to the Current Population Survey (CPS)
data whenever possible. CPS is a monthly survey of 60 to 80 thousand households conducted by
the Bureau of Labor Statistics (BLS). It includes data on topics such as employment, hours of work
and earnings, along with demographic and labor force characteristics for each household member.
As shown above, a combination of March and January supplements to the CPS can be used to
determine eligibility to parental leave under the state and/or the FMLA criteria. The January
supplement contains the necessary information on job tenure and hours worked for 1987, 1991, and
then biannually from 1996 onward, while the March supplement gives details on employer size.23
Likewise, the June supplement can be used to calculate the percentage of mothers with young
children who are actually taking parental leave during the first 3 months after child birth. Each
supplement includes a question on family income, allowing the calculation of these statistics across
The NICHD follows the new mothers for a few years, but does not reveal information about their employer size, jobtenure or annual hours worked. It is also not a nationally representative sample.22. In 1999, the corresponding percentages were 12% and 13%. Sources: Documentation of the Detail Natality Tape
File for 1999 Data, and Public Use Data Tape Documentation: 1985 Detail Natality. U.S. Department of Health andHuman Services, National Center for Health Statistics. See also Livingston and Cohn (2010) for a recent discussion.23. It should be note that the CPS is not ideally suited for this purpose as the employer size cut-off is not reported
at 50 employees, the limit used by the FMLA and many state mandates. For that reason, the CPS estimates onleave eligibility should be considered approimations. CPS reports firm size limits at 25 and 100 employees. Since thedistribution of U.S. establishment sizes is fairly linear between 25 and 100 employees (e.g. Henly and Sanchez, 2009),point estimates for eligibility can be based on the percentile points between the upper and lower bounds created bythe CPS firm size limits. See table 4c for more details.
10

the family income distribution. However, as the CPS does not follow the same individuals over a
longer period of time it cannot be used to evaluate the effect of leave taking on career metrics.
IV. Identification and Estimation
The goal of this paper is to evaluate differences in parental leave availability, actual leave taking
and the effects of leave taking across the family income distribution. Of particular interest are the
low-income families and their access to leave as well as their ability to take any parental leave to
which they are legally entitled. The U.S. data also in principle enable the identification of any
career effects of parental leave due to changes and variations in the family leave policies over time
and across states and firms. These variations would create discontinuities in the eligibility of women
who give birth at different points in time, in different locations and who work for firms of different
sizes. Assuming that suitable data exists, these discontinuities suggest that an evaluation of the
career effects might be possible.
The first part of the estimation framework ic concened with the effect of family leave policies
on leave taking.24 In case of the pre-FMLA state policies, the first stage would take the following
form.
(1) Li = α+ γ′Ds(i) + θ′Dt(i) + βPs(i)t(i) + δ
′Xi + εi,
where Li is an indicator that mother i takes parental leave after giving birth or a measure of
the total leave length taken. Ds are the state specific dummies and Dt the year-of-birth (of the
child) dummies. Ps(i)t(i) is an indicator taking value one if the birth took place in a state that
implemented a pre-FMLA parental leave policy after the time when the policy was implemented.
Xi is a vector of other person specific covariates, including e.g. race, marital status, number of
children, education, earnings prior to leave, and age groups.
As the interest here is on the distributional effects of the parental leave policies, measures of
family income are introduced in the estimated equations. Here, family income (Ii) is included
in the leave equation along with its second and third polynomial, and as an interaction with the
post-reform dummy For the case of the FMLA, the estimated equation takes the form.
24. In a causal model of the effects of parental leave taking on women’s career indicators this would also representthe first stage of the model.
11
(2) Li = α+ γ′Ds(i) + θ′Dt(i) + βPt(i) + Ii + I
2i + I
3i + Ii × Pt(i) + δ′Xi + εi, : i.
Finally, if it is found that the FMLA and/or state policies have an impact on leave taking,
a second stage equation can be estimated for the various career metrics such as employment.
Depending on the type of natural experiment that can be conducted on the available data, these
equations could be estimated as a reduced form, differences-in-differences or with instrumental
variables. The identifying assumption is that the family leave reforms do not affect family formation
decisions systematically differently by "career mindedness" or some other unobserved factor that
influences the career metrics. This assumption can be studied indirectly by looking at the effects of
the reforms on overall fertility across states. Cannonier (2011) argues that the FMLA did increase
the overall fertility, but did not show significant differences e.g. across income groups.25
V. Main Results: The Effect of Parental Leave Policy
Reforms
V.A. Impact of reforms on leave provision, eligibility and leave taking
As already discussed above, women with low family income are much less likely to be legally
covered by the family leave mandates created through the FMLA and state reforms. Tables 4a
and 4b summarize by family income quartile whether the new mothers were legally entitled to
job-protected parental leave. Legal entitlement is here defined as having an employer immediately
prior to the child birth with at least the minimum number of employees for whom the new mother
had worked at least the minimum duration and minimum number of annual hours required by the
(state or federal) mandate. In the case of the FMLA, this would mean having worked for at least
12 months and 1250 hours per year for an employer who had at least 50 employees.
Under the pre-FMLA state policy mandates (table 4a), only 27 percent of women in lowest
family income quartile qualified for job protected parental leave, whereas more than half of the
women in the top two quartiles were legally entitled to leave. According to the FMLA criteria, 32
percent of the women in the lowest income quartile were legally eligible for parental leave, while
as at least 50 percent of women in the highest quartiles met the eligibility criteria. The tables
25. Research in other countries confirms that family policies affect fertility rates, without really changing therelationship between fertility and economic status (e.g. Bjorklund, 2006; Lalive and Zweimuller, 2009).
12
also dissect the reasons for ineligibility by individual criteria and all their combinations. For most
women who were not legally covered by the state mandates or the FMLA, the firm size requirement
appears to be a factor. Those at the bottom of the income distribution were also more frequently
made ineligible due to a short job tenure, and to some extent fewer hours worked.
An analysis of the CPS January and March supplements reveals a similar pattern across the
family income distribution (table 4c). Only 36 percent of women in the lowest family income quartile
were legaly eligible for parental leave, while the share was much higher (55%) in the top income
quartile. Firm size is again a significant factor for most women, although the CPS sample also
reveals large discrepancies across family income distribution in meeting the job tenure criteria.26
It should be noted that employers may provide job-protected (and even paid) parental leave
for women who are not legally eligible for it, and smaller employees not covered by the policy
requirements also frequently provide some leave arrangements for at least some of their employees.
Tables 5a and 5b summarize by family income quartile the actual employer paid leave provisions
and actual leave taking before and after the policy reforms. Prior to the state policy reforms, just
over half of the employees in the lower family income quartiles worked for firms that provided paid
parental leaves, whereas nearly three quarters of the employees in the top income quartile had paid
leave available. It is notable that even those employees whose employers provide some paid leave
arrangement do not necessarily take paid leave. This may be due to an insuffi cient compensation
level during leave or the fact that paid leaves are not provided for all employees within the firm.
For example, only 19 percent of the employees in the bottom income quartile report having used
paid parental leave, even though 54 percent worked for an employer who had a paid leave policy
available. The usage of paid leaves was much higher in the top income quartile (43 percent),
although still much lower than the percentage of those whose employer supposedly provided a paid
leave. The average leave length also varied considerably across income quartiles prior to the state
policy implementation.
Provision of paid leaves increased in all family income groups after the state reforms, but the
26. One difference between the NLSY and CPS samples is the higher proportion of women with long job tenurein the NLSY. This is caused by the sampling of NLSY women who were employed prior to giving birth, whichautomatically emphasizes women with greater labor market attachment. While the NLSY sample can be thought ofa representation of women with significant ties to the labor market, the CPS is more representative of all workingwomen at a given point in time. The comparison of these two data sets is therefore instructive in giving a fullerpicture of parental leave eligibility in the US.
13

gap between the lowest and highest income quartile did not markedly change as a result (table 5a).
The differences across income quartile remained particularly stark in the smaller firms.27 Likewise,
leave taking and average leave length increased in all income groups, but much more so for the
high income families such that the gaps between the lowest and highest quartile actually increased
noticeably. Finally, after the state policy reforms the share of those women who took paid leave
(as a percentage of employees whose employer provides paid leave) was much higher in the highest
family income quartile and increased more than that in the lowest quartile relative to the pre-reform
situation.
For the FMLA, paid leave provision increased most in the top family income quartiles, but
the differences between the lowest and highest quartile remained largely unchanged (table 5b).
Interestingly, leave taking and average length increased most in the third income quartile, but
significant increases in leave taking also took place in the lower quartiles. Despite this, sizeable
gaps in leave taking and length remain across the family income groups. Indeed, these numbers
based on tables 5 and 4 describe a very unequal pattern of leave eligibility, provision and taking
across the family income distribution. After the FMLA, just over a third of the lowest income
quartile employees working in large firms with a paid leave policy actually took paid parental leave,
while 67 percent of the highest income quartile employees did so. This may be related to the fact
that even though the companies have paid leave available, employees in the lowest income quartile
are not eligible to use it.
A similar analysis using the June CPS supplement shows very comparable patterns across the
family income distribution. Mothers who gave birth in the previous 3 months were more likely to
be employed and on parental leave after the FMLA than during the years prior to the FMLA. The
analysis looks at women aged 20-40 who worked in a private sector firm at some point over the
last 12 months prior to the June CPS interview. Overall, about 85 percent of them were employed
at the time of the June interview prior to the FMLA, and this share increased to 89 percent after
the FMLA.28 Of these same women, 39 percent were on parental leave at the time of the June
interview prior to the FMLA. After the FMLA, just over 50 percent of the women were on parental
27. This increase may partly be related to the actual reforms, but there has also been a general trend of increasedleave provision that needs to be accounted for in the regression analysis.28. Years 1990 and 1992 are used as the pre-FMLA period, whereas the post-FMLA period consists of 1994, 1995
and 1998.
14
leave in June; a sizeable increase over a period of a few years. Table 5c shows an analysis of these
patterns across the family income distribution. Just as was shown for the NLSY, there are very
large differences in leave taking across quartiles of the family income distribution. Women in low-
income families are much less likely to return to employment after giving birth, and also much less
likely to be on parental leave at the time of the CPS interview. The differences in leave taking are
not reduced after the FMLA, but appear larger in the post-FMLA period, if anything.
A simple regression model for the probability of meeting the FMLA or state eligibility criteria
shows that women with higher family incomes are much more likely to meet the criteria both during
the entire time period as well as in the post-reform period (Table 6, columns 1 and 4).29 When
estimating the model using the continuous definition of family income (column 2) the effects at
various points of the family income distribution are calculated at the bottom of the table. These
calculations again show that women at the higher end of the income distribution are much more
likely to meet the eligibility criteria. Likewise, a simple regression for the probability of taking any
leave implies that women with a higher family income are more likely to take leave (column 3).
Based on the information shown here and in tables 4a and 4b it would appear that the greater
leave taking is likely associated with working in a job that allows the woman to meet the eligibility
criteria (long tenure, full time work, large employer). In most cases the direction of the estimates
is similar in the post-reform period (column 4). However, during the post-reform period the model
with the continuous definition of family income shows estimated effects that are somewhat non-
linear at the top of the distribution and therefore a third polynomial is added to better capture
the shape of the family income effect.30. Overall, it seems that the effect of family income on the
probability of meeting the eligibility criteria is, if anything, greater in the post-reform period. The
next set of tables turns to a more detailed analysis of leave taking in relation to family income and
the policy reforms.
When estimating the effect of the FMLA, and controlling for state fixed effects, time trends
and individual characteristics, the NLSY data reveal an increased probability of leave taking by
nearly 20 percentage points, and increased average leave length by 5 weeks across all states after
29. In this regression, a person is considered to meet the FMLA criteria if they worked for the same employer forat least 52 weeks, 1250 hours per year and their employer had at least 50 employees. This is a technical definitionapplied to both the pre- and post-FMLA births, and therefore does not capture the actual eligibility.30. A model without the additional third polynomial for family income produces essentially flat and statistically
insignificant estimates for the post-reform period.
15
the reform (Table 7, columns 1 to 3). No significant increase is seen for paid parental leaves, as
might have been expected since the FMLA did not stipulate anything about pay during leave.
The FMLA effects are very similar in those states that did not have a previous mandate, although
the effect remains statistically significantly only for leave length (columns 4 to 6). As shown in
the previous tables, leave taking varies noticeably across the family income distribution, and clear
patterns emerge where women with higher family incomes are more likely to take leave and stay
on leave longer. The FMLA does not appear to have impacted the differences across family income
groups, as shown by the small and statistically insignificant interaction term. Finally, the state
policy reforms do not show any statistically significant effects on any of the leave metrics studied
here, although a distinct pattern by family income is clearly noticeable (columns 7 to 9).
In order to evaluate whether the FMLA affected parental leave taking in those groups that
one might most likely expect, Table 8 breaks down the FMLA estimates across different sub-
populations. First, it might be expected that the FMLA had its greatest impact in states that
did not have a prior parental leave mandate, if it made a whole new population of women eligible
for leave. As could be expected based on results shown above, this does not seem to be the case
for any of the leave metrics.31 Similarly, it would be reasonable to assume that the FMLA mostly
affected those women who met the eligibility criteria. In reality, it is true that women who meet
the eligibility criteria are more likely to take paid and unpaid parental leave, and to take longer
leaves, but the FMLA is not the reason behind the observed pattern. Instead, these women are
more likely to work in jobs where the employer offered a more generous leave arrangement already
before the FMLA, and are therefore more likely to take leave. Third, it could be expected that
women working in medium-sized firm (instead of large or small firms) would be most affected by
the FMLA. Waldfogel (1999) found some evidence for that pattern using the CPS. The NLSY data
give some indication that leave taking increased most for women working in medium-sized firms,
but the effects are not statistically significant. Interestingly, women working in large firms are most
likely to take both paid and unpaid leave, and have longer leave durations. This again signals that
those firms offer the most generous leave arrangements, regardless of the FMLA. To conclude this
analysis, the FMLA effects are evaluated for women whose family income was in the bottom tercile
31. Using CPS data Waldfogel (1999) also found that the FMLA actually had its largest effects in states with priorlwas on leave taking.
16
of the distribution. Again, it appears that those women are less likely to take any kind of leave
in general. There is some indication that the FMLA increased unpaid leave taking for that group,
but the effect is only weakly significant. The breakdown of FMLA effects across the most likely
groups to be affected shows that the groups most targeted by the FMLA probably already enjoyed
a reasonably high parental leave coverage and were not particularly strongly affected by the new
law.
V.B. Connection to career metrics
This section describes the connection of parental leave taking and leave length to the various
career metrics first for the full NLSY sample used in this study and then separately for the low
family income group, i.e. families whose income falls below the median of the sample. Some of the
estimates in Table 7 revealed a reasonably strong first stage for the FMLA that could possibly be
exploited in a 2SLS or differences-in-differences estimation. It should be noted, however, that the
FMLA does not satisfy the requirements for an "ideal natural experiment" that could be conducted:
there is no evidence that leave taking increased more for those who became legally eligible for leave
as a result of the FMLA.32 Hence, the most reasonable way to utilize the FMLA policy change
is to create a comparison of women giving birth before and after the FMLA, interacting the pre
and post dummies with an indicator of leave taking. This is a much weaker test, and therefore the
NLSY sample size may not be large enough to detect statistically significant effects connected to
the FMLA induced changes in leave taking.
The career metrics are calculated at 1, 2, 3 and 4 years after the birth of the child related to
the parental leave in order to capture both the short-run and long-run effects of leave taking. The
metrics are defined as follows. First, the mother is considered employed if she reported a positive
number of hours worked for the relevant calendar year, and unemployed if she reported some (or all)
weeks looking for work since the last relevant interview. Second, annual earnings are deflated using
the CPI series published by the BLS (all urban consumers series), and then a natural logarithm
32. The most likely reason for this is that those who were legally eligible for leave after the FMLA already hada high prevalence of employer provided paid parental leave prior to the FMLA, and hence their situation was notmuch improved by the new legislation. In addition, the FMLA appears to have more widely increased leave provision,possibly due to employer awareness of the importance of such a benefit, or increased competition among employersfor female employees. Baum (2006) shows that for the full NLSY sample (including those women not giving birthas well as males), family leave legislation significantly increased employer leave provision and did so in particular foreligible employees working in covered (i.e. larger) firms.
17

is taken. The earnings regressions only consider persons that had some positive earnings during
the relevant interview year, and combine all earnings across jobs if the person had more than one
job during the year. Third, hourly wages are also in logarithms and deflated using the CPI, and
likewise only considered for those who reported positive hourly wages during the relevant interview
year. If the person had multiple jobs during the year, the hourly wage from their first reported
employer was used. Finally, during some interviews NLSY participants are asked whether their
job position had changed relative to the previous year, and whether this change was related to
a promotion or demotion. 33 A linear probability model is estimated for the likelihood of being
promoted since the previous year.
The OLS estimates in Table 8a show a positive and statistically significant connection of taking
any parental leave after child birth with the probability of employment, annual earnings, hourly
wages and the probability of promotion. For example, those mothers taking any leave were 26
percent more likely to be employed and working one year after birth and 9 percent less likely
to be unemployed. They had considerably higher earnings (46%) and hourly wages (14%), and
were also more likely to receive a promotion in the year following birth (10%). Similarly, a longer
parental leave appears to be positively associated with greater post-birth employment, earnings
and hourly wages. For example, taking an additional week of parental leave is associated with a 1.2
percent greater employment probability and 1.5 percent greater annual earnings. These positive
associations do weaken, or even completely disappear, over time as shown by the declining estimates
by year 4.34
The positive employment, earnings and promotion associations also exist for the low family
income sample (table 8b), and no noticeable differences in the magnitudes of the coeffi cients exist
to the full sample (table 8a). Likewise, the probability of unemployment is negatively related
to taking any leave and total leave length both for the full sample and the low-income sample.
And similar to the full NLSY sample, the observed associations between leave taking and career
metrics weaken after a few years also for the low-income sample. As emphasized above, these
estimated effects from the OLS regressions are most likely driven by self-selection: mothers with
higher earnings and greater career focus are more likely to afford taking parental leave and more
33. The years when promotion were captured include 1988-1990, 1996, 1998, 2000, 2002, 2004, 2006 and 2008.34. The weakening of the positive association takes place for all other career metrics except the hourly wage. The
relationship between hourly wage and parental leave remains practically flat for the entire 4 years following the leave
18

likely to utilize it. One way to retrieve the causal effect of taking parental leave on career indicators
would be to use the timing of the FMLA and the state reforms as an instrument for leave taking.
However, a careful study of the populations most affected by the reforms shows that reforms are
less than ideal as "natural experiments". For example, those who become technically eligible as
a result of the new legislation do no increase their leave taking more than others. This is most
likely due to their already existing leave allowances by their employers, and the fact that they were
already at a high level of parental leave usage prior to the reform date.
One way to utilize the NLSY data is to look at women’s career outcomes before and after the
reforms, and compare those taking parental leave to those not taking leave across the two time
periods. While the overall effect of leave taking is still endogenous and positive, the interaction of
the leave indicators and post-policy indicators is arguably less so. This analysis finds very small
changes in the career metrics around the reform date, indicating that either the additional leaves
induced by the reforms had little effect on womens’careers, or there simply isn’t enough data to
uncover the effects. For all of the metrics there is some indication that the relationship between
leave taking and career outcomes experiences some reversal around the FMLA, but the effects are
almost never significant (Table 11a). Indeed, the full sample shows mostly statistically insignificant
relationship between the FMLA induced additional leaves and the career metrics. For the low-
income families, the results are strikingly similar (Table 11b). Given the sample size of the NLSY
and the limited variation in leave taking it is diffi cult to make any further progress on the career
analysis.
VI. Discussion and Conclusions
This paper utilized the state and federal family leave legislation to study parental leave coverage,
leave taking and womens’careers. In particular, the differences in leave coverage and utilization
across the income distribution are described and it is shown that low-income women are less likely
to be eligible for legally mandated parental leave, less likely to have employer provided paid and
less likely to utilize their leave even if they are eligible.
Few studies or popular press articles have focused on the issues that low-income and middle-
class families face when trying to combine work and family responsibilities. As one exception, in
19
a 2006 Harvard Magazine article Elizabeth Warren describes the worsening financial position of
middle-class families and notes that two earners are typically needed just to survive. Similarly,
Nancy Folbre wrote a recent blog about children growing up in poor families, in particular with
single mothers. These accounts of the economic vulnerability of single mothers and middle-class
families, along with the results presented above, suggest that several policy measures could be
taken to improve the ability of low-income and middle-class families to reach the goal of raising
children while remaining actively engaged in the labor force. First, paid, job protected parental
leaves would likely improve the ability of women from all family income groups to retain their jobs
while affording to take time off to care for the newborn. This would help low-income mothers to
retain their former employment and the benefits that accrue from a longer tenure with the same
employer, and avoid the need to resort to welfare support.35 Second, extending the FMLA coverage
to smaller firms and employees with a shorter tenure would significantly increase the eligibility of
low-income women to parental leave and reduce the eligibility gap across income groups. Finally, as
the career consequences of taking a leave at the currently mandated length are likely very minimal,
from that perspective there is no reason why the U.S. leave mandates could not be extended beyond
12 weeks as is the case in most other industrialized countries.
As an example on leave coverage, if the firm size requirement of the FMLA was dropped from 50
to 10 employees the legal eligibility of women in the lowest family income quartile would increase
from 32% to 48%. If, in addition, the tenure requirement was dropped from 12 to 6 months,
legal eligibility would further increase to 52%, and if the annual hours worked requirement was
further reduced to 600 as many as 63% of women in the lowest quartile would become eligible.
For the highest family income quartile, these changes would increase eligibility to 64%, 67% and
78%, respectively. Changes in the eligibility criteria could therefore have a significant impact in
reducing the disparities in leave availability across the income distribution. To gauge the effect of
paid family leave, consider that about 67% of women whose employer provides paid leave actually
take leave, but leave is taken by only 30% of those whose employer does not provide paid leave.
These shares range from 62% to 67%, and 27% to 36% by family income quartile. Based on these
simple calculations, if all women were provided paid leave, the overall leave taking might increase
35. Han et al. (2011) confirm that state family related policies importantly affects the employment of new mothers,especially those in the lower end of the family income distribution (those with no education and single mothers).
20
from 59% to 67%, and the overall gap between the family income quartiles would decrease by 21
percentage points.36 While these examples are only indicative of what might happen as a result of
policy changes, they suggest that the disparities across income groups could be significantly reduced
by increasing eligibility and/or introducing a paid parental leave policy. The evidence from other
countries corroborates this hypothesis, as there are very small differences in parental leave taking
across income groups in countries such as France, Finland, Sweden. Moreover, the importance of
paid leave is highlighted in a recent study by Lalive et al. (2011), who show that leave length is
significantly affected by cash benefits (rather than employment protection), but the leaves induced
by cash benefits do not adversely affect women’s labor market outcomes. Lalive and Zweimuller
(2009) find that job protection mainly benefits high wage (white-collar) women, while low-wage
women respond more strongly to cash benefits.
One closely related issue pertains of course to the availability of affordable child care after the
new mother returns to employment. Klerman and Leibowitz (1990) note that child care costs of
infants can be prohibitively high for families with more than one child. They evaluate the effect
of child care subsidies on new mothers’labor supply and find that tax care credits increased the
probability of returning to work within 3 months, but not beyond that.37 Walker (1996) discusses
the affordable child care from the particular perspective of low-income parents and argues that
the child care financing requires a fundamental reform. The NLSY data used in the current study
show that returning to employment after child birth is much less frequent for low-income mothers,
and becomes less likely after the mother has more than one child. These constraints would not be
solved by increasing parental leave availability and financing, but might need to be alleviated by
more affordable infant care.
Finally, a key difference between the U.S. and most other developed countries relates to the
public provision versus mandating of parental leave. While most other countries rely on publicly
provided and financed parental leave, the FMLA mandates certain firms to provide family leave
to employees who fulfill specific criteria. In terms of the equitableness of leave access, Summers
36. Previous reports and studies on the impact of paid family leave include Fass (2009), Houser (2012) and Rossin-Slater et al. (2011). Waldfogel (2009) constrasts the U.S. situation to other nations. Cantor et al. (2001) andWaldfogel (2001) report than more than half of the women on parental leave are concerned about financial constrains.37. Baker et al. (2008) show that availability of heavily subsidized, high quality child care indeed increases the use
of child care and maternal employment. They also argue that the increased use of child care leads to worse familywell-being.
21

(1989) reminds that, while perhaps more effi cient to provide, these kinds of mandated, employer
provided benefits are by nature less equitable than publicly provided, tax financed benefits. The
obvious problem with mandated benefits is that they only help those who have a job, and in the
case of the FMLA, those who have a job that meets the FMLA criteria for eligibility.
While the current study finds few negative career consequences from taking parental leave, it
should be noted that these results cannot be extended beyond the current leave framework. In
particular, the small effects found here may well be due to the very short duration of the typical
family leave in the United States relative to other countries. In addition, the small sample size of
the NLSY makes it diffi cult to uncover statistically significant effects and to build a more causal
estimation framework. It would be useful to consider using other, larger data sources for the
United States, and also creating comparative analyses to other countries where parental leave is
more extensive in length. Finally, while this paper has focused on the effects of parental leave on
working mothers, a more extensive study evaluating the effects on employers and other employees
would be warranted to form a more balanced picture of the issue.
References
Albrecht, James W., Per-Anders Edin, Marianne Sundström, and Susan V. Broman. 1999. CareerInterruptions and Subsequent Earnings: A Reexamination Using Swedish Data. The Journal ofHuman Resources 34(2): 294-311.
Arulampalam, Wiji, Alison L. Booth and Mark L. Bryan. 2007. Is There a Glass Ceiling overEurope? Exploring the Gender Pay Gap across the Wage Distribution. Industrial and LaborRelations Review 60(2), 163-186.
Bardasi, Elena, and Janet C. Gornick. 2008. Working for Less? Women’s Part-Time Wage Penaltiesacross Countries. Feminist Economics 14(1): 37-72.
Baum, Charles L. 2003. The Effects of Maternity Leave Legislation on Mothers’Labor Supply afterChildbirth.
Baum, Charles L. 2006. The effects of government-mandated family leave on employer family leavepolicies. Contemporary Economic Policy Publisher 24(3): 432-445.
Baker, Michael, Jonathan Gruber, and Kevin Milligan. 2008. Universal Child Care, Maternal LaborSupply, and Family Well-Being. Journal of Political Economy 116(4): 709-745.
Baker, Michael and Kevin Milligan. 2008. How Does Job-Protected Maternity Leave Affect Mothers’Employment? Journal of Labor Economics 22(4): 655-691.
Berger, Lawrence M., Jennifer Hill, and Jane Waldfogel. 2005. Maternity Leave, Early MaternalEmployment, and Child Health and Development in the US. The Economic Journal, 115 (Feb-ruary): F29-F47.
22
Berger, Lawrence M., and Jane Waldfogel. 2004. Maternity Leave and the Employment of NewMothers in the United States. Journal of Population Economics 17(2): 331-349.
Bertrand, Marianne, Claudia Goldin, and Lawrence F. Katz. 2010. Dynamics of the Gender Gapfor Young Professionals in the Financial and Corporate Sector. American Economic Journal:Applied Economics, 2(3): 228—55.
Björklund, Anders. 2006. Does Family Policy Affect Fertility? Lessons from Sweden. Journal ofPopulation Economics 19(1): 3-24.
Blau, Francine D., and Jed DeVaro. 2006. New Evidence on Gender Differences in PromotionRates: An Empirical Analysis of a Sample New Hires. National Bureau of Economics Research,Working Paper No. 12321.
Blau, Francine D., and Lawrence M. Kahn. 1992. The Gender Earnings Gap: Learning from Inter-national Comparisons. American Economic Review 82(2), 533-538.
Blau, Francine D., and Lawrence M. Kahn. 1994. Rising Wage Inequality and the U.S. GenderGap. The American Economic Review 84(2): 23-28.
Blau, Francine D., and Lawrence M. Kahn. 2003. Understanding International Differences in theGender Pay Gap. Journal of Labor Economics 21(1): 106-144.
Booth, Alison L., Marco Francesconi, and Jeff Frank. 2001. A sticky floors model of promotion,pay, and gender. European Economic Review 47(2003): 295-322.
Buligescu, Bianca, Denis de Crombrugghey, Gulcin Mentesoglu, and Raymond Montizaanz. 2009.Panel estimates of the wage penalty for maternal leave. Oxford Economic Papers 61, i35—i55.
Cannonier, Colin D. 2011. Essays in health economics and public policy. Ph.D dissertation. De-partment of Economics, Louisiana State University and Agricultural Mechanical College.
Cantor, David, Jane Waldfogel, Jeffrey Kerwin, Mareena M. Wright, Kerry Levin, John Rauch,Tracey Hagerty, and Martha S. Kudela. 2001. Balancing the Needs of Families and Employers:Family and Medical Leave Surveys. Rockville, MD: Westat.
Chatterji, Pinka, Sara Markowitz, and Jeanne Brooks-Gunn. 2011. Early Maternal Employmentand Family Wellbeing. National Bureau of Economic Research, Working Paper No. 17212.
Clemans-Cope, Lisa, Matthew S. Pantell, Cynthia D. Perry, Genevieve M. Kenney, and JenniferE. Pelletier. 2008. Access to and Use of Paid Sick Leave Among Low-Income Families withChildren. Pediatrics 122: e480-e486.
Conover, Abigail E. 2007. Assessing the relationship between income and maternal leave takingunder the 1993 Family and Medical Leave Act. Master’s Thesis. Georgetown Public PolicyInstitute, Georgetown University.
Crittenden, Ann. 2001. The Price of Motherhood: Why the most important job in the world is stillthe least valued. New York, NY: Metropolitan Books.
Garcia-Crespo, Dolores. 2001. Promotions in the Spanish labor market: differences by gender.Oxford Bulletin of Economics and Statistics 63(5): 599-615.
Fass, Sarah. 2009. Paid Leave in the States: A Critical Support for Low-wage Workers and TheirFamilies. National Center for Children in Poverty. Columbia University.
Gregg, Paul, and Jane Waldfogel. 2005. Symposium on Parental Leave, Early Maternal Employmentand Child Outcomes: Introduction. The Economic Journal 115(February): F1-F6.
Glass, Jennifer. 2004.Blessing or a Curse? Work and Occupations 31(3): 367-394.Groot, Wim, and Henriette Maasen van den Brink. 1996. Glass ceilings or dead ends: Job promotionof men and women compared. Economic Letters 53: 221-226.
Han, Wen-Jui, Christopher Ruhm, Jane Waldfogel, and Elizabeth Washbrook. 2011. Public Poli-cies and Women’s Employment after Childbearing, and Child Well-Being. The B.E. Journal ofEconomic Analysis & Policy 11(1), 1935-1682.
23
Hanratty, Maria and Eileen Trzcinski. 2009. Who Benefits from Paid Family Leave? Impact ofExpansions in Canadian Paid Family Leave on Maternal Employment and Transfer Income.Journal of Population Economics 22(3): 693-711.
Henly Samuel E., and Juan M. Sanchez. 2009. The U.S. Establixhment Size Distribution: SecularChanges and Sectoral Decomposition. Economic Quarterly 95: 419-459.
Herman, Alexis M., and Katharine G. Abraham. 1998. Employee Benefits in Medium and LargePrivate Establishments, 1995. Bureau of Labor Statistics Bulletin 2496.
Herman, Alexis M., and Katharine G. Abraham. 1999. Employee Benefits in Small Private Estab-lishments, 1996. Bureau of Labor Statistics Bulletin 2507.
Hersch, Joni, and W. Kip Viscusi. 1996. Gender Differences in Promotions and Wages. IndustrialRelations 35(4): 461-472.
Hochschild, Arlie R. 1997. The Time Bind: When Work Becomes Home and Home Becomes Work.New York, NY: Metropolitan Books.
Houser, Linda. 2012. Pay Matters: The Positive Impacts of Paid Family Leave for Families, Busi-nesses, and the Public. Rutgers Center for Women and Work.
Joshi, Heather, Susan Macran, and Shirley Dex. 1996. Employment after Childbearing andWomen’sSubsequent Labour Force Participation: Evidence from the British 1958 Birth Cohort. Journalof Population Economics 9(3): 325-348.
Kane, Carol K. 1998. State Mandates for Maternity Leave: Impact on Wages, Employment, andAccess to Leave. PhD dissertation. Department of Economics, Boston College.
Klerman, Jacob Alex, and Arleen Leibowitz. 1990. Child Care and Women’s Return to Work afterChildbirth. The American Economic Review 80(2): 284-288.
Klerman, Jacob A., and Arleen Leibowitz. 1994. The Work-Employment Distinction among NewMothers. The Journal of Human Resources 29(2): 277-303.
Lalive, Rafael, and Josef Zweimüller. 2009. How Does Parental Leave Affect Fertility and Return toWork? Evidence from Two Natural Experiments. The Quarterly Journal of Economics 124(3):1363-1402.
Lalive, Rafael, Analía Schlosser, Andreas Steinhauer, and Josef Zweimüller. 2011. Parental Leaveand Mothers’ Careers: The Relative Importance of Job Protection and Cash Benefits. IZADiscussion Paper 5792.
Livingston, Gretchen, and D’Vera Cohn. 2010. The New Demography of American Motherhood.Pew Research Center: Social & Demographic Trends Report.
Manchester, Colleen Flaherty, Lisa M. Leslie, and Tae-Youn Park. Screening for Commitment: TheEffect of Maternity Leave Use on Wages.
Reich, Robert B. 1993. Employee Benefits in Medium and Large Private Establishments, 1991.Bureau of Labor Statistics Bulletin 2422.
Reich, Robert B., and Katharine B. Abraham. 1994. Employee Benefits in Small Private Establish-ments, 1992. Bureau of Labor Statistics Bulletin 2441.
Rönsen, Marit, and Marianne Sundström. 1996. Maternal Employment in Scandinavia: A Com-parison of the After-Birth Employment Activity of Norwegian and Swedish Women. Journal ofPopulation Economics 9(3): 267-285.
Rossin-Slater, Maya, Christopher J. Ruhm, and Jane Waldfogel. 2011. The Effects of California’sPaid Family Leave Program on Mothers’Leave-Taking and Subsequent Labor Market Outcomes.NBER Working Paper No. 17715.
Ruhm, Christopher J. 1998. The Economic Consequences of Parental Leave Mandates: Lessonsfrom Europe. The Quarterly Journal of Economics 113(1): 285-317.
Ruhm Christopher J. 2005. Parental leave and child health. Journal of Health Economics: 19,931—960.
24

Solis, Hilda L., and Keith Hall. 2011. National Compensation Survey: Employee Benefits in theUnited States, March 2011. Bureau of Labor Statistics Bulletin 2771.
Summers, Lawrence. 1989. Some simple economics of mandated benefits. American Economic Re-view 39(2): 177-183.
Tanaka, Sakiko. 2005. Parental Leave and Child Health Across OECD Countries. The EconomicJournal 115 (February): F7—F28.
Waldfogel, Jane. 1995. The Price of Motherhood: Family Status and Women’s Pay in Young BritishCohort. Oxford Economic Papers 47(4): 584-610.41.
Waldfogel, Jane. 1998a. Understanding the “Family Gap” in Pay for Women with Children. TheJournal of Economic Perspectives 12(1): 137-156.
Waldfogel, Jane. 1998b. The Family Gap for Young Women in the United States and Britain: CanMaternity Leave Make a Difference? Journal of Labor of Economics 16(3): 505-545.
Waldfogel, Jane. 1999a. Family leave coverage in the 1990s. Monthly Labor Review 122: 13-21.Waldfogel, Jane. 1999b. The Impact of the Family and Medical Leave Act. Journal of Policy Analysisand Management 18(2): 281-302.
Waldfogel, Jane. 2001. Family and Medical Leave: Evidence from the 2000 Surveys. Monthly LaborReview (September): 17-23.
Waldfogel, Jane. 2009. The Role of Family Policies in Antipoverty Policy. Focus 20(2): 50-55.Walker, James R. 1996. Funding Child Rearing: Child Allowance and Parental Leave. The Futureof Children 6(2): 122-136.
Winter-Ebmer, Rudolf, and Josef Zweimüller. 1997. Unequal Assignment and Unequal Promotionin Job Ladders. Journal of Labor Economics 15(1): 43-71.
Zveglich, Joseph E., and Yana van der Meulen Rodgers. 2003. The Impact of Protective Measuresfor Female Workers Journal of Labor Economics 21(3): 533-555.
References for State Policy ReformsGeneral ReferencesNational Partnership for Women & Families (2005) Expecting Better: A State-by-State Analysisof Parental Leave Programs.
Shimabukuro, Jon and Cassandra LaNel Foley (2008) State Family and Medical Leave Laws.Strumberg, Robert, Janice Steinschneider and George Elser (1989) State Legislative Sourcebookon Family & Medical Leave.
Stutts, John R. and Frank Heiland (2006) Diversity in U.S. Family and Medical Leave Policy: AComparison of Federal and State Legislation between 1972 and 2005.
United States Department of Labor: Women’s Bureau (1993) State Maternity/Family Leave Law.Women’s Legal Defense Fund (1994) State Family Leave Laws and Regulations.State Specific ReferencesCalifornia: Cal. Gov’t Code § 12945.2Connecticut: Conn. Gen. Stat. §§ 31-51kk and 31-51llDistrict of Columbia: D.C. Code §§ 32-501 and 32-502Hawaii: Haw. Rev. Stat. § 398-3Maine: Me. Rev. Stat. Ann. tit. 26, §§ 843 and 844Massachusetts: Mass. Ann. Laws ch. 149, § 105DMinnesota: Minn. Stat. §§ 18.940 and 181.941New Jersey: N.J. Stat. Ann. §§ 34:11B-3 and B-4Oregon: Or. Rev. Stat. §§§§ 659A.153 and 659A.156 and 659A.159 and 6569A.162Rhode Island: R.I. Gen. Laws §§ 28-48-1 and 28-48-2Tennessee: Tenn. Code Ann. § 4-21-408
25

Vermont: Vt. Stat. Ann. tit. 21, §§ 471 and 472Washington: Wash. Rev. Code §§§ 49.78.020 and 49.78.220 and 49.78.240Wisconsin: Wis. Stat. § 103.10
26
State Date of Policy Firm size Tenure Hours
Leave
length
Total
Births
Before
Policy
After
Policy
CA January, 1992 50 12 1,250 12 441 298 143
CT July, 1990 75 12 1,000 16 107 54 53
DC April, 1991 50 12 1,000 16 14 10 4
LA January, 1987 26 any any 6 40 11 29
MA October, 1972 6 3 full 8 52 0 52
ME April, 1988 25 12 any 10 2 1 1
MN August, 1987 21 12 50% 6 64 24 40
NJ April, 1990 75 12 1,000 12 114 47 67
OR January, 1988 25 3 any 12 22 9 13
RI July, 1987 50 12 1,560 13 2 0 2
TN January, 1988 100 12 full 16 51 17 34
VT July, 1992 10 12 1,560 12 3 3 0
WA September, 1989 100 12 1,820 12 56 24 32
WI April, 1988 50 12 1,000 6 137 41 96
ME 1995 15 12 any 10 2 1 1
OR 1995 25 6 600 12 15 6 9
* Sources: See the List for Policy References at the end of the paper.
Table 1: Eligibility Criteria for State Parental Leave Policies Enacted Before and After the FMLA,
with Corresponding NLSY Sample Sizes by State
I. Parental Leave Policies Enacted Prior to the FMLA
II. Parental Leave Policies Enacted After the FMLA
* Notes: The policies enacted after the FMLA include only those that have more generous
provisions than required by the FMLA.
Variable Mean Min Max St.D.
Mothers age at birth 26.30 21 42.00 3.76
Number of births in 1985-1999 1.64 1 5.00 0.72
Parental leave legislation 0.38 0 1.00 0.49
Eligible for parental leave at birth 0.17 0 1.00 0.37
Takes any parental leave 0.53 0 1.00 0.49
Length of parental leave taken 5.35 0 39.71 7.26
Employer offers paid leave 0.69 0 1.00 0.46
Education: College 0.39 0 1.00 0.49
Education: HS 0.55 0 1.00 0.50
Married 0.85 0 1.00 0.36
Spouse's education at least HS 0.77 0 1.00 0.42
Family income 9.38 0 14.42 3.93
Number of children aged 0-2 0.37 0 4.00 0.54
Number of children aged 3-5 0.25 0 3.00 0.48
Black 0.06 0 1.00 0.24
Hispanic 0.11 0 1.00 0.31
Mothers hourly wage before birth 2.28 -4.31 7.27 1.10
Employed in the 12 months after birth 0.78 0 1.00 0.41
Earnings after birth 10.78 6.02 12.51 0.90
Hourly wage after birth 2.62 -4.33 4.42 0.60
Ever promoted after birth 0.15 0 1.00 0.35
Tenure with employer 190.83 1 938.00 182.23
Hours worked previous year 1723.25 12 8320.00 696.42
Employer size > 50 0.51 0 1.00 0.50
Number of respondents 1,831
Number of observations (births) 2,493
Table 2: Descriptive Statistics for the NLSY Sample of Women Who Gave a Birth in 1985-
1999
* Sources: NLSY data on births between January 1, 1986 and and December 31, 1999.
* Notes: Includes births to mothers working for a private comoany prior to the birth.
Excludes persons who had worked for the military or the government during the year
prior to birth, were self-employed, or had missing information for any of the key variables.
Group of States
Total
Births
Before
State Policy
and FMLA
After State
Policy,
Before
FMLA After FMLA
States with Pre-FMLA Parental
Leave Policies 772 319 243 210
States without Pre-FMLA
Parental Leave Policies 1,721 1,308 n/a 413
All States 2,493 1,627 243 623
Table 3: NLSY Data in States that Adopted Parental Leave Policies Prior to the
Introduction of the FMLA Versus Other States
* Notes: See table 2. Excludes observations with missing values on key variables.
Includes births taking place in 1986-1999.

(1) (2) (3) (4)
Quartile 1 Quartile 2 Quartile 3 Quartile 4
Eligible 27% 48% 61% 51%
Not Eligible 73% 51% 39% 49%
Of those not eligible:
Tenure only not met 11% 13% 9% 13%
Hours only not met 2% 6% 4% 7%
Firm size only not met 32% 28% 42% 60%
Tenure & hours not met 11% 6% 4% 0%
Tenure & firm size not met 23% 22% 4% 13%
Hours & firm size not met 7% 13% 17% 7%
No criteria met 14% 13% 21% 0%
Tenure < 12 months 43% 28% 15% 13%
Hours < 1,250 25% 20% 18% 7%
Firm size < 50 55% 39% 33% 39%
Table 4a: Eligibility for Parental Leaves under the State Parental Leave Policy (pre-FMLA) and
Criteria for Eligibility by Family Income Quartile.
* Notes: See table 2. NLSY data on births between January 1, 1986 and August 7, 1993. Excluding
persons where firm size, tenure or hours worked is missing. Quartile defined by family income.
Overall, of those not eligible:
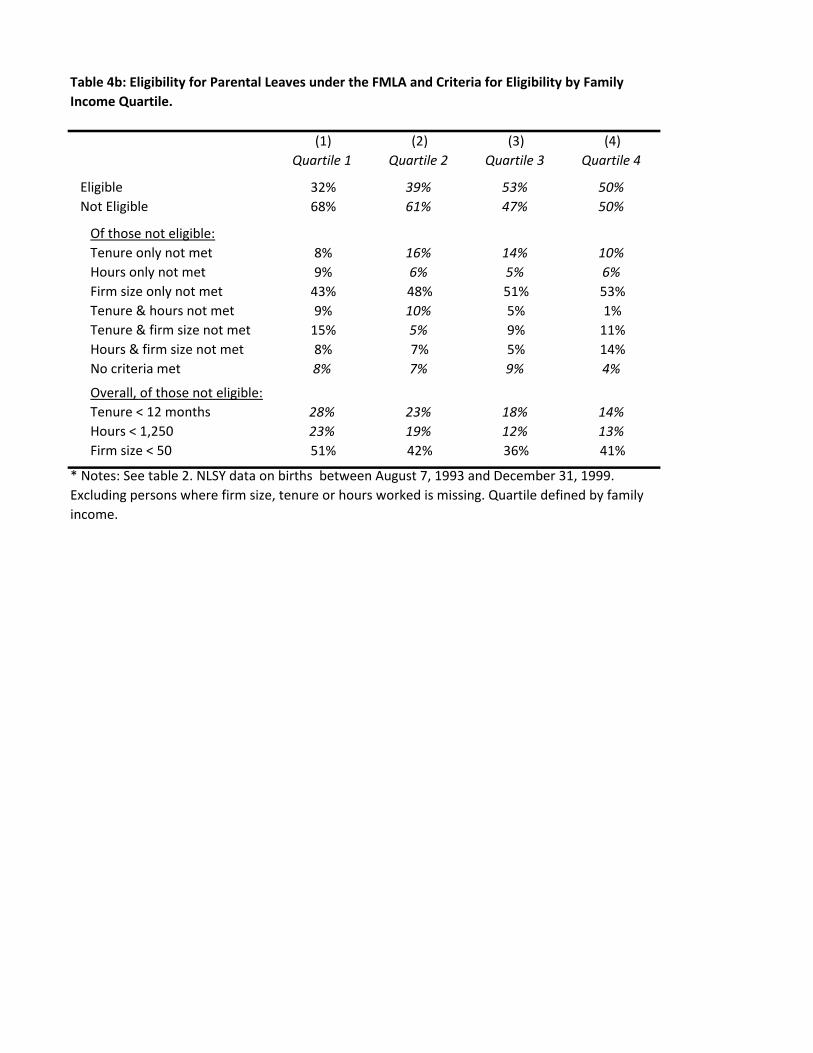
(1) (2) (3) (4)
Quartile 1 Quartile 2 Quartile 3 Quartile 4
Eligible 32% 39% 53% 50%
Not Eligible 68% 61% 47% 50%
Of those not eligible:
Tenure only not met 8% 16% 14% 10%
Hours only not met 9% 6% 5% 6%
Firm size only not met 43% 48% 51% 53%
Tenure & hours not met 9% 10% 5% 1%
Tenure & firm size not met 15% 5% 9% 11%
Hours & firm size not met 8% 7% 5% 14%
No criteria met 8% 7% 9% 4%
Tenure < 12 months 28% 23% 18% 14%
Hours < 1,250 23% 19% 12% 13%
Firm size < 50 51% 42% 36% 41%
Table 4b: Eligibility for Parental Leaves under the FMLA and Criteria for Eligibility by Family
Income Quartile.
* Notes: See table 2. NLSY data on births between August 7, 1993 and December 31, 1999.
Excluding persons where firm size, tenure or hours worked is missing. Quartile defined by family
income.
Overall, of those not eligible:
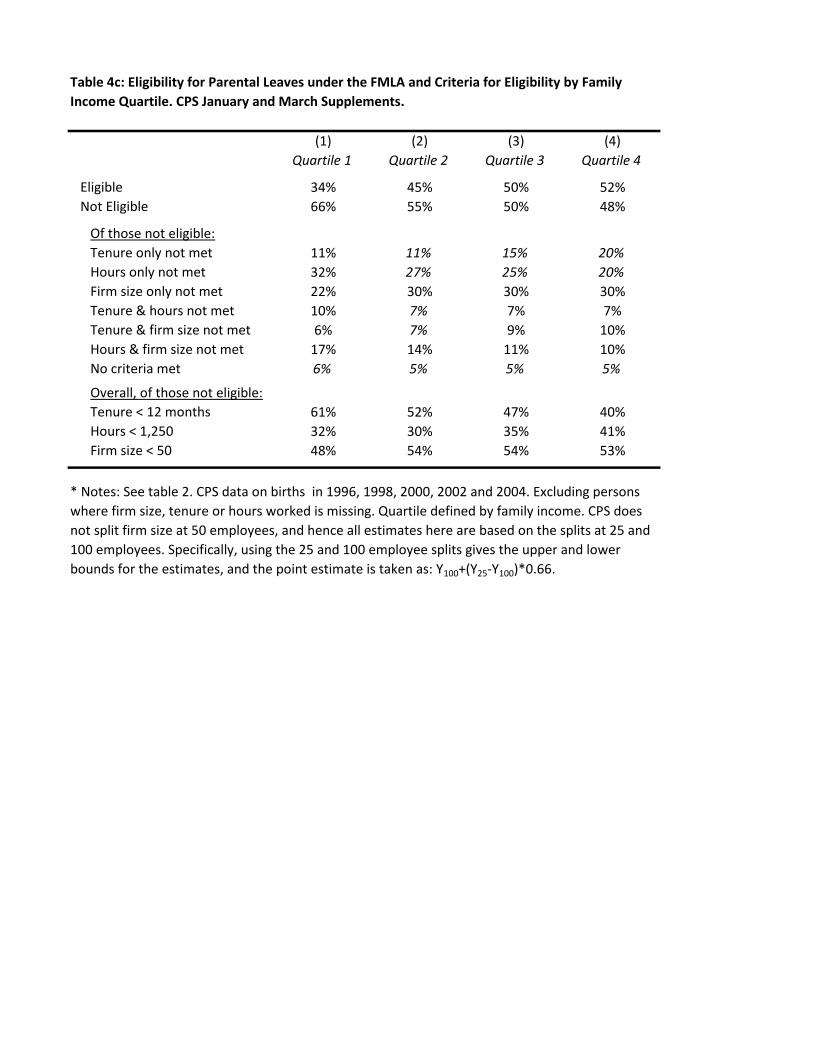
(1) (2) (3) (4)
Quartile 1 Quartile 2 Quartile 3 Quartile 4
Eligible 34% 45% 50% 52%
Not Eligible 66% 55% 50% 48%
Of those not eligible:
Tenure only not met 11% 11% 15% 20%
Hours only not met 32% 27% 25% 20%
Firm size only not met 22% 30% 30% 30%
Tenure & hours not met 10% 7% 7% 7%
Tenure & firm size not met 6% 7% 9% 10%
Hours & firm size not met 17% 14% 11% 10%
No criteria met 6% 5% 5% 5%
Tenure < 12 months 61% 52% 47% 40%
Hours < 1,250 32% 30% 35% 41%
Firm size < 50 48% 54% 54% 53%
Table 4c: Eligibility for Parental Leaves under the FMLA and Criteria for Eligibility by Family
Income Quartile. CPS January and March Supplements.
Overall, of those not eligible:
* Notes: See table 2. CPS data on births in 1996, 1998, 2000, 2002 and 2004. Excluding persons
where firm size, tenure or hours worked is missing. Quartile defined by family income. CPS does
not split firm size at 50 employees, and hence all estimates here are based on the splits at 25 and
100 employees. Specifically, using the 25 and 100 employee splits gives the upper and lower
bounds for the estimates, and the point estimate is taken as: Y100+(Y25-Y100)*0.66.

(1) (2) (3) (4)
Quartile 1 Quartile 2 Quartile 3 Quartile 4
Employer provides paid leave 54% 54% 66% 73%
Takes paid leave 19% 19% 26% 43%
Takes any leave 38% 35% 40% 56%
Leave length 4.7 3.6 3.9 7.3
Employer provides paid leave 40% 37% 51% 64%
Takes paid leave 9% 5% 23% 33%
Takes any leave 28% 28% 44% 53%
Leave length 3.4 2.2 3.4 8.0
Employer provides paid leave 69% 73% 80% 80%
Takes paid leave 31% 35% 29% 50%
Takes any leave 50% 46% 37% 59%
Leave length 6.3 5.2 4.4 6.7
Employer provides paid leave 55% 66% 80% 84%
Takes paid leave 28% 33% 43% 66%Takes any leave 40% 52% 62% 79%
Leave length 3.7 6.4 6.6 8.7
Employer provides paid leave 43% 53% 60% 76%
Takes paid leave 27% 20% 24% 48%
Takes any leave 43% 44% 56% 64%
Leave length 3.5 6 4.6 7.1
Employer provides paid leave 74% 75% 94% 89%
Takes paid leave 30% 42% 56% 78%
Takes any leave 35% 58% 67% 89%
Leave length 3.8 6.6 8.0 9.7
Table 5a: Provision and Usage of Parental Leaves Before and After the State policy reforms (pre-
FMLA) by Family Income Quartile.
Pre-Reform All Firms
Post-Reform
* Notes: See table 2. NLSY data on births between January 1, 1986 and and August 6, 1993, in states
that implemented a reform prior to the FMLA. Excluding persons where firm size, tenure or hours
worked is missing, as well as those where no family incole is reported. Quartile defined by family
income. Small firms have fewer than 50 employees, while large firms have at least 50 employees.
Pre-Reform Small Firms
Pre-Reform Large Firms
Post-Reform Small Firms
Post-Reform Large Firms

(1) (2) (3) (4)
Quartile 1 Quartile 2 Quartile 3 Quartile 4
Employer provides paid leave 55% 64% 65% 75%
Takes paid leave 22% 26% 35% 45%
Takes any leave 36% 43% 50% 59%
Leave length 3.8 4.5 4.9 5.7
Employer provides paid leave 46% 47% 53% 64%
Takes paid leave 17% 16% 22% 31%
Takes any leave 30% 33% 38% 52%
Leave length 3.1 3.5 3.6 4.7
Employer provides paid leave 69% 79% 78% 84%
Takes paid leave 29% 35% 47% 57%
Takes any leave 44% 52% 62% 65%
Leave length 4.7 5.3 6.2 6.5
Employer provides paid leave 60% 70% 88% 82%
Takes paid leave 27% 38% 54% 58%Takes any leave 45% 47% 67% 66%
Leave length 3.4 4.6 7.1 5.8
Employer provides paid leave 54% 53% 85% 64%
Takes paid leave 30% 28% 48% 49%
Takes any leave 50% 35% 60% 58%
Leave length 3.2 2.5 6.4 4.2
Employer provides paid leave 67% 82% 90% 95%
Takes paid leave 24% 45% 59% 64%
Takes any leave 39% 55% 71% 73%
Leave length 3.7 6 7.6 7.1
Table 5b: Provision and Usage of Parental Leaves Before and After the FMLA by Family Income
Quartile.
* Notes: See table 2. NLSY data on births between August 7, 1993 and December 31, 1999, in states
that had not implemented a reform prior to the FMLA. Excluding persons where firm size, tenure or
hours worked is missing, as well as those where no family incole is reported. Quartile defined by
family income. Small firms have fewer than 50 employees, while large firms have at least 50
employees.
Pre-FMLA
Post-FMLA
Pre-Reform Small Firms
Pre-Reform Large Firms
Post-Reform Small Firms
Post-Reform Large Firms
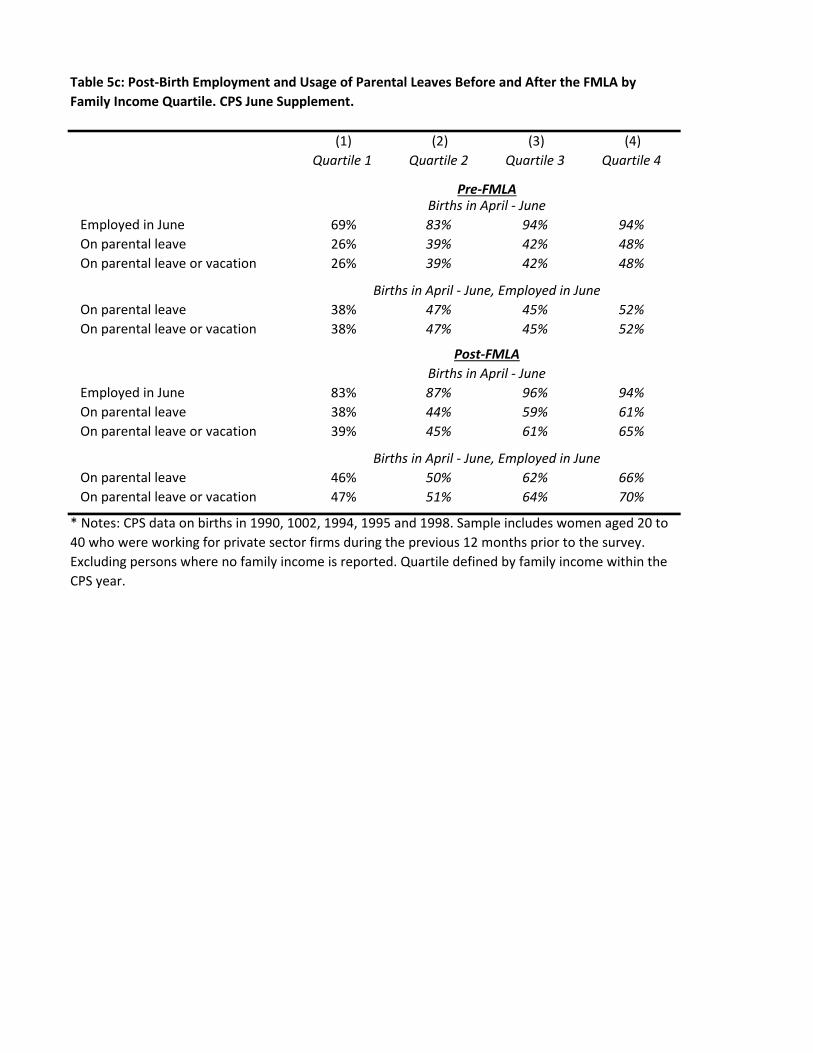
(1) (2) (3) (4)
Quartile 1 Quartile 2 Quartile 3 Quartile 4
Employed in June 69% 83% 94% 94%
On parental leave 26% 39% 42% 48%
On parental leave or vacation 26% 39% 42% 48%
On parental leave 38% 47% 45% 52%
On parental leave or vacation 38% 47% 45% 52%
Employed in June 83% 87% 96% 94%
On parental leave 38% 44% 59% 61%
On parental leave or vacation 39% 45% 61% 65%
On parental leave 46% 50% 62% 66%
On parental leave or vacation 47% 51% 64% 70%
* Notes: CPS data on births in 1990, 1002, 1994, 1995 and 1998. Sample includes women aged 20 to
40 who were working for private sector firms during the previous 12 months prior to the survey.
Excluding persons where no family income is reported. Quartile defined by family income within the
CPS year.
Pre-FMLA
Post-FMLA
Table 5c: Post-Birth Employment and Usage of Parental Leaves Before and After the FMLA by
Family Income Quartile. CPS June Supplement.
Births in April - June
Births in April - June, Employed in June
Births in April - June
Births in April - June, Employed in June

(1) (2) (3) (4) (5) (6)
Meet Criteria Meet Criteria Any leave Meet Criteria Meet Criteria Any leave
Quartile 2 0.104*** 0.156***
(0.026) (0.049)
Quartile 3 0.136*** 0.229***
(0.028) (0.053)
Quartile 4 0.165*** 0.189***
(0.030) (0.057)
Ln(Family Income) -0.038*** -0.025* -0.405*** -0.286**
(0.015) (0.015) (0.115) (0.112)
Ln(Family Income)2
0.004*** 0.003** 0.071*** 0.049**
(0.001) (0.001) (0.020) (0.020)
Ln(Family Income)3-0.003*** -0.002**
(0.001) (0.001)
Estimated effect at the:
25th centile 0.024 -0.014 0.052 -0.038
Median 0.072 0.011 0.145 0.007
75th centile 0.101 0.026 0.170 0.015
Number of Observations 2,493 2,493 2,493 866 866 866
Adjusted R2
0.110 0.111 0.158 0.105 0.106 0.137
* Notes:See table 2. All regressions include controls for race, schooling, age group, marital status, spouse's schooling, number of
children ages 0-2 and 3-5, total family income, mother's hourly wage prior to birth and state unemployment rate. The regressions
also include state and year of birth dummies. Robust standard errors in parentheses.
Table 6: Eligibility Criteria and Parental Leave Taking by Family Income Quartile
Births after state reform or FMLABirths during 1986-1999

FMLA Policy Change
(1) (2) (3) (4) (5) (6) (7) (8) (9)
Any Leave Paid Leave Leave Length Any Leave Paid Leave Leave Length Any Leave Paid Leave Leave Length
Post-Reform 0.179** 0.089 5.000*** 0.146 -0.028 4.052** 0.024 0.008 -0.576(0.098) (0.093) (1.484) (0.122) (0.115) (1.797) (0.091) (0.084) (1.373)
Ln(Family Income) -0.232*** -0.209** -2.485** -0.205** -0.194** -3.154*** -0.048*** -0.053*** -0.639**
(0.069) (0.065) (1.044) (0.084) (0.079) (1.237) (0.018) (0.016) (0.266)
Ln(Family Income)2 0.003** 0.035*** 0.413** 0.035** 0.033** 0.558** 0.005*** 0.005*** 0.057**(0.001) (0.011) (0.190) (0.015) (0.014) (0.221) (0.002) (0.001) (0.024)
Ln(Family Income)3 -0.002*** -0.001*** -0.017** -0.002** -0.001** -0.002**
(0.001) (0.001) (0.008) (0.001) (0.000) (0.001)
Income * Post-Reform -0.005 -0.003 -0.007 -0.001 0.006 0.085 0.001 0.002 0.140
(0.005) (0.005) (0.079) (0.007) (0.006) (0.096) (0.007) (0.007) (0.120)
Reform State -0.042 0.094 -3.603
(0.365) (0.337) (5.514)
Estimated effect at the:
25th centile -0.025 -0.033 -0.608 -0.021 -0.029 -0.477 -0.034 -0.042 -0.864
Median 0.034 0.030 0.076 0.035 0.025 0.123 0.013 0.009 -0.337
75th centile 0.055 0.054 0.331 0.054 0.044 0.254 0.042 0.040 -0.009
Number of Observations 2,493 2,493 2,493 1,721 1,721 1,721 1,866 1,866 1,866
Adjusted R2 0.161 0.180 0.108 0.158 0.177 0.097 0.162 0.185 0.093
F-statistic 7.39 8.31 5.00 6.29 7.05 4.04 6.42 7.39 3.89
Table 7: Parental Leave Taking and Family Income: FMLA and State Reforms
State Policy Changes
* Notes: See table 2. All regressions include controls for race, schooling, age group, marital status, spouse's schooling, number of children ages 0-2 and 3-5, total
family income, mother's hourly wage prior to birth and state unemployment rate. The regressions also include state and year of birth dummies. Robust
standard errors in parentheses.
All States Non-Reform States Pre-FMLA Births

(1) (2) (3)
Any Leave Paid Leave Leave Length
Post-FMLA 0.168* 0.079 4.913***(0.099) (0.094) (1.506)
Reform State -0.326 -0.210 -5.596
(0.360) (0.341) (5.477)
Post-FMLA * Reform State 0.031 0.026 0.240(0.047) (0.044) (0.709)
Post-FMLA 0.148 0.064 4.386***
(0.098) (0.092) (1.504)
Meet Criteria 0.165*** 0.221*** 1.921***
(-0.018) (0.022) (0.355)
Post-FMLA * Meet Criteria -0.018 -0.058 0.282
(0.044) (0.041) (0.673)
Post-FMLA 0.140 0.064 4.403***
(0.100) (0.094) (1.517)
Medium-Sized Firm 0.040 0.081*** 0.287
(0.026) (0.024) (0.385)
Post-FMLA * Medium-Sized Firm 0.057 0.002 1.065
(0.049) (0.047) (0.750)
Post-FMLA 0.198** 0.110 5.049***
(0.097) (0.092) (1.479)
Large Firm 0.159*** 0.194*** 1.784***
(0.028) (0.026) (0.427)
Post-FMLA * Large Firm -0.066 -0.055 0.936
(0.054) (0.051) (0.826)
Post-FMLA 0.123 0.069 5.100***
(0.088) (0.084) (1.345)
Low Family Income -0.079*** -0.061*** -0.448
(0.024) (0.023) (0.370)
Post-FMLA * Low Income 0.081* 0.009 -0.142
(0.048) (0.045) (0.727)
C. Medium Sized Firms (100-499)
D. Large Firms (500-)
E. Low Family Income
Table 8: Parental Leave Taking: Effects of the FMLA Across Sub-Groups
* Notes: See table 2. All regressions include controls for race, schooling, age group,
marital status, spouse's schooling, number of children ages 0-2 and 3-5, total family
income, mother's hourly wage prior to birth and state unemployment rate. The
regressions also include state and year of birth dummies. Robust standard errors in
parentheses.
FMLA Policy Change - All States
A. By State Reform Status
B. By FMLA Eligibility Criteria
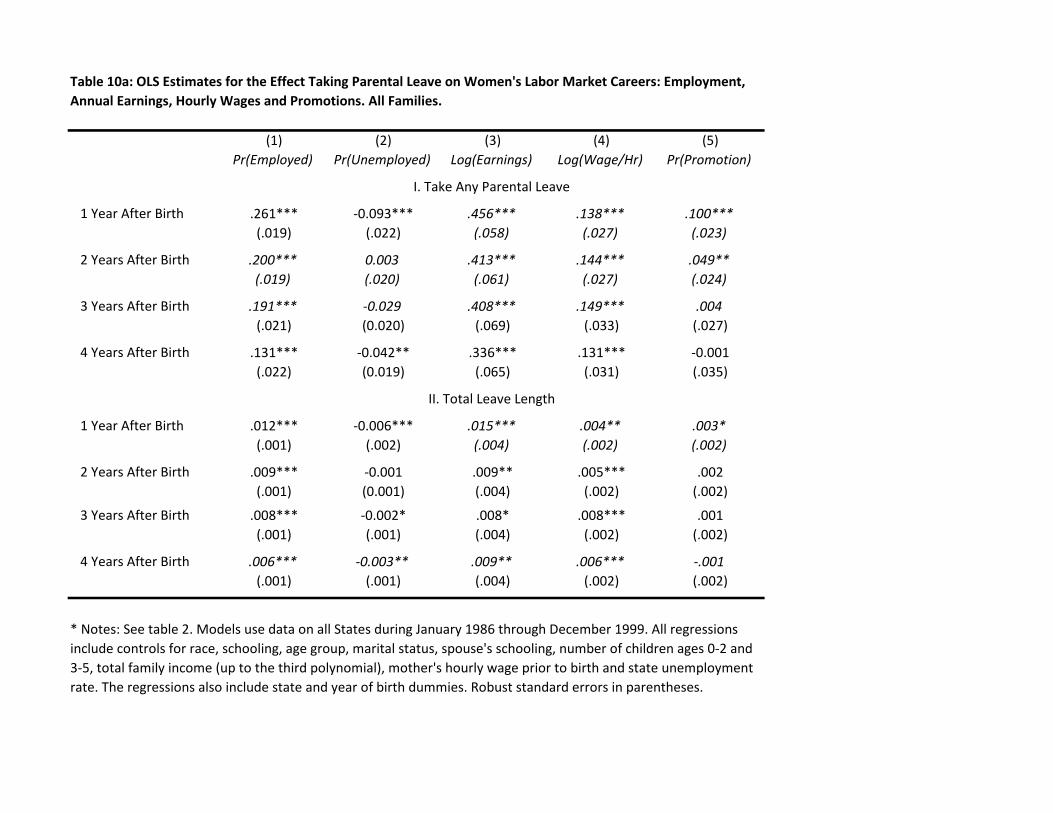
(1) (2) (3) (4) (5)
Pr(Employed) Pr(Unemployed) Log(Earnings) Log(Wage/Hr) Pr(Promotion)
1 Year After Birth .261*** -0.093*** .456*** .138*** .100***
(.019) (.022) (.058) (.027) (.023)
2 Years After Birth .200*** 0.003 .413*** .144*** .049**
(.019) (.020) (.061) (.027) (.024)
3 Years After Birth .191*** -0.029 .408*** .149*** .004
(.021) (0.020) (.069) (.033) (.027)
4 Years After Birth .131*** -0.042** .336*** .131*** -0.001
(.022) (0.019) (.065) (.031) (.035)
1 Year After Birth .012*** -0.006*** .015*** .004** .003*
(.001) (.002) (.004) (.002) (.002)
2 Years After Birth .009*** -0.001 .009** .005*** .002
(.001) (0.001) (.004) (.002) (.002)
3 Years After Birth .008*** -0.002* .008* .008*** .001
(.001) (.001) (.004) (.002) (.002)
4 Years After Birth .006*** -0.003** .009** .006*** -.001
(.001) (.001) (.004) (.002) (.002)
* Notes: See table 2. Models use data on all States during January 1986 through December 1999. All regressions
include controls for race, schooling, age group, marital status, spouse's schooling, number of children ages 0-2 and
3-5, total family income (up to the third polynomial), mother's hourly wage prior to birth and state unemployment
rate. The regressions also include state and year of birth dummies. Robust standard errors in parentheses.
I. Take Any Parental Leave
II. Total Leave Length
Table 10a: OLS Estimates for the Effect Taking Parental Leave on Women's Labor Market Careers: Employment,
Annual Earnings, Hourly Wages and Promotions. All Families.

(1) (2) (3) (4) (5)
Pr(Employed) Pr(Unemployed) Log(Earnings) Log(Wage/Hr) Pr(Promotion)
1 Year After Birth 0.254*** -0.140*** 0.524*** 0.175*** 0.090***
(0.028) (0.035) (0.098) (0.038) (0.033)
2 Years After Birth 0.196*** -0.003 0.433*** 0.118*** 0.066**
(0.028) (0.033) (0.107) (0.036) (0.034)
3 Years After Birth 0.200*** -0.057* 0.522*** 0.191*** -0.012
(0.031) (0.032) (0.113) (0.048) (0.041)
4 Years After Birth 0.126*** -0.085*** 0.147 0.115*** 0.003
(0.032) (0.031) (0.109) (0.040) (0.054)
1 Year After Birth 0.011*** -0.009*** 0.016*** 0.006** 0.001
(0.002) (0.002) (0.006) (0.002) (0.002)
2 Years After Birth 0.010*** -0.001 0.006 0.003 0.005**
(0.002) (0.002) (0.007) (0.002) (0.002)
3 Years After Birth 0.010*** -0.003 0.004 0.009*** -0.001
(0.002) (0.002) (0.006) (0.003) (0.002)
4 Years After Birth 0.005*** -0.004** 0.003 0.006** 0.001
(0.002) (0.002) (0.007) (0.003) (0.004)
Table 10b: OLS Estimates for the Effect Taking Parental Leave on Women's Labor Market Careers: Employment,
Annual Earnings, Hourly Wages and Promotions. Low-Income Families.
I. RHS = Take Any Parental Leave
II. RHS = Total Leave Length
* Notes: See table 2. Models use data on all States during January 1986 through December 1999. Sample includes
families in the bottom 50% of the family income distribution. All regressions include controls for race, schooling,
age group, marital status, spouse's schooling, number of children ages 0-2 and 3-5, total family income (up to the
third polynomial), mother's hourly wage prior to birth and state unemployment rate. The regressions also include
state and year of birth dummies. Robust standard errors in parentheses.
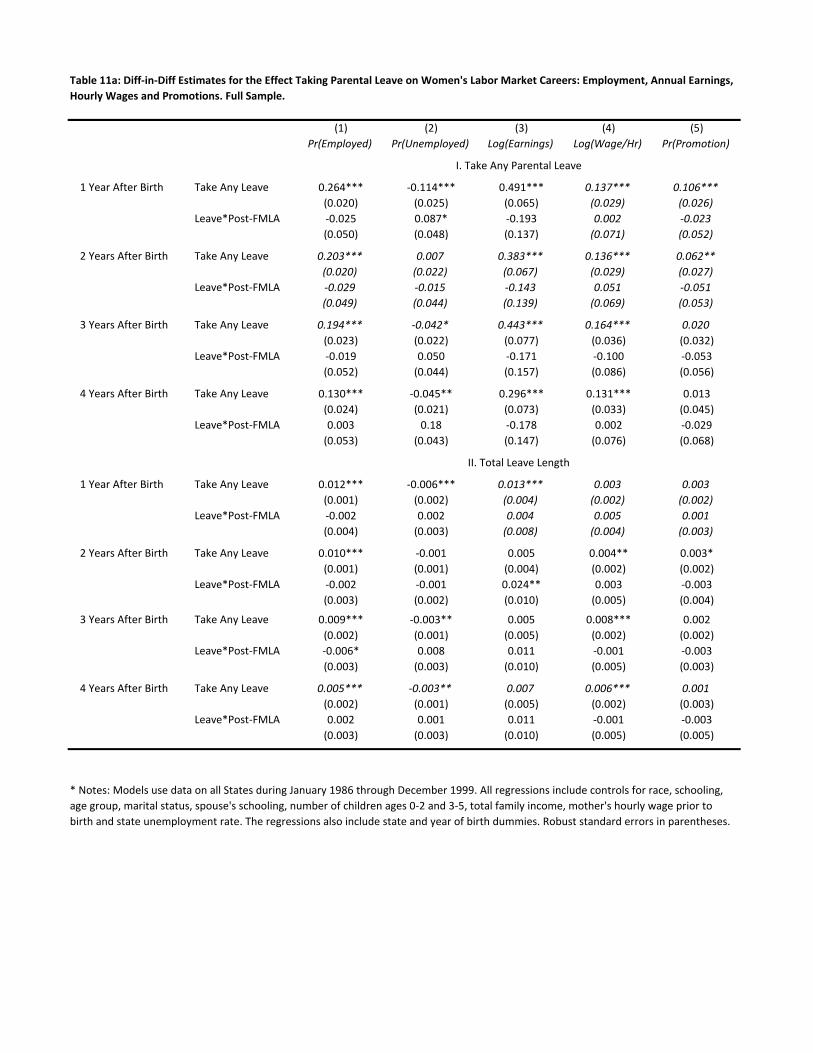
(1) (2) (3) (4) (5)
Pr(Employed) Pr(Unemployed) Log(Earnings) Log(Wage/Hr) Pr(Promotion)
1 Year After Birth Take Any Leave 0.264*** -0.114*** 0.491*** 0.137*** 0.106***
(0.020) (0.025) (0.065) (0.029) (0.026)
Leave*Post-FMLA -0.025 0.087* -0.193 0.002 -0.023
(0.050) (0.048) (0.137) (0.071) (0.052)
2 Years After Birth Take Any Leave 0.203*** 0.007 0.383*** 0.136*** 0.062**
(0.020) (0.022) (0.067) (0.029) (0.027)
Leave*Post-FMLA -0.029 -0.015 -0.143 0.051 -0.051
(0.049) (0.044) (0.139) (0.069) (0.053)
3 Years After Birth Take Any Leave 0.194*** -0.042* 0.443*** 0.164*** 0.020
(0.023) (0.022) (0.077) (0.036) (0.032)
Leave*Post-FMLA -0.019 0.050 -0.171 -0.100 -0.053
(0.052) (0.044) (0.157) (0.086) (0.056)
4 Years After Birth Take Any Leave 0.130*** -0.045** 0.296*** 0.131*** 0.013
(0.024) (0.021) (0.073) (0.033) (0.045)
Leave*Post-FMLA 0.003 0.18 -0.178 0.002 -0.029
(0.053) (0.043) (0.147) (0.076) (0.068)
1 Year After Birth Take Any Leave 0.012*** -0.006*** 0.013*** 0.003 0.003
(0.001) (0.002) (0.004) (0.002) (0.002)
Leave*Post-FMLA -0.002 0.002 0.004 0.005 0.001
(0.004) (0.003) (0.008) (0.004) (0.003)
2 Years After Birth Take Any Leave 0.010*** -0.001 0.005 0.004** 0.003*
(0.001) (0.001) (0.004) (0.002) (0.002)
Leave*Post-FMLA -0.002 -0.001 0.024** 0.003 -0.003
(0.003) (0.002) (0.010) (0.005) (0.004)
3 Years After Birth Take Any Leave 0.009*** -0.003** 0.005 0.008*** 0.002
(0.002) (0.001) (0.005) (0.002) (0.002)
Leave*Post-FMLA -0.006* 0.008 0.011 -0.001 -0.003
(0.003) (0.003) (0.010) (0.005) (0.003)
4 Years After Birth Take Any Leave 0.005*** -0.003** 0.007 0.006*** 0.001
(0.002) (0.001) (0.005) (0.002) (0.003)
Leave*Post-FMLA 0.002 0.001 0.011 -0.001 -0.003
(0.003) (0.003) (0.010) (0.005) (0.005)
Table 11a: Diff-in-Diff Estimates for the Effect Taking Parental Leave on Women's Labor Market Careers: Employment, Annual Earnings,
Hourly Wages and Promotions. Full Sample.
I. Take Any Parental Leave
II. Total Leave Length
* Notes: Models use data on all States during January 1986 through December 1999. All regressions include controls for race, schooling,
age group, marital status, spouse's schooling, number of children ages 0-2 and 3-5, total family income, mother's hourly wage prior to
birth and state unemployment rate. The regressions also include state and year of birth dummies. Robust standard errors in parentheses.
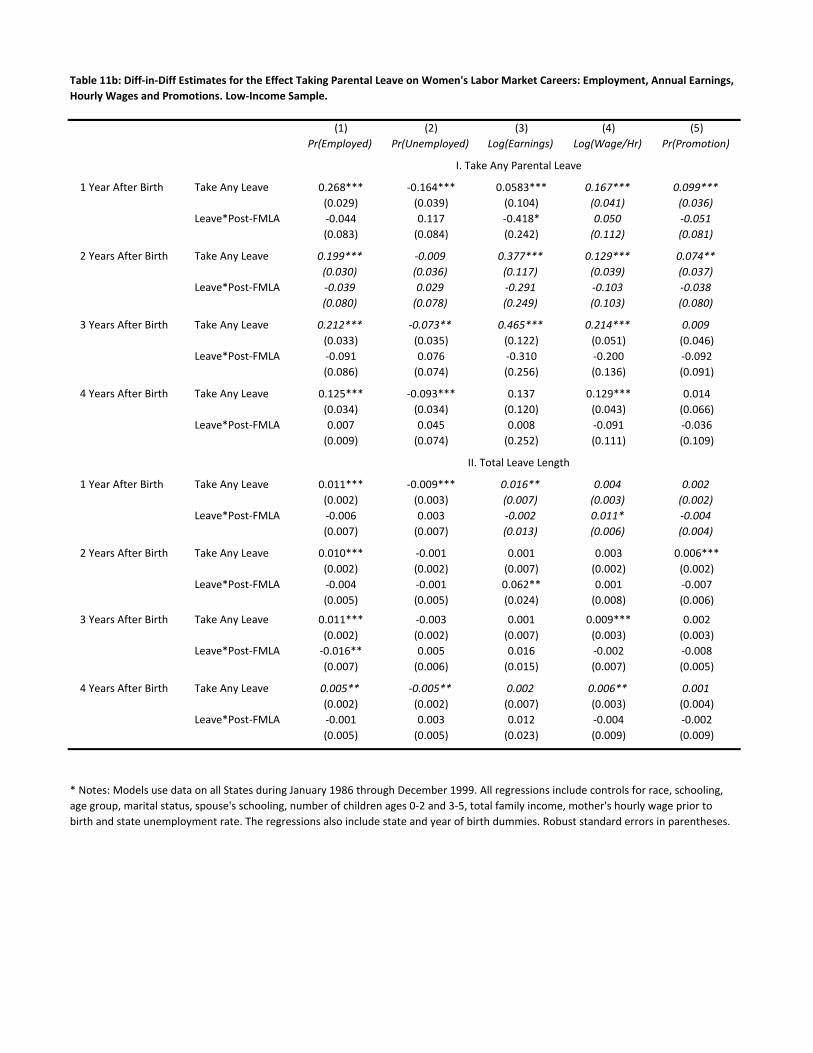
(1) (2) (3) (4) (5)
Pr(Employed) Pr(Unemployed) Log(Earnings) Log(Wage/Hr) Pr(Promotion)
1 Year After Birth Take Any Leave 0.268*** -0.164*** 0.0583*** 0.167*** 0.099***
(0.029) (0.039) (0.104) (0.041) (0.036)
Leave*Post-FMLA -0.044 0.117 -0.418* 0.050 -0.051
(0.083) (0.084) (0.242) (0.112) (0.081)
2 Years After Birth Take Any Leave 0.199*** -0.009 0.377*** 0.129*** 0.074**
(0.030) (0.036) (0.117) (0.039) (0.037)
Leave*Post-FMLA -0.039 0.029 -0.291 -0.103 -0.038
(0.080) (0.078) (0.249) (0.103) (0.080)
3 Years After Birth Take Any Leave 0.212*** -0.073** 0.465*** 0.214*** 0.009
(0.033) (0.035) (0.122) (0.051) (0.046)
Leave*Post-FMLA -0.091 0.076 -0.310 -0.200 -0.092
(0.086) (0.074) (0.256) (0.136) (0.091)
4 Years After Birth Take Any Leave 0.125*** -0.093*** 0.137 0.129*** 0.014
(0.034) (0.034) (0.120) (0.043) (0.066)
Leave*Post-FMLA 0.007 0.045 0.008 -0.091 -0.036
(0.009) (0.074) (0.252) (0.111) (0.109)
1 Year After Birth Take Any Leave 0.011*** -0.009*** 0.016** 0.004 0.002
(0.002) (0.003) (0.007) (0.003) (0.002)
Leave*Post-FMLA -0.006 0.003 -0.002 0.011* -0.004
(0.007) (0.007) (0.013) (0.006) (0.004)
2 Years After Birth Take Any Leave 0.010*** -0.001 0.001 0.003 0.006***
(0.002) (0.002) (0.007) (0.002) (0.002)
Leave*Post-FMLA -0.004 -0.001 0.062** 0.001 -0.007
(0.005) (0.005) (0.024) (0.008) (0.006)
3 Years After Birth Take Any Leave 0.011*** -0.003 0.001 0.009*** 0.002
(0.002) (0.002) (0.007) (0.003) (0.003)
Leave*Post-FMLA -0.016** 0.005 0.016 -0.002 -0.008
(0.007) (0.006) (0.015) (0.007) (0.005)
4 Years After Birth Take Any Leave 0.005** -0.005** 0.002 0.006** 0.001
(0.002) (0.002) (0.007) (0.003) (0.004)
Leave*Post-FMLA -0.001 0.003 0.012 -0.004 -0.002
(0.005) (0.005) (0.023) (0.009) (0.009)
Table 11b: Diff-in-Diff Estimates for the Effect Taking Parental Leave on Women's Labor Market Careers: Employment, Annual Earnings,
Hourly Wages and Promotions. Low-Income Sample.
I. Take Any Parental Leave
II. Total Leave Length
* Notes: Models use data on all States during January 1986 through December 1999. All regressions include controls for race, schooling,
age group, marital status, spouse's schooling, number of children ages 0-2 and 3-5, total family income, mother's hourly wage prior to
birth and state unemployment rate. The regressions also include state and year of birth dummies. Robust standard errors in parentheses.

Figure 1: Parental Leave Mandates by Country: Leave Length by Type
0
100
200
# Weeks Unpaid Leave
# Weeks Paid Leave (FTE)
350
318 312
170
163
148
116
80
70 69 6660 58
52 5248
43 4238
24
14
52