parent presentation common core/ essential standards...
TRANSCRIPT
PARENT PRESENTATION
Common Core/ Essential Standards Assessment Results
Video
Watch here: http://www.youtube.com/watch?v=b7d5QK3lpeI&feature=youtu.be
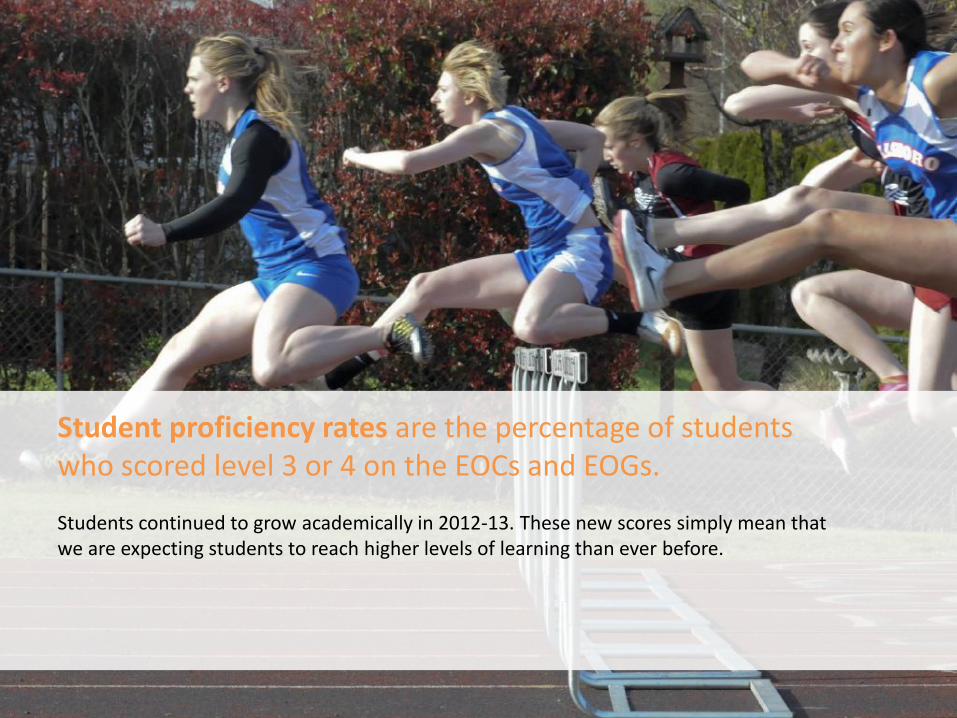
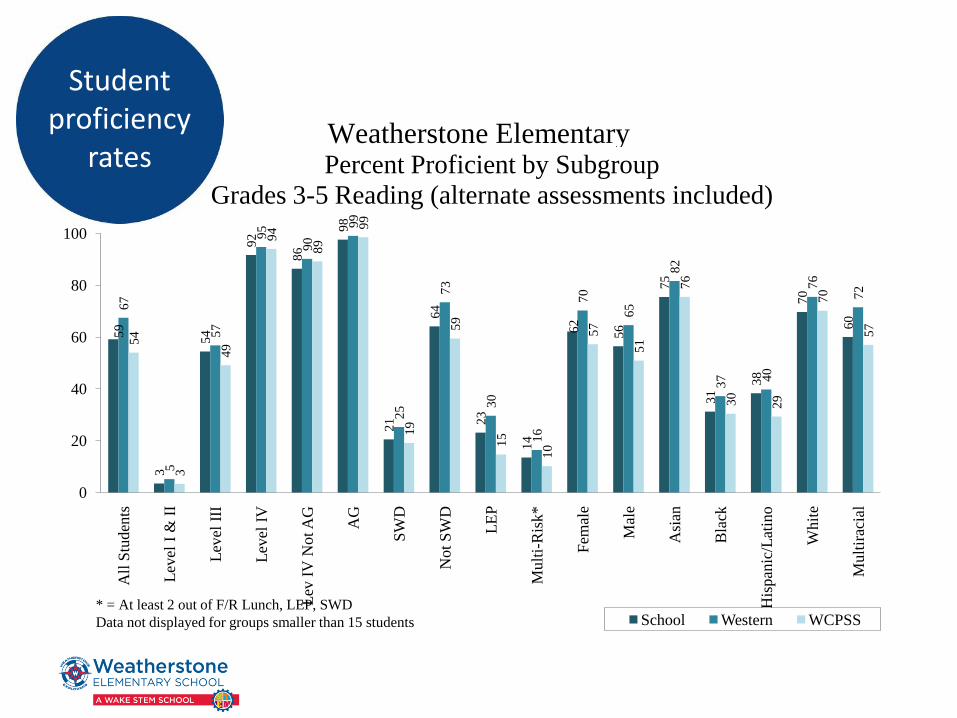
Student proficiency rates are the percentage of students who scored level 3 or 4 on the EOCs and EOGs. Students continued to grow academically in 2012-13. These new scores simply mean that we are expecting students to reach higher levels of learning than ever before.
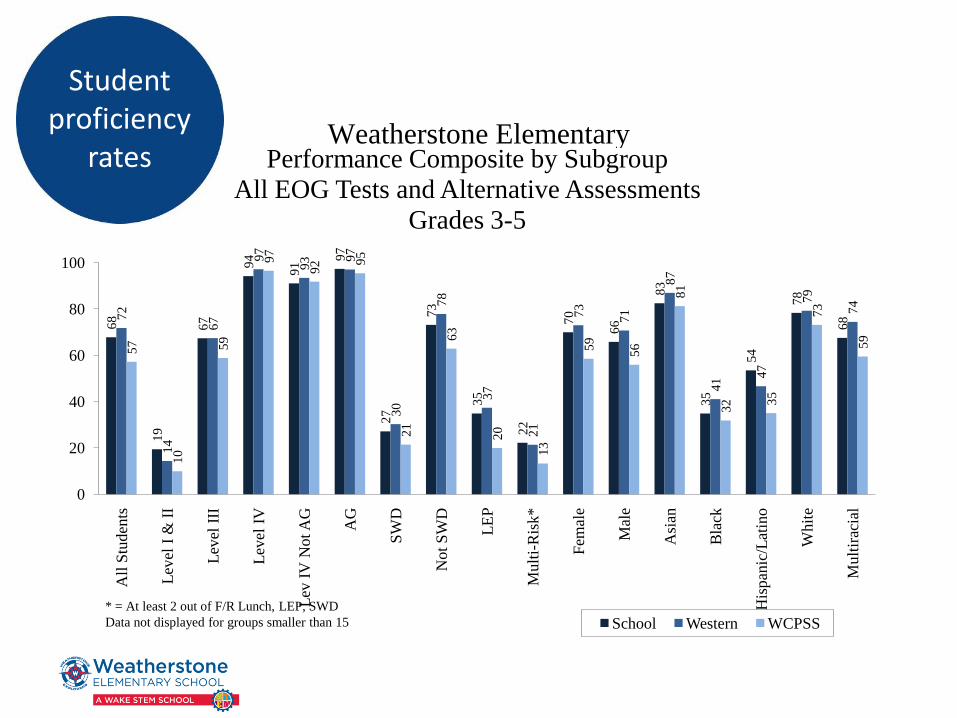
Student proficiency
rates
68
19
67
94
91
97
27
73
35
22
70
66
83
35
54
78
68
72
14
67
97
93
97
30
78
37
21
73
71
87
41
47
79
74
57
10
59
97
92
95
21
63
20
13
59
56
81
32
35
73
59
0
20
40
60
80
100
All
Stu
den
ts
Lev
el I
& I
I
Lev
el I
II
Lev
el I
V
Lev
IV
Not A
G
AG
SW
D
Not
SW
D
LE
P
Mult
i-R
isk*
Fem
ale
Mal
e
Asi
an
Bla
ck
His
pan
ic/L
atin
o
Whit
e
Mult
irac
ial
Performance Composite by Subgroup
All EOG Tests and Alternative Assessments
Grades 3-5
School Western WCPSS
Weatherstone Elementary
* = At least 2 out of F/R Lunch, LEP, SWD
Data not displayed for groups smaller than 15
Student proficiency
rates
59
3
54
92
86
98
21
64
23
14
62
56
75
31
38
70
60
67
5
57
95
90
99
25
73
30
16
70
65
82
37
40
76
72
54
3
49
94
89
99
19
59
15
10
57
51
76
30
29
70
57
0
20
40
60
80
100
All
Stu
den
ts
Lev
el I
& I
I
Lev
el I
II
Lev
el I
V
Lev
IV
Not A
G
AG
SW
D
Not
SW
D
LE
P
Mult
i-R
isk*
Fem
ale
Mal
e
Asi
an
Bla
ck
His
pan
ic/L
atin
o
Whit
e
Mu
ltir
acia
l
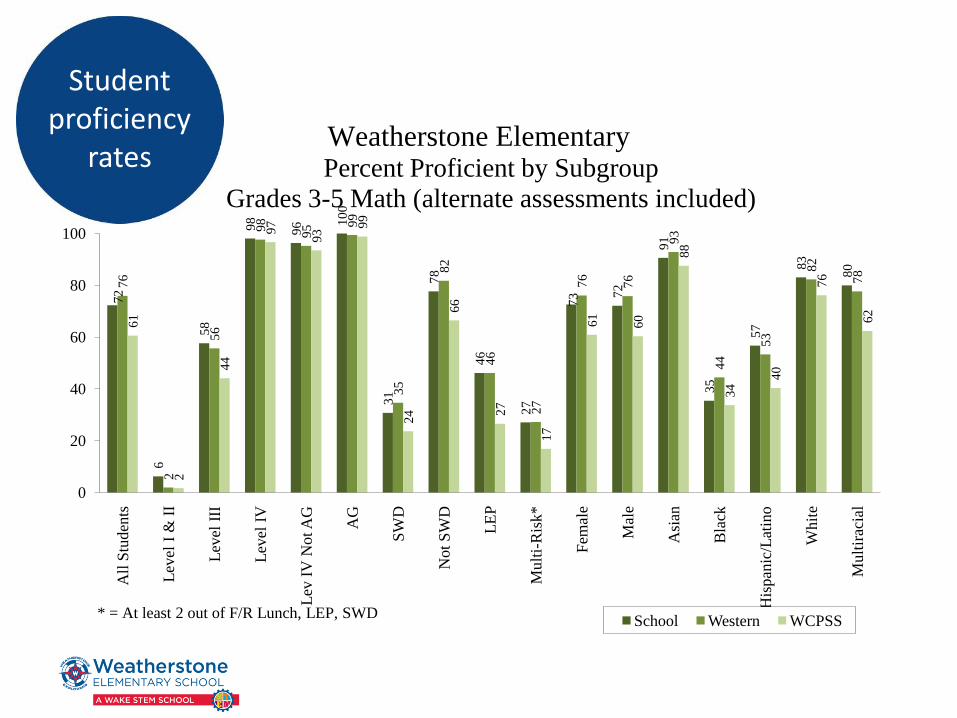
Percent Proficient by Subgroup
Grades 3-5 Reading (alternate assessments included)
School Western WCPSS
Weatherstone Elementary
* = At least 2 out of F/R Lunch, LEP, SWD
Data not displayed for groups smaller than 15 students
Student proficiency
rates
72
6
58
98
96
10
0
31
78
46
27
73
72
91
35
57
83
80
76
2
56
98
95
99
35
82
46
27
76
76
93
44
53
82
78
61
2
44
97
93
99
24
66
27
17
61
60
88
34
40
76
62
0
20
40
60
80
100
All
Stu
den
ts
Lev
el I
& I
I
Lev
el I
II
Lev
el I
V
Lev
IV
Not A
G
AG
SW
D
Not
SW
D
LE
P
Mult
i-R
isk*
Fem
ale
Mal
e
Asi
an
Bla
ck
His
pan
ic/L
atin
o
Whit
e
Mu
ltir
acia
l
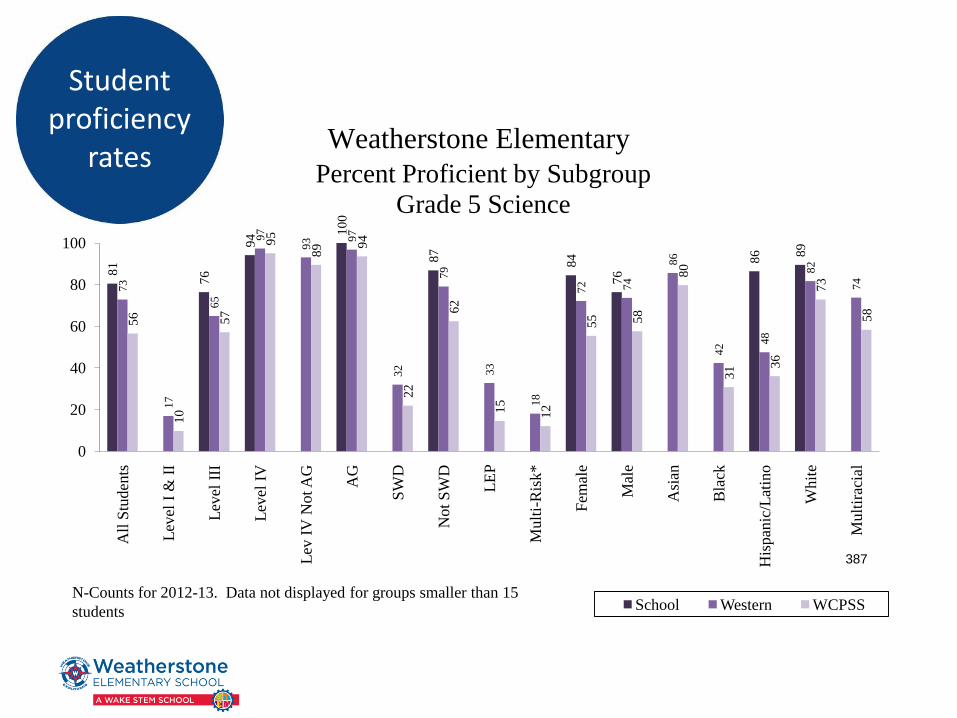
Percent Proficient by Subgroup
Grades 3-5 Math (alternate assessments included)
School Western WCPSS
Weatherstone Elementary
* = At least 2 out of F/R Lunch, LEP, SWD
Student proficiency
rates
81
76
94
10
0
87
84
76
86
89
73
17
65
97
93
97
32
79
33
18
72
74
86
42
48
82
74
56
10
57
95
89
94
22
62
15
12
55
58
80
31
36
73
58
0
20
40
60
80
100
All
Stu
den
ts
Lev
el I
& I
I
Lev
el I
II
Lev
el I
V
Lev
IV
Not A
G
AG
SW
D
Not
SW
D
LE
P
Mult
i-R
isk*
Fem
ale
Mal
e
Asi
an
Bla
ck
His
pan
ic/L
atin
o
Whit
e
Mult
irac
ial
Percent Proficient by Subgroup
Grade 5 Science
School Western WCPSS
Weatherstone Elementary
387
N-Counts for 2012-13. Data not displayed for groups smaller than 15
students
Student growth rates reflect the progress students made during the course of the school year.
Academic growth rates
• Our EVAAS growth rate for 2012-13 was 3.77 which EXCEEDED the growth target for the state.
• WES was the 4th highest Western Wake School in growth
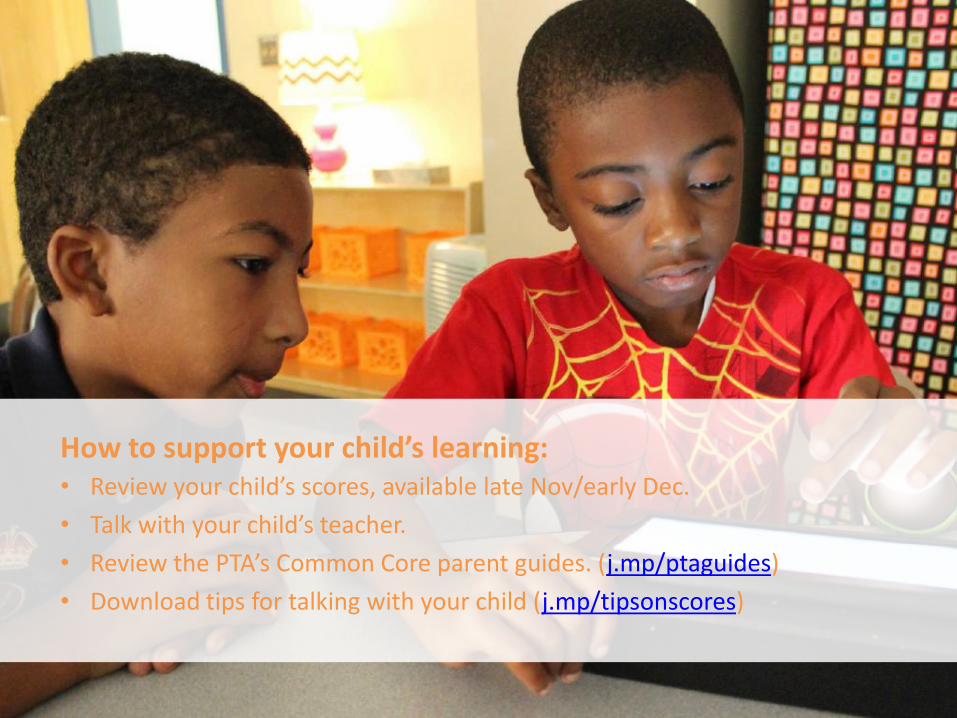
How to support your child’s learning: • Review your child’s scores, available late Nov/early Dec.
• Talk with your child’s teacher.
• Review the PTA’s Common Core parent guides. (j.mp/ptaguides)
• Download tips for talking with your child (j.mp/tipsonscores)
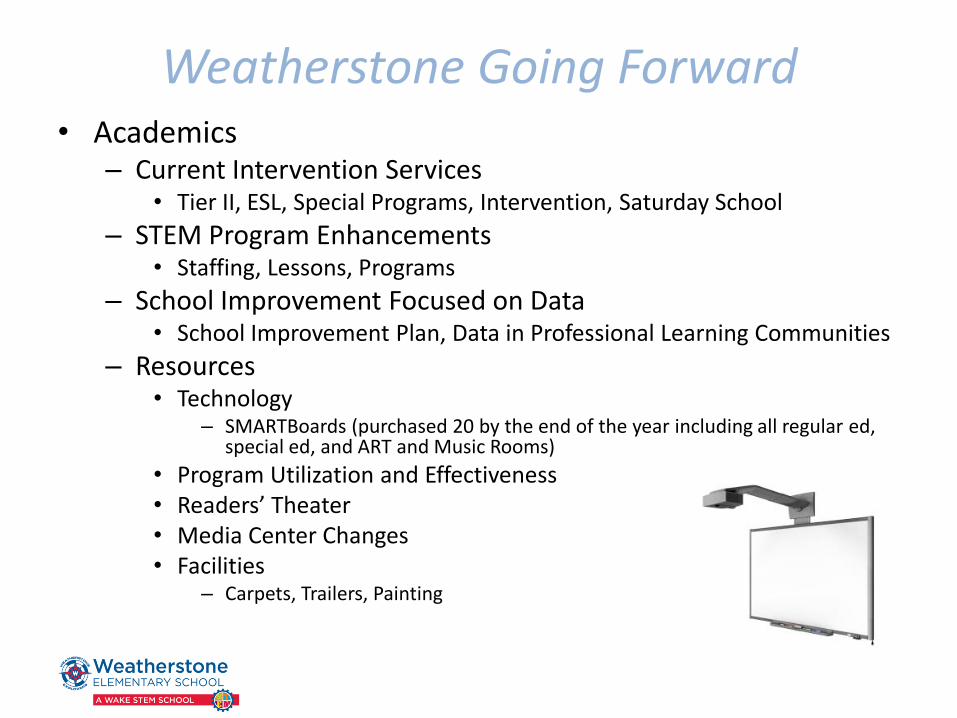
Weatherstone Going Forward • Academics
– Current Intervention Services • Tier II, ESL, Special Programs, Intervention, Saturday School
– STEM Program Enhancements • Staffing, Lessons, Programs
– School Improvement Focused on Data • School Improvement Plan, Data in Professional Learning Communities
– Resources • Technology
– SMARTBoards (purchased 20 by the end of the year including all regular ed, special ed, and ART and Music Rooms)
• Program Utilization and Effectiveness • Readers’ Theater • Media Center Changes • Facilities
– Carpets, Trailers, Painting
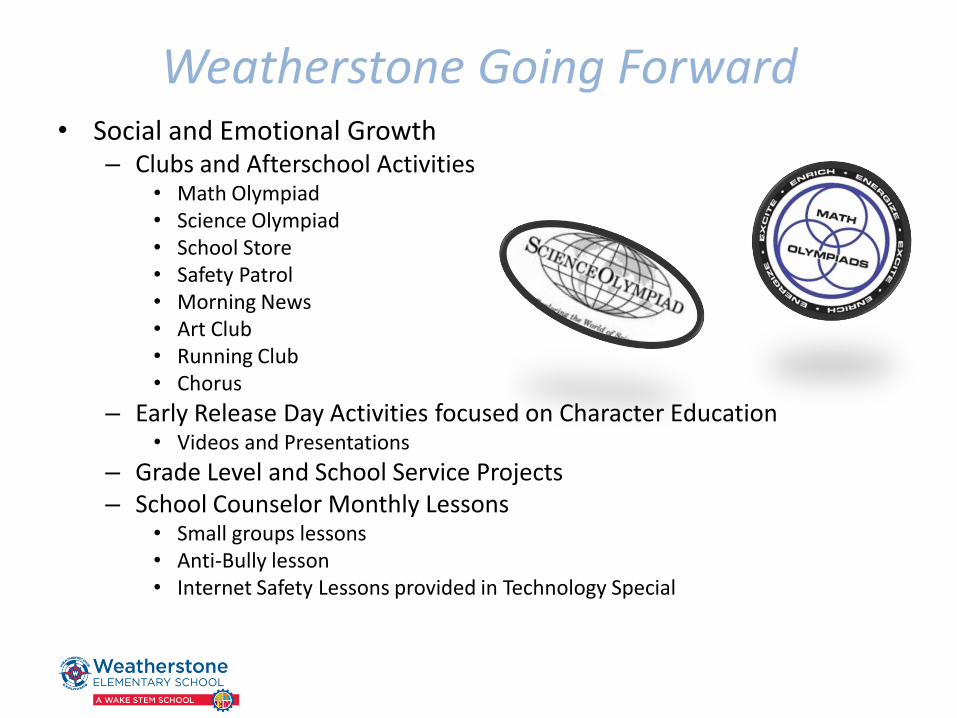
Weatherstone Going Forward • Social and Emotional Growth
– Clubs and Afterschool Activities • Math Olympiad • Science Olympiad • School Store • Safety Patrol • Morning News • Art Club • Running Club • Chorus
– Early Release Day Activities focused on Character Education • Videos and Presentations
– Grade Level and School Service Projects – School Counselor Monthly Lessons
• Small groups lessons • Anti-Bully lesson • Internet Safety Lessons provided in Technology Special
Weatherstone Going Forward
• Physical Growth
– Campus Enhancements
• K-2 Playground
• 3-5 Playground
• Long Range Partnership between PTA, WES, and WCPSS
– Fundraiser Partnership with PTA, Boosterthon focused on Good Character and Physical Activity
– PE offered more often now (60 lessons vs. 45)