parapet research group, princeton university ee ieee international symposium on workload...
TRANSCRIPT

Parapet Research Group, Princeton University EE
IEEE International Symposium on Workload Characterization
IISWC ’05, Austin, TX
Oct 06, 2005
Detecting Recurrent Phase Behavior under Real-System Variability
Canturk ISCI
Margaret MARTONOSI

Canturk Isci - Margaret Martonosi2
Detecting Recurrent Phase Behavior under Real-System Variability [IISWC ’05]
Phase Analysis & Real Systems Phases:
Self-similar, mostly recurrent, execution regions
How to identify phase recurrences when real-system effects make them inexact replicas?
Useful for characterization, dynamic-adaptive management
0
0.1
0.2
0.3
0.4
0.5
0.6
0.7
0.8
0.9
1
0 5 10 15 20 25 30 35 40 45Time [s]
0
0.1
0.2
0.3
0.4
0.5
0.6
0.7
0.8
0.9
1
0 5 10 15 20 25 30 35 40 45Time [s]
E1 E2 E3 E4 E5
Canturk Isci - Margaret Martonosi3
Detecting Recurrent Phase Behavior under Real-System Variability [IISWC ’05]
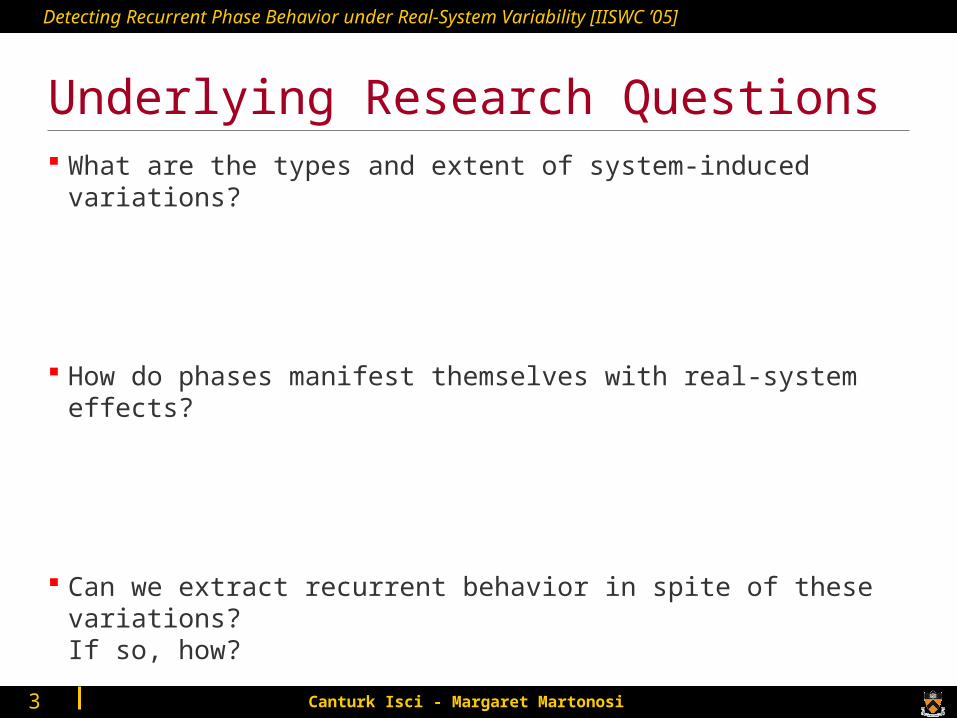
Underlying Research Questions What are the types and extent of system-induced variations?
How do phases manifest themselves with real-system effects?
Can we extract recurrent behavior in spite of these variations?If so, how?

Canturk Isci - Margaret Martonosi4
Detecting Recurrent Phase Behavior under Real-System Variability [IISWC ’05]
Background: Power and Phases
Runtime processor power monitoring and estimation [Micro’03] Sample PMCs to estimate powers for 22 chip components
Real measurement feedback for tuning and verification
Workload power phase behavior with power vectors [WWC’03] Consider power estimations as power vectors
Characterize “power phases” based on vector similarity

Canturk Isci - Margaret Martonosi5
Detecting Recurrent Phase Behavior under Real-System Variability [IISWC ’05]
Variability in Real-System Runs Initial idea was to look at phase distributions of apps and use
some signature analysis to detect/predict phases
HOWEVER: Multiple runs inevitably exhibit different behavior
Quantities & durations vary Phase distributions vary
Metric Variability Time Variability
0
10
20
30
40
50
60
0 5 10 15 20 25 30Time [s]
Po
wer
[W
]
Gcc Run1Gcc Run2Gcc Run3
Time VariabilityMetric Variability

Canturk Isci - Margaret Martonosi6
Detecting Recurrent Phase Behavior under Real-System Variability [IISWC ’05]
Underlying Research Questions What are the types and extent of system-induced variations?
Metric variability
Time variability
How do phases manifest themselves with real-system effects?
Can we extract recurrent behavior in spite of these variations?If so, how?

Canturk Isci - Margaret Martonosi7
Detecting Recurrent Phase Behavior under Real-System Variability [IISWC ’05]
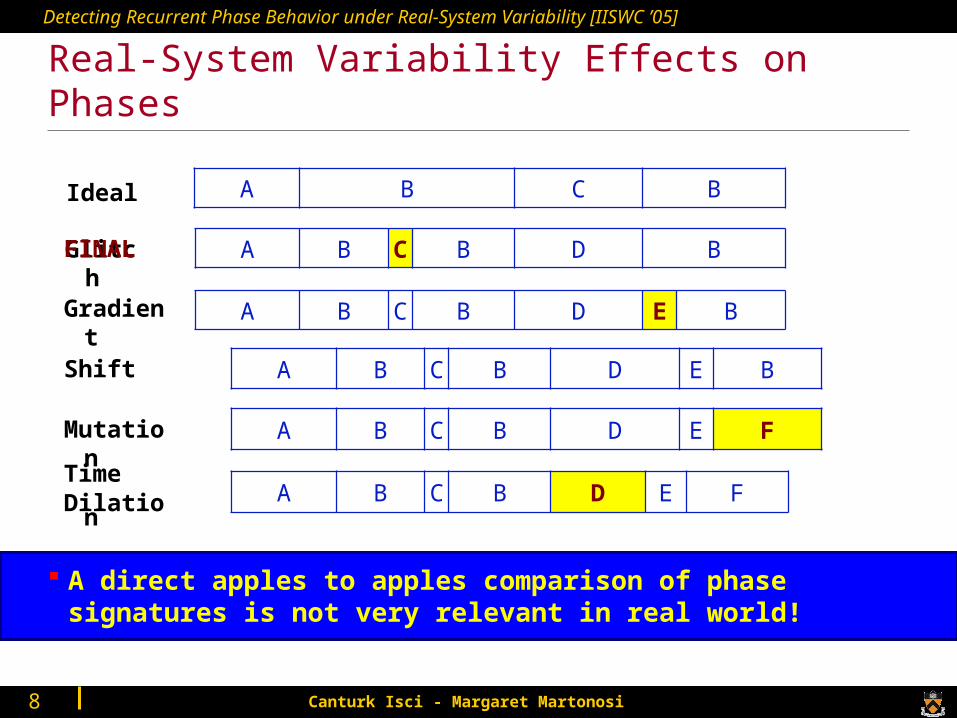
Real-System Variability Effects on Phases
t
Metric
A B C BIdeal
A B C B D BGlitch
A B C B D E BGradient
A B C B D E BShift
A B C B D E FMutation
A B C B D E FTime Dilation
Canturk Isci - Margaret Martonosi8
Detecting Recurrent Phase Behavior under Real-System Variability [IISWC ’05]
Real-System Variability Effects on Phases
A direct apples to apples comparison of phase signatures is not very relevant in real world!
A B C BIdeal
A B C B D BGlitch
A B C B D E BGradient
A B C B D E BShift
A B C B D E FMutation
A B C B D E FTime Dilation
FINAL
Canturk Isci - Margaret Martonosi11
Detecting Recurrent Phase Behavior under Real-System Variability [IISWC ’05]
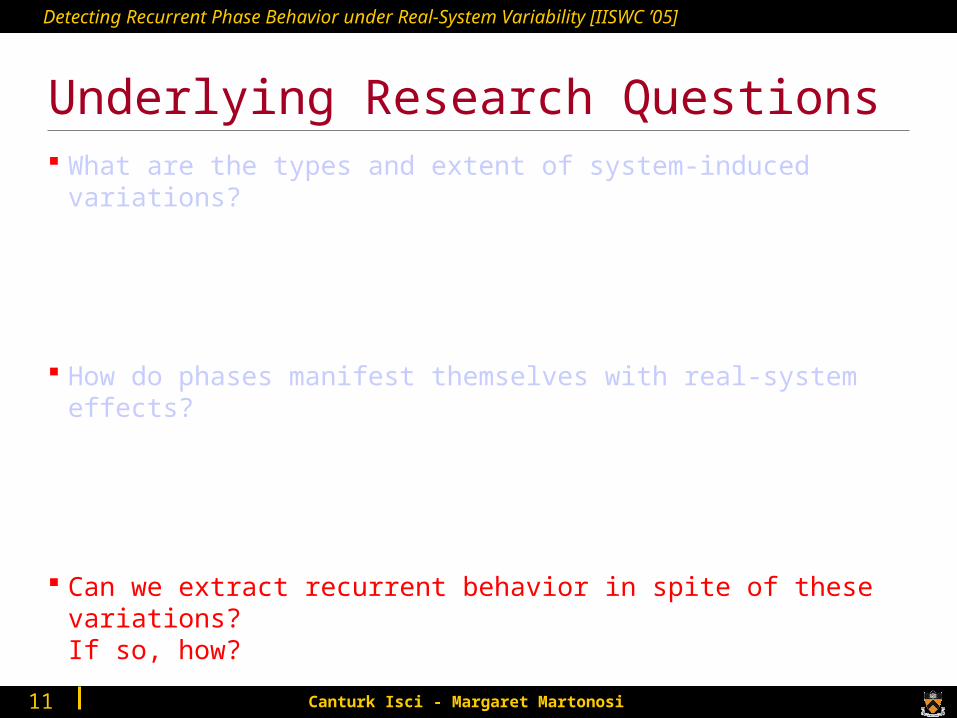
Underlying Research Questions What are the types and extent of system-induced variations?
How do phases manifest themselves with real-system effects?
Can we extract recurrent behavior in spite of these variations?If so, how?
Canturk Isci - Margaret Martonosi12
Detecting Recurrent Phase Behavior under Real-System Variability [IISWC ’05]
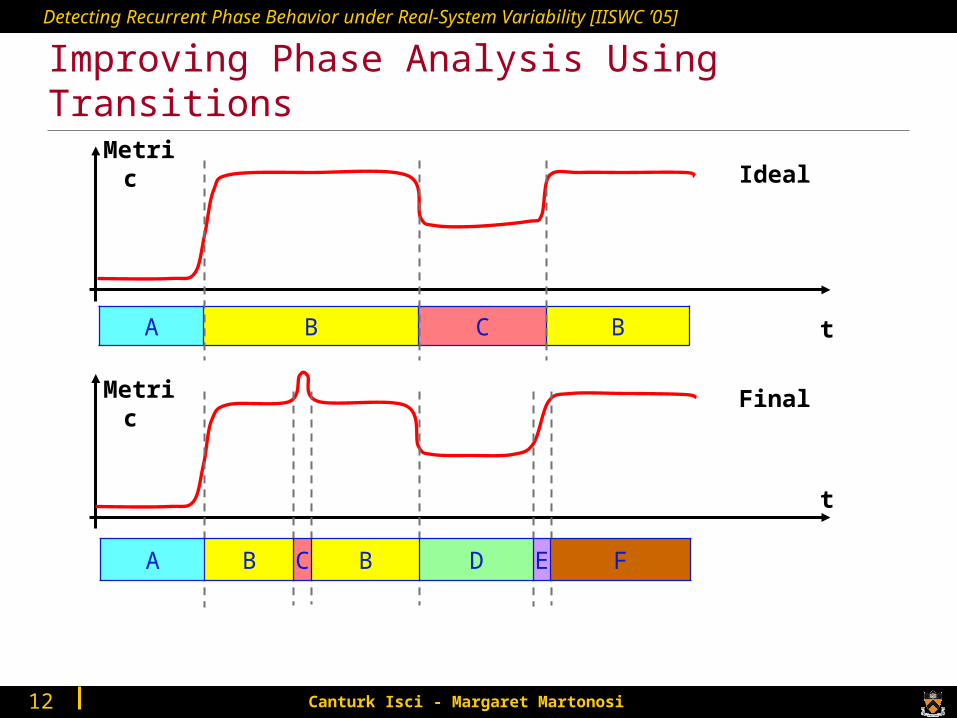
Improving Phase Analysis Using Transitions
t
Metric
A B C B
t
Metric
A B C B D E F
Ideal
Final

Canturk Isci - Margaret Martonosi13
Detecting Recurrent Phase Behavior under Real-System Variability [IISWC ’05]
Value based phase representations do not show good correlation
t
Value Based Phases (VBP)
A B C B
t
A B C B D E F
12
32
12
4
6
23
5
Improving Phase Analysis Using Transitions

Canturk Isci - Margaret Martonosi14
Detecting Recurrent Phase Behavior under Real-System Variability [IISWC ’05]
Our Proposed Solution with Transitions
Tracking phase transitions rather than phase sequences is more useful in detecting recurrent behavior
t
Transition Based Phases (TBP)
A B C B
t
A B C B D E F
1 1 100…0 00…0 00…0 00…0
1 1 100…0 00…0 00…0 00…000…0
1 1 1

Canturk Isci - Margaret Martonosi15
Detecting Recurrent Phase Behavior under Real-System Variability [IISWC ’05]
Our Transition-Guided Detection FrameworkBenchmark run #1
Sample PMCs to form 12D vectors
Benchmark run #2
Vector stream #1
Identify Transitions
Vector stream #2
TBPinit #1
Apply glitch/gradient filtering
TBPinit #2
TBPgg #1 TBPgg #2
Apply near-neighbor blurring
TBPggN #1
Match ⇒ Peak at best alignmentMismatch ⇒ No observable peak
Apply cross correlation

Canturk Isci - Margaret Martonosi16
Detecting Recurrent Phase Behavior under Real-System Variability [IISWC ’05]
Sampling Effects: Glitches & Gradients Nothing happens without disturbances Glitches
Glitch: Instability where before & after are same Spurious transitions
Nothing happens instantaneously Gradients Gradient: Instability where before & after are different A single true trans-n
Glitch/Gradient Filtering: Very simple: no consecutive transitions
Initial Transitions:
GLITCHES:
0 00 0 00 110 000 0 0 0 00 0 11 1 10 000 00 00 0 11 11 1 111 100 00
Refined Trans-ns: 0 00 0 00000 000 0 0 0 00 000000 000 00 00 000000000000 00
Initial Transitions:
GRADIENTS:
0 00 0 11 110 000 0 0 0 00 0 11 1 10 000 00 00 0 11 11 1 111 100 00
Refined Trans-ns: 0 00 010000 000 0 0 0 00 010000 000 00 00 010000000000 00
Canturk Isci - Margaret Martonosi17
Detecting Recurrent Phase Behavior under Real-System Variability [IISWC ’05]
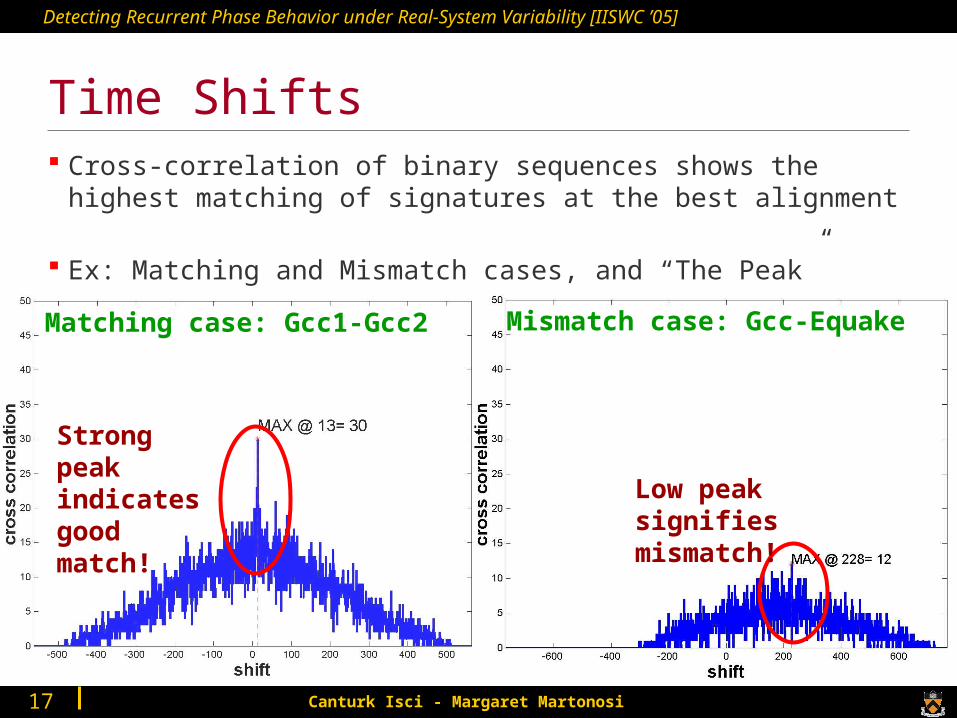
Time Shifts Cross-correlation of binary sequences shows the highest
matching of signatures at the best alignment
Ex: Matching and Mismatch cases, and “The Peak”
Matching case: Gcc1-Gcc2 Mismatch case: Gcc-Equake
Strong peak indicates good match! Low peak
signifies mismatch!

Canturk Isci - Margaret Martonosi18
Detecting Recurrent Phase Behavior under Real-System Variability [IISWC ’05]
Observation: Dilations exist as small jitters (few samples)
Proposed Solution: “Near-Neighbor Blurring” Blur edges slightly Consider transitions as distributions around
their actual locations
Tolerance: Spread of this distribution, [t-x, t+x] samples
Ex: Matching improvement with tolerance=2:
Time Dilations
run1
Mism
atch!
t
1 1 1
00 0 0 0 0 0 0 0 0 0 0 0 0 0 0 0 0 0 0
run21 1 1
00 0 0 0 0 0 0 0 0 00 0 0 0 0 0 0 0 t
1

Canturk Isci - Margaret Martonosi19
Detecting Recurrent Phase Behavior under Real-System Variability [IISWC ’05]
.7.3
.7.3
.7.7.3
.7.3
.7
Observation: Dilations exist as small jitters (few samples)
Proposed Solution: “Near-Neighbor Blurring” Blur edges slightly Consider transitions as distributions around
their actual locations
Tolerance: Spread of this distribution, [t-x, t+x] samples
Ex: Matching improvement with tolerance=2:
Time Dilations
run1
Match!t
1 1 1
0 0 0 0 0 0 0 0
run21 1 1
00 0 0 0 0 0 0 0 0 00 0 0 0 0 0 0 0 t
1
0 0 0 000000000

Canturk Isci - Margaret Martonosi20
Detecting Recurrent Phase Behavior under Real-System Variability [IISWC ’05]
Our Transition-Guided Detection FrameworkBenchmark run #1
Sample PMCs to form 12D vectors
Benchmark run #2
Vector stream #1
Identify Transitions
Vector stream #2
TBPinit #1
Apply glitch/gradient filtering
TBPinit #2
TBPgg #1 TBPgg #2
Apply near-neighbor blurring
TBPggN #1
Match ⇒ Peak at best alignmentMismatch ⇒ No observable peak
Apply cross correlation

Canturk Isci - Margaret Martonosi21
Detecting Recurrent Phase Behavior under Real-System Variability [IISWC ’05]
Results How do we quantify phase recognition quality?
Matching Score:
Range of values ≥ 0
Higher is better

Canturk Isci - Margaret Martonosi22
Detecting Recurrent Phase Behavior under Real-System Variability [IISWC ’05]
Results Detection Results:
(green: highest match; red: highest mismatch)
bzip2 equake gap gcc gzip mcf vortex convert lamebzip2 0.44 0.05 0.07 0.05 0.15 0.18 0.08 0.09 0.15equake 0.15 0.39 0.28 0.06 0.26 0.25 0.09 0.04 0.08gap 0.20 0.22 0.79 0.07 0.10 0.33 0.04 0.05 0.12gcc 0.05 0.04 0.05 0.19 0.03 0.05 0.16 0.04 0.12gzip 0.10 0.10 0.19 0.05 1.08 0.16 0.10 0.03 0.07mcf 0.18 0.18 0.23 0.04 0.16 6.14 0.17 0.08 0.08vortex 0.23 0.10 0.12 0.01 0.11 0.08 1.93 0.03 0.05convert 0.21 0.17 0.26 0.06 0.14 0.25 0.09 0.22 0.13lame 0.12 0.11 0.12 0.04 0.13 0.20 0.06 0.02 0.21
BESTTOLERANCE
1 2 1 3 1 0 1 7 2

Canturk Isci - Margaret Martonosi23
Detecting Recurrent Phase Behavior under Real-System Variability [IISWC ’05]
Receiver Operating Characteristics
Best detection scheme (tolerance=1) achieves 100% hit detection with <5% false alarms.
(Using the same threshold for all apps!)
Very high detect threshold
P{hit} = 0P{false alarm} = 0
0 detect threshold
P{hit} = 1P{false alarm} = 1
Desired operating point
P{hit} ~ 1P{false alarm} ~ 0

Canturk Isci - Margaret Martonosi24
Detecting Recurrent Phase Behavior under Real-System Variability [IISWC ’05]
Comparison: TBP Outperform VBP10.818.4 18.4 11.3
0
1
2
3
4
5
bzip2 equake gap gcc gzip mcf vortex convert lame AVE
Mat
chin
g S
core
/ H
igh
est
Mis
mat
ch
Value-Based Phases Refined Trans-nsNear-Nbr Blurred Trans-ns
Break-evenvalue
(VBPs)(Tgg)
(TggN)
In all cases transitions perform better In almost all cases near-neighbor blurring improves detection

Canturk Isci - Margaret Martonosi25
Detecting Recurrent Phase Behavior under Real-System Variability [IISWC ’05]
Conclusions Detecting phase behavior on real systems has interesting
challenges resulting from system induced variability
Phase transition information improves detection capabilities TBP show 6X better detection capabilities than VBP
Supporting methods, such as Glitch/Gradient Filtering and Near-Neighbor Blurring improve detectability of transition signatures Near-neighbor blurring with tolerance=1 achieve 100% recurrence
detection with <5% false alarms
Resulting infrastructure can enable a range of phase-oriented system adaptations!

Canturk Isci - Margaret Martonosi26
Detecting Recurrent Phase Behavior under Real-System Variability [IISWC ’05]
Thanks!

Canturk Isci - Margaret Martonosi27
Detecting Recurrent Phase Behavior under Real-System Variability [IISWC ’05]
BACKUPS 0.5) How much noise, how much variation? 1) Variation in time sequences of phase distributions for two
gcc runs; recurrent phases with ammp 2) Refined transition counts for different thresholds 3) Advantages with Power/PMC Vectors 4) Threshold vs. Hits & Misses with Tolerance=1 5) How about instr-n based sampling/control flow-based
approach? 6) What’s the source of variability? 7) Glitches/Gradients vs. sampling frequency? 8) Use of this framework? 9) Multithreaded / OLTP like benchmarks? 10) SMT/CMP/multiprogramming environment?

Canturk Isci - Margaret Martonosi28
Detecting Recurrent Phase Behavior under Real-System Variability [IISWC ’05]
0.5) Noise vs. Variations
Gcc Gzip Vpr Vortex Gap
Crafty
Measured Modeled
Stable Apps Vpr/Crafty change very little, Variable ones change much more

Canturk Isci - Margaret Martonosi29
Detecting Recurrent Phase Behavior under Real-System Variability [IISWC ’05]
1)Phase Distributions Along Execution Timeline for 2 Runs of Gcc

Canturk Isci - Margaret Martonosi30
Detecting Recurrent Phase Behavior under Real-System Variability [IISWC ’05]
0
10
20
30
40
50
60
70
80
90
100
1330 1530 1730 1930 2130 2330 2530
1) Recurrence Example with Ammp
Although obvious to the eye, comparing phase sequences directly does not reveal the recurrence clearly!
0
1
2
3
4
5
6
PM_FPU_FMOV_FEST
PM_INST_CMPL
PM_FPU_FSQRT
PM_FPU_FIN
PM_FPU_FEST
PM_FPU_FMA
PM_FPU_FDIV0
1
2
3
4
5
6
0.01 4729.66 9471.93 14213.98 18972.01 23736.07 28478.26 33221.45 37963.79 42706.74
Ammp (POWER4) Performance Vectors (As Individually Normalized Rates)
0
1
2
3
4
5
6

Canturk Isci - Margaret Martonosi31
Detecting Recurrent Phase Behavior under Real-System Variability [IISWC ’05]
2) Refined Transitions for Different Thresholds
0
20
40
60
80
100
0 5 10 15 20 25 30 35 40 45 50Threshold
Fin
al T
ran
sit
ion
Co
un
t
0
100
200
300
400
500
Ori
gin
al T
ran
sit
ion
Co
un
t
Final transitions Original transitions
0
10
20
30
40
50
0 0.5 1 1.5 2 2.5 3 3.5 4 4.5 5 5.5 6 6.5 7Threshold
Fin
al T
ran
sit
ion
Co
un
t
0
120
240
360
480
600
Ori
gin
al T
ran
sit
ion
Co
un
t
Final transitions Original transitions
Gcc
Equake

Canturk Isci - Margaret Martonosi32
Detecting Recurrent Phase Behavior under Real-System Variability [IISWC ’05]
3) Advantages with Power/PMC Vectors Direct relation to actual processor power consumption
Acquired at runtime
Identify program phases with no programmatical knowledge of application

Canturk Isci - Margaret Martonosi33
Detecting Recurrent Phase Behavior under Real-System Variability [IISWC ’05]
4) Threshold vs. Hits & Misses with Tolerance=1
100% hits with < 5% false alarms, for threshold:
3/14=0.21 – 4/14=0.29

Canturk Isci - Margaret Martonosi34
Detecting Recurrent Phase Behavior under Real-System Variability [IISWC ’05]
5) How about inst-n based sampling / control flow-based approaches? We have tried 3 methods:
OS/USR counting with PMCsDoesn’t eliminate variability
Binding to threads in sampling Didn’t solve variability/registration problems
Dynamic instrumentation with PinGot back to perfect repeatability
Lost actual benchmark execution behavior that flows thru the processor
PC sampling doesn’t solve variability if we simply sample PCs every 1ms or so. (Application execution time varies)
Sampling at fixed instruction counts is for a specific PID makes it deterministic Has its downsides with uncontrolled timing behavior and not being
able to bind to flow thru processor

Canturk Isci - Margaret Martonosi35
Detecting Recurrent Phase Behavior under Real-System Variability [IISWC ’05]
6) What’s the Source of Variability? We don’t have perfect, classified answer yet.
Maybe Pin/atom can help
- Different locality at different runs
- Intensity of spontaneous system processes
- Inexact memory access patterns / swaps
- Different cache/tlb/bht etc states

Canturk Isci - Margaret Martonosi36
Detecting Recurrent Phase Behavior under Real-System Variability [IISWC ’05]
7) Glitches/Gradients vs. Sampling Frequency
Reducing frequency smoothes glitches, BUT dithers gradients More sluggish, LPF’ed response Also smoothes actual phase changes
We use 100ms to meet limitations of high frequency corner: No observable perturbation to actual execution
Limited by RS232 speed
Close lower bound to acquire 3-4 DMM samples

Canturk Isci - Margaret Martonosi37
Detecting Recurrent Phase Behavior under Real-System Variability [IISWC ’05]
8) What’s the Use of This? First, this is a GENERIC recurrence detection under variability
system!! Can use to detect/predict phases with specific features:
Memory boundness Hotspots
Can be stretched to security/reliability: Matching signatures with PIDs
Specific promising avenues: CMP workload balancing by signatures power Activity migration in the case of hotspot signatures **DVFS at experienced signatures**
Need help from BBVs under phase behavior changes with taken actions!!
Canturk Isci - Margaret Martonosi38
Detecting Recurrent Phase Behavior under Real-System Variability [IISWC ’05]
9) Multithreaded/OLTP Like Benchmarks?
No fundamental analysis problem as we don’t try to bind to processes
Some of the experimented ones: Mozilla, Xmms, Mplayer
FLAT power behavior Not interesting
Need more infrastructure work to get OLTP like applications running on our platform
Interesting follow-on to see variability of these apps

Canturk Isci - Margaret Martonosi39
Detecting Recurrent Phase Behavior under Real-System Variability [IISWC ’05]
10) SMT/CMP/Multiprogramming Environments
Don’t have the SMT/CMP platforms hooked up for multimeter (yet)
SMT should be similar, as long as the multi-app behavior is somewhat repeatable
CMP less clear, one PMC set & power measurement per core? Overall per chip?
We have tried multiprogramming on our P4: Memory intensive apps create too much swapping/thrashing for
the behavior to be somewhat repeatable.
Not useful for phase detection
How deterministic is Task switching?

Canturk Isci - Margaret Martonosi40
Detecting Recurrent Phase Behavior under Real-System Variability [IISWC ’05]
OLD/EXTRA Slides