parametric computational study on butterfly-shaped
TRANSCRIPT
1
Parametric Computational Study on
Butterfly-Shaped Hysteretic Dampers
A. Farzampour1 and M.R. Eatherton2
ABSTRACT
Structural steel plates oriented to resist shear loading can be used as hysteretic dampers in
seismic force resisting systems. Some steel plate hysteretic dampers have engineered cut-outs
leaving shear links that exhibit controlled yielding. A promising type of link described in the
literature is the butterfly-shaped link that better aligns bending strength along the link length with
the shape of the applied moment diagram. In previous studies, it has been observed that these links
are capable of substantial ductility and energy dissipation. However, the effect of varying butterfly
geometric parameters on the location of plastic hinges, accumulation of plastic strain, the potential
for fracture, buckling, and energy dissipation are not well understood and thus deserve further
investigation.
A parametric computational study is conducted to investigate the shear yielding, flexural
yielding, and lateral torsional buckling limit states for butterfly-shaped links. After validating the
accuracy of the finite element (FE) modeling approach against previous experiments, 112
computational models with different geometrical properties were constructed and analyzed
including consideration of initial imperfections. The resulting yielding moment, corresponding
critical shear force, the accumulation of plastic strains through the length of links as well as the
1Research Scholar, Dept. of Civil Engineering, Virginia Tech, Blacksburg, VA 24060 (email: [email protected]) 2 Associate Professor, Dept. of Civil Engineering, Virginia Tech, Blacksburg, VA 24060

2
amount of energy dissipated are investigated.
The results indicate that as the shape of the butterfly-shaped links become too straight or
conversely too narrow in the middle, peak accumulated plastic strains increase. The significant
effect of plate thickness on the buckling limit state is examined in this study. Results show that
overstrength for these links (peak force divided by yield force) is between 1.2 - 4.5, with straight
links producing larger overstrength. Additionally, proportioning the links to delay buckling, and
designing the links to yield in the flexural mode are shown to improve energy dissipation.
Keywords: Structural fuse, Hysteretic damper, Finite element analysis, Energy dissipation, Initial
imperfection, Butterfly-shaped links.
1. Introduction
The ductile behavior of structures allows inelastic drift capacity and energy dissipation during
severe earthquakes. Steel plates with shear links can be implemented as hysteretic dampers in the
seismic force resisting system to concentrate inelastic deformations and damages in this element
while surrounding steel members remain elastic. If these hysteretic dampers are also replaceable,
they are sometimes referred to as structural fuses because they yield and thus limit the earthquake
forces applied to the surrounding structure [1, 2].
A promising type of structural fuse for seismic energy dissipation, consists of a steel plate with
cutouts leaving tapered links as shown in Fig.1. The tapered shape is reminiscent of a butterfly and
thus the links are sometimes referred to as butterfly-shaped shear links. The flexural strength of
these links varies quadratically due to the tapered geometry, while the moment demand (associated
with shear loading) varies linearly along the length of the fuse as shown in Fig. 2c. This
relationship between the shapes of the moment strength and moment demand curves creates two

3
key benefits: 1) by adjusting the butterfly-shaped link geometrical properties, the location of
yielding can be controlled and can be located away from corners that are subjected to stress
concentrations, thus making the link more resistant to fracture [3, 4, 5], and 2) because the shape
of the moment demand and moment strength are similar, the yielding spreads over a large length
of the link, thus dissipating significant energy [ 6, 7, 8]. Some research suggests that the butterfly
geometry should be selected such that yielding initiates at the quarter points, midway between the
ends and middle to maximize ductility, but that the yielding will spread over the entire link length
before fracture [3, 8].
Fig. 1 shows four of the many possible ways a butterfly-shaped structural fuse can be
implemented in a building including use as the link beam in an eccentrically braced frame (Fig. 1a
and 1b), coupling beam in a coupled shear wall (Fig. 1c), butterfly-shaped links can be used around
the perimeter of the web plate in a steel plate shear wall (Fig. 1d), or as the replaceable links in the
relatively new linked column frame system [9] (Fig. 1e). Butterfly-shaped structural fuses have
also been used as hysteretic dampers in a number of buildings [5, 6, 7], proposed for use in self-
centering rocking frame structures [3], and proposed as structural fuses in moment connections
[10].

4
Structural fuse
with butterfly-
shaped links
a) Eccentrically Braced
Frame Application
c) Coupled shear wall
Applicationd) Shear wall
Application
b) Butterfly-shaped fuse
e) Linked column
Application
Figure 1. Examples of the implemnation of the buttrefly-shaped fuse
Several studies have indicated that butterfly-shaped structural fuses have advantages for use in
these types of structural applications. Butterfly-shaped links represent a more efficient
implementation of the steel than straight links [2, 3], promote distributed yielding along the length
of the link [3, 4], can develop full hysteretic behavior [4], demonstrate substantial ductility [3, 4],
are relatively easy to fabricate [3], resist buckling [12], the planar geometry makes them applicable
for space-constrained applications [1, 3, 4], and their replicability can reduce repair costs after
large earthquakes [5, 6, 7]. It is reported that butterfly-shaped hysteretic dampers are capable of
repeated large inelastic cycles of up to 30% shear angle across the link length [3, 4] without fracture
or loss of strength. In addition, full hysteretic behavior during cyclic displacements up to large
shear angles has been demonstrated in previous studies [3].

5
Z
b
a
L
Plate
Thickness, t Moment
Moment
Capacity
Moment
Demand
a) Butterfly-shaped Plate (from [2]) b) Geometry c) Moment Diagram
Figure 2. The butterfly-shaped hysteretic damper
Research studies on butterfly-shaped fuses and similar hysteretic dampers have included
experimental programs and computational investigations. Laboratory experiments have been
conducted to validate analytical models, evaluate fracture and ductility, and investigate the effect
of design variables on cyclic behavior [e.g. 3, 4]. Fig. 2a shows one of the butterfly-shaped
hysteretic dampers tested by Ma et al. [3] wherein the link geometry is characterized by four
geometric parameters (Fig. 2b) consisting of the width at the end, b, width at the middle, a, link
length, L, and plate thickness, t. Some computational studies have also been conducted to
investigate the effect of these butterfly geometry on the load resisting behavior of the fuses (e.g.
energy dissipation, damping, mitigating strain concentration, and initial stiffness) [3, 4]; however,
none have systematically evaluated the effect of butterfly geometric parameters on such behavior.
In this study, the effect of varying geometries on the location of the plastic hinges, accumulation
of plastic strains, the occurrence of buckling, overstrength, and energy dissipation are investigated.
A computational parametric study on 112 butterfly-shaped links with various geometrical
properties is conducted to investigate the shear, flexural and buckling limit states of the different
6
butterfly-shaped link geometries under monotonic and cyclic loading conditions. The study is
broken into two parts, the first a parametric study using monotonic pushover analysis and the
second involving cyclically applied displacements. Based on this study, recommendations are
made as to the appropriate selection of butterfly geometry to meet different objectives.
2. Parametric study description and example pushover curves
2. 1. Validation of finite element methodology
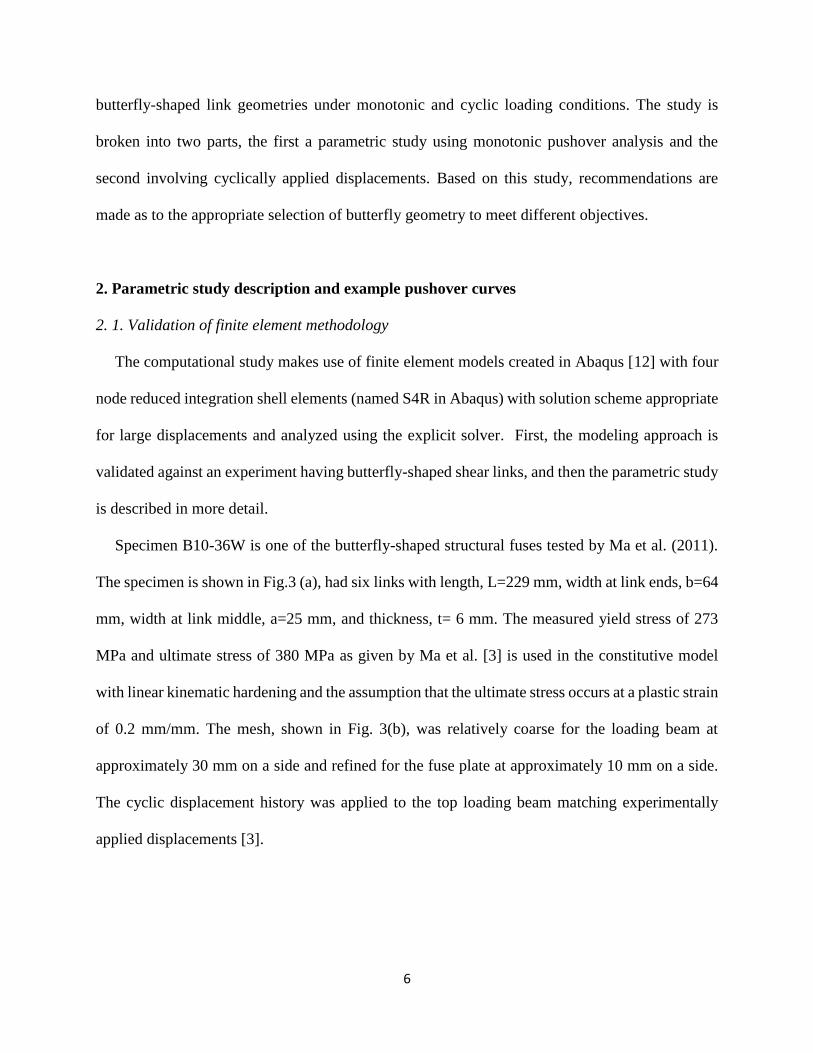
The computational study makes use of finite element models created in Abaqus [12] with four
node reduced integration shell elements (named S4R in Abaqus) with solution scheme appropriate
for large displacements and analyzed using the explicit solver. First, the modeling approach is
validated against an experiment having butterfly-shaped shear links, and then the parametric study
is described in more detail.
Specimen B10-36W is one of the butterfly-shaped structural fuses tested by Ma et al. (2011).
The specimen is shown in Fig.3 (a), had six links with length, L=229 mm, width at link ends, b=64
mm, width at link middle, a=25 mm, and thickness, t= 6 mm. The measured yield stress of 273
MPa and ultimate stress of 380 MPa as given by Ma et al. [3] is used in the constitutive model
with linear kinematic hardening and the assumption that the ultimate stress occurs at a plastic strain
of 0.2 mm/mm. The mesh, shown in Fig. 3(b), was relatively coarse for the loading beam at
approximately 30 mm on a side and refined for the fuse plate at approximately 10 mm on a side.
The cyclic displacement history was applied to the top loading beam matching experimentally
applied displacements [3].

7
Fixed
Support,
all DOFs
Multi Point
Constraint for
translation
Pinned
Support
Four node Shell
Element, 10mm
Pinned
Support
Loading
Beam
Multi Point
Constraint
Four node Shell
Element, 30mmVertical
Strut
All nodes at end cross-
section are tied to a
reference node
a) Picture of the test specimen [3] b) FE model
c) Deformed Shape at 10% drift angle d) Load vs. deformation behavior
Figure 3. Verification of finite element modeling methodology against Ma et al. (2011)
Fig. 3(c) shows the deformed shape at 10% drift angle and Fig. 3(d) shows a comparison
between the hysteric behavior from FE modeling and the tested specimen. The shear force, V, is
normalized to the computed yield strength, Vpflex, as will be described later and the horizontal axis
is the displacement, δ, normalized to the height, h, measured from bottom bolts to top bolts, which
is equal to 508mm. The computational model was demonstrated to be capable of capturing the
lateral torsional buckling shape and the load-displacement behavior including yielding, the onset
of lateral torsional buckling, and subsequent geometric hardening associated with link tension
(shown as increasing shear force at large drift angles in Fig. 3(d)).
2. 2. Parametric study description
8
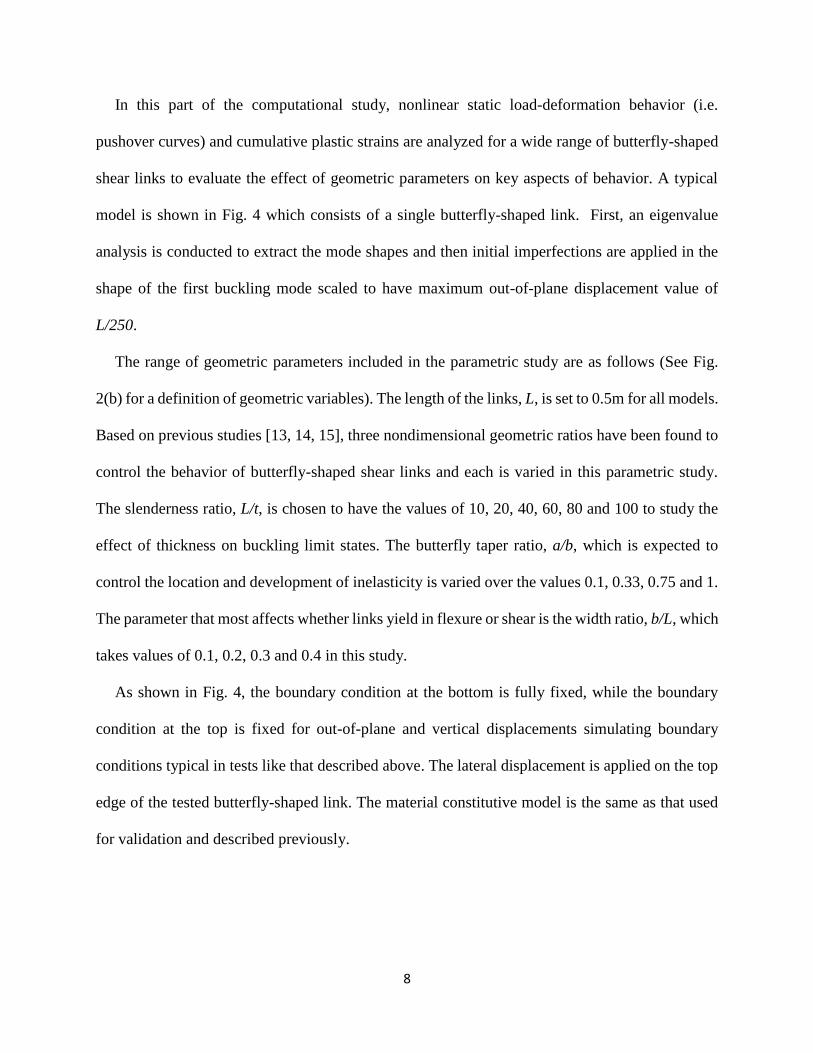
In this part of the computational study, nonlinear static load-deformation behavior (i.e.
pushover curves) and cumulative plastic strains are analyzed for a wide range of butterfly-shaped
shear links to evaluate the effect of geometric parameters on key aspects of behavior. A typical
model is shown in Fig. 4 which consists of a single butterfly-shaped link. First, an eigenvalue
analysis is conducted to extract the mode shapes and then initial imperfections are applied in the
shape of the first buckling mode scaled to have maximum out-of-plane displacement value of
L/250.
The range of geometric parameters included in the parametric study are as follows (See Fig.
2(b) for a definition of geometric variables). The length of the links, L, is set to 0.5m for all models.
Based on previous studies [13, 14, 15], three nondimensional geometric ratios have been found to
control the behavior of butterfly-shaped shear links and each is varied in this parametric study.
The slenderness ratio, L/t, is chosen to have the values of 10, 20, 40, 60, 80 and 100 to study the
effect of thickness on buckling limit states. The butterfly taper ratio, a/b, which is expected to
control the location and development of inelasticity is varied over the values 0.1, 0.33, 0.75 and 1.
The parameter that most affects whether links yield in flexure or shear is the width ratio, b/L, which
takes values of 0.1, 0.2, 0.3 and 0.4 in this study.
As shown in Fig. 4, the boundary condition at the bottom is fully fixed, while the boundary
condition at the top is fixed for out-of-plane and vertical displacements simulating boundary
conditions typical in tests like that described above. The lateral displacement is applied on the top
edge of the tested butterfly-shaped link. The material constitutive model is the same as that used
for validation and described previously.

9
Shell,
5mm
Roller
Fixed
L=0.5m
Figure 4. General properties of a model in ABAQUS
2.3 Limit States and example pushover curves
Three limit states, flexural yielding, shear yielding and lateral torsional buckling (LTB) have
been identified as the major limit states for butterfly-shaped links [3, 13]. The shear strength
associated with flexural yielding and shear yielding limit states, as derived in previous work [14,
15] are given in Eq. (1) and Eq.(2), respectively, based on the geometrical properties given in Fig.
1(b). The minimum value of Eq. (1) and Eq. (2) is defined as the design shear yield force, Vy which
is described by Eq. (3). Eq. 4 gives an equation to predict the shear force associated with elastic
lateral torsional buckling which is based on a previous derivation [13].
Pr
(2 2 )yflexure
ed
a nt b aV
L
Flexure Limit state (1)
Pred ( / 3)shear
ytV a Shear Limit state (2)
Pred Predmin{ , }shear flex
yV V V First Yielding Limit State (3)
33 2
Pred 2
2[0.096( / ) 0.281( / ) 0.547( / ) 0.533]
1
LTB EbtV a b a b a b
L v
LTB Limit State (4)
An example of the shear load-displacement behavior of a butterfly-shaped link experiencing
each of the three limit states is presented below. The shear force is extracted from the
computational model as the summation of the horizontal reaction forces at the bottom edge and

10
horizontal displacements are recorded at the top edge of the links. In general, links that do not
buckle will experience a ductile limit state (e.g. flexure as shown in Fig. 5) and undergo geometric
hardening at large shear deformations as the link resists axial tension due to the boundary
conditions which don’t allow shortening.
The behavior of a flexure-dominated butterfly-shaped link is described in Fig. 5, in which, the
flexural limit state governs the yielding of the link as plastic hinges form at two locations along
the link length (labeled as Point 1). After some hardening, at Point 2, a concentration of stress at
the middle of the link is observed. After Point 2, the whole link acts as a mechanism and the
strength starts to degrade. In this context, Vmax is the maximum shear strength based on the finite
element analysis which is extracted from the pushover curves.
Figure 5. General pushover curve for a typical flexure dominated butterfly-shaped link
A shear-dominated butterfly-shaped link is demonstrated in Fig. 6. It is observed from the stress
distribution that the butterfly-shaped link has experienced shear yielding at the middle of the link
at Point 1. Geometric hardening then occurs due to axial elongation of the link. Subsequently, the
Equivalent
Plastic strain
at point 1
Von-Mises
Stress at point 1
Equivalent
Plastic strain at
point 2
Von-Mises
Stress at point 2

11
concentration of the flexural stress starts to occur and at Point 2, the link strength begins to degrade.
Figure 6. Pushover curve for shear dominated model
The third limit state is lateral torsional buckling, which is highly dependent on the thickness of
the link. Some link configurations buckle before reaching either yielding limit state, while others
achieve the first yielding limit state (flexure or shear) and then experience strength degradation
due to buckling. Fig. 7(a) shows a model with very high slenderness ratio (L/t=80) that experiences
buckling. A sharp decline in strength is observed concurrently with increasing out-of-plane
displacements in the link.
To further demonstrate the effect of plate thickness on lateral torsional buckling and associated
load-deformation behavior, Fig. 7(b) shows curves for L/t = 10, 20, 80, and 100; curves for L/t=40
and 60 are omitted for clarity. From Fig. 7(b), it is noted that the butterfly-shaped links that
experienced lateral torsional buckling were not able to reach to their shear or flexure yielding
capacity. Lateral torsional buckling of butterfly-shaped links is investigated in detail in [13] and
is discussed more in later sections of this paper.
Equivalent
Plastic strain
at point 1
Equivalent
Plastic strain
at point 2

12
a) Pushover curve for a model with LTB b) The effect of thickness
Figure 7. Pushover curves for butterfly-shaped links
3. Parametric study results and discussion
Pushover curves were analyzed to monitor the effect of parameters of interest on load-
deformation behavior. Aspects of the load-deformation behavior that are evaluated include:
flexural hinge location at a shear angle of 0.05 rad. (as measured over the link length, L), maximum
equivalent plastic strain at 0.05 rad., overstrength measured as maximum shear load divided by
yield load, energy dissipation up to a shear angle of 0.33 rad., and a comparison of shear yield
force to the predicted strength.
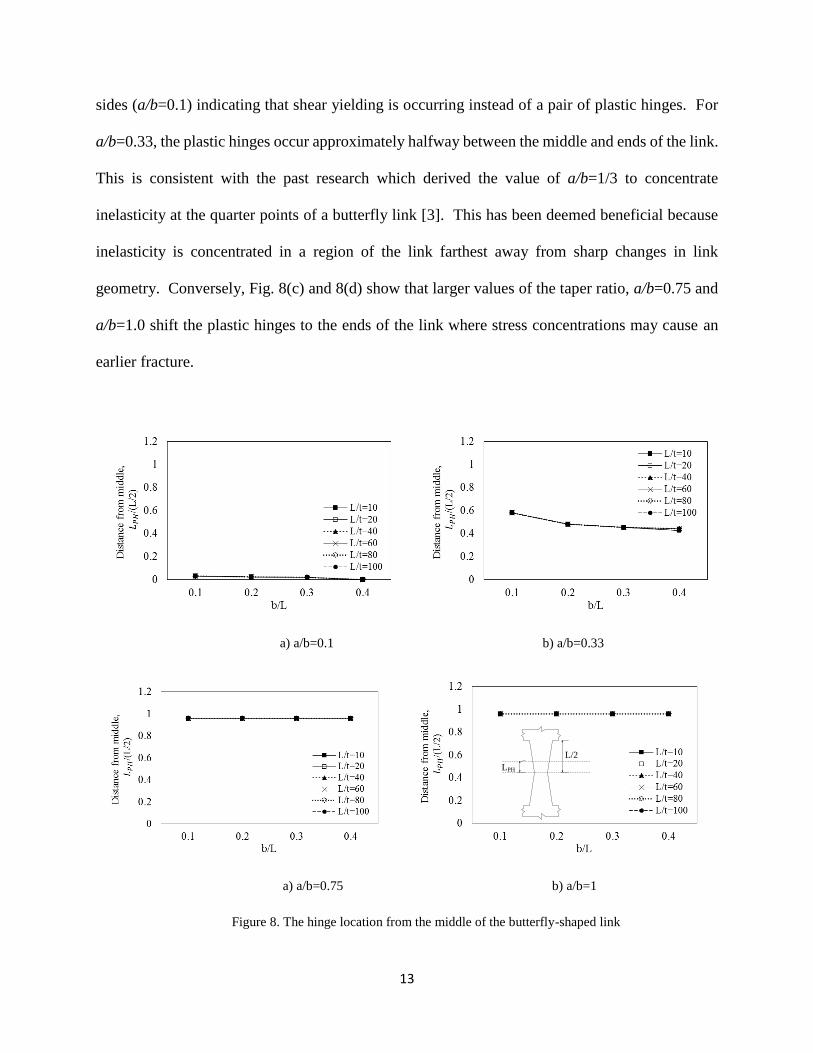
The location of the plastic hinge was calculated as follows. The plastic strain was extracted for
each model at a specified shear angle of 0.05 rad. The distances between the elements with highest
plastic strain values to the middle of the link were averaged and are reported in Fig. 8 as the hinging
location, LPH. It is observed that the hinge location is independent of link slenderness ratio (L/t)
since all six lines of each subplot are nearly identical in Fig. 8. Similarly, the width of the link
(b/L) has a little effect on the hinge location for the range of width ratios considered. It is noted
that when the width ratio becomes large enough, the behavior will shift to being dominated by
shear yielding at the middle.
The peak plastic strains are shown to be at the link middle, LPH=0, for links with steeply sloping
Plastic strain
13
sides (a/b=0.1) indicating that shear yielding is occurring instead of a pair of plastic hinges. For
a/b=0.33, the plastic hinges occur approximately halfway between the middle and ends of the link.
This is consistent with the past research which derived the value of a/b=1/3 to concentrate
inelasticity at the quarter points of a butterfly link [3]. This has been deemed beneficial because
inelasticity is concentrated in a region of the link farthest away from sharp changes in link
geometry. Conversely, Fig. 8(c) and 8(d) show that larger values of the taper ratio, a/b=0.75 and
a/b=1.0 shift the plastic hinges to the ends of the link where stress concentrations may cause an
earlier fracture.
a) a/b=0.1 b) a/b=0.33
a) a/b=0.75 b) a/b=1
Figure 8. The hinge location from the middle of the butterfly-shaped link
L/2
LPH

14
To further investigate the potential for fracture, the maximum equivalent plastic strain
anywhere in the model was recorded at a shear angle of 0.05 rad. The equivalent plastic strain rate,
휀̅̇𝑝𝑙, is given in index notation by Eq. (5) where the term 휀�̇�𝑗𝑝𝑙
is the rate of the ij component of the
plastic strain matrix.
휀̅̇𝑝𝑙 = √2
3휀�̇�𝑗
𝑝𝑙휀�̇�𝑗𝑝𝑙 (5)
A mesh sensitivity analysis (not shown here) demonstrated small variation in the equivalent
plastic strain values with a reduction in mesh size of 50%. Furthermore, these values are not meant
to give an absolute measure for when a link will fracture but instead, are intended to be a relative
measure of how prone one configuration is to fracture compared to another.
The equivalent plastic strain is shown in Fig. 9(a) to be relatively high for the a/b=1.0 group
compared to all other a/b groups, which validates the observation in previous literature that these
straight links (slit panels) can be prone to fracture at much smaller drift angles than butterfly-
shaped links [2]. For instance, previous cyclic tests on butterfly-shaped links showed them capable
of shear angles up to 0.3 rad. before fracture [3] whereas straight links may fracture at shear angles
of 0.03 rad. [2]. It is noted that a/b=0.75 and a/b=1 have the maximum equivalent plastic strain
compared to the rest of the models, since the inelasticity is concentrated at the ends for both cases
which is shown in Fig 9.
Along the same lines, Fig. 9(a) shows that the equivalent plastic strains for the shear-dominated
models (i.e. a/b=0.1) are larger due to plastic strains being concentrated at a location of geometrical
discontinuity, i.e., the middle of the link. For the links with inelasticity concentrated at the quarter
points (e.g. for a/b=0.33), the plastic strain is lower than any other taper ratio (a/b), corroborating

15
the hypothesis that concentrating inelasticity far from the discontinuities will delay fracture [3, 8].
Fig. 9(b) shows that the slenderness ratio, L/t, does not affect the equivalent plastic strains as
much as the taper ratio, a/b ratio. It is noted that as the b/L ratio increases, the hinge locations
approaches to the middle section of the butterfly-shaped link. This would generally increase the
PEEQ values since, at the middle, the geometrical discontinuity (i.e. corner) exists.
a) Varying taper ratio (a/b) b) Varying slenderness (L/t)
Figure 9. Peak Equivalent Plastic Strains in the Model at a Shear Angle of 0.05 rad.
Overstrength, or the increase in strength beyond the design strength, controls the design of the
surrounding structure such that smaller overstrength generally means a more economical structure.
However, some overstrength is advantageous in that hardening in the ductile mechanism forces
the inelasticity to spread to more ductile elements. In this study, the ratio Vmax /V1FE is used to
assess overstrength, where Vmax is the maximum force extracted from the pushover curves, and
V1FE is the yield (or buckling) strength extracted from the finite element model results. The value
of V1FE is the shear strength associated with substantial nonlinearity in the load-deformation curve
such as shown as Point 1 in Fig. 5, 6, and 7. This is an approximate measure of overstrength since
actual overstrength can only be obtained from tests and may be limited by fracture of the link.
Fig. 10 shows that overstrength is more sensitive to the width ratio, b/L than the taper ratio, a/b,
a/b=0.33 L/t=10

16
or the slenderness ratio, L/t. For all taper ratios except for a/b=0.33, the overstrength was
approximately 4.0 for butterfly-shaped links with a narrow width, b/L=0.1 and transitioned to
approximately 1.0 to 2.0 for wider links, b/L=0.4. Since the overstrength in butterfly-shaped links
is primarily associated with geometric hardening and the development of tension in the link, the
results show that the narrower links are prone to larger geometric hardening. This appears to be
true regardless of whether the links experience shear yielding at the middle (a/b=0.1) or flexural
yielding at the ends (a/b=0.75, a/b=1.0).
However, for a taper ratio of a/b=0.33, the overstrength is significantly smaller with values
ranging from 1.0 to 2.3. Since the inelasticity is initiated at the quarter points, additional applied
shear angle acts to spread the inelasticity over a larger area of the link and thus limits the tension
that develops in the link. The smaller overstrength values for a/b=0.33 implies that this taper ratio
will result in the most economical surrounding structure.
a) a/b=0.1 b) a/b=0.33
c) a/b=0.75 d) a/b=1

17
Figure 10. Overstrength obtained from FE analysis
Energy dissipation is important in a seismic force resisting system for limiting peak drifts during
an earthquake. The normalized energy index is calculated as the area under the pushover curve
(evaluated up to a shear angle of 0.33 rad.) divided by a rectangular area with a normalized force
of V/Vy=1 up to a shear angle of 0.33 rad., which is schematically illustrated in Fig. 11. In this
study, the energy index is used primarily to evaluate which configurations experience lateral
torsional buckling as indicated by values of the energy index less than 1.0. In the next section,
models are subjected to cyclic displacement and energy dissipation is evaluated more thoroughly
including the effect of pinching on hysteretic behavior.
As shown in Fig. 12, configurations producing an energy index less than 1.0 are those with
large slenderness ratio, L/t, and width ratio, b/L. For example, Fig. 12(b) shows that L/t ≥ 60 causes
energy index less than 1.0 for b/L=0.3, and L/t ≥ 40 causes the energy index to clearly drop below
1.0 for b/L=0.4. While Eq. (4) emphasizes the effect of thickness on lateral torsional buckling
(cubic term), the dependence on the width ratio, b/L, may be less obvious. Conversely, Eq. (4)
appears to overemphasize the importance of the taper ratio, a/b, on lateral torsional buckling with
a four-term polynomial, whereas Fig. 12 shows less effect of a/b on energy index. The effect of
the taper ratio is observed most with a/b=0.1 where the shear dominated links produced energy
indices close to 1.0. This shows that shear yielding links are less prone to buckling than those
forced to develop flexural plastic hinges.

18
V/Vy
Shear Angle (rad)
Normalized area
1
0.330.0
Figure 11. Baseline energy used for normalizing pushover energy
a) a/b=0.1 b) a/b=0.33
a) a/b=0.75 b) a/b=1
Figure 12. Energy dissipation from pushover analyses
Lateral Torsional
Buckling
Shear dominated
Lateral Torsional Buckling
Flexure dominated
Lateral Torsional Buckling
Flexure dominated
Lateral Torsional Buckling
Flexure dominated
Shear and
flexure
19
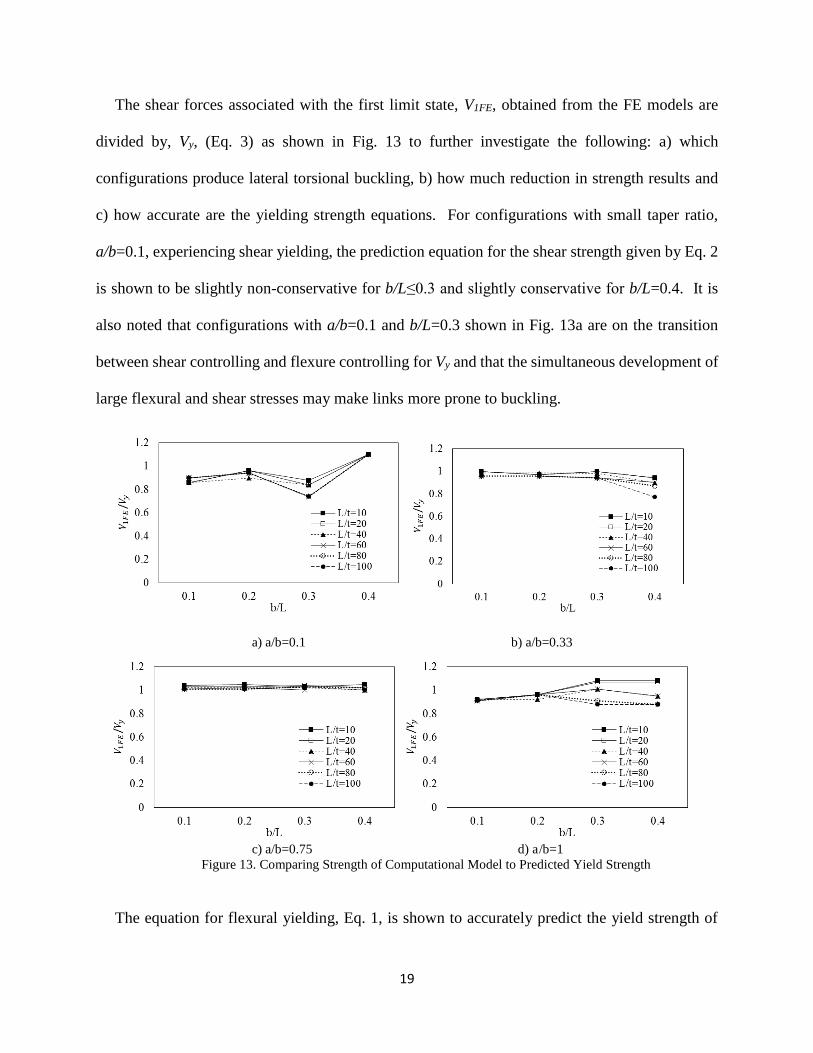
The shear forces associated with the first limit state, V1FE, obtained from the FE models are
divided by, Vy, (Eq. 3) as shown in Fig. 13 to further investigate the following: a) which
configurations produce lateral torsional buckling, b) how much reduction in strength results and
c) how accurate are the yielding strength equations. For configurations with small taper ratio,
a/b=0.1, experiencing shear yielding, the prediction equation for the shear strength given by Eq. 2
is shown to be slightly non-conservative for b/L≤0.3 and slightly conservative for b/L=0.4. It is
also noted that configurations with a/b=0.1 and b/L=0.3 shown in Fig. 13a are on the transition
between shear controlling and flexure controlling for Vy and that the simultaneous development of
large flexural and shear stresses may make links more prone to buckling.
a) a/b=0.1 b) a/b=0.33
c) a/b=0.75 d) a/b=1
Figure 13. Comparing Strength of Computational Model to Predicted Yield Strength
The equation for flexural yielding, Eq. 1, is shown to accurately predict the yield strength of

20
butterfly-shaped links for a/b=0.33 and a/b=0.75 except where lateral torsional buckling caused a
reduction in strength for values of L/t ≥ 40 for a/b=0.33. The largest reduction in strength
associated with lateral torsional buckling was for L/t=100, b/L=0.4, and a/b=0.33 with a strength
that was approximately 70% of the predicted flexural yielding strength. For the largest taper ratio,
a/b=1.0, the prediction equation for flexural yielding strength was conservative for thicker plates
and non-conservative when the links were subject to lateral torsional buckling, L/t≥60, and
b/L≥0.3.
4. Cyclic analyses and equivalent viscous damping
The energy index used in the previous section was limited by the fact that the analysis was
monotonic and thus did not capture hysteretic behavior. In this section, a more thorough
investigation of energy dissipation is conducted using a subset of the models subjected to the AISC
341-16 cyclic displacement protocol for eccentrically braced frame links [16]. For these purposes,
16 models are used as representative of the configurations examined in the parametric study.
Selected models were those with taper ratio, a/b=0.33 and a/b=0.75; slenderness ratio, L/t=10 and
L/t=60; and width ratio, b/L=0.2 and b/L=0.6. In addition, the effect of buckling which
significantly decreases the energy dissipation capability and increases the pinching effect, as
shown in Fig. 14, is investigated within this section.

21
a) Nonbuckling configuration b) Buckling configuration
L=0.5, a/b=0.33, b/L=0.6, L/t=10 L=0.5, a/b=0.33, b/L=0.6, L/t=60
Figure 14. Effect of buckling on butterfly-shaped link hysteric behavior
In this part of the study, the energy dissipation is characterized by equivalent viscous damping.
As shown in Fig.14(b), the area inside one hysteretic loop is defined as Eso, the area associated
with an equivalent elastic system is given as the triangular area, Ed, and the equivalent viscous
damping, εeq, is calculated using Eq. (6).
휀𝑒𝑞 =1
4𝜋(
𝐸𝑑
𝐸𝑆0) (6)
a) Load amplitude and definition of a cycle b) The hysteric response behavior
Figure 14. Definition of areas used to calculate the equivalent viscous damping
To be more specific, the equivalent viscous damping was calculated using Eq. (8) using the
average equivalent stiffness given by Eq. (7) where d+ and d- are the maximum and minimum
displacements in the cycle and P+ and P- are the maximum and minimum shear force. Eq. (8) is
Buckling
occurrence

22
equivalent to Eq. (6), but explicitly accounts for the fact that the magnitude of force in the positive
and negative excursions are not equal.
𝐾𝑒𝑓𝑓 =(|𝑃+| + |𝑃−|)
(|𝛿+| + |𝛿−|) (7)
휀𝑒𝑞 =1
2𝜋[
𝐸𝑑
𝐾𝑒𝑓𝑓(|𝛿+| + |𝛿−|)2] (8)
The models were subjected to the cyclic displacement history prescribed by AISC 341-16 [16]
for eccentrically braced frame links because structural fuses with butterfly-shaped links may be
implemented in similar configurations [e.g. 3, 17]. The equivalent viscous damping ratio is then
calculated for shear angles of 0.005, 0.008, 0.012, 0.015, 0.025, 0.035, 0.045 and 0.05 rad. to
understand the trends in damping ratio with increasing drift ratios.
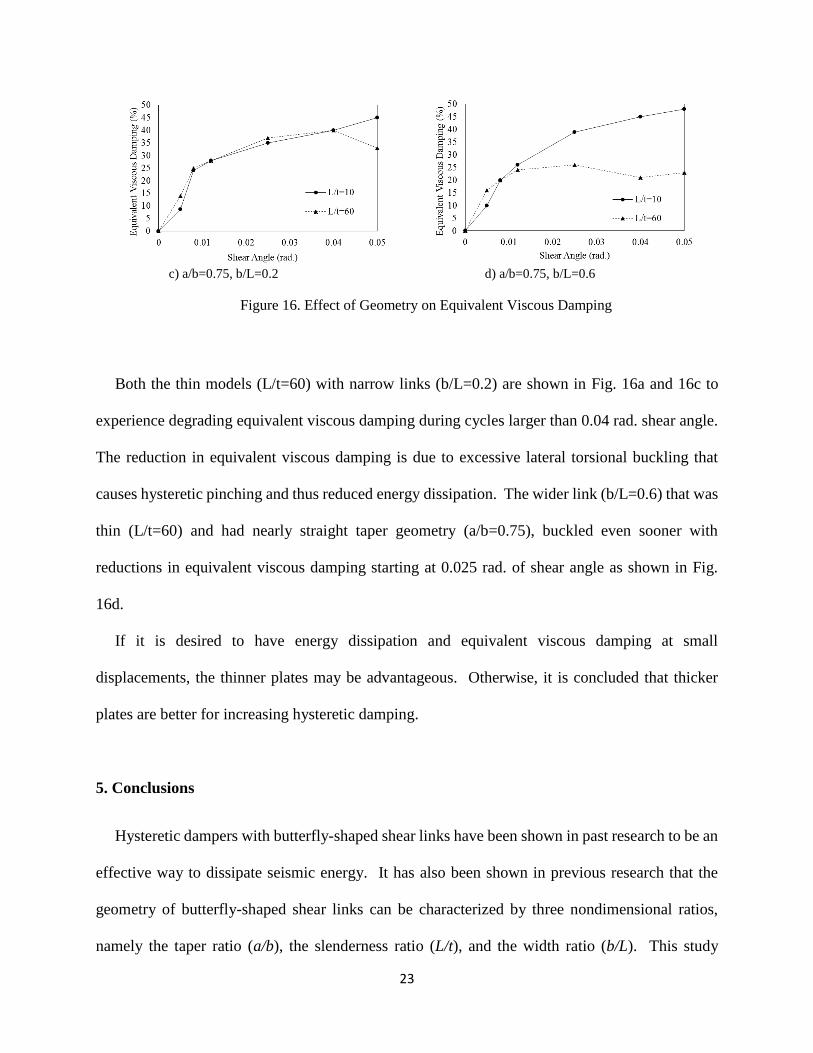
The resulting equivalent viscous damping is shown in Fig. 16. In general, thin links (L/t=60)
had higher equivalent viscous damping during smaller amplitude displacement cycles (up to 0.01
rad shear angle) than thicker links (L/t=10) (see Fig. 16a, 16c, and 16d). The reason is that thin
links start behaving inelastic at smaller drifts than thicker links as demonstrated by Fig. 14a and
Fig. 14b. However, the thinner plates showed less or similar equivalent viscous damping than the
thick plates for shear angles greater than 0.01 because yielding generates more hysteretic damping
than buckling which corroborates with previous studies [18, 19].
a) a/b=0.33, b/L=0.2 b) a/b=0.33 b/L=0.6
23
c) a/b=0.75, b/L=0.2 d) a/b=0.75, b/L=0.6
Figure 16. Effect of Geometry on Equivalent Viscous Damping
Both the thin models (L/t=60) with narrow links (b/L=0.2) are shown in Fig. 16a and 16c to
experience degrading equivalent viscous damping during cycles larger than 0.04 rad. shear angle.
The reduction in equivalent viscous damping is due to excessive lateral torsional buckling that
causes hysteretic pinching and thus reduced energy dissipation. The wider link (b/L=0.6) that was
thin (L/t=60) and had nearly straight taper geometry (a/b=0.75), buckled even sooner with
reductions in equivalent viscous damping starting at 0.025 rad. of shear angle as shown in Fig.
16d.
If it is desired to have energy dissipation and equivalent viscous damping at small
displacements, the thinner plates may be advantageous. Otherwise, it is concluded that thicker
plates are better for increasing hysteretic damping.
5. Conclusions
Hysteretic dampers with butterfly-shaped shear links have been shown in past research to be an
effective way to dissipate seismic energy. It has also been shown in previous research that the
geometry of butterfly-shaped shear links can be characterized by three nondimensional ratios,
namely the taper ratio (a/b), the slenderness ratio (L/t), and the width ratio (b/L). This study

24
investigated the effect of the three key butterfly-shape geometric parameters on link behavior. A
parametric computational study using a validated computational modeling approach was
conducted on 112 configurations to investigate the location of plastic hinges, accumulation of
plastic strains, the occurrence of buckling, energy dissipation and equivalent viscous damping.
The three primary limit states for butterfly-shaped links are flexural yielding, shear yielding,
and lateral torsional buckling. The trends in observed plastic hinge location show that for small
taper ratios (a/b=0.1), shear yielding occurs at the middle of the link and that for large taper ratios
(a/b=0.75 and 1.0), flexural hinges form at the ends of the link. The models also corroborate
previously derived equations that predict that a taper ratio of a/b=0.33 cause flexural plastic hinges
to form at the quarter points midway between the middle and ends of the link. The magnitude of
equivalent plastic strains can be an order of magnitude larger for straight links (a/b=1.0) as
compared to butterfly-shaped links that promote more distributed yielding along the link length
(e.g. a/b=0.33). This suggests that straight links will have less inelastic deformation capacity
which is consistent with past testing. The results also suggest that having even a little taper (e.g.
a/b=0.75) causes a substantial reduction in equivalent plastic strains.
The taper ratio and width ratio were shown to control the amount of hardening and overstrength
a butterfly-shear link will develop. For the purposes of this study overstrength was defined as the
peak shear force from the FE model divided by the shear yield force and did not consider fracture.
The configurations with taper ratio a/b=0.33 led to smaller overstrength, between one and two
whereas other taper ratios led to overstrength as large as four for width ratios of b/L=0.1 and
approximately two for width ratio of b/L=0.4.
It was shown that configurations with wide links (large b/L) and thin plates (large L/t) were
susceptible to lateral torsional buckling which reduced the amount of energy dissipation and

25
equivalent viscous damping. However, these configurations produced larger equivalent viscous
damping at small shear angles because they become inelastic at smaller drift angles.
In general, the results of this study reinforce previous research that recommends a/b=0.33 to
create flexural plastic hinges at the quarter points, promote inelasticity away from geometric
discontinuities (i.e. corners), and thus resist fracture. The a/b=0.33 geometry was also found to
limit the amount of hardening and overstrength which is expected to lead to more economical
design of the surrounding frame. If larger hardening is desirable to encourage the spread of
inelasticity to as many structural fuses as possible, then smaller width ratio (e.g. b/L=0.1) and
larger taper ratio (e.g. a/b=0.75) are recommended. In some cases, thinner links that experience
lateral torsional buckling may be desirable to produce inelasticity at small drift angles or to cause
strength degradation after some inelasticity.
Acknowledgments
This material is based upon the work supported by the National Science Foundation under Grant
No. CMMI-1453960. Any opinions, findings, and conclusions or recommendations expressed in
this material are those of the authors and do not necessarily reflect the views of the National
Science Foundation or other sponsors. The Advanced Research Computing (ARC) facilities at
Virginia Tech provided computational resources and technical support for this project.
References
1. Martınez-Rueda, J. E. (2002) “On the Evolution of Energy dissipation Devices for Seismic Design”,
Earthquake Spectra, Vol. 18, No. 2, pp. 309-346.
2. Hitaka T., and Matsui C. (2006) “Seismic performance of Steel Shear Wall with Slits integrated with multi
story composite moment frame”, 5th International conference on behavior of steel structures in seismic areas,
Stessa, Yokohama, Japan.
3. Ma X., Borches E., Pena A., Krawinkler H., Billington S., Dierlein G. (2011) “Design and behavior of steel
shear plates with opening as energy dissipating fuses”, The John A. Blume Earthquake Engineering Center,
Report No. 173.
26
4. Lee C., K Ju Y., Min J., Lho S., and Kim S. (2015) “Non-uniform steel strip dampers subjected to cyclic
loadings”, Engineering Structures, Vol. 99, No. 15, pp. 192–204.
5. Luth G., Krawinkler H., McDonald B., Park M. (2008), “USC School of Cinema, An Example of Reparable
Performance Based Design”, SEAOC 2008, convention proceedings.
6. Kobori T. (2017), “Honeycomb Damper (HDS)”, Retrieved from http://www.kobori-
takken.co.jp/English/randd/ctrl41.html
7. Kobori T., Y. Miura, Fukuzawa, T. Yamanda, T. Arita, Y. Takenaka, N. Miyagwa, N. Tanaka, and T.
Fukumoto, (1992) “Development and application of hysteresis steel dampers”, Earthquake Engineering
Tenth Conference.
8. Farzampour A., Eatherton M. (2018) “Simultaneous Consideration of Shear and Flexural Stresses for
Butterfly-Shaped Dampers Design”, international Conference on Materials Engineering and Applications,
ICMEA, China.
9. Malakoutian M., Berman J.W., Dusicka P., Lopes A. “Seismic Performance and Design of Linked Column
Frame System (LCF)”, 15th world conference on earthquake engineering, Lisbon.
10. Oh S., Kim Y., and Tyo H. (2009) “Seismic performance of steel structures with slit dampers”, Engineering
Structures, Vol. 31, No. 9, pp. 1997-2008.
11. Kawai Y., Ono T., Sato A., and Kondo M. (2016) “Allowable Design Formula for Steel Sheet Shear Walls
with Burring Holes”, Proceedings of the 7th International Conference, Baltimore, Maryland.
12. Simulia (2014) “Dassault Systems Simulia Corporation”, ABAQUS-6.14, Johnston, RI.
13. Farzampour A., and Eatherton M. (2017) “Lateral Torsional Buckling of Butterfly-Shaped Shear Links.
SSRC Annual Stability Conference”, San Antonio, Proc. of Annual Stability Conference Structural Stability
Research Council, USA.
14. Farzampour A., and Eatherton M. (2018) “Parametric Study on Butterfly-shaped Shear Links with Various
Geometries”, 11th National Conference on Earthquake Engineering, 11NCEE, USA.
15. Farzampour A., and Eatherton M. (2018) “Investigating Limit States for Butterfly-Shaped and Straight Shear
Links”, 16th European Conference on Earthquake Engineering, 16ECEE, Greece.
16. AISC 341-16. Seismic Provisions for Structural Steel Buildings. American Institute
of Steel Construction, An American National Standard.
17. Chopra A. (2012) “Dynamics of Structures. Theory and Applications to Earthquake Engineering”, 4th Edition
Prentice Hall.
18. Lee C., Kim S., Kim D., Ryu J., and K Ju Y. (2016) “Numerical and experimental analysis of
combined behavior of shear type friction damper and non-uniform strip damper for multi-level
seismic protection”, Engineering Structures, Vol. 114, pp. 75–92.
19. Teruna D., A. Majid T., and Budiono B. (2015) “Experimental Study of Hysteretic Steel Damper for Energy
Dissipation Capacity”, Advances in Civil Engineering, Hindawi Publishing Corporation, Vol. 2015.