parametric analysis of inelastic …etd.lib.metu.edu.tr/upload/12613654/index.pdfparametric analysis...
TRANSCRIPT

PARAMETRIC ANALYSIS OF INELASTIC INTERACTION IN FRAME-
WALL STRUCTURAL SYSTEMS
A THESIS SUBMITTED TO
THE GRADUATE SCHOOL OF NATURAL AND APPLIED SCIENCES
OF
MIDDLE EAST TECHNICAL UNIVERSITY
BY
SONER SEÇKİNER
IN PARTIAL FULFILLMENT OF THE REQUIREMENTS
FOR
THE DEGREE OF THE MASTER OF SCIENCE
IN
CIVIL ENGINEERING
SEPTEMBER 2011

Approval of the thesis:
PARAMETRIC ANALYSIS OF INELASTIC INTERACTION IN FRAME-
WALL STRUCTURAL SYSTEMS
submitted by SONER SEÇKİNER in partial fulfillment of the requirements for
the degree of Master of Science in Civil Engineering Department, Middle
East Technical University by,
Prof. Dr. Canan Özgen
Dean, Graduate School of Natural and Applied Science
_______________
Prof. Dr. Güney Özcebe
Head of Department, Civil Engineering
_______________
Assoc. Prof. Dr. Afşin Sarıtaş
Supervisor, Civil Engineering Dept., METU
_______________
Examining Committee Members:
Assoc. Prof. Dr. Erdem Canbay
Civil Engineering Dept., METU
_______________
Assoc. Prof. Dr. Afşin Sarıtaş
Civil Engineering Dept., METU
_______________
Assoc Prof. Dr. Murat Altuğ Erberik
Civil Engineering Dept., METU
_______________
Assist. Prof. Dr. Alp Caner
Civil Engineering Dept., METU
_______________
Assist. Prof. Dr. Burcu Güneş
Civil Engineering Dept., Atılım University
_______________
Date:
13.09.2011

iii
I hereby declare that all information in this document has been obtained and
presented in accordance with academic rules and ethical conduct. I also
declare that, as required by these rules and conduct, I have fully cited and
referenced all material and results that are not original to this work.
Name, Last name : Soner SEÇKİNER
Signature :

iv
ABSTRACT
PARAMETRIC ANALYSIS OF INELASTIC INTERACTION IN FRAME-
WALL STRUCTURAL SYSTEMS
Seçkiner, Soner
M.Sc., Department of Civil Engineering
Supervisor: Assoc. Prof. Dr. Afşin Sarıtaş
September 2011, 74 pages
The purpose of this thesis is to investigate the inelastic action in the reinforced
concrete frame-wall structures analytically and with that analysis to follow the
plastic formation of the structure. For this purpose, six mid-rise reinforced
concrete buildings with frame-wall are modeled and analyzed to understand the
effect of the height and base shear force ratio of the wall on the nonlinear
interaction between reinforced concrete wall and frame members under static
lateral loads and ground motion excitations. The parametric analysis is conducted
by assuming planar response of the buildings under loadings.
The buildings are generated considering the limit design concept suggested by
Turkish Earthquake Code 2007 and Turkish Standards TS500, and the frame-wall
members are modeled by using spread plasticity elements and fiber discretization
of sections. In the analysis stage, each element section is divided into confined
and unconfined regions for detailed modeling of the building by using OpenSEES
nonlinear finite element program. Two dimensional analyses are conducted under
static and dynamic loadings. For static pushover analyses, three different lateral
load cases (Triangular, Uniform and First-Mode Lateral Load Patterns) are

v
considered. For dynamic analyses, eight different ground motions are used. These
ground motions are scaled to the corresponding design response spectrum
suggested by Turkish Earthquake Code 2007 by using RSPMATCH program.
Using the result of the complex and simplified analyses, inter-story drift ratios,
plastic rotations and internal force distributions of the buildings are investigated.
Keywords: Frame-wall structures, reinforced concrete shear wall, nonlinear
analysis, frame-wall interaction

vi
ÖZ
DUVAR-ÇERÇEVE YAPISAL SİSTEMLERDE ELASTİK OLMAYAN
ETKİLEŞİMİN PARAMETRİK ÇÖZÜMLENMESİ
Seçkiner, Soner
Yüksek Lisans, İnşaat Mühendisliği Bölümü
Tez Yöneticisi: Doç. Dr. Afşin Sarıtaş
Eylül 2011, 74 sayfa
Bu tezin amacı çerçeveli ve duvarlı betonarme yapıların doğrusal olmayan
davranışını analitik olarak incelemek ve bu analizlerle binada meydana gelen
plastikleşmeyi takip etmektir. Bu amaca yönelik olarak altı adet orta yükseklikte
çerçeveli ve duvarlı betonarme binanın tasarımı yapılmıştır. Bu binaların
tasarımındaki parametrik farklılıklar toplam bina yüksekliği ve duvar tabanında
taşınan kesme kuvveti oranı sonucudur. Binaların tepkisinin düzlemsel kaldığı
varsayılmış ve statik ve dinamik yüklemeler altında analizleri yapılarak çerçeve
ve duvar elemanları arasındaki doğrusal olmayan etkileşim incelenmiştir.
Çalışmada dikkate alınan binalar Türk Deprem Yönetmeliği 2007’deki ve Türk
Standartları TS500’deki limit dizayn önerileri gözetilerek tasarlanmıştır. Çerçeve-
duvar sistemin tüm elemanları yayılı plastisite elemanları ve fiber kesit modelleri
kullanılarak modellenmiştir. Doğrusal olmayan analiz OpenSEES sonlu elemanlar
programı kullanılarak gerçekleştirilmiştir. Her bir kolon, kiriş ve duvar kesidi
üstünde sargılı ve sargısız betonarme bölgelerin davranışı dikkate alınmış ve
doğrusal olmayan malzeme modelleri kullanılmıştır. Binaların analizi aşamasında
davranışın düzlemsel olduğu varsayılarak statik ve dinamik analizler yapılmıştır.
Statik öteleme analizi için üç farklı yatay yükleme (Üçgen, Düzgün Yayılı ve İlk-

vii
mod Yatay Yükleme Şablonları) kullanılmıştır. Dinamik analizler için, sekiz farklı
yer hareketi kullanılmıştır. Bu yer hareketleri, Türk Deprem Yönetmeliği 2007’de
tavsiye edilen ivme sprektrumuna RSPMATCH programı kullanılarak
ölçeklenmiştir. Bu kompleks ve basitleştirilmiş analizlerin kullanılması
sonucunda, katlar arası ötelenmeler, kritik elemanlarda meydana gelen plastik
dönmeler ve içsel yük dağılımları incelenmiştir.
Anahtar Kelimeler: Çerçeve-duvar binalar, betonarme duvar, doğrusal olmayan
analiz, çerçeve-duvar etkileşimi

viii
To My Family

ix
ACKNOWLEDGEMENTS
The author would like to express his sincere appreciation to his supervisor Assoc.
Prof. Dr. Afşin Sarıtaş for his supervision, guidance, encouragement and patience
throughout this study.
The scholarship provided by the Scientific and Technological Research Council of
Turkey (TÜBİTAK) is gratefully acknowledged.
I would like to thank Assoc. Prof. Dr. Erdem Canbay and Assoc. Prof. Dr. Sinan
Akkar for their comments and suggestions throughout this study.
x
TABLE OF CONTENTS
ABSTRACT ........................................................................................................... iv
ÖZ ........................................................................................................................... vi
ACKNOWLEDGEMENTS .................................................................................... ix
TABLE OF CONTENTS ........................................................................................ x
LIST OF TABLES ................................................................................................. xii
LIST OF FIGURES ............................................................................................. xiii
CHAPTERS
1. INTRODUCTION ............................................................................................. 1
1.1 GENERAL ................................................................................................ 1
1.2 RESEARCH OBJECTIVE AND SCOPE ................................................ 3
2. LITERATURE SURVEY ................................................................................. 5
2.1 INTRODUCTION .................................................................................... 5
2.3 NONLINEAR INTERACTION IN FRAME-WALL ............................... 5
3. MODELLING AND ANALYSING FRAME ELEMENTS ........................... 11
3.1 INTRODUCTION .................................................................................. 11
3.2 BUILDING MODEL .............................................................................. 11
3.3 ELEMENT MODEL ............................................................................... 18
3.3.1 Beam Element ..................................................................................... 18
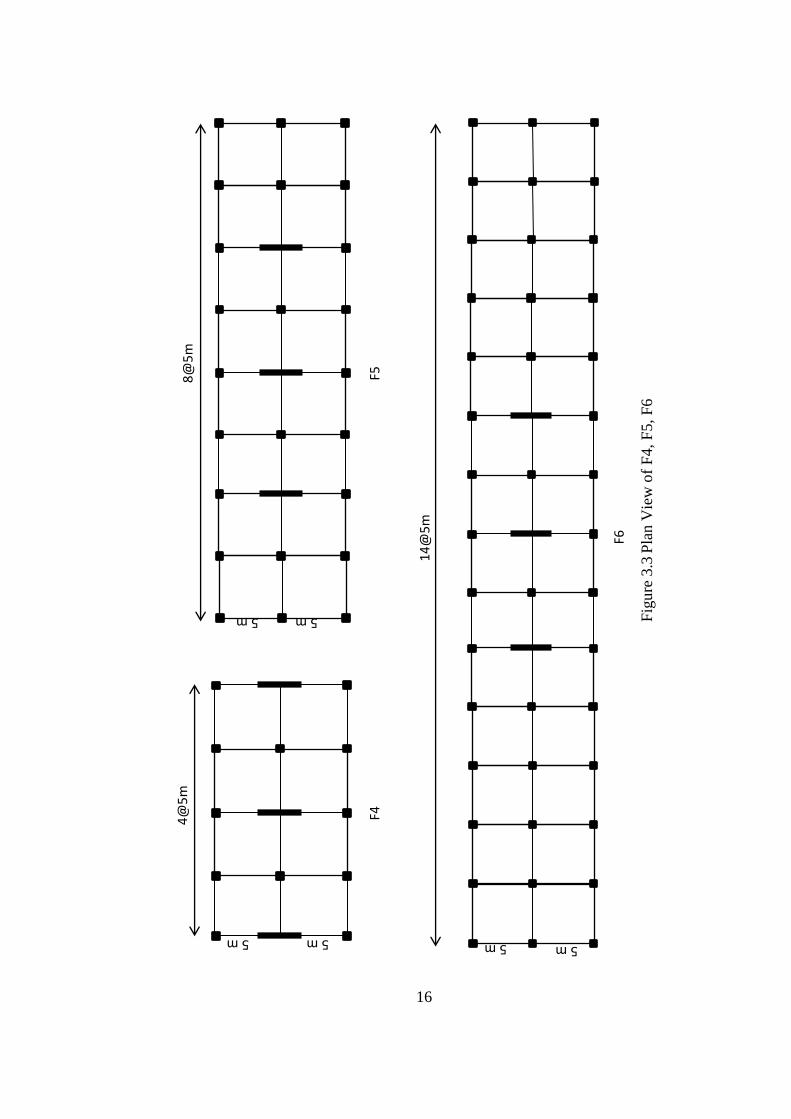
3.3.2 Column and Shear Wall Elements ....................................................... 21
3.4 MATERIAL PROPERTIES ................................................................... 24

xi
3.5 OpenSEES ............................................................................................... 26
3.6 SCALING AND SELECTION OF GROUND MOTIONS ................... 28
3.7 RSPMATCH ........................................................................................... 31
4. RESULTS AND DISCUSSION ..................................................................... 32
4.1 INTRODUCTION .................................................................................. 32
4.2 STATIC PUSHOVER ANALYSES ....................................................... 33
4.2.1 Pushover Results of Selected Elements ............................................... 36
4.2.2 Plastic Rotation of Selected Elements ................................................. 41
4.2.3 Inter-Story Drift ................................................................................... 45
4.2.4 Patterns of Static Load Effects ............................................................ 47
4.2.5 Comparison of Wall Base Shear Ratio ................................................ 51
4.3 NONLINEAR DYNAMIC ANALYSES ............................................... 54
4.3.1 Time-History Analyses Results ........................................................... 55
4.3.2 Plastic Rotation of Selected Elements ................................................. 60
4.3.3 Patterns of Shear Force Distributions .................................................. 63
4.4 SUMMARY ............................................................................................ 67
5. CONCLUSION ............................................................................................... 69
5.1 CONCLUSION ....................................................................................... 69
5.2 RECOMMENDATIONS FOR FUTURE RESEARCH ......................... 71
REFERENCES ...................................................................................................... 72
xii
LIST OF TABLES
TABLES
Table 3.1 The Properties of Selected Buildings .................................................... 13
Table 3.2 Elastic Base Shear Force Ratio of Wall ................................................. 17
Table 3.3 Member Size of Selected Buildings ...................................................... 18
Table 3.4 Properties of Employed Ground Motions .............................................. 29
Table 4.1 Comparison of Inelastic Base Shear Force Ratio of Wall at 0.0% Roof
Drift Ratio .............................................................................................................. 52
Table 4.2 Comparison of Inelastic Base Shear Force Ratio of Wall at 0.5% Roof
Drift Ratio .............................................................................................................. 53
Table 4.3 Comparison of Inelastic Base Shear Force Ratio of Wall at 2.0% Roof
Drift Ratio .............................................................................................................. 54

xiii
LIST OF FIGURES
FIGURES
Figure 2.1 Deformation Modes of Frame-Wall Structures (Emori and Schnobrich,
1978) ........................................................................................................................ 7
Figure 2.2 Typical Deflection of Frames (Goodsir et al., 1982) ............................. 8
Figure 2.3 Lumped Frames of Building (Goodsir et al., 1982) ............................... 9
Figure 2.4 Plan View of Building (Goodsir et al., 1982) ........................................ 9
Figure 3.1 Lumped View of Selected Frames ....................................................... 14
Figure 3.2 Plan View of F1, F2, F3 ....................................................................... 15
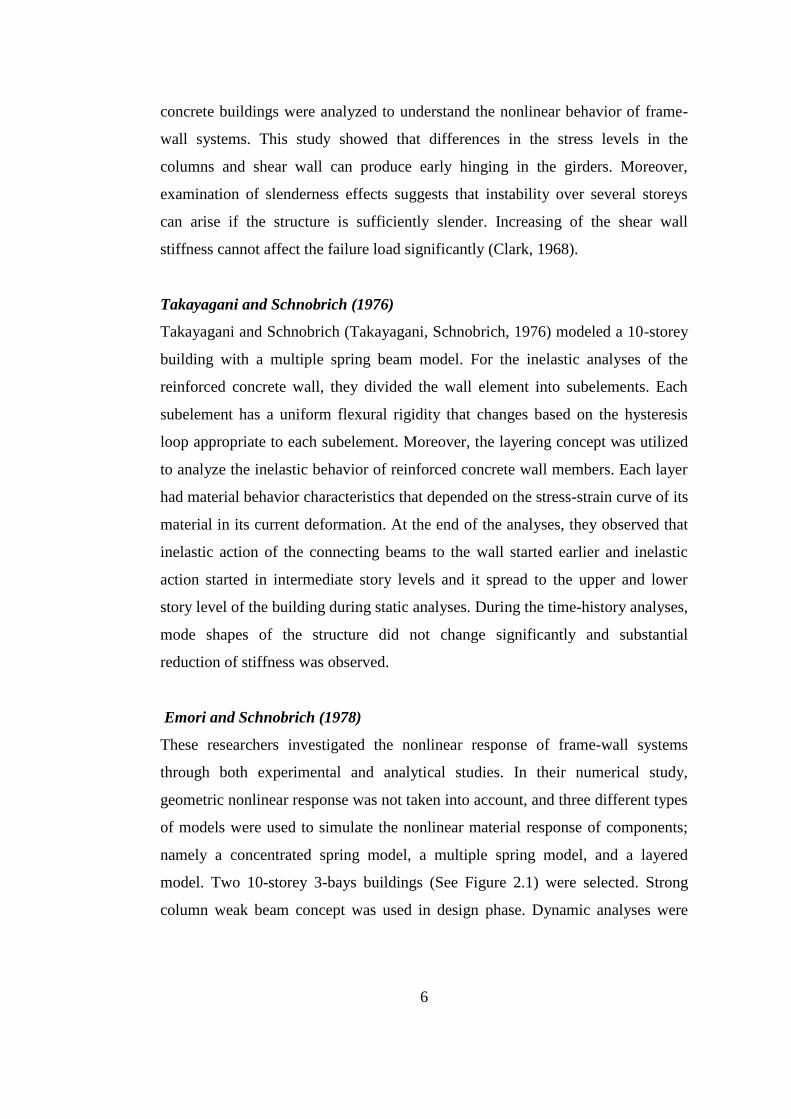
Figure 3.3 Plan View of F4, F5, F6 ....................................................................... 16
Figure 3.4 Sectional Dimension of Beams ............................................................ 20
Figure 3.5 Dimensions of Columns ....................................................................... 21
Figure 3.6 Regions in Shear Wall .......................................................................... 22
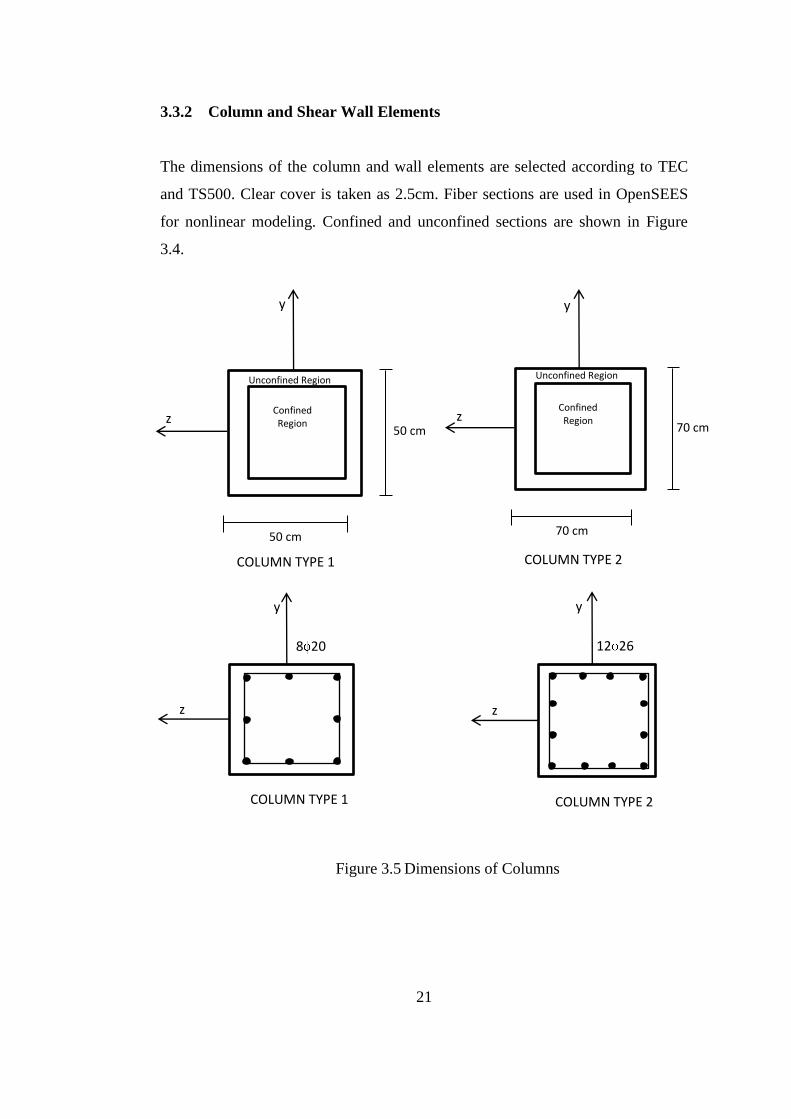
Figure 3.7 Details of Shear Wall ........................................................................... 23
Figure 3.8 Concrete01 Material Model (Mazzoni et al., 2007) ............................. 25
Figure 3.9 Steel02 Material Model (Mazzoni et al., 2007) ................................... 26
Figure 3.10 Fiber Discritation of Beam-Colum Element (Taucer et al., 1991) ..... 27
Figure 3.11 Spectral Acceleration vs. Period for Unscaled Ground Motions (5%
Damped) ................................................................................................................ 30
Figure 3.12 Spectral Acceleration vs. Period for Scaled Ground Motions (5%
Damped) ................................................................................................................ 30
Figure 4.1 Applied Static Lateral Load Patterns ................................................... 33
xiv
Figure 4.2 Total Base Shear vs. Roof Drift Ratio – Triangular Pushover Analysis
............................................................................................................................... 34
Figure 4.3 Total Base Shear vs. Roof Drift Ratio – Uniform Pushover Analysis . 34
Figure 4.4 Total Base Shear vs. Roof Drift Ratio – First-Mode Pushover Analysis
............................................................................................................................... 35
Figure 4.5 Wall Base Shear vs. Roof Drift Ratio – Triangular Pushover Analysis
............................................................................................................................... 36
Figure 4.6 Wall Base Shear vs. Roof Drift Ratio – Uniform Pushover Analysis .. 37
Figure 4.7 Wall Base Shear vs. Roof Drift Ratio – First-Mode Pushover Analysis
............................................................................................................................... 37
Figure 4.8 Total Column Base Shear vs. Roof Drift Ratio – Triangular Pushover
Analysis ................................................................................................................. 39
Figure 4.9 Total Column Base Shear vs. Roof Drift Ratio – Uniform Pushover
Analysis ................................................................................................................. 39
Figure 4.10 Total Column Base Shear vs. Roof Drift Ratio – First-Mode Pushover
Analysis ................................................................................................................. 40
Figure 4.11 Story vs. Maximum Plastic Rotation for Middle Column – Pushover
Analysis ................................................................................................................. 42
Figure 4.12 Story vs. Maximum Plastic Rotation for Wall – Pushover Analysis . 44
Figure 4.13 Story vs. Inter-Story Drift Ratio – Triangular Pushover Analysis ..... 45
Figure 4.14 Story vs. Inter-Story Drift Ratio – Uniform Pushover Analysis ........ 46
Figure 4.15 Story vs. Inter-Story Drift Ratio – First-Mode Pushover Analysis .... 46
Figure 4.16 The Total Internal Force Distributions in Columns at the end of
Triangular Pushover Analysis ................................................................................ 48

xv
Figure 4.17 The Total Internal Force Distributions in Columns at the end of
Uniform Pushover Analysis ................................................................................... 48
Figure 4.18 The Total Internal Force Distributions in Columns at the end of First-
Mode Pushover Analysis ....................................................................................... 49
Figure 4.19 The Total Internal Force Distributions in Wall at the end of Triangular
Pushover Analysis ................................................................................................. 50
Figure 4.20 The Total Internal Force Distributions in Wall at the end of Uniform
Pushover Analysis ................................................................................................. 50
Figure 4.21 The Total Internal Force Distributions in Wall at the end of First-
Mode Pushover Analysis ....................................................................................... 51
Figure 4.22 Normalized Base Shear vs. Maximum Roof Drift for All Buildings –
Time-History Analysis ........................................................................................... 55
Figure 4.23 Story vs. Max. Inter-Story Drift Ratio for All Buildings – Time-
History Analysis of Gm1 ....................................................................................... 56
Figure 4.24 Story vs. Max. Inter-Story Drift Ratio for All Buildings – Time-
History Analysis of Gm2 ....................................................................................... 56
Figure 4.25 Story vs. Max. Inter-Story Drift Ratio for All Buildings – Time-
History Analysis of Gm3 ....................................................................................... 57
Figure 4.26 Story vs. Max. Inter-Story Drift Ratio for All Buildings – Time-
History Analysis of Gm4 ....................................................................................... 57
Figure 4.27 Story vs. Max. Inter-Story Drift Ratio for All Buildings – Time-
History Analysis of Gm5 ....................................................................................... 58
Figure 4.28 Story vs. Max. Inter-Story Drift Ratio for All Buildings – Time-
History Analysis of Gm6 ....................................................................................... 58

xvi
Figure 4.29 Story vs. Max. Inter-Story Drift Ratio for All Buildings – Time-
History Analysis of Gm7 ....................................................................................... 59
Figure 4.30 Story vs. Max. Inter-Story Drift Ratio for All Buildings – Time-
History Analysis of Gm8 ....................................................................................... 59
Figure 4.31 Plastic Rotation of Middle Column – Time-History Analysis ........... 61
Figure 4.32 Plastic Rotation of Wall – Time-History Analysis ............................. 62
Figure 4.33 Story vs. Maximum Total Shear Force / Total Base Shear for
Columns – Time-History Analysis ........................................................................ 64
Figure 4.34 Story vs. Maximum Shear Force / Total Base Shear for Wall – Time-
History Analysis .................................................................................................... 65
1
CHAPTER 1
INTRODUCTION
1.1 GENERAL
Structural walls or more popularly called as shear walls provide significant lateral
rigidity to moment resisting frame systems; thereby reducing displacement
demands on structural components that are either primary or secondary to the
building. In recent years, the need to use shear walls has furthermore increased
especially in earthquake prone regions. Researchers observed that a well-designed
shear-wall when introduced in a moment resisting frame provides increased
energy dissipation during severe earthquakes.
Shear walls in high seismic regions should be well designed because prior
observations showed that the buildings did not reveal good performance even if
they have high wall area to floor area. It is also known that the moment resisting
frame system is sometimes insufficient to carry lateral loads during severe
earthquakes.
According to Turkish Earthquake Code (TEC), frame-wall systems can be
classified in two groups;
High ductile frame-wall system which is composed of high ductile frame
and high ductile shear wall,

2
Mixed type frame-wall system which is composed of normal ductile frame
and high ductile shear wall.
Reinforced concrete walls are regarded as effective lateral force resisting
members and they are capable of conferring good performance to structures
subjected to wind and earthquake. Their resistance against earthquake forces
provides enough strength to the building that it can survive under strong ground
motion with only limited structural damage. As a result, the nonstructural
components are not damaged during earthquake strike, as well (Tjhin, Aschheim,
Wallace, 2006).
While designing buildings, the important point is to decide the sufficient lateral
resistance against earthquakes, winds and blast loads. These forces can produce
high stresses and induce vibrations. Reinforced concrete walls are often chosen
because they provide reliable and economical solution to resist such lateral forces.
Columns have also contribution to the lateral resistance but their contribution is
much smaller than reinforced walls (Schnobrich, 1977).
Practical engineers use elastic analysis methods for the design of the buildings
because it is easy to implement and TEC allows them to use elastic analysis.
However, recent observations show that the response of frame-wall systems is
often in the inelastic range when a strong lateral force due to earthquake force is
acting on the building. Moreover, nowadays contemporary researchers and
engineers frequently use inelastic analysis to understand the behavior of buildings.
The nonlinear approach is much more realistic than elastic approach. Therefore,
the inelastic analysis approach should be preferred while designing and analyzing
the response of buildings, especially if they have complex force redistribution
mechanisms between various load carrying components. Generally, two types of
nonlinear behavior is studied; material nonlinearity and geometric nonlinearity.

3
Combination of material and geometric nonlinearities results in complex
nonlinear stress variations in the members when compared with the stress
variations obtained by first-order linear elastic analysis. This stress variation is
very important to identify the failure mechanism observed in frame-wall system.
Therefore, the frame-wall systems must be studied by considering the nonlinear
behavior of components (Kayal, 1986).
It can be concluded that shear-wall has an important role in nonlinear lateral load
analysis of the building systems. Because of this reason, the nonlinear interaction
between frame-wall should be investigated carefully in the building system.
1.2 RESEARCH OBJECTIVE AND SCOPE
The purpose of this thesis is to investigate analytically the inelastic behavior of
the reinforced concrete planar frame-wall structures and with that analysis to
follow the force redistribution process and the overall plastic formation of the
structure.
Six mid-rise reinforced concrete buildings with frame-wall system are designed
according to the TEC (Turkish Earthquake Code 2007) and Turkish Standards
TS500. The buildings are analyzed and modeled to understand the influence of the
height of building and the base shear force ratio of wall on the nonlinear
interaction between reinforced concrete wall and frame members under static
lateral loads and ground motion excitation.
This thesis is composed of five chapters. In Chapter 2, brief information about
past researches about nonlinear analyses on frame-wall buildings will be
presented. In Chapter 3, modeling details of the building will be introduced and
the analyses details will be given. In Chapter 4, results of the nonlinear seismic

4
and static analyses results will be compared with the different analyses cases.
Finally, the conclusion will be presented in Chapter 5.

5
CHAPTER 2
LITERATURE SURVEY
2.1 INTRODUCTION
The inelastic force redistribution in frame-wall buildings should be investigated
first in order to prevent collapse of the structure (Emori, Schnobrich, 1978). In
this regard, choosing an accurate and relatively simple finite element model
suitable for the nonlinear analysis of the reinforced concrete frame-wall buildings
is very important. Many researches have been reported about nonlinear behavior
of reinforced concrete frame-wall buildings and finite elements methods. In this
chapter, past researches about inelastic interaction in frame-wall structures and
finite element models are discussed.
2.3 NONLINEAR INTERACTION IN FRAME-WALL
Clark (1968)
This is one of the earliest research study published on the nonlinear behavior of
frame-wall structures. The aim of the study was to predict the behavior of large
planar reinforced concrete frame-wall structures through the consideration of
material and geometric nonlinearity in analysis. In the analysis, the nonlinear
material behavior was introduced at the member level through the use of elastic
perfectly plastic moment-curvature relationships. A computer program was
developed using Fortran programming language. The equations of equilibrium
were solved by an iterative procedure. Two 20-storey and 2-bays reinforced
6
concrete buildings were analyzed to understand the nonlinear behavior of frame-
wall systems. This study showed that differences in the stress levels in the
columns and shear wall can produce early hinging in the girders. Moreover,
examination of slenderness effects suggests that instability over several storeys
can arise if the structure is sufficiently slender. Increasing of the shear wall
stiffness cannot affect the failure load significantly (Clark, 1968).
Takayagani and Schnobrich (1976)
Takayagani and Schnobrich (Takayagani, Schnobrich, 1976) modeled a 10-storey
building with a multiple spring beam model. For the inelastic analyses of the
reinforced concrete wall, they divided the wall element into subelements. Each
subelement has a uniform flexural rigidity that changes based on the hysteresis
loop appropriate to each subelement. Moreover, the layering concept was utilized
to analyze the inelastic behavior of reinforced concrete wall members. Each layer
had material behavior characteristics that depended on the stress-strain curve of its
material in its current deformation. At the end of the analyses, they observed that
inelastic action of the connecting beams to the wall started earlier and inelastic
action started in intermediate story levels and it spread to the upper and lower
story level of the building during static analyses. During the time-history analyses,
mode shapes of the structure did not change significantly and substantial
reduction of stiffness was observed.
Emori and Schnobrich (1978)
These researchers investigated the nonlinear response of frame-wall systems
through both experimental and analytical studies. In their numerical study,
geometric nonlinear response was not taken into account, and three different types
of models were used to simulate the nonlinear material response of components;
namely a concentrated spring model, a multiple spring model, and a layered
model. Two 10-storey 3-bays buildings (See Figure 2.1) were selected. Strong
column weak beam concept was used in design phase. Dynamic analyses were

7
conducted, and the results were compared with experimental results. The research
demonstrated remarkable results that inelastic actions play a major role in
controlling the structural response of frame-wall type structures. The results
obtained through the use of multiple spring models demonstrated detailed inelastic
behavior in shear-walls. Frequencies of the structure decrease considerably during
the earthquake motion reflecting a significant reduction of structural component
rigidities.
Figure 2.1 Deformation Modes of Frame-Wall Structures (Emori and Schnobrich,
1978)
Goodsir et al. (1982)
Goodsir et al. (Goodsir, Paulay, Carr, 1982) studied inelastic response of three 12-
storey buildings (See Figure 2.2). The structures composed of seven 2-bays
frames, eight 1-bay frames and a range of three pairs of shear walls which
provided variation in stiffness distribution. Design of the buildings was conducted
by application of capacity design principles to the result of preliminary elastic
analyses. Nonlinear dynamic analysis was conducted, and El Centro N-S, 1940
and Pacoima Dam S14oW, 1971 excitations were used.

8
Figure 2.2 Typical Deflection of Frames (Goodsir et al., 1982)
In order to reduce required time and capacity for the analysis of the structural
system, Goodsir et al. used the lumped frames and lumped walls as shown in
Figures 2.3 and 2.4. They stated that simplifying the structural model by lumping
the frames and walls provided a convenient approach for a parametric analysis
where the response of the building was assumed to remain in the plane. To
investigate the report deeper, Goodsir et al. compared cracked and uncracked
frame and wall elements with inelastic material models by conducting static
lateral load analyses and dynamic analyses. At the end of the analyses, Goodsir et
al. concluded that the buildings showed good resistance to the seismic attack. In
addition, they observed that the structures show similar deflections and maximum
displacement, and as the wall size increased, the fluctuations on the displacement
decreased.

9
Figure 2.3 Lumped Frames of Building (Goodsir et al., 1982)
Figure 2.4 Plan View of Building (Goodsir et al., 1982)

10
Park, Reinhorn, Kunnath (1987)
Park et al. (Park, Reinhorn, Kunnath, 1987) developed an inelastic analysis
program. This program is called IDARC (Inelastic Damage Analysis of
Reinforced Concrete Frame-Shear Wall Structures). IDARC has become popular
since 1987 and various version of the program has been developed by Park et al
(1987). Park et al. used a 7-story building, and modeled the shear-wall and frame
elements by using fiber sections and inelastic material and nonlinear geometry
properties. They modeled the shear-wall with the fiber section column element
and they used rigid end zones for the wall element. They concluded that the
experimental results and analytical computations matched.
Akış (2004)
Akış studied the three dimensional behavior of frame-wall structures with the
purpose of finding the optimum shear wall orientation under dynamic and static
analysis. The analyses were performed by using Sap2000 and Etabs programs
assuming the buildings remain in the elastic range. Akış stated that wide column
analogy for shear walls can be used for the analysis of multistory buildings where
rigid diaphragm floor is valid.
Amiri et al. (2008)
Amiri et al. (Amiri, Ahmadi, Ganjavi, 2008) investigated the inelastic behavior of
frame-wall structures under dynamic analysis. They selected 8-, 12-, 15-storey
buildings for their study and compared the responses of the buildings in terms of
the drift distribution, hysteric energy, and damage index and top-story
displacement under ten severe earthquakes by using IDARC 2D finite element
program. They observed that the damage in the columns was negligible in each
story because of the strong-column and weak-beam consideration. And roof floor
experienced less damage than other story levels.

11
CHAPTER 3
MODELLING AND ANALYSING FRAME ELEMENTS
3.1 INTRODUCTION
This chapter gives information about the analysis methods and selected structural
systems considered in the thesis. Furthermore, the analysis approach and
analytical models used for the components are discussed. For detailed comparison
of the inelastic interaction between the wall and the frame, six reinforced concrete
frames and eight ground motions are employed.
Two mid-rise frame sets used in this study contain 10- to 15-storey frames
including various numbers of bays. Identified according to the names F1, F2, F3
for 10-storey buildings and F4, F5, F6 for 15-storey buildings, the buildings have
2-bay to 12-bay frames.
The ground motion records are selected from Strong Motion Database, Pacific
Earthquake Engineering Research Center (PEER) in order to compare and
contrast the inelastic behavior between wall and frame better.
3.2 BUILDING MODEL
The structural models are generated considering the limit design concept
suggested by TEC (Turkish Earthquake Code, 2007) and Turkish Standards
TS500 (2000). The shear force ratio of the wall to frame is changing in the range

12
of 0.40 to 0.75 which are limit values for high ductile buildings and mixed type of
buildings in TEC. It is worth to mention that these ratios are values obtained from
elastic analyses calculated by using gross moment of inertia of structural
components.
In Chapter 2, it was mentioned that Goodsir et al. analyzed frame systems
composed of variable frame and wall systems. Goodsir et al. lumped the frame
systems and wall systems into the plane for easy parametric analysis (Goodsir,
Paulay, Carr, 1982). The study presented in this thesis also takes advantage of the
convenience of planar analysis by lumping frames as suggested by Goodsir.
Six building models are studied in this thesis. The elastic analyses as part of the
design phase are conducted using the ETABS finite element program (Wilson,
Dovey, Habibullah, 1997), and by following the guidelines presented in TEC and
TS500. Buildings are designed as high ductile frame wall systems. Probina (2010)
is used to check the design of the buildings. Strong column and weak beam design
concept is followed.
In the building models, C30 concrete and S420 steel is used. The height of the
building is 30 m. for F1, F2, F3 frames and 45 m. for F4, F5 and F6 frames.
Number of story is 10 and 15 as shown in Table 3.1. Total mass of buildings are
changing between 753.1 tons and 5261.4 tons and fundamental period of the
buildings are changing from 0.68 sec. to 1.92 sec. as shown in Table 3.1.

13
Table 3.1 The Properties of Selected Buildings
FRAME
Total
Mass
(tons)
Story #
Fundamental
Period T1
(sec)
Story
Height (m)
Number of
Frame
Bays
Number
of Wall
Bays
F1 753.1 10 1.12 3 2 1
F2 2030.4 10 0.82 3 6 1
F3 3309.02 10 0.68 3 10 1
F4 2140.65 15 1.92 3 2 3
F5 3388.95 15 1.77 3 6 3
F6 5261.4 15 1.42 3 12 3
Slab thickness of the buildings is 12 cm and building is composed of either 5 m or
3.5 m beams. All of the slabs are 5 m x 5 m in dimension. Two dimensional view
of building is presented in Figure 3.1, where wall and frames are lumped at the
right of the rigid link and frames are lumped at the left of the building. Once
again, F1, F2 and F3 have ten stories and F4, F5, F6 have fifteen stories.
In Figure 3.2, the plan view of F1 to F3 buildings are shown. F1 has two bays of
frames and one bay of wall, F2 has six bays of frames and one bay of wall and F3
has ten bays of frames. In Figure 3.3, plan view of F4 to F6 buildings are shown.
F4 has two bays of frames and three bays of wall, F5 has six bays of frames and
three bays of wall and F6 has twelve bays of frames and three bays of wall.

14
Fig
ure
3.1
Lum
ped
Vie
w o
f S
elec
ted F
ram
es
5 m
5 m
3.5
m
15@3m
Rig
id L
ink
3.5
m
3 m
10@3m
5 m
5 m
3
.5 m
Rig
id L
ink
3 m
3.5
m
F1, F
2, F
3
F4, F
5, F
6
Mid
dle
Colu
mn

15
2@
5m
5 m 5 m 6
@5
m
5 m 5 m
10
@5m
5 m 5 m
F1
F2
F3
Fig
ure
3.2
Pla
n V
iew
of
F1, F
2,
F3
16
F5
Fig
ure
3.3
Pla
n V
iew
of
F4, F
5,
F6
F6
4@
5m
5 m 5 m
8@
5m
5 m 5 m
14
@5
m
5 m 5 m
F4
F5

17
The static analyses are performed by using ETABS program and the designs are
controlled and verified by Probina. It is assumed that the buildings are in Zone 1
according to TEC and the buildings are residential buildings. All of the members
are assumed to be highly ductile. Only the flexural design is conducted, and it is
assumed that buildings are resistant to shear forces and shear design is not
considered. Strong column weak beam design is strictly checked at each beam-
column connection. Nonlinear analyses are performed in Open System for
Earthquake Engineering Simulation (OpenSEES) by using nonlinear material
models specified at stress-strain level over a cross-section of every member in the
buildings (Mazzoni, McKenna, Scott, Fenves, 2009). It was assumed that the
nonlinear response was mainly affected by material behavior.
Table 3.2 Elastic Base Shear Force Ratio of Wall
FRAME Elastic Base
Shear Force
Ratio of Wall %
F1 75.2
F2 57.1
F3 46.5
F4 73.1
F5 57.7
F6 44.2
Table 3.2 shows the ratio of elastic base shear force of wall to the total base shear
force in the selected buildings designed for the parametric analyses. The values in
the table are obtained from the analysis of the buildings in ETABS by using gross
moment of inertia for the calculation of flexural rigidity of structural components
as suggested by TEC and TS 500. The shear force ratio is changing from 0.40 to
0.75, falling in the range suggested by TEC.

18
3.3 ELEMENT MODEL
The member size of different buildings is shown in Table 3.3. The dimensions are
confirming to the guidelines in TEC 2007 and TS500. The columns are selected as
0.5 m x 0.5 m for F1 to F3 buildings and 0.7 m x 0.7 m for F4 to F6 buildings.
The beams are selected as 0.25 m x 0.55 m for all buildings. In Table 3.3, the
dimension of members is constant over the height of the building.
Table 3.3 Member Size of Selected Buildings
FRAME
Wall
Dimension
(m)
Column
Dimension
(m)
Beam
Dimension
(m)
F1 3 x 0.25 0.5 x 0.5 0.25 x 0.55
F2 3 x 0.25 0.5 x 0.5 0.25 x 0.55
F3 3 x 0.25 0.5 x 0.5 0.25 x 0.55
F4 3 x 0.25 0.7 x 0.7 0.25 x 0.55
F5 3 x 0.25 0.7 x 0.7 0.25 x 0.55
F6 3 x 0.25 0.7 x 0.7 0.25 x 0.55
3.3.1 Beam Element
The dimensions are selected according to TEC and TS500 resulting in 55cm depth
and 25 cm width. Clear cover is selected as 2.5cm. Beam element is modeled in
OpenSEES by using nonlinear force-based frame element and fiber discretization
of the section. Using the fiber section model, unconfined region is defined and
beam is meshed into 10 x 10 pieces.
In Figure 3.4, the gross sectional dimensions and the amount of longitudinal
reinforcement in the beam elements are given. F1, F2, F3 type of frames uses type
1 beams and F4, F5, F6 type of frames uses type 2 beams. Unconfined region of
the beam element is shown in Figure 3.4. In the design phase the beams are

19
supposed to be safe against shear failure, thus, sufficient shear reinforcement
(stirrup) is supplied for beams. In Figure 3.4, the detail of reinforcement is given
for support region of beam. The description of the concrete stress-strain relation
for the unconfined region is presented in the Material Properties Section coming
ahead in this chapter.
In OpenSEES (Mazzoni, McKenna, Scott, Fenves, 2009), fiber-based nonlinear
beam-column element (Taucer, Spacone, Filippou, 1991) is the fundamental tool
used for the nonlinear analysis of framed structural systems. The nonlinear
response of this element is mainly derived by the integration of the material
stress-strain relations over each section, and then the accumulated section
responses give the force-deformation response of the element by using force-
based shape functions. Force-based beam elements are now popularly used in
research due to their accuracy and robustness in the nonlinear analysis of framed
structural systems. In OpenSEES, by using the facility of fiber-based nonlinear
beam-column element, unconfined and confined sections can be defined over the
cross-section of a beam. Moreover, longitudinal reinforcements can be defined in
the same way (See Figure 3.4).

20
z
y
25 cm
55 cm
BEAM
Unconfined Region
BEAM TYPE 1
z
y
2 12
1 14
4 12
1 14
BEAM TYPE 2
5 12
1 14
Figure 3.4 Sectional Dimension of Beams
z
y
3 14
21
3.3.2 Column and Shear Wall Elements
The dimensions of the column and wall elements are selected according to TEC
and TS500. Clear cover is taken as 2.5cm. Fiber sections are used in OpenSEES
for nonlinear modeling. Confined and unconfined sections are shown in Figure
3.4.
Figure 3.5 Dimensions of Columns
50 cm
50 cm
COLUMN TYPE 1
z
y
Unconfined Region
Confined Region
70 cm
70 cm
COLUMN TYPE 2
z
y
Unconfined Region
Confined Region
COLUMN TYPE 1
z
y
8 20
COLUMN TYPE 2
z
y
12 26

22
In Figure 3.5 two types of column are shown. Type 1 is used in buildings F1 to
F3, and type two columns are used in buildings F4 to F6. These members are
designed as high ductile.
Three types of material properties are used to describe the nonlinear material
behavior of concrete in shear wall members (See Figure 3.6). Confined Type 1
has more confinement than other types. The concrete left out of the stirrups is
assumed to compose the unconfined region (See Figure 3.8).
In Figure 3.7, the details of used walls are shown. For buildings F1 to F3 critical
shear wall height is 6 m, and for buildings F4 to F6 critical shear wall height is 9
m. F1, F2, and F3 buildings contain wall type 1 under critical wall height and wall
type 2 over critical wall height. Buildings F4, F5, and F6 use wall type 3 under
critical wall height and wall type 4 over critical wall height. In the figure
boundary zones are shown and its length changes from 40 cm to 60 cm. 2.5 cm
concrete cover is used for the walls.
Confined Type 1
Confined Type 2
z
Confined Type 1
Unconfined
y
Figure 3.6 Regions in Shear Wall
23
60 cm 180 cm 60 cm
8 16 16 12 8 16
22 12
40 cm 220 cm 40 cm
6 14 6 14
60 cm 180 cm 60 cm
8 16 16 12 8 16
40 cm 220 cm 40 cm
8 14 16 12 8 14
Wall Type 1
Wall Type 2
Wall Type 3
Wall Type 4
Figure 3.7 Details of Shear Wall

24
3.4 MATERIAL PROPERTIES
In OpenSEES, the concrete stress-strain relations can be defined as confined and
unconfined with the use of appropriate material parameters, and furthermore the
reinforcing steel can be defined as inelastic. The concrete model is selected as
Concrete01 uniaxial material type (Mazzoni, McKenna, Scott, Fenves, 2007) and
this model is based on Kent-Scott-Park material model (Kent, Park, 1971) with
degraded reloading stiffness proposed by Karsan and Jirsa (Karsan, Jirsa, 1969)
with an assumption of no tensile strength. The model requires compressive and
crushing compressive strengths, and maximum and crushing strains to define the
model. In Figure 3.8, concrete material model of Concrete01 object is shown. In
this model concrete material has no tensile strength. In Figure 3.8, $epsU is
ultimate strain, $epsc0 is strain at peak compressive stress, $fpcu is ultimate stress
and $fpc is peak compressive stress. Equation 3.1 gives the initial elastic modulus
of the material model. For unconfined materials $fpcu parameter is set to zero.
3.1
In all stages of the modeling, compressive strength of concrete is taken as 30
MPa. Detailed material parameters for columns and beams are written in the next,
where the material properties are taken from the study conducted by Orakcal and
Wallace (2006). For the columns, confined concrete has 0.002 strain at maximum
compressive strength and ultimate strain is 0.012. Maximum compressive strength
is 30 MPa and over ultimate strain columns continue to carry a compressive
strength of 6 MPa. Moreover, unconfined concrete has 0.002 strain at maximum
compressive strength and ultimate strain is 0.012. Over ultimate strain, the
unconfined material regions of the columns carry no stress. For the beams, only
unconfined concrete is used over the whole section, where the stress-strain
relations are similar with the unconfined regions of the columns.

25
Figure 3.8 Concrete01 Material Model (Mazzoni et al., 2007)
For the shear walls, three types of material parameters are used as shown in
Figure 3.6. In this figure, the confined type 1 concrete has 0.003 strain at
maximum compressive strength and 0.020 ultimate strain. At ultimate strain wall
has compressive strength of 18 MPa. The confined type 2 concrete has 0.002
strain at maximum compressive strength and 0.014 ultimate strain. At ultimate
strain wall has compressive strength of 4.5 MPa. Furthermore, unconfined region
of wall has 0.002 strain at maximum compressive strength and 0.008 ultimate
strain. Over ultimate strain unconfined regions carry no stress. The calibration of
these material properties falls in line with the methodology presented by Orakcal
and Wallace (2006).
The reinforcements in the elements are modeled as single steel fibers across the
section and this model uses Steel02 material model (Mazzoni et al., 2007).
Steel02 material model uses a uniaxial Giuffre-Menegotto-Pinto steel material
object with isotropic strain hardening (Mazzoni et al., 2007). In Figure 3.9, basic
description of steel02 material model is presented. In this figure, E is the initial
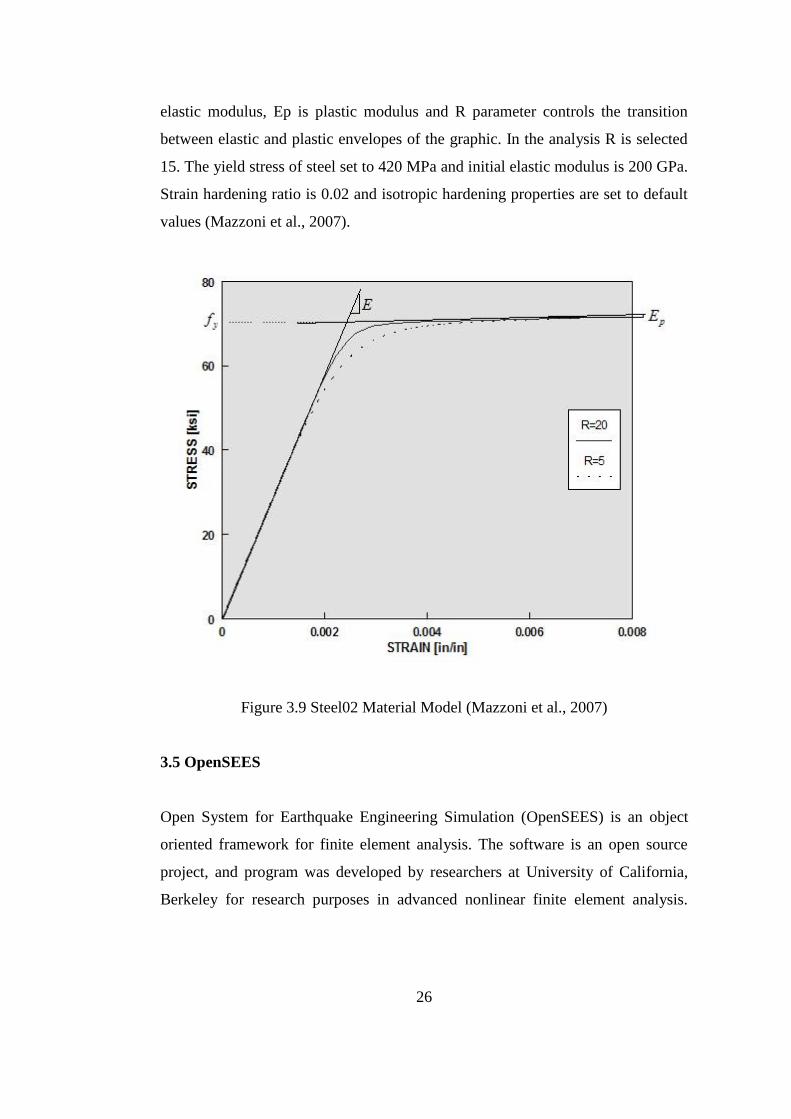
26
elastic modulus, Ep is plastic modulus and R parameter controls the transition
between elastic and plastic envelopes of the graphic. In the analysis R is selected
15. The yield stress of steel set to 420 MPa and initial elastic modulus is 200 GPa.
Strain hardening ratio is 0.02 and isotropic hardening properties are set to default
values (Mazzoni et al., 2007).
Figure 3.9 Steel02 Material Model (Mazzoni et al., 2007)
3.5 OpenSEES
Open System for Earthquake Engineering Simulation (OpenSEES) is an object
oriented framework for finite element analysis. The software is an open source
project, and program was developed by researchers at University of California,
Berkeley for research purposes in advanced nonlinear finite element analysis.

27
OpenSEES has three parts, i.e. Modelbuilder, Domain, and Analysis, and in
addition Recorder part exists. The main objects are controlled by Domain and
other objects control the implementation of the analysis. OpenSEES has a
powerful material, element and analysis libraries for the simulation of nonlinear
models. Tcl scripting language is supported for powerful analysis organization
(Mazzoni et al., 2007).
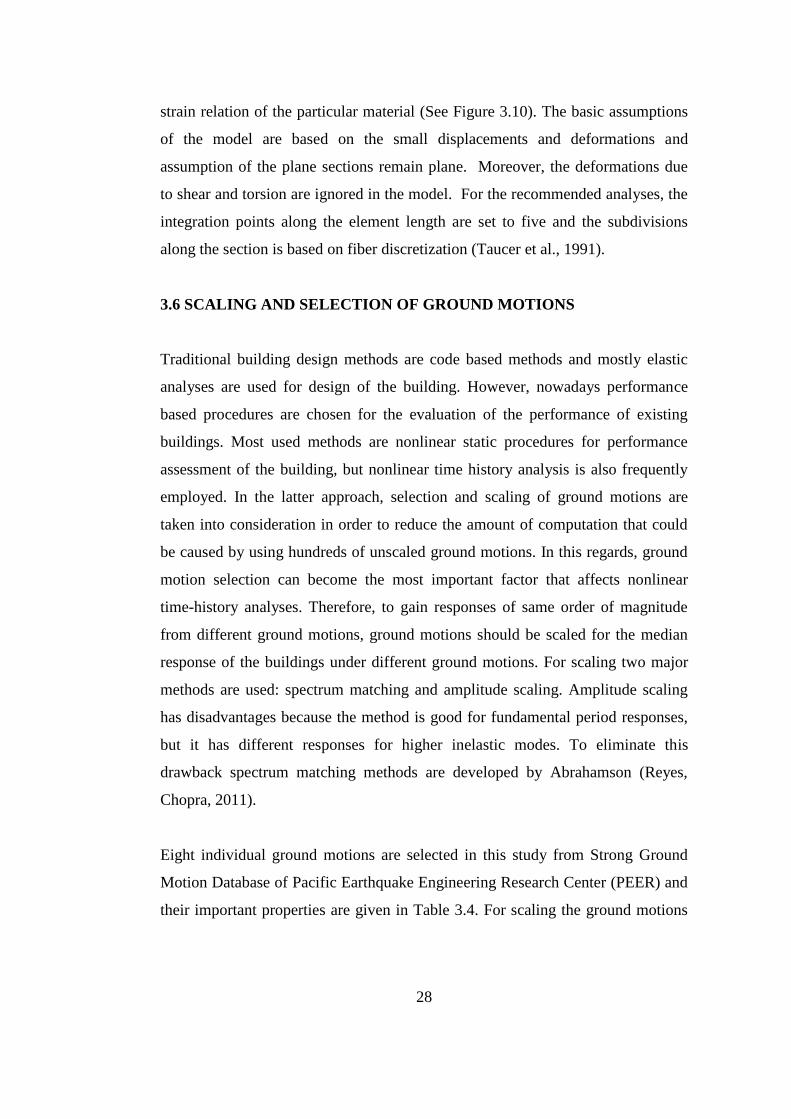
Figure 3.10 Fiber Discritation of Beam-Colum Element (Taucer et al., 1991)
Taucer et al. (1991) developed a nonlinear force-based beam-column element
using fiber discretization of the section. The force-based or also called as
flexibility-based beam element is widely used for nonlinear analysis in research,
and OpenSEES uses this model as its main frame element with nonlinear
capabilities. In the model, the element is divided into longitudinal fibers and the
model uses integration of the response of the fibers by considering uniaxial stress-
28
strain relation of the particular material (See Figure 3.10). The basic assumptions
of the model are based on the small displacements and deformations and
assumption of the plane sections remain plane. Moreover, the deformations due
to shear and torsion are ignored in the model. For the recommended analyses, the
integration points along the element length are set to five and the subdivisions
along the section is based on fiber discretization (Taucer et al., 1991).
3.6 SCALING AND SELECTION OF GROUND MOTIONS
Traditional building design methods are code based methods and mostly elastic
analyses are used for design of the building. However, nowadays performance
based procedures are chosen for the evaluation of the performance of existing
buildings. Most used methods are nonlinear static procedures for performance
assessment of the building, but nonlinear time history analysis is also frequently
employed. In the latter approach, selection and scaling of ground motions are
taken into consideration in order to reduce the amount of computation that could
be caused by using hundreds of unscaled ground motions. In this regards, ground
motion selection can become the most important factor that affects nonlinear
time-history analyses. Therefore, to gain responses of same order of magnitude
from different ground motions, ground motions should be scaled for the median
response of the buildings under different ground motions. For scaling two major
methods are used: spectrum matching and amplitude scaling. Amplitude scaling
has disadvantages because the method is good for fundamental period responses,
but it has different responses for higher inelastic modes. To eliminate this
drawback spectrum matching methods are developed by Abrahamson (Reyes,
Chopra, 2011).
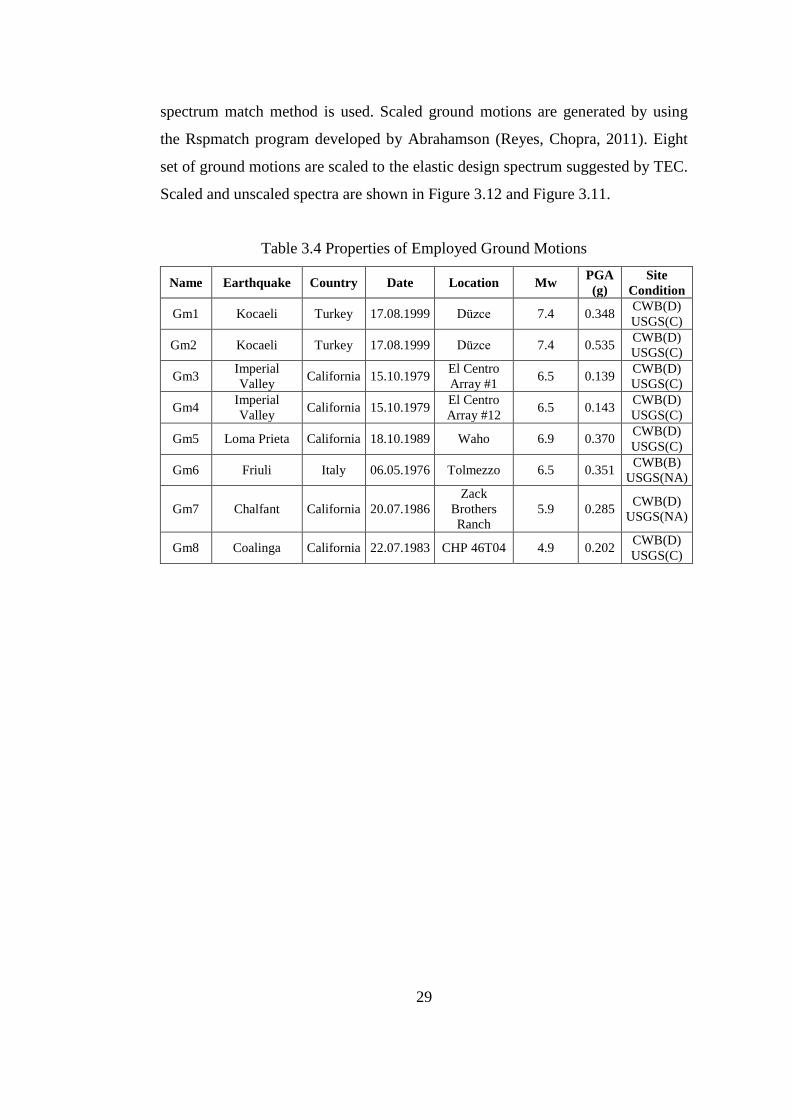
Eight individual ground motions are selected in this study from Strong Ground
Motion Database of Pacific Earthquake Engineering Research Center (PEER) and
their important properties are given in Table 3.4. For scaling the ground motions
29
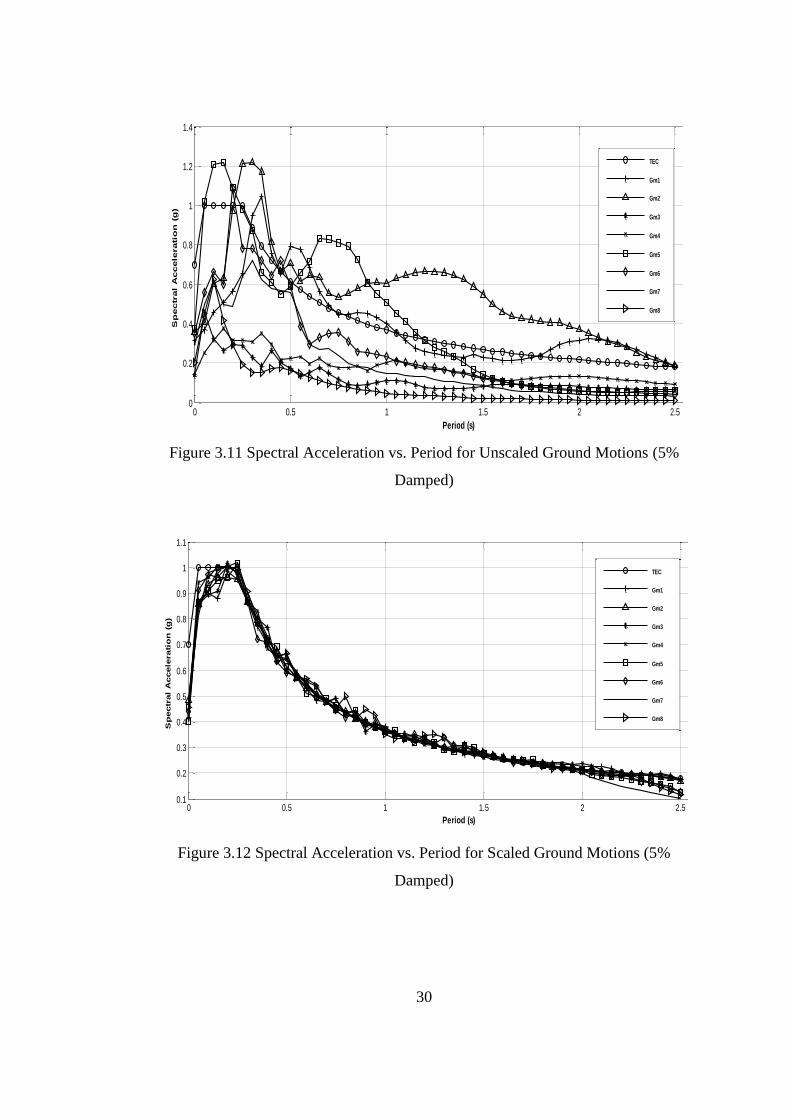
spectrum match method is used. Scaled ground motions are generated by using
the Rspmatch program developed by Abrahamson (Reyes, Chopra, 2011). Eight
set of ground motions are scaled to the elastic design spectrum suggested by TEC.
Scaled and unscaled spectra are shown in Figure 3.12 and Figure 3.11.
Table 3.4 Properties of Employed Ground Motions
Name Earthquake Country Date Location Mw PGA
(g)
Site
Condition
Gm1 Kocaeli Turkey 17.08.1999 Düzce 7.4 0.348 CWB(D)
USGS(C)
Gm2 Kocaeli Turkey 17.08.1999 Düzce 7.4 0.535 CWB(D)
USGS(C)
Gm3 Imperial
Valley California 15.10.1979
El Centro
Array #1 6.5 0.139
CWB(D)
USGS(C)
Gm4 Imperial
Valley California 15.10.1979
El Centro
Array #12 6.5 0.143
CWB(D)
USGS(C)
Gm5 Loma Prieta California 18.10.1989 Waho 6.9 0.370 CWB(D)
USGS(C)
Gm6 Friuli Italy 06.05.1976 Tolmezzo 6.5 0.351 CWB(B)
USGS(NA)
Gm7 Chalfant California 20.07.1986
Zack
Brothers
Ranch
5.9 0.285 CWB(D)
USGS(NA)
Gm8 Coalinga California 22.07.1983 CHP 46T04 4.9 0.202 CWB(D)
USGS(C)
30
Figure 3.11 Spectral Acceleration vs. Period for Unscaled Ground Motions (5%
Damped)
Figure 3.12 Spectral Acceleration vs. Period for Scaled Ground Motions (5%
Damped)
0 0.5 1 1.5 2 2.50
0.2
0.4
0.6
0.8
1
1.2
1.4
Period (s)
Sp
ectr
al
Accele
rati
on
(g
)
TEC
Gm1
Gm2
Gm3
Gm4
Gm5
Gm6
Gm7
Gm8
0 0.5 1 1.5 2 2.50.1
0.2
0.3
0.4
0.5
0.6
0.7
0.8
0.9
1
1.1
Period (s)
Sp
ectr
al
Accele
rati
on
(g
)
TEC
Gm1
Gm2
Gm3
Gm4
Gm5
Gm6
Gm7
Gm8

31
3.7 RSPMATCH
Rspmatch is developed by Abrahamson in 1993. Rspmatch iteratively adjusts the
original earthquake record to a target spectrum in time domain. The program can
add wavelets having specified period ranges and limited durations to the input
ground motion for scaling. This method is also called non-stationary spectrum
matching method. The algorithm firstly developed by Lilhanand and Tseng and
then Abrahamson modified the algorithm and developed Rspmatch program
(Fahjan, Ozdemir, 2008). In analysis no filtering is used and twenty iterations are
appropriate for matching the ground motion to the spectrum advised by TEC.
32
CHAPTER 4
RESULTS AND DISCUSSION
4.1 INTRODUCTION
In this chapter, nonlinear pushover and nonlinear dynamic analyses of the
buildings described in the previous chapter are presented. These buildings are
assumed to resist lateral loads in their own planes. In this regard, the buildings are
hypothetical buildings designed for the sake of the research conducted in this
thesis.
Buildings are analyzed under nonlinear static and dynamic loadings in order to
understand the interaction between the frame and wall components. The pushover
analysis is conducted by considering triangular, uniform and first-mode lateral
load patterns presented in Figure 4.1. Nonlinear time-history analyses are utilized
with scaled earthquake motions as mentioned in Chapter 3. To use the advantages
of planar analysis lumped frames are used in two dimensions so that the behavior
of nonlinear interaction between wall and frame can be investigated better.
Moreover, lumped frames give the chance of better parametric study, because the
computational burden can be minimized. For analysis OpenSEES finite element
software package is employed due to its vast library of nonlinear models available
for earthquake simulation of frame structural systems. OpenSEES can provide
outputs that consist of member forces, drift ratios and plastic rotations of the
selected frames. Among these results, particular ones are selected to be presented

33
in this chapter to discuss frame-wall interaction for the buildings having different
height and different framing.
4.2 STATIC PUSHOVER ANALYSES
The pushover curves, plastic rotations, inter-story drifts and member forces of the
10-story buildings F1, F2, F3, and 15-story buildings F4, F5, F6 are presented
through Figure 4.2 to Figure 4.21. The difference between the same story
buildings (e.g. F1 and F2) is due to the percentage of base shear force carried by
the wall in the design phase described in Chapter 3 (Please refer to Table 3.2).
The pushover results of the buildings F1 through F6 are presented in Figure 4.2 to
Figure 4.4. In these figures, total base shear of the buildings and drift of top story
are compared.
Figure 4.1 Applied Static Lateral Load Patterns
c) First Mode b) Uniform a) Triangular
34
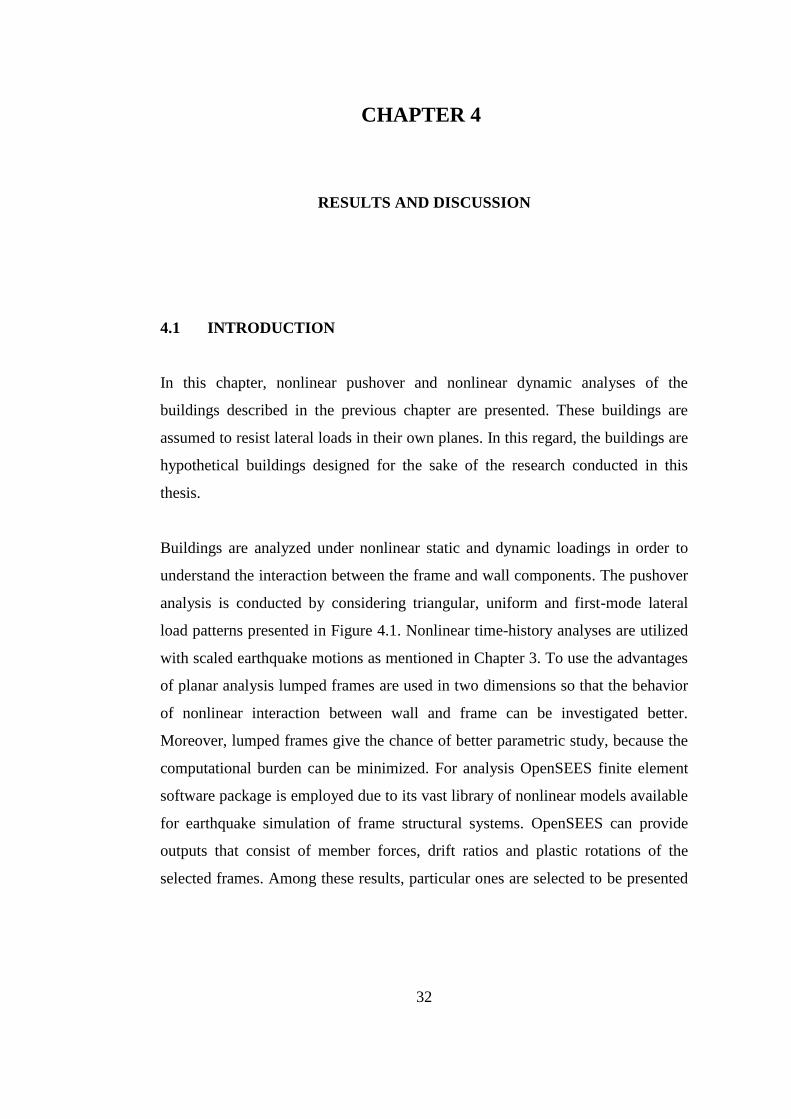
Figure 4.2 Total Base Shear vs. Roof Drift Ratio – Triangular Pushover Analysis
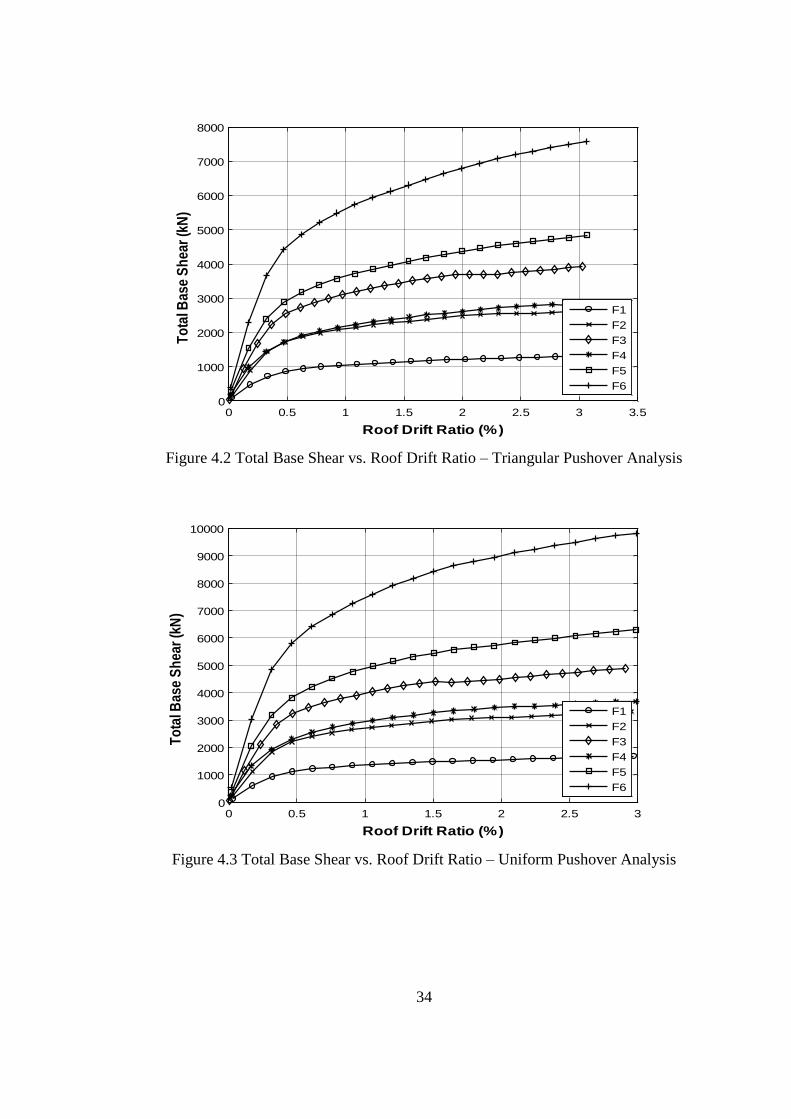
Figure 4.3 Total Base Shear vs. Roof Drift Ratio – Uniform Pushover Analysis
0 0.5 1 1.5 2 2.5 3 3.50
1000
2000
3000
4000
5000
6000
7000
8000
Roof Drift Ratio (%)
To
tal B
ase
Sh
ear
(kN
)
F1
F2
F3
F4
F5
F6
0 0.5 1 1.5 2 2.5 30
1000
2000
3000
4000
5000
6000
7000
8000
9000
10000
Roof Drift Ratio (%)
To
tal B
ase
Sh
ear
(kN
)
F1
F2
F3
F4
F5
F6

35
Figure 4.4 Total Base Shear vs. Roof Drift Ratio – First-Mode Pushover Analysis
Through Figure 4.2 to Figure 4.4, F1, F2 and F3 have 10 stories, and the lateral
stiffness of F1, F2 and F3 increases as the base shear ratio of wall decreases. In
the same way, F4, F5 and F6 have 15 stories, and the lateral stiffness of F4, F5
and F6 increases as the base shear ratio of wall decreases. The 15-story buildings
are stiffer than 10-story buildings because the member sizes of 15-story buildings
are larger. In addition, the triangular and first-mode lateral load cases yield similar
results. After 0.5% roof drift ratio, nonlinear behavior of buildings are observed
due to the inelastic action in the walls. Thus, the nonlinear behavior of frame-wall
type buildings mainly starts as a result of the nonlinearity in the walls. After 0.5%
roof drift ratio, the buildings perform stable nonlinear behavior even when the
wall appears to soften, because the redistribution between wall and frame provides
the required strength to keep the building’s response ductile. In three lateral
loading cases, uniform loading case punishes the building more than triangular
and first-mode lateral loading cases so that the building have to resist more lateral
load in uniform loading.
0 0.5 1 1.5 2 2.5 3 3.50
1000
2000
3000
4000
5000
6000
7000
8000
Roof Drift Ratio (%)
To
tal B
ase
Sh
ear
(kN
)
F1
F2
F3
F4
F5
F6
36
4.2.1 Pushover Results of Selected Elements
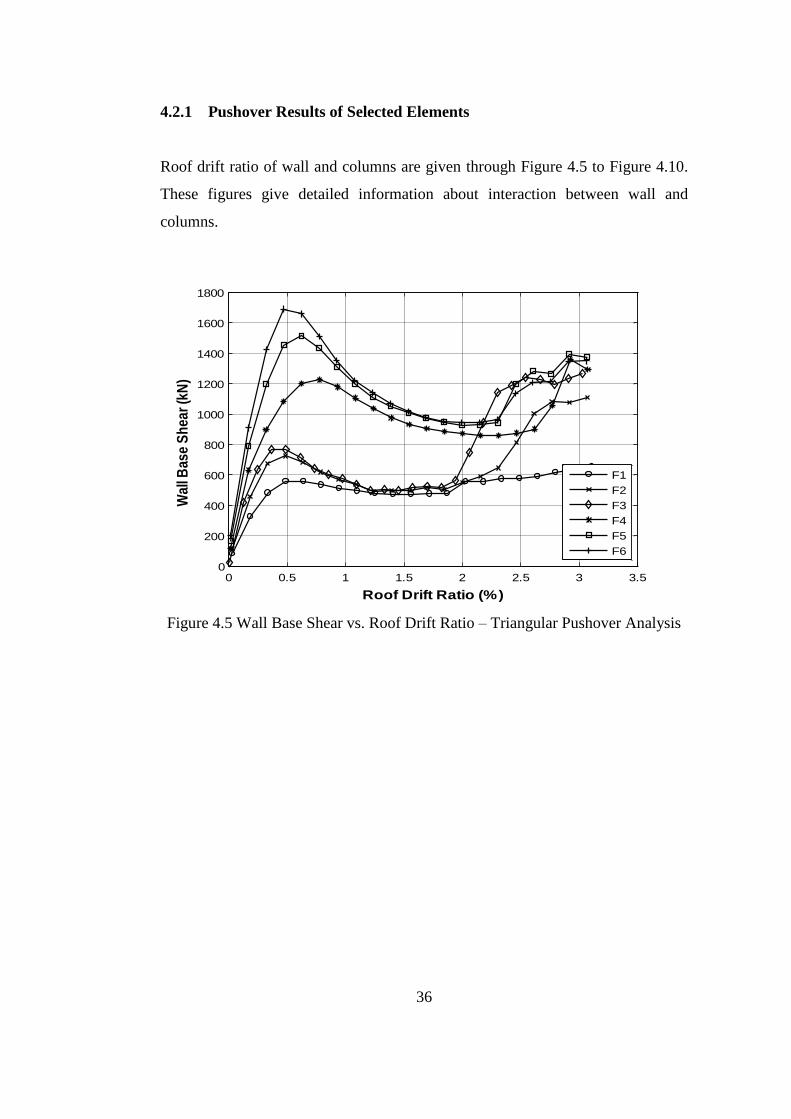
Roof drift ratio of wall and columns are given through Figure 4.5 to Figure 4.10.
These figures give detailed information about interaction between wall and
columns.
Figure 4.5 Wall Base Shear vs. Roof Drift Ratio – Triangular Pushover Analysis
0 0.5 1 1.5 2 2.5 3 3.50
200
400
600
800
1000
1200
1400
1600
1800
Roof Drift Ratio (%)
Wal
l Bas
e S
hea
r (k
N)
F1
F2
F3
F4
F5
F6

37
Figure 4.6 Wall Base Shear vs. Roof Drift Ratio – Uniform Pushover Analysis
Figure 4.7 Wall Base Shear vs. Roof Drift Ratio – First-Mode Pushover Analysis
0 0.5 1 1.5 2 2.5 30
500
1000
1500
2000
2500
Roof Drift Ratio (%)
Wal
l Bas
e S
hea
r (k
N)
F1
F2
F3
F4
F5
F6
0 0.5 1 1.5 2 2.5 3 3.50
200
400
600
800
1000
1200
1400
1600
1800
Roof Drift Ratio (%)
Wal
l Bas
e S
hea
r (k
N)
F1
F2
F3
F4
F5
F6
38
The shear force carried by the walls is presented through Figure 4.5 to Figure 4.7.
The lateral stiffness increases as the base shear ratio of wall decreases in above
figures. The 15-story buildings are stiffer than the 10-story buildings because the
member sizes and reinforcements of wall of 15-story buildings are larger than the
10-story buildings. In addition, the triangular and first-mode lateral load cases
yield similar results for the wall. After 0.5% roof drift ratio, the wall appears to
soften more especially when the height of the building increases. We believe that
this is caused by the redistribution of forces between the wall and frame
components. It is worth to mention that the wall performs stable ductile
performance when it is analyzed by itself alone in OpenSEES (i.e. not connected
to the columns as part of the analysis conducted in F1 to F6 buildings). During
that stand-alone analysis, the wall shows significant nonlinearity due to yielding at
0.5% roof drift ratio, as well, but no softening in the response was observed after
that point. Once again coming back to the results of F1 to F6 buildings, columns
start yielding around 1.5% roof drift ratio, and the walls provide the necessary
capacity for the ductile response of the building after this incidence. In three
lateral loading cases, uniform loading case punishes the building more than
triangular and first-mode loading cases so that the building have to resist more
lateral load in uniform loading.

39
Figure 4.8 Total Column Base Shear vs. Roof Drift Ratio – Triangular Pushover
Analysis
Figure 4.9 Total Column Base Shear vs. Roof Drift Ratio – Uniform Pushover
Analysis
0 0.5 1 1.5 2 2.5 3 3.50
1000
2000
3000
4000
5000
6000
7000
Roof Drift Ratio (%)
To
tal C
olu
mn
Bas
e S
hea
r (k
N)
F1
F2
F3
F4
F5
F6
0 0.5 1 1.5 2 2.5 30
1000
2000
3000
4000
5000
6000
7000
8000
Roof Drift Ratio (%)
To
tal C
olu
mn
Bas
e S
hea
r (k
N)
F1
F2
F3
F4
F5
F6

40
Figure 4.10 Total Column Base Shear vs. Roof Drift Ratio – First-Mode Pushover
Analysis
The shear force carried by the columns is presented through Figure 4.8 to Figure
4.10. The lateral stiffness of total columns in a building increases as the base shear
ratio of the wall of that building decreases. Moreover, the increase in building
height raises the lateral stiffness of the building. The triangular and first-mode
lateral load cases yield similar results for the columns. After 1.5% roof drift ratio,
the columns start to crack, therefore, the wall starts to supply the necessary
capacity for large drift of the building. F1 is the weakest building among all due to
its design. It can be said that the uniform loading case punishes the columns more
than other loading cases, because some columns starts to crack at lower drift ratio
in uniform loading case.
Through Figure 4.2 to Figure 4.5, it is understood that the change in nonlinear
behavior of the buildings started at 0.5% roof drift ratio and they showed ductile
behavior under different loading cases. Through Figure 4.6 to Figure 4.8, the wall
started to change its nonlinear behavior at 0.5% roof drift ratio, moreover, the
0 0.5 1 1.5 2 2.5 3 3.50
1000
2000
3000
4000
5000
6000
7000
Roof Drift Ratio (%)
To
tal C
olu
mn
Bas
e S
hea
r (k
N)
F1
F2
F3
F4
F5
F6

41
building started to yield at 0.5% ratio. Therefore the general nonlinear behavior of
building was determined by wall. In addition, all walls started to change its
nonlinear behavior at same roof drift ratio because the wall had constant width of
3m and same amount of drift caused the same amount of rotation for the wall and
same amount of strain at the edge reinforcements of the wall. The nonlinear
material properties are same in all reinforced concrete buildings, as a result, the
wall yielded at same roof drift ratio. Therefore, it can be said that the nonlinear
behavior of a frame-wall building depends on the width of the wall significantly.
Once the wall lost its lateral strength, the columns supplied the required amount of
strength to carry the lateral load in the analyses. Interestingly, after 1.5% roof drift
ratio the columns started to crack and the walls started to supply the required
strength for ductile response.
4.2.2 Plastic Rotation of Selected Elements
In this section, inelastic behavior of column and wall elements, maximum plastic
rotations of wall and middle column (See Figure 3.1) are discussed under different
lateral load patterns for detailed investigation of local response of the buildings.

42
Figure 4.11 Story vs. Maximum Plastic Rotation for Middle Column – Pushover
Analysis
In Figure 4.11, maximum envelopes of plastic rotations of the middle column (See
Figure 3.1) of the buildings are given. In Figure 4.11, at the second story level,
concentration in the plastic rotation is seen for all buildings. 15-story buildings
have more plastic rotation at base level than 10-story buildings. Moreover, when
0 0.5 1 1.5 2 2.5
x 10-3
1
2
3
4
5
6
7
8
9
10
Max. Plastic Rotation (rad)
Sto
ry
Push Over Triangular
Push Over Uniform
Push Over First Mode
0 0.2 0.4 0.6 0.8 1 1.2 1.4 1.6 1.8
x 10-3
1
2
3
4
5
6
7
8
9
10
Max. Plastic Rotation (rad)
Sto
ry
Push Over Triangular
Push Over Uniform
Push Over First Mode
0 0.5 1 1.5
x 10-3
1
2
3
4
5
6
7
8
9
10
Max. Plastic Rotation (rad)
Sto
ry
Push Over Triangular
Push Over Uniform
Push Over First Mode
-0.5 0 0.5 1 1.5 2 2.5 3 3.5 4
x 10-3
0
5
10
15
Max. Plastic Rotation (rad)
Sto
ry
Push Over Triangular
Push Over Uniform
Push Over First Mode
0 0.5 1 1.5 2 2.5 3 3.5 4 4.5
x 10-3
0
5
10
15
Max. Plastic Rotation (rad)
Sto
ry
Push Over Triangular
Push Over Uniform
Push Over First Mode
0 1 2 3 4 5
x 10-3
0
5
10
15
Max. Plastic Rotation (rad)
Sto
ry
Push Over Triangular
Push Over Uniform
Push Over First Mode
F1 F2
F3 F4
F5 F6

43
shear force ratio of the wall decreases, in other words, the lateral stiffness of
building increases, the plastic rotation decreases in middle columns. Load cases
do not change the plastic rotation particularly in F1, F4, F5 buildings. However, in
F2 and F3 buildings, uniform lateral load pattern produces slightly different result
than other lateral load pattern. 10-story buildings F2 and F3 have 57.13 %, 46.5 %
elastic base shear force ratio of wall respectively. The reason for the difference of
plastic rotation in these buildings is not known clearly, but it can be said that the
elastic base shear force ratio of wall can affect the plastic rotations of wall in
uniform lateral load pattern.
In Figure 4.12, maximum envelopes of plastic rotations of the wall of the
buildings are given. At second story, concentration in the plastic rotation is seen
for all buildings. The plastic rotation of the wall is not affected due to the change
in building height, because all buildings have 3 m width wall and the width of the
wall influences the nonlinear property the most in these simulations. For 10-story
buildings, at seventh story, plastic rotation increases, because the modal shape of
the building affects the buildings nonlinear behavior. In the same way, for 15-
story building, at tenth story, plastic rotation increases. Loading cases do not
change the plastic rotation particularly except for F2 and F3 buildings. The same
can be concluded for columns in terms of the difference in plastic rotations of wall
for uniform lateral load pattern.

44
Figure 4.12 Story vs. Maximum Plastic Rotation for Wall – Pushover Analysis
To compare the differences of plastic rotations between wall and middle column,
plastic rotations were not observed for wall at top story, but for columns there
were significant plastic rotations. It can be said that there was not a direct
relationship between the plastic rotations of wall and column. The height of
building influenced the column particularly, but the wall was not affected from
-0.005 0 0.005 0.01 0.015 0.02 0.025 0.031
2
3
4
5
6
7
8
9
10
Max. Plastic Rotation (rad)
Sto
ry
Push Over Triangular
Push Over Uniform
Push Over First Mode
0 0.005 0.01 0.015 0.02 0.0251
2
3
4
5
6
7
8
9
10
Max. Plastic Rotation (rad)
Sto
ry
Push Over Triangular
Push Over Uniform
Push Over First Mode
0 0.005 0.01 0.015 0.02 0.0251
2
3
4
5
6
7
8
9
10
Max. Plastic Rotation (rad)
Sto
ry
Push Over Triangular
Push Over Uniform
Push Over First Mode
-0.005 0 0.005 0.01 0.015 0.02 0.0250
5
10
15
Max. Plastic Rotation (rad)
Sto
ry
Push Over Triangular
Push Over Uniform
Push Over First Mode
-0.005 0 0.005 0.01 0.015 0.02 0.0250
5
10
15
Max. Plastic Rotation (rad)
Sto
ry
Push Over Triangular
Push Over Uniform
Push Over First Mode
-0.005 0 0.005 0.01 0.015 0.02 0.0250
5
10
15
Max. Plastic Rotation (rad)
Sto
ry
Push Over Triangular
Push Over Uniform
Push Over First Mode
F1 F2
F3 F4
F5 F6

45
the change of building’s height. Base plastic rotations of middle column nearly
doubled as the building height increased.
4.2.3 Inter-Story Drift
Inter-story drift is an important parameter to investigate for understanding the
relationship between neighboring stories. It develops the displacement transition
between stories. To understand these relationships, maximum envelopes of inter-
story drift ratio of the buildings are given through Figure 4.13 to Figure 4.15.
Figure 4.13 Story vs. Inter-Story Drift Ratio – Triangular Pushover Analysis
1 1.5 2 2.5 3 3.5 40
5
10
15
Story Drift Ratio (%)
Sto
ry
F1
F2
F3.
F4
F5
F6

46
Figure 4.14 Story vs. Inter-Story Drift Ratio – Uniform Pushover Analysis
Figure 4.15 Story vs. Inter-Story Drift Ratio – First-Mode Pushover Analysis
Through Figure 4.13 to Figure 4.15, maximum envelopes of inter-story drift ratio
of the buildings are given. From these figures, it is understood that inter-story drift
1 1.5 2 2.5 3 3.5 4 4.50
5
10
15
Story Drift Ratio (%)
Sto
ry
F1
F2
F3.
F4
F5
F6
1 1.5 2 2.5 3 3.5 40
5
10
15
Story Drift Ratio (%)
Sto
ry
F1
F2
F3.
F4
F5
F6

47
ratio is close to the results of other loading cases for the same building height. The
loading case does not affect the inter-story drift significantly. Moreover, it is clear
that the rapid change in inter-story drift ratio is observed at second story level for
all buildings. While the base shear ratio of wall decreases, the inter-story drift
ratio decreases at the stories near the top story and basement. At the middle
stories, the changes in the base shear ratio of wall do not change the inter-story
ratio of buildings. The increase in the height of building also increases the inter-
story drift ratio.
4.2.4 Patterns of Static Load Effects
In this section, axial force, bending moment and shear force distributions along
each column and wall at the end of the lateral load analyses are presented through
Figure 4.16 to Figure 4.21. It is important to investigate the force levels between
stories because they give the meaningful results for understanding the nonlinear
force distribution among stories and between frame and wall components. To
understand these relationships the static load effects are discussed in this section.

48
Figure 4.16 The Total Internal Force Distributions in Columns at the end of
Triangular Pushover Analysis
Figure 4.17 The Total Internal Force Distributions in Columns at the end of
Uniform Pushover Analysis
0 0.2 0.4 0.6 0.8 10
5
10
15
Axial Force / Total Weight
Sto
ry
F1
F2
F3.
F4
F5
F6
0.1 0.2 0.3 0.4 0.5 0.6 0.7 0.8 0.90
5
10
15
Shear Force / Total Base Shear
Sto
ry
F1
F2
F3.
F4
F5
F6
0 0.1 0.2 0.3 0.4 0.5 0.6 0.7 0.80
5
10
15
Moment / Total Base Moment
Sto
ry
F1
F2
F3.
F4
F5
F6
0 0.2 0.4 0.6 0.8 10
5
10
15
Axial Force / Total Weight
Sto
ry
F1
F2
F3.
F4
F5
F6
0.1 0.2 0.3 0.4 0.5 0.6 0.7 0.80
5
10
15
Shear Force / Total Base Shear
Sto
ry
F1
F2
F3.
F4
F5
F6
0 0.1 0.2 0.3 0.4 0.5 0.6 0.7 0.80
5
10
15
Moment / Total Base Moment
Sto
ry
F1
F2
F3.
F4
F5
F6

49
Figure 4.18 The Total Internal Force Distributions in Columns at the end of First-
Mode Pushover Analysis
Through Figure 4.16 to Figure 4.18, different lateral load results are presented for
columns at the end of the analyses corresponding to approximately 3% roof drift
ratio. In these figures, it is understood that the buildings do not collapse under all
loading cases, because axial load level of columns are adequate for the buildings
to remain safe. In Figure 4.16, the base shear ratio of F1 building is 50% and base
shear ratio of F6 building is 83% at triangular pushover analysis. In elastic
analysis, F1 building has 25% base shear force ratio as mentioned in Chapter 3.
These ratios are different from static analysis, because the nonlinear material
property changes the behavior of the building significantly and at end of the
analysis the columns have less damage than the walls so that the increase in the
base shear ratio in columns is an expected situation. Moreover, it can be said that
same situation are seen in Figure 4.17 and Figure 4.18.
0 0.2 0.4 0.6 0.8 10
5
10
15
Axial Force / Total Weight
Sto
ry
F1
F2
F3.
F4
F5
F6
0.1 0.2 0.3 0.4 0.5 0.6 0.7 0.8 0.90
5
10
15
Shear Force / Total Base Shear
Sto
ry
F1
F2
F3.
F4
F5
F6
0 0.1 0.2 0.3 0.4 0.5 0.6 0.7 0.80
5
10
15
Moment / Total Base Moment
Sto
ry
F1
F2
F3.
F4
F5
F6
50
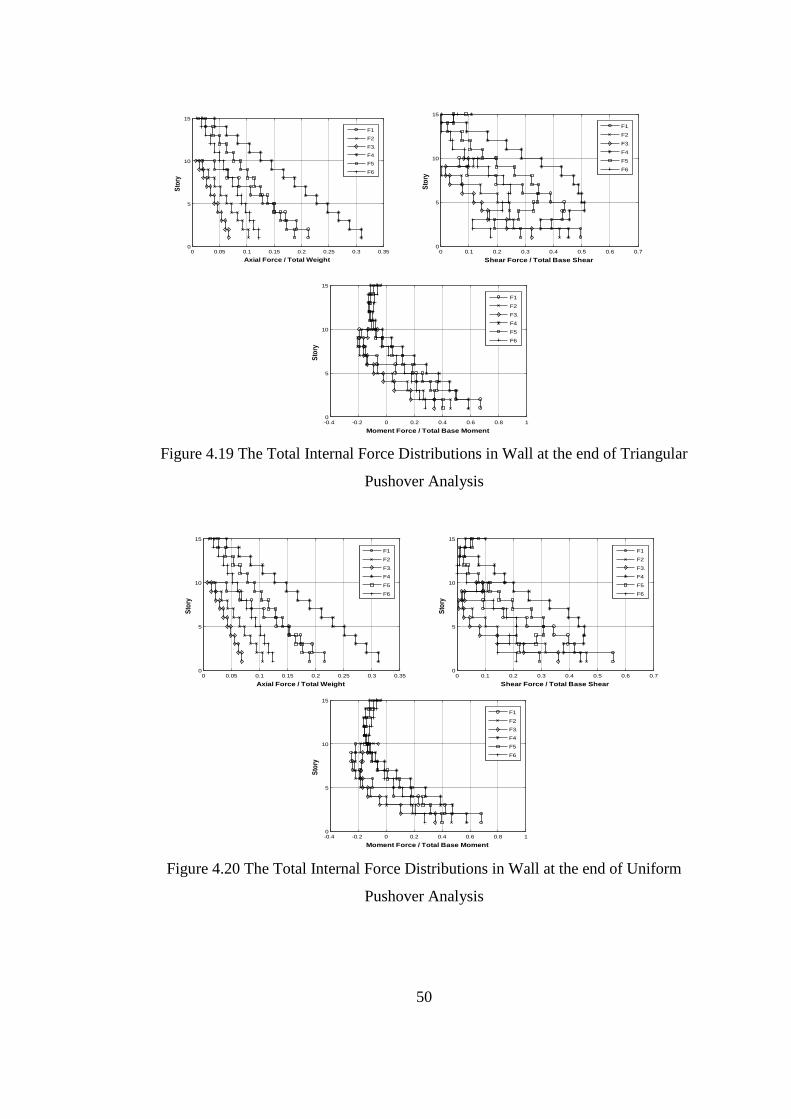
Figure 4.19 The Total Internal Force Distributions in Wall at the end of Triangular
Pushover Analysis
Figure 4.20 The Total Internal Force Distributions in Wall at the end of Uniform
Pushover Analysis
0 0.05 0.1 0.15 0.2 0.25 0.3 0.350
5
10
15
Axial Force / Total Weight
Sto
ry
F1
F2
F3.
F4
F5
F6
0 0.1 0.2 0.3 0.4 0.5 0.6 0.70
5
10
15
Shear Force / Total Base Shear
Sto
ry
F1
F2
F3.
F4
F5
F6
-0.4 -0.2 0 0.2 0.4 0.6 0.8 10
5
10
15
Moment Force / Total Base Moment
Sto
ry
F1
F2
F3.
F4
F5
F6
0 0.05 0.1 0.15 0.2 0.25 0.3 0.350
5
10
15
Axial Force / Total Weight
Sto
ry
F1
F2
F3.
F4
F5
F6
0 0.1 0.2 0.3 0.4 0.5 0.6 0.70
5
10
15
Shear Force / Total Base Shear
Sto
ry
F1
F2
F3.
F4
F5
F6
-0.4 -0.2 0 0.2 0.4 0.6 0.8 10
5
10
15
Moment Force / Total Base Moment
Sto
ry
F1
F2
F3.
F4
F5
F6
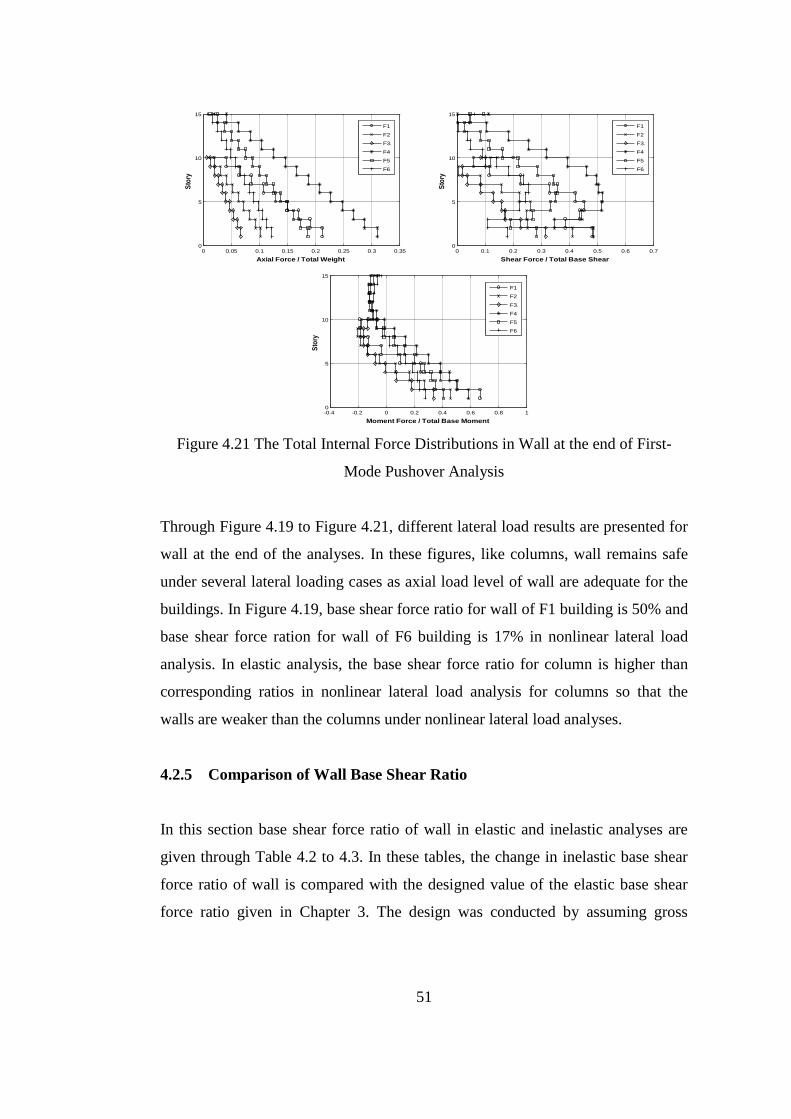
51
Figure 4.21 The Total Internal Force Distributions in Wall at the end of First-
Mode Pushover Analysis
Through Figure 4.19 to Figure 4.21, different lateral load results are presented for
wall at the end of the analyses. In these figures, like columns, wall remains safe
under several lateral loading cases as axial load level of wall are adequate for the
buildings. In Figure 4.19, base shear force ratio for wall of F1 building is 50% and
base shear force ration for wall of F6 building is 17% in nonlinear lateral load
analysis. In elastic analysis, the base shear force ratio for column is higher than
corresponding ratios in nonlinear lateral load analysis for columns so that the
walls are weaker than the columns under nonlinear lateral load analyses.
4.2.5 Comparison of Wall Base Shear Ratio
In this section base shear force ratio of wall in elastic and inelastic analyses are
given through Table 4.2 to 4.3. In these tables, the change in inelastic base shear
force ratio of wall is compared with the designed value of the elastic base shear
force ratio given in Chapter 3. The design was conducted by assuming gross
0 0.05 0.1 0.15 0.2 0.25 0.3 0.350
5
10
15
Axial Force / Total Weight
Sto
ry
F1
F2
F3.
F4
F5
F6
0 0.1 0.2 0.3 0.4 0.5 0.6 0.70
5
10
15
Shear Force / Total Base Shear
Sto
ry
F1
F2
F3.
F4
F5
F6
-0.4 -0.2 0 0.2 0.4 0.6 0.8 10
5
10
15
Moment Force / Total Base Moment
Sto
ry
F1
F2
F3.
F4
F5
F6
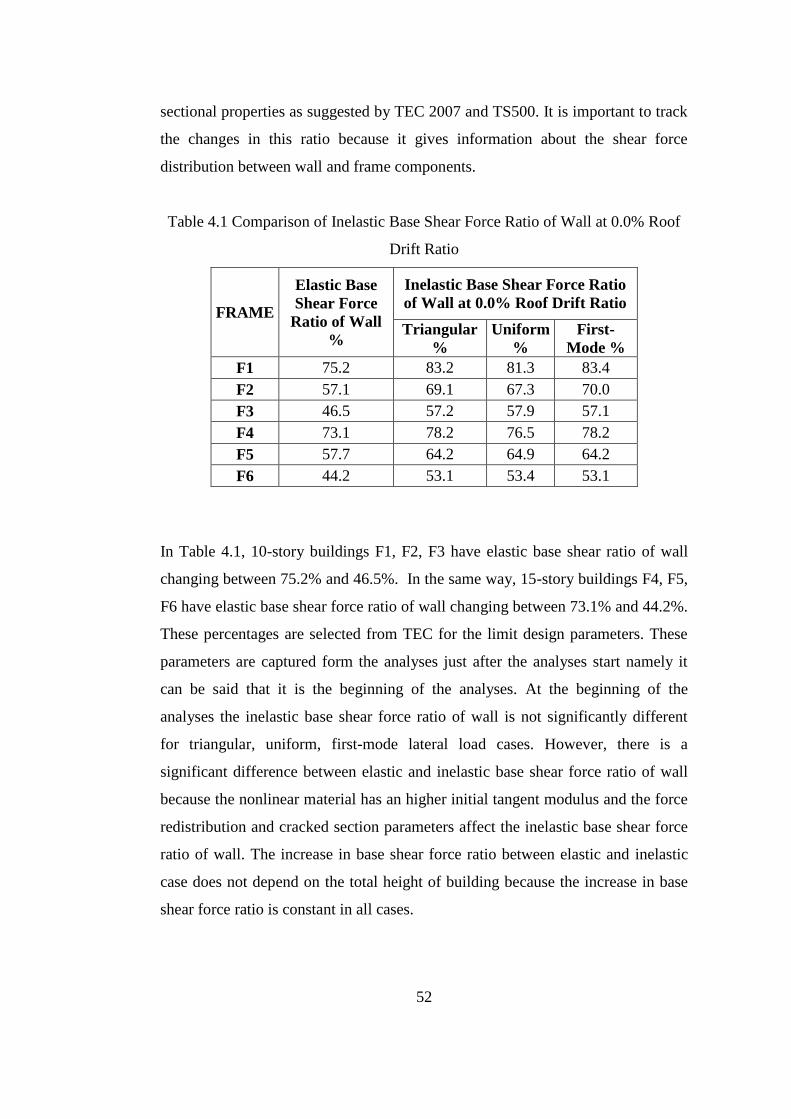
52
sectional properties as suggested by TEC 2007 and TS500. It is important to track
the changes in this ratio because it gives information about the shear force
distribution between wall and frame components.
Table 4.1 Comparison of Inelastic Base Shear Force Ratio of Wall at 0.0% Roof
Drift Ratio
FRAME
Elastic Base
Shear Force
Ratio of Wall
%
Inelastic Base Shear Force Ratio
of Wall at 0.0% Roof Drift Ratio
Triangular
%
Uniform
%
First-
Mode %
F1 75.2 83.2 81.3 83.4
F2 57.1 69.1 67.3 70.0
F3 46.5 57.2 57.9 57.1
F4 73.1 78.2 76.5 78.2
F5 57.7 64.2 64.9 64.2
F6 44.2 53.1 53.4 53.1
In Table 4.1, 10-story buildings F1, F2, F3 have elastic base shear ratio of wall
changing between 75.2% and 46.5%. In the same way, 15-story buildings F4, F5,
F6 have elastic base shear force ratio of wall changing between 73.1% and 44.2%.
These percentages are selected from TEC for the limit design parameters. These
parameters are captured form the analyses just after the analyses start namely it
can be said that it is the beginning of the analyses. At the beginning of the
analyses the inelastic base shear force ratio of wall is not significantly different
for triangular, uniform, first-mode lateral load cases. However, there is a
significant difference between elastic and inelastic base shear force ratio of wall
because the nonlinear material has an higher initial tangent modulus and the force
redistribution and cracked section parameters affect the inelastic base shear force
ratio of wall. The increase in base shear force ratio between elastic and inelastic
case does not depend on the total height of building because the increase in base
shear force ratio is constant in all cases.

53
Table 4.2 Comparison of Inelastic Base Shear Force Ratio of Wall at 0.5% Roof
Drift Ratio
FRAME
Elastic Base
Shear Force
Ratio of Wall
%
Inelastic Base Shear Force Ratio
of Wall at 0.5% Roof Drift Ratio
Triangular
%
Uniform
%
First-Mode
%
F1 75.2 64.1 62.8 63.9
F2 57.1 41.2 39.8 41.9
F3 46.5 49.0 48.1 49.2
F4 73.1 63.1 63.9 63.2
F5 57.7 50.1 47.0 50.1
F6 44.2 38.2 34.2 38.3
In Table 4.2, the inelastic parameters are taken in the analyses at the 0.5% roof
drift ratio. At this point, wall shows different nonlinear behavior and this
nonlinearity affects the inelastic base shear force ratio. All lateral load patterns
produces similar results, thus, it can be said that the inelastic base shear ratio of
wall at the early stages of analyses is not affected from lateral load pattern.
Additionally, the inelastic base shear force ratio of wall drops below the values
corresponding to the elastic analyses and the decrease is constant for all buildings.
Therefore, the change in inelastic base shear ratio of wall is not affected from the
elastic base shear ratio of wall and total buildings height.

54
Table 4.3 Comparison of Inelastic Base Shear Force Ratio of Wall at 2.0% Roof
Drift Ratio
FRAME
Elastic Base
Shear Force
Ratio of Wall
%
Inelastic Base Shear Force Ratio
of Wall at 2.0% Roof Drift Ratio
Triangular
%
Uniform
%
First-Mode
%
F1 75.2 46.1 50.5 43.6
F2 57.1 22.3 36.5 21.2
F3 46.5 33.6 32.8 33.5
F4 73.1 33.1 32.1 34.8
F5 57.7 21.2 27.2 21.9
F6 44.2 14.7 17.5 14.6
In Table 4.3, the results are taken in the analyses at the 2.0% roof drift ratio. At
this point, some of the columns started to yield and wall started to increase its load
carrying capacity. In all loading cases, the inelastic base shear force ratio of wall
is significantly below the elastic base shear force ratio of wall.
4.3 NONLINEAR DYNAMIC ANALYSES
In this section, the behavior of the buildings under eight different earthquakes
records whose details were given in Section 3.5 will be discussed. The
earthquakes records are scaled to the proposed earthquake spectra by TEC. Total
masses are lumped in the corresponding nodes. Due to the scaling of the
earthquake records, the responses of the structures are expected to be similar to
each other.

55
4.3.1 Time-History Analyses Results
Maximum roof drift and inter-story drift ratio of building are investigated through
Figure 4.22 to Figure 4.30. The purpose herein is to investigate analytically the
general response of a reinforced concrete frame-wall structure under eight
different scaled earthquakes records.
Figure 4.22 Normalized Base Shear vs. Maximum Roof Drift for All Buildings –
Time-History Analysis
In Figure 4.22, the absolute maximum roof drift of six buildings under eight
scaled ground motions is plotted against the absolute maximum of the normalized
base shear. The absolute maximum roof drift and normalized base shear is plotted
at same time. From this figure, it is understood that the buildings are in the plastic
range since the wall is known to yield at 0.5% roof drift from prior analyses. The
maximum roof drift ratio is 0.83% in Figure 4.22, which means the buildings
should survive under the scaled earthquakes during time-history analyses. In the
next figures, the inter-story drift ratio of the buildings is presented.
0 0.2 0.4 0.6 0.8 1 1.20
0.05
0.1
Max. Roof Drift (%)
No
rmal
ized
Bas
e S
hea
r ( V
ba
se /
W )
F1
F2
F3
F4
F5
F6

56
Figure 4.23 Story vs. Max. Inter-Story Drift Ratio for All Buildings – Time-
History Analysis of Gm1
Figure 4.24 Story vs. Max. Inter-Story Drift Ratio for All Buildings – Time-
History Analysis of Gm2
0.1 0.2 0.3 0.4 0.5 0.6 0.7 0.80
5
10
15
Story Drift Ratio (%)
Sto
ry
F1
F2
F3
F4
F5
F6
0.1 0.2 0.3 0.4 0.5 0.6 0.7 0.8 0.90
5
10
15
Story Drift Ratio (%)
Sto
ry
F1
F2
F3
F4
F5
F6

57
Figure 4.25 Story vs. Max. Inter-Story Drift Ratio for All Buildings – Time-
History Analysis of Gm3
Figure 4.26 Story vs. Max. Inter-Story Drift Ratio for All Buildings – Time-
History Analysis of Gm4
0 0.2 0.4 0.6 0.8 1 1.2 1.40
5
10
15
Story Drift Ratio (%)
Sto
ry
F1
F2
F3
F4
F5
F6
0 0.2 0.4 0.6 0.8 1 1.2 1.40
5
10
15
Story Drift Ratio (%)
Sto
ry
F1
F2
F3
F4
F5
F6

58
Figure 4.27 Story vs. Max. Inter-Story Drift Ratio for All Buildings – Time-
History Analysis of Gm5
Figure 4.28 Story vs. Max. Inter-Story Drift Ratio for All Buildings – Time-
History Analysis of Gm6
0.1 0.2 0.3 0.4 0.5 0.6 0.7 0.8 0.90
5
10
15
Story Drift Ratio (%)
Sto
ry
F1
F2
F3
F4
F5
F6
0.1 0.2 0.3 0.4 0.5 0.6 0.7 0.8 0.9 10
5
10
15
Story Drift Ratio (%)
Sto
ry
F1
F2
F3
F4
F5
F6

59
Figure 4.29 Story vs. Max. Inter-Story Drift Ratio for All Buildings – Time-
History Analysis of Gm7
Figure 4.30 Story vs. Max. Inter-Story Drift Ratio for All Buildings – Time-
History Analysis of Gm8
0.1 0.2 0.3 0.4 0.5 0.6 0.7 0.80
5
10
15
Story Drift Ratio (%)
Sto
ry
F1
F2
F3
F4
F5
F6
0.1 0.2 0.3 0.4 0.5 0.6 0.7 0.8 0.90
5
10
15
Story Drift Ratio (%)
Sto
ry
F1
F2
F3
F4
F5
F6
60
Through Figure 4.23 to 4.30, maximum envelopes of inter-story drift ratio of all
buildings are shown. Some of the time-history analyses yield similar results. Gm4,
Gm5 and Gm8 produce similar results for inter-story drift. F3 has the strongest
lateral load strength, but in the time-history analyses for Gm1 and Gm3 it
produces the largest inter-story drift ratio at fourth story. It is clear that rapid
change in maximum inter-story drift ratio is observed at the second story of the
buildings. Moreover, the time-history analyses results do not depend on the base
shear ratio of wall and building height.
Despite the fact that the ground motions were scaled with respect to the design
response spectrum proposed by TEC, differences in inter-story drifts were
observed as a result of the nonlinear dynamic analysis of the buildings. It is
important to realize that the scaling procedure obviously does not produce exactly
the same type of ground motion despite the behavior observed in the spectral
acceleration shown in Figure 3.12. Differences are for example due to the duration
of the ground motions, the time where the peak accelerations occur for the scaled
ground motions. Further differences will be discussed in local responses measures
in the next.
4.3.2 Plastic Rotation of Selected Elements
In this section, maximum plastic rotations of wall and middle column (See Figure
3.1) are discussed under different scaled ground motions for detailed investigation
of the local response measures of the buildings.

61
In Figure 4.31, maximum envelopes of plastic rotations of the middle column (See
Figure 3.1) of the buildings are given. In Figure 4.31, at second story, the
concentration in plastic rotation is seen for all buildings. 15-story buildings have
more plastic rotation at base level than 10-story buildings. It is interesting to
observe that the base shear force ratio of wall does not affect the plastic rotations.
Except F1, ground motions produces similar results. The difference in F1 may
0 0.2 0.4 0.6 0.8 1 1.2 1.4 1.6 1.8
x 10-3
1
2
3
4
5
6
7
8
9
10
Max. Plastic Rotation (rad)
Sto
ry
Gm1
Gm2
Gm3
Gm4
Gm5
Gm6
Gm7
Gm8
-2 0 2 4 6 8
x 10-4
1
2
3
4
5
6
7
8
9
10
Max. Plastic Rotation (rad)
Sto
ry
Gm1
Gm2
Gm3
Gm4
Gm5
Gm6
Gm7
Gm8
-1 0 1 2 3 4 5 6 7 8
x 10-4
1
2
3
4
5
6
7
8
9
10
Max. Plastic Rotation (rad)
Sto
ry
Gm1
Gm2
Gm3
Gm4
Gm5
Gm6
Gm7
Gm8
0 0.5 1 1.5 2 2.5 3 3.5
x 10-4
0
5
10
15
Max. Plastic Rotation (rad)
Sto
ry
Gm1
Gm2
Gm3
Gm4
Gm5
Gm6
Gm7
Gm8
0 1 2 3
x 10-4
0
5
10
15
Max. Plastic Rotation (rad)
Sto
ry
Gm1
Gm2
Gm3
Gm4
Gm5
Gm6
Gm7
Gm8
0 0.5 1 1.5 2 2.5 3 3.5
x 10-4
0
5
10
15
Max. Plastic Rotation (rad)
Sto
ry
Gm1
Gm2
Gm3
Gm4
Gm5
Gm6
Gm7
Gm8
F1 F2
F3 F4
F5 F6
Figure 4.31 Plastic Rotation of Middle Column – Time-History Analysis
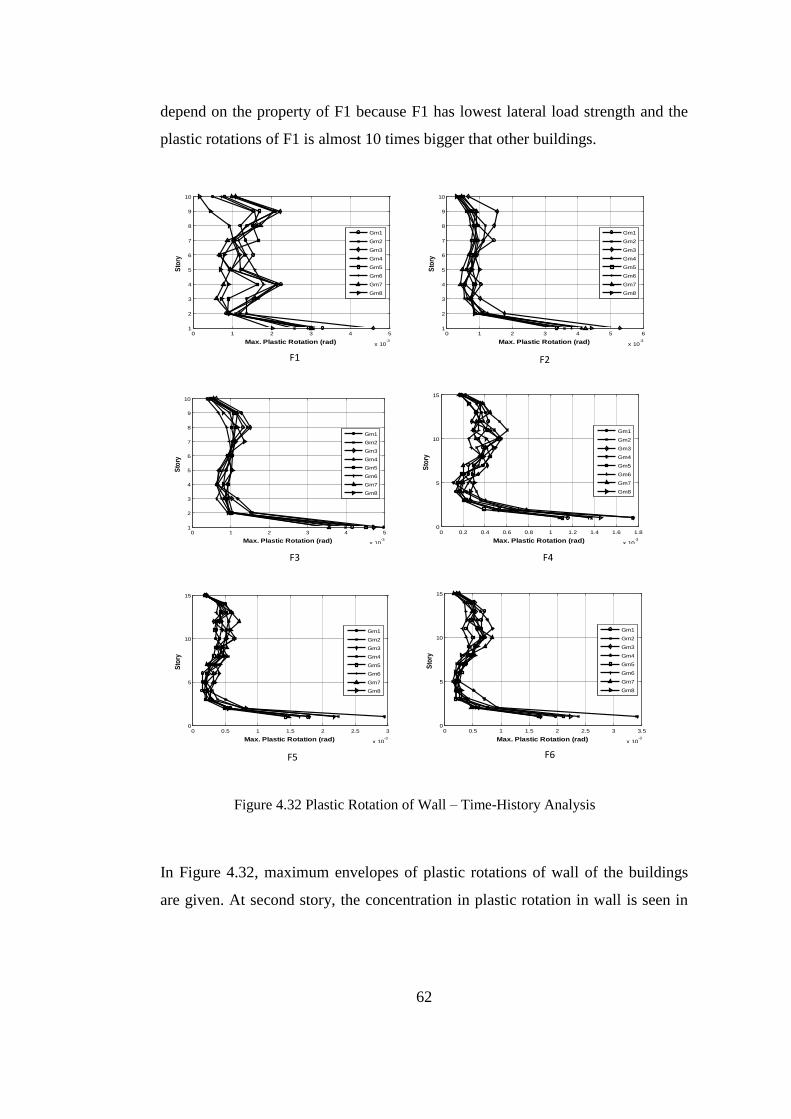
62
depend on the property of F1 because F1 has lowest lateral load strength and the
plastic rotations of F1 is almost 10 times bigger that other buildings.
In Figure 4.32, maximum envelopes of plastic rotations of wall of the buildings
are given. At second story, the concentration in plastic rotation in wall is seen in
0 1 2 3 4 5
x 10-3
1
2
3
4
5
6
7
8
9
10
Max. Plastic Rotation (rad)
Sto
ry
Gm1
Gm2
Gm3
Gm4
Gm5
Gm6
Gm7
Gm8
0 1 2 3 4 5 6
x 10-3
1
2
3
4
5
6
7
8
9
10
Max. Plastic Rotation (rad)
Sto
ry
Gm1
Gm2
Gm3
Gm4
Gm5
Gm6
Gm7
Gm8
0 1 2 3 4 5
x 10-3
1
2
3
4
5
6
7
8
9
10
Max. Plastic Rotation (rad)
Sto
ry
Gm1
Gm2
Gm3
Gm4
Gm5
Gm6
Gm7
Gm8
0 0.2 0.4 0.6 0.8 1 1.2 1.4 1.6 1.8
x 10-3
0
5
10
15
Max. Plastic Rotation (rad)
Sto
ry
Gm1
Gm2
Gm3
Gm4
Gm5
Gm6
Gm7
Gm8
0 0.5 1 1.5 2 2.5 3
x 10-3
0
5
10
15
Max. Plastic Rotation (rad)
Sto
ry
Gm1
Gm2
Gm3
Gm4
Gm5
Gm6
Gm7
Gm8
0 0.5 1 1.5 2 2.5 3 3.5
x 10-3
0
5
10
15
Max. Plastic Rotation (rad)
Sto
ry
Gm1
Gm2
Gm3
Gm4
Gm5
Gm6
Gm7
Gm8
F1 F2
F3 F4
F5 F6
Figure 4.32 Plastic Rotation of Wall – Time-History Analysis

63
all buildings. For 10-story buildings, the plastic rotation does not depend on the
building and 10-story buildings produce similar results. For 15-story buildings,
the plastic rotation do not depend on the building and 15-story buildings produce
similar results. The plastic rotations in the wall do not depend on the height of the
building but F1 produces different plastic rotation patterns. This result might be
caused due to the interaction between wall and frame because the middle columns
produce non-stable plastic rotations for F1 building. It can be concluded that the
wall of F4 building is exposed to least plastic rotation because F4 has great lateral
strength and high base shear force ratio of wall.
4.3.3 Patterns of Shear Force Distributions
In this section, absolute maximum envelopes of shear force distributing along
stories of columns and wall for dynamic analyses are presented in Figure 4.33 and
Figure 4.34. It is important to understand the shear force distribution along stories
because they give meaningful results for understanding the inelastic force
distribution between wall and frame. To understand these, nonlinear dynamic
shear force distribution along stories are discussed in this section.

64
0.1 0.2 0.3 0.4 0.5 0.6 0.7 0.80
5
10
15
Max. Shear Force / Total Base Shear
Sto
ry
F1
F2
F3.
F4
F5
F6
0.2 0.3 0.4 0.5 0.6 0.7 0.8 0.90
5
10
15
Max. Shear Force / Total Base Shear
Sto
ry
F1
F2
F3.
F4
F5
F6
0.1 0.2 0.3 0.4 0.5 0.6 0.7 0.80
5
10
15
Max. Shear Force / Total Base Shear
Sto
ry
F1
F2
F3.
F4
F5
F6
0.2 0.3 0.4 0.5 0.6 0.7 0.8 0.90
5
10
15
Max. Shear Force / Total Base Shear
Sto
ry
F1
F2
F3.
F4
F5
F6
0.1 0.2 0.3 0.4 0.5 0.6 0.7 0.80
5
10
15
Max. Shear Force / Total Base Shear
Sto
ry
F1
F2
F3.
F4
F5
F6
0.2 0.3 0.4 0.5 0.6 0.7 0.8 0.9 10
5
10
15
Max. Shear Force / Total Base Shear
Sto
ry
F1
F2
F3.
F4
F5
F6
0.1 0.2 0.3 0.4 0.5 0.6 0.7 0.80
5
10
15
Max. Shear Force / Total Base Shear
Sto
ry
F1
F2
F3.
F4
F5
F6
0.2 0.3 0.4 0.5 0.6 0.7 0.8 0.9 10
5
10
15
Max. Shear Force / Total Base Shear
Sto
ry
F1
F2
F3.
F4
F5
F6
Gm1 Gm2
Gm3 Gm4
Gm5 Gm6
Gm7 Gm8
Figure 4.33 Story vs. Maximum Total Shear Force / Total Base Shear for
Columns – Time-History Analysis

65
0 0.2 0.4 0.6 0.8 10
5
10
15
Maximum Shear Force / Total Base Shear
Sto
ry
F1
F2
F3.
F4
F5
F6
0 0.1 0.2 0.3 0.4 0.5 0.6 0.7 0.80
5
10
15
Maximum Shear Force / Total Base Shear
Sto
ry
F1
F2
F3.
F4
F5
F6
0 0.1 0.2 0.3 0.4 0.5 0.6 0.7 0.80
5
10
15
Maximum Shear Force / Total Base Shear
Sto
ry
F1
F2
F3.
F4
F5
F6
0 0.1 0.2 0.3 0.4 0.5 0.6 0.7 0.80
5
10
15
Maximum Shear Force / Total Base Shear
Sto
ry
F1
F2
F3.
F4
F5
F6
0 0.1 0.2 0.3 0.4 0.5 0.6 0.70
5
10
15
Maximum Shear Force / Total Base Shear
Sto
ry
F1
F2
F3.
F4
F5
F6
0 0.2 0.4 0.6 0.8 10
5
10
15
Maximum Shear Force / Total Base Shear
Sto
ry
F1
F2
F3.
F4
F5
F6
0 0.1 0.2 0.3 0.4 0.5 0.6 0.70
5
10
15
Maximum Shear Force / Total Base Shear
Sto
ry
F1
F2
F3.
F4
F5
F6
0 0.1 0.2 0.3 0.4 0.5 0.6 0.70
5
10
15
Maximum Shear Force / Total Base Shear
Sto
ry
F1
F2
F3.
F4
F5
F6
Gm1 Gm2
Gm3 Gm4
Gm5 Gm6
Gm7 Gm8
Figure 4.34 Story vs. Maximum Shear Force / Total Base Shear for Wall –
Time-History Analysis

66
In Figure 4.33, the absolute maximum shear force of the columns is shown. In this
figure, eight ground motions are used and the details of the ground motions were
given in Section 3.5. The shear force ratio changes from 34 % to 83 %. It means
that the base shear force ratio is different from the time-history and elastic
analysis. Moreover, the observation from the maximum shear force envelope can
be misleading since the maximum force envelopes do not occur at the same time.
This phenomenon can yield wrong results such that the summation of shear force
percentage can be over hundred percentages. In addition, due to the hysteretic
properties of the material model, the maximum shear force can be misleading for
comparing time-history analyses of two different ground motions because the
reloading numbers of building are not known well for different analyses.
In Figure 4.33, the shear force distribution of columns increases along stories as
the base shear ratio of wall decreases. However F2 and F3 produce similar
distribution in some ground motion analyses. Analysis of F1 under Gm2 ground
motion results in interesting shear force distribution. This situation may be
observed because of the local failures of columns. Moreover, F1 building is the
weakest building and this affects the result.
In Figure 4.34, the absolute maximum shear force of the wall is shown. It is
understood that the shear force ratio changes from 30% to 100%. Thus, in some
cases, the shear wall can take all of the shear force, because local failure of the
columns can result in no shear force in that element. The maximum envelopes of
shear force of wall can be misleading due to the same reason explained above for
columns.

67
4.4 SUMMARY
In this chapter, six buildings were investigated under pushover analysis and time-
history analysis. For pushover analysis, three lateral load patterns were used as
triangular, uniform and first-mode lateral load pattern. The pushover analyses
were done by using OpenSEES. In the analysis stage, some problems were
encountered. First of all, convergence problems were encountered during the
solution of the nonlinear equilibrium equations with the nonlinear algorithms
available in OpenSEES. It is observed that the Krylow Newton (Mazzoni et al.,
2007) algorithm solved most of these problems in this regards. Another problem
was observed due to the use of rigid links in connecting the nonlinear frame
elements having fiber sections. In order to overcome this problem one axially
rigid element was used at each story level. Moreover, besides the buildings in
Chapter 3, three more buildings were designed and modeled in the preliminary
stage of the research conducted in this thesis. The pushover responses of these
buildings had stability and convergence problems close to 2% roof drift ratio; thus
these were not considered as sufficiently ductile for parametric analyses
conducted in this thesis. The encountered problems were caused by the level of
axial force in the load carrying components. To fix this problem the width and
thickness of wall was multiplied by 1.5 and the new buildings were designed.
For static pushover analysis, triangular and first-mode lateral load patterns
produced similar results and uniform lateral load pattern produced more lateral
load under same top story drift ratio, thus the members cracked earlier under
uniform loading. The nonlinear behavior of the wall did not change under
different building height, because the width of wall was 3 m and same top story
drift ratios produced same total rotation in the wall, therefore, the strain at the
edge of wall is same for all buildings and the edge steel of wall yields at same top
story drift ratio for same material model. The nonlinear properties of the column
were different, because the section properties changes for all buildings. Moreover,
68
the force redistribution between wall and columns were worth to be investigated,
because similar pushover results were produced for all buildings. The wall yielded
at 0.5% top story drift ratio, but the necessary strength for stable drift ratio was
supplied by columns. After columns started to crack, the required strength was
supplied by wall because the wall performed perfect ductile performance by itself
and it had necessary strength for ductile performance. Therefore, it could supply
the required strength for ductile response. For wall, the plastic rotation for the
buildings, which had same base shear force ratio under different building height,
was similar because the wall width was same and the wall width dominates the
nonlinear behavior of the wall. However, the columns produced different results
for the buildings, which had same base shear force ratio under different building
height, because the section properties of columns changed for those buildings.
Afterwards, time-history analysis was carried out by using OpenSEES.
Convergence problems encountered were overcome by decreasing the time
increment and by utilizing Newton Line Search (Mazzoni et al., 2007) algorithm.
It is worth to mention that decreasing the step actually resulted in increased
amount of data to be stored for post processing.
For time-history analysis, eight scaled ground motions, whose details were given
in Section 3.5, were utilized. The scaling was made using Rspmatch (Fahjan and
Ozdemir, 2008). The absolute maximum roof drift ratio was 0.83% and minimum
roof drift ratio was 0.42%. Therefore, yielding occurred in the walls and columns.
Maximum plastic rotations were similar for the wall for different height , but
maximum plastic rotations were different for columns, because the dimensions of
the wall was same for different height and column dimensions were different for
different height.
69
CHAPTER 5
CONCLUSION
5.1 CONCLUSION
The modeling of the inelastic behavior of reinforced concrete structures is a
complicated problem, but by adopting simple assumptions and analytical
procedures described in this thesis, reasonable results are obtained. Using realistic
constitutive models for concrete and steel materials, and advanced finite element
models to capture spread of plasticity in structural members, leads to extra
computational effort, but remarkable improvements can be achieved. Considering
these results, the following statements are achieved from this study:
Initial base shear percentages of wall in nonlinear lateral load analyses are
significantly higher than those in elastic analyses.
Load redistribution occurs between wall and frame parts due to the
yielding of wall at 0.5% roof drift ratio. The softening in wall does not
change the general smooth drift behavior of building because the columns
supply the required strength necessary to ensure ductile yielding of the
building. Once the base columns yield at around 1.8% roof drift in this
study, it is observed that the walls then again supply the required strength
to the structural system. Thus, it is observed that the ductility of wall
members in wall-frame systems is the most crucial element in ensuring the
70
overall ductile response of these buildings no matter what the wall
percentage is with respect to the frame.
Due to the overturning effect, lateral load carrying capacity of exterior
columns reduces significantly due to the excessive axial loads. However, it
is observed that the axial load carrying capacity remains in these members,
and the overturning effect does not significantly alter the overall behavior
of the structure.
Rapid change in inter-story drift ratio is observed in frame parts of the
buildings despite the fact that the design is fully compatible with TEC
(Turkish Earthquake Code 2007) and Turkish Standards TS500, and
furthermore checked with regards to the finite element package Probina.
Despite the fluctuations in inter-story drift ratio, wall provides the required
strength for stability of building.
The behavior of frame-wall buildings resembles each other, because the
width of wall dominates the nonlinear behavior of wall and the wall
usually controls the nonlinear behavior of the building.
Plastic rotations of wall show that the wall is a good energy dissipating
member of the buildings.
In pushover analyses, triangular and first-mode lateral load pattern
produce similar results in the buildings, and uniform lateral load pattern
punishes the building more than the other loading cases.
Time-history analyses with scaled ground motions produces similar roof
drift ratio of a building in terms of general response of a building, but it
produces completely different inter-story drifts and member forces in
71
terms of local response measures of a building. Thus, these differences
would require further attention in the design phase.
5.2 RECOMMENDATIONS FOR FUTURE RESEARCH
The following considerations are recommended for future research:
For mid-rise reinforced concrete buildings, different width of walls should be
compared in the nonlinear analyses.
Concentration of inter-story drifts in columns of frame-wall structural
systems should be carefully followed for the building designed in the limits of
the TEC.

72
REFERENCES
Akış, T. (2006), Lateral Load Analysis of Shear Wall–Frame Structures, Ph.D.
Thesis, Middle East Technical University, Ankara.
Amiri, J., Ahmadi, Q., Ganjavi, B. (2008), Assesment of Reinforced Concrete
Buildings with Shear Wall Based on Iranian Seismic Code, Journal of Applied
Sciences, Vol. 8, No. 23,
Clark, W., J. (1968), Analysis of Reinforced Concrete Shear Wall-Frame
Structure, Ph.D. Thesis, University of Alberta, Ottawa, Canada.
Emori, K., Schnobrich, W. (1978), Analysis of Reinforced Concrete Frame-Wall
Structures for Strong Motion Earthquakes, Report No. UILU-ENG 78-2025,
National Science Foundation, University of Illinois, Illinois, USA.
Fahjan, Y., Ozdemir, Z. (2008), Scaling of Earthquake Accelerograms for Non-
Linear Dynamic Analyses to Match the Earthquake Design Spectra, the 14th
Word
Conference on Earthuake Engineering, Beijing, China.
Goodsir, W., Paulay, T., Carr, A. (1982), The Inelastic Seismic Response of
Reinforced Concrete Frame-Shear-Wall Structures, Research Report, University
of Canterbury, Christchurch, New Zealand.
Karsan, I., D., Jirsa, J., O. (1969), Behavior of Concrete under Compressive
Loadings, Journal of the Structural Division, American Society of Civil
Engineers, New York, Vol. 95, 2543-2563.
Kayal, S. (1986), Nonlinear Interaction of RC Frame-Wall Structures, Journal of
Structural Engineering, Vol. 112, No. 5.

73
Kent, D., C., Park, R. (1971), Flexural Members with Confined Concrete, Journal
of the Structural Division, American Society of Civil Engineers, New York, Vol.
97, ST7.
Mazzoni, S., McKenna, F., Scott, M., and Fenves, G. (2009). OpenSEES
Command-Language Manual. Retrieved from http://opensees.berkeley.edu,
27/07/2011.
Orakcal, K., Wallace, J., W. (2006), Flexural Modelling of Reinforced Concrete
Walls – Experimental Verification, ACI Structural Journal, Vol. 103, No. 2, page
196-206
Pacific Earthquake Engineering Research Center (PEER), Strong Motion
Database, Retrieved from http://peer.berkeley.edu/ 21/04/2011.
Probina (2010), Probina for Microsoft Windows, version 15.0 (2010). Reference
Guide Manual. Ankara: Prota Bilgisayar.
Reyes, J., Chopra, A. (2011), Modal Pushover-Based Scaling of Two Components
of Ground Motion Records for Nonlinear RHA of Buildings, Retrieved from
http://nsmp.wr.usgs.gov/ 25/07/2011.
Schnobrich, W. (1977), Behavior of Reinforced Concrete Structures Predicted by
the Finite Element Method, An International Journal, Computers and Structures,
Vol. 7, No. 3 page.
Takayagani, T., Schnobrich, W. (1976), Computed Behavior of Reinforced
Concrete Coupled Shear Walls, Report No. UILU-ENG-76-2024, National
Science Foundation, University of Illinois, Illinois, USA.

74
Taucer, F., F., Spacone, E.,. and Filippou, F., C. (1991), A Fiber Beam-Column
Element for Seismic Response Analysis of Reinforced Concrete Structures, Report
No. UCB/EERC-91/17, California Department of Transportation, National
Science Foundation, Earthquake Engineering Research Center, College of
Engineering, University of California, Berkeley.
Tjhin, T., Aschheim, M., Wallace, J. (2007), Yield Displacement-based seismic
desgn of RC wall Buildings, Engineering Structures, Vol. 29, page 2946–2959.
TS 498 (1987), Design Loads for Buildings, Turkish Standards Institution,
Ankara.
TS 500 (2000), Requirements for Design and Construction of Reinforced
Concrete Structures, Turkish Standards Institution, Ankara.
Turkish Earthquake Code, TEC, (2007), Specification of Buildings to be Built in
Disaster Areas, The Ministry of Public Works and Settlement, Ankara.
Wilson, E., L., Dovey, H., H., Habibullah, A. (1997), “ETABS Three
Dimensional Analysis of Building Systems”, Computers and Structures Inc.,
Berkeley, California, USA.