parameters in characterizing grain size and mechanical
TRANSCRIPT

metals
Article
Comparison of Linear and Nonlinear UltrasonicParameters in Characterizing Grain Size andMechanical Properties of 304L Stainless Steel
Sungho Choi 1, Juyoung Ryu 2, Jae-Seung Kim 3 and Kyung-Young Jhang 1,*1 School of Mechanical Engineering, Hanyang University, Seoul 04763, Korea; [email protected] Department of Mechanical Convergence Engineering, Hanyang University, Seoul 04763, Korea;
[email protected] Center for Robotic & Manufacturing, Institute for Advanced Engineering, Yongin 17180, Korea;
[email protected]* Correspondence: [email protected]; Tel.: +82-2-2220-0434
Received: 7 November 2019; Accepted: 27 November 2019; Published: 28 November 2019
Abstract: Ultrasonic nondestructive techniques can be used to characterize grain size and to evaluatemechanical properties of metals more practically than conventional destructive optical metallographyand tensile tests. Typical ultrasonic parameters that can be correlated with material properties includeultrasonic velocity, ultrasonic attenuation coefficient, and nonlinear ultrasonic parameters. In thiswork, the abilities of these ultrasonic parameters to characterize the grain size and the mechanicalproperties of 304L stainless steel were evaluated and compared. Heat-treated specimens with differentgrain sizes were prepared and tested, where grain size ranged from approximately 40 to 300 µm. Themeasurements of ultrasonic velocity and ultrasonic attenuation coefficient were based on a pulse-echomode, and the nonlinear ultrasonic parameter was measured based on a through-transmissionmode. Grain size, elastic modulus, yield strength, and hardness were measured using conventionaldestructive methods, and their results were correlated with the results of ultrasonic measurements.The experimental results showed that all the measured ultrasonic parameters correlated well withthe average grain size and the mechanical properties of the specimens. The nonlinear ultrasonicparameter provided better sensitivity than the ultrasonic velocity and the ultrasonic attenuationcoefficient, which suggests that the nonlinear ultrasonic measurement would be more effective incharacterizing grain size and mechanical properties than linear ultrasonic measurements.
Keywords: grain size; ultrasonic velocity; ultrasonic attenuation coefficient; nonlinear ultrasonicparameter; 304L stainless steel
1. Introduction
There have been increasing demands for quantitative characterization of material microstructuresthat correlate with mechanical properties of metals in many industrial fields, such as power plant,manufacturing, infrastructure, and so on [1–3]. Grain size is one of the fundamental microstructuralquantities of interest, and it correlates with mechanical properties such as elasticity, plasticity, creep,fatigue, and yield strength [4–6]. Characterizing the grain size can be used to monitor the changesin mechanical properties during the service of structures. Furthermore, the characterization also haspotential for evaluating material degradation due to thermal aging or damage and for predicting theremaining service life of structures [7–9].
Ultrasonic nondestructive techniques have the ability to characterize grain size and evaluatemechanical properties [2,10], which is emerging as an alternative to conventional destructive
Metals 2019, 9, 1279; doi:10.3390/met9121279 www.mdpi.com/journal/metals

Metals 2019, 9, 1279 2 of 14
optical metallography and tensile tests that are time consuming and require cutting specimensfrom structures [5,6]. Ultrasonic parameters that can be effectively used to characterize materialmicrostructures include ultrasonic velocity, ultrasonic attenuation coefficient, and nonlinear ultrasonicparameters [11–38]. The ultrasonic velocity is directly related to mechanical properties, including theelastic modulus and the material density, which are influenced by microstructures such as grains,precipitates, and phase transformations [11–15]. The attenuation of ultrasonic waves depends onmicrostructural features such as grains, dislocations, inclusions, and pores based on absorption,diffraction, and scattering of ultrasonic waves by the microstructures [16–21]. In most cases, scatteringby grains is the dominant attenuation mechanism. The nonlinear ultrasonic parameter is related to theamplitude of a monochromatic fundamental wave propagating through a medium and the amplitudeof higher harmonics due to waveform distortion caused by interaction between the fundamental waveand the microstructures. This nonlinear parameter is also known to be sensitive to microstructuralfeatures. The use of nonlinear ultrasonics was recently intensively studied for characterizing themicrostructure and the material degradation [22–38].
Correlations between grain size and linear ultrasonic parameters, including ultrasonic velocityand attenuation coefficient, have been actively studied [12–15,17–21]. Ultrasonic velocities andscattering coefficients of plane longitudinal and shear waves in polycrystals as a function of grainsize and wavenumber were theoretically explained by Hirsekorn [12]. Attenuation coefficients andscattering regimes, including Rayleigh, stochastic, and diffusion scattering, according to the ratio ofultrasonic wavelength and grain size are well described in the literature [17,18]. Experimental studieson ultrasonic velocity and attenuation coefficient in various steel grades showed that these linearultrasonic parameters were highly correlated with the average grain size [6,13,14]. The increase inaverage grain size caused a decrease in ultrasonic velocity and an increase in attenuation coefficient.Botvina et al. [18] reanalyzed the published data on the correlation between the ultrasonic attenuationcoefficient and the grain size in a number of metals and alloys involving a range of average grainsizes from 12.5 to 300 µm and derived one master curve graph showing the correlation. Non-contacttechniques such as electromagnetic acoustic transducers [19] and laser ultrasonics [20] were also studiedto evaluate grain size. It has been reported that the ultrasonic velocity and the attenuation coefficientare also related to the mechanical properties affected by grain size, including hardness [5,10,21], yieldstrength [5,15], and tensile strength [10]. The increase in average grain size resulted in a decrease inmechanical properties (hardness and strength), which caused a decrease in ultrasonic velocity and anincrease in attenuation coefficient.
Reports on the correlation between grain size and nonlinear ultrasonic parameter are rare in theliterature [7,22]. This is because most previous nonlinear ultrasound studies have focused mainlyon evaluating material degradation, such as fatigue damage [23–25], creep damage [26,27], thermalaging [28–30], and plastic deformation [31,32], in which dominant microstructural characteristics thataffect the nonlinear ultrasonic parameter are dislocation densities [33,34], precipitates [35–37], andphase transformations [38]. Several previous studies showed that there was a good correlation betweenthe grain size and the nonlinear ultrasonic parameter [7,22]. The increase in average grain size causeda decrease in the nonlinear ultrasonic parameter and the hardness.
The previously mentioned studies demonstrated that both linear and nonlinear ultrasonicparameters have a good correlation with grain size and can be effectively used to evaluate grainsize and mechanical properties. After this fundamental verification, the question arises as to whichultrasonic parameter is most sensitive to changes in grain size and mechanical properties. However,it is still difficult to determine the most sensitive parameter simply by comparing the results ofprevious studies because experimental conditions and materials are different in each previous study.Ultrasonic parameters measured under the same experimental conditions must be compared, and it isalso necessary to analyze and compare the sensitivity to both grain size and mechanical properties,including hardness and strength. A comparison of the measurement deviations in each ultrasonicparameter should also be conducted.
Metals 2019, 9, 1279 3 of 14
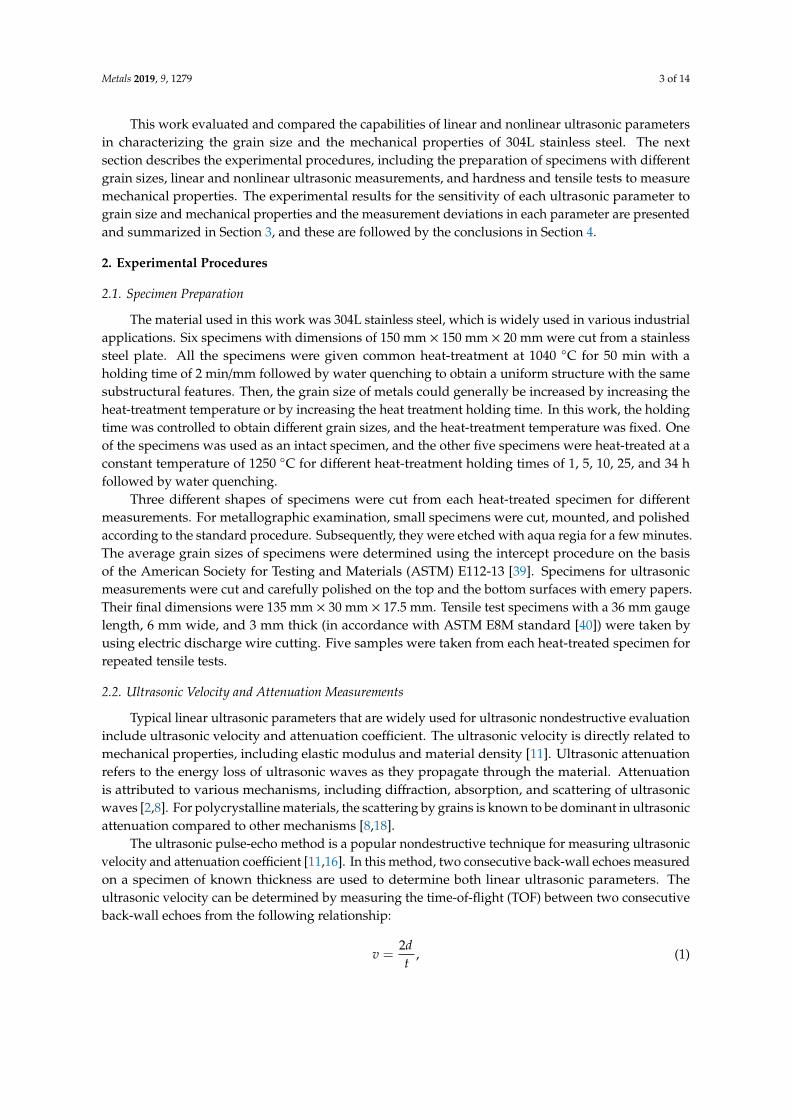
This work evaluated and compared the capabilities of linear and nonlinear ultrasonic parametersin characterizing the grain size and the mechanical properties of 304L stainless steel. The nextsection describes the experimental procedures, including the preparation of specimens with differentgrain sizes, linear and nonlinear ultrasonic measurements, and hardness and tensile tests to measuremechanical properties. The experimental results for the sensitivity of each ultrasonic parameter tograin size and mechanical properties and the measurement deviations in each parameter are presentedand summarized in Section 3, and these are followed by the conclusions in Section 4.
2. Experimental Procedures
2.1. Specimen Preparation
The material used in this work was 304L stainless steel, which is widely used in various industrialapplications. Six specimens with dimensions of 150 mm × 150 mm × 20 mm were cut from a stainlesssteel plate. All the specimens were given common heat-treatment at 1040 C for 50 min with aholding time of 2 min/mm followed by water quenching to obtain a uniform structure with the samesubstructural features. Then, the grain size of metals could generally be increased by increasing theheat-treatment temperature or by increasing the heat treatment holding time. In this work, the holdingtime was controlled to obtain different grain sizes, and the heat-treatment temperature was fixed. Oneof the specimens was used as an intact specimen, and the other five specimens were heat-treated at aconstant temperature of 1250 C for different heat-treatment holding times of 1, 5, 10, 25, and 34 hfollowed by water quenching.
Three different shapes of specimens were cut from each heat-treated specimen for differentmeasurements. For metallographic examination, small specimens were cut, mounted, and polishedaccording to the standard procedure. Subsequently, they were etched with aqua regia for a few minutes.The average grain sizes of specimens were determined using the intercept procedure on the basisof the American Society for Testing and Materials (ASTM) E112-13 [39]. Specimens for ultrasonicmeasurements were cut and carefully polished on the top and the bottom surfaces with emery papers.Their final dimensions were 135 mm × 30 mm × 17.5 mm. Tensile test specimens with a 36 mm gaugelength, 6 mm wide, and 3 mm thick (in accordance with ASTM E8M standard [40]) were taken byusing electric discharge wire cutting. Five samples were taken from each heat-treated specimen forrepeated tensile tests.
2.2. Ultrasonic Velocity and Attenuation Measurements
Typical linear ultrasonic parameters that are widely used for ultrasonic nondestructive evaluationinclude ultrasonic velocity and attenuation coefficient. The ultrasonic velocity is directly related tomechanical properties, including elastic modulus and material density [11]. Ultrasonic attenuationrefers to the energy loss of ultrasonic waves as they propagate through the material. Attenuationis attributed to various mechanisms, including diffraction, absorption, and scattering of ultrasonicwaves [2,8]. For polycrystalline materials, the scattering by grains is known to be dominant in ultrasonicattenuation compared to other mechanisms [8,18].
The ultrasonic pulse-echo method is a popular nondestructive technique for measuring ultrasonicvelocity and attenuation coefficient [11,16]. In this method, two consecutive back-wall echoes measuredon a specimen of known thickness are used to determine both linear ultrasonic parameters. Theultrasonic velocity can be determined by measuring the time-of-flight (TOF) between two consecutiveback-wall echoes from the following relationship:
v =2dt
, (1)

Metals 2019, 9, 1279 4 of 14
where v, d, and t are the ultrasonic velocity, the specimen thickness, and the TOF between twoconsecutive back-wall echoes, respectively. The attenuation coefficient can be calculated from theamplitude ratio of two consecutive back-wall echoes as follows [2,16]:
α =20 log(S1/S2)
2d, (2)
where α is the attenuation coefficient, and S1 and S2 are the amplitudes of the two-consecutive back-wallechoes, respectively.
A schematic of the experimental setup for linear ultrasonic measurements based on a pulse-echomode is shown in Figure 1. A 2.25 MHz piezoelectric longitudinal transducer (V106-RM, Panametrics-NDT, Waltham, MA, USA) was used with a pulser/receiver (5072PR, Panametrics-NDT, Waltham, MA,USA) that sends a negative electric pulse to the transducer and receives ultrasonic echo signals detectedby the transducer. The contact pressure between the transducer and the test specimen was keptconstant at 300 kPa using a pneumatic control system to minimize variations in the contact conditionsduring the repeated measurements. The electric signal acquired from the pulser/receiver was averaged300 times with an oscilloscope (HDO4034A, Teledyne LeCroy, Chestnut Ridge, NY, USA) that digitizesthe analog signal with a time resolution of 0.1 ns. Then, the averaged digital signal was transferred to acomputer. The first and the second back-wall echoes were analyzed to measure the ultrasonic velocityand the attenuation coefficient. An auto-correlation function was used for precise measurements ofTOF between the two back-wall echoes. Then, the ultrasonic velocity was calculated using Equation(1). From the amplitude ratio of the two back-wall echoes, the attenuation coefficient was calculatedusing Equation (2). Repeated measurements were conducted ten times for each specimen.
Figure 1. Schematic of the experimental setup for linear ultrasonic measurements based on apulse-echo mode.
2.3. Nonlinear Ultrasonic Measurements
The nonlinear ultrasonic technique using second-order harmonic generation based on the nonlinearelastic response of a material to an ultrasonic wave propagating through the material can effectivelyevaluate microstructural features of metals. The theory and the principles of this technique are welldescribed in the literature [9]. In this technique, the nonlinear ultrasonic parameter is used as aquantitative indicator corresponding to microstructural features, and it is defined as follows:
β =8A2
k2xA21
, (3)
where β is the absolute nonlinear ultrasonic parameter, A1 and A2 are the displacement amplitudesof the fundamental and the second-order harmonic waves after they have propagated through thematerial, respectively, k is the wavenumber, and x is the wave propagation distance.
The measurement of the absolute nonlinear ultrasonic parameter requires not only the informationon wavenumber and wave propagation distance but also the measurement of absolute displacement.Therefore, many researchers have alternatively used the relative nonlinear ultrasonic parameter, whichis relatively simple to measure. When the wavenumber and the propagation distance are kept constant

Metals 2019, 9, 1279 5 of 14
in a series of measurements, the relative nonlinear ultrasonic parameter β′ is defined by the measuredelectric signal amplitudes as follows:
β′ =A2′
(A1′)2 , (4)
where A1′ and A2
′ are the electric signal amplitudes of the fundamental and the second-order harmonicwaves measured by an ultrasonic sensor, respectively.
In general, the measurement of the relative nonlinear ultrasonic parameter is conducted on a seriesof specimens of the same thickness with varying levels of material degradation or microstructureswhile maintaining the same experimental conditions. Then, the variation in the relative nonlinearparameter is correlated with the microstructural features.
A schematic of the experimental setup for nonlinear ultrasonic measurements is shown inFigure 2, which is based on a through-transmission mode. A high-power electric signal generator(RAM-5000-SNAP, Ritec, Warwick, MA, USA) was used to provide the high power electric sinusoidalsignal of 11 cycles with a 2.5 MHz center frequency. The output electric signal from the generator passedthrough a high power 50 Ω termination and a 3 MHz low pass filter to suppress the initial harmonicsgenerated in the electric signal generator and then went to the transmitter. Narrowband piezoelectrictransducers with center frequencies of 2.25 and 5 MHz (V106-RM and V109-RM, Panametrics-NDT,Waltham, MA, USA) were used as a transmitter and a receiver, respectively. A specially designedfixture was used to maintain the transmitter and the receiver alignment on the same centerline axis.The contact pressure between the transducers and the test specimen was kept constant at 300 kPa usinga pneumatic control system. The signal acquired from the receiver was averaged 300 times with anoscilloscope and then transferred to a computer. A fast Fourier transform (FFT) was then performed toanalyze the amplitudes of the fundamental wave (A1
′) and the second-order harmonic wave (A2′) in
the received signal after applying a Hanning window. Then, (A1′)2 and A2
′ obtained at different inputpower levels were plotted and fitted linearly. Thereafter, the relative nonlinear ultrasonic parameterβ′ was calculated as the slope of the fitted line, as in Equation (4). Repeated measurements wereconducted six times for each specimen.
Figure 2. Schematic of the experimental setup for nonlinear ultrasonic measurements based on athrough-transmission mode.
2.4. Mechanical Property Measurements
The mechanical properties analyzed in this work included hardness, elastic modulus, andyield strength. The hardness measurements were conducted on the specimens used for ultrasonicmeasurements. The hardness was measured using a Vickers hardness tester (HMV-2T, Shimadzu,Kyoto, Japan), in accordance with the ASTM E384 standard [41], at a test load of 9.8 N and a dwelltime of 10 s at room temperature. For each specimen, the measurement was repeated over ten differentlocations. The elastic modulus and the yield strength were obtained from tensile tests. The tensiletests were performed using a universal testing machine (MTS793, MTS, Eden Prairie, MN, USA) at acrosshead speed of 2 mm/min at room temperature. For each heat-treated type, the tensile test wasrepeated five times.

Metals 2019, 9, 1279 6 of 14
3. Experimental Results and Discussion
3.1. Grain Size
The standard intercept count method of ASTM E112 was applied to the photographs, as shown inFigure 3, which were obtained with an optical microscope to measure average grain size of heat-treatedspecimens. The measured values for ASTM grain size number, G, and average grain size are given inTable 1. The average grain size of the intact specimen was 41 µm. The heat-treatment at 1250 C causedgrain coarsening, and the average grain size increased to 294 µm when the heat-treatment holdingtime increased to 34 h. There was no meaningful relationship between holding time and grain size, butsuch a relationship is beyond the scope of this study. In this study, the average grain size measured oneach heat-treated specimen, given in Table 1, was correlated with ultrasonic parameters.
Figure 3. Optical photographs of specimens heat-treated at a constant temperature of 1250 C fordifferent holding times: (a) no heat treatment; (b) 1 h; (c) 5 h; (d) 10 h; (e) 25 h; and (f) 34 h.
Table 1. The American Society for Testing and Materials (ASTM) grain size number G and averagegrain size of specimens heat-treated with different holding times.
Holding Time (h) ASTM Grain Size No. G Average Grain Size (µm)
0 6.3 411 1.8 1925 1.7 202
10 1.3 23225 0.7 28634 0.6 294
3.2. Ultrasonic Velocity vs. Grain Size
A typical ultrasonic echo signal is shown in Figure 4a. The first and the second back-wall echoesare clearly observed and separated in the time domain. The auto-correlation function was used toaccurately calculate the TOF between the two echoes. Figure 4b shows the auto-correlation results ofthe echo signal shown in Figure 4a. The TOF was determined as the time lag when the magnitudereached a maximum, as shown in the figure.

Metals 2019, 9, 1279 7 of 14
Metals 2019, 9, x FOR PEER REVIEW 7 of 14
ultrasonic velocity was 5682.5 m/s for the intact specimen, and it decreased by approximately 0.25% to 5668.2 m/s as the grain size increased to 294 μm. As indicated by the dashed line in the figure, a linear relationship existed with a good correlation coefficient of 0.9906. The reduction of the ultrasonic velocity would be mainly attributed to the increase in grain size. Though microstructural features, including dislocations and precipitates, can also affect the ultrasonic velocity, their effects would be small enough to be neglected because the microstructural features are much smaller than the ultrasonic wavelength. The present experimental results also matched well with those of the theoretical model based on mode conversion and multiple scattering theories proposed by Hirsekorn [12]. The theoretical model calculated the ultrasonic velocity in polycrystalline material as a function of the wavenumber, k, and the grain diameter, D, and showed that the ultrasonic velocity decreased almost linearly with increasing grain size when the value of kD ranged from 0 to 1. In this study, the kD values ranged from 0.1 to 0.7, and the ultrasonic velocity decreased almost linearly by approximately 0.25%, which is reasonable and can be explained by ultrasonic scattering by grains.
Figure 4. (a) Typical ultrasonic echo signal; and (b) auto-correlation results of the signal shown in (a).
Figure 5. Ultrasonic velocity as a function of grain size.
3.3. Ultrasonic Attenuation Coefficient vs. Gain Size
The ultrasonic attenuation coefficient as a function of grain size is shown in Figure 6, where both the average value and the data range for ten repeated measurements are shown. All measurements were made in the Rayleigh scattering region. The average attenuation coefficient was 0.2305 dB/mm for the intact specimen with a grain size of 41 μm, and it approximately doubled to 0.3433 dB/mm as the grain size increased to 294 μm. There was also a linear relationship between the attenuation coefficient and the grain size, but the correlation coefficient was 0.9624, which was lower than that between the ultrasonic velocity and the grain size. However, the sensitivity of the ultrasonic
Figure 4. (a) Typical ultrasonic echo signal; and (b) auto-correlation results of the signal shown in (a).
The measured ultrasonic velocity as a function of grain size is shown in Figure 5, where eachsymbol is the average of ten measurements, and error bars represent the data range. The averageultrasonic velocity was 5682.5 m/s for the intact specimen, and it decreased by approximately 0.25%to 5668.2 m/s as the grain size increased to 294 µm. As indicated by the dashed line in the figure, alinear relationship existed with a good correlation coefficient of 0.9906. The reduction of the ultrasonicvelocity would be mainly attributed to the increase in grain size. Though microstructural features,including dislocations and precipitates, can also affect the ultrasonic velocity, their effects would besmall enough to be neglected because the microstructural features are much smaller than the ultrasonicwavelength. The present experimental results also matched well with those of the theoretical modelbased on mode conversion and multiple scattering theories proposed by Hirsekorn [12]. The theoreticalmodel calculated the ultrasonic velocity in polycrystalline material as a function of the wavenumber,k, and the grain diameter, D, and showed that the ultrasonic velocity decreased almost linearly withincreasing grain size when the value of kD ranged from 0 to 1. In this study, the kD values rangedfrom 0.1 to 0.7, and the ultrasonic velocity decreased almost linearly by approximately 0.25%, which isreasonable and can be explained by ultrasonic scattering by grains.
Figure 5. Ultrasonic velocity as a function of grain size.
3.3. Ultrasonic Attenuation Coefficient vs. Gain Size
The ultrasonic attenuation coefficient as a function of grain size is shown in Figure 6, where boththe average value and the data range for ten repeated measurements are shown. All measurementswere made in the Rayleigh scattering region. The average attenuation coefficient was 0.2305 dB/mm forthe intact specimen with a grain size of 41 µm, and it approximately doubled to 0.3433 dB/mm as thegrain size increased to 294 µm. There was also a linear relationship between the attenuation coefficientand the grain size, but the correlation coefficient was 0.9624, which was lower than that between theultrasonic velocity and the grain size. However, the sensitivity of the ultrasonic attenuation coefficient

Metals 2019, 9, 1279 8 of 14
to the change in grain size and the stability of ultrasonic attenuation measurements were better thanthose in the ultrasonic velocity measurements.
Figure 6. Ultrasonic attenuation coefficient as a function of grain size.
In the present experimental results, the increase in ultrasonic attenuation coefficient with increasinggrain size resulted from the increase in the ultrasonic energy loss due to the ultrasonic scattering bygrains. Although the ultrasonic attenuation coefficient includes both absorption and scattering terms,the ultrasonic absorption term is very small and can be ignored in the case of polycrystalline materials,and ultrasonic scattering by grains and interfaces dominates the change in the ultrasonic attenuationcoefficient [5,8].
3.4. Nonlinear Ultrasonic Parameter vs. Grain Size
A typical tone-burst ultrasonic signal and its frequency spectrum used for the nonlinear ultrasonicmeasurement are shown in Figure 7. Both the 2.5 MHz fundamental component and the 5 MHzsecond-order harmonic component are present, and they are separated clearly in the frequency domain.Figure 8 illustrates the relationship between the second-order harmonic amplitude A2
′ and the square ofthe fundamental amplitude (A1
′)2 as a function of increasing input voltage level in the intact specimen.A good-fit linear relationship was observed between A2
′ and (A1′)2 with a high correlation coefficient
of 0.9991. The slope of the linearly fitted line corresponds to the relative nonlinear ultrasonic parameterβ′, as in Equation (4).
Figure 7. (a) Typical tone-burst ultrasonic signal; and (b) its frequency spectrum used for the nonlinearultrasonic measurement.

Metals 2019, 9, 1279 9 of 14
Figure 8. Linear relationship between A2′ and (A1
′)2 as a function of increasing input voltage level inthe intact specimen.
The average values and the data ranges of the measured nonlinear ultrasonic parameters as afunction of grain size are shown in Figure 9. The average nonlinear ultrasonic parameter was 0.001356for the intact specimen, and it was reduced by about half as the grain size increased to 294 µm. Thetendency of the nonlinear ultrasonic parameter to decrease with increasing grain size was the same asthat of the ultrasonic velocity, while it was the opposite that of the ultrasonic attenuation coefficient. Alinear relationship between the nonlinear ultrasonic parameter and the grain size was also observedwith a correlation coefficient of 0.9761. The sensitivity of the nonlinear ultrasonic parameter to thechange in grain size and the stability of nonlinear ultrasonic measurements were at levels similar tothose in the ultrasonic attenuation measurements.
Figure 9. Nonlinear ultrasonic parameter as a function of grain size.
The decrease in nonlinear ultrasonic parameter with increasing grain size was due to the decreasein the number of grain boundaries in a unit volume. Grain boundaries, which separate grains withdifferent crystallographic orientations, can be regarded as interfacial defects that result in ultrasonicnonlinearity [7,22]. While ultrasonic waves pass through the interfacial discontinuities with highlocalized strains, the ultrasonic waveform is distorted, and such distortion leads to the generationof higher harmonics. A larger number of grain boundaries in the wave propagation path results inhigher ultrasonic nonlinearity. For the specimens used in this study, larger grain size means a smallernumber of grain boundaries in the wave propagation path and lower ultrasonic nonlinearity. Note thatultrasonic velocity and attenuation coefficient are directly sensitive to grain size based on ultrasonicscattering by grains. In contrast, the nonlinear ultrasonic parameter is dependent on the number ofgrain boundaries rather than grain size.
Note that the values of the measured nonlinear ultrasonic parameters might include not only theultrasonic nonlinearity caused by nonlinear elastic response of a material to an ultrasonic wave but alsothe system nonlinearity that could occur in various measurement system elements such as an electric

Metals 2019, 9, 1279 10 of 14
signal generator, transducers, couplant layers, and so on. In this work, the system nonlinearity wasminimized as much as possible and was also kept constant in a series of ultrasonic measurements byusing a low pass filter, surface polishing of specimens, and a pneumatic system. Assuming the systemnonlinearities measured on each specimen were constant, the relative values of nonlinear ultrasonicparameters were compared and correlated with grain size.
3.5. Mechanical Properties vs. Grain Size
Mechanical properties, including elastic modulus, yield strength, and hardness, were analyzedaccording to grain size. The elastic modulus and the yield strength were measured using tensile tests,and their average values and data ranges are shown in Figure 10a,b, respectively. Both mechanicalproperties decreased with increasing grain size. This material weakening was attributed to the smallernumber of grain boundaries that act as barriers to dislocation movement [4,5,22]. The change in elasticmodulus with grain size, shown in Figure 10a, could also be correlated with the change in ultrasonicvelocity, shown in Figure 5. It is well known that ultrasonic velocity is a function of elastic modulusand material density. The decrease in the elastic modulus corresponds to a decrease in the ultrasonicvelocity, assuming there is almost no change in material density, even if grain size changes. The increasein grain size also caused a decrease in hardness, as shown in Figure 10c. The reduction in hardness wasalso due to a decrease in the number of grain boundaries that prevent plastic deformation [22]. Overall,the increase in grain size caused a decrease in the number of grain boundaries, which weakened themechanical properties.
Figure 10. (a) Elastic modulus; (b) yield strength; and (c) hardness as a function of grain size.
3.6. Summary
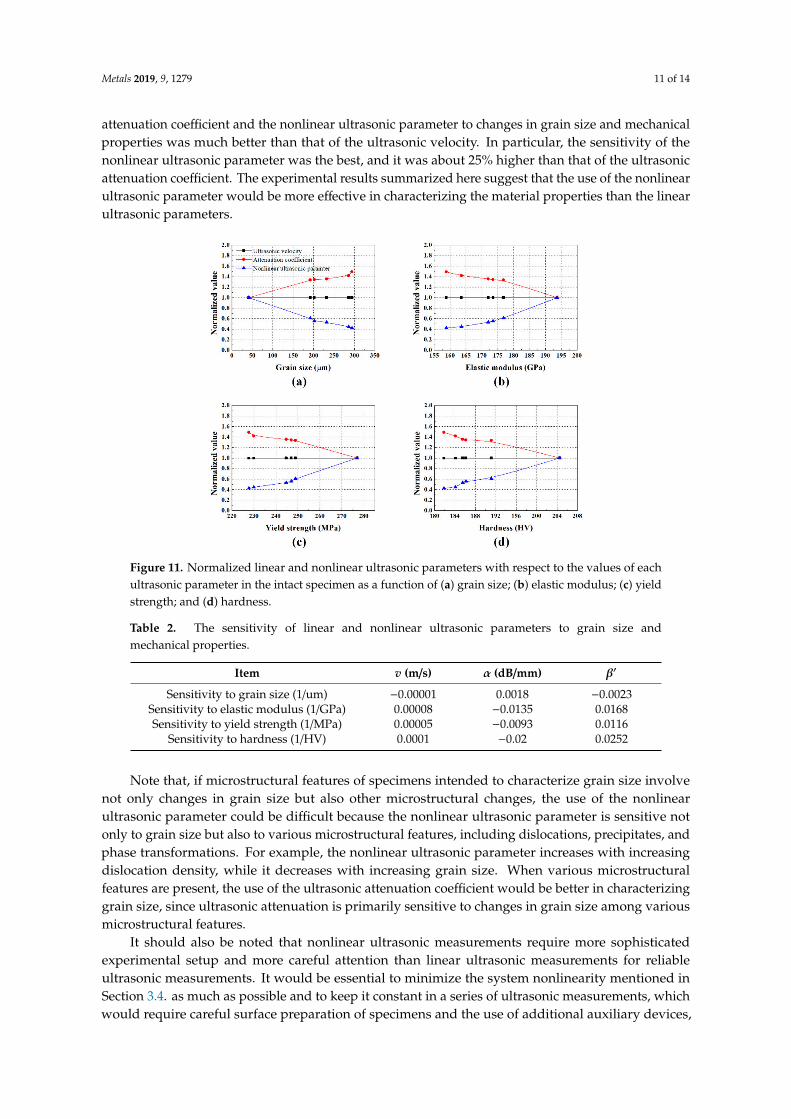
Linear and nonlinear ultrasonic parameters were correlated with grain size and mechanicalproperties, and the normalized values of ultrasonic parameters as a function of the material propertieswere compared, as shown in Figure 11. These values were normalized with respect to the values ofeach ultrasonic parameter in the intact specimen. The sensitivity of ultrasonic parameters to materialproperties was determined by the slope of the fitted line when the correlation was linearly fitted. Thesensitivity of each ultrasonic parameter is summarized in Table 2. The sensitivity of the ultrasonic
Metals 2019, 9, 1279 11 of 14
attenuation coefficient and the nonlinear ultrasonic parameter to changes in grain size and mechanicalproperties was much better than that of the ultrasonic velocity. In particular, the sensitivity of thenonlinear ultrasonic parameter was the best, and it was about 25% higher than that of the ultrasonicattenuation coefficient. The experimental results summarized here suggest that the use of the nonlinearultrasonic parameter would be more effective in characterizing the material properties than the linearultrasonic parameters.
Figure 11. Normalized linear and nonlinear ultrasonic parameters with respect to the values of eachultrasonic parameter in the intact specimen as a function of (a) grain size; (b) elastic modulus; (c) yieldstrength; and (d) hardness.
Table 2. The sensitivity of linear and nonlinear ultrasonic parameters to grain size andmechanical properties.
Item v (m/s) α (dB/mm) β′
Sensitivity to grain size (1/um) −0.00001 0.0018 −0.0023Sensitivity to elastic modulus (1/GPa) 0.00008 −0.0135 0.0168Sensitivity to yield strength (1/MPa) 0.00005 −0.0093 0.0116
Sensitivity to hardness (1/HV) 0.0001 −0.02 0.0252
Note that, if microstructural features of specimens intended to characterize grain size involvenot only changes in grain size but also other microstructural changes, the use of the nonlinearultrasonic parameter could be difficult because the nonlinear ultrasonic parameter is sensitive notonly to grain size but also to various microstructural features, including dislocations, precipitates, andphase transformations. For example, the nonlinear ultrasonic parameter increases with increasingdislocation density, while it decreases with increasing grain size. When various microstructuralfeatures are present, the use of the ultrasonic attenuation coefficient would be better in characterizinggrain size, since ultrasonic attenuation is primarily sensitive to changes in grain size among variousmicrostructural features.
It should also be noted that nonlinear ultrasonic measurements require more sophisticatedexperimental setup and more careful attention than linear ultrasonic measurements for reliableultrasonic measurements. It would be essential to minimize the system nonlinearity mentioned inSection 3.4. as much as possible and to keep it constant in a series of ultrasonic measurements, whichwould require careful surface preparation of specimens and the use of additional auxiliary devices,

Metals 2019, 9, 1279 12 of 14
such as a pneumatic system and a specially designed fixture. If practical applications do not allowthese requirements, ultrasonic attenuation coefficient measurements would be an effective alternative.
4. Conclusions
The abilities of ultrasonic velocity, ultrasonic attenuation coefficient, and nonlinear ultrasonicparameter to characterize the grain size and the mechanical properties of 304L stainless steel wereevaluated and compared. The increase in grain size caused a decrease in ultrasonic velocity and anincrease in ultrasonic attenuation coefficient, which was due to ultrasonic scattering by grains. Thenonlinear ultrasonic parameter decreased with increasing grain size. This was because the number ofgrain boundaries that were the sources of ultrasonic nonlinearity decreased as the grain size increased.In terms of mechanical properties, the increase in grain size resulted in a decrease in elastic modulus,yield strength, and hardness. The nonlinear ultrasonic parameter provided better sensitivity thanthe ultrasonic velocity and the ultrasonic attenuation coefficient, which suggests that the nonlinearultrasonic measurement would be more effective in characterizing grain size and mechanical propertiesthan the linear ultrasonic measurements. Future work will analyze the effects of surface roughnessand measurement system on linear and nonlinear ultrasonic measurements.
Author Contributions: Conceptualization, S.C. and J.-S.K.; methodology, S.C. and K.-Y.J.; formal analysis, S.C.and J.R.; investigation, S.C. and J.R.; resources, J.-S.K. and K.-Y.J.; writing—original draft preparation, S.C.;writing—review and editing, S.C. and K.-Y.J.; supervision, K.-Y.J.; funding acquisition, J.-S.K. and K.-Y.J.
Funding: This work was supported by the Korea Institute of Energy Technology Evaluation andPlanning (KETEP) and the Ministry of Trade, Industry and Energy (MOTIE) of the Republic of Korea(No.20181510102360) and the National Research Foundation of Korea (NRF) Grant funded by the KoreanGovernment (NRF-2013M2A2A9043241).
Conflicts of Interest: The authors declare no conflict of interest.
References
1. Li, M.; Lomonosov, A.M.; Shen, Z.; Seo, H.; Jhang, K.Y.; Gusev, V.E.; Ni, C. Monitoring of thermal aging ofaluminum alloy via nonlinear propagation of acoustic pulses generated and detected by lasers. Appl. Sci.2019, 9, 1191. [CrossRef]
2. Toozandehjani, M.; Matori, K.A.; Ostovan, F.; Mustapha, F.; Zahari, N.I.; Oskoueian, A. On the correlationbetween microstructural evolution and ultrasonic properties: A review. J. Mater. Sci. 2015, 50, 2643–2665.[CrossRef]
3. Rens, K.L.; Wipf, T.J.; Klaiber, F.W. Review of nondestructive evaluation techniques of civil infrastructure. J.Perform. Constr. Facil. 1997, 11, 152–160. [CrossRef]
4. Lehto, P.; Remes, H.; Saukkonen, T.; Hänninen, H.; Romanoff, J. Influence of grain size distribution on theHall–Petch relationship of welded structural steel. Mater. Sci. Eng. A 2014, 592, 28–39. [CrossRef]
5. Aghaie-Khafri, M.; Honarvar, F.; Zanganeh, S. Characterization of grain size and yield strength in AISI 301stainless steel using ultrasonic attenuation measurements. J. Nondestruct. Eval. 2012, 31, 191–196. [CrossRef]
6. Palanichamy, P.; Joseph, A.; Jayakumar, T.; Raj, B. Ultrasonic velocity measurements for estimation of grainsize in austenitic stainless steel. NDT E Int. 1995, 28, 179–185. [CrossRef]
7. Li, W.; Chen, B.; Qing, X.; Cho, Y. Characterization of microstructural evolution by ultrasonic nonlinearparameters adjusted by attenuation factor. Metals 2019, 9, 271. [CrossRef]
8. Wan, T.; Naoe, T.; Wakui, T.; Futakawa, M.; Obayashi, H.; Sasa, T. Effects of grain size on ultrasonic attenuationin type 316L stainless steel. Materials 2017, 10, 753. [CrossRef]
9. Jhang, K.Y. Nonlinear ultrasonic techniques for nondestructive assessment of micro damage in material: Areview. Int. J. Precis. Eng. Manuf. 2009, 10, 123–135. [CrossRef]
10. Khan, S.Z.; Khan, T.M.; Joya, Y.F.; Khan, M.A.; Ahmed, S.; Shah, A. Assessment of material properties of AISI316L stainless steel using non-destructive testing. Nondestruct. Test. Eval. 2016, 31, 360–370. [CrossRef]
11. ASTM E494-15, Standard Practice for Measuring Ultrasonic Velocity in Materials; ASTM International: WestConshohocken, PA, USA, 2015.

Metals 2019, 9, 1279 13 of 14
12. Hirsekorn, S. The scattering of ultrasonic waves by polycrystals. J. Acoust. Soc. Am. 1982, 72, 1021–1031.[CrossRef]
13. Bouda, A.B.; Lebaili, S.; Benchaala, A. Grain size influence on ultrasonic velocities and attenuation. NDT EInt. 2003, 36, 1–5. [CrossRef]
14. Vijayalakshmi, K.; Muthupandi, V.; Jayachitra, R. Influence of heat treatment on the microstructure, ultrasonicattenuation and hardness of SAF 2205 duplex stainless steel. Mater. Sci. Eng. A 2011, 529, 447–451. [CrossRef]
15. Kwun, S.I.; Hong, S.T.; Choo, W.Y. Ultrasonic nondestructive evaluation of microstructure and strength ofcarbon steels. J. Mater. Sci. Lett. 2000, 19, 1453–1456. [CrossRef]
16. ASTM E664-93, Standard Practice for the Measurement of the Apparent Attenuation of Longitudinal UltrasonicWaves by Immersion Method; ASTM International: West Conshohocken, PA, USA, 2000.
17. Papadakis, E.P. Rayleigh and stochastic scattering of ultrasonic waves in steel. J. Appl. Phys. 1963, 34, 265–269.[CrossRef]
18. Botvina, L.R.; Fradkin, L.J.; Bridge, B. A new method for assessing the mean grain size of polycrystallinematerials using ultrasonic NDE. J. Mater. Sci. 2000, 35, 4673–4683. [CrossRef]
19. Ahn, B.; Lee, S.S.; Hong, S.T.; Kim, H.C.; Kang, S.J.L. Application of the acoustic resonance method toevaluate the grain size of low carbon steels. NDT E Int. 1999, 32, 85–89. [CrossRef]
20. Dubois, M.; Militzer, M.; Moreau, A.; Bussière, J.F. A new technique for the quantitative real-time monitoringof austenite grain growth in steel. Scr. Mater. 2000, 42, 867–874. [CrossRef]
21. Moghanizadeh, A.; Farzi, A. Effect of heat treatment on an AISI 304 austenitic stainless steel evaluated by theultrasonic attenuation coefficient. Mater. Test. 2016, 58, 448–452. [CrossRef]
22. Mini, R.S.; Balasubramaniam, K.; Ravindran, P. An experimental investigation on the influence of annealedmicrostructure on wave propagation. Exp. Mech. 2015, 55, 1023–1030. [CrossRef]
23. Zhang, J.; Xuan, F. Fatigue damage evaluation of austenitic stainless steel using nonlinear ultrasonic wavesin low cycle regime. J. Appl. Phys. 2014, 115, 204906. [CrossRef]
24. Nam, T.; Choi, S.; Lee, T.; Jhang, K.; Kim, C. Acoustic nonlinearity of narrowband laser-generated surfacewaves in the bending fatigue of Al6061 alloy. J. Korean Phys. Soc. 2010, 57, 1212–1217.
25. Kim, J.; Jacobs, L.J.; Qu, J.; Littles, J.W. Experimental characterization of fatigue damage in a nickel-basesuperalloy using nonlinear ultrasonic waves. J. Acoust. Soc. Am. 2006, 120, 1266–1273. [CrossRef]
26. Balasubramaniam, K.; Valluri, J.S.; Prakash, R.V. Creep damage characterization using a low amplitudenonlinear ultrasonic technique. Mater. Charact. 2011, 62, 275–286. [CrossRef]
27. Valluri, J.S.; Balasubramaniam, K.; Prakash, R.V. Creep damage characterization using non-linear ultrasonictechniques. Acta Mater. 2010, 58, 2079–2090. [CrossRef]
28. Xiang, Y.; Deng, M.; Xuan, F. Thermal degradation evaluation of HP40Nb alloy steel after long term serviceusing a nonlinear ultrasonic technique. J. Nondestruct. Eval. 2014, 33, 279–287. [CrossRef]
29. Xiang, Y.; Deng, M.; Xuan, F.; Liu, C. Experimental study of thermal degradation in ferritic Cr-Ni alloy steelplates using nonlinear Lamb waves. NDT E Int. 2011, 44, 768–774. [CrossRef]
30. Kim, C.; Park, I.; Jhang, K. Nonlinear ultrasonic characterization of thermal degradation in ferritic 2.25Cr-1Mosteel. NDT E Int. 2009, 42, 204–209. [CrossRef]
31. Choi, S.; Seo, H.; Jhang, K. Noncontact evaluation of acoustic nonlinearity of a laser-generated surface wavein a plastically deformed aluminum alloy. Res. Nondestruct. Eval. 2015, 26, 13–22. [CrossRef]
32. Punnose, S.; Mukhopadhyay, A.; Sarkar, R.; Kumar, V. Characterisation of microstructural damage evolutionduring tensile deformation of a near-α titanium alloy: Effects of microtexture. Mater. Sci. Eng. A Struct.Mater. Prop. Microstruct. Process. 2014, 607, 476–481. [CrossRef]
33. Cantrell, J.H.; Yost, W.T. Nonlinear ultrasonic characterization of fatigue microstructures. Int. J. Fatigue 2001,23, 487–490. [CrossRef]
34. Hikata, A.; Chick, B.B.; Elbaum, C. Dislocation contribution to the second harmonic generation of ultrasonicwaves. J. Appl. Phys. 1965, 36, 229–236. [CrossRef]
35. Choi, S.; Lee, P.; Jhang, K.Y. A Pulse inversion-based nonlinear ultrasonic technique using a single-cyclelongitudinal wave for evaluating localized material degradation in plates. Int. J. Precis. Eng. Manuf. 2019, 20,549–558. [CrossRef]
36. Matlack, K.H.; Bradley, H.A.; Thiele, S.; Kim, J.; Wall, J.J.; Jung, H.; Qu, J.; Jacobs, L.J. Nonlinear ultrasoniccharacterization of precipitation in 17-4PH stainless steel. NDT E Int. 2015, 71, 8–15. [CrossRef]
Metals 2019, 9, 1279 14 of 14
37. Kim, C.; Lissenden, C.J. Precipitate contribution to the acoustic nonlinearity in nickel-based superalloy. Chin.Phys. Lett. 2009, 26, 086107. [CrossRef]
38. Hurley, D.C.; Balzar, D.; Purtscher, P.T.; Hollman, K.W. Nonlinear ultrasonic parameter in quenchedmartensitic steels. J. Appl. Phys. 1998, 83, 4584–4588. [CrossRef]
39. ASTM E112-13, Standard Test Methods for Determining Average Grain Size; ASTM International: WestConshohocken, PA, USA, 2015.
40. ASTM E8/E8M-16a, Standard Test Methods for Tension Testing of Metallic Materials; ASTM International: WestConshohocken, PA, USA, 2016.
41. ASTM E384-17, Standard Test Method for Microindentation Hardness of Materials; ASTM International: WestConshohocken, PA, USA, 2017.
© 2019 by the authors. Licensee MDPI, Basel, Switzerland. This article is an open accessarticle distributed under the terms and conditions of the Creative Commons Attribution(CC BY) license (http://creativecommons.org/licenses/by/4.0/).