parameters for apple quality - louis bolk
TRANSCRIPT


Parameters for apple qualityand an outline for a new quality concept
met Nederlandse samenvatting: Parameters voor appelkwaliteiten een aanzet tot een nieuw kwaliteitsconcept
mit Deutschen Zusammenfassung: Parametern für Apfelqualitätund ein Entwurf eines neuen Qualitätsbegriffes
part 1 report
Joke Bloksma, Martin Northolt, Machteld Huber,Louis Bolk Institute, 2001.


About the Food, Quality and Health programme (FQH)The FQH programme has been established in 2000 by Louis Bolk Institute, Triodos Bank and organic producttrade companies to develop quality concepts based on life processes and parameters for determination thequality of products grown with different agricultural methods.The programme is developed and carried out by an international group of institutes with experience of traditionaland holistic research methods. The programme will be extended by research on the effect on health ofconventional and organic grown products.For further information co-ordinator: Martin D. Northolt, Email: [email protected] or www.louisbolk.nl/FQH.
About this first apple projectDirected by Joke Bloksma, Martin Northolt, Machteld Huber from the Louis Bolk Institute in co-operation withPieterjans Jansonius (LBI), Mirjam Matze (LBI), Monique Hospers (LBI), Anna de Weerd (LBI), Paul Doesburg (LBI),Orchard ter Linde (NL), Roel van Wijk and Jan Soeren (Meluna Bio-photon research, NL), Jürgen Strube and PeterStolz (Kwalis Qualitätsforschung Fulda GmbH, D), Hartmut Heilmann (Elektrochemische Qualitätsuntersuchungen,Kirchberg/Jagst, D),Jens Otto Andersen (Univ. Kopenhagen, DK), Ruth Mandera (D),Ingo Hagel (Inst. for biodynamic Research, Darmstadt, D) and Franco Weibel (FIBL, CH).
About the Louis Bolk InstituteThe Louis Bolk Institute has been a pioneer in innovative scientific research in organic farming, nutrition andhealthcare since 1976. Broadening the basis of scientific research is the aim of the institute's work.Where conventional research methods do not suffice, new methods are looked for, such as: phenomenology,participatory research, pictomorphological investigations and conscious-intuitive methods, Rudolf Steinersphilosophy being a source of inspiration.You can order a general Annual Report about the Louis Bolk Institute or an annual report only about fruit growingresearch. These texts and the list of publications are also available on the web-site.
For more information:Louis Bolk Institute, Hoofdstraat 24,NL 3972 LA Driebergen, The NetherlandsPhone: +31-343-523860 and Fax: +31-343-515611E-mail: [email protected] or www.louisbolk.nl
About this publicationJ. Bloksma, M. Northolt and M. Huber, 2001:Parameters for Apple Quality and an outline for a new quality concept.Louis Bolk Institute, Driebergen.Please, use reference if cited.
Louis Bolk Publication Publication no. GVV 01Food, Quality and Health Publication no. FQH 01ISBN 90-74021-22-0 30 euro (ƒ 66,-) for the 2 parts
keywords: organic product quality, vital quality, vitality, structure,coherence, apples, taste, copper chloride crystallisations,bio-photons, electro-chemical, self-decomposition.

Table of contents of part 1Page
Annexes, see part 2:
Summary and conclusions: Parameters for apple quality and an outline for a newquality concept 1
Samenvatting en konklusies: Parameters voor appelkwaliteit en een aanzet toteen nieuw kwaliteitsconcept 8
Zusammenfassung und Konklusionen: Parametern für Apfelqualität und einEntwurf eines neuen Qualitätsbegriffes 15
1 Introduction 231.1 Background: search for a quality concept for organic food 231.2 Life processes as the conceptual background 241.3 The apple as the first research crop 251.4 Choice of quality parameters 261.5 Reference series 261.6 Research questions 261.7 Co-operation 271.8 Funding 27
2 Introduction on apple growing 282.1 Growth and ripening processes in apple 28
2.1.1 Processes of mass formation or ‘growth’ 282.1.2 Processes of differentiating or ripening 282.1.3 Vital quality as harmonious integration of growth and ripening 28
2.2 What is optimal ripeness? 302.3 Texture of apple flesh 302.4 Influence of light 302.5 Alteration and senescence 312.6 Polarity between seeds and fruit flesh 31
3 The reference series and experimental design 323.1 Circumstances in the orchard 323.2 The season 2000 323.3 Description of the reference series 32
3.3.1 Series A: ripening 333.3.2 Series B: bearing 343.3.3 Series C: light and bio-dynamic field preparations 353.3.4 Series D: shelf-life 35
4 Method 364.1 Working sequence 364.2 Experimental design, sampling and analyses 374.3 Statistical analyses 37
5 Leaf series and twig growth 39
6 Exterior of the fruit 406.1 Fruit size 406.2 Skin colour 40

6.3 Shape, blush colour and shine 40
7 Basic parameters: firmness, starch, sugar, acid and calculated indexes 427.1 Firmness 427.2 Starch 437.3 Sugar in Brix 437.4 Malic acid 457.5 Streif-index 457.6 Technical quality index (TQ-index) 46
8 Mineral content (N, P, K, Mg, Ca) and dry matter 48
9 Protein and free amino acids 51
10 ‘Health’ compounds: vitamins and phenolic compounds 5410.1 Vitamin C 5410.2 Phenolic compounds 54
11 Self-disintegration (SD) 57
12 Sensory properties 59
13 Copper chloride crystallisation (=CC) 63
14 Capillary rising Picture method (CP) 67
15 Delayed luminescence 6915.1 Delayed luminescence by Meluna 6915.2 Spectral range luminescence in flesh and seeds by Kwalis 73
16 Electro-chemical parameters 78
17 Bovis-value 82
18 Comparing the parameters 8418.1 Costs of parameters 8418.2 Similarity between sub-samples 8418.3 Relations between parameters 84
19 Characteristics of the varying factors 9119.1 Ripeness: unripe, overripe 9119.2 Bearing: from underbearing to overbearing 9219.3 Light: exposure to sun, shadow 9319.4 Bd-field preparations 9419.5 Shelf life 95
20 Reflection on research questions 9620.1 A More detailed description of the three aspects of vital quality 96
20.1.1 Growth processes 9620.1.2 Differentiation processes 9620.1.3 Integration processes 97
20.2 Perspective for practical relevance of the vital quality concept 9820.3 In which amount do the various parameters reflect vitality, structure and coherence? 10020.4 Recommendations for further research 105
21 Literature 106

Annexes, see part 2:1. leaf series (B)2. external quality of the apples (A,B,C)3. basic parameters (A,B,C,D): size, firmness, sugar, malic acid, starch, Streif-index, TQ-index, dry matter, N, P, K,
Mg, Ca4. self-disintegration-test, vitamin C, sugar (A,B,C,D)5. Bovis-value (A,B,C,D)6. protein and amino acids (A,C)7. phenolic compounds (A,C)8. sensory properties of apples (A,B,C,D): overall, skin, crispness, mealiness, juiciness, rawness, sourness,
sweetness, aroma9. copper chloride crystallisation (A,B,C,D)10. capillary pictures (A,B,C,D)11. delayed luminescence by Meluna (A,B,C,D)12. spectral range luminescence by Kwalis (A,C)13. electro-chemical measurements by Heilmann (A,B,C,D)14. correlations between parameters15. overview of the results of the parameters per series16. sensory test form17. equipment for spectral range luminescence by Kwalis18. equipment for spectral range luminescence by Meluna19. method improvement of the self-disintegration test
Grey columns in the tables mean these data are presented in graphics too.

Parameters for apple quality and an outline for a new quality concept, part 1. 1
Summary and conclusions: Parameters for applequality and an outline for a new quality conceptMotivation and framework of the Food, Quality and Health programmeThe commonly used quality-concept, with the emphasis on external appearance and nutritional content, is notsufficient for organic products and their market. Organic growers and their consumers strive to a product with‘vitality’, ‘life-force’, ‘coherence’ or terms of similar wording. These terms are expected to play a role in wholesomenourishment and to distinguish between living food products and a solution of nutrients.The mentioned terms are interpreted very diverse, mostly based on a single test, while a quality concept withoperational parameters was still lacking.The objective of the international ‘Food, Quality and Health (FQH) programme’ is to develop a contextual qualityconcept with testing parameters that corresponds to the needs of the organic producers. The first step to this isthe development of a quality concept and parameters. This resulted in the preliminary concept of ‘vital quality’.Eventually we strive to examine the effect of high vital-quality food on human health.During this first FQH-project with apples, we studied the possibility of introducing this new concept, ‘vital quality’linked to testing parameters. We stress however the orientation character of this project as the introduction of anew quality concept with experimental parameters entails the lure of circular reasoning, as validation is performedwith new and experimental parameters. The new quality concept and parameters are ‘preliminary’ and evaluationof the consistency and usability requires several years of testing with various products. Eventually this will inspireconfidence whether ‘vital quality’ is a meaningful and operational concept.In this project the concept will be developed and adjusted in a very limited context. Namely, apples from a singlevariety that were grown under different conditions, at one orchard and in one season.
Quality concept ‘vital quality’We mention a number of requirements that apply to a quality concept for organic agriculture. Firstly, arelationship with the central paradigm of organic agriculture: to sustain life processes. Growth and differentiationcan be considered the two basic life processes, whether or not balanced and integrated. Therefore growth,differentiation and their integration are the three aspects upon which the new quality concept is based.Secondly, the quality concept must be communicated to both the producer and the consumer, who have adifferent reference index. The producer, who works with growing plants, thinks in terms of life processes, which canbe stimulated, reduced and balanced. While on the other hand, the consumer and retailer think in terms ofcontrollable and recognisable product aspects. Therefore the quality concept has two sides; life processes andproduct aspects. Both sides are related to one another.Thirdly, the quality concept must relate to the holistic health view of physicians and dieticians to facilitate theinitiation of health assessing research projects during the programmes second phase.
All three requirements combined, resulted in a quality concept indicated as ‘vital quality’, based on the lifeprocesses growth, differentiation and integration processes and the corresponding product aspects; vitality,structure and coherence.
Vitality is only one aspect of ‘vital quality’In the quality concept ‘vital quality’; vitality has been defined as the result of growth processes. Therebycorresponding to the usage of vitality in the sense of growth-full, young and lively. It does not correspondhowever, to the usage of vitality in the sense of health related due to a harmonious balance between growth anddifferentiation, and strong resistance and self-regulating abilities. In the new quality concept the latter isincorporated in the integrated or contextual aspect of vital quality.

J. Bloksma, M. Northolt and M. Huber, Louis Bolk Institute, 20012
Objectives and methodsAimThis research aims to develop a coherent quality concept for the organic agriculture including the accessorytesting parameters. So, in the first instance this research does not aim to answer whether organic cultivatedproducts are better than conventionally cultivated products, and what we may consider ‘better’. In a later stage,when the quality concept has been further developed and validated, different agricultural cultivation methods willbe compared.
The apple as the first research cropThe apple has been chosen as the first crop as the life processes growth and differentiation are well-knownphenomena amongst fruit-growers, and because the Louis Bolk Institute has experience with this crop. World-wideresearch on apple-quality aided to determining which aspects had to be standardised in order to excludeunwanted variations. The Elstar variety has been chosen as one of the most tasty, Dutch apple-varieties.
Reference seriesThe basis of this research is formed by sets of 20 apples, specifically cultivated for this research. We attempted togrow the apples in such a way that only one of the life processes would increasingly be affected between the twoextremes within each series, whereas all other factors were standardised as much as possible. The series differed inpicking date, bearing, sun exposure, Bd-preparations and ageing after storage.The season 2000 had ideal weather conditions for apple cultivation as a result of which the intended extremes inthe series weren’t realised, and the optima weren’t located in the centre of the series.
Choice of parametersWe chose traditional parameters that are commonly used to assee the quality of apples, and experimentalparameters which we expect to be relevant for vital quality.The following parameters were evaluated (per series a set of parameters was choosen)• crop: soil, growth, bearing, diseases and plagues, leaf series, next years budding (LBI).• traditonal parameters: crop size, ground colour, blush colour, shine, firmness, starch, Brix, acid, N, P, K, Mg, Ca
and dry matter (Lab. PPO and lab ZVl)• vitamin C (LBI), phenolic compounds (TU-München, D), amino acids and protein (Kwalis Qualitätsforschung,
Fulda, D).• self-disintegration (LBI), taste (LBI), copperchloride crystallisations (LBI), capillary pictures (LBI + R. Mandera).• two different methods with biophotons (Meluna Biophotone research, Wijk bij Duurstede NL, and Kwalis
Qualitätsforschung, Fulda, D).• electrochemical parameters: pH, redoxpotential, electrical resistance, combined in the P-value (H. Heilmann,
D).• Bovis-value (this is an intuitive observation technique, which was added for evaluation, LBI).
Partners
• apple cultivation (LBI, bio-dynamic Orchard ter Linde, Oost-kapelle, NL).• quality concept development: LBI, R. van Wijk (NL), J.O. Andersen (DK), F. Weibel (CH), J. Strube and P. Stolz
(D), H. Heilmann (D).• Funding: LBI, Meluna Biophotone research (NL), Kwalis Qualitätsforschung, (D), Stichting Triodos Fonds (NL),
Software AG Stiftung (D), Zukunftsstiftung Landwirtschaft (D), Stichting Klaverblad (NL).
Repeats and reliabilityWe collected samples of 120-apples each, originating from minimal 10 different trees, and are divided insubsamples for the different laboratories. To cut back expenses in this preliminary research, we chose not toperform independent repetitions in the field. Per parameter we chose either for subsample analysis or forindependent repeats on individual apples. For the experimental parameters we predominantly chose forrepetitions within the sample to demonstrate the variation of the method. A number of traditional parametersacted as reference and control for the homogeneity of the sample.

Parameters for apple quality and an outline for a new quality concept, part 1. 3
To a certain extent treatment series compensate the lack of independent repetitions. The strict standardisation ofapple size and location of growth in the tree aided to minimise the variation within the samples. Practically allparameters showed a consequent course within the series by which means we judged, in retrospect, the uniformityof the series and the reliability of the quality measurements as satisfactory. The only exceptions were the self-disintegration test and the vitamin C analysis, although these analyses might be improved in the near future.
Methodical stepsThe risk of reasoning in a circle can not be avoid completely. Our basis lays in the cultivated series of apples witha gradual increase of certain life processes, and assaying of the consistency between concept and results of theparameters.The strategy was as follows: we attempted to cultivate apples in such a way that only one of the life processeswould be affected per series. In this way we depicted the experimental parameters that seemed to be relevant forthese life processes. The results were compared to the outcome of the traditional parameters and with literature,indicating the usability of our series. The experimental parameters appeared to supplement the traditionalparameters and enrich our vision of the life processes and the quality concept. We also determined the mutualrelation between the parameters. Finally, all parameters were reviewed for there relation with the life processesand therefore with the new quality concept.
Results of the treatment seriesRipeningFor comparison within one treatment series, we chose to perform the analyses on the same day. For the series with5 different picking dates (between September the 1st and October the 9th) this means that early picking is relatedto a several weeks longer cold storage period. So this series actually shows the difference between ripening on thetree versus ripening in storage. As the conversion of starch into sugar and loss of firmness occur both on the treeand during cold storage. For many other aspects of ripening like colour, size, taste, biophotons, crystallisation,capillary pictures and Bovis-value, ripening on the tree is essential.Determining all these parameters aided us to regard the process of ripening as a successive process in whichcontinually different compounds change from a solid state into a soluble state or evaporate. For example firm fruitwith starch, acid and phenolic compounds ripen into juicy fruit with soluble sugars and aromatic compounds.The holistic methods show an increase in openness and ‘facing-outwards’. The ripening process can becharacterised as a transition from vitality into structure and coherence. Which is contrary to the ageing process incold storage, during which also a loss of vitality occurs, but without an increase in structure and coherence.various parameters related to coherence have a maximum (or optimum) value at the second or fourth pickingdate.
BearingIn June the trees were pruned to the desired bearing level: 35, 75, 100, 125 and 140 fruit per tree. Thiscorresponds to 14, 30, 40, 50 and 60 tons of apples per hectare. Previously, we estimated the third bearing to beoptimal but due to the favourable season for apple cultivation the fourth bearing level turned out also to beoptimal for satisfactory taste and flowerbud formation.A well-known phenomenon, which we also encountered here, are the relations between a higher bearing and:decreased twig onset (visualised with the leaf series), lower leaf/fruit ratios and reduced flowerbud formation forthe next season. The impact of high bearing on fruit quality was demonstrated by the dilution of all parametersinvolved with assimilation and mineral uptake: dry matter, sugar, sourness, aroma and the various minerals.However, the opposite was found for Ca. Ca levels and the Ca/K ratio as a measure for storage potential actuallyincreased at a higher bearing, as is also found in the field.The copperchloride crystallisation images of apples from low bearing trees gave a powerless and vegetativeimpression, whereas apples from high bearing trees gave poor, sharply outlined impressions. Average bearing gaverise to the most vital and differentiated images. The capillary pictures were sharper at a high bearing. The tastewas more or less constant and only decreased at the highest bearing. The biophotone level decreased directly afterexcitation (a measure for vitality) and the hyperbolicallity (a measure for the differentiation/growth ratio)increased.In conlcusion, a higher bearing resulted in a decrease in vitality and an increase in structure.

J. Bloksma, M. Northolt and M. Huber, Louis Bolk Institute, 20014
Sun exposureDuring harvest, separate apples were picked, hanging either in full sunlight, complete shadow or in between thesetwo extremes. We harvested two sunlight series, one with and one without Bd-preparations. The sun exposurelevels of both series were comparable. Apples grown in the sun gave rise to increased colour, phenolic compound,biophotons (all three a measure for the differentiation/growth ratio), a broader colour spectrum with biophotons(a measure for fruit-typicality), higher protein/amino acid ratios, more coherence and transparency incopperchloride crystallisation images and more round, open shapes in the capillary pictures (all measures forincreased integration). Surprisingly, no difference was found in taste, firmness, calcium or acidity. New for us werethe much higher levels of N, P, K, amino acids and proteins in the shaden-grown fruit. This resulted in the higherCa/K ratio for the sun-exposed fruit, which corresponds to the experience that sun-exposed fruit stores better.Seemingly, sun-exposure stimulates differentiation, resulting in an increased structure and coherence.
Bio-dynamic preparationsA part of the orchard wasn’t treated with Bd-preparations this season. The other part was treated twice with acow-manure preparation and twice with a silica preparation. The sunlight series was gathered from both parts ofthe orchard.When testing for homogeneity, the part of the orchard that had preparations administered appeared to be slightlymore growthfull, although this might not due to preparation usage.Remarkable was that traditional parameters like colour, taste, firmness, minerals, starch, acid and pH revealed nodifference between apples with and without preparations. However, a couple of experimental parameters linked toeither differentiation or integration did reveal differences, e.g. phenolic compounds, protein/amino acid ratio,electrical resistance, broader colour spectrum with biophotons, increased transparent copperchloride crystallisationimages and Bovis-value. Albeit the effects were not encountered at all three levels of sun-exposure, making it hardto draw firm conclusions.The light and preparation series are combined, as we expected preparations to have an effect similar to that ofsun-exposure and moreover, would enhance the integration process. The results did not confirm nor deny ourexpectations.
Shelf-lifeThe apples of the fourth picking date remained in cold storage for three months, and were taken out at differenttime intervals. This resulted in a shelf-life series of 1, 4, 8 and 12 days. As is commonly known, and found heretoo, firmness and acidity clearly decrease during ageing while the sugar level remains constant for some time dueto remobilization. Practically all parameters indicated a limited ageing, but not as severe as we had anticipated.The series wasn’t extreme enough and, in retrospect, should have contained longer shelf-lives to obtain a realimage of decay. As the apples grew older the needle structure of the crystallisation images developed more andmore towards the periphery.Surprisingly, apples only one day out of cold storage were judged by a lot of parameters as being less good thanapples 4 days out of cold storage. Apparently, apples need to acclimatise to altered conditions after cold storage(and/or transport) for a couple of days.This series wasn’t illustrative to assay the quality-concept as besides the vitality, also the differentiation andintegration decreased. The changes in life processes aren’t distinguishable in shelf-life series.
Further elaboration of the concept ‘vital-quality’Research indicates that besides the two life processes, growth and differentiation, it is meaningful to addintegration as a third aspect between these two processes.Distinguishing the two life processes, growth and differentiation, can only theorethically be done. As soon as aliving organism starts growing, both processes are apparent, albeit in a certain balance. Sometimes with theemphasis on growth (vegetative life stage, luxurious, cancer growth), sometimes with the emphasis ondifferentiation (generative life stage, poor emergency flowering). Some of the characteristics of ‘vital-quality’ aredescribed below based of apple parameters. In the following scheme Fig. 11a these concepts are generalised toform the basis for other crop research.

Parameters for apple quality and an outline for a new quality concept, part 1. 5
Vitality is the result of growthGrowth can be described as the process of the expansive filling of space with unformed mass, growth of organs,cell division and, in the case of plants, the production of primary metabolites by photosynthesis. A vital tree has alot of green leaves and a considerable apple yield. A vital apple has a good size, is firm, crisp and juicy. Theproduct contains a high amount of starch, sugar, acid, amino acids and proteins whereby the ratio between thetwo is determined by the degree of ripeness. A vital apple is still building up biomass, whereby a lot oftransportable compounds are formed (amino acids, sugar). The acidity is low, the turgor is high, the amount ofbiophotons directly after excitation is high and the crystallisation images are filled with a dense needle structure.
Structure is the result of differentiationDifferentiation is the process of specialisation in form and function, cell differentiation, refinement of form,flavour, gloss and colour, ripening into maturity, flowerbud formation, forming pollen and seed formation.Organisation of structure is initiated and secondary metabolites are formed, e.g. the wax on the skin, phenoliccompounds, vitamins and aromatic compounds. Well-structured fruit contain a lot of pits, a high calcium level andstore well. The amount of biophotons decreases after excitation in a hyperbolical manner. The crystallisationimages are clearly arranged, have a high degree of one-centredness and the sharp side-needles have a largeangle.
Coherence is the result of integrationThe growth processes must take place on a medium level to allow the differentiation process to proceed well. Tooluxurious growth will inhibit ripening to full maturity. Whereas with a trifling growth, differentiation will result inpoorness, emergency flowering and ‘conservation’, resulting in hard, dry and small apples.When growth and differentiation progress simultaneously and balanced, possibly in a rhythmic alternation, werefer to this as an integration process. A dynamic balance between growth and differentiation that depends onthe context, like species, variety, development stage, season, soil and orchard management.However, integration is not only about a certain balance between growth and differentiation, but also about thedegree of interaction. Sufficient integration allows an apple to combine a good taste with a reasonably goodstorage potential. The taste is aromatic, juicy and crisp, and has a well-balanced sweet/sour ratio. Thebiosynthesis is completed, which is expressed in the fairly low free-amino acid, and relatively high protein levels.Such apples are resistant to self-disintegration, stress and disease. The flesh is elastic and retains tension a whileafter picking. The electrical resistance is high and the redoxpotential is low. The amount of biophotons starts of ona high level after excitation, decreases hyperbolically and expresses a broad, fruit-typical colour spectrum. Thecrystallisations show a coherent and apple-typical image. The Bovis-value is high.
The aspect ‘coherence’ appears to be a relational featureWhen judging vitality and structure, the observer can remain detached and objective. At this level even thecrystallisation images can to a certain degree be judged by image analysis software. When judging coherence, theobserver is expected to be related to, and be involved with the subject, and to express an aim as a reference forquality. The fruitgrower adds his own aims. He chooses the target values in the relation between growth anddifferentiation by determining the balance between a high yield and a good taste.A lot of the tests relate to coherence, depend on an active participation of the researcher, for example the sensoryproperties and ‘empathical observations’ when judging the crystallisation images. When developing theseparameters, specific attention must be spent on the (inter-subjective) judgements, to allow the tests to bescientifically sound. The development of tests to determine coherence is of great importance for the new quality-concept; because the coherence aspect is the most essential aspect of ‘vital-quality’.
Assessment of the usefulness of the quality-concept for fruitgrowersRecognising and judging the balance is of great importance for growers to deploy cultural measurements whichwill restore the balance in good time. After presentation of this quality-concept, fruitgrowers were capable ofpointing out the cultural measurements they could deploy to limit surplus growth or differentiation. Mostfruitgrowers were however uncertain on how to actually stimulate the integration of both processes. Biodynamicalgrowers presume Bd-preparations play a role in this event, although this has not been proven yet.

J. Bloksma, M. Northolt and M. Huber, Louis Bolk Institute, 20016
Assessment of the used parameters for the quality-conceptThe traditional parameters are indispensable as they allow us to verify the series and the homogeneity, and form alink with literature. Amongst the experimental parameters, notably the crystallisations, biophotons and Bovis-valuewere of great value for the development of a new and coherent quality-concept. The significance of the capillarypictures has not been established yet. Perhaps in the future, the low cost parameters can be used routinely, albeitinterpreted in respect to the entire quality-concept, like for example the sweet/sour ratio and the protein/aminoacid ratio.
Recommendations for further research for concept- and method-development• comparable experimental design with apples in a series of increasing nitrogen fertilisation, and anew series
with Bd-preparations, see discussie in §19.3.• comparable experiments with other products, notably carrot, red beet, potato, tomato and milk and determine
whether the three aspects of vital-quality can also be found in these products.• methodical improvement of the parameters: taste, self-disintegration, crystallisation and Bovis-value.• further development and interpretation of biophotons and copperchloride crystallisations.• which cultivation circumstances improve the integration process?• nutritional research to determine the significance of vitality, structure and coherence for human health.

Parameters for apple quality and an outline for a new quality concept, part 1. 7
Fig. 11a: Vital Quality in keywords for various crops
Vital Qualitycommunication with communication with
the grower about consumer and retailer aboutPROCESSES PROPERTIES
in the growing crop of the harvested product
1. Growth 1. Vitalityhh forming mass hhgreen vegetative mass, size,
yieldhh forming primary metabolites hhsugar, acid, starch, through photosynthesis amino acids, proteinhh anabolic processes hhtension, juiciness, crispnesshh hormones auxin, gibberellin, cytokinin hhmetabolic energy
hhgermination power
2. Differentiation 2. Structurehhripening, refining hhdifferentiated refined formshhordering hhorder, calcium, firm cell wallshhforming secondary metabolites hhcolour, aroma, bitterness, wax,hhhormone ethylene vitamins, phenolic compounds,hhcatabolic processes hhstorablehhforming pollen and flowerbuds hhgenerative organs, seeds
1+2 Integration 1+2 Coherencehhbalancing growth and differentiation hhbalance of vitality and
structurehhco-operation hhintegration, resistance to
disintegrationhhself-regulating hhself-regulation, elasticity
resistance to stress and, diseases
hhrelating to species, variety, development, hhspecies typical, farm typical, etc. season, soil, farm context, etc. hharomatic taste AND firmness
AND storage potentialhhcapable to reproduce

J. Bloksma, M. Northolt and M. Huber, Louis Bolk Institute, 20018
Samenvatting en konklusies: Parameters voorappelkwaliteit en een aanzet tot een nieuwkwaliteitsconceptAanleiding en het kader van het ‘Food, Quality and Health-programma’Het veel gehanteerde kwaliteitsbegrip, met nadruk op uiterlijk en inhoudsstoffen, blijkt niet te voldoen voorproducten uit de biologische landbouw en het bijbehorende handelskanaal. Biologische telers en hunconsumenten streven naar een product met ‘vitaliteit’, ‘levenskracht’, ‘samenhang’ of noemen het nog anders. Vandeze begrippen wordt verwacht dat ze een rol spelen bij gezonde voeding en dat een levend voedingsproduct zichonderscheidt van een oplossing van nutriënten.De genoemde begrippen worden echter door verschillende mensen heel verschillend ingevuld, meestal gebaseerdop één of enkele analyses. Een kwaliteitsconcept op basis van deze begrippen met toetsbare parameters ontbraknog.Het internationale meerjaren onderzoek ‘Food, Quality and Health’ (FQH) heeft als doel een samenhangendkwaliteitsbegrip met toetsbare parameters te ontwikkelen dat aansluit bij de behoefte van de biologischeproducenten en consumenten. De eerste stap is het ontwikkelen van kwaliteitsbegrippen en parameters. Hiervooris het voorlopige concept van de ‘vitale kwaliteit’ ontwikkeld. Daarna is pas de tweede stap mogelijk, het toetsenof producten met een hoge ‘vitale kwaliteit’ inderdaad gezonder zijn voor (bepaalde groepen) mensen.In dit eerste FQH-project met appels verkenden we de mogelijkheid om een begrip voor ‘vitale kwaliteit’ teintroduceren met toetsbare parameters. Het is nadrukkelijk een verkenning omdat het introduceren van een nieuwkwaliteitsbegrip met experimentele parameters het risico van een cirkelredenering met zich meebrengt. Immerseen onbekend begrip laat zich moeilijk introduceren door onbekende parameters. Het nieuwe kwaliteitsbegrip ende parameters zijn ‘voorlopig’ en moeten gedurende meerdere jaren en bij verschillende producten op consistentieen bruikbaarheid getoetst worden. Uiteindelijk kan dan het vertrouwen ontstaan of ‘vitale kwaliteit’ een zinvol entoetsbaar begrip is. In dit project is het hier beschreven begrip ontwikkeld en aangepast aan een heel beperktecontext, namelijk aan appels van één ras, wel met verschillende behandelingen gegroeid, maar op één bedrijf enin één jaar.
Kwaliteitsbegrip ‘vitale kwaliteit’Wij stellen aan een kwaliteitsbegrip voor de biologische landbouw een aantal eisen. Ten eerste dat het aansluit bijhet centrale paradigma uit de biologische landbouw, het verzorgen van levensprocessen. Groei en differentiatiekunnen als de twee basis levensprocessen beschouwd worden, die al dan niet in balans en geïntegreerd metelkaar kunnen zijn. Groei, differentiatie en hun integratie zijn de drie aspecten waarop het nieuwe kwaliteitsbegripis gebaseerd.Ten tweede moet het kwaliteitsbegrip gebruikt kunnen worden zowel door de producent als door de consument.Beide hebben een heel verschillende belevingswereld. De producent ziet het groeiend gewas en denkt in termenvan levensprocessen, die hij of zij kan bevorderen of afremmen en in balans brengen. De consument en handeldenken in termen van eigenschappen van het eindproduct die controleerbaar en herkenbaar moeten zijn. Hetkwaliteitsbegrip heeft daarom twee kanten, die van de processen en die van de eigenschappen. Beide kanten zijnaan elkaar gerelateerd.Ten derde moet het kwaliteitsbegrip aansluiten bij de holistische visie op gezondheid van artsen envoedingskundigen, zodat in de tweede fase van het programma onderzoeksprojecten opgezet kunnen worden omgezondheid te toetsen en een theorie voor het werkingsmechanisme ontwikkeld kan worden.Alle eisen verenigd, ontwikkelden we een kwaliteitsbegrip dat we aanduiden met ‘vitale kwaliteit’, dat gebaseerdis op de processen groei, differentiatie en integratie met de corresponderende producteigenschappen vitaliteit,structuur en samenhang.
Vitaliteit is maar één aspect van ‘vitale kwaliteit’Het begrip vitaliteit heeft hierin dus een specifieke invulling gekregen, namelijk als het resultaat vangroeiprocessen. Het sluit hiermee aan bij mensen die ‘vitaal’ gebruiken in de zin van groeikrachtig, jong,levenslustig. Het sluit niet meer aan bij de mensen die ‘vitaal’ gebruiken voor de eigenschap dat een organisme

Parameters for apple quality and an outline for a new quality concept, part 1. 9
door harmonie tussen groei en differentiatie gezond is, met een sterke weerstand en met sterk zelfregulerendvermogen. Deze laatste toestand is in het nieuwe kwaliteitbegrip terug te vinden in het geïntegreerde ofsamenhangende aspect van vitale kwaliteit.
Doel en werkwijzeDoelstellingHet onderzoek richt zich op het ontwikkelen van een kwaliteitsbegrip voor de biologische landbouw en het zoekennaar bijbehorende toetsbare parameters. Dit onderzoek is dus niet in de eerste instantie gericht op de vraag ofproducten uit de biologische landbouw beter zijn dan producten uit de conventionele landbouw. We wetenimmers nog niet naar welke kwaliteitsaspecten we moeten kijken en wat we als ‘beter’ moeten beschouwen. Pasin tweede instantie, als het kwaliteitsbegrip ontwikkeld en getoetst is, kunnen verschillende teeltmethoden metelkaar vergeleken worden.
De appel als eerste proefgewasDe appel is gekozen als eerste proefgewas omdat voor fruittelers de levensprocessen groei en differentiatieherkenbaar zijn en het Louis Bolk Instituut ervaring heeft met dit gewas. Bij appel is al wereldwijd veel onderzoeknaar kwaliteit gedaan zodat we vooraf al wisten waarop gestandaardiseerd moest worden om geen ongewenstevariatie te krijgen. Het ras Elstar is gekozen als één van de meest smakelijke, Nederlandse appelrassen.
ReferentieseriesDe 20 speciaal voor dit onderzoek geteelde partijen Elstar appels vormen de basis van dit onderzoek. De appelswaren zó geteeld dat zo mogelijk slechts één van de levensprocessen in kleine stapjes tussen beide extremenvarieerde binnen één serie en verder alle andere factoren zoveel mogelijk gestandaardiseerd waren. De partijenvarieerden in pluktijdstip, dracht, zonlicht, Bd-preparaten en veroudering na bewaring. Door het zeer gunstigeteeltjaar 2000 bleken achteraf de beoogde extremen in de series te ontbreken en de beoogde optima niet preciesin het midden van de serie.
Keuze van parametersWe kozen parameters uit die een rol spelen in het reguliere kwaliteitsbegrip voor appel en experimenteleparameters waarvan we verwachtten dat ze relevant zijn voor ‘vitale kwaliteit’.De volgende parameters zijn onderzocht (per serie is een relevant geacht pakket samengesteld)• gewas: bodem, groei, dracht, ziekten en plagen, bladreeks, bloei het volgende jaar(LBI)• gangbare parameters: vruchtmaat, grondkleur, bloskleur, glans, hardheid, zetmeel, Brix, zuur, N, P, K, Mg, Ca,
droge stof (lab. PPO. Lab Zeeuws Vlaanderen).• vitamine C (LBI), fenolen (TU-München, D), aminozuren en eiwit (Kwalis Qualitätsforschung, Fulda, D),• zelfontbindingstest (LBI), smaak (LBI), koperchloride kristallisaties (LBI), stijgbeelden (LBI+ R.Mandera).• biofotonen bepaald met 2 verschillende methoden (Meluna Biofotonen-onderzoek, Wijk bij Duurstede NL, en
Kwalis Qualitätsforschung, Fulda, D)• electrotrochemische parameters: pH, redox-potentiaal, electrische weerstand, tezamen in P-waarde (H.
Heilmann, Kirchberg, D)• Bovis-waarde (dit is een intuïtieve waarneming die ter oriëntatie werd verkend, LBI).
Partners• Teelt van de appels: LBI, biologisch-dynamische Boomgaard ter Linde, Oost-Kapelle (NL).• Ontwikkelen kwaliteitsbegrip: LBI, R. van Wijk (NL), J.O. Andersen (DK), F. Weibel (CH), J. Strube en P. Stolz
(D), H. Heilmann (D).• Financiering: LBI, Meluna-biofotonen-onderzoek (NL), Kwalis Qualitätsforschung (D), Stichting Triodos Fonds
(NL), Software AG Stiftung (D), Zukunftsstiftung Landwirtschaft (D), Stichting Klaverblad (NL).
Herhalingen en betrouwbaarheidDe partijen van 120 appels zijn mengmonsters van minimaal 10 verschillende bomen, die verdeeld zijn in sub-monsters voor de verschillende laboratoria. Om de kosten te beperken in dit oriënterende onderzoek kozen we nietvoor onafhankelijke herhalingen in het veld. Per parameter is gekozen voor bepalingen aan mengmonsters of aan

J. Bloksma, M. Northolt and M. Huber, Louis Bolk Institute, 200110
onafhankelijke herhalingen van individuele appels. Bij de experimentele parameters is zo veel mogelijk gekozenvoor herhalingen binnen de partij om zicht op de variatie in de methode te krijgen. Een aantal gangbareparameters dienden als referentie en controle op homogeniteit van partijen.Het werken met behandelingsseries compenseert enigszins het gemis aan onafhankelijke herhalingen. De striktestandaardisatie van appelgrootte en groeiplaats in de boom hielp de variatie binnen de partijen te verkleinen.Bijna alle parameters lieten een consequent verloop binnen de series zien waardoor we achteraf de uniformiteitvan de series en de betrouwbaarheid van de kwaliteitsmetingen als voldoende beoordeelden. Alleen dezelfontbindingstest, het smaakonderzoek en de vitamine C-bepaling waren onvoldoende nauwkeurig, maarkunnen in de toekomst nog verbeterd worden.
Methodische stappenHet risico van een cirkelredenering is niet geheel weg te nemen. Ons anker ligt in de geteelde series appels meteen geleidelijke toename in bepaalde levensprocessen en het toetsen van consistentie tussen begrip enuitkomsten van parameters.De werkvolgorde was als volgt: De appels werden geteeld in series die binnen één serie zomogelijk in slechts éénvan de levensprocessen varieerden. De experimentele parameters die relevant leken voor deze levensprocessenwerden bepaald. De uitkomsten werden vergeleken met het verloop van gangbare parameters en met gegevensuit de literatuur. Hieruit bleek dat we goed bruikbare series hadden. De experimentele parameters bleken degangbare parameters aan te vullen en verrijkten ons beeld van de levensprocessen en van het kwaliteitsbegrip.Ook werd beoordeeld hoe parameters zich onderling verhielden. Tenslotte werden alle parameters stuk voor stukbeoordeeld op hun relatie met de levensprocessen en hun relatie met het nieuwe kwaliteitbegrip.
Resultaten van de behandelingsseriesRijpheidVoor de vergelijkbaarheid binnen één behandelingsserie is gekozen voor analyses op dezelfde dag. Voor de seriemet 5 verschillende pluktijdstippen (tussen 1 september en 9 oktober) betekent dit dat vroeg plukken gekoppeldis aan enkele weken langer gekoeld bewaren. De serie laat daarom in feite zien wat het verschil is tussen rijpingaan de boom en rijping in de koeling. De omzetting van zetmeel naar suiker en verlies van hardheid tredenimmers zowel aan de boom als in de koeling op. Echter, voor bepaalde aspecten van rijping is rijping aan deboom essentieel, zoals kleur, maat, smaak, biofotonen, kristallisatiebeeld, stijgbeeld en Bovis-waarde.Het bepalen van al deze parameters hielp ons om het rijpingsproces te leren herkennen als een opeenvolgendproces waarin steeds andere stoffen van vaste vorm in oplossing gaan of verdampen: bijvoorbeeld harde vruchtenmet zetmeel, zuur en fenolen gaan over in sappige vruchten met opgeloste suikers en aromatische stoffen.De beeldvormende methoden laten een toename in openheid en naar-buiten-gericht-zijn zien. Het rijpingsproceskunnen we karakteriseren als een lichte afname van vitaliteit en een toename van structuur en samenhang. Dit integenstelling tot het verouderingsproces in de koeling, waarin ook verlies van vitaliteit optreedt, maar zondertoename van structuur en samenhang. Veel parameters, die samenhang aangeven hadden een maximale (hieroptimale) waarde ten tijde van het derde of vierde pluktijdstip.
DrachtIn juni werden vruchten uit bomen gedund tot de gewenste drachtniveaus: 35, 75, 100, 125 en 140 vruchten perboom. Dit komt overeen met 14, 30, 40, 50 en 60 ton appels per hectare. Vooraf hadden we het derde dracht-niveau als optimaal ingeschat, maar door het gunstige seizoen bleek achteraf het vierde drachtniveau dit jaar ooknog mogelijk voor voldoende smaak en bloemknopvorming. Een bekend fenomeen, en ook hier weer gevonden,was dat hogere dracht samen gaat met minder twijggroei (in beeld gebracht met de bladreeks methode), en ookmet een lagere blad/vrucht-verhouding en minder bloemknopaanleg voor het volgende jaar. Bij de kwaliteit vande vruchten bleek de hogere dracht een afname door verdunning tot gevolg te hebben in alle parameters die metassimilatie en mineralenopname te maken hebben: droge stof, suiker, zuur, aroma en de verschillende mineralen.Calcium gedroeg zich omgekeerd ten opzichte van de andere mineralen. Ca en Ca/K als maat voorbewaarbaarheid namen juist toe bij hogere dracht, hetgeen aansluit bij de ervaring in de praktijk.De kristallisatiebeelden gaven bij weinig vruchten de indruk van krachteloos en vegetatief en bij veel vruchtenscherpe vormen en indruk van armoede. Bij de middelmatige dracht waren de meest vitale en gedifferentieerdebeelden zien. De stijgbeelden werden scherper bij hoge dracht. De smaak was min of meer constant en alleen bijde hoogste dracht minder goed. Bij de hogere dracht nam de biofotonenemissie na excitatie af (maat voorvitaliteit) en de mate van hyperboliciteit van de emissie (maat voor de verhouding differentiatie/groei) toe.

Parameters for apple quality and an outline for a new quality concept, part 1. 11
Samenvattend was bij toenemende dracht een afname van vitaliteit en een toename van structuur waarneembaar.
ZonlichtBij de oogst zijn uit dezelfde bomen apart appels geplukt die in de volle zon hingen, geheel in de schaduw of daartussen in. We hadden twee series met zonlicht, één met en één zonder Bd-preparaten. In beide series werdenvrijwel overeenkomende resultaten ten aanzien van de zonbelichting gemeten. Bij de appels in volle zon vondenwe vooral meer kleur, fenolen, biofotonen (alle drie een indicatie voor differentiatie), een breder kleurenspectrumbij biofotonen (maat voor vrucht-typisch), hogere verhouding eiwit/aminozuren, meer samenhang entransparantie in het kristallisatiebeeld en meer ronde open vormen in de stijgbeelden (allen maat voor meerintegratie). Verrassend was dat er geen verschil in smaak was, ook niet in hardheid, calcium of zuurgraad. Nieuwvoor ons waren de veel hogere gehalten van N, P, K , aminozuren en eiwit in de schaduwvruchten. De zonvruchtenhadden hierdoor een hogere Ca/K-verhouding dat aansluit bij de ervaring in de praktijk dat zonbelichte vruchtenbeter bewaarbaar zijn.Samenvattend lijkt zonbelichting dus de differentiatie te stimuleren, waardoor meer structuur en samenhang werdgevonden.
Biologisch-dynamisch spuit preparatenEen deel van de boomgaard kreeg dit seizoen geen Bd-spuitpreparaten. Het andere deel werd twee maalbehandeld met koemestpreparaat en tweemaal met kiezelpreparaat. Er werd een zonlicht-serie geplukt in zowelhet deel met preparaten als in het deel zonder preparaten.Bij de controle op homogeniteit bleek het deel zonder preparaten iets groeikrachtiger, waarbij we niet kunnenaangeven of dit door de preparaten komt of door andere oorzaken.Opvallend was dat met gangbare parameters, zoals kleur, smaak, hardheid, mineralen, zetmeel, zuur en pH geenverschil gevonden werd tussen appels uit het deel met en zonder preparaten. Echter bij een aantal experimenteleparameters die differentiatie of integratie aangeven vonden we wel verschillen, zoals bij fenolen,eiwit/aminozuren, elektrische weerstand, breder kleurenspectrum bij biofotonen, transparanterkristallisatiebeelden en Bovis-waarde. De effecten treden echter niet altijd bij alle drie niveaus van zonbelichtingop en maken daardoor harde conclusies niet mogelijk.De series over licht en preparaten zijn gecombineerd omdat we van preparaten een vergelijkbaar effect als vanzonlicht verwachtten en bovendien het bevorderen van het integratie-proces. Beide verwachtingen kunnen nochbevestigd noch ontkent worden door deze resultaten.
VerouderingDe appels van het vierde pluktijdstip werden 3 maanden in de mechanische koeling bewaard en op verschillendemomenten uit de koeling op de fruitschaal gelegd. Hierdoor ontstond een serie in uitstalleven van 1, 4, 8 en 12dagen. Bekend, en ook hier gevonden, is dat bij veroudering de hardheid en het zuurgehalte duidelijk afnemen,terwijl het suikergehalte nog een tijdlang op peil blijft. Bijna alle parameters lieten een beperkte veroudering zien,maar minder sterk dan we verwacht hadden. De serie was niet extreem genoeg en had achteraf nog langereuitstalperioden moeten bevatten om werkelijk verval in beeld te krijgen. Bij de kristallisatiebeelden ontwikkelde denaaldstructuur zich steeds meer in de periferie naarmate de appels ouder waren.Opmerkelijk was dat de appels die net 1 dag uit de koeling waren, door veel parameters als minder goed werdenbeoordeeld dan appels van 4 dagen uit de koeling. Ze lijken na koeling (en/of transport) gedurende een aantaldagen te moeten acclimatiseren.Voor het toetsen van het kwaliteitsbegrip was deze serie geen illustratieve serie omdat waarschijnlijk vooralvitaliteit, maar ook differentiatie en integratie afnamen. De veranderingen in levensprocessen zijn in dezeverouderingsserie niet te onderscheiden.
Verdere uitwerking van het begrip ‘vitale kwaliteit’Uit het onderzoek blijkt dat, naast de twee levensprocessen groei en differentiatie, het zinvol lijkt om als derdeaspect de integratie tussen deze twee processen toe te voegen.Het onderscheiden van twee levensprocessen, groei en differentiatie, is slechts een denkbaar onderscheid. Zodraeen levend wezen begint te groeien is er al sprake van beide processen, die in een bepaalde verhouding staan.Soms met de nadruk op groei (vegetatieve levensfase, weelderigheid, kankergezwel) en soms met nadruk opdifferentiatie (generatieve levensfase, armetierige noodbloei). Hieronder worden de kenmerken van ‘vitalekwaliteit’ beschreven aan de hand van de appelparameters. In bijgaand schema fig. 11b worden deze begrippen

J. Bloksma, M. Northolt and M. Huber, Louis Bolk Institute, 200112
veralgemeniseerd als basis voor onderzoek bij andere gewassen.
Vitaliteit is het resultaat van groeiGroei kan worden beschreven als het proces van expansief vullen van de ruimte met ongevormde massa, groei vanorganen, celdeling en bij planten de productie van primaire metabolieten door fotosynthese. Een vitale boomheeft veel groene bladeren en een flinke appelopbrengst. Een vitale appel heeft een grote maat, is stevig,knapperig en sappig. Het product heeft een hoog gehalte aan zetmeel, suiker, zuur, aminozuren en eiwittenwaarbij de verhouding tussen aminozuren en eiwit wordt bepaald door de mate van rijpheid. Een vitale appel isnog bezig met opbouw van biomassa, waarbij nog vele transporteerbare stoffen worden gevonden (aminozuren,suikers). De pH is hoog, de turgor is hoog, de hoeveelheid biofotonen direct na excitatie is hoog en dekristallisatiebeelden zijn goed gevuld met een dichte naaldstructuur.
Structuur is het resultaat van differentiatieDifferentiatie is het proces van specialisatie in vorm en functie, zoals celdifferentiatie, verfijning in vorm, geur,kleur, glans, afrijping, bloemknopvoming, stuifmeelvorming en zaadvorming. Er ontstaat ordening van structuur envorming van secundaire metabolieten, zoals de was op de schil, fenolen, vitaminen en aromatische stoffen.Vruchten met goede structuur hebben veel pitten, een hoog calciumgehalte en zijn lang bewaarbaar. Dehoeveelheid biofotonen neemt na excitatie in een hyperbolische curve af. De kristallisatiebeelden zijn duidelijkgeordend, hebben slechts één centrum en de scherpe zijnaalden hebben een grote hoek.
Samenhang is het resultaat van integratieDe groeiprocessen moeten op een middelhoog niveau plaatsvinden om de differentiatie processen goed te latenverlopen. Bij te weelderige groei komt de afrijping niet tot zijn recht. En bij geringe groei, leidt differentiatie totarmetierigheid, tot noodbloei en tot ‘conservering’ met harde, droge appeltjes als gevolg.Als groei en differentiatie gelijktijdig en evenwichtig verlopen, eventueel in ritmische afwisseling, dan is sprakevan een integratie proces. Er is een dynamische balans tussen groei en differentiatie die mede afhangt van decontext, zoals soort, ras, ontwikkelingsstadium, seizoen, bodem en boomgaardmanagement.Bij integratie gaat het niet alleen om een bepaalde balans tussen groei en differentiatie, maar ook om de matevan in wisselwerking treden. Bij voldoende integratie combineert een appel een goede smaak met een redelijklange bewaarbaarheid. De smaak is aromatisch, sappig, knapperig en heeft een goede verhouding tussen zoet enzuur. De biosynthese is afgerond, wat herkenbaar is aan weinig vrije aminozuren en relatief veel eiwit. Zulkeappels hebben weerstand tegen zelfontbinding, stress en ziekten. Het vruchtvlees is elastisch en behoudt devochtspanning lange tijd na het plukken. De electrische weerstand is hoog en de redox-potentiaal is laag. Dehoeveelheid biofotonen begint na excitatie op hoog niveau en neemt met een hyperbolische curve af en laat eenbreed, vrucht-typische kleurenspectrum zien. De kristallisaties tonen een samenhangend en appel-typisch beeld.De Bovis-waarde is hoog.
Het aspect ‘samenhang’ blijkt een relationeel kenmerkBij het beoordelen van vitaliteit en structuur kan de waarnemer nog afstandelijk en objectief beoordelen. Zelfs dekristallisatiebeelden kunnen op dit niveau door een beeldherkennende computer tot op zekere hoogte beoordeeldworden. Bij het beoordelen van samenhang wordt betrokkenheid en inleving van de waarnemer verwacht en ookeen doelstelling als referentie voor de beoordeling. De fruitteler brengt een eigen regie in. Hij kiest destreefwaarden in de verhouding tussen groei en differentiatie door de afweging tussen streven naar hogeopbrengst en streven naar goede smaak. Bij veel van de testen op samenhang wordt een actieve deelname van deonderzoeker verwacht, bijvoorbeeld smaakproeven en inlevend waarnemen bij de beoordeling van dekristallisatiebeelden. Bij het ontwikkelen van deze parameters moet speciaal aandacht aan de (inter-subjectieve)beoordeling worden gegeven om de testen acceptabel voor wetenschappelijk onderzoek te laten zijn. Hetontwikkelen van testen om integratie te meten is van groot belang voor het nieuwe kwaliteitsbegrip; het aspectsamenhang is immers het meest wezenlijk voor ‘vitale kwaliteit’.

Parameters for apple quality and an outline for a new quality concept, part 1. 13
Beoordeling op bruikbaarheid voor fruittelers van het kwaliteitsbegripHet herkennen en beoordelen van de balans is voor telers van groot belang om tijdig met cultuurmaatregelen tekunnen corrigeren. Fruittelers bleken in staat om na presentatie van dit kwaliteitsconcept de cultuurmaatregelente noemen die ze kunnen inzetten als correctie op te veel groei of op te veel differentiatie. Hoe de werkelijkeintegratie tussen beide processen te bevorderen is, bleek voor de fruittelers onzeker. Biologisch-dynamische telersnemen aan dat de Bd-preparaten hierbij een rol spelen, maar dat moet nog beter aangetoond worden in volgendonderzoek.
Beoordeling van de gebruikte parameters voor het kwaliteitsbegripDe gangbare parameters zijn als basis onontbeerlijk en maken controle van series, van homogeniteit enaansluiting op de literatuur mogelijk. Onder de experimentele parameters, lijken met name de kristallisaties,biofotonen en Bovis-waarde van waarde te zijn voor het ontwikkelen van een nieuw en samenhangendkwaliteitsbegrip. De betekenis van stijgbeelden en elektrochemische parameters is nog onvoldoende duidelijk. Inde toekomst kunnen wellicht de goedkopere parameters routinematig gebruikt worden, maar dan geïnterpreteerdvanuit het gehele kwaliteitbegrip, zoals bijvoorbeeld de verhouding zoet/zuur en de verhoudingeiwit/aminozuren.
Aanbevelingen voor verder onderzoek voor de begrips- en methode-ontwikkeling• vergelijkbare proefopzet met appels in een serie met toenemende stikstofbemesting en opnieuw een serie met
Bd-preparaten.• vergelijkbare proefopzet met andere producten, m.n. wortel, rode biet, tarwe, aardappel, tomaat, melk en
beoordelen of de drie aspecten van vitale kwaliteit hier ook te vinden zijn.• methodische verbetering van de parameters: smaak, zelf-ontbindingstest en kristallisaties.• verdere ontwikkeling in interpretatie van biofotonen, koperchloride kristallisaties en Bovis-waarde.• welke teeltomstandigheden verbeteren het integratieproces?• voedingsonderzoek om de betekenis van vitaliteit, structuur en samenhang voor de menselijke gezondheid te
bepalen.

J. Bloksma, M. Northolt and M. Huber, Louis Bolk Institute, 200114
Fig. 11 b: Vitale kwaliteit in trefwoorden voor diverse gewassen
Vitale kwaliteitcommunicatie met communicatie met de
de teler over de consument en handelaar over dePROCESSEN EIGENSCHAPPENin het gewas van het geoogst product
1. Groei 1. Vitaliteithh massa vorming hhgroene massa, maat, opbrengsthh vorming primaire metabolieten hhsuiker, zuur, zetmeel, door fotosynthese aminozuren, eiwithh anabolische processen hhturgor, sappigheid, knapperigheidhh hormonen auxine, gibberelline, cytokinine hhmetabolische energie
hhkiemkracht
2. Differentiatie 2. Structuurhhrijping, verfijning hhgedifferentieerde fijne vormenhhordening hhorde, calcium, stevige celwandenhhvorming secondaire metabolieten hhkleur, aroma, bitterheid, was,hhhormoon ethyleen vitamines, fenolenhhkatabolische processen hhbewaarbaarhhbloemknopvorming, stuifmeelvorming hhgeneratieve organen, zaden
1+2 Integratie 1+2 Samenhanghhbalans tussen groei en differentiatie hhbalans in vitaliteit en structuurhhintegratie, doordringing hhintegratie, weerstand tegen
zelfontbindinghhzelfregulatie hhzelfregulatie, elasticiteit,
weerstand tegen stress en ziekten,hhrelatie tot soort, ras, ontwikkelingsfase, hhsoort-typisch, bedrijfs-typisch, etc.
seizoen, bodem, bedrijfs-context, etc. hharomatische smaak EN hardheid EN bewaarbaarheidhhin staat tot voortplanting

Parameters for apple quality and an outline for a new quality concept, part 1. 15
Zusammenfassung und Konklusionen: Parametern fürApfelqualität und ein Entwurf eines neuenQualitätsbegriffesDer Grund und der Rahmen vom ‘Food, Quality and Health-Programm’Der viel verwendete Begriff der Qualität mit Betonung des Aussehens und der Inhaltstoffe, scheint sich bei denProdukten des ökologischen Landbaus und dem dazugehörigen Handel nicht zu bewähren.Ökologische Bauern und ihre Konsumenten streben ein Produkt an, dem ‘Vitalität‘, ‘Lebenskraft‘,‘Ganzheit’,‘Zusammenhang‘ oder wie es auch immer bezeichnet wird, innewohnt. Von diesen Begriffen wird erwartet, dass siegesunde Nahrungsmittel beschreiben und mit ihrer Hilfe lebendige Nahrung von einer bloßen Nährstofflösungunterschieden werden kann. Hiervon ist die sogenannte Astronautennahrung die extremste Form.Die genannten Begriffe werden von jedem Menschen unterschiedlich interpretiert, häufig in Bezugnahme auf eineUntersuchung, wobei ein Qualitätskonzept mit prüfbaren Parametern bisher immer noch fehlte.
Das internationale mehrjährige Programm ‘Food, Quality and Health’ (FQH) hat zum Ziel einen umfassendenQualitätsbegriff mit überprüfbaren Parametern zu entwickeln, der den Bedürfnissen ökologischer Produzenten undKonsumenten entspricht. Der erste Schritt ist das Entwickeln von Qualitätsbegriffen und Parametern. Hierfür istdas vorläufige Konzept von der ‘vitalen Qualität’ entwickelt worden. Dann erst ist es als zweiter Schritt möglich zuprüfen, ob für bestimmte Gruppen von Menschen die Produkte mit einer hohen ‘vitalen Qualität’ tatsächlichgesünder sind.
In diesem ersten FQH-Projekt mit Äpfeln, suchten wir nach Möglichkeiten einen Begriff für ‘vitale Qualität’ mitnachprüfbaren Parametern einzuführen.Dies ist lediglich ein Versuch, weil die Einführung eines neuen Qualitätsbegriffs mit Hilfe von experimentellenParametern Gefahr läuft, sich im Kreis seiner eigenen Gedanken zu verfangen. Der hier entwickelte neueQualitätsbegriff und die Parameter verstehen sich als „vorläufig’ und müssen mehrere Jahre hindurch bei vielenProdukten auf ihre Zuverlässigkeit und Handhabbarkeit hin getestet werden. Dann erst kann man daraufvertrauen, dass ‘vitale Qualität’ ein sinnvoller und nachprüfbarer Begriff ist. In diesem Projekt wurde der hierbeschriebene Begriff in einem sehr begrenzten Kontext entwickelt, nämlich anhand von Äpfeln einer Sorte, dieinnerhalb eines Jahres auf einem Betrieb gewachsen sind und dabei unterschiedlichen Behandlungen ausgesetztwaren.
Qualitätsbegriff ‘vitale Qualität’An einem Qualitätsbegriff für den ökologischen Landbau stellen wir einige Ansprüche. Erstens sollte er an daszentrale Paradigma, nämlich das Bewahren von Lebensprozessen, anschließen. Wachstum und Differenzierung alsdie Grundlagen der Lebensprozesse können miteinander im Gleichgewicht stehen und in den Prozess integriertsein oder auch nicht. Wachstum, Differenzierung und ihre Integration sind die drei Aspekte, auf denen der neuenQualitätsbegriff basiert.Als zweites sollte der Qualitätsbegriff sowohl vom Produzenten als auch vom Konsumenten angewendet werdenkönnen. Beide haben äußerst unterschiedliche Vorstellungen. Der Produzent sieht die wachsende Pflanze unddenkt in Begriffen von Lebensprozessen, die er oder sie fördern, hemmen und ins Gleichgewicht bringen kann.Konsument und Handel denken an die Eigenschaften des Endproduktes, die kontrollierbar und erkennbar seinsollen. Der Qualitätsbegriff hat darum zwei Seiten: Prozesse und Eigenschaften. Beide Seiten stehen miteinanderin Verbindung.Als drittes soll der Qualitätsbegriff anschließen an die ganzheitliche Betrachtungsweise von Ärzten undErnährungswissenschaftlern sowie über Gesundheit, so dass in der zweiten Phase des ProgrammsUntersuchungsprojekte durchgeführt werden können, die den Nutzen der Produkte für die Gesundheit testen undeiner Theorie für die Wirkungsweise zu entwicklen.
Unter Berücksichtigung aller Ansprüche haben wir einen Qualitätsbegriff entwickelt, der mit ‘vitaler Qualität’bezeichnet wird. Er basiert auf den Prozessen Wachstum, Differenzierung und Integration und beinhaltet die

J. Bloksma, M. Northolt and M. Huber, Louis Bolk Institute, 200116
zugehörigen Produkteigenschaften Vitalität, Struktur und Kohärenz.
Vitalität ist nur ein Aspekt von ‘vitaler Qualität’Die Bedeutung des Begriffes Vitalität ist im Moment vorrangig das Resultat von Wachstumsprozessen. Vitalität indiesem Sinne bedeutet wachstumskräftig, jung, lebensfreudig. Der Aspekt von Vitalität, der die Fähigkeit meint,daß ein Organismus zwischen Wachstums- und Differenzierungsprozessen gesund und in Harmonie bleibt, einkräftiges Immunsystem und ein starkes selbstregulierendes Vermögen besitzt, dieser Aspekt findet sich in demneuen Qualitätsbegriff unter den Gesichtspunkten der Integration und Kohärenz wieder.
Ziel und ArbeitsmethodeZielsetzungZiel unserer Forschung ist es, einen Qualitätsbegriff für den ökologischen Landbau zu entwickeln und nach dendazugehörenden prüfbaren Parametern zu suchen. Dieses Forschungsvorhaben zielt also in erster Linie nicht aufdie Frage, ob Produkte aus dem ökologischen Landbau besser sind als Produkte aus dem konventionellenLandbau. Wir wissen ja noch nicht, welche Qualitätsaspekte wir zu Rate ziehen müssen, und was wir als ‚besser‘beurteilen sollen. Erst in zweiter Linie, wenn der Qualitätsbegriff entwickelt und geprüft worden ist, könnenunterschiedliche Anbaumethoden miteinander verglichen werden.
Der Apfel als erstes UntersuchungsobjektDer Apfel ist als erstes Untersuchungsobjekt gewählt worden, weil die Obstanbauer die Lebensprozesse Wachstumund Differenzierung des Apfels erkennen und das Louis Bolk Instituut mit diesem Obst Erfahrung hat. An Äpfelnist weltweit schon viel Forschung bezüglich Qualität betrieben worden, so dass wir vorher schon wussten, woraufwir standardisieren sollten, um unerwünschte Variationen zu vermeiden. Die Sorte Elstar wurde gewählt, da sieeine der schmackhaftesten niederländischen Apfelsorten ist.
ReferenzserienDie 20 speziell für diese Untersuchung angebauten Partien von Elstar-Äpfeln bilden die Grundlage dieserUntersuchung. Die Äpfel wurde so angebaut, dass möglichst nur ein Lebensprozess innerhalb einer Serie in kleinenSchritten zwischen den Extremen variiert und alle anderen Faktoren so gut wie möglich standardisiert bleiben.Die Partien unterscheiden sich durch den Zeitpunkt des Pflückens, den Ertrag, Sonneneinstrahlung, Anwendungder biodynamiche Präparate und die Alterung nach der Lagerung. Durch die günstigen Bedingungen, die imAnbaujahr 2000 herrschten, traten die erwarteten Extreme nicht auf, und die zu erwarteten Optima wichen vomMittelwert in der Serie ab.
Die Wahl der ParameterWir haben Parameter ausgewählt, die innerhalb des regulären Qualitätsbegriffes für Äpfel eine Rolle spielen undhaben experimentelle Parameter ausgewählt, von denen wir erwarteten, dass sie für die „vitale Qualität’ wichtigsind.Die folgenden Parameter sind untersucht worden (pro Referenzserie wurde ein für relevant befundenes Paketzusammengestellt)• Apfelbaum: Boden, Wachstum, der Ertrag, Krankheiten und Schädlingen, Blattfolge, Blüte im nächsten Jahr
(LBI).• Konventionelle Parameter: Fruchtgröße, Grundfarbe, Deckfarbe, Glanz, Festigkeit, Stärke, Brix, Säure, N, P, K,
Mg, Ca, Trockenmasse (Lab. PPO Randwijk und Lab. Zeeuws Vlaanderen).• Vitamin C (LBI), Phenole (TU-München), Aminosäuren und Eiweiß (Kwalis Qualitätsforschung, Fulda, D).• Selbstzersetzungstest (LBI), Geschmack (LBI), Kupferchloridkristallisation (LBI), Steigbilder (LBI + R. Mandera).• Zwei unterschiedliche Methoden mit Biophotonen (Meluna Biofotonen-onderzoek, Wijk bij Duurstede NL, und
Kwalis Qualitätsforschung, Fulda, D).• Elektrochemische Parameter: pH, Redoxpotential, elektrischer Widerstand, P-Wert (H. Heilmann, Kirchberg,
D).• Bovis-Wert (dies ist eine intuitive Wahrnehmung, welche zur Orientierung durchgeführt wird, LBI).

Parameters for apple quality and an outline for a new quality concept, part 1. 17
Die Partner• Für den Apfel-Anbau: LBI, biologisch-dynamische Boomgaard ter Linde.• Entwickeln des Qualitätsbegriffes: LBI, R. van Wijk (NL), J.O. Andersen (DK), F. Weibel (CH), J. Strube und P.
Stolz (D), H. Heilmann (D).• Finanzierung: LBI, Meluna-biofotonen-onderzoek (NL), Kwalis Qualitätsforschung (D), Stiftung Triodos Fonds
(NL), Software AG Stiftung (D), Zukunftsstiftung Landwirtschaft (D), Stichting Klaverblad (NL).
Die Wiederholbarkeit und die ZuverlässigkeitDie Partien von je 120 Äpfeln sind Mischproben von mindestens 10 unterschiedlichen Bäumen, die für dieverschiedenen Labors auf sogenannte Subproben verteilt werden. Um in dieser einer ersten Orientierungdienenden Untersuchung die Kosten zu beschränken, haben wir uns nicht für unabhängige Wiederholungen imFeld entschieden. Jeder Untersuchungsparameter wurde jeweils an einer Mischprobe oder an individuellen Äpfelngeprüft. Bei den experimentellen Parametern sind so viele Wiederholungen wie möglich innerhalb der Partienuntersucht worden, um so die Varianz der Methode abschätzen zu können.Einige herkömmliche Parameter dienten als Referenz und als Kontrolle für die Homogenität der Partien.Durch Behandlungsserien wird der Mangel an unabhängigen Partien einigermaßen kompensiert. Die genaueStandardisierung der Apfelgröße und der Wachstumsstelle des Apfels im Baum reduzierte die Variation innerhalbder Partien. Bei fast allen Parametern gab es einen konsequenten Verlauf innerhalb der Serien, wodurch wirhinterher sowohl die Einheitlichkeit der Serien als auch die Zuverlässigkeit der Qualitätsmessungen alsausreichend beurteilten. Nur der Selbstzersetzungstest, die Geschmacksuntersuchung und die Vitamin C-Bestimmung erwiesen sich als ungenau, können aber in der Zukunft noch verbessert werden.
Methodische SchritteDas Risiko, sich im Kreis seiner eigenen Gedanken zu befinden, kann man nicht ausschließen. Von diesemStandpunkt aus versuchten wir, innerhalb der angebauten Apfelserien einen Zusammenhang zwischen den sichverändernden Lebensprozesse zu erkennen und diese zu verstehen. Bei dem Experiment wurde folgendermaßenvorgegangen:Zuerst wurden die Äpfel in Serien angebaut. Die Äpfeln einer Serie sollten möglichst in nur eines Lebensprozessesvariieren. Anschließend wurden die experimentellen Parameter, die für den entsprechenden Lebensprozeßaussagekräftig sind, bestimmt. Die Resultate wurden mit herkömmlichen Parametern und mit Aufzeichnungen ausder Literatur verglichen. Hier zeigte sich, dass wir über brauchbare Serien verfügten. Die experimentellenParameter ergänzten die herkömmlichen Parameter und ergänzten so unser Bild von den Lebensprozessen unddem Qualitätsbegriff. Die Beziehungen der Parameter untereinander wurden untersucht. Schließlich wurden dieBeziehungen der Parameter zu den entsprechenden Lebensprozessen beurteilt und in Beziehung zum neuenQualitätsbegriff gesetzt.
Die Resultate der BehandlungsserienReifeFür die Vergleichbarkeit innerhalb einer Behandlungsserie, sind die Analysen am gleichen Tag untersucht worden.Für die Serie mit fünf unterschiedlichen Ernteterminen (zwischen dem 1. September und dem 9. Oktober) bedeutetein früher Pflücktermin immer auch einige Wochen Lagerung bei kühlen Temperaturen. Aus dieser Serie lässt sichdeshalb der Unterschied zwischen der Reifung am Baum und der Reifung bei der Lagerung erkennen. DieUmwandlung von Stärke zu Zucker und der Verlust von Festigkeit verlaufen sowohl am Baum als auch bei derLagerung. Für viele andere Aspekte der Reifung ist die Reifung am Baum essentiell, wie z.B. Farbe, Größe,Geschmack, Biophotonen, Kristallisationsbild, Steigbild und der Bovis-Wert.Durch die Bestimmung all dieser Parameter verstanden wir den Prozess der Reifung als eine aufeinanderfolgendeUmwandlung von festen Stoffen in die flüssige oder gasförmige Zustandsform. So werden z.B. harte Früchte, mitStärke, Säuren und Phenole, in saftige Früchte mit aufgelösten Zuckern und Aromastoffen umgewandelt.Die bildschaffenden Methoden zeigen eine Zunahme von Offenheit und sind nach Außen gerichtet. DenReifungsprozess können wir als einen Übergang von Vitalität zu Struktur und Kohärenz charakterisieren. Das istein Gegensatz zum Alterungsprozess, der in der Kühlung stattgefunden hat, wobei auch ein Verlust an Vitalitätauftrat, aber ohne Zunahme von Struktur und Kohärenz.Vor allem die Früchte des dritten oder vierten Erntetermins zeigten optimale Werte bei den

J. Bloksma, M. Northolt and M. Huber, Louis Bolk Institute, 200118
Untersuchungsparametern an.
Der ErtragIm Juni wurden die Früchte im Baum ausgedünnt bis auf die erwünschte Anzahl von: 35, 75, 100, 125 und 140Früchte pro Baum. Dies korreliert mit einer Erntemenge von 14, 30, 40, 50 und 60 Tonnen Äpfel pro Hektar.Vorher schätzten wir das dritte Ertragsniveau als den optimalsten Wert ein. Aber auf Grund der günstigen Saisonerwies sich auch das vierte Ertragsniveau bezüglich Geschmack und Blütenknospenformung als geeignet. Einbekanntes Phänomen, das sich auch hier wieder gezeigt hat, ist der Zusammenhang zwischen höherem Ertrag undgeringerem Wachstum der Äste (bildlich dargestellt durch die Blattfolgemethode) und auch ein niedrigesBlatt/Frucht-Verhältnis und weniger Knospenansatz für das nächste Jahr.Bezüglich der Qualität der Früchte zeigten sich bei dem höheren Ertrag niedrigere Werte bei denUntersuchungsparametern, die mit Assimilation und mit Aufnahme der Mineralien zu tun haben z.B.Trockenmasse, Zucker, Säuren, Aromen und mehrere Mineralien. Bei Calcium zeigte sich als einziges Mineral einesteigende Konzentration. Die Calciumkonzentration und das Ca/K-Verhältnis als Maßstab für die Lagerung, steigtmit höherem Ertrag, was mit der Erfahrung in der Praxis übereinstimmt.Die Kristallisationsbilder zeigten bei niedrigen Ertragsniveaus ein Bild von Kraftlosigkeit und entsprachen ehereinem vegetativen Stadium. Die Kristallisationsbilder des höheren Ertragsniveaus waren verkümmert, besaßenaber schärfere Formen. Bei den mittelmäßigen Ertragen waren meistens vitale und differenzierte Bilder zu sehen.Die Steigbilder wurden mit zunehmendem Ertrag schärfer. Der Geschmack zeigte kaum Unterschiede,verschlechterte sich aber bei dem höchsten Ertrag. Bei den Biophotonen nahm das Niveau gerade nach derAnregung ab (ein Maß für die Vitalität) und die „Hyperbolizität’ nahm zu (ein Maß für das VerhältnisDifferenzierung/Wachstum).Zusammenfassend muß gesagt werden, daß mit zunehmendem Ertrag eine Abnahme an Vitalität und eineZunahme an Struktur zu beobachten war.
SonnenlichtDer Baum wird in drei Bereiche gegliedert: erster Bereich mit voller Sonneneinstrahlung, zweiter Bereich mittotalem Schatten und der dritte Bereich stellt eine Mischform von beiden dar. Aus jedem der Bereiche werdenanschließend Äpfel geerntet.Es gibt zwei Serien mit drei Varianten Sonnenlicht, eine Serie mit und eine Serie ohne Biodynamische Präparate. Inbeiden Serien mit Sonnenlicht wurden fast übereinstimmende Resultate hinsichtlich Sonnenbeleuchtunggemessen. Bei den Äpfeln die in der vollen Sonne gewachsen sind, zeigte sich eine bessere Färbung, höhereGehalte an Phenolen, bessere Werte bei den Biophotonenmessungen (sind alle drei ein Maß für das VerhältnisDifferenzierung/Wachstum), ein breiteres Farbenspektrum bei den Biophotonen (ist ein Kennzeichen für denBegriff „Fruchttypisch’), höheres Verhältnis Eiweiß/Aminosäuren, bessere Einheitlichkeit und Transparenz imKristallbild und rundere, offenere Formen im Steigbild (sie sind alle ein Maß für mehr Integration). Überraschendwar, dass kein Unterschied im Geschmack gefunden wurde, so wie auch nicht in Festigkeit, Calcium- oder imSäuregehalt.Neu für uns waren die viel höheren Gehalte an N, P, K, Aminosäuren und Eiweiß bei den Früchten die im Schattengewachsen sind. Die Früchte, die in der Sonne gewachsen sind, besaßen ein höheres Ca/K-Verhältnis. Dieserletzter Zusammenhang ist in der Praxis bekannt; sonnebeleuchtete Früchte lassen sich besser lagern.Sonneneinstrahlung scheint die Differenzierung zu stimulieren, wodurch mehr Struktur und Kohärenz gefundenwurde.
Biologisch-dynamische SpritzpräparateEin Teil des Obstgartens wurde in dieser Saison nicht mit biodynamischen Spritzpräparaten behandelt. Der andereTeil wurde zweimal mit dem Kuhmistpräparat und zweimal mit dem Kieselpräparat behandelt. Sowohl aus derbehandelten als auch aus der unbehandeltem Fläche des Obstgartens wurden eine Sonnenlichtserien gepflückt.Bei der Kontrolle auf Homogenität erschien der Teil ohne Präparate ein wenig kräftiger im Wuchs, wir könnenaber nicht genau angeben, ob dies durch die Präparate verursacht wurde oder andere Ursachen hatte.Auffällig war, dass mit den herkömmlichen Parametern, wie Farbe, Geschmack, Festigkeit, Mineralien, Stärke,Säuren und pH-Wert, kein Unterschied gefunden wurde zwischen Äpfeln aus dem Teil mit und aus dem Teil ohnePräparate. Aber bei einigen experimentellen Parametern, die Differenzierung oder Integration angeben, fanden wirschon Unterschiede, z.B. bei Phenolen, Eiweiß/Aminosäuren, elektrischer Widerstand, breiteres Farbenspektrumbei den Biophotonen, transparenterer Kristallisationsbilder und höhere Bovis-Werte. Die Effekte treten aber nicht

Parameters for apple quality and an outline for a new quality concept, part 1. 19
bei allen drei Niveaus der Beleuchtung auf und machen deshalb eindeutige Aussagen nicht möglich.Die Licht und Präparatenserien sind miteinander kombiniert, weil wir von den Präparaten einen ähnlichen Effektwie von dem Sonnenlicht erwarteten und fördern den Integrationsprozess. Beide Erwartungen erwiesen sich durchdie Resultate weder als bestätigt noch als falsch.
AlterungDie Äpfeln des vierten Erntetermins wurden drei Monate lang bei kühlen Temperaturen gelagert und zuunterschiedlichen Zeitpunkten aus dem Lager geholt und in eine Obstschale gelegt. So entstand eine Serie mit 1,4, 8 und 12 Tagen alten Äpfeln. Hier bestätigte sich die in der Praxis bekannte Tatsache, daß mit zunehmenderAlterung die Festigkeit und der Gehalt an Säuren deutlich abnehmen, während der Zuckergehalt durch dieRemobilisierung noch eine Weile konstant bleibt. Fast alle Parameter zeigen eine begrenzte Alterung, aberweniger stark als wir erwarteten. Die Serie war nicht ausreichend aussagekräftig. Daher sollten dieLagerungszeiten der Äpfel erhöht werden, um einen wirklichen Verfall beobachten zu können.Bei den Kristallisationsbildern zeigte sich mit zunehmendem Alter der Äpfel auch eine Zunahme der Nadelstrukturan der Peripherie. Bemerkenswert war, dass die Äpfel die nach einem Tag aus der Kühlung geholt wurden, beivielen Parametern weniger gute Werte hatten als die Äpfel die vor 4 Tage aus dem Kühlhaus geholt wurden. Esscheint, als ob sich die Äpfel erst vom eventuellen Transportstress oder an die Bedingungen außerhalb derKühlung anpassen müssen.Für die Prüfung des Qualitätsbegriffes war diese Serie nicht anschaulich, wir vermuten, dass vor allem die Vitalität,aber auch die Differenzierung und die Integration abnehmen. Die Änderungen in den Lebensprozessen lassen sichin einer Alterungsserie nicht voneinander unterscheiden.
Weitere Ausarbeitung des Begriffes ‘vitale Qualität’Aus der Untersuchung zeigt sich, dass die Integration zwischen den beiden Lebensprozessen Wachstum undDifferenzierung eingefügt werden müsste.Das Unterscheiden von den zwei Lebensprozessen, Wachstum und Differenzierung ist nur ein begrifflicherUnterschied. Sobald ein lebendiges Wesen anfängt sich zu entwickeln, treten beide Lebensprozesse in einembestimmten Verhältnis gleichzeitig auf. Manchmal überwiegt das Wachstum (vegetative Lebensphase, Üppigkeit,Krebsgeschwulst) und manchmal die Differenzierung (generative Lebensphase, Notreife). Im unterstehenden Textwurden die Merkmale des Begriffes ‘vitale Qualität’ an Hand der untersuchten Qualitätsparameter bei Äpfelnbeschrieben. In dem beiliegenden Schema Fig. 11c werden diese Begriffe verallgemeinert, das als die Basis fürweitere Untersuchung an anderen Pflanzen dient.
Vitalität ist das Ergebnis von WachstumWachstum ist das Ausdehnen einer formloser Substanz in einen bestimmten Raum: z.B. das Wachstum vonOrganen, Zellteilung und die Produktion primärer Pflanzenstoffe durch die Photosynthese bei Pflanzen. Ein vitalerBaum zeichnet sich durch viele grüne Blätter und einen guten Apfelertrag aus. Der entsprechende vitale Apfel istgroß, fest, knusprig und saftig. Das Produkt enthält einen hohen Gehalt an Stärke, Zucker, Säuren, Aminosäurenund Eiweißen, wobei das Verhältnis zwischen Aminosäuren und Eiweiß durch das Maß der Reifung bestimmt wird.Ein vitaler Apfel ist noch mit dem Aufbau der Biomasse beschäftigt, aber es lassen sich noch viele transportierbareStoffe finden (Aminosäuren, Zucker). Der Säuregrad ist niedrig, der Turgor ist hoch, die Menge an Biophotonengleich nach der Anregung ist auch hoch und die Kristallisationsbilder sind mit einer dicht besetzten Nadelstrukturgefüllt.
Struktur ist das Resultat von DifferenzierungDifferenzierung ist der Prozess von Spezialisierung in Form und Funktion. Das sind z.B. die Zelldifferenzierung, dieVerfeinerung in Form, Geruch, Farbe und Glanz, die Reifung, die Blüteknospenformung, die Pollenbildung undSamenformung. Dabei wird die Struktur geordnet und die sekundäre Pflanzenstoffe werden geformt, wie z.B. dasWachs auf der Schale, Phenole, Vitamine und aromatische Stoffe. Früchte mit einer guten Struktur enthalten vieleKerne, haben einen hohen Gehalt an Calcium und die Lagerungszeit ist länger. Die Menge an Biophotonen nimmtnach „Exitation’ in einer hyperbolischen Kurve ab. Die Kristallisationsbilder sind deutlich strukturiert, haben nurein Zentrum und die spitzen Äste sind in einem großen Winkel angeordnet.

J. Bloksma, M. Northolt and M. Huber, Louis Bolk Institute, 200120
Kohärenz ist das Resultat von IntegrationDie Wachstumsprozesse müssen auf einem mittelhohen Niveau stattfinden, um die Differenzierungsprozesse gutverlaufen zu lassen. Bei einem zu üppigen Wachstum erfolgt keine vollständige Ausreifung. Und bei einemgeringen Wachstum, z. B Notreife erfolgt die Differenzierung in verkümmerte, kleine, harte, haltbare getrockneteÄpfel. Wenn sich die gleichzeitig ablaufende Prozesse, Wachstum und Differenzierung in einem Gleichgewichtbefinden, oder sich rhythmisch abwechseln, dann wird von einem Integrationsprozess gesprochen. Das dynamischeGleichgewicht zwischen Wachstum und Differenzierung, ist z.B. abhängig von Art, Sorte, Entwicklungsstadium,Saison, Boden und Obstgartenmanagement.Bei der Integration geht es nicht nur um ein spezifisches Gleichgewicht zwischen Wachstum und Differenzierung,sondern auch um die Wechselwirkung zwischen den beiden Prozessen.Bei einer ausreichenden Integration vereint ein Apfel einen guten Geschmack mit einer ziemlich langenHaltbarkeit. Der Geschmack kennzeichnet sich als aromatisch, saftig, knusprig und einem optimalen Verhältniszwischen süß und sauer. Die Biosynthese ist beendet, wenn wenig freie Aminosäuren und relativ viel Eiweiß in derFrucht vorhanden sind. Solche Äpfel besitzen bessere ’Schutzmechanismen’ gegen Selbstzersetzung, Stress undKrankheiten. Das Fruchtfleisch ist elastisch und hält lange Zeit nach der Ernte die Feuchtigkeitsspannung. Derelektrische Widerstand ist hoch und das Redoxpotential niedrig. Die Menge an Biophotonen fängt nach „Exitation’auf einem hohen Niveau an, nimmt danach mit einer hyperbolischen Kurve ab und zeigt dabei ein fruchttypischesFarbenspektrum. Die Kristallisationen zeigen ein einheitliches und apfeltypisches Bild. Der Bovis-Wert ist hoch.
Der Aspekt der Kohärenz scheint ein relatives Kennzeichen zu seinBei der Beurteilung von Vitalität und Struktur ist der Beobachter noch in der Lage seine Objektivität zu erhaltenund alles von einem gewissen Abstand zu betrachten. Auch die Kristallisationsbilder werden von diesemStandpunkt (Objektivität und Abstand) zum Teil mit Computerprogrammen analysiert. Zur Beurteilung derKohärenz wird vom Beobachter eines Engagement und mit dem Versuchsobjekt erwartet, sowie eine klareZielsetzung für die Referenz der Beurteilung.Der Obstbauer bringt seine eigenen Regie ein. Er entscheidet sich mit seinen Maßnahmen für einen gutenGeschmack oder einen hohen Ertrag. Damit legt er die optimalen Werte zwischen Wachstum und Differenzierungfest.Viele der Tests zum Aspekt des Kohärenzes verlangen eine aktive Teilnahme des Untersuchers (z.B.Geschmackstest) und ein Sich-Hineinversetzen in die Kristallisationsbilder.Bei der Entwicklung dieser Parameter soll die Aufmerksamkeit auf der intersubjektiven Beurteilung liegen, um dieTests für wissenschaftliche Untersuchungen geeignet zu machen. Das Entwickeln von Tests zur Messung derIntegration ist sehr wichtig für den neuen Qualitätsbegriff; der Aspekt der Kohärenz ist das wesentlichste Elementfür den Begriff der ’vitalen Qualität’.
Beurteilung der Brauchbarkeit des Qualitätsbegriffes für den ObstbauerDas Erkennen und Beurteilen des Gleichgewichts ist für den Anbauer sehr wichtig, um rechtzeitig mitentsprechenden Kulturmaßnahmen Korrekturen vornehmen zu können. So waren die Obstanbauer in der Lage,nach der Vorstellung des Qualitätskonzeptes Kulturmaßnahmen zu nennen, die bei zu viel Wachstum oderDifferenzierung zur Regulation angewendet werden könnten. Wie die tatsächliche Integration zwischen beidenProzessen sich stimulieren läßt, war den Obstbauern jedoch unklar. Biologisch-dynamisch wirtschaftendeObstbauern vermuten, dass die biodynamische Präparate hierbei eine Rolle spielen, diese Vermutung muß abernoch in weiteren Forschungen nachgewiesen werden.
Die Beurteilung der verwendeten Parameter für den QualitätsbegriffDie herkömmlichen Parameter sind als Basis unentbehrlich, erst sie machen die Untersuchung von Serien,Homogenität und die Vergleichbarkeit mit Aufzeichnungen in der Literatur möglich. Von den experimentellenParametern erscheinen die Kristallisationen, die Biophotonenmessung und der Bovis-Wert, für die Entwicklung desneuen, ganzheitlichen Qualitätsbegriffes als brauchbar. Die Bedeutung der Steigbilder und die elektrochemischenParameter sind noch unzureichend. In der Zukunft können vielleicht die kostengünstigen Parameter routinemäßigangewendet werden, aus der Sicht des neuen Qualitätsbegriffes, wie z.B. das Verhältnis süß/sauer oder dasVerhältnis Eiweiß/Aminosäuren.

Parameters for apple quality and an outline for a new quality concept, part 1. 21
Empfehlungen für weitere Untersuchungen bezüglich der Begriffsentwicklung undder Methodenentwicklung• Vergleichbare Versuchsreihe mit Äpfeln in einer Serie bei zunehmenden Stickstoffdüngung und erneut eine
Serie mit biodynamische Präparaten.• Vergleichbare Versuchsreihen mit anderen Produkten vor allem Möhren, Rote Bete, Weizen, Tomate, Milch
und die Beurteilung, ob die drei Aspekte des Begriffes „vitale Qualität’ auch hier zu treffen.• Methodische Verbesserung der Parameter: Geschmack, Selbstzersetzungstest, und die Kristallisationen.• Weitere Verbesserung der Interpretation der Biophotonenmesswerte, der Kupferchloridkristallisation und
Bovis-Wert.• Welche Anbaubedingungen verbessern den Integrationsprozess?• Die Untersuchung der Nahrung, um die Bedeutung von Vitalität, Struktur und Kohärenz für die menschliche
Gesundheit zu erkennen.

J. Bloksma, M. Northolt and M. Huber, Louis Bolk Institute, 200122
Fig. 11c: Vitale Qualität in Stichworten für unterschiedliche Anbauprodukte
Vitale QualitätKommunikation mit Kommunikation mit dem
Produzenten über die Konsument und dem Händler überPROZESSE EIGENSCHAFTEN
in den Anbauprodukten der geernten Produkten
1. Wachstum 1. Vitalitäthh Massebildung hhgrüne Masse, Größe, Ertraghh Bildung von primären Pflanzenstoffen hhZucker, Säuren, Stärke, durch die Photosynthese Aminosäuren, Eiweißhh anabolische Prozesse hhTurgor, Saftigkeit, Knusprigkeithh Hormon Auxin, Gibberellin, Cytokinin hhmetabolische Energie
hhKeimkraft
2. Differenzierung 2. StrukturhhReifung, Verfeinerung hhdifferenzierte feine FormenhhOrdnung hhOrdnung, Calcium,
feste ZellwändehhBildung von sekundären Pflanzenstoffen hhFarbe, Aromen, Bitterkeit, Wachs,hhHormon Ethylen Vitamine, Phenolehhkatabolische Prozesse hhLagerbarkeithhBlütenknospenformung, Pollenbildung hhgenerative Organe, Samen
1+2 Integration 1+2 KohärenzhhGleichgewicht von Wachstum hhGleichgewicht von Vitalität und und Differenzierung StrukturhhIntegration, Durchdringung hhIntegration, Resistenz gegen
SelbstzersetzunghhSelbstregulation hhSelbstregulation, Elastizität,
Resistenz gegen Stress und Krankheit
hhBeziehung zur Art, Sorte, Entwicklungsphase,hhArt-typisch, Betriebs-typisch, usw. Jahreszeit, Boden, Betrieb-kontext, usw. hharomatische Geschmack UND
Festigkeit UND LagerbarkeithhFortpflanzungfähig

Parameters for apple quality and an outline for a new quality concept, part 1. 23
1 IntroductionThis chapter describes motivation, the FQH-framework, the global objective and method and the hypothesis of thenew quality concept.
1.1 Background: search for a quality concept for organic food
The continued development of sustainable agriculture will depend to an important degree on a high stable qualityof organic products. To reach this we need a sound operational definition of product quality. In the organic visionof product quality and nutritional value, product quality encompasses the concept vitality.But the concept ‘vitality’ is used in several ways by different authors, varying from extreme ‘growth full’ to ‘notgrowth full at all’ and emphases on keeping its own form and regulation processes. In practise it is a property thatis more expected than really measured. Although there are some people in the world trying to develop tools tomeasure aspects of this vitality.
In this project we introduce vitality just for the result of the growth process. Furthermore we introduce the qualityaspect structure for the result of the differentiation or ripening process, and the quality aspect coherence for theresult of the integration of growth and differentiation process. The processes growth, differentiation andintegration and the properties vitality, structure and coherence are covered by the term ‘vital quality’ as an overallconcept. With ‘vital quality’ we associate to the German ‘Vital Qualität’. In §1.2 and fig.12 this quality concept isfurther explained.
This quality concept is different from the conventional view. The quality aspects vitality, structure, and coherenceare inextricably linked with an organic philosophy based on the life processes, and the assumption that theprocesses during development of the crop are reflected in properties of the final product. The conventionalnutritional theory, on the other hand, tends to focus only on nutrients and external quality.
The organic concept of product quality requires further substantiation. At this moment, it is difficult tocommunicate the organic quality concept to the consumers because of lack of illustrative examples of thedifferent aspects of quality and the confusing use of the concept ‘vitality’.In this investigation, therefore, we further develop the organic vision and organic concept of quality, we developappropriate quality parameters for measuring the quality of products and develop the ‘vital quality’ concept in away that it will inform both grower and consumer.
Working hypothesisFrom a scientific viewpoint, the idea that vital quality, or more specific vitality, structure and coherence areimportant quality aspects of agricultural products and relevant for a healthy nutrition, only qualifies as a workinghypothesis. Although a number of positive indications exist to support this assumption, as yet there is not enoughsound evidence to substantiate it scientifically. The substantiation of the assumption is difficult. To avoid beingcaught up in a vicious circle that would prevent any further research into this matter, we have chosen to acceptthis working hypothesis as a starting point. Once sufficient progress has been made in defining the qualityaspects, we will go back and strive to substantiate the working hypothesis. Follow-up research will be necessarywith respect to the effect of high-quality foods on health.
Left-out aspects of qualitySome aspects of quality are left out in this concept; these important aspects must find a place in another context:1. The aspects that are not seen in the final product such as social-economic aspects, influence on environment,
use of energy, influence on personal development and enjoy of labour, fair earnings, communication betweenproducer and consumer.
2. The aspects of storage potential, transportability, suitability for processing.3. The residue aspects: microbiological, mycotoxins, residues of pesticides.

J. Bloksma, M. Northolt and M. Huber, Louis Bolk Institute, 200124
1.2 Life processes as the conceptual background
In organic agriculture the central paradigm is about life processes, as they continuously unroll in plants, animalsand man, in relationship with the surrounding soil, water and air, and the light and warmth being encompassed inthese. In organic agriculture the farmer doesn't manage minerals and nutrients, but he manages life processes ofliving organisms. The results of these life processes are expressed in the quality and quantity of the product that isgrown or raised. Quality and quantity, in their turn, have an effect on the life processes of man, the consumer ofthe product.
How can, in this way of thinking, the product quality be described, doing justice to the various processes in thelifecycle in living beings? Can product quality be described in such a way that a bridge can be built between lifeprocesses that lead to these products and life processes in man who is eating the product? The hypothesis in theorganic thinking is, that also the life processes in food products have to be ‘digested’ by the consuming organismand that in this active process of interaction the consumer’s health is stimulated.
Growth and differentiation as universal life processesSuch basic and universally found life processes - let it be somewhat adjusted to either the plant-, animal- orhuman-life situation - are processes of growth and of differentiation. They are expressed as well in the morphologyas in the physiology. We mention some examples in plant and humans to emphasise the universality of these twoprocesses (see Fig.12 for these processes in sheme) and to lay the basis for connecting plant product quality tohuman health.
Growth is associated with increase of mass and size.Differentiation is associated with formation of a complex morphology, blossoming, fruit forming, ripeningand synthesis of specific compounds.Integration of growth and differentiation is associated with an integrated structure, resistance to stress,diseases and disintegration.
Examples of growth and differentiation in human, plant and animalIn morphology growth brings an increase of living substance, material, whereas differentiation brings the formand structure of tissues and organs. In human physiology growth is found in anabolic processes, promoted forexample by corticosteroid hormones and differentiation is related to catabolic processes, of which adrenaline is anexample. In plant physiology primary metabolites (sugar, starch) are synthesised in growth processes andsecondary metabolites (vitamins, phenols) in differentiation processes.
In the human being these processes of growth and differentiation can be easily seen in the embryonicdevelopment. A hand is formed out of two principles: first a centrifugal process of growing and proliferation,producing a ‘bud’, in which then through a centripetal differentiating process form and structure of the fingers are‘modelled’ in. When these processes are in balance and well integrated the proper shape appears. Also in adultman a physiologically healthy situation exists by the balance and harmonious integration of growth anddifferentiation. In a disease like cancer growth of cells has become dominant and differentiation has decreased.Modern cancer therapies therefore try to improve differentiation processes (Leenstra 1996).
Also in plant growth and differentiation are found, but the intensity of either differs at different stages ofdevelopment (von Kraft 1995). In the vegetative phase of the young plant, growth predominates in the formationof green substance, mainly leaves. Later this leaf growing process is reduced (in fruit trees there is even a leaf-pause in the winter) and a generative phase of blooming, fruit- and seed forming starts with a drasticdifferentiation of form and substance and the appearance of colour, aroma and taste.
Integration as additional aspectTypical for the cultivated nutritional plants is the fact that these two phases are intensified and have becomeintermingled to a certain degree. Berendt (1983) studied this phenomenon in lettuce. In wild lettuce developmentstarts with a vegetative phase of sprouting and rosette building of small leaves, so the emphasis is on growthprocesses. This phase is followed by a differentiation phase with ‘shooting’, development of very fine flowers andseeds, and no leaves anymore, so the emphasis is on differentiation processes.

Parameters for apple quality and an outline for a new quality concept, part 1. 25
The head of cultivated lettuce has much more substantial leaves than its wild counterpart, so growth anddifferentiating processes both have increased and intermingled. At the moment of being ‘ready for harvest’ theseleaves are aromatic and have a typical ‘salad-like’ taste. These characteristics are a result of integration processesby cultivation (breeding and cultural practises).In apple, we see the same tendency, the small wild apple fruit has been cultivated into a substantial fruit, which inripening becomes juicy, coloured and tasteful. Also here growing and differentiating processes are intensified andintegrated by cultivation.
In this study we chose to work with a quality concept which is based on the intensity of growing processes, ofdifferentiating processes and of harmonious and species typical integration of these two life processes. They are allpart of the vital quality of a product. For a farmer who works with growing plants these concepts are recognisableand easily translated into fertilising, pruning, etc. For the consumer or trader, who buys a harvested product anddidn’t see the growing process, these concepts are less usable. So we need other concepts for the ‘ready product’the consumer buys: the result of the growing processes should be found in its vitality, the result of thedifferentiating processes in the refinement of the product, characterised by its fine structure (including smell,colour), while a harmonious integration of life processes should lead to coherence in the product in a contexttypical way. With ‘context’ we think of the typical way species, variety, soil, climate, season, development stage,farm and farmer will reflect.
Communication about qualitySo we will use the three quality concepts in process terms for communication with the grower. The grower shouldbe able to manage growth, differentiation and integration to reach a high vital quality.And for the final product and the communication with the consumer we use the three quality concepts in terms ofcondition: so products with a high vitality, structure and coherence are assumed to influence the well being in apositive way.We intend to link the conceptual quality aspects to the living forces and growing conditions known by the groweron the one hand and to the nutritional value, experienced by the trader and consumer on the other hand. Thisconcept also has the possibility to connect to the holistic health view of physicians and dieticians.This consumer’s health hypothesis should be tested later in other FQH-projects, but that is beyond the scope ofthis study. Here, the aim is to develop tools to describe and judge these quality-aspects.
The word ‘vitality’ can be confusingAs overall concept, in which both life processes are present, we chose for ‘vital quality’ (E), as it is alreadyinternationally used in ‘ Vital Qualität’(D) and ‘vitale kwaliteit’ (NL), also see figure12a,b,c in the summaries inthree languages.Realise there is a meaningful difference between this ‘vital quality’, as a balance between the two life processes(growth, differentiation) and their integration with optimal self-regulation properties and the ‘vitality’, a conceptonly at the level of growth, so especially fresh, green, growing, young and lively.In some groups (e.g. homeopathic healers) the word ‘ vitality’ is used for what we call here ‘coherence’ and inother groups (e.g. conventional agriculture) the word ‘ vitality’ is used for what we also call here ‘vitality’.
1.3 The apple as the first research crop
Several projects on apple growth and ripening processes in orchards are already being carried out by the LouisBolk Institute's fruit section. The polarity of ‘growth and ripening’ is a well-known and well-documentedphenomenon in the literature on conventional fruit growing, as are its effects on product quality. The decision tofocus initially on the apple in this project is thus prompted by the fact that this polarity is recognised as relevantto apples which thus provides us an opportunity to tie in with conventional views on quality. Later we will applythis concept to other crops, on which the growth and differentiating processes are more hidden.
Another reason to choose the apple as an example is the comparative study of organic and conventional grownGolden Delicious apples by FIBL to find relevant parameters for organic products (Weibel et al 2000). This studyshows a better quality for organic in many parameters (firmness, taste, phosphate, phenols, fibres and ‘vitality’ bypicture developing methods). And no difference in dry matter, Brix, acid, minerals (N, K, Mg, Ca), preference by

J. Bloksma, M. Northolt and M. Huber, Louis Bolk Institute, 200126
rats and self-disintegration test.In a study which compares whole production systems there is no answer which cultural practices cause the betterquality in organic systems (picked riper? no over-bearing trees? less nitrogen? more light exposed? bio-dynamicpreparations?). This question is the next step we want to take and leads to our current experimental design withseries of apples with one varying factor to teach us how these factors respond in the several parameters. Andfinally how to improve cultural practices by fruit growers to reach optimal quality.
1.4 Choice of quality parameters
Appropriate parameters are necessary to test the vitality, structure and coherence of agricultural products andfoods. Different types of quality parameters can be distinguished: sensory tests, component analyses and morecomplex or holistic parameters.In sensory tests the taste, aroma, consistency, colour and appearance are determined. Component analyses areused to determine the contents of components such as sugars, acids, minerals, vitamins, amino acids, carotenoidsand polyphenols.Holistic parameters are the copper chloride crystallisation, capillary pictures, biophotons, disintegration test,electro-chemical measurements and Bovis-value. An overview of holistic parameters is given by Meier-Ploeger andVogtmann (1988). In this report you find each parameter in separate chapters in §5-§17.
The results of the sensory tests, component analyses and the holistic parameters could be related to the growingconditions and ageing conditions. However, an evaluation of these parameters, measured separately or incombination, with respect to the quality aspects vitality, structure and coherence has never been made.To evaluate these parameters we need reference series of products grown under different, sometimes extremeconditions in order to influence their growth and ripening. In each series only one cultural factor is varied in steps.
1.5 Reference series
Before quality parameters can be developed, reference values have to be established first on the basis of referenceseries. Four reference series are prepared: ripening period, fruit-bearing, light conditions with and without bio-dynamic preparations, and finally different ageing by different shelf-lives.The apples were grown in an organic fruit orchard in series of 5 or 6 with a progressive intensity of the abovementioned conditions. Growing conditions in the orchard are documented. Apple samples have been taken fromthese series and all mentioned parameters are determined. The series will enable us to identify the appropriateparameters. The intention was to plan the middle intensity of the series treatments as ideal from a fruit grower’sperspective for trading.Apples thus produced should express characteristics in a manner that should enable us to measure extreme valuesof the parameters, and to relate them to the process of growth, differentiation (here ripening) and the integration.• Series A, 5 harvest times from unripe to over-ripe, cold stored until the last picking date.• Series B, 5 levels of fruit bearing from very low to trees laden heavily with fruit (this series is also part of a
running project on optimisation of fruit yield and quality).• Series C, 3 levels of light (shady, moderate, full sunlight) both with and without bio-dynamic field
preparations, thus a total of 2x3=6 treatments.• Series D, 4 periods of ‘on the shelf’ after a 3 month period in cold storage. Apples from the 4th harvest date
from series A are used for these D-series. D1 is the same as A4, and D2 to D5 have an increased shelf life.Between A4=D1 and D2 the influence of three months of cold storage is seen.
1.6 Research questions
The underlying questions were:1. Is the intensity of the growth processes, the ripening processes and the integration of these in the reference
series, reflected in the following parameters: fruit size, colour, shine on skin, firmness, sugar, starch, acid,vitamin C, minerals, amino-acids, phenolic compounds, taste, copper chloride crystallisation, capillary pictures,

Parameters for apple quality and an outline for a new quality concept, part 1. 27
bio-photons, electrochemical measurements and self-disintegration? If so, in which degree? Which parametersare so similar that it makes the other redundant? Is it possible to interpret the cheap component analyses in amore holistic view?
2. Can the measured values be used for testing vital quality? Can working hypotheses be set up on the basis ofthis information regarding consequences for human health and growing methods?
1.7 Co-operationIn contacts with the organic movement an urgent request is heard also to include research question no 2,concerning the quality concept, into this project. The aim to develop a thorough quality concept is ambitious andis best served by a good co-operation between (inter)-national experts on different parameters. So the Louis BolkInstitute invited several colleague-researchers, to participate in this project with their specific techniques and toparticipate in the discussion on understanding and integrating the different parameters in the quality concept.
Participants:• Louis Bolk Institute at Driebergen (NL), J. Bloksma (M.Sc. biology), M.A.S. Huber (M.D. physician), Dr. M.
Northolt (food science), P.J. Jansonius (M.Sc. agriculture), M. Matze (M.Sc. nutrition), H.J.T.M. Hospers (M.Sc.biology) and A.M. de Weerd: co-ordination, quality concept, supporting the apple growing, description oforchard and crop, leaf series, external quality, Brix analysis, vitamin C, dry matter, disintegration test, sensorytest, copper chloride crystallisations, capillary pictures.
• Meluna Bio-photon Research at Geldermalsen (NL), Dr. R. van Wijk: measurements of bio-photons i.c.w. A.Popp and quality concept.
• Kwalis Qualitätsforschung Fulda Gmbh (D), Dr. J. Strube en Dr. P. Stolz: measurements of bio-photons withcoloured light (modification of Popp’s method), amino-acid analyses and quality concept.
• Arbeitskreis Qualität der BTQ (Gesellschaft für Boden, Technik Qualität) Kirchberg (D), Dipl.Ing.agr. H.Heilmann: electrochemical measurements and quality concept.
• University of Copenhagen/Hertha (DK), J.O. Andersen: quality concept.• Forschungs Institut für Biologisch Landbau at Frick (CH) Dr. F. Weibel: quality concept and experienced in
alternative quality research in apple.• Inst. for biodynamic Research Darmstadt (D), I. Hagel: quality concept.
Further collaboration with:• Orchard Ter Linde at Oost Kapelle (NL): growing and storing the apples.• Laboratory of Research Station for Fruit Growing (PPO) at Randwijk (NL): measurements of colour, firmness,
Brix, starch, acid.• Laboratory for Soil, Crop and Environment, Zeeuws Vlaanderen (NL): analyses of dry matter and minerals.• TU-München, Fachgebiet Obstbau (D): Prof. Dr. D. Treutter: analyses of phenolic compounds.• Ruth Mandera (expert capillary pictures).• Statistics: M. Engelmoer (M.Sc. biology)• Text-work: I. Schwagerman.• English language: P. Doesburg (LBI) and German language: Maike Damhuis.
1.8 FundingThis project is financed by• the Louis Bolk Institute (NL),• Meluna Bio-photons (NL)• Kwalis (D),• Stichting Triodos Fonds (NL),• Stichting Klaverblad (NL),• the Software Stiftung (D)• the Zukunftsstiftung Landwirtschaft (D).
We thank them all.

J. Bloksma, M. Northolt and M. Huber, Louis Bolk Institute, 200128
2 Introduction on apple growingThis chapter is meant for those who are not familiar with the growth and ripening processes in the apple.
2.1 Growth and ripening processes in apple
Chapter 2.1 is intended for people who are not familiar with the crop apple. Some basic processes in growth,ripening and the influence of picking date, crop load, light exposure and maturing on fruit quality are summarisedfrom literature and practise.
2.1.1 Processes of mass formation or ‘growth’Growth processes are associated with the growing volume of mass; the tree is spreading more and more into thesurrounding area. In varying periods of the season apple trees show:• length and succulent growth of roots (Feb.-May)• length growth of twigs and spreading of leaves (May-Aug)• succulent growth of the tree trunk (May-Aug)• unfolding clusters and flowers on last year’s reserves (End of April)• fruit setting (May)• development of fruit and fruit size (first by cell division; later cell enlargement) (May-Sept)• filling of flower buds, bark and wood with reserves (aminoacids, sugars, starch) for next year (Aug-Nov)The growth processes are guided by plant hormones like auxin, gibberellin and cytokinin and are favoured bywater and nutrients taken up from the earth. The fruit grower stimulates these processes by watering, fertilisation,and growth stimulating pruning or reduces these processes by root pruning, controlled water stress etc.
2.1.2 Processes of differentiating or ripeningDifferentiation processes are associated with a complex morphology and physiology, fruit and seed formation,ripening and syntheses of specific compounds. In varying periods of the season apple trees show:• pollination (April-May)• flower bud initiation (May-June for flowering next year)• ceasing shoot growth and lignification (=forming wood) (June-Sept)• ripening of fruit: getting colour (red blush and ground colour from green to yellow), forming flavour (aroma,
sugars) (Aug-Oct)• developing seeds (May-Oct)• ripening of shoots and leaves: colouring leaves and withdrawing compounds from leaves into bark, buds and
wood for next year reserve.• more intensive respiration in the fruit around ripeness (the moment of ‘climacterium’).• syntheses of secondary metabolites like wax on the skin, phenolic compounds, vitamins, etc. (June-Oct)The differentiating processes are guided by plant hormones as absisin acid and ethylene and are favoured bywarmth and light. The fruit grower stimulates these processes by optimal light entrance into the tree, summerpruning etc.
To get an optimal differentiating process first some mass must be formed. If not you will see for example‘emergency flowers’, no successful pollination or fruit without aroma because of lack of assimilates.
2.1.3 Vital quality as harmonious integration of growth and ripening
Apple as a bi-annual cropDuring summer time the apple tree is working at three stages:1. growth of roots, shoots and leaves and production of assimilates for this year;

Parameters for apple quality and an outline for a new quality concept, part 1. 29
2. growth and ripening of the apples for harvest this year;3. initiation and filling of buds for next year with reserves.An apple tree is botanically seen as a perennial crop. But you also can look at an apple twig as a biannual crop:bud formation in the first season (comparable with released seed in the soil) with a pause in winter. In the secondseason: flowering, fruiting, shooting and bud formation (comparable with an annual crop up to seed formation).This second view makes it easier to understand the various simultaneous processes and how to support the cropwith cultural measurements. It is like singing a canon with three voices.
Alternate bearingTypical for some apple varieties (e.g. Elstar, Boskoop) is the habit of alternate bearing. In a year with high bearing,only few new buds for next year are formed and in a year with low bearing (by spring frost e.g.) too many buds areformed and the tree ‘over-flowers’ itself and looses energy for growing. So without fruit growers measures the treejumps from one extreme into the opposite extreme next year. For a wild apple tree this habit is not a problem.Seen over many years the tree has enough chances to grow and spread seeds into the world and maintain itsexistence.But for an agricultural crop with an aim at high food quality and sufficient production this is not enough. Thisalternation from one extreme into the other extreme brings less fruit quality and less mean production over theyears. So the aim for fruit growers is to support and balance those processes by cultural measures like grafting onlow or high growing rootstocks, pruning, root-pruning, thinning, training, fertilising, watering, trunk notching, etc.Fruit growers are used to speak about ‘growth and ripening’, ‘growth and production’ or ‘vegetative andgenerative’ referring to this polarity.
Integration for fruit qualityIn fruit growing literature many examples are known about the benefits of the balance between growth and yield.A harmonious grown tree is more capable to regulate itself. An irregularly grown tree reacts more to water stress.And an irregularly grown apple tree produces apples that store shorter. Table 1 shows some quality aspects inconnection with bearing, summarised from literature.
Table 1: Characteristics of under-bearing, optimal bearing and over-bearing.
low bearing optimal bearing high bearingmany leaves per fruit 35-50 leaves per fruit few leaves per fruit
low photosynthesis activityper leaf
Moderate photosynthesis activityper leaf
high photosynthesis activityper leaf
high sugar and acidthus much taste
fresh taste low sugar, low acid,thus less taste
big sized fruit Medium sized fruit small sized fruitearly ripening Ripening in time later ripening
Red blush, yellow ground colour Moderate colour less blush, green ground colourFirm firm less firm
Physiological storage diseases:Bitter pit, internal brown, rot
Maximal storage quality physiological storage diseases
Optimum between quantity and qualityFruit growers have to choose the optimal position between yield and fruit quality. Some decades ago inconventional apple growing we saw quantity was more important than quality. On average high yielding varietieswith less aroma like Golden and Red Delicious were grown and bought. High yield was achieved by optimalgrowing conditions and chemical help (drip irrigation with dissolved nutrients, artificial hormones for growth andyield regulation, pesticides) at the cost of fruit taste. From experiments with increasing levels of nitrogen it isknown that the optimum for different properties is found at different levels of nitrogen. Increasing nitrogen willfirst result in an optimum for skin colour, then for taste and storage potential, then for texture and finally for yield(Stoll 1997).But nowadays in an overproducing market for apples, the call for high quality, particularly taste and colour isheard. The high producing varieties are making place for varieties with good taste and colour like Elstar and theJonagold mutant with improved colour. For Elstar the advised target yield has gone down from 60 tons/ha of
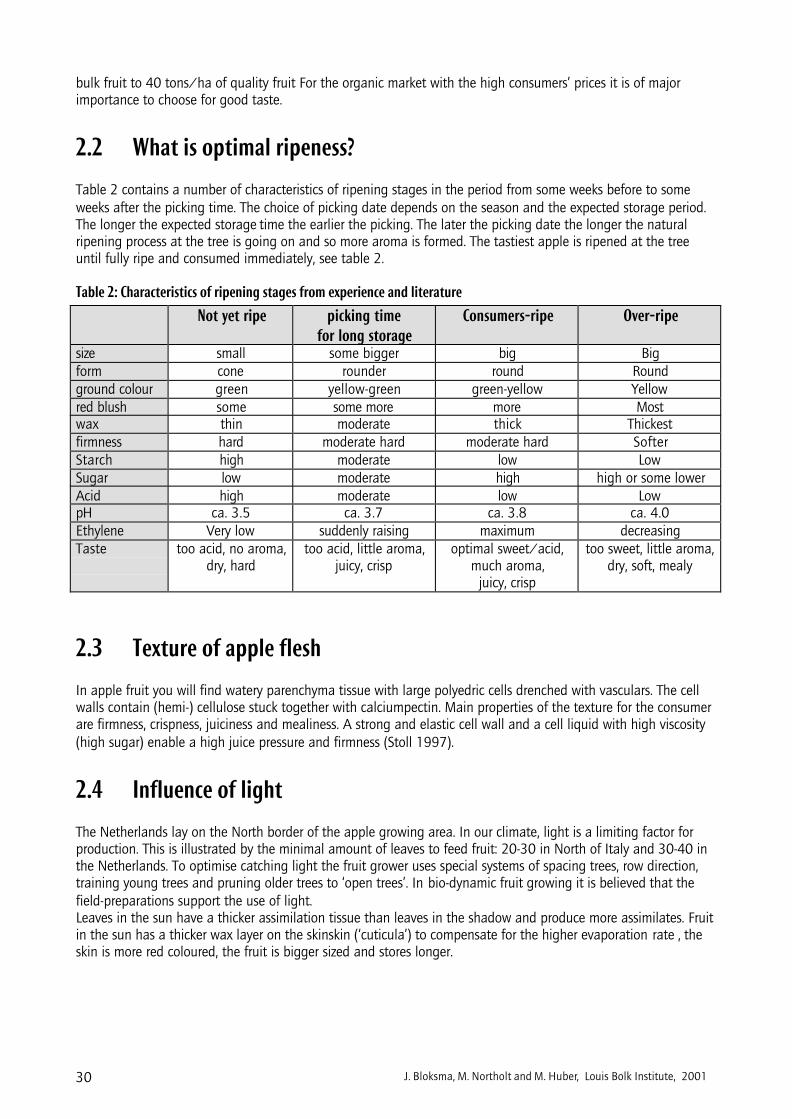
J. Bloksma, M. Northolt and M. Huber, Louis Bolk Institute, 200130
bulk fruit to 40 tons/ha of quality fruit For the organic market with the high consumers’ prices it is of majorimportance to choose for good taste.
2.2 What is optimal ripeness?
Table 2 contains a number of characteristics of ripening stages in the period from some weeks before to someweeks after the picking time. The choice of picking date depends on the season and the expected storage period.The longer the expected storage time the earlier the picking. The later the picking date the longer the naturalripening process at the tree is going on and so more aroma is formed. The tastiest apple is ripened at the treeuntil fully ripe and consumed immediately, see table 2.
Table 2: Characteristics of ripening stages from experience and literature
Not yet ripe picking timefor long storage
Consumers-ripe Over-ripe
size small some bigger big Bigform cone rounder round Roundground colour green yellow-green green-yellow Yellowred blush some some more more Mostwax thin moderate thick Thickestfirmness hard moderate hard moderate hard SofterStarch high moderate low LowSugar low moderate high high or some lowerAcid high moderate low LowpH ca. 3.5 ca. 3.7 ca. 3.8 ca. 4.0Ethylene Very low suddenly raising maximum decreasingTaste too acid, no aroma,
dry, hardtoo acid, little aroma,
juicy, crispoptimal sweet/acid,
much aroma,juicy, crisp
too sweet, little aroma,dry, soft, mealy
2.3 Texture of apple flesh
In apple fruit you will find watery parenchyma tissue with large polyedric cells drenched with vasculars. The cellwalls contain (hemi-) cellulose stuck together with calciumpectin. Main properties of the texture for the consumerare firmness, crispness, juiciness and mealiness. A strong and elastic cell wall and a cell liquid with high viscosity(high sugar) enable a high juice pressure and firmness (Stoll 1997).
2.4 Influence of light
The Netherlands lay on the North border of the apple growing area. In our climate, light is a limiting factor forproduction. This is illustrated by the minimal amount of leaves to feed fruit: 20-30 in North of Italy and 30-40 inthe Netherlands. To optimise catching light the fruit grower uses special systems of spacing trees, row direction,training young trees and pruning older trees to ‘open trees’. In bio-dynamic fruit growing it is believed that thefield-preparations support the use of light.Leaves in the sun have a thicker assimilation tissue than leaves in the shadow and produce more assimilates. Fruitin the sun has a thicker wax layer on the skinskin (‘cuticula’) to compensate for the higher evaporation rate , theskin is more red coloured, the fruit is bigger sized and stores longer.

Parameters for apple quality and an outline for a new quality concept, part 1. 31
2.5 Alteration and senescence
Maturation is the natural process after ripening. The fruit has to disintegrate to release its seeds. The membranestructure of the cells looses its cohesion, tissues get soft and turn brown, cells slide from each other and theconsumer says the apple is getting ‘mealy’. The electric conductance of the tissue increases. The process ofmaturing is slowed down by the modern storage techniques but continues during shelf life (Stoll 1997).
2.6 Polarity between seeds and fruit flesh
After being young, small and extremely firm the seeds and flesh are developing into opposite characteristics:The flesh gets softer, juicy, aromatic, white, round, open to the surrounding, produces ethylene, easy todisintegrate and suitable for human nutrition. The seeds, on the other hand, get hard, dry, brown, pointed,sustainable, closed, produce gibberellins and are intended for reproduction. Table 3 shows differences in mineralcontent between flesh and seeds, seed data is from former research on another apple variety.
Table 3: Nutrients in flesh and seeds in the apple variety Red Boskoop (LBI 1999)N P K Mg Ca% dry matterin mg/100 gram fresh weigh
emphasis on
flesh 16 45 12 125 6 5 carbohydratesseeds 80 3000 415 600 210 16 nitrogen

J. Bloksma, M. Northolt and M. Huber, Louis Bolk Institute, 200132
3 The reference series and experimental designThis chapter describes the circumstances of our experimental results.
3.1 Circumstances in the orchard
Soil and climateOrchard Ter Linde is situated in the south-western part of the Netherlands, in a sunny mild sea climate with aslight salty spray by sea wind. The soil is limy humus sea loam on limy sand with trickle irrigation. This soil hasbeen bio-dynamically cultivated for more than seventy years.
The orchardThe orchard is 10 years old, on dwarf rootstock M9, 2460 trees/ha with mowed grass in the tramline and most ofthe year a clean cultivated tree strip. The grower is able to prune to open trees with a quiet top. Sulphur and asmall amount of lime sulphur are applied for scab control and some microbiological treatments against insects.Composted cow manure with Bd-compost-preparations is used every three years. In the other years, as this year,dry chicken manure pellets are used for additional fertilisation. For this experiment we used some rows withoutfertilisation. The differences in % nitrogen in leaves of fertilised and none-fertilised were not noticeable: andaveraged 2,0% N in August.This orchard is known for low nitrogen levels in soil and leaves and good fruit quality. The bearing differs fromyear to year depending on flowering conditions from 15 (spring frost) to 150 (too little fruit thinning) fruit pertree.
The variety ElstarThe apple variety is Elstar, strain Elshof, pollinated by Alkmene. Elstar is one of the best tasting varieties inHolland; also under sub-optimal conditions you will have good fruit quality, especially colour and taste wise. Thefruit is round, size small to moderate. The skin is green-yellow with a red shade and quit red, which is typical forthe Elshof strain. Exposure to light is of great importance to colour the skinskin. For this variety exposure to light isof great importance to colour the blush. Among apples the apple variety Elstar has the habit of alternate bearingand of unequal ripening. Fruit growers usually pick Elstar in two or three rounds.
3.2 The season 2000
In the former year (1999) the roots were pruned after a frost year with low bearing and too much growth. In theseason 2000 the balance between growth and bearing returned. The pollination conditions were good, the fruitset was good and needed moderate hand thinning. The optimal yield for this orchard is estimated at a 100 fruitper tree for a regular bearing every year. Rain fell nicely spread throughout this summer season, so soilmineralisation was good and twig and fruit grew continuously. In general, this leads to good storage quality andhigh bearing capacity. Also the heavy bearing trees, that have no twig growth in most other years, now have amoderate growth. This year the opposition between growth and yield is not as pronounced as we are used to. Thisyear had an average number of sun hours and was very late with cold nights which colour the fruit red. Theautumn was relatively warm.There was only a small amount of fruit with insect damage this year. For measuring the quality we only usedsound fruit.
3.3 Description of the reference series
The aim was to create series with only one varying factor increasing in small steps and standardised for all otherinfluences. Due to our knowledge about apple quality and how it depends on the place in the tree, exposure, size,fertilisation, etc, we knew what had to be standardised. Because of adding series C later, we had to use morefertilised rows for these series. In table 4 we summarised the main factors and how we succeeded in standardising.

Parameters for apple quality and an outline for a new quality concept, part 1. 33
Table 4: Overview of the varying and constant factors in the series:Series Nr. of
treat-ments
fertilising exposureto the sun
Bd-fieldprepara-
tions
yield of fruitper tree
growth pickingdate
Days of cold(4°C)
Storage
fruit size ofsamplein mm
A ripening 5 low Full yes 130 moderate 1, 12, 21,29 Sep;9 Oct
20(A1, A2,A3), 12,0(A5).
70-75 to 75-85
B bearing 5 low Full yes 35(B1); 75;100; 125;140(B5)
strong toweak
22 Sep 4 75-85(1=80-90)
3 medium no(1);half;
full (3)
yes 130 moderate 18 Sep 1 75-85C light andpreparations
3 medium no (4);half;
full (6)
no 120 slightlymore thanmoderate
18 Sep 1 75-85
1 + 4 low Full yes 130 moderate 29 Sep 12(D1),101(D2),98(D3),94(D4),90(D5),
75-85D shelf life
D1 (=D4): short cold storage of 7 days, at 4°C.D2 – D5: three months of cold storage at 4°C and respectively 1, 4, 8 and 12 days, at 16 °C.
We checked the series with a couple of conventional parameters (Streif-index, sugar, colour, firmness) that aredescribed well in literature for ripening, bearing, light and storage life. Although we tried, it is impossible to varyonly one factor. Several factors are connected to each other in apple growth, for example low bearing is correlatedwith big fruit. When we tried to standardise the other factors we realised we weren’t taking a representativesample of the whole tree which had consequences for the interpretations. Below you will find the description andthe choices of the four series from this point of view.
3.3.1 Series A: ripeningTo get an idea of the characteristics of ripening expressed in different parameters, we made a series with differentpicking dates from unripe to over-ripe, with about a one-week interval. We chose date 2 as optimal for longstorage and date 3 as optimal for short storage. We had a row of 10 trees in the orchard from which we pickedevery week a sample of 120 apples from the sun side and with a 75-85 mm size.
Early picked means stored longerNext we had the methodological choice between measuring every week one fresh sample or to store the samplesuntil the last one was picked and measure five samples at the same time and conditions. For practical reasons asmany laboratories are involved and to have a better opportunity to compare, we chose for the second option. Thatmeans we have a ripening series with different picking dates and different storage periods together. So earlypicked means stored longer and the last picking is not stored at all. This combination might have importantconsequences.After picking the first unripe sample, we found the quality of very unripe: small size, very firm, hardly any red skin,low in starch and an astringent taste. During the five weeks of storage the ripening process continues partially.Some ripening processes go on during storage: converting starch into sugar. Other ripening processes only occuron the tree: increase in fruit size, increase in red skin, forming skin wax, increase in aroma. After waiting until thefive samples were picked, we only saw a slight difference in starch between the five ripeness samples and also intaste we found hardly any differences in astringency. Accidentally no. 1 and 2 were not cooled until no. 3 waspicked. In the usual ripening process, firmness decreases. Also in storage the firmness will decrease. In series A theoverall effect of a later picking date and shorter storage period on firmness is more or less constant.

J. Bloksma, M. Northolt and M. Huber, Louis Bolk Institute, 200134
Other varying parametersIn series A, you will also find an increasing fruit size. In the last five weeks of the ripening process between thefirst picking and the last picking the apples grew about 15 mm in diameter. We tried to standardise fruit size, butfor the first and the last picking date this was not possible and the compromise is an average increase of 8 mmbetween the smallest and the biggest standardised sample.We expected date 5 to be over-ripe, but in the sensory test those apples were still good. See series D for real over-ripe apples. The LBI-samples are checked for ripeness with the Lugol test and the extremes within one sample weredeleted. Series A was not as extreme as we hoped for.
3.3.2 Series B: bearingThe trees for these series were fruit thinned in two steps in June and July. Those trees were part of a largerexperiment with many independent repetitions in this orchard looking for the optimal bearing capacity. In fruitgrowing it is known that high bearing trees in a particular year initiate less flower buds for the next year and theother way around. For the fruit grower an equal bearing from year to year will give more production in the longterm, less work and better fruit quality. The aim is to find out the maximal bearing for a regular every year yield ofgood quality and where the optimum in quality lays.
2000 was a year with high bearing capacity and good fruit qualityWe consider bearing level 3 as the best in this bio-dynamic orchard with skilled labourers and bearing 4 as moreusual for a conventional orchard. Around these yields we chose high and low extremes. We planned an extreme of175 fruit/tree but by natural dropping the highest bearing we could obtain was 140 fruit/tree. The lowestbearing was 35 fruit/tree by severe thinning. Finally we used the bearings 35, 75, 100, 125, 140 fruit/tree whichcorresponds with a yield of 14, 30, 40, 50, 56 ton/ha. This year had extremely good production conditions.Therefore, the extremes in bearing did not show the known effects in fruit quality very clearly. The good conditionsalso lead to less severe fruit growth retardation than usually. The expected strong polarity between growth andyield is not reached in these series. See table 5 for a summary of varying parameters.
The good year 2000 results in enough flower bud initiation for the next year 2001 except in trees with thehighest bearing. After spring frost in 2001 the flowering was overall too low, but anyway it was clear that anincreased bearing of fruit in 2000 showed a decrease in flower-index in 2001: 3,7; 1,9; 1,6; 1,0; 0,5.
The flower-index has a range from 1-10; from no flower up to every cluster with flowers.
Other varying parametersThis increase in fruit per tree corresponds with a decrease of numbers of leaves per fruit that assimilate andevaporate from roughly 130, 55, 42, 35 to 30. We had 10 trees of each bearing level in the orchard.In series B with the increased bearing and a decrease in fruit size we tried to standardise fruit size. This waspossible for bearing level 2, 3, 4, 5 but at the extreme low bearing level 1, the fruit size was too big for storagequality.In these series we counted seeds. The amount of seed per apple varied per fruit from 1 to 8 with an average of 3,7and no significant difference by bearing. During picking the ripeness is very nicely standardised and uniform, seeresults of Streif-index.
Table 5: bearing seriescode fruit/tree
2000yield in tons/ha2000
twig growth2000
leaves/fruit2000
flower-index2001
B1 35 14 moderate-severe 130 3,7B2 75 30 moderate-severe 55 1,9B3 100 40 moderate 42 1,6B4 125 50 weak-moderate 35 1,0B5 140 56 weak-moderate 30 0,5

Parameters for apple quality and an outline for a new quality concept, part 1. 35
3.3.3 Series C: light and bio-dynamic field preparationsFor these series we had to use rows in the orchard that were fertilised a slightly more than rows in the other series,but no significant higher % nitrogen appeared in leaves or fruit. The reason for using a fertilised row is a practicalreason because we needed more trees than planned to obtain enough fruit growing in the shadow.
Bio-dynamic field preparationsThis year the bio-dynamic field preparations were used only in two thirds of the 3 ha parcel: horn manurepreparation on the 14th and 26th of April and horn silica preparation on the 30th of June and the 11th ofAugust. Although we looked carefully for comparable trees in the orchard, we noticed during the year somedifferences between the part of the orchard with, and the part without preparations. This is probably caused by adifference in thinning. The trees without preparations had slightly less fruit per tree, more growth and slightlybigger fruit with less blush. The leaf analyses showed slightly less nitrogen (1,9% and 2,0%, but not significant).So the trees without preparations seem a little more vegetative. This might also be due to tree variation.In the open trees with preparations there was not enough fruit growing in the shadow. So, some fruit without thestandardised quality was added to the sample.
We subjectively checked in the field if and where the vitality of the soil (with the Bovis intuitive method, see§17) increased. At three different places this was found 2 rows wider than the border treated with thepreparations and parallel to the border. This indicates that the preparations have some effect. The distancebetween application border and effect border of about 6 meters is more often found in experiments withpreparations.
No conclusions about the preparations could be drawn due to lack of independent repetitions in the field. Wehope to obtain the independent repetitions in successive years.
Sun-shadowFor these series we had two rows with 15 trees each of moderate size that were thinned for this experiment in aspecial way to get more shaded grown fruit than normally. The picker has standardised for size very well (see fruitsize). We see a correlation between less sun and later or less ripeness (more starch and less sugar, so a higherStreif index).Realise, in all trees, also where shaded grown fruit is picked, the outer side of the tree is exposed to the sun andthe leaves have been assimilating in the sun. So, only the position of the fruit in the tree is in full sun, half sun orin the shadow.
3.3.4 Series D: shelf-lifeFruit for this series is collected from series A (picking date 4) and is stored in mechanical storage for three monthsat 4°C and high humidity. At the end of December every 4 days part of this fruit is taken out of the storage andkept at room conditions (16°C and varying humidity). So at the second week of January we collected a series ofapples with different shelf lives. D1=A4 is used as short stored reference and is already measured in October.D2, D3, D4, D5 are all stored for about 3 months and have an increased shelf-life. See table 4 for the summary.To get a series with very altered fruit, we chose a very late picking time for mechanical storage purpose. Despitethis we got no bad quality like mealy tasting, soft and rot. A compliment for the orchard, but a pity for this project.After storage the fruit, with little rot spots was not tested.

J. Bloksma, M. Northolt and M. Huber, Louis Bolk Institute, 200136
4 MethodThis chapter describes the working sequence, the methodological steps, experimental design, sampling method,statistics and the structure of the report.
4.1 Working sequence
In §1.1 already the risk is mentioned of reasoning in circles. We are searching for a new concept with newparameters. We cannot avoid this risk but when describing our line of thought as clear as possible we can beaddressed for thinking faults and wrong assumptions. This is the only way to introduce new concepts and newparameters. So we cannot speak about a traditional proof but only check for consistency and suitability of ahypothesis in different situations and products. Here we try to do the first check on experimentally grown series ofapples and refer to the methodical steps as described in Bouter/van Dongen (1995) and in Houten/Diegem(1990).
Our method and working order was:1. We had a preliminary hypothesis about a new quality concept being more suitable for organic products,
introduced in §1.1 in terms of what we consider as the basic life processes in organisms: ‘growth’,‘differentiation’ and ‘integration’.
2. We chose 5 experimental series (ripening, bearing, light exposure, bio-dynamic preparations, ageing) becausein every series we expected one or more aspects of the life processes will vary.. This is our ‘golden standard’ forthe criterion-validation.
3. To make this quality hypothesis operational we selected conventional and experimental parameters that maybe useful to the concept. In each chapter (§5-§17) concerning a single parameter this assumption isexplained in the subject heading ‘background’, the method is described and the results of our measurementsare first discussed as facts and if relevant, compared with earlier experience in literature. After considering thecorrelations in §18, the headlines in the series in §19 and the life processes in §20, we discussed eachparameter in relation to the series and the hypothetical concept and added this to each parameter chapter.
4. We checked the sub-sample similarity for some parameters in more than one sub-sample (for practical reasonswe had to work with different sub-samples in the different laboratories) in §18.2 and drew conclusions aboutthe similarity.
5. We compared the parameters with each other in §18.3 for relevant correlations and costs. This helped toclassify parameters in §20 and check the several domains on internal consistency. After a number of similarprojects we can choose the most promising and least costly parameters for quality control.
6. We summarised the results of the parameters in each series separately as facts and next arose a whole imagearound the changing factor(s) per series in §19. First we compared this with our expectation based on theresults of the conventional parameters and next checked the consistency and expectation of the results of theexperimental parameters.
7. We did this the other way around in §20 and summarised the three life processes in relation to the differentparameters to double check on consistency of the traditional parameters and to find the relationship betweenthe experimental parameters based on correlations in §18 (face-validity).
8. We checked the suitability of the concept in discussions with fruit growers and consumers and this lead to thedouble and connected lines in the vital quality concept (first steps according to content-validity). One aspectof suitability is the communication with growers in terms of processes they are used to managing in their fruitgrowing practice (growth, differentiation and integration). The other aspect of suitability is thecommunication with the consumer about properties of the product, making clear that a vital quality applediffers from a ‘bag of water with nutrients and flavours’. We found the quality concept sufficient suitable topresent in this report, but are still searching to find a better proof for the process of integration. More detailsare discussed in the following chapters.

Parameters for apple quality and an outline for a new quality concept, part 1. 37
4.2 Experimental design, sampling and analyses
We had no independent repetitions of treatments in the orchard. We collected one sample of 120 apples from 10to 20 trees per treatment and divided it into equal sub-samples judged by eye. To reduce natural variation westandardised as much as possible (fruit size, bearing, exposure to the sun, medium or high position in the tree).Because we work with series we get certainty from a consequent line in the successive treatments instead of theindependent repetitions.
A project with many partners at different places in the Netherlands and Germany has the disadvantage of workingwith different sub-samples on different dates and long transport. The costs of analyses do not permit as manyrepetitions as we wished.
The apples mature slowly in the fridge (4-6° C) and faster outside. When we compare the samples of differentanalyses we must realise this influence.See table 5 for which parameters share the same sub-sample and for the out-of-the-fridge-period of the samples.
All measurements and judgements are done with blind samples. This is especially important for the parameterswhere a subjective part is included as in crystallisation and Bovis.
4.3 Statistical analyses
The statistical analyses were performed with the statistical package SPSS version 8 (Norušis 1998).
Analysis of varianceAnalysis of variance was used to test the differences between the various treatments, since nearly always normallydistributed data was collected. At first it was tested whether the variances from the different samples could beconsidered as homogeneous by using the Levene test. When such was the case, test statistics were based upon a t-test calculating the square root of the smallest variation between a sample pair. When the variances had to beconsidered as unequal, the pair wise comparisons were based upon the calculation of Tamhane’s T2-statistic,which is a conservative test based upon a t-test.Differences between means were made visible with ‘a’, ‘b’, etc in the tables. When no differences at the 95% levelwere found, the same letter was used for all means of one parameter in all series together. In the figures ofparameters with independent repetitions we used error-bars for the standard error of the mean (sem).
CorrelationsThe mean values of the different variables per parameter were also linear related to each other. Pearson’s r2 wascalculated in annex 14.2 for correlation with the confidence at p<0,05 and p<0,01. In annex 14.3 somemeaningful correlations are shown in several figures.
It was not possible to perform a cluster analysis or an analysis of covariance, since there were hardly anyparameters which were measured in all series. Some parameters were not determined when biologically not ofinterest.

J. Bloksma, M. Northolt and M. Huber, Louis Bolk Institute, 200138
Table 6: Parameters, institutes, sub-samples and different period out of the fridge
date of analysis hours outside the fridgebetween orchard-storage
and analysing
Parameter Institute Independent
samples
fruit persample
Dupli-catesper
analysisA B C D A B C D
Leaf series LBI 4 - - - 21Sep - - - - - -
Exterior LBI 1 >100 - 10 Oct 26 Sep 19 Sep 9 Jan 8 10 8 10
Brix, acid PPO 1 25 2 13 Oct 29 Sep 22 Sep 12 Jan 36 36 48 36
Firmness, colour,starch
PPO 25 1 1 13 Oct 29 Sep 22 Sep 12 Jan 36 36 48 36
Minerals ZVl 1 25 2 -- 5 Oct 5 Oct - 48 48 60 -
Vitamin C LBI 1 8 2 11 Oct 2 Nov - 10 Jan 24 24 - 24
Brix, pH LBI 1 8 1 11 Oct 27 Sep 20 Sep 10 Jan 24 24 24 24
Self-disintegration
LBI 8 1 1 11 Oct 27 Sep 20 Sep 10 Jan 24 24 24 24
Dry matter LBI 8 1 1 11 Oct 27 Sep 20 Sep 10 Jan 24 24 24 24
Sensory test LBI 1 8 7 11 Oct 27 Sep 20 Sep 10 Jan 24 24 24 24
Crystallisation LBI 1 5-8 4 11 Oct 28 Sep 20 Sep 10 Jan 24 12 24 24
Capillarypictures
LBI 1 5-8 1 11 Oct 28 Sep 20 Sep 10 Jan 24 12 24 24
Delayedluminescence
Meluna 10 1 2 11,12,13 Oct
27,28,29 Sep
20,21,22 Sep
10,11,12 Jan
24 24 24 24
Spectral rangeluminescence
Kwalis 12 1 4 12-14Oct
14-19Oct
60 60
Amino-acids Kwalis 1 5 4 17 Oct 19 Oct 60 60
Phenoliccompounds
München 1 10 1 driedlater
- driedlater
- 60 100?
Elctrochemical Heil-mann
1 10 1 14 Oct 29 Sep 23 Sep 13 Jan 48 48 60? 75?
Bovis LBI 1 10-25 4 10 Oct 26 Sep 19 Sep 9 Jan 8 10 8 10
Parameters for the same sub-samples share a double lined compartment

Parameters for apple quality and an outline for a new quality concept, part 1. 39
5 Leaf series and twig growthMaking leaf series is a method by LBI to visualise growth and regularity in vegetative development of the appletwig.
BackgroundMaking leaf series as an image of shoot growth is a method developed at Louis Bolk Institute (Bloksma andJansonius, 2000). The successive leaves of one shoot are viewed as a biography of the growing season. Shootlength is smaller when a lot of fruit competes for growth. Leaf size and internodes are smaller when growth istemporarily limited by, for example, drought.
MethodWe labelled 4 standardised shoots (1 fruit/shoot, 45° up from side branch) per treatment and wrote down someshoot top dates in the growing season. We did not choose an average but a characteristic shoot for making adrawing. This year was very unusual in the way that the growth was less dependant from bearing than it mostly is.So we exaggerated a little this year to show this rule in fruit growing.
Results
B: BearingWe only picked twigs with leaves in series B because bearing usually has a large influence on growth.In annex 1 you see the drawn leaf series and symbols for bearing and the proportion leaf to fruit as is presented intable 5.
In the season 2000 the growing conditions were so well that also the heavy bearing trees produced some twiggrowth. We chose twigs characterising something between the main rule and this years conditions. More fruit pertree leads to smaller leaves and earlier stop of growth and less flower bud initiation for the next season.
DiscussionRelations between firmness and other parametersThe main consequence of the ratio leaf/fruit, as is indicated in the figure, is the supply of assimilates for the fruit.You will find this consequence in the decreasing sugar content (annex 3.3).
Relations with growth, differentiation and integrationGrowth is reflected in leaf size and irregular leaf shape, in twig length and in internode length. Differentiation isfound in regular shape and in details as fine leaf serrations. Integration is found in regularity in the leaf formsequence (Bloksma and Jansonius 2000). Because of the polarity between twig growth and fruit growth in thetree it is not necessarily that growth full leaves reflect a growth full quality in the fruit.

J. Bloksma, M. Northolt and M. Huber, Louis Bolk Institute, 200140
6 Exterior of the fruitExterior quality, as size, grading, colour, smooth and blemish, is important for the traders. In this research we onlyused sound fruit and standardised for size and sun exposure, so these measurements have the role to check thestandardisation and only partially for information about characteristics of the series.
6.1 Fruit size
BackgroundFruit size has a major influence on several quality parameters, so we tried to standardise for size as is shown intable 4. Measuring size, in table 6 and annex 3, is a check for this standardisation and not a parameter influencedby the treatments. From the commercial point of view the best size for an Elstar apple is 65-80 mm.
There is no fixed relationship between size and weight, because the specific density varies in the season, fromseason to season and between varieties of apples.
As a rule of thump we use the following relationships (M. Kers, DLV 2000)mm size 60 65 70 75 80 85gram 92 107 128 158 193 235
MethodFruit size is measured in horizontal diameter in mm or in weight in gram.PPO-laboratories measured size in mm on 25 individual apples.
6.2 Skin colour
BackgroundSkin colour plays an important role in the preference of the consumer and has a relation with the ripening process.
MethodWith a chromameter (Minolta CR-300) 3 values of 25 individual apples are measured at the ground colour side:L-value for intensity of reflection (higher value means more reflection); A-value for green ground colour (highervalue means less green); B-value for yellow ground colour (higher value means yellower). Besides that % red blushis measured by a prototype of a sorting camera (AWETA), see table 6 for results.
6.3 Shape, blush colour and shine
BackgroundExterior plays an important role in trading and ripeness indication.
Method en resultsLBI described visually shape, colour, shine and amount of wax in a box with 100 apples.See annex 2.1 for photographs of apples in boxes and description in annex 2.2.
DiscussionAs expected there is a large difference between series A and C. Ripening on the tree produces big irregular apples

Parameters for apple quality and an outline for a new quality concept, part 1. 41
with purple red, fat and glossy skin and ripening in the store does not change size and blush, only ground colourfrom yellow to deep yellow. Bearing or preparations do not influence the exterior and could be nicelystandardised.After storage a thin layer of white moulds is found on the skin. The apples with the longest shelf life (D3, D4) hadsome small rotten spots and were deleted from the series.
Relations between colour and shine and other parametersThe percentage blushed skin is correlated with many unripeness parameters: firmness (r2=0,26), starch (r2=0,61),acid (r2=0,48), Streif index (r2=0,74), N, P, K, Mg (r2=0,63-0,81), vitamin C (r2=0,48), both protein and free aminoacids (both r2=0,84), raw flesh (r2=0,28), astringent skin (r2=0,52) and emission at t=3 in delayed luminescence(r2=0,40). Blush is positively correlated with Brix-1 (r2=0,22), protein ratio (r2=0,77), yellow/blue ratio in spectralrange luminescence (r2=0,75), electrical resistance (r2=0,60), P-value (r2=0,23) and differentiation in crystallisation(r2=0,27).Ground colour and shine are not examined in the correlation table.
Relations with growth, differentiation and integrationIn blush we easily recognise the ripening process (differentiation) as well as in the series (A and C) and in thecorrelations. Moreover we find a slight correlation between blush and integration parameters.As discussed in the background we expect ripening as the main factor for colour (green ground turns into yellow;red blush turns into purple) and for wax. We expect sun exposure as main factor for percentage of blush. Bothparameters acting at the level of differentiation.

J. Bloksma, M. Northolt and M. Huber, Louis Bolk Institute, 200142
7 Basic parameters: firmness, starch, sugar, acid andcalculated indexes
Parameters, as firmness, starch, sugar and acid form our basic to check the quality of the experimental series andto communicate with common quality researchers. These parameters are cheap and also known in combinations inseveral calculated indexes.
7.1 Firmness
BackgroundFirmness is a quality measure that is correlated to sensory tests. Firmness is appreciated especially by youngpeople. For traders this is the main quality parameter because a firm apple would not be damaged so much undertransport conditions. To get very firm apples traders want apples to be picked unripe.Consumers experience the firmness of Elstar as crisp (>6), as firm (4,5-6), as soft (4-4,5), as too soft (3,5-4) and asmealy (<3,5) (v.Diepen 1990). Firmness is the result of the combination of cell turgor (water, sugar) and elasticityof cell walls.
MethodFirmness in kg/cm2 is measured with a penetrometer with the 11 mm plunger at 8 mm depth on 25 individualapples at the ground colour side without skin.
Results and discussionThe means of firmness and figures in kg/cm2 are shown in annex 3.
A: ripeningThe expected decrease in firmness during ripening in series A is not found. The explanation is already mentionedin §2.3.1: firmness decreases both during ripening and storage.
B: bearingThe slow decrease of firmness with increased bearing is in harmony with the expectation, with the crispness in thesensory test and with literature (Wagenmakers 1999, Awad 2001).
C: lightThere is no significant difference as a result of growth in different light intensities.
C: preparationsThere is no difference when preparations are used.
D: shelf lifeAs expected, firmness strongly decreased after storage due to water loss and decreased slightly with prolongedshelf-life.
DiscussionRelations between firmness and other parametersFirmness is correlated with many other parameters that are linked to ripeness or ageing, however most of theseparameters are highly correlated with firmness because of the presence of two separated groups: series A+B+Cversus series D, see for example general appreciation in annex 14.3.6.

Parameters for apple quality and an outline for a new quality concept, part 1. 43
Relations with growth, differentiation and integrationFirmness is the result of turgor and cell elasticity. Turgor (after taking up water) can be seen as a growth aspectwhereas cell wall elasticity and the capacity of not loosing its water is more an integrational aspect.
7.2 Starch
BackgroundThe Lugol-test is a rough measure for ripeness for the fruit grower and is easy to perform in the orchard. Duringripening starch levels are decreasing, which is reflected in an increase on the scale of the EU-standardised colourchart for decreased starch levels. For Elstar the optimal picking time is between scale 2 and 3 on the colour chartfor long storage and between 5 and 8 for direct consumption.
MethodLugol-iodine-test (=3 gram I2 and 10 gram KI per litre) on starch is performed on 25 individual half apples.Scale numbers 1 to 10 are used of the EU-standardised colour chart. A higher number means a lower starch level.
Results and discussionIn annex 3 the means and figures of ‘decreased starch levels’ are denoted. The lugol test on starch shows a largevariation between individual fruit samples. However, the means are in a consequent line.
A: ripeningWhen picked later we see a decrease in starch content.
B: bearingWith more fruit per tree the starch content decreases slightly as is understandable when assimilates have to beshared by more fruit.
C: lightThe Lugol test shows fewer differences with light or preparations which fits with the constant sugar levels. In thesun there is slightly less starch which is in accordance with earlier ripening.
D: shelf lifeAfter picking in a fairly ripe condition the lugol test varied from 5 to 9, with an average of 7,4.After storage, starch in all apples was hardly gone and not measured in detail any more.
DiscussionRelations between starch and other parametersStarch is correlated with many other parameters that have to do with ripeness and sun exposure. Notable is thenegative correlation between starch and the yellow/blue ratio in spectral luminescence (see annex 14.3.29 withr2=0,95 based on series A+C).
Relations with growth, differentiation and integrationWe recognise in starch as basic potential building material a clear growth aspect.
7.3 Sugar in Brix
BackgroundA high amount of both sugar and acid improve the taste, the balance between both is important.

J. Bloksma, M. Northolt and M. Huber, Louis Bolk Institute, 200144
For good taste fruit growers strive for a good proportion between sugar and acid: Brix >12 and acid: 8-10 g/l.Sugar is not spread homogeneously in the fruit: more near the skin than near the core and more near the bottomthan near the top (Stoll 1997).
MethodBrix is measured twice in juice by PPO and by LBI. At PPO-laboratories juice is made of a mixed sample of 25 halfapples, including skin and core. At LBI juice is made without core and filtered by cloth, see §13 aboutcrystallisations. Brix is measured with an optical Brix-meter and indicates total soluble solids, mainly sugars(glucose, saccharose, fructose, and sorbitol).
ResultsSugar is measured in 2 sub-samples in Brix (sample PPO in annex 3 and LBI in annex 4) and is tasted assweetness (annex 9). These three examinations show a good similarity (see annex 14 for correlation). This pointsout the similarity of the sub-samples. Further all sugar results are in a consequent line so there is no indication foran unknown factor, which could interfere when independent replicates are not included.
A: ripeningSugar content increases slightly. It does not vary as much as we expected from literature and experience. Theexplanation is already given (§2.3.1) in the fact that the early picked apples are stored relatively long. The processof transforming starch into sugar is going on, also in a cooled storage.
B: bearingSugar content shows a decrease with an increasing yield. This is also found in other experiments (Wagenmakers1999, Awad 2001, etc). This is easy to understand, because fruit from high bearing trees have less leaves per fruitto deliver assimilates.
C: lightBoth in annex 3 and in annex 4 we see a more or less constant level of sugar in the apple series with preparations.It is known that a tree distributes its assimilates through the phloem equally over all fruit, grown either sunny orshady.
C: preparationsThe slightly lower amount of sugar in the sun-grown apples without preparations is not clearly understood, anddiscussed further in §19.
D: shelf lifeAfter storage the sugar content was decreased, but during the shelf life period it didn’t change. It is know that thesugar content decreases by dissimilation in storage. It is also know that during the shelf life period, breakdown ofsugar is preceded by breakdown of other compounds, so finally sugar levels will decrease. This last phase is notreached here.
DiscussionRelations between Brix and other parametersBrix is correlated with many other parameters that have to do with bearing and thus distributing assimilates. Wefound positive correlations between Brix and dry matter (see annex 14.3.4; r2=0,73), Brix and protein ratio (seeannex 14.3.5; r2=0,69) and Brix with the yellow/blue ratio in spectral range luminescence (see annex 14.3.30;r2=0,69). We only found a weak positive correlation between Brix and sweet tasting (see annex 14.3.10; r2=0,26).Negatively correlated were Brix and calcium content (see annex 14.3.3; r2=0,81), and Brix with both protein andfree amino acids (r2=0,65; r2=0,68).

Parameters for apple quality and an outline for a new quality concept, part 1. 45
Relations with growth, differentiation and integrationFor sugar we have the same argument as for starch to see this as a growth parameter. The ratio sugar/starch canbe seen as a ripening indication and sugar/acid as a balance for taste and an indication for the integrationprocess.
7.4 Malic acid
BackgroundA high amount of both sugar and acid improves the taste, the balance between both is important.For good taste fruit growers strive for a good proportion between sugar and acid: Brix >12 and acid: 8-10 g/l.
MethodMalic acid is determined in duplo by endpoint-titration (pH=8,1) in juice, total acid is measured, of which morethan 95 % is malic acid, it is assumed that acid =malic acid in gram/litre.
Results and discussionIn annex 3 the results are shown. The decrease in acid levels in the ripening series, the decrease in the bearingseries, the constant level in the light series and the decrease in the shelf life are all according to our experienceand literature (Awad 2001). The same tendencies are found for sourness in the sensory test.
Relations between malic acid and other parametersAcid is correlated with many other parameters that have to do with ripening and bearing and thus the distributionof assimilates. Acid is rather well positively correlated with firmness (r2=0,87), starch (r2=0,73), Streif index(r2=0,71), both phosphates and potassium (r2=0,53; r2=0,42), vitamin C (r2=0,68), both protein and free aminoacids (r2=0,72; r2=0,71). Acid is also positively correlated, but weaker, with dry matter (r2=0,40), crispness(r2=0,53), and juiciness (r2=0,49), rawness (r2=0,63), general appreciation (see annex 14.3.7; r2=0,47), delayedluminescence at 3 sec. (r2=0,48) and Bovis-value (r2=0,47). Acid and sourness are positively correlated (see annex14.3.11; r2=0,72).Acid is rather well negatively correlated with protein ratio (r2=0,77), the yellow/blue ratio in spectral rangeluminescence (see annex 14.3.31; r2=0,89) and electrical resistance (r2=0,74). Acid is also negatively correlated,but weaker, with blush (r2=0,48) and disintegration (r2=0,31). Do not confuse acid with acidity (pH). These are notthe same properties as is illustrated in the only moderate negative correlation (r2=0,53).
Relations with growth, differentiation and integrationFor acid we have the same argument as for sugar and starch to see this as a growth parameter. The ratiosugar/acid as a balance for taste can be seen as an indication for the integration process.
7.5 Streif-index
BackgroundFor fruit growers the Streif-index is a measure for maturity and is calculated from parameters that can bemeasured relative easy at the orchard: firmness, Brix and starch in the units as mentioned before (Streif 1996). Alower value indicates a riper product. For Elstar the optimal picking time for long storage is at Streif-index 0,3 andfor short storage at 0,2 and optimal for taste for direct consumption is a Streif-index below 0,15.
MethodStreif-index = firmness / (Brix x starch).

J. Bloksma, M. Northolt and M. Huber, Louis Bolk Institute, 200146
Results and discussionSee for data annex 3.
A: ripenessThe Streif-index shows a moderate decrease, during ripening but not as strong as expected. This methodologicalpoint is mentioned earlier (§2.3.1) due to the fact that the early picked apples are stored relatively long. Theprocesses of transforming starch into sugar and the decrease in firmness are going on, also in a cooled storage.
B: bearingWe expected from starch and firmness levels slightly more ripeness in the high bearing trees, but the low sugarlevels conceal this in the overall Streif-index.
C: lightWe see slightly less or later ripening in the shaded grown fruit than we expected.
D: shelf lifeIn series D no starch is measured because none was expected, so the Streif-index is also not meaningful.
DiscussionRelations between Streif maturity index and other parametersThe Streif index is correlated to many other parameters that have to do with ripeness and these correlations arevery similar to those discussed in §7.4 for starch.
Relations with growth, differentiation and integrationIn accordance with its name the Streif-maturity-index looks like a ripening (=differentiation) parameter. Inconnection with our quality concept it is worth mentioning that this index is built up by a formula consisting ofonly growth parameters of which the mutual proportions change as an indication of maturing. Maturing in thisway can also take place in the store and is not necessarily restricted to the tree. In series A the difference betweenapples matured in store versus ripened on the tree in the sun is clearly demonstrated (see §19.1). For our qualityconcept the differentiating process in the sun is obliged to reach high vital quality.
7.6 Technical quality index (TQ-index)
BackgroundMany authors tried to find a cheap measure for eating quality to replace the expensive sensory test. Here wechecked the conceptual FIBL-technical-quality-index as described for Golden Delicious (Weibel et al, 2000). Theindex is calculated from 3 parameters and on average corresponds rather well with results obtained from sensorytests with Golden Delicious. A higher value is predicted as a better eating quality. First we will check this formulaand then look for another formula that possibly will fit better for Elstar.
MethodTQ-index = 1x Brix + 2x firmness (kg/cm2) + 3x acid (g/l).
ResultsThe results are shown in annex 3.

Parameters for apple quality and an outline for a new quality concept, part 1. 47
DiscussionRelations between technical quality index and sensory propertiesThe TQ-index for Golden Delicious based on Brix, firmness and acid is rather well correlated with the generalappreciation in the sensory test (see annex 14.3.8, r2=0,55 when linear r2 increases with a more complex line).As discussed in §18 this good correlation is due to the presence of two separated groups: series A+B+C versusseries D. We searched for a better predicting TQ-index based on these three technical measurements for our Elstarseries, however we didn’t find a higher correlation than the one with only firmness (see annex 14.3.6; r2=0,68).This means that firmness is the best technical parameter for the prediction of taste in these data.

J. Bloksma, M. Northolt and M. Huber, Louis Bolk Institute, 200148
8 Mineral content (N, P, K, Mg, Ca) and dry matterMineral content and dry matter also are basic parameters.
BackgroundMinerals are of importance during the storage period. Misbalances in minerals are correlated with physiologicalstorage problems as ‘internal breakdown’. For good storage quality the amount of nitrogen should be low,phosphate and calcium high and potassium low in relation to calcium. A little nitrogen is necessary becausenitrogen is present in chlorophyll and flavour compounds. Potassium favours size, colour and aroma.Dry matter content is not easy to interpret. It is known to be related to cell size (smaller cells have higher drymatter) and to sugar content.
Method lab Zeeuws VlaanderenThe mineral content is measured by the laboratory of Zeeuws Vlaanderen. We sent them one mixed sample of 25half apples with skin and core but without seeds from the PPO-laboratories. They were immediately dried at 70°Cfor at least 48 hours. The tissues were destructed by sulphuric acid, copper sulphate and hydrogen peroxide in 2hours at 330°C. Both treatments were performed in duplo. Minerals were analysed by:• spectrophotometry: Nitrogen at 660 nm (NEN 7434) and Phosphorus at 880 nm (NEN 7435).• flame-photometry: Potassium at 769,9 nm (NEN 7436); Magnesium at 285,2 nm and Calcium at 422,7 nm
(NEN 6450).Mineral content is expressed both as % of dry matter and in mg/100gram fresh flesh.
Method LBIFor the self-disintegration test LBI measured the dry matter. Because only a very small dry room at 70°C wasavailable, LBI dried at 30°C for one week and corrected the outcome with a factor to compensate for thedifference between 30° and 70°C.
Results and discussion of the dry matterDry matter is measured once in series A en D (LBI in annex 4) and twice in series B and C (lZVl in annex 3 and LBIin annex 4).
A: ripeningWe found a slight increase in dry matter in the 2 ripest samples.
B: bearingBoth measurements equal well and have a more or less consequent decreasing line with increasing bearing.
C: lightBoth measurements equal quite well and show an increasing dry matter with more light (more evaporation in thesun) and a higher dry matter without preparations (no explanation).
C: preparationsIn apples with preparations we find a lower dry matter. We expected juicier apples or apples with a lower sugarcontent, but do not clearly find this.
D: shelf lifeAfter storage dry matter drops down due to dissimilating sugar in storage. During shelf life we see little effect,although we expected an increase due to evaporation.

Parameters for apple quality and an outline for a new quality concept, part 1. 49
Discussion about dry matterRelations between dry matter and other parameters:Dry matter is measured in two laboratories: dry matter 1 (PPO) in series B and C and dry matter 2 (LBI) in allseries. The correlation between these both is only moderate (annex 14.3.2; r2=0,58), which is explained by the lessprecise method at LBI. The correlations between the dm-1 samples or between the dm-2 are not equal either.A clear positive correlation is found thrice with Brix (see annex 14.3.4; r2=0,77; 0,38; 0,93). A negative correlationis found with calcium (r2=0,71) and with delayed luminescence (t=3 r2=0,66 and lag time r2=0,68, see annex14.3.25).Weaker positive correlations are found with firmness (r2=0,38; 0,36), vitamin C (r2=0,57), many sensoryparameters (r2=0,20-0,34), electrical resistance (r2=0,25) and Bovis-value (r2=0,30).
Relations with growth, differentiation and integrationDry matter is a complex parameter to place in the quality concept. Dry matter is the result of water uptake(growth), sugar content (growth), cell-compactness (inverse growth) and maybe more.Up to now we place dry matter with a question mark at the growth-level.
Results and discussion about minerals: N, P, K, Mg, CaThe results are shown in annex 3. Minerals are only measured in series B and C and are shown both in milligramsper 100 gram dry matter and per fresh matter. Magnesium is shown only in the table, not in a figure.
A: ripeningIn these series we have no own measurements because we expected no difference. From experience it is knownthat mineral content doesn’t change so much during the ripening process. Only by increasing fruit size mineralcontents are diluted slightly, but here we standardised for size. Rain during the period fruit hang on the tree ofteninduces a severe increase in potassium. This is no ripening effect but an uptake effect (De Jager, pers. comm.).
B: bearingWith an increase in bearing we see a decrease in N, P, K and an increase of Ca both in fresh and in dry weight.The decrease is explained by dilution due to enhanced fruit growth. The higher Ca can be caused by lesscompetition from fewer growing twigs in high bearing trees. The proportion K/Ca, as indication for storagepotential, is twice as good in the high bearing trees because K decreases and Ca increases.Wagenmakers (PPO unpubl.) found in a bearing series of Elstar (1998: 60, 100, 140 fruit/ tree) an equal N, Mg,Ca and a decrease in K and P. In the later in summer defruited trees Ca was higher.
C: lightBoth with and without preparations we see a decrease in N, P, K and an equal Ca which increases in light, so theK/Ca ratio decreases in more sun. This induces an overall increase in storage quality for sun-exposed fruit. Thiseffect has been found earlier in comparing inner and outer fruit in trees, but an explanation failed (de Jager,1995). We see corresponding high amounts of proteins and amino acids in shaded-grown apples (see annex 6).
C: preparationsNo difference was found in N, P, K per dry matter between apples which were or weren’t treated withpreparations. Ca is slightly higher in apples with preparations (possibly related to less twig growth). Because ofthe lower dry matter with preparations the mineral content in fresh weight is higher
D: shelf lifeIs not measured, because of the expectation that it would not differ.
Discussion about the mineralsRelations between minerals and other parameters:Minerals are only measured in series B and C, and the correlations are based on only 11 measurements. We found

J. Bloksma, M. Northolt and M. Huber, Louis Bolk Institute, 200150
quit often a high correlation between the N, P, K, Mg contents and the Ca content.
High N, P, K, Mg- contents are found in unripe (Streif) and shaded-grown apples. So it wasn’t surprising to findnitrogen positively correlated with starch (r2=0,60) and negatively with blush (r2=0,80) and the yellow/blue ratioin spectral range luminescence (see annex 14.3.32; r2=0,86 based on only 6 measurements in series C).As expected, nitrogen is positively correlated with protein (r2=0,74) and free amino acids (r2=0,80), but negativelywith protein ratio (r2=0,77). It is interesting to find a high positive correlation between nitrogen and disintegration(see annex 14.3.15; r2=0,72) which fits with the experience of fruit growers that apples with high nitrogen will rotsoon. There is a weak positive correlation with the P-value (r2=0,39).The P, K and Mg correlations mainly follow the line of N. Specific for phosphate is the positive correlation withBrix (r2=0,86) and the negative correlation with electrical resistance (r2=0,65) and integration in crystallisation(r2=0,63).Specific for potassium is a positive correlation with acid (r2=0,42) and Brix (r2=87), which is known in fruit science,see subject heading background, but which is not found as a positive correlation with taste in our series. We founda positive relation with electrical resistance (r2=0,67) and a negative correlation with the yellow/blue ratio inspectral range luminescence (see annex 14.3.39; r2=0,90 based on only 6 measurements in series C).
Calcium is moderate positively correlated with self-maintenance (see annex 14.3.20; r2=0,59), lag time in delayedluminescence (see annex 14.3.26; r2=0,51) and acidity (r2=0,48).Calcium is strong negatively correlated with both Brix-measurements (see annex 14.3.3;r2=0,81 and r2=0,99).We found negative correlations between calcium and firmness (r2=0,76), crispness (see annex 14.3.13; r2=0,71),dry matter (r2=0,71) and weaker with sourness (r2=0,49), aroma (r2=0,42) and general appreciation (r2=0,47).
Relations with growth, differentiation and integrationLooking at the concept of growth (uptake from earth, §20) we expect all minerals to be growth parameters. N, P,K and Mg are diluted in series B due to increased fruit bearing and are higher in shaded-grown apples. This isindeed found in the correlations with the experimental data.Calcium levels increase in series B and are not influenced by sun in series C. Also in many other correlations Calevels are the inverse of the other mineral levels. The uptake of calcium is also known as an exception in aphysiological way: it is sucked up by the hormone gibberellin formed in growing tissues (especial by seeds in thefruit) and ones in the tissue it is not easy to reallocate. Calcium (and especially the Ca/K ratio) makes an applemore resistant against ageing or disintegration. This is why we consider placing calcium at the level of structure,although calcium is not correlated with many ripening parameters.

Parameters for apple quality and an outline for a new quality concept, part 1. 51
9 Protein and free amino acidsProtein and amino acid are usually not measured while this content is very low in apple. We add this parameter tolearn about processes. This chapter is written in co-operation with Peter Stolz.
BackgroundVarious viewpoints can be chosen in examining amino acids in plants and vegetables.One viewpoint is based on the evaluation of the nutritional-physiological quality of the plant material from thepoint of human need for amino acids. This view is also generally held in the determination of amino acids afterhydrolysis of the protein, which simulates human digestion. The criterion here is to meet the human need foramino acids especially the essential amino acids.
The second viewpoint is that the amino acids and proteins in the plant are related to the physiological state of theplant. Here the criterion is to what extent amino acids and proteins reflect the physiological state of the plant.Apples contain a low amount of protein (0,2-0,5g/100 gram fresh weight; Souci 1994) Therefore, protein andfree amino acids should be considered from the second point of view.
In the past, Schuphan (1976) evaluated agricultural crops on the basis of the amount of free amino acids (i.e. allnon-protein nitrogen compounds) in relation to total nitrogen. This assessment is based on the followingconsideration: The plant – depending on its physiological state– takes in nitrogen as nitrate or ammonium andmakes amino acids and proteins out of it. This process will go on only if all growth factors are optimal. The supplyof water from the earth to the plant, light intensity and, to a lesser extent, temperature, are considered as thedecisive growth factors. For this view we use ‘amino acid ratio’.Here, the hypothesis is put forward that the plant shows a higher quality when it has formed its metabolicprocesses in a manner appropriate to its species. That is after it has converted nitrate or ammonium into aminoacids and further into proteins.When the concentration of protein is high in relation to total protein + amino acids, a plant has to a large extentformed its metabolic processes. For this view we use ‘protein ratio’.
To test the total amount of protein, one has to determine what protein contents of the plant parts used as foodare typical for the plant's species. Plant seeds like peas, beans and grains, but also apple pips are high in protein(see table 3). In these generative plant parts, protein appears to be necessary for its function or is specific for thenatural expression.On the other hand, plant parts like apple flesh, contain relatively low protein contents of 0,2-0,5 g protein per100 gram fresh weight. The nature of the apple fruit appears to lie more in its sugar and acid content. The proteinappears to be needed only for the metabolic system. Therefore low protein content is to be expected for aproperly grown apple.
MethodCrude-protein determination according to KjehldalMethod: VDLUFA Methods Volume III Animal-Feed Testing: Determination of crude protein, by method 4.1.1:crushing; decomposition using sulphuric acid/catalyst; alkalisation; steam distillation; titrimetric quantification.
Determination of free amino-acidsCrushing; protein precipitation with trichloroacetic acid; centrifuge/filtering; determination of free amino acidswith amino acid analyser (ion-exchange chromatography), detection using post-column derivatives with ninhydrin.
Calculated ‘free amino acid ratio’ and ‘protein ratio’Free amino acid ratio = free amino acids / (protein + free amino acids) x 100%Protein ratio = protein / (protein + free amino acids) x 100%Both ratios are each other opposite.

J. Bloksma, M. Northolt and M. Huber, Louis Bolk Institute, 200152
Results and discussionThe results are shown in annex 6.
A: ripeningDuring ripening we found hardly any differences in the amounts of protein and amino acids.The contents of free amino acids in the ripening series range from 38 to 52 mg/100g, and protein contents from175 to 194 mg/100g (= 0,18 – 0,19 %) which is relatively low within the range expected for apples with a lowamount of fertiliser added. The protein ratio is high (79-89%) and lies within the range of weakly fertilised apples.Based on this available data it is not possible to make a meaningful differentiation of the state of maturity orripeness.
C: increased fertilisationThe content of free amino acids in the light series ranges from 72 – 243 mg/100g and is significantly above thevalues for the ripening series A (at 38 – 52 mg/100g) which was weakly fertilised. Even the protein contentwhich ranges from 213–419 mg/100g for the light series, compared to 175-194 mg/100g for the weaklyfertilised ripening series, points out the effect of fertilisation with nitrogen. In the light series however, the proteinratio is much lower than in the unfertilised series (63-75%) and indicates that the plant was less able to convertthe amino acids into protein compared to its unfertilised counterpart in series A.
C: lightWith increasing light both protein and free amino acid contents decrease, but the protein ratio increases. Clearlybeaten are the shaded-grown samples with values of 237 and 243 mg/100g for the total sum of free aminoacids, 413 and 419 mg/100g for protein and values of 63% for protein ratio. This shows that the shaded-grownapples were insufficiently able to convert the amino acids into proteins.
C: preparationsThe use of preparations shows a decrease in both protein and in free amino acids but also an increase in proteinratio. The effect of preparations is the strongest in the sun-grown apples (38% less protein, 56% less free aminoacids, 10% higher protein ratio), slightly less in half shadow (respectively 17% less protein, 29% less free aminoacids, 6% higher protein ratio) and is completely absent in the shadow. The shaded-grown apples are similar withand without preparations. The apples grown in half shadow with preparations are similar to the apples in full sunwithout preparations. Here we see an influence of the preparations in the same degree as more sun. Oddlyenough the preparations do not have any influence on the shaded-grown apples.The apples with preparations in the sun have a protein ratio almost as high (75%) as the unfertilised series A inthe sun (79-84%).
DiscussionRelations between protein and free amino acids and other parametersThe correlations for protein and for free amino acids are very similar. As expected protein is positively correlatedwith total nitrogen compounds (r2=0,74), free amino acids (r2=0,99), protein ratio (r2=0,94), and negative withBrix/N (r2=0,88).Protein is positively correlated with many parameters for ripeness or shaded-growth like firmness (r2=0,53), starch(r2=0,58), Streif-index (r2=0,75), acid (r2=0,72), blush (inverse r2=0,84), Brix (inverse see annex 14.3.5; r2=0,69)and rawness (r2=0,46). Remarkable is the strong positive correlation with magnesium (r2=0,94).Memorable are the negative correlations with electrical resistance (r2=0,84), the yellow/blue ratio in spectralrange luminescence (see annex 14.3.34 with r2=0,67) and phenolic compounds (r2=0,58).Surprisingly, and only found for free amino acids is the strong positive correlation with potassium (r2=0,87).
Relations between the protein ratio and other parametersFor the protein ratio, also expressed as % incorporated amino acids, positive correlations are found with manyparameters indicative of ripening like blush (r2=0,77), Brix (r2=0,68), phenolic compounds (see annex 14.3.21 withr2=0,58), not raw (r2=0,46), firmness (inverse r2=0,71), starch (inverse r2=0,59), Streif-index (inverse r2=0,79), acid(inverse r2=0,77),

Parameters for apple quality and an outline for a new quality concept, part 1. 53
We also found positive correlations with yellow/blue ratio in spectral range luminescence (see annex 14.3.40 withr2=0,64), electrical resistance (r2=0,85) and unexpectedly a weak negatively correlation with self-maintenance(r2=0,38).
Relations with growth, differentiation and integrationFree amino acids are easy to recognise as building stones, so ‘amino acids’ is a clear growth parameter. Protein isalready synthesised a little further, but still can be considered as a growth parameter. The identical behaviour ofamino acids and protein in the table of correlations support this choice. The many negative correlations betweenamino acids and integration parameters suggest an arrest of differentiation/integration by high concentrations ofamino acids.The protein ratio (protein/protein+amino acid) as a measure for incorporated building stones can be seen as anintegration parameter. (Or when expressed as ‘amino acid ratio’ we must speak about a inverse integrationparameter). This is supported by the high protein ratio in apples in the sun and with preparations in series C andalso in many correlations with integration parameters as yellow/blue ratio in spectral range luminescence andelectrical resistance.

J. Bloksma, M. Northolt and M. Huber, Louis Bolk Institute, 200154
10 ‘Health’ compounds: vitamins and phenoliccompounds
With regard to human health, vitamin C and phenolic compounds are important as anti-oxidants. For thesecomponents we do not assume more is better or healthier. When eating apples, these compounds might contributeto human health. Here we try to explain these ‘health’ components or secondary metabolites as a result of growthand ripening processes.
10.1 Vitamin C
BackgroundElstar apples contain 10-20 mg vitamin C/100 gram fresh weigh (Stoll 1997, PPO pers.comm.).
MethodThe vitamin C-content (=ascorbic + dehydroascorbic acid) in mg/100 gram fresh-weight was analysed by LBI inapple juice from a mixed sample of 8 apples with skin per treatment. The analysis followed the titration proceduredescribed by Gersons (1972) with a fresh-made 20% 2-5-dichloorfenol-indofenol (Na-salt) as reagent in a 2%-solution of metaphosphoros acid to prevent natural oxidation processes.
Results and discussionThe results are shown in annex 4. All values are lower than expected (<10 mg/100 gram fresh-weight) and nearthe detection limit of this method. The values in series A and B vary so much, there is no strait line, so we expectmeasure faults. The low values in series D and even lower after shelf life are as expected.
Relations between vitamin C and other parametersThe correlations between vitamin C and other parameters are mainly determined by the difference between seriesB (fresh apples) and series D (older and less fresh apples) and are expected.
Relations with growth, differentiation and integrationFrom the concept we thought vitamin C, as a secondary metabolite, would be a differentiation parameter. In theseries and in the correlations we see vitamin C also behaves like a growth parameter. So we put a question –markat both levels. The measurements are not precise enough to distinguish between growth and differentiation withour experimental data.
10.2 Phenolic compounds
BackgroundIn flesh and skin of apple many phenolic compounds are present. The colour of the skin is caused by anthocianinpigment (mainly the phenolic compound cyanidin 3-galactoside). Chlorogenic acid, catechins, procyanidins andquercetin-glycosides are potent antioxidants with potential to prevent oxidation processes such as building up ofsuperficial scald (a storage disorder). Furthermore, they are known to inhibit galactosidases of apple thus havingthe potential to prevent fruit softening. A high level of these compounds, particularly in the fruit skin may increasethe storage potential and, thus, fruit quality (`~Barden and Bramlage 1994). They may also have a function inthe resistance of apples to diseases in the orchard (Mayer at all 1995, Michalek Diss. TUM). As anti-oxidant theyalso have a meaning for human health (Cornell University in Nature 22-6-2000).In general, the biosynthesis of phenylpropanoids depends on the supply of carbohydrates. Studies by Treutter andAwad (2001) revealed that a high C/N-ratio is necessary for high amounts of phenolic compounds.In organic grown apples a higher amount of phenolic compounds are found than in conventionally grown apples(Weibel et all. 2000; Søgaard pers. comm. 2001). Until now we haven’t the knowledge to interpret the various

Parameters for apple quality and an outline for a new quality concept, part 1. 55
phenolic groups separately, so we only present here the total amount in figures.
MethodApples from different treatments were longitudinally cut into eight slices, which were frozen at -20°C andlyophilised. From the dry pieces the brown and oxidised surface was removed and representative parts were cutfrom the top, the middle and the bottom of the fruit slices. These pieces (skin, core, inner, outer flesh in a weightproportion as in the apple) were combined and ground in a mixer while methanol was added. After furtherextraction in an ultrasound water bath for 30 min, the samples were centrifuged and the supernatantconcentrated before analysis by HPLC. The analysis was performed as described by Treutter et al. (1994) and Mayret al. (1995). Flavanols (13 components), cinnamon acids (3 components), phloretin-glycosides (2 components)and quercetin-glycosides (5 components) were determined.These results cannot be compared with those of Awad and de Jager (1999, 2000), as they used another method.
Results and discussionThe results are shown in annex 7.
A: ripeningWe find a decrease of total phenolic compounds during ripening.A general decrease of phenolic content during fruit development and ripening can be expected but is not wellestablished and not intensively studied (Mayr et al. 1995). Awad (2001) found in Elstar apple skin duringmaturation a decrease in concentration but an increase content per fruit. This can be explained by dilution due tofruit growth and continuing syntheses.
B: bearingAwad and the Jager (2001) found no significant differences in the phenolic compounds in apples with respect tobearing. Therefore we didn’t analyse series B.
C: lightBesides the effect of preparations we found the highest levels of phenolic compounds in the most exposed apples.Thus, more shadow during growth results in lower phenolic levels. Because of the higher sugar content and thelower nitrogen content the C/N-ratio of the sunny-grown apples is twice as high. A high C/N-ratio is ofimportance for the synthesis of phenols (pers.com. D. Treutter). So this difference is in line with the physiology. Theminor compounds (phloridzin, quercetin) also show exceptions here, without consequences for the overalltendency.Awad (2001) showed an increase of cyanidins (the main anthocyanin pigment in the skin) from August in sun-exposed fruit and hardly in shaded-grown fruit.
C: preparationsIndependent of light exposure we see thrice that apples with preparations have a + 20% higher level of overallphenolic compounds. As far as known, this is the first time to find such an effect.
D: shelf lifeAwad and de Jager (2000) found no significant differences in the phenolic compounds measured in apples withrespect to shelf-life. Therefore we did not analyse series D.
DiscussionRelations between phenolic compounds and other parametersAstringent taste is caused by phenolic compounds so we expected a correlation and found a strong one (seeannex 14.3.14; r2=0,94), but this is only based on 5 measurements of series A.We found a positive correlation between phenolic compounds and protein ratio (see annex 14.3.21; r2=0,58) andwith electrical resistance (r2=0,38). Negative correlations are found with proteins and free amino acids (r2=0,58;r2=0,37).

J. Bloksma, M. Northolt and M. Huber, Louis Bolk Institute, 200156
Relations with growth, differentiation and integrationPhenolic compounds are secondary metabolites and that is why we place this parameter in the level ofdifferentiation. Also the higher concentration of phenols in series C in sun-grown fruit and in fruit treated withpreparations support this idea. The decrease in concentration of phenols with riper fruit in series A may look likethe contrary, but remember, a decrease in concentration can also mean an increase in mg per fruit. Phenols arecorrelated with some integration parameters (protein ratio and electrical resistance), so maybe there is also anintegrational aspect?

Parameters for apple quality and an outline for a new quality concept, part 1. 57
11 Self-disintegration (SD)BackgroundThis test is developed to measure ‘self-maintenance’. Therefore a slice is taken out of fresh fruit and exposed to airand incubated in a petri-disk unto disintegration by autolysis and opportunistic micro-organisms. See for furtherbackground annex 19. LBI uses this test in many crops, but with apples the results were poor, see under methodimprovement and annex 19. In this project we gave this test on apple another chance.
MethodThis test was carried out by LBI with 8 apples per treatment.From each apple two slices (ca. 0,50-0,75 cm thick) were cut trough the middle of the apple. The remaining upperand lower parts of the apples were used for the other tests (taste, vit.C, crystallisation, and capillary picture).Both slices of each apple were weighed. Then one was dried in a stove for initial dry weight and one was used forself-disintegration and dried for dry weight after the test. From this data the dry matter loss of every individualapple was calculated.The slice in the petri-dish for disintegration was placed one hour in open air in the laboratory for natural infectionby micro-organisms and then covered with a lid with ridges to allow gas exchange. The petri-dish was placed in adark incubator of 20°C and a relative humidity of circa 100%.After 7 days the apple slices were judged as to the following parameters:
Visual judging, qualitative:1. Presence of black-sporulating fungi. These fungi have proved to be very aggressive, and when they are present
the percentage white surface is not a good parameter any more. So, these slices were excluded and in somecases the amount of observations without black mould became very small.
2. Percentage of the slice-surface (without black mould) that was still white as an indicator for ‘self-maintenance’.
Dry weight judging, quantitative:3. Loss of dry matter after self-disintegration.
Degree of disintegration = ∆d.s. = (d.s.before – d.s.after)/ d.s.before * 100%.
ResultsThis parameter is shown in annex 4. We presented 2 values: ‘%dry matter loss’ in one week and ‘%area white’after a week of ‘self-maintenance’. The first parameter is calculated from all slices, the second without slices withblack fungi. The variation between the 8 apple slices in one sample is so large that no significant (95%)differences between the means appeared. Nevertheless we discuss the tendencies.
A: RipenessLater picking shows a tendency to faster disintegration especially of the ripest samples, and an equal self-maintenance. With riper samples we expected an increase in disintegration and a decrease in self-maintenance.These results give the impression that none of these apples are so ripe that they loose their form and only theripest ones disintegrate a little more than average.
B: BearingSeries B has one lost sample, the remaining values show a constant ‘disintegration’ and a decreasing tendency in‘self-maintenance’ with increased bearing.
C: LightSeries C shows only a small difference between ‘self-disintegration’ and ‘self-maintenance’. More sun exposureleads to less disintegration and equal self-maintenance.

J. Bloksma, M. Northolt and M. Huber, Louis Bolk Institute, 200158
C: PreparationsThere is a slight but consequent difference for apples with preparations in a way we did not expect, they seem todisintegrate and loose their form a little easier.
D: Shelf-lifeSeries D shows a consistent increase in disintegration and a decrease in self-maintenance as expected.
DiscussionRelations between disintegration and other parametersDisintegration is positively correlated with nitrogen content (see annex 14.3.15 with r2=0,72) and with phosphate,potassium and magnesium. The nitrogen content fits with the experience that apples with a high nitrogen contentstore shorter than apples with a lower nitrogen content.Disintegration is negatively correlated with vitamin C (see annex 14.3.17 with r2=0,59). Vitamin C is known as anantioxidant and from the figure we derived that a minimum of 4 mg/100gram protects against a disintegrationof more than 7% dry matter loss in a week.Disintegration is also negatively correlated with firmness (see annex 14.3.16 with r2=0,60), many sensoryproperties (crisp, juicy, sour, not raw, aromatic, general), and Bovis-value (see annex 14.3.18 with r2=0,57). Thesecorrelations are again mainly due to the presence of two groups of apples: series A, B, C on the one side and theolder, softer and easy to disintegrate apples from series D on the other side. The negative correlation with acidity(see annex 14.3.19 with r2=0,54) is caused by the group of apples from series B with an unexplained low pH. It isalso a reasonable assumption that a low pH prevents disintegration.We expected a negative correlation between disintegration and self-maintenance, a negative correlation betweendisintegration and dry matter (as found earlier however in this experiment only with r2=0,39) and a positivecorrelation between disintegration and Brix (sugar as an easy to assimilate substrate), but none of thesecorrelations were very profound.
Relations between self-maintenance and other parametersSelf-maintenance is positively correlated with calcium-content (see annex 14.3.20 with r2=0,59). Apples with highcalcium-content are known to be well structured and long storable and self-maintenance fits with these properties.There is a weak positive correlation with Brix (PPO, r2=0,33) and some weak negative correlations with proteinratio (r2=0,38) and crispness (r2=0,43).We expected a correlation between self-maintenance and disintegration, vitamin C or phenolic compounds, butnone of these correlations were very profound.
Relations with growth, differentiation and integrationFrom the concept, both resistance to disintegration and self-maintenance are parameters involved with keepingyour own form. Which fits with the level of integration. Looking at the series we expected a decrease in self-disintegration during ripening and ageing and an increase with sun exposure, preparations and moderate bearing,of the above only ageing and light exposure were found.Looking at the correlations we found only a few correlations with other integration parameters. As mentionedearlier we are not satisfied with the precision of this method, maybe this is the reason we didn’t find theexperimental evidence, maybe our way of hypothesising is not correct?
Method improvementTo improve this test we need to measure dry matter more precisely and use more sub-samples to compensate forthe loss of slices due to the aggressive black fungi. See annex 19 for experiences and questions with self-disintegration test on apples.

Parameters for apple quality and an outline for a new quality concept, part 1. 59
12 Sensory propertiesTaste is one of the most important parameters for apple quality in consumer’s eyes. This chapter is written in co-operation with Mirjam Matze.
BackgroundSensory panels are mostly used for judgements between varieties, but LBI has the experience that a trained panelis also able to judge between various treatments within one apple variety.
Method: expert panel and preparation of the tastersAt LBI we determine the taste as objective as possible by controlling the taste circumstances and dividing theminto taste-characterisation and judgement, see form in annex 15. LBI chose to use a trained panel of 7 to 8people.The tasters are trained to judge apples and are checked for individual consistency of the results.Eight people have been selected who: do not smoke, are familiar with eating apples and like them and arefamiliar with eating organically grown products. In the week before each sensory session these tasters received a‘trial-bag’ with about 6 – 8 apples of different varieties, ripeness, aroma and production systems (bio-dynamic,organic or conventional). With the aid of these trial apples the tasters were asked to train themselves at home bytasting the apples to get a good feeling about how much an apple can vary in different aspects. In this way theycalibrated themselves from the range of 1 (=very little) to 10 (=extreme) in the varying aspects and get used tothe question list.
MethodPreparations of the apple segmentsAt LBI the same apples were used for many parameters. The apples are cut horizontally to obtain 2 slices for theself-disintegration test. Both remaining halves have been divided with an apple divider on a glass plate into 2x10segments; the core is eliminated. Half of these segments have been used for the sensory test; the other halves areused to make juice to test the other parameters. The segments of 8 half apples per treatment are combined in aglass bowl, mixed well and covered under plastic for the rest of the time (about 5 to 15 minutes) before tasting.Each taster received about 8 segments per treatment at random in a coded tasteless paper dish. In one session 5or 6 treatments were compared. Every taster had another code sequence, because of the well know preference forthe first sample.Series A, B, D are served with skin. The light series C, with clearly visual skin differences, was served peeled toavoid psychological influence.
Answer form with objective characterisation and personal judgementThe taster starts with one segment in the mouth. There are three categories of questions in a fixed sequence:concerning biting the skin (thick, astringent), biting the flesh (crispy, juicy, mealy), and tasting the flesh (raw,sweet, acid, aroma). In every category the different aspects have to be characterised objectively between 1 and 10and next to be judged personally between 1 and 10. These two exercises are important to correct for personalpreference. A very sweet apple for example: one person who likes sweet apples marks a high score for sweetnessfor characterisation and for judgement. Another person who finds this apple too sweet marks a high score forcharacterisation but a lower for judgement. The personal preference is seen in the judgement.At every form some space is left for other remarks. After comparing other samples the taster can repeat with theleft segments as much as he/she likes for more certainty.After incorporating the data we correlated all scores of one person’s characterisations with their judgements to geta ‘personal taste profile’ for the different aspects and to see how consistent a person judges the different seriesand samples. A consistent person shows a narrow line (straight or bend down). We used only the data ofconsistent tasters (7 of the 8).
Results and discussionThe results are shown in annex 8.
A: Ripeness

J. Bloksma, M. Northolt and M. Huber, Louis Bolk Institute, 200160
Riper apples gave a slight (not significant) improvement of total judgement. Probably this has to do withincreased sweetness (especially treatment 5), less sour, less astringent skin and less ‘rawness’ (but only smalldifferences).In some aspects we see an optimum in the intermediate treatments (which is also optimal from the point of viewof the fruit grower): the thinnest skin (3), the highest juiciness (4) and the best results for aroma (3). These allconfirm general accepted knowledge about taste and confirm the measured sugar and acid contents.The juiciness in the sensory test and the measured %dry matter are positively correlated. Crispness increases untilripening treatment 3; beyond this treatment the crispiness stays constant.
B: BearingThe bearing does not influence the general appreciation. Only the heaviest bearing shows a slight decrease. This isstrange because some important sensory aspects decrease by bearing: crispness, sweetness (especially bearing 5),sourness and aroma.In series B the skin is characterised as relatively thick compared to series A (session effect?) and is independent ofbearing. The skin is relatively astringent, especially treatment 1.
C: Light and preparationsFor taste the differences due to light exposure or preparations are smaller than we saw with other parameters andaren’t significant. The total judgement and aroma are independent of light exposure.
D: Shelf-lifeFor general appreciation and most detailed aspects of taste we see a severe decrease after storage and a slightdecrease during the period of shelf life. It is well known that apples loose their good taste in cooled storage andduring shelf life.
DiscussionRelations between taste and other parametersThe general appreciation is positively correlated with firmness (see annex 14.3.6 with r2=0,68 although this isbased on two separated groups; series A, B and C versus series D), with acid (see annex 14.3.7 with r2=0,72) andstrongly with the Bovis-value (see annex 14.3.9 with r2=0,87). We found a weaker positive correlation with drymatter (r2=0,20), acidity (r2=0,27) and DL-emission at t=3 in delayed luminescence test (r2=0,31). Generalappreciation is moderate negatively correlated with calcium (r2=0,47), dry matter (r2=0,42) and disintegration(r2=0,40). Remarkably there is no correlation with Brix.Within the sensory parameters we see a group of crispness, juiciness and non-mealiness that is strong positivelycorrelated with general appreciation (r2=0,72-0,99). Sourness (r2=0,54) and aroma (r2=0,42) are moderatepositively correlated while sweetness is only weakly correlated (r2=0,21).In §7.6 we discussed an attempt to find a formula that predicts taste based on some easy to measure technicalparameters. Based on this small amount of data the best technical parameter seems to be firmness. Of allparameters the Bovis-value has the best prediction-value for taste.
Looking at the various aspects of taste we can mention some remarkable correlations.With an astringent skin taste many parameters of unripe ness are correlated: starch (r2=0,62), Streif (r2=0,71),sweetness (inverse r2=0,32) and rawness (r2=0,31). With a non-astringent skin taste a number of parameterslinked to sun-exposure are correlated, like blush (r2=0,52), magnesium (r2=0,90) and electrical resistance (r2=0,33).This is a new phenomenon for us, and is found in other series than the light series (series C is tasted without skinbecause of the psychological influence skin colour has on the taste perception).As expected, an astringent skin is positively correlated with phenolic compounds (see annex 14.3.14 with r2=0,94)because the astringent components have a phenolic origin.
Crispness is correlated with many parameters. As expected a strong positive correlation is found with firmness(annex 14.3.12 with r2=0,80). Crispness is an important determinant for general appreciation (r2=0,72). Narrowlyrelated with juiciness (r2=0,85), acid (r2=0,53), pH (inverse r2=0,56) and sourness (r2=0,70). Crispness is correlatedwith aromatic taste (r2=0,60), vitamin C (r2=0,48), dry matter (r2=0,34), Brix/N (r2=0,37), DL-emission at t=3 indelayed luminescence test (r2=0,27), yellow/blue ratio in spectral range luminescence (r2=0,59) and Bovis-value

Parameters for apple quality and an outline for a new quality concept, part 1. 61
(r2=0,70).Remarkable is the strong negative correlation with calcium (see annex 14.3.13 with r2=0,71); here we recognisethe polarity between storage potential (calcium) and taste (crisp).
Juiciness is strongly correlated with crispness (r2=0,85), so the majority of the correlations found for crispness arealso found for juiciness. Remarkable is the negative and not expected correlation with disintegration (r2=0,62).
Mealiness is only measured in series D. The high correlations found in annex 14.1 are only based on 4measurements and are left out of the discussion.
Rawness is an aspect of taste and as expected correlates with unripe-ness parameters: firmness (r2=0,44), crispness(r2=0,20), starch (r2=0,42), acid (r2=0,63), pH (inverse r2=0,35), sourness (r2=0,30), Streif-index (r2=0,43), drymatter (r2=0,30), blush (inverse r2=0,28), protein (r2=0,46), amino acids (r2=0,45), protein ratio (inverse r2=0,46),astringent skin (r2=0,31), vitamin C (inverse r2=0,60), DL-emission at t=3 in delayed luminescence test,yellow/blue ratio in spectral range luminescence (inverse r2=0,59) and electrical resistance (inverse r2=0,57).
Sourness in taste is as expected well correlated with acid (see annex 14.3.11 with r2=0,57) and acidity (inverser2=0,63). Besides this we find correlations with freshness parameters like firmness (r2=0,80), crispness (r2=0,70),dry matter (inverse r2=0,30), vitamin C (r2=0,43), general appreciation (r2=0,54), DL-emission at t=3 in delayedluminescence test (r2=0,54) and Bovis-value (r2=0,59).We found negative correlations with calcium (r2=0,49), disintegration (r2=0,45), and weaker negative correlationswith electrical resistance (r2=0,28), differentiation and integration in crystallisation images (r2=0,29 and r2=0,26).
Sweetness is only correlated with a few parameters. We found a weak positive correlation with Brix (see annex14.3.10 with r2=0,26) although we expected a stronger one. A weak positive correlation was found with generalappreciation (r2=0,21), yellow/blue ratio in spectral range luminescence (r2=0,38) and a weak negativecorrelation with astringency (r2=0,32).
Aromatic taste showed moderate positive correlations with crispness (r2=0,60), juiciness (r2=0,53), sourness(r2=0,48), acidity (inverse pH r2=0,21), general appreciation (r2=0,42), Bovis-value (r2=0,48). Weak positivecorrelations with firmness (r2=0,35), Brix (r2=0,21), acid (r2=0,20), ripeness-index (inverse Streif r2=0,26), drymatter (r2=0,23 and 0,40). It seems the tasters judge the sweet/sour ratio often as ‘aroma’. Negative correlationswere found with calcium (r2=0,42) and disintegration (r2=0,47).
Relations with growth, differentiation and integrationAppreciation is a complex parameter. We are glad we performed a very detailed sensory test. From the concept werecognise growth aspects in sweetness, sourness and juiciness. Crispness also has a growth aspect, but similar towhat is said for firmness there is also an integrational aspect involved with sustaining the crispness. Mealiness canbe seen as a loss of vitality (growth) and loss of coherence between cells (integration). Physiologically seen, acondition wherein aroma is gained requires a high level of basic substances (sugar, sour, etc) together with adifferentiation process, so we place gaining aroma at the integrational level with a question mark fordifferentiation. Loss of rawness or astringent skin can be seen as a result of ripening. Overall taste depends oncertain proportions, as is seen in the sweet/sour ratio.Because of the small differences and the large variation we have only little experimental evidence from the seriesto support this hypothesis. The tendencies we recognise in series D that support this theory are the loss of vitality(sourness, crispness, juiciness) and integration (aroma, overall) with ageing. In series B we find that the reason forlower appreciation for apples from the highest bearing trees is too little sweetness (insufficient sugar for all fruit),and like wise insufficient growth.Looking at the correlations it is remarkable to see that overall appreciation is mainly correlated with growthparameters, so juiciness, crispness, sweet/sour ratio are important. The correlations withdifferentiation/integration parameters are illustrated by rawness of flesh, astringent skin and sweet/sour ratio inthe ripening process.

J. Bloksma, M. Northolt and M. Huber, Louis Bolk Institute, 200162
Method improvementIt has hardly ever been done; comparing the taste between apples of only one variety grown in the same orchard,and moreover when there is no bad tasting sample present. So the tasters were provoked to sense very smalldifferences, smaller than we had anticipated. With this in mind it is understandable to find a variation which istoo large around the means in the experimental data. An improvement can be a correction factor orstandardisation to decrease this variation. Another aspect might be a better training to improve sensing thedifference between sweet/sour and aroma.A well known phenomenon, and also found here, is the high appreciation of the first tasted apple. That is why thevarious samples are presented in a random sequence to the members of the taste panel. An improvement mightbe to correct for this phenomenon. When analysing the variation in judgement we see an increase in variationfrom the sixth apple onwards, this means the tasters are getting tired and lose their refined tasting ability, so weconclude to present a maximum of 5 samples per taster in future.

Parameters for apple quality and an outline for a new quality concept, part 1. 63
13 Copper chloride crystallisation (=CC)This is one of the experimental parameters to learn about life processes.
BackgroundThe copper chloride crystallisation method (CC) has been developed from a viewpoint that living organisms do notjust exist of substances, but have directing and organising ‘living, architectural, structuring forces’. Thesestructuring forces direct form and function of the organism. To demonstrate the existence of this structuring forcethe CC was developed around 1930 by Ehrenfried Pfeiffer in Switzerland and since then the CC is gradually beingfurther developed to a method with which experts can distinguish different types of structuring forces (Engquist,1970). The method can be applied with juice from a living organism. The juice is mixed with a solution of copperchloride which is incubated in a climate chamber, where the water evaporates and the solids crystallise afterseveral hours. The pattern of the crystals is then examined. It is thought that the type of crystal patterns indicatesthe living, architectural and structuring forces, here called the life processes in the growing product. The forcesthat are supposedly reflected in these patterns, play an important role in the provisional quality concept. Themethod is already longer in use with blood from human beings, as an additional method for medical diagnostics.In the Louis Bolk Institute and some other European institutes this method is now in development for food quality.It is ‘used’ in this project in an exploratory way to gain experience and reference material.
Method
Preparing juiceIn §4 the way of sampling is described. The apple segments of 5 apples were grated manually to a mixed sample.This grated apple was then squeezed through a cloth with a 110 µ diameter. The resulting juice is left for 30minutes to allow the debris to settle. One ml of apple juice is combined with 33 ml aquabidest and 10 ml ofcopper chloride 20% solution.
Crystallisation process4.5 ml of the mixture is pipetted into a well-cleaned glass plate with a width of 9.5 cm and glued to a glass rimwith a mixture of paraffin and bee-wax. Four replicate glass plates are prepared from one sample of juice.The crystallisation takes place in a climate chamber of 31 C° and 60% RH. The copper chloride starts tocrystallise after 8 -11 hours. The next day the rim is removed and the plate is dried further with filtration paperand stored as a glass plate in a plastic bag.The CC is a very sensitive method and the current climate chambers at LBI do not have enough constantconditions. In expectation of the improved chambers, we did the crystallisation twice, on two separate days withtwo separate sub samples. The ‘best day’ - judged by clear differences between variants and few differencesbetween the four replicates- was chosen to be described.
Observation and judgementThe series are placed on a light-board to be judged. Judging starts with an empathic first impression of thegestures and qualities in the patterns, expressed in terms of coherence, vitality, differentiation; terms that emergein this method as self-evident, natural concepts. Then the more objective facts are scored in terms of measurableproperties, like length of crystallisation needles, angles between branches and side needles, etc. Finally a freedescription is given. This process of judgement was first done blindly and was repeated after revealing thesequence of samples in the series.One representative image per variant is digitally scanned and presented in annex 9. Choosing one image of thefour is a subjective process of characterisation, which is based on the impression of the essential changes in thesequential series. The described observations are based on 4 images per sample. So the presented image may notcontain all aspects described in the text. In annex 9 the different categories, classified in the observation andjudgement process, are explained.

J. Bloksma, M. Northolt and M. Huber, Louis Bolk Institute, 200164
ResultsThe results are shown in annex 9.1 (details method); annex 9.2 (representative pictures) and 9.3 (figures perseries).
A: ripeningIn these series we needed to reveal the sample codes before we could rank the images. Then a developmentstarted to appear. From a very abundant dividing and subdividing of small needles in the multi-centered imagesA1 and A2, both with a very dense and thick needle-structure, the series developed from image A3 onwards tomore one-centeredness. The head branches make bigger gestures, the structure of the side needles is lessabundantly divided, more air appears between the needles and the structures open more to the periphery. Theimages become more coherent towards A5. It also seems that in the images the centre of attention is graduallydrawn more towards the periphery. The ripening series are in accordance with our expectations aboutdifferentiation and coherence.
B: bearingIn these series it was possible to blindly find the right sequence. The series starts in B1 with a very thin, long andslack image filling needle structure as one extreme. The ‘middle images’ in B3 have a well filled ground structurewith short and bristle-like needles, and an apple-typical structure. The other extreme, B5, shows images with aquite empty surface of the plate and faintly apple-typical characteristics. Gradually the needles become somewhatsharper. The extreme under bearing situation seems to show a ‘luxurious but inharmonious growth’. The extremeoverbearing (B5) shows ‘poorness’ and the crystal structure does not reach the border. The lowest bearing,expected to be very vital, was surprisingly weak but yet coherent. For both vitality and for differentiation B3 hadthe highest scores and for coherence B4 scored a little higher. From the crystallisations point of view this serieshad the expected optimum in the middle.
C: lightAlthough the series with and without preparations are very different, in both, with the increasing amount of light,an increase can be seen in one-centeredness and in coherence of the images. Also an increase in the refinement ofform of the needles is seen, as well as in the transparency of the images.
C: preparationsIn the coded samples a clear difference can be seen between two groups of three images. One group (C1, C2, C3,later revealed as the group with preparations) shows slender and quite straight needles which have relatively fewside needles; these images appear very ‘transparent’ but also somewhat ‘thin’. The other group ( C4, C5, C6, laterappearing to be the group without preparations) has a much fuller needle-structure and more bunches of sideneedles. The needles of the first group are distinctly longer than in the second group. It was a surprise to find thatthe ‘thinner, more transparent group’ with a slightly lower vitality- and differentiation-score, was the one treatedwith preparations. The coherence was, as expected, a little better in the apples with preparations.
D: shelf lifeThe just-out-of-the-storage-apples (D2) show a rather inharmonious, kind of ‘shocked’ image. Apples-4-days-on theshelf (D3) are regarded as the most harmonious ones. In the next two images the attention is drawn increasinglytowards the outer, peripheral zone. Parallel to this the structure changes in the sense of much more dividing intolong thin side needles that appear as very un-apple-like. A loss of coherence, which might have been expected,was not seen, moreover an increase was found! Apples until 12 days on the shelf, stay vital and coherent. Noageing signs, as we expected, appeared.
DiscussionThe crystallisations form a holistic image, and aid to the interpretation of the conventional parameters for growth,differentiation and integrationThe images have brought information of a totally different quality than the other methods. Observing theseimages brings the experience of the reality of life processes closer. It changes the way of thinking and makes iteasier to integrate other data, including the conventional ones, into a more holistic overview about what is

Parameters for apple quality and an outline for a new quality concept, part 1. 65
converting in the various series, see §19 en annex 9.3. The results brought some confirmation in series A, B and Cfor light and also some surprises in series C for preparations and in series D.Crystallisations are especially valuable for the vital quality concept because crystallisations can be judged on allthree aspects of the concept. Vitality is recognised as smooth, quite dense needle structures filling the whole plate.Structure is recognised as , well ordered, one-centrered, regular pattern of sharp side-needles with a wide angle.Coherence is recognised as a whole where the parts are interconnected, without isolated structures and in a waytypical for apple.
Relations between crystallisations and other parametersIn the table of correlations (annex 14.1) only the empathic judgements are included, the impressions of vitality,structure and integration. We found no correlations between what is experienced in these images as vitality andany other parameter. A handicap in the search for correlations is the rough score-scale used, which seldom willgive significant correlations. In this report we only evaluated the empathetical observations of the first impression.The other scores will be kept until we have collected more data from other projects.
With the impression of differentiation we found some moderate correlations: negative correlations with unripe-ness parameters like firmness (r2=0,20), malic acid (r2=0,29) and sourness (r2=0,29) as we expected for ripening isan aspect of differentiation. With the delayed luminescence test we found a negative correlation with the DL-emission at t=3 (r2=0,30; annex 14.3.41 and not expected) and with lag time (r2=0,30; annex 14.3.42). The lastcorrelation is as expected because lag time is known to be an inverse differentiation parameter.We found a negative correlation with redoxpotential (Eh: r2=0,22) and P-value (r2=0,33; annex 14.3.43). This is asexpected because P-value is known to be an inverse ordering parameter.We found a moderate positive correlation with the impression of integration in the same images (r2=0,35; annex14.3.44) as fits with the hypothesis that to a certain amount differentiation is a prerequisite for integration.
With the impression of integration we found a negative correlation with aromatic taste (r2=0,34; annex 14.3.45)which we expected to be positive because we assume aroma as an integration-parameter. With sourness (r2=0,26)and DL-emission at t=3 in the delayed luminescence test a moderate negative correlation is found. This isunderstandable as both parameters are thought to belong to the growth process and when growth is too severethe integration is inhibited. We found a negative correlation with redoxpotential (Eh: r2=0,31) and P-value(r2=0,33; annex 14.3.47). This is as expected because P-value is known to be an inverse ordering parameter. Andwe repeat the moderate positive correlation between the impression of differentiation and of integration in thesame images (r2=0,35; annex 14.3.44 as expected). No correlation with Bovis-value is found (see annex 14.3.48)unless we had expect.
New steps in the method during this projectDuring this project a new method of judging CC on a quantitative scale was introduced. This facilitates comparingwithin series and with other parameters. Quantification was performed with the empathically judged aspects ofvitality, differentiation and coherence, which arose from the images. There were only a few moderate correlationswith other parameters, which are thought to indicate aspects of growth, differentiation and integration. Thisbrings into question whether we have enough consensus about the aspects of vitality, differentiation andcoherence and about the concept of vital quality. Also the selected items described in the quantitative scale canbe improved.A new insight from the correlations is that ‘transparency’ of images is a measure for differentiation.
Method improvement for the futureOur aim is to develop the CC to a reliable scientific method giving information about living, architectural andstructuring forces and thus about the life processes in food products, with repeatable judgements , if the sametechnical and judgmental conditions are used. To reach this goal we need some improvements.First the technical requirement to make reproducible images. As the CC is a very sensitive method it requires goodtechnology, and also ‘green fingers’ for the method. We mentioned previously that the current climate chambersat the LBI do not have optimal stable conditions. To circumvent this, two separate crystallisation series were madeon different days, and the technically ‘best day’ was chosen. Improvement of the chambers is necessary to obtainbetter control. But nevertheless with a single repeat we obtained results that could be interpreted.

J. Bloksma, M. Northolt and M. Huber, Louis Bolk Institute, 200166
Next, is the requirement for capable judging of the images. One way is to analyse the objective facts about theneedle structure. A computer could do that and discriminate between the physically recognisable propertiesbetween different images on the level of growth and differentiation. But the empathic judgements on the level ofintegration still ask for human observations.This is the way of the personal judgement by trained observers. Research in the past showed that a group ofskilled observers can reach acceptable intra- and inter-observer repeatability with respect to objectively as well asemphatically judged aspects of images. (Amons, van der Bie, Huber, Koopmans,1992,1999).Last step is the interpretation of the images: what do the observed facts and characteristics mean? To makeinterpretations, references have to be available to correlate to and also a conceptual network has to be present.Studies like this apple study are suitable to obtain references. In this CC method expert-validity will be the firstand most feasible to obtain. A co-operation and result-comparison with a colleague-laboratory would be mostuseful and will take place in the future.

Parameters for apple quality and an outline for a new quality concept, part 1. 67
14 Capillary rising Picture method (CP)This is one of the experimental parameters to learn about processes.
BackgroundThe capillary rising picture method (CP) was developed with the same purpose as the copper chloridecrystallisation (CC) to make aspects of life processes in living organisms visible. The method was developed fromascending chromatography (Kolisko 1939) and is also called capillary dynamolysis (A.Tingstad 2001).In the CP a different method and medium is used than in the CC, so other aspects of life processes might appearthan in the CC. In the Louis Bolk Institute this method has only recently been introduced. The aim was to obtainreference material to see whether it is worthwhile developing this method further at LBI.
Method
Preparing juice and rising processThe same juice as for the CC is used. Two concentrations are made, 100% and 50%, for which either 0.6 ml applejuice or 0.3 ml juice with 0.3 ml aqua bidest is allowed to rise in chromatographic paper (Whatmann no. 1) anddry during 3 hours in a room of 20 C° and 60% RH. Next the filter is placed in a solution of 0.7 ml silver nitrate0.25 % which is allowed to migrate vertically up the filter paper up to 1 mm over the juice-line, under a glassbowl during 30 min. After drying, 2 ml of iron sulphate 0.25 % is added to rise nearly to the top of the paperunder a glass bowl during 0.5 to 2 hours. Then the paper is dried for 3 hours. The last two stages take place in adark room.
ObservationsFor training in technique and judgement of the images the help of an expert, Mrs. Ruth Mandera from Germany,was asked. She considered the technical quality of the images as good. She first described the CP’s blindly, thenwith known series sequences, but she could not interpret the images because she had not worked with applesbefore. From her descriptions of the two concentrations of the four series, we chose to present here the ones thatshow the most obvious signs. Which can be of either concentration.
ResultsThe technical terms are indicated in annex 10.1 and some photos with description in annex 10.2.
A: ripeningCP A1 and A5 are very different in the way that in A1 the middlezone lies like a barrier between the lower partand the upper part of the images. Whereas in A5 the middlezone connects in a lively way the lower and the upperpart and the images seem more like a whole. In A1 the bowls of the middlezone are round, whereas in A5 thebowls have opened into vertical lines. The content of the bowls in A1 is a solid grey, whereas in A5 this area isfilled with vertical lines. Also more flags appear. In images A2-A4 a transition is recognised. Summarising, theripening series showed a continuous process from closed horizontal gestures into open vertical gestures.
B: bearingAgain the middlezone draws most attention. In B1 it is rather pale, with a pale silverline under the bowls. In B5the bowls in the middlezone are strongly formed and are contoured by a strong brown lower silverline. Also theforms of the bowls seem to change: in B1 the tendency is towards an irregular form whereas in B5 the tendency istowards a rounder and regular form. B2-B4 shows a gradual transition from pale forms to stronger and clearerforms, but not so obvious that it was found blindly.
C: lightThe full sunlight series show the roundest forms and contours in the bowls of the middlezone and few, swingingflags. There is openness between the flags. The shaded grown series show less round forms and a palermiddlezone and have many more flags, which are stiff. The half sunlight grown series are somewhere in between.So increasing sunlight showed a gradual change from stiff to more bowl-like and open forms.

J. Bloksma, M. Northolt and M. Huber, Louis Bolk Institute, 200168
C: preparationsNo differentiating criteria could be found. The only impression is that the forms have more contrast.
D: shelf lifeAfter storage the images showed great differences with the original; in annex 10.2 all the five are shown. Thejuice did not rise well and produced increasingly broadened bowl forms in the middlezone. This might be due toan increased ‘stickyness’ of the juice.
DiscussionThe images are only described, not explained. It is a first step to find which phenomena in plant developmentrelate with the phenomena in the capillary pictures. In future research the images will gradually get their meaningin the context of the other parameters.

Parameters for apple quality and an outline for a new quality concept, part 1. 69
15 Delayed luminescenceThis is one of the experimental parameters to learn about processes.
Introduction to ‘Bio-photons’Plants in darkness emit a permanent and extremely weak radiation of light [Ruth 1976, Popp 1979, Colli, 1954,Günther 1983, Neurohr 1992]. This emission becomes stronger when preceded by an illumination phase (inducedemission). The intensity of the light emission decreases following the illumination phase and, after some time,equals the weak permanent emission. This transition time depends on the sample material and varies from a fewseconds to some hours.Popp designated bio-photon analysis as the examination of the weak light emission by biological samples, thoughno clear differentiation was made between induced and permanent emission.
Meluna Bio-photon Research co-operates with Popp in measuring delayed luminescence and Kwalis developed anown method with spectral range luminescence. Both methods are used in this project and described in more detailin the next two chapters. Differences in the methods are summarised below in figure 7:
Figure 7: Differences between the two methods of delayed luminescence.
Meluna: delayed luminescence Kwalis: spectral range luminescenceor fluorescence-excitation-spectroscopy
measured part of the apple 2 disks from the inner applefrom both the blushed and theshaded side (2x)
whole fruit in the skinat 4 sides (4x)
repetitions 10 apples 12 applescolour of excitated light white (in 2 intensities) 8 colours from the light spectrumduration of measuring luminescence 3 to 200 sec 1 to 50 sec.presented values • emission at t=3 sec (for
metabolic energy)• lag-time, figure determining the
form of the hyperbolic curve
• % yellow/blue• emission of all 8 colours/blue
15.1 Delayed luminescence by Melunawritten in co-operation with Roel van Wijk
BackgroundMeluna characterises the development of a plant or an organ as the co-operation between two forces: a forceforming mass through metabolic activity and a differentiating force for compartmentalisation and order.A compartment is then defined as a part of the whole with a specific (different from the whole) composition,structure and/or function. The increase in size or mass of a compartment during development might also bedifferent from the increase of mass and size of the whole.When the metabolic activity decreases, more energy is stored in the differentiated structure via an integrationprocess. Fully ‘integrated’ is the situation with a maximum order together with the highest metabolic energy.Because of the similarity in thinking with the concept described in §1 and §20, we expect a good alignment inthis work which appears in the discussion indeed.
Long-term delayed luminescence, which can be detected with sensitive light detecting devices, presentsinformation about the energy-storage capacities of apple flesh. The characteristics of this energy-storage capacityare derived from the shape of the curve representing the delayed luminescence. A high start after 3 second (t=3-value) means a high metabolic activity. A real hyperbolic decrease in luminescence is found in a welldifferentiated situation and is expressed as a low ‘lag-time’ in the curve, see example in annex 18.

J. Bloksma, M. Northolt and M. Huber, Louis Bolk Institute, 200170
Input of energy is obtained by excitation with two different protocols, differing in intensity and duration of theexcitation, high intensity and short: ‘flash’, and longer with a low intensity: ‘LED’. The use of this variation inexcitation conditions increases the probability to detect differences, but in this case the results were the same andonly the results obtained with LED are shown in the figures.
MethodMeasuring 5 to 6 flesh repetitions/apple of 10 to12 individual apples takes 3 days. On each day measurementswere performed for maximally 12 hours, during which 3-4 apples per treatment were tested.
Sample preparationFor the present studies, apples were kept in the dark at room temperature for at least 30 minutes. The subsequentsampling of the flesh of the apples was performed at a very low light intensity. The procedure for samplepreparation was as follows.Each apple was judged for its most red-coloured and most green-coloured side. These two areas were selected forsampling by cutting the selected convex disks (slices) at a diameter of approximately 5 cm (with a maximalthickness of 1.5 – 2 cm). The centre part of each disk was used to prepare a smaller (3 cm diameter) disk and theskin side of this disk was removed. This resulted in a draughts-like disk (3 cm diameter; 1 cm thick). This disk wasplaced in an aluminium foil-coated petri-dish of 3.3 cm diameter with the former skin side facing upwards. Thesample contained neither skin nor core parts. Each disk was prepared in this manner immediately beforemeasurement.
Excitation protocol of delayed luminescenceIn the first set-up the sample is illuminated with a very high intensity source (xenon flashlight X-3644; 25 Wattseconds) situated 43 cm above the sample, and parallel to the photomultiplier tube. In the second type ofexcitation the sample was illuminated at a moderate light intensity with a LED (white light LED type 5 mm;Conrad Electronic) for 1 minute. The LED illumination source is also situated 43 cm above the sample, andparallel to the photomultiplier tube. Immediately after illumination, the sample was transferred under thephotomultiplier.
Measurement of delayed luminescenceDelayed luminescence was measured in the period from 2 seconds to 200 seconds after illumination with a dwelltime of 0.2 sec. The luminescence was measured with a photon counter, which was equipped with a HamamatsuR550 photomultiplier tube (spectral response 280-850 nm, 1.5 kV) kept at –20oC.Standard high performance photon counting electronics consisting of a low-noise pre-amplifier, amplifier,discriminator and rate-meter were used. The petri-dishes containing the samples were situated in themeasurement chamber, with the sample approximately 6 cm below the photomultiplier window.
Analysis of luminescence decayThe variety of curves representing delayed luminescence suggests that the decay of luminescence cannot besufficiently described by a simple exponential curve. Some curves can be described by a simple hyperbolical curve.However most curves are composed of two hyperbolic parts and a transition between these two parts.
Since each measurement consists of the counts in a fixed, 50 m sec. period, the log-log plotted scale of the graphcauses the individual measurement points to deviate relatively more in the tail part of the curve than at the startof the measurement. In order to minimise the deviation in the data points, the total measurement time wasdivided in such time periods that the average value of the logarithm of the time points is equally distributed onthe time axis, with the exception of the first measured values. This reduces the number of data points from 1000to 68. The number of photons in these time intervals was averaged. In this way the relative standard error of themean of the data points over the measured time range is almost equal. Examples of curves are presented in annex18.
In order to describe two hyperbolic parts and the transition, the log-log plotted delayed luminescence curvesobtained after excitation by ‘LED’ and ‘flash’ are characterised by six parameters.1. Initial slope (‘Slope A’): The initial slope of the log-plotted curve.2. Final slope (‘Slope B’): The final slope of the log-plotted curve.

Parameters for apple quality and an outline for a new quality concept, part 1. 71
3. T=3 sec emission (‘t=3 sec’): emission measured at 3 sec after illumination. A higher emission indicates ahigher metabolic energy.
4. T=200 sec emission (‘t=200 sec’): emission measured at 200 sec after illumination.5. Transition (‘Apparent lag time’): time that extrapolation of the final slope reaches the 3 sec value. A lower
lagtime is indicative of more differentiation.6. Hyperbolic character (‘Degree of hyperbolic decay’): The reverse of the calculated deviation from a hyperbolic
curve. High hyperbolicaly closely resembles the ‘lower lag time’ condition and indicate, at least for apples, ahigh energy’s storage capacity.
Parameters 3 and 5 are thought to be the key parameters in the two life processes and are presented in figures inthis report.
Results Delayed luminescenceSee annex 11 for results.
A: RipeningIncreasing ripeness is reflected in the steadily decrease of the emission after 3 seconds and the steadily increase ofthe hyperbolicallity of the curve (inverse lag time). It is interesting to note that all points given in the table andgraphs are average values obtained from two sites of 10 apples. Particularly at the ripest stage, A5, manyindividual apples showed a real hyperbolic curve. Apples with the condition that luminescence is largely decreasedand hyperbolicallity is lost were not seen in this series, so we saw no overripe apples.
B: BearingIncreased bearing is reflected in the steadily increase of the emission after 3 seconds and the steadily decrease ofthe hyperbolicallity of the curve.
C: LightThe emission after 3 seconds decreases a little with more sun and the hyperbolicallity of the curve (inverse lagtime) is relatively high. However no consistent relation is observed between the hyperbolicallity and lightcondition. The exception is the sample grown in the shadow with preparations (C3). We have to do with anunexplained effect.The decrease in emission at 3 seconds is in line with the expected higher degree of ripeness in the sun. Thedecrease of hyperbolicallity is contrary to what we expected for growth in the sun and for this we have noexplanation.
C: PreparationsThe emission after 3 seconds increases a little with preparations and the hyperbolicallity of the curve decreasesmore with sunny and half sunny-grown apples. Also here the exception is the sample grown in the shade withpreparations (C3). The decrease of hyperbolicallity is contrary to what we expected for preparation treatment andfor this too, we have no explanation.
D: Shelf lifeA longer shelf life is reflected in the slight decrease of the emission after 3 seconds and a maximumhyperbolicallity of the curve in the apples 4 days out of storage (D3).
DiscussionRelations between delayed luminescence and other parametersEmission at 3 seconds is correlated with many parameters. First a positive correlation with the group ofparameters related with unripeness like firmness (r2=0,51), starch (r2=0,49); Streif-index (see annex 14.3.22;r2=0,73); acid (r2=0,48); crispness (r2=0,27); non-mealiness (r2=0,30), rawness (r2=0,27), pH (inverse r2=0,44),blush (inverse r2=0,40) and dry matter (inverse r2=0,66).We also found positive correlations with aspects we usually find in more ripened fruit like sweetness (r2=0,47),general appreciation (r2=0,31), P-value (r2=0,28) and Bovis (r2=0,26). Unexpectedly we found negative

J. Bloksma, M. Northolt and M. Huber, Louis Bolk Institute, 200172
correlations with electrical resistance (r2=0,23), Brix (Brix-2; r2=0,55), differentiation and integration incrystallisation (resp. r2=0,30 and r2=0,28).Emission at 3 seconds is positively correlated with the other delayed luminescence parameters like hyperbolicallity(see annex 14.3.23: ‘inverse DL-lagtime’ r2=0,56) and yellow/blue ratio in spectral range luminescence (see annex14.3.12; r2=0,68).
The hyperbolicallity of the delayed luminescence (inverse DL-lagtime) is negatively correlated with only a fewparameters: calcium (see annex 14.3.26; r2=0,51), redoxpotential (Eh: r2=0,32), P-value (r2=0,28) and emission at3 seconds (DL t=3, r2=0,56) and negatively correlated with dry matter (see annex 14.3.25; r2=0,68) anddifferentiation and integration in crystallisation (resp. r2=0,30 and r2=0,45).
Relations with growth, differentiation and integrationMeluna assumes the ‘emission of biophotons at 3 seconds’ to be a measure for ‘metabolic energy’, the driving forcefor both growth processes and differentiation processes, a potential (or vitality) for both growth continuance andfor differentiation, maintaining structure (or in other words preventing disintegration).We recognise this assumption in these apple series in the phenomenon that correlations are found with bothprocesses indeed. We see a decrease when this energy is used in the ripening process (found in the later picked inseries A, the lowest bearing of series B and in the sun in series C) or in the ageing process (series D).
Meluna assumes the hyperbolicallity to be a measure for the ratio between growth and differentiation processes ina way that a high hyperbolicallity (=low lagtime) indicates more differentiation and a low hyperbolicallity (=highlagtime) is indicative of more growth. Looking at the correlations we recognise this in correlations with inverseredoxpotential (P-value too) and differentiation in crystallisations (both assumed to be differentiation parameters)and dry matter (assumed to be a growth parameter). Regarding the series we found a switch from growth todifferentiation in series A with increased ripening, in series B with lower bearing and in series C with more sun allas is expected.
Proportion of metabolic energy versus the differentiation/growth ratioThe ripening process in series A is illustrated by the lower availability of metabolic energy and its use fordifferentiation, see figure 8. Increase in tree load in series B is illustrated by higher availability of metabolic energy(for growth) relative to its (lower) use for differentiation. At first the apples from low bearing trees wereinterpreted only as riper, but considering the decreased starch levels (annex 3.3) we only slightly can explain this
f igure 8 : Combinat ion of both measurements in de layed luminescence by Meluna
2,8
2,9
3,0
3,1
3,2
3,3
3,4
3,5
3,6
1 , 0 01 , 0 51 , 1 01 , 1 51 , 2 01 , 2 51 , 3 0
inverse ' lag t ime' for rat io dif ferentiat ion/growth
'em
isso
n t=
3 se
c' fo
r met
abol
ic g
row
th A: r ipening
B: bear ing
C: l ight without prep
D: shelf l ife

Parameters for apple quality and an outline for a new quality concept, part 1. 73
aspect. Apples from low bearing trees are full of sugar, so it might be suggested that under this condition arelatively high availability of metabolic energy is combined with a relatively high degree of differentiation.The more sun-exposed apples in series C are characterised as having less metabolic energy and more use fordifferentiation. Preparations induce the apple’s vitality and delay the differentiation. In series D we found a nick inthe figure, possibly explained by a loss of metabolic energy and a need for further ripening (differentiation) ontothe fourth day (D3) and after that a loss of differentiation/structure as a start of disintegration (D4, D5).
Another remarkable thing is to find two main lines, one for series A and D and one line for series B and C. We canunderstand the lower metabolic energy in A+D from the fact that these apples are stored for a varied length oftime or used their metabolic energy during the ripening process (series A and D are slightly riper than series B andC). Series C is overall high in metabolic energy and low in differentiation/growth. A possible explanation for this,is that series C is the only fertilised series.
Looking at the A- and D-lines, It is surprisingly how well the D1, D2, D3-samples of ripening in January afterstorage fit in the line between A1 to A5 of the ripening process in September. That means that a 3 months storedapple after 5 days of shelf life (D3) is quite similar to an apple freshly picked but one week over due in September(A5). Another interesting thing is that D1 and D2 differ in a 3 months storage period, while no difference in theratio differentiation/growth is found. However there is some decrease in metabolic energy. After the maximum indifferentiation is reached at D3 we see a turn with a slight revival in metabolic activity before breaking down as isfound in many ageing products.
15.2 Spectral range luminescence in flesh and seeds by Kwaliswritten in co-operation with Jürgen Strube
BackgroundThis method measures the delayed luminescence after excitation. Measurement is performed for 7 excitationcolours plus white instead for white only. So the spectral range is used to excite samples and fluorescence-excitation-spectroscopy is an adequate description reflecting what is done.Basis for the rating of samples is a proved theoretical concept [Strube 1998, Strube 1999, Strube 2000]. Thisconcept relates spectral data to plant properties. The concept has two foundations, primarily measuredphenomena and in addition Popp’s theory of cell communication.The basic phenomenon is shown by a green plant versus a chemical. A green plant shows a broad excitationspectrum, a chemical shows response only after blue excitation. This can be explained, as to photosynthesis ofgreen plants contributes the whole spectrum of light. Chemicals show only the normal fluorescence excited byblue and uv-light. The excitation spectrum of dormant seeds is in between, a broad spectrum as green plants have,but with its maximum after excitation with blue light [Strube 1998]. So, in general samples can classified asvegetative (when related with broad spectrum) or seed-like (when related with spectrum less broad or evenconcentrated on blue).Popp’s theory of cell communication assumes best conditions of life when the inner structure of living mattercommunicates equally on all frequencies, that means all modes of structural resonance are present. That meansbest differentiated structure is followed by broad resonance. And indeed fluorescence-excitation-spectroscopyshows a broad excitation range with maximum at red-green-yellow for ripest apples. Dormant seeds showrestricted resonance as vegetative activity and cell communication is on minimum.Basis for the evaluation are pilot studies with leaf crops, beans and other seeds. The method was mainly used totest seeds [Strube 1998, Strube 1999, Strube 2000]. Broad spectral range excitability correlates with a vegetativecharacter, narrow spectral range excitability with a seed-like character.Fruits and seeds of the same fruit were investigated at these apples the first time. The expectation was that bestapple flesh will have the maximum red-yellow-green response related to blue and corresponding the apple seedswill behave most seed-like for ripest apples (reduced red-yellow-green values related to blue).So this method is expected to give information about the most fruit-like character of apple-flesh and the seed-likecharacter of apple seeds. The method is expected also to show ageing, but this was not applied during this study.

J. Bloksma, M. Northolt and M. Huber, Louis Bolk Institute, 200174
MethodIn this report a brief description is given as an easy overview. A more extended description is provided earlier[Strube 1999, Strube 1998, Strube 2000]. The excitation spectra used for the analysis are derived by exciting asample using subsequently light of various wavelengths (colours) and measuring the total emission. The samplereacts to the various excitation colours with an afterglow of different intensity and duration (fluorescenceexcitation spectroscopy). The red-yellow-green range is compared to blue.
Measuring equipmentThe device used for fluorescence measurement basically consists of a chamber impervious to light in which thesample is placed. A shutter similar to those of a camera allow the sample to be illuminated for limited periods oftime (5 s) by means of a 150 W tungsten lamp, a set of commercial colour filters (Schott) and collimating lenses(sample distance 25 cm). Excitation is followed by the subsequent (0,2 s dwell time) measurement of the inducedlight by two photomultipliers (EMI 9558QA cooled to –28°C) highly sensitive in the 190-850 nm range with aresponse according to S20 cathode (EMI). The measurement position is turned 90° from excitation direction. Forthe principal arrangement see figure in Annex 16. Standard single photon counting electronics is applied.
Excitation and measurement protocolThe typical time course of measurements is depicted in the following chart (annex 17). First the sample isilluminated for 5 sec by coloured light. During the following measurement phase, the emission radiated by thesample becomes continuously weaker.With apples, the time required for the emission to reach a constant level recedes at a significantly slower pacethan illustrated in annex 17. As shown by preliminary analyses, an adequate measuring period was 50 secondswith 500 msec counting period time. For apples the mean of the luminescence from the 30th to the 50th second(40 count intervals of 500 msec) is designated as ‘R40’.Excitation and measurement is repeated for each colour 5 times. 7 colours and white are applied, so 40 sequentialexcitations and measurements are performed during one measurement sequence. The colour sequence is dark-red,red, light-red, yellow, green, blue, uv and white, using standard colour filters from the Schott Co.
Measurements with apple fruitSamples were stored in a refrigerator at 5 (+/-1) °C. They were removed from the refrigerator 12 hours prior totesting, stored at 15 (+/-2) °C and subsequently measured also at 15°C.Each apple was tested as a whole from 4 different sides (90° rotation). Since each sample consisted of 12 apples,there were 48 individual measurements of 8 colours conducted on each sample.
Measurements with seedsThe drying process of the fresh seeds necessary prior to measurement took some 2-3 months. Drying was attemperature of 15°C (+/-2°) in the presence of silicagel. The seeds of the 12 apples of a sample were measuredtogether. Each sample was measured 8 times at the same colour with different filling arrangement to involve mostof the surface of the seeds. As for flesh 8 colours were measured.
Collected dataAfter each excitation the complete response for 50 sec in 500 msec intervals was collected and stored.
Calculated dataResponse of same excitation colour was averaged point by point forming the averaged response of the 5excitations. Parts of the response are designated as follows:• Mw1 Mean of first reading following excitation (highest response value).• R40 Mean of the readings from the 31st – 50th second (mean of 40 values).• R80 Mean of the readings from the 11th – 50th second (mean of 80 values).
Above data are absolute values. In order to become independent of the sample’s physical size (e.g. size of anapple), normalized data are calculated by dividing the response of each colour by response of white (Mw1%w,R40%w, R80%w) or by response of blue (R40%bl, R80%bl).• Mw1%w Like Mw1, however a relative spectrum based on white light.

Parameters for apple quality and an outline for a new quality concept, part 1. 75
• R40%w Like R40, however relative spectrum based on white light.• R80%w Like R80, however relative spectrum based on white light.• R40%bl Like R40, however relative spectrum based on blue light.• R80%bl Like R80, however relative spectrum based on blue light.
According to Popp the curvature of the response curve is of particular importance in evaluating coherent systems[Popp 1986, Popp 1993]. The curvature is evaluated by calculating the quadratic difference between responsecurve and the best possible hyperbola and between response curve and the best possible exponential referencecurve. The quotient of the square differences is designated Chi E/H. Small values (below 1) correspond to anexponential course of the curve, values greater than 1 correspond to a more hyperbolical curvature.• Chi E/H 25 Coefficient of the curve's course calculated over seconds 1 – 12,5.• Chi E/H 50 Coefficient of the curve's course calculated over seconds 1 – 25.• Chi E/H100 Coefficient of the curve's course calculated over seconds 1 – 50.
Analysis of dataSpectra of R40%bl reflect all information needed to discriminate between fruit-like and seed-like as mentionedabove (see ‘background’). The very similar R80%bl spectra reflect same information but may be helpful for kindsof samples not measured before (in case of different response timing).Spectra of Mw1 relate to ageing of apples. Ageing was not investigated during this study. In addition Mw1 has aweak correlation to seed-character.In general Chi E/H 50 correlates weak to R40%bl. For flesh of apples also a strong correlation can occur.In order to reflect the character of a sample in one figure, yellow/blue ratio of R40 may be used (that is ‘yellow’bar out of spectrum R40%bl).
Results of measurements are presented as spectra for R40%bl and as data table. For ease of evaluation alsographs of yellow/blue ratio R40 are provided, see annex 12.
Evaluation of samplesHigh values of yellow/blue R40 indicate most fruit-like apples. Low values of yellow/blue R40 indicate mostseed-like kernels.
StatisticsFrom the 8 x 48 individual measurements, the mean values and mean-value standard deviations were calculatedand depicted in graphs for each of the respective testing parameters.The differences between any two samples were tested for their significance using the two-sided t-test (usingGraphPad).For this study, all parameters were calculated possibly capable of providing statements. In order to maintain thesimplicity of the overview, only a selection is illustrated. All data can be provided on request.
Results for flesh and seedsSee annex 12 for results.
A: RipeningThe increase of ripening correlates significantly with the decrease of the broadness of the excitation spectrum. Thismeans that for the whole apple higher values at red, light-red and yellow in relation to blue were found. Thebroadness of the spectrum is expressed in the figures in annex 12.4 in the yellow/blue ratio, and gives an equalline for red, light-red and yellow. So, in the ripest apples the highest yellow/blue ratio is measured in the wholefruit and the lowest in the seeds.
C: Light exposureThe light exposure of apples correlates also significantly with the broadness of the excitation spectrum. A highyellow/blue ratio is measured in the apples exposed to sunlight, lowest values are measured in apples grown inthe shadow. This is also valid for apples with and without bd-field preparations.

J. Bloksma, M. Northolt and M. Huber, Louis Bolk Institute, 200176
Because of too little seeds in series C (only 20 from 10 apples), there is no data on the seeds.
C: Bd-field preparationsThe influence of Bd-field preparations is also reflected in the broadness of the excitation spectrum. A higheryellow/blue ratio is measured in the apples with preparations under sunlight and under half-shaded conditions.The inverse effect was found for the apples grown under shaded conditions.This effect is also reflected by a lot of the other methods, as is seen in annex 15 and §19.4
Discussion
Relations between spectral range luminescence and other parameters:The yellow/blue ratio in spectral range luminescence is clearly correlated with many ripeness and/or sunparameters: we found negative correlations with firmness (see annex 14.3.28; r2=0,57), starch (see annex 14.3.29;r2=0,95), Streif-index (see annex 14.3.27; r2=0,89), acid (see annex 14.3.31; r2=0,89), rawness (r2=0,59), mineralsN,P,K and Mg (r2=0,71-0,90; see annex 14.3.32 and 14.3.39), proteins (see annex 14.3.34; r2=0,67), free aminoacids (see annex 14.3.33; r2=0,64) and positive correlations with blush (r2=0,75), Brix (see annex 14.3.30;r2=0,69), sweetness (r2=0,38).Positive correlations are found with Brix/N-ratio (r2=0,86), protein ratio (see annex 14.3.40; r2=0,63), crispness(see annex 14.3.35; r2=0,59), DL-emission at t=3 (see annex 14.3.24; r2=0,68), electrical resistance (see annex14.3.36; r2=0,63) and a negative correlation with disintegration (r2=0,45). Only a weak positive correlation isfound with the Bovis-value (see annex 14.3.37; r2=0,23).
Relation with growth, differentiation and integrationKwalis assumed the yellow/blue ratio in spectral range luminescence to be a parameter for fruit-character and‘being alive’. In our quality concept this is at the level of integration. Thus, the clear correlations with protein ratio,electrical resistance, disintegration and Bovis are expected. As expected the ripening series and the sunnier grownfruit from the light-exposure series, have an increasing amount of ripe fruit (see annex 12.3).
The concept ‘fruit-like’ and ‘seed-like’.This data fits perfectly in the context of the preliminary spectral range luminescence measurements of leaves,seeds and chemicals. Living plants are open to the full spectrum of sunlight. This openness is measured as lightemission especially after excitation with the colours red, light-red, yellow and green to which dead chemicals reactvery weakly. This is valid only for plant leaves and fruit. For seeds the inverse is found. So a broad spectrum in red,light-red, yellow and green is called ‘fruit-like’ and a narrow spectrum around blue, ‘uv’ and white is called ‘seed-like’ (see annex 12.4).
In this context the flesh of riper apples is characterised to be more fruit-like than the unriper ones andcorresponding the seeds from riper apples are more seed-like. This is reflecting clearly the inner differentiationwhich is part of the new quality concept.
In addition, apples grown in sunlight have to be characterised as more fruit-like than shadow grown apples. Dataalso show that Bd-field preparations result in apples which are more fruit-like. The influence of sunlight seems tobe stronger than the Bd-field preparations. This is suggested by the fact that full sunlight results in apples that aremore fruit-like than half-shadow grown apples with Bd-field preparations with respect to the measured data.
Fruit and seed are polarThe same experiments showed that polar phenomena arise for seeds on the one hand and leaves on the otherhand. The more plants are being investigated, the more it becomes a general phenomenon that seeds can beconsidered of a better quality if they emit little after red, yellow and green light excitation. From this point of viewwe tried successfully to interpret the results of the coded samples of apples (and samples of beans and Calendulain other studies). In §2.1.7 the polarity between seeds and fruit flesh has already been seen in other parameters.
This is important for methodological reasons but it also has practical implications. It can be interpreted that a very

Parameters for apple quality and an outline for a new quality concept, part 1. 77
ripe apple with the highest quality of flesh also contains the best seeds. So there is no contradiction between thevegetative and reproductive parts. A contradiction may arise, when fertilisation is achieved in a different way.Then the vegetative development may be stimulated solely. This is an intriguing research question that should beaddressed. Application of Bd-field preparations has a harmonious development (in a vegetative and reproductivesense) of the plant as goal and in this case it was achieved.
Supplementary data and method improvementJust for completeness and not for regular evaluation chi-e/h-values (degree of hyperbolic decay) were calculatedin addition for all colours, see annex 12.2. This shows that mainly ‘white’ values correlate often with the R40%blor R80%bl values. ‘Blue’ and ‘uv’ values have an even better correlation. The R40%blue figures give the samepattern as Meluna’s lagtime.The question arose whether only the red skin of the apples was measured, which correlates with ripeness. Perhapsthis may be also the fact, however, the seeds show the same ripeness order and so do the slices measured byMeluna. Kwalis measurements performed on some pealed samples of apples showed the same spectralcharacteristics as whole apples. So there are some aspects strongly supporting the concept, that structuralbehaviour is measured.
Normally seeds are measured in an amount greater than 100 seeds per sample. The measuring-technique forseeds has been improved for samples with fewer seeds for this apple project. It was possible to obtain results with36 seeds per sample from ripeness series with a special seed holder, but the only 23 seeds per sample from thelight series was beyond reliable measurement levels.

J. Bloksma, M. Northolt and M. Huber, Louis Bolk Institute, 200178
16 Electro-chemical parametersThis is an experimental parameter to learn about properties as vitality, structure and ageing.This chapter is written in co-operation with Hartmut Heilmann.
BackgroundLife processes in plants and animals can be described as chains of electro-chemical or redox reactions. Vincent(1955) developed a bio-electrical theory to derive an electrical energy value of food from measurements of pH,redox potential and electrical resistance of a watery solution of the food. He suggested that food with highreducing power, later expressed as low P-value (as a combined parameter of the three mentioned parametersabove), was health promoting. Later, M. Hoffmann (1988) analysed different products and determined factorsinfluencing the P-value. In studies with J. Streif, he found that a low P-value correlated with a high apple quality.Harvest time and storage had a profound influence on the P-value. The P-value and apple quality could beinfluenced by soil fertility and application of different types of fertilisers (H. Keppel, 1998).
PH-Value (acidity)The pH-Value is the best known electrochemical parameter, and is used to measure the acidity. The pH ismeasured by potentiometry using suitable electrodes. The measured mV value is logarithmically transformed tothe pH-Value. The potentiometric equilibrium is at pH 7, and 0 mV. A difference in pH of 1 (at 25°) equals 59mV. In plants proton activity reflected in pH has energetic aspects. Plant cells push protons into the cellular lumenand use the proton motive force to generate ATP in the cell membranes (Mengel 1991). So, the consumption ofprotons and increase of pH means a loss of vitality (Stoll 1997, Kinzel 1989).
RedoxpotentialThe redoxpotential is of central interest for electrochemical research because it reflects the gradient of electronswhich life processes utilise for their cellular work (Kollath, 1978). The redoxpotential can be determined withsuitable electrodes of gold or platinum; Heilmann’s laboratory prefers gold. The redoxpotential represents therespiratory equilibrium between oxidising and reducing substances in a liquid milieu. When the energetic power ishigher (the redoxpotential is low), plant cells can use more free enthalpy for their activity. Such plants conveymore to the consumer’s organism. As this is the aim, decrease of the energetic power is looked upon asdenaturation (Kollath, 1987).
Redoxpotential as Eh [in mV]Traditionally the flow of electrons was considered to be the main respiratory energy transport in an organism.Oxygen is the terminal electron acceptor.Eh = Eho + Eref
Eho is the read off value of the potentiometer.Eref is the tension of the reference electrode.Eh‘ or rH is Eh with pH-correction to pH7.
rH = 2 Eh/ E (Nernst) + 2 pHEh‘ = Eh + (pH – 7) x E (Nernst)
Eh‘ = (rH/2 – 7) x E (Nernst)
E (Nernst) is the Nernst-factor of 59,1 mV (25°C)
The Electrical Resistance R [in Ω]High values of electrical resistance indicate that electrolytes and other cellular ions are more integrated inmembranes and cell organelles. Low values indicate free-moving electrolytes, which might be a sign ofdeterioration of plant cells and tissues. The conductivity G [mS] is the inverse of R.
P-value as measure of dissipation [in µW]The P-value is used to determine the tendency of an organism to dissipate its energy. High values represent themost probable state of higher entropy, low values show low entropy. It takes into account the gradient of the

Parameters for apple quality and an outline for a new quality concept, part 1. 79
redoxpotential and the role of the electrical resistance.P = Eh2 / R
In the 8Th Congress Electrochemical Quality Research, Vienna 2001, a modification for energy dissipation wassuggested (Heilmann 2001).
DP = (Eh‘)2 / RIn the DP, the pH value is taken into account. The data were presented also according to this aspect and will bediscussed. In each case lower values of P or DP of food are considered as of higher value.
Aim of electrochemical researchThe pattern of energy regulation is based on experiences with food like water, vegetables, fruit, potatoes andgrains. The thermodynamic question is: how does the organism deal with its energy flow? Which level of entropycan it maintain? The aim is to characterise the pattern of energy loss or maintenance of entropy level. Higher Pand DP values can be interpreted as more openness, while lower values are a sign of ordering or coherence.
Healthy legumes, fruit and grains usually show low levels of entropy. In a comparative examination of seven pairsof organic and conventional products, the organic products had lower P-values than the conventional products(Heilmann & Hoffmann 1995). Products not yet ripe or infected with a parasites had higher P-values.
MethodPreparing juiceEach sample consists of 10 unwashed apples. In series D some apples were damaged by transport and were sortedout (maximum 3/sample were damaged). The apples are cut into quarters, the inner part is cut away, becausethis is not consumed. Juice is collected from 7-10 apples with a household device. The juice is left to settle forabout 5 minutes until the foam floats on top and clear juice can be taken for analysis. The juice was notcentrifuged because the juice separated nicely.
Preparation of electrodesThe redox-electrodes are adapted to the specific range of work. For apples they are put into freshly prepared applejuice for some time. The pH-electrode is calibrated with pH 7 and pH 4,01 buffers. The electrode for electricalresistance is checked monthly.
MeasurementsThe juice is made successively and measured immediately after preparation. Usually 3-5 measurements areperformed, calculations are made and converted into graphs.
ResultsResults are presented in annex 13. Because the juice is obtained from a mixed sample of 7-10 apples, nostatistical significance can be calculated.
A: ripeningThe pH stays constant and increases from the 4th picking date onwards. The redoxpotential decreases firmly toincrease a little on the latest picking date. The resistance stays constant and decreases on the latest picking date.The P-value reflects mainly the trend of the redox . The trend of the P-value in the ripening series is similar to whatis found in previous ripening series (Streif 1996, Hoffmann 1997).
B: bearingBearing has no effect on the pH and is remarkably low compared to the other series (no explanation). Theresistance increases in the first three bearings. The redoxpotential and P-values are constant except for the secondbearing, which gives higher values. Transport damage might be an explanation for this, although the outcome ofother parameters did not show such exception in series B.

J. Bloksma, M. Northolt and M. Huber, Louis Bolk Institute, 200180
C: lightThe pH is constant. The resistance generally increases with more light, and the shaded-grown apples withoutpreparations have a somewhat higher resistance. The redox-potential and P-value clearly decrease with increasinglight.
C: preparationsThe pH is constant. In apples with preparations, the resistance in (half) sun is slightly higher, this is also found forthe redoxpotential and the P-value. This was not expected. Heilmann interpreted this as increased ripeness due topreparation usage. This, however is not supported by other parameters.
D: shelf lifeThe pH shows a large increase which is a logical continuation of series A. The resistance shows a maximum after 4days of shelf life and afterwards decreases a little. The redoxpotential and P-value also increase with a longer shelflife, as was expected from earlier experience with fruit.
Discussion
Acidity (pH)Relations between acidity and other parametersAcidity (pH) is correlated with many other parameters that have to do with ripening and ageing. In theseprocesses the pH increases (=less acid). So as expected acidity is negatively correlated with firmness (r2=0,68), acid(r2=0,53), vitamin C (r2=0,59), sourness (r2=0,63), crispness (r2=0,56), and juiciness (r2=0,48), rawness (r2=0,35),DL-emission at t=3 (r2=0,44). Acidity is weak negatively correlated with general appreciation (r2=0,27), aroma(r2=0,21) and Bovis-value (r2=0,38) and positively correlated with calcium (r2=0,48), nitrogen (r2=0,77),magnesium (r2=0,75), disintegration (r2=0,54), Brix-2 (r2=0,29) and electrical resistance (r2=0,23). We cannotexplain the positive correlation with the minerals and resistance. The others fit into the quality concept, see below.
Relations with growth, differentiation and integrationFor fruit like apples, acidity can be seen as a growth parameter, as a potential for further ripening, as is illustratedin the negative correlation with many ripeness parameters. In ageing in series D the fruit looses its vitality, the pHincreases and so the basis for integration decreases, as is illustrated in negative correlations with taste, Bovis-value, and the positive correlation with disintegration.
Redoxpotential (Eh)Relations between redoxpotential and other parametersRedoxpotential (Eh) is correlated with only a few parameters: weak positively with DL lagtime (r2=0,32) and weaknegatively with differentiation and integration in crystallisations (r2=0,22 and 0,31). Because of the P-valueformula a high correlation with the P-value is expected (r2=0,92, see annex 14.3.43).
Relations with growth, differentiation and integrationIn series A and D we saw the redoxpotential decreasing heavily during ripening and increasing a little during over-ripening and ageing. Heilmann’s assumption of the redoxpotential being a parameter for order, together with thecorrelations with a number of differentiation parameters, suggest that the redoxpotential is a differentiationparameter. In these results we also see the ability to show the loss of structure in over-ripe fruit, which is an aspectof integration.
Electrical resistance (R)Relations between electrical resistance and other parameters:Resistance (R) is negatively correlated with parameters like firmness (r2=0,50), starch (r2=0,55), acid (r2=0,74),Streif-index (r2=0,69), vitamin C (r2=0,66), sourness (r2=0,28), rawness (r2=0,57), astringent taste (r2=0,33),phosphate (r2=0,65), protein and free amino acids (r2=0,84 and 0,85), DL-emission at t=3 (r2=0,23). Positively

Parameters for apple quality and an outline for a new quality concept, part 1. 81
correlated with blush (r2=0,60), potassium (r2=0,67), protein ratio (r2=0,85), yellow/blue ratio in spectral rangeluminescence (r2=0,63; see annex 14.3.36), and has a weak positive correlation with dry matter (r2=0,25),phenolic compounds (r2=0,38) and pH (r2=0,23).
Relations with growth, differentiation and integrationIn series A and D we saw the resistance slowly decreasing during the last phase of ripening and ageing. Sun andpreparations in series C and the higher bearing trees in series B gave the highest resistance. Considering this, weexpected electrical resistance to be an integration parameter. This is supported by good correlations with otherintegration parameters like the yellow/blue ratio in spectral range luminescence and protein ratio.In series B and C the overall level is lower than in series A and D. The same difference in overall level we see inripeness (A and D are riper) and in the DL-emission at t=3 (A and D have less metabolic energy). So this suggestsa certain amount of differentiation is obliged for this integration process, and so electrical resistance is adifferentiation parameter too.
P-valueRelations between P-value and other parametersThe P-value is correlated very strongly with the redoxpotential (Eh: r2=0,92; see annex 14.3.43). This is what weexpected as the redoxpotential plays a severe role in the P-value-formula.The P-value is slightly positive correlated with blush (r2=0,23), nitrogen and phosphate (r2=0,39 and 0,51), DL-emission at t=3 (r2=0,28), and DL-lagtime (r2=0,28). The P-value is slightly negative correlated with differentiationand integration in crystallisations (r2=0,32 and 0,33; see annex 14.3.43 and 14.3.47).
Relations with growth, differentiation and integrationBecause of the close relation with the redoxpotential we expect the P-value also to be a differentiation parameter.Beside that we recognise also growth aspects (pH) and differentiation (Eh) and integration aspects (R) the P-value-formula. From the concept we expect ‘dissipitation’ as an inverse parameter for integration, but in thecorrelations we found aspects of all three levels. For our quality concept a complex parameter like the P-value fordifferentiation and integration will give additional information when we use the separate aspects (pH, Eh, R)apart from each other.

J. Bloksma, M. Northolt and M. Huber, Louis Bolk Institute, 200182
17 Bovis-valueBovis is an intuitive measurement-scale for vitality made by Mr Bovis. It is performed by trained people whoregularly calibrate each other, making it inter-subjective. This method has its meaning only when you know thepeople who are doing it and their integrity, their skill to concentrate and attentively connect with the object. This isnot a parameter we expect to make objective in the way of independence of the observer and it is added as anexperimental parameter to get an idea of its worth .
MethodPeople concentrate on the energy flow coming up from the earth and the flow going down to the earth throughthe apples, and the amount of both flows is counted in Bovis. This can be a parameter for the ‘integration’ aspectof quality.For food the interpretation is: <3000 causing illness; 3000-6500 unhealthy; 6500-7000 neutral; >7000 healthsupporting. Here we present in kilo-Bovis to avoid big numbers.Joke Bloksma performed the Bovis blindly (i.e. without knowing the treatment) . This quick measurement was alsoused to check the similarity of the sub-samples before sending them to the various partners and was performed onat least 4 sub-samples.
ResultsThe results are shown in annex 4 as kilo-Bovis.
A: ripeningThis series shows no clear difference in Bovis-value with increased ripeness. Picking date 4 has the onlydistinguishable higher value and the last picking date is again lower, possible due to over-ripeness.
B: bearingThe different bearings have a rather constant Bovis-value, a decrease is found with the highest bearing(overbearing?).
C: lightIncrease in light-exposure shows a large and consequent increase in Bovis-value, both with and withoutpreparations.
C: preparationsApples with preparations show a slight increase in Bovis-value, but only significantly higher in full sunlight.
D: shelf lifeIn storage and shelf life period the Bovis-value decreases sharply. After 4 days of shelf life the Bovis-value dropsbelow the value that is said to support human health.
DiscussionVery important for the Bovis-value is the maturation in series D, but also optimal picking date, sun andpreparations have effect.

Parameters for apple quality and an outline for a new quality concept, part 1. 83
Relations between Bovis-values and other parametersBovis-value is strong positively correlated with general appreciation (r2=0,88; annex 14.3.9 and with many aspectsof taste: crispness, juiciness, sourness and aroma) and with firmness (r2=0,70). Weaker positive correlations arefound with acid (r2=0,47), pH (inverse 0,38), dry matter (r2=0,30), vitamin C (r2=0,34), emission at t=3 in delayedluminescence test (r2=0,26) and yellow/blue ratio in spectral range luminescence (r2=0,23; annex 14.3.37). Bovisis negatively correlated with disintegration (r2=0,58; annex 14.3.18). We found no correlation with crystallisations(see annex 14.3.48).
Relations with growth, differentiation and integrationThe big changes in Bovis-value are found in series D (a decrease during ageing) and in series C (higher in sun andwith preparations). These series are thought to show integration/differentiation (C) or loss of integration (D andlast picking date in A). From the assumption that Bovis is a measure for the connection between the up-going anddown-going energy flows through a plant or through the fruit, Bovis is thought to be related to integration. Bovis-values positively correlate with integration parameters like taste, SRL-yellow/blue and inverse disintegration. Wefound weaker correlations with some growth-parameters like acid, pH, dry matter, DL-emission at t=3 and adifferentiation parameter like vitamin C. This places Bovis-value as a preliminary integration parameter.

J. Bloksma, M. Northolt and M. Huber, Louis Bolk Institute, 200184
18 Comparing the parameters18.1 Costs of parametersIn this phase of developing a new quality concept we permit ourselves to work with as many parameters as possible to learn from each anaspect of quality. For the routine phase later, we have to choose which quality measurements are sufficient for routine usage and are acompromise between much information and little costs. See table 10 to get an idea what the parameters will cost.
Table 10: Global costs (year 2000, excl. tax) in Euro of 1 sample when measured in a series of about 5 samples
Parameter laboratory remarks EuroLeaf series LBI picking in the field, drying, drawing 100,-Exterior LBI global description 16,-Starch by lugol LBI 12 individual apples 34,-Making juice LBI 1 mixed sample of 12 apples 52,-Brix LBI in juice (in duplo) 26,-Vitamin C: meth.Sprenger LBI in juice (in duplo) 30,-Disintegr ation incl. dry matter LBI 8 individual apples, incl. photo 75,-Sensory test LBI trained panel of 8 apple experts 110,-Crystallisation LBI 4 images per mixed juice sample,
2 concentrations, 1 repetition410,-
Capillary picture LBI 1 image per mixed juice sample,2 concentrations, 1 repetition
300,-
Brix and acid PPO duplo on mixed sample 15,-Starch, firmness, skin colour PPO 25 individual apples 18,-Minerals, incl. dry matter LZVl duplo destruction, mixed sample 57,-Delayed luminescence Meluna 10 individual apples
2 types of excitation; 2-200 sec.900,-
Delayed luminescence in fluorescenceexcitation spectra
Kwalis 10 individual applescomplete spectra with 8 types ofexcitation
950,-
Amino acids, protein Kwalis 1 mixed sample of 10 apples 250,-Phenols TU-München 1 mixed sample of 10 apples 300,-Electrochemical measurements pH, R, Ehand calculated P-value
Heilmann 1 mixed sample of 10 apples4x measured in proceeding time
130,-
Bovis LBI 4 independent repetitions 18,-
18.2 Similarity between sub-samplesFor practical reasons we had to work with different sub-samples for different laboratories. Because of this werisked obtaining non-comparable results from the different laboratories. In table 5 we present an overview of sub-samples and dates of measurements in the different laboratories. We worked with highly standardised fruit, seetable 4, which minimises the variation during sub-sampling. Besides this we checked for similarity in a number ofways:1. Bovis-value of 4 sub-samples before sending to different laboratories. The difference between mixed sub-
samples was below 100 Bovis and that means the sub-samples were very similar.2. Brix is measured in 2 sub-samples: PPO (1) and LBI (2). In annex 14.3.1 the correlation is shown which is
rather good (r2=0,76). It would be better if every laboratory had measured Brix (as an easy measurement) tocheck similarity of sub-sampling and possible transport-delay.
3. Delay or damage during transport or faults during sub-sampling can cause unexpected deviations in results.This can be the case with the electro-chemical parameters in B2.
18.3 Relations between parametersTo get an idea of the relations between parameters we made a correlation table for (only!) linear correlations witha certain amount of confidence and significance (selected for p<0,05 and r>0,5); see annex 14.1 and 14.2. We

Parameters for apple quality and an outline for a new quality concept, part 1. 85
looked for narrow correlations with a methodological or biological meaning and presented these figures in annex14.3. The conclusions drawn for the individual parameters are discussed in the various parameters’ chapters andare collected in this chapter again. The next list is only for people with interest in correlations. Others bettercontinue at § 19.
Relations between colour and shine and other parametersThe percentage blushed skin is correlated with many unripe-ness parameters: firmness (r2=0,26), starch (r2=0,61),acid (r2=0,48), Streif index (r2=0,74), N, P, K, Mg (r2=0,63-0,81), vitamin C (r2=0,48), both protein and free aminoacids (both r2=0,84), raw flesh (r2=0,28), astringent skin (r2=0,52) and emission at t=3 in delayed luminescence(r2=0,40). Blush is positively correlated with Brix-1 (r2=0,22), protein ratio (r2=0,77), yellow/blue ratio in spectralrange luminescence (r2=0,75), electrical resistance (r2=0,60), P-value (r2=0,23) and differentiation in crystallisation(r2=0,27).The correlation between ground colour and shine is not examined in the correlation table.
Relations between firmness and other parametersFirmness is correlated with many parameters that are indicative of ripeness or ageing, but most of them are highlycorrelated with firmness due to the presence of two separated groups: series A+B+C versus series D, see forexample general appreciation in annex 14.3.6.
Relations between starch and other parametersStarch is correlated with many parameters that are indicative of ripeness and sun exposure. Notable is thenegative correlation between starch and the yellow/blue ratio in spectral range luminescence (see annex 14.3.29with r2=0,95 based on series A+C).
Relations between Brix and other parametersBrix is correlated with many parameters that are indicative of bearing and thus the distribution of assimilates. Wefound positive correlations between Brix and dry matter (see annex 14.3.4; r2=0,73), Brix and protein ratio (seeannex 14.3.5; r2=0,69) and Brix with the yellow/blue ratio in spectral range luminescence (see annex 14.3.30;r2=0,69). We only found a weak positive correlation between Brix and sweet taste (see annex 14.3.10; r2=0,26).Negatively correlated were Brix and calcium content (see annex 14.3.3; r2=0,81), and Brix with both protein andfree amino acids (r2=0,65; r2=0,68).
Relations between malic acid and other parametersAcid is correlated with many parameters that are indicative of ripening and bearing and thus the distribution ofassimilates. Acid has a rather well positive correlation with firmness (r2=0,87), starch (r2=0,73), Streif index(r2=0,71), both phosphates and potassium (r2=0,53; r2=0,42), vitamin C (r2=0,68), both protein and free aminoacids (r2=0,72; r2=0,71). Acid also has a positive correlation (albeit weaker) with dry matter (r2=0,40), crispness(r2=0,53), and juiciness (r2=0,49), rawness (r2=0,63), general appreciation (see annex 14.3.7; r2=0,47), delayedluminescence at 3 sec. (r2=0,48) and Bovis-value (r2=0,47). Acid and sourness are rather well positively correlated(see annex 14.3.11; r2=0,72).Acid is rather well negatively correlated with protein ratio (r2=0,77), the yellow/blue ratio in spectral rangeluminescence (see annex 14.3.31; r2=0,89) and electrical resistance (r2=0,74). Acid is also negatively correlated(albeit weaker) with blush (r2=0,48) and disintegration (r2=0,31). Do not confuse acid with acidity (pH). These arenot the same properties as is illustrated in the only moderate negative correlation (r2=0,53).
Relations between Streif maturity index and other parametersStreif index is correlated with many parameters that are indicative of ripeness, these correlations are very similar tothose discussed in §7.4 for starch.
Relations between technical quality index and sensory propertiesThe TQ index for Golden Delicious based on Brix, firmness and acid is rather well correlated with the generalappreciation in the sensory test (see annex 14.3.8, r2=0,55 when linear; r2 increases with a more complex line).As discussed in §18 this good correlation is due to the presence of two separated groups: series A+B+C versusseries D. In an attempt to find a better predicting index for the general appreciation based on Brix, firmness andacid measurements in our Elstar series, firmness was found to have the highest correlation (see annex 14.3.6;

J. Bloksma, M. Northolt and M. Huber, Louis Bolk Institute, 200186
r2=0,68). Conclusively, firmness is the best technical parameter for the prediction of taste.
Relations between dry matter and other parameters:Dry matter is measured in two laboratories: dry matter 1 (PPO) in series B and C and dry matter 2 (LBI) in allseries. The correlation between both measurements is only moderate (annex 14.3.2; r2=0,58), which is explainedby the less precise method at LBI. The correlations between the dm-1’s or the dm-2’s are not equal either.A clear positive correlation is found thrice with Brix (see annex 14.3.4; r2=0,77; 0,38; 0,93). A negative correlationis found with calcium (r2=0,71) and with delayed luminescence (t=3 r2=0,66 and lagtime r2=0,68, see annex14.3.25).Weaker positive correlations are found with firmness (r2=0,38; 0,36), vitamin C (r2=0,57), many sensoryparameters (r2=0,20-0,34), electrical resistance (r2=0,25) and Bovis-value (r2=0,30).
Relations between minerals and other parameters:Minerals are only measured in series B and C, and the correlations are based on only 11 readings. We found manytimes a high correlation between N, P, K, Mg in one group and Ca separately.
High N, P, K, Mg- contents are found in unripe (Streif) and shaded-grown apples. So it wasn’t surprising to findthat nitrogen is positively correlated with starch (r2=0,60) and negatively with blush (r2=0,80) and theyellow/blue ratio in spectral range luminescence (see annex 14.3.32; r2=0,86 based on only 6 readings in seriesC).As expected, nitrogen is positively correlated with protein (r2=0,74) and free amino acids (r2=0,80), but negativelywith protein ratio (r2=0,77). It is interesting to find a high positive correlation between nitrogen and disintegration(see annex 14.3.15; r2=0,72) as fits with the experience of fruit growers that apples with high nitrogen levels rotquickly. A weak positive correlation was found with the P-value (r2=0,39).The P, K and Mg correlations mostly follow the line of the N correlations. Specific for phosphate is the positivecorrelation with Brix (r2=0,86) and a negative correlation with electrical resistance (r2=0,65) and integration incrystallisation (r2=0,63).Specific for potassium is a positive correlation with acid (r2=0,42) and Brix (r2=0,87), which is known in fruitscience, see above in the subject heading background, but which is not found as a positive correlation with tastein our series. We found a positive correlation with electrical resistance (r2=0,67) and a negative correlation withthe yellow/blue ratio in spectral range luminescence (see annex 14.3.39; r2=0,90 based on only 6 readings inseries C).
Calcium is moderate positively correlated with self-maintenance (see annex 14.3.20; r2=0,59), lagtime in delayedluminescence (see annex 14.3.26; r2=0,51) and acidity (r2=0,48).Calcium is strong negatively correlated with the two independent Brix-measurements (see annex 14.3.3;r2=0,81and r2=0,99).We found negative correlations for the relations between calcium and firmness (r2=0,76), crispness (see annex14.3.13; r2=0,71) and dry matter (r2=0,71) and slightly less negative correlations with sourness (r2=0,49), aroma(r2=0,42) and general appreciation (r2=0,47).
Relations between protein and free amino acids and other parametersThe correlations for protein and for free amino acids are very similar. As expected protein is positively correlatedwith total nitrogen compounds (r2=0,74), free amino acids (r2=0,99), protein ratio (r2=0,94), and negative withBrix/N (r2=0,88).Protein is positively correlated with a lot of parameters indicative of ripeness or shaded-growth like firmness(r2=0,53), starch (r2=0,58), Streif-index (r2=0,75), acid (r2=0,72), blush (inverse r2=0,84), Brix (inverse see annex14.3.5; r2=0,69) and rawness (r2=0,46). Remarkable is the strong positive correlation with magnesium (r2=0,94).Memorable are the negative correlations with electrical resistance (r2=0,84), the yellow/blue ratio in spectralrange luminescence (see annex 14.3.34 with r2=0,67) and phenolic compounds (r2=0,58).Surprisingly, and only found for free amino acids is the strong positive correlation with potassium (r2=0,87).
Relations between the protein ratio and other parametersFor the protein ratio, also expressed as % incorporated amino acids, positive correlations are found with manyparameters indicative of ripening like blush (r2=0,77), Brix (r2=0,68), phenolic compounds (see annex 14.3.21 with

Parameters for apple quality and an outline for a new quality concept, part 1. 87
r2=0,58), non-rawness (r2=0,46), firmness (inverse r2=0,71), starch (inverse r2=0,59), Streif-index (inverse r2=0,79),acid (inverse r2=0,77).We also found positive correlations with the yellow/blue ratio in spectral range luminescence (see annex 14.3.40with r2=0,64), electrical resistance (r2=0,85) and unexpectedly a weak negative correlation with self-maintenance(r2=0,38).
Relations between vitamin C and other parametersThe correlations between vitamin C and other parameters are mainly determined by the difference between seriesB (fresh apples) and series D (older and less fresh apples) and are as expected.
Relations between phenolic compounds and other parametersBecause astringent taste is caused by phenolic compounds we expected, and found a strong correlation betweenthese two parameters (see annex 14.3.14; r2=0,94), although this is only based on 5 measurements of series A.We found positive correlations between phenolic compounds and protein ratio (see annex 14.3.21; r2=0,58) andwith electrical resistance (r2=0,38). Negative correlations are found with proteins and free amino acids (r2=0,58;r2=0,37).
Relations between disintegration and other parametersDisintegration is positively correlated with nitrogen content (see annex 14.3.15 with r2=0,72) the same stands forphosphate, potassium and magnesium. The nitrogen content fits with the experience that apples with highnitrogen store shorter than with a lower nitrogen content.Disintegration is negatively correlated with vitamin C (see annex 14.3.17 with r2=0,59). Vitamin C is known as anantioxidant and the figure denotes a minimum of 4 mg/100gram of vitamin C to protect against a disintegrationof more than 7% dry matter loss in a week.Disintegration is also negatively correlated with firmness (see annex 14.3.16 with r2=0,60), many sensoryproperties (crisp, juicy, sour, not raw, aromatic, general), and Bovis-value (see annex 14.3.18 with r2=0,57). Thesecorrelations are mainly due to the presence of two separated groups: series A+B+C on one side and the older,softer and easier to disintegrate apples from series D on the other side . The negative correlation with acidity (seeannex 14.3.19 with r2=0,54) is caused by the group of apples from series B with an unexplained low pH. It is alsoimaginable that a low pH prevents disintegration.We expected a negative correlation between disintegration and self-maintenance, a negative correlation betweendisintegration and dry matter (as earlier found and here only with r2=0,39) and a positive correlation betweendisintegration and Brix (sugar as an easy to assimilate substrate), but none of these correlations were found veryclearly.
Relations between self-maintenance and other parametersSelf-maintenance is positively correlated with calcium-content (see annex 14.3.20 with r2=0,59). Apples with highcalcium-content are known to be well structured and long storable and self-maintenance fits with these properties.There is a weak positive correlation with Brix (PPO, r2=0,33) and some weak negative correlations with proteinratio (r2=0,38) and crispness (r2=0,43).We expected a correlation between self-maintenance and disintegration, vitamin C or phenolic compounds, butnone of these correlations were found very clearly.
Relations between sensory properties and other parametersThe general appreciation has a positive correlation with firmness (see annex 14.3.6 with r2=0,68 although againbased on the presence of two separated groups: series A+B+C versus series D), with acid (see annex 14.3.7 withr2=0,72) and a strong positive correlation with Bovis-value (see annex 14.3.9 with r2=0,87). We found a weakerpositive correlation with dry matter (r2=0,20), acidity (r2=0,27) and DL-emission at t=3 in delayed luminescencetest (r2=0,31). General appreciation has a moderate negative correlation with calcium (r2=0,47), dry matter(r2=0,42) and disintegration (r2=0,40). Remarkable is that no correlation was found with Brix.Within the mutual sensory parameter we see a group consisting of crispness, juiciness and non- mealiness that hasa strong positive correlation with general appreciation (r2=0,72-0,99). Sourness (r2=0,54) and aroma (r2=0,42) areonly moderate positively correlated whereas sweetness is weakly correlated (r2=0,21).In §7.6 we discussed an attempt to establish a formula that predicts taste based on some easy to measuretechnical parameters. Based on this small amount of data the best technical parameter is firmness. Of all

J. Bloksma, M. Northolt and M. Huber, Louis Bolk Institute, 200188
parameters Bovis-value has de best prediction-value for taste.
Looking at the various aspects of taste we can mention some remarkable correlations.With an astringent skin taste many parameters of unripe-ness are correlated: starch (r2=0,62), Streif (r2=0,71),sweetness (inverse r2=0,32) and rawness (r2=0,31). With a non-astringent skin taste we find correlations withparameters related to sun-exposure like blush (r2=0,52), magnesium (r2=0,90) and electrical resistance (r2=0,33).This is a new phenomenon for us which is found in series other than the light series (series C is tasted without skinbecause of the appreciation the skin colour would on the tasters).As expected, astringent skin is positively correlated with phenolic compounds (see annex 14.3.14 with r2=0,94) asthe astringent components have a phenolic origin.
Crispness is correlated with many parameters. As expected a strong positive correlation with firmness (annex14.3.12 with r2=0,80) was found. Crispness is an important addition for general appreciation (r2=0,72). Narrowlyrelated with juiciness (r2=0,85), acid (r2=0,53), pH (inverse r2=0,56) and sourness (r2=0,70). Crispness is correlatedwith aromatic taste (r2=0,60), vitamin C (r2=0,48), dry matter (r2=0,34), Brix/N (r2=0,37), DL-emission at t=3 indelayed luminescence test (r2=0,27), yellow/blue ratio in spectral range luminescence (r2=0,59) and Bovis-value(r2=0,70).Remarkable is the strong negative correlation with calcium (see annex 14.3.13 with r2=0,71); here we recognisethe polarity between storage potential (calcium) and taste (crisp).
Juiciness is strongly correlated with crispness (r2=0,85), so many correlations discussed for crispness are also foundfor juiciness. Remarkable is the negative and unexpected correlation with disintegration (r2=0,62).
Mealiness is only measured in series D. The high correlations found in annex 14.1 are only based on 4measurements and are left out in the discussion.
Rawness is an aspect of taste and as expected correlated with unripe-ness parameters: firmness (r2=0,44), crispness(r2=0,20), starch (r2=0,42), acid (r2=0,63), pH (inverse r2=0,35), sourness (r2=0,30), Streif-index (r2=0,43), drymatter (r2=0,30), blush (inverse r2=0,28), protein (r2=0,46), amino acids (r2=0,45), protein ratio (inverse r2=0,46),astringent skin (r2=0,31), vitamin C (inverse r2=0,60), DL-emission at t=3 in delayed luminescence test,yellow/blue ratio in spectral range luminescence (inverse r2=0,59) and electrical resistance (inverse r2=0,57).
Sourness in taste is well correlated with acid (see annex 14.3.11 with r2=0,57) and acidity (inverse r2=0,63) as weexpected. Additionally, positive correlations were found with many freshness parameters like firmness (r2=0,80),crispness (r2=0,70), dry matter (inverse r2=0,30), vitamin C (r2=0,43), general appreciation (r2=0,54), DL-emissionat t=3 in delayed luminescence test (r2=0,54) and Bovis-value (r2=0,59).We found negative correlations with calcium (r2=0,49), disintegration (r2=0,45), weaker negative correlations withelectrical resistance (r2=0,28), differentiation and integration in crystallisation images (r2=0,29 and r2=0,26).
Sweetness is only correlated with a few other parameters. We found a weak positive correlation with Brix (seeannex 14.3.10 with r2=0,26) although we expected this to be stronger. A weak positive correlation was found withgeneral appreciation (r2=0,21), yellow/blue ratio in spectral range luminescence (r2=0,38) and weakly negativewith astringent (r2=0,32).
Aromatic taste showed moderate positive correlations with crispness (r2=0,60), juiciness (r2=0,53), sourness(r2=0,48), general appreciation (r2=0,42), Bovis-value (r2=0,48) and weak positive correlations with firmness(r2=0,35), acidity (inverse pH r2=0,21), Brix (r2=0,21), acid (r2=0,20), ripeness-index (inverse Streif r2=0,26), drymatter (r2=0,23 and 0,40). It seems the tasters judge the sweet/sour ratio often as ‘aroma’. Negative correlationswere found with calcium (r2=0,42) and disintegration (r2=0,47).
Relations between crystallisations and other parametersIn the table of correlations (annex 14.1) only the empathic judgements are included, the impression of vitality,structure and integration. We found no correlations between what is experienced in these images as vitality andany other parameter.
With the impression of differentiation we found moderate correlations: negative correlations with unripe-ness

Parameters for apple quality and an outline for a new quality concept, part 1. 89
parameters like firmness (r2=0,20), malic acid (r2=0,29) and sourness (r2=0,29) as we expected. With the delayedluminescence test we found a negative correlation with the DL-emission at t=3 (r2=0,30; annex 14.3.41 which wehadn’t expected) and with the lagtime (r2=0,30; annex 14.3.42). The last correlation is as expected as lagtime issaid to be an inverse differentiation parameter.We found a negative correlation with redoxpotential (Eh: r2=0,22) and P-value (r2=0,33; annex 14.3.43). This is asexpected as the P-value is said to be an inverse ordering parameter.We found a moderate positive correlation with the impression of integration in the same images (r2=0,35; annex14.3.44) which fits with the hypothesis that a certain amount of differentiation is a prerequisite of integration.
With the impression of integration we found a negative correlation with aromatic taste (r2=0,34; annex 14.3.45)which we expected to be positive because we assume aroma to be an integration-parameter. With sourness(r2=0,26) and DL-emission at t=3 in the delayed luminescence test a moderate negative correlation was found.This can be explained by the fact that both parameters are thought to belong to the growth processes and whengrowth is too severe it inhibits the integration. We found a negative correlation with redoxpotential (Eh: r2=0,31)and P-value (r2=0,33; annex 14.3.47). This is as expected as the P-value is said to be an inverse orderingparameter. And we repeat the moderate positive correlation between the impression of differentiation andintegration in the same images (r2=0,35; annex 14.3.44 as expected). Un-expectedly no correlation with the Bovis-value was found (see annex 14.3.48).
Relations between delayed luminescence and other parametersEmission at 3 seconds is correlated with many parameters. First a positive correlation with the group ofparameters indicative of unripe-ness was found: firmness (r2=0,51), starch (r2=0,49); Streif-index (see annex14.3.22; r2=0,73); acid (r2=0,48); crispness (r2=0,27); non-mealiness (r2=0,30), rawness (r2=0,27), pH (inverser2=0,44), blush (inverse r2=0,40) and dry matter (inverse r2=0,66).Positive correlations were found with aspects we usually find in more ripened fruit like sweetness (r2=0,47),general appreciation (r2=0,31), P-value (r2=0,28) and Bovis (r2=0,26). We found unexpected negative correlationswith electrical resistance (r2=0,23), Brix (Brix-2; r2=0,55), differentiation and integration in crystallisation (resp.r2=0,30 and r2=0,28).Emission at 3 seconds is positively correlated with the other delayed luminescence parameters like hyperbolicallity(see annex 14.3.23: ‘inverse DL-lagtime’ r2=0,56) and yellow/blue ratio in spectral range luminescence (see annex14.3.12; r2=0,68).
The hyperbolicallity of the delayed luminescence (inverse DL-lagtime) is negatively correlated with only a fewparameters: calcium (see annex 14.3.26; r2=0,51), redoxpotential (Eh: r2=0,32), P-value (r2=0,28), emission at 3seconds (DL t=3, r2=0,56), dry matter (see annex 14.3.25; r2=0,68) and differentiation and integration incrystallisation (resp. r2=0,30 and r2=0,45).
Relations between spectral range luminescence and other parameters:The yellow/blue ratio in spectral range luminescence is clearly correlated with many ripeness and/or sunparameters: we found negative correlations with firmness (see annex 14.3.28; r2=0,57), starch (see annex 14.3.29;r2=0,95), Streif-index (see annex 14.3.27; r2=0,89), acid (see annex 14.3.31; r2=0,89), rawness (r2=0,59), mineralsN,P,K and Mg (r2=0,71-0,90; see annex 14.3.32 and 14.3.39), proteins (see annex 14.3.34; r2=0,67), free aminoacids (see annex 14.3.33; r2=0,64) and positive correlations with blush (r2=0,75), Brix (see annex 14.3.30;r2=0,69), sweetness (r2=0,38).Positive correlations are found with Brix/N-ratio (r2=0,86), protein ratio (see annex 14.3.40; r2=0,63), crispness(see annex 14.3.35; r2=0,59), DL-emission at t=3 (see annex 14.3.24; r2=0,68), electrical resistance (see annex14.3.36; r2=0,63) and a negative correlation with disintegration (r2=0,45). Only a weak positive correlation isfound with Bovis-value (see annex 14.3.37; r2=0,23).
Relations between acidity (pH) and other parametersAcidity (pH) is correlated with many parameters that are indicative of with ripening and ageing. In these processesthe pH increases (=less acid). So as expected acidity is negatively correlated with firmness (r2=0,68), acid(r2=0,53), vitamin C (r2=0,59), sourness (r2=0,63), crispness (r2=0,56), and juiciness (r2=0,48), rawness (r2=0,35),DL-emission at t=3 (r2=0,44). Weak negative correlations were found with general appreciation (r2=0,27), aroma(r2=0,21) and Bovis-value (r2=0,38) and positive correlations with calcium (r2=0,48), nitrogen (r2=0,77),magnesium (r2=0,75), disintegration (r2=0,54), Brix-2 (r2=0,29) and electrical resistance (r2=0,23). We cannot

J. Bloksma, M. Northolt and M. Huber, Louis Bolk Institute, 200190
explain the positive correlation with the minerals and the electrical resistance. The others fit into the qualityconcept, see below.
Relations between redoxpotential (Eh) and other parameters:The redoxpotential (Eh) is correlated with only a few parameters: weak positively with DL lagtime (r2=0,32) andweak negatively with differentiation and integration in crystallisations (r2=0,22 and 0,31). Because of the P-valueformula a high correlation with the P-value is expected (r2=0,92, see annex 14.3.43).
Relations between electrical resistance (R) and other parameters:Resistance (R) is negatively correlated with parameters like firmness (r2=0,50), starch (r2=0,55), acid (r2=0,74),Streif-index (r2=0,69), vitamin C (r2=0,66), sourness (r2=0,28), rawness (r2=0,57), astringent taste (r2=0,33),phosphate (r2=0,65), protein and free amino acids (r2=0,84 and 0,85), DL-emission at t=3 (r2=0,23). Positivelycorrelated with blush (r2=0,60), potassium (r2=0,67), protein ratio (r2=0,85), yellow/blue ratio in spectral rangeluminescence (r2=0,63; see annex 14.3.36), and weakly positive with dry matter (r2=0,25), phenolic compounds(r2=0,38), pH (r2=0,23).
Relations between P-value and other parameters:The P-value is very strongly correlated with the redoxpotential (Eh: r2=0,92; see annex 14.3.43). This is what weexpected because the redoxpotential plays a key role in the P-value-formula.P-value is positively correlated with blush (r2=0,23), nitrogen and phosphate (r2=0,39 and 0,51), DL-emission att=3 (r2=0,28), and DL-lagtime (r2=0,28). Surprisingly the P-value is negatively correlated with differentiation andintegration in crystallisations (r2=0,32 and 0,33; see annex 14.3.43 and 14.3.47).
Relations between Bovis-values and other parametersBovis-value is strong positively correlated with general appreciation (r2=0,88; annex 14.3.9 and with many aspectsof taste: crispness, juiciness, sourness and aroma) and with firmness (r2=0,70). Weaker positive correlations arefound with acid (r2=0,47), pH (inverse 0,38), dry matter (r2=0,30), vitamin C (r2=0,34), emission at t=3 in delayedluminescence test (r2=0,26) and yellow/blue ratio in spectral range luminescence (r2=0,23; annex 14.3.37). Bovisis negatively correlated with disintegration (r2=0,58; annex 14.3.18). We found no correlation with crystallisations(see annex 14.3.48).

Parameters for apple quality and an outline for a new quality concept, part 1. 91
19 Characteristics of the varying factorsWhen we consider the patterns in the various figures for each series we find clusters of parameters with a similarresult. We could distinguish a steady increase, a decrease, constant values, or an optimum and come with aqualitative description, see annex 15. In this chapter we describe each series from this point of view and a * meansa significant relationship, inaccurate parameters are left out (SDT, vitamin C). In the discussion the concept of vitalquality including vitality, structure and coherence is already used, see §1 and §20 for more detailed introduction.
19.1 Ripeness: unripe, overripe
Later picking (and shorter storage) results in:• a continuous increase of size*, irregular shape*, redness*, fat and glossy skin, Brix-1 (slow), crispness,
sweetness, ripe flavour, hyperbolic character of delayed luminescence* (Meluna: inverse lagtime), one-centredness, openness to periphery and coherence in crystallisation pattern.
• at first constant and at the 4th and 5th picking date an increase of Brix-2, dry matter, pH and vitamin C.• a continuous decrease of starch*, Streif-index, malic acid, sourness, astringent skin taste, general
appreciation, phenolic compounds, emission at 3 sec. of delayed luminescence*, subdividing of needles anddensity in crystallisation-pattern.
• an optimum at the 3rd picking date in thin skin, aroma and TQ-index.• an optimum at the fourth picking date in: juiciness, low P-value and low redox-potential and high Bovis-
value*.• an optimum at the third and forth picking date in free amino-acids and a minimum in protein ratio.• a broader spectrum in whole fruit and a smaller spectrum for seeds in spectral range luminescence (Kwalis:
%yellow/R40blue).• no difference in firmness, protein, self-maintenance.• In an earlier study with Jonagold apples, ripeness was related with contents of sugar, malic acid, taste, self-
maintenance and Bovis-value (Bloksma, de Jonge and Brands 1996) and with phenolic compounds andbasic parameters (Awad 2001).
DiscussionRipening in the store versus ripening at the treeWe found no difference in firmness and only a slow conversion form starch into sugar, normally known as strongripeness indicators. This is caused by compensation of a later picking by a longer storage of the earlier pickings. Aswe know in storage this conversion from starch into sugar goes on and firmness decreases. So this series is more orless indicative of ripened-in-the-store versus ripened-at-the-tree!For growers who want to reach good quality, it is interesting to see which aspects of the ripening process willcontinue in storage and for which aspects ripening at the tree is a must. Here we see that the conversion fromstarch into sugar and the decrease of firmness continue perfectly well in storage. These two parameters areimportant aspects for the conventional Streif-index for ripeness (loss of vitality). But for quality parameters likeskin colour, flavour, aroma, luminescence, P-value, crystallisations and Bovis (structure and cohernce), the ripeningprocess on the tree is important.
Ripening series without the expected extremesThis series didn’t reflect the broad range between unripe and overripe as was theoretical possible because unripepicked apples ripened during storage more than we expected and the last picking date was too early for realoverripeness.Because of this prolonged ripening and/or long storage the quality of series A is much lower and/or riper than inseries B and C. This is illustrated in firmness, malic acid, Streif-index, delayed luminescence, electrical resistanceand P-value.

J. Bloksma, M. Northolt and M. Huber, Louis Bolk Institute, 200192
Ripening can be seen as a process of transition from solid into soluble and volatile compoundsLooking at the ripening series the ripening process is illustrated quite nicely. The ripening process can be seen as asuccessive transition of a firm, sour, astringent fruit into an optimal stage for human consumption in taste, beforedisintegrating and releasing seeds. The early ripening started with transition of solid substances like starch, acidand phenolic compounds into soluble and volatile substances like sugar, juice and aromatic-compounds. Aroundthe third and forth picking date some other compound levels started to decrease, such as protein, amino-acids andaromatic-compounds whereas the pH suddenly increased. The transition process can also be seen as theincreasing ‘openness towards the periphery’ in the crystallisations, the weaker luminescence after 3 seconds, andthe better hyperbolic and fruit-like character in luminescence. The fifth picking date is already over-ripe for humanconsumption, as is seen in a disbalance between sweetness and sourness (sweet without sour tastes dull), loss ofaroma, less electrical resistance, loss of vitality in crystallisations and lower Bovis-values.
Ripening can be seen as a transition from vitality into structure and coherenceThe fruit grower expected the optimal ripeness for direct consumption around the third and forth picking date.And indeed, around these picking dates we recognised some aspects of what is called the ‘climacterium’ inliterature (the physiological stage in fruit around real ripeness with a short and high ethylene-ripening-hormoneproduction and a high metabolic activity). So, useful parameters for the optimal ripeness (here optimal taste) seemto be: sweet/sour balanced taste, aromatic, high yellow/blue ratio in spectral range luminescence, open andperiphery orientated crystallisation image, low P-value, high Bovis-value.Parameters indicating vitality (high emission in DL at 3 sec.) decrease and parameters indicating structure andcoherence (crystallisation, broad spectrum and hyperbolic character in delayed luminescence) increase without anoptimum in the reach of this series. The transition from vitality into structure is clearly shown in annex 11.2 in theleft-under figure.
19.2 Bearing: from underbearing to overbearing
Increased bearing results in:• a continuous increase of: calcium, delayed luminescence* (Meluna: emission at 3 sec), electrical resistance
and sharpness in needle-structure in crystallisations.• a continuous decrease of: twig growth, Brix, sweetness, firmness, malic acid, sourness, TQ-index, dry matter*,
minerals N, P, K and hyperbolic character* of luminescence (Meluna: inverse lag-time).• some (not significant) decrease of: crispness, aroma, astringent skin and general appreciation.• a constant value with a minimum quality at bearing 2 for: redoxpotential and P-value (this sub-sample might
have been damaged).• an optimum at bearing 3 for: apple typicality and balance between luxurious growth and emptiness in
crystallisation.• a slight optimum at bearing 4 for: sensory aspects (or maybe this sub-sample was riper?)• no difference in: starch, ripeness (Streif-index), skin colour*, thin skin, pH, Bovis-value*.• the standardisation for fruit size did not succeed completely; B1 was slightly bigger and B5 slightly smaller
than the average of this series. The standardisation was good for ripeness and sun-exposed blush.
DiscussionAmongst fruit growers it is known that fruit of high bearing trees will have a sub optimal taste but store better(here, we did not check the storage potential again). This is related to the decrease in the K/Ca-ratio, as is shownin this series. Maybe electrical resistance and sharpness of the needle structure indicate the same (this is to beproven in a later project)?An increased bearing and a decreased number of leaves per tree means that each fruit has to be fed by fewerleaves (see annex 1). A partial compensation is found in the phenomenon that the photosynthetic activity per leafincreases with a higher demand (also see § 2.1.3). In this bearing series we see a decrease in all compoundsrelated to the assimilation such as dry matter, sugar, acid and aroma and a decrease in minerals that have to bedistributed to more fruit. These relations are commonly found in bearing research.

Parameters for apple quality and an outline for a new quality concept, part 1. 93
The underbearing trees have longer twigs on all sides, and gave the impression to be weaker, lazier, luxurious andshowed a more vegetative growth. The same is seen for their fruit: a powerless slack crystallisation picture with avegetative character and a weak luminescence. The luxurious aspect of these trees is expressed by the few but verynice sweet-sour-balanced and tasteful apples.Fruit from overbearing trees showed poor crystallisation pictures that do not reach the periphery. This fruit is notvery well filled with substances like sugar, acid, minerals and have a poor taste. But can we consider the highermetabolic energy, expressed as a higher delayed luminescence, to be the result of the increased photosyntheticactivity of higher bearing trees?In this orchard we expected bearings 4 and 5 to be overbearing with respect to flower bud formation for the nextseason. However, in 2001 it appeared that only the 5th bearing was actually overbearing, which is possibly due tothe good season in 2000.We also expected bearing 5 (and maybe also bearing 4) to be overbearing with respect to fruit quality. In thisseries we found only for the highest bearing a decrease in sweetness, crispness, aroma and astringent skin taste.However, we found hardly any decrease in the overall appreciation. This is hard to understand. In manyparameters in B5 we recognised the preserving tendency as is described in §20.1 for fruit with growth shortageand severe differentiation.In this series the expected optimum in fruit quality around bearing 4 is not demonstrated very clearly. Only in thecrystallisation images we recognise an optimum between the two mentioned poles. The optimal bearing for thetree is not necessarily the optimal bearing for fruit taste, nor for optimal storage potential. This is seen in the factthat different parameters have their optimum at different fruit bearing levels. The season 2000 had such excellentweather (see §3.2) for apple growth that the highest bearing with 130 fruit per tree was not the extreme bearingthat we had hoped for.
Increased bearing can be seen as a change in emphasis from vitality to structureIn apples from the lowest bearing trees we see all vitality parameters at a high level. Twig vigour is high and so isthe vitality of the fruit (sweet, juicy, crispy, minerals, dry matter, etc). In apples from the highest bearing trees werecognise more structure in: high calcium levels, high electrical resistance, sharp formed crystallisations, clear andcontoured capillary pictures, increased hyperbolicallity in delayed luminescence and the general knowledge thatapples from high bearing trees will store longer. The only phenomenon we didn’t find in line with an increasedbearing, is the increase of the emission at t=3 in delayed luminescence (thought to be a vitality parameter).
19.3 Light: exposure to sun, shadow
With an increased exposure to sunlight we see:• a slow decrease in starch* and malic acid and an increase in sugar, so slightly less ripeness in the shadow.• a continuous increase of red blush*, yellow ground colour*, dry matter*, phenolic compounds, protein ratio,
hyperbolicallity of luminescence* (inverse lagtime without preps), broad spectrum in spectral rangeluminescence* for fruit, electrical resistance, Bovis*-value and more transparency, coherence, and one-centredness in crystallisations.
• a continuous decrease of the minerals N, P, K, protein, amino-acid, emission at t=3 in delayed luminescence*(without preps), redoxpotential, P-value and dark vertical flags in the capillary pictures.
• an optimum at half shadow for the delayed luminescence (DL: both parameters with preps).• no difference in firmness*, general appreciation*, sweetness*, sourness*, crispness*, juiciness*, aroma*,
calcium, pH.
Exposure to sun stimulates differentiation resulting in a more structured and coherent productIn this series we must consider the influence of slightly earlier ripening of apples grown in the sun. This meansthat the shaded-grown apples can improve a little by picking them a couple of days later. But when we comparethe figures of the ripening series, it is clear that a slightly later picking date will not compensate the bigdifferences due to sun exposure.As expected we found more red blush, more yellow ground, more phenolic compounds, more hyperbolicallity inluminescence (DL inverse lagtime), all results of a stronger differentiation due to sun exposure.Besides more differentiation, the sun-grown apples are also more integrated and more apple-like (broader

J. Bloksma, M. Northolt and M. Huber, Louis Bolk Institute, 200194
spectrum in luminescence, higher protein ratio, higher Bovis-value and more coherence in crystallisations).Surprisingly, we did not find a better taste and aroma in the sun–grown fruitRemarkable is the enormous influence of shadow, which is expressed in high nitrogen, protein and free amino-acidlevels. Whereas the low protein content in sunny apples is more incorporated (high protein ratio) into the apple.PPO (annual report 1998) reports a comparable phenomenon; higher nitrogen contents for the inner grown fruitcompared to the outer grown fruit in the same tree, for this they have no physiological explanation.Similar to nitrogen, the potassium and phosphor contents are also much lower in the sun, whereas the calciumlevel remains constant. Consequently, the K/Ca-ratio of sun-exposed apples is much better for storage than theshadow-grown apples and also here sunny fruit can be seen as better structured. This is consistent with theexperience of growers that well exposed apples will store better.Because of the easy transportable assimilates there is no big difference in sugar between sun and shaded-grownapples, so the C/N-ration is much higher in the sun. The higher dry matter content and sugar levels are normalphenomena because of an increased evaporation in the sun.We see a similarity in properties of apples from both the shaded-grown and the more fertilised trees.
19.4 Bd-field preparations
Addition of preparations results in quite complicated and not easy to understand effects:• higher for all light-exposure levels are: the levels of phenolic compounds, the transparency of the
crystallisations and with more light the crystallisations have slender and quite straight needles with few sideneedles.
• higher, but only for the sun-exposed fruit are the emission at t-3 in delayed luminescence*, Ca-content,protein ratio, acidity, Bovis-value*.
• higher, but only for the shaded-grown fruit is the P-value.• higher, for the sun-exposed fruit; lower for the shaded-grown fruit, are electrical resistance and broad
spectrum in spectral range luminescence*.• lower at all light-levels is dry matter (1x).• lower, only for the sun-exposed fruit are protein, amino acid, K/Ca and hyperbolicallity of luminescence* (DL
inverse lagtime).• lower, for the sun-exposed; higher for the shaded-grown fruit, but not very extreme are Brix (2x) and dry
matter (1x).• no difference in blush*, firmness*, starch, malic acid, ripeness (Streif-index), N-, P-, K-content, capillary
pictures, general appreciation* and all sensory parameters*.
DiscussionWhen interpreting these complex effects, we should keep in mind that this series has no repetitions in the field.The slightly increased growth and slightly lower bearing of the trees without preparations, as is described in §2.3,can be a result of not using preparations or simply be due to natural occurring variations. Nevertheless this seriesis well standardised for ripeness and size and thus can be compared with the other series.While the preparations don’t effect in most conventional parameters, including taste, it is remarkable to see someinfluence in the experimental parameters like delayed luminescence, protein ratio, phenolic compounds,crystallisations, P-value and Bovis-value.
Preparations where expected to improve differentiation and integration processes and this is partly foundAccording to our idea and former experience we expected more differentiation and integration as a result of Bd-field preparation usage (Lammerts van Bueren & Beekman 1995; Bisterbosch 1994).Some aspects of both processes can be recognised. From the integration-hypothesis we can easily imagine that ahigher water tension (less dry matter), higher protein ratio, broader range in spectral luminescence and higherBovis-value are integrational aspects.Differentiation phenomena are found in higher phenolic compound and calcium levels, lower K/Ca ratio andlower free amino acids. All are known to improve the storage potential. Other aspects of differentiation, like taste,make no difference (or only a little, non-significant difference).

Parameters for apple quality and an outline for a new quality concept, part 1. 95
We also see some aspects that will have an inverse effect on differentiation and integration processes like adecreased hyperbolicallity in delayed luminescence and a higher P-value.
Preparations where expected to level differences but this series does not support this ideaAccording to our idea and former experience we expected that Bd-field preparations would bring some ‘sunny’-aspects in shaded-grown fruit. That was the idea behind combining both factors in one series. We only find thislevelling-hypothesis in Brix and ones in dry matter. Whereas in other parameters no levelling, or rather the inverse(K, N and protein) is found.For protein, free amino acids and spectral range luminescence it seems the preparations mainly have an influencein the sun and not in the shadow, which is contrary to the hypothesis. Or maybe preparations need sun for someaspects of their action (protein-metabolism, spectral range luminescence) and not for other aspects (like formingphenols). All these 3 parameters are tested on one sub-sample in the Kwalis-laboratory. Maybe the C6-sample(shadow, no preps) was of relative good quality and not representative, or maybe the hypothesis is wrong.
19.5 Shelf life
After 3 months of cold storage (D1 to D2) we see:• a sudden decrease in firmness*, Brix, malic acid, dry matter, general appreciation*, crispness*, juiciness*,
sourness*, aroma*, Bovis*.• a sudden increase in disintegration and pH.• a slow decrease (not significant) in vitamin C, delayed luminescence (Meluna t=3).• no difference in sweetness*, self-maintenance, P-value, redox-potential, electrical resistance.• in crystallisations a shock-effect (D2)
With longer shelf life (D2ÕD5) we see:• a decrease in firmness*, general appreciation*, vitamin C, emission at t=3 in delayed luminescence*, Bovis-
value*.• a slow decrease (not significant) in malic acid, self-maintenance, crispness, juiciness, aroma.• a slow increase in dry matter, P-value, pH, redox-potential.• an optimum at D3 in pH, electrical resistance, crystallisation, hyperbolicallity of luminescence* (DL lagtime).• no difference in Brix, sweetness, sourness.• in crystallisation a recovery from the shock (D3) growing out to an openness and retreating towards the
periphery with long thin needles.
DiscussionShelf life as a loss of vitality, structure and coherenceThe dates are conform what we expected in storage and shelf life by literature. From other quality research it isknown that apples are able to remobilize sugar from tissue compounds to keep a steady sugar level for a very longperiod of time, also when firmness and sourness already decrease. This is also found here.From experience it is known that apples need some days to revive from cold storage and to re-release aromaticflavour again. It is surprising to find the optimal revival time at D3, which is expressed very well in manyexperimental parameters like pH, electrical resistance, crystallisation and hyperbolicallity of luminescence.Because of the expected decrease of all three aspects of vital quality in this series we will not be able todistinguish vitality, structure or coherence parameters.
Shelf life until twelve days was not long enough to see real ageing and disintegrationThe overall good quality of the apples in this orchard prevented the real extremes (fresh to aged) to occur after 12days of shelf life. Some vitality parameters remain at a good level (vitality in crystallisations) and some parametersindicate some ageing in this period (general appreciation, firmness, vitamin C, self-maintenance, capillary pictures,DL-emission at t=3, P-value, Bovis-value).

J. Bloksma, M. Northolt and M. Huber, Louis Bolk Institute, 200196
20 Reflection on research questionsIn §1.1 we introduced a hypothetical concept for vital quality and its grounds. After the experimental series weevaluated the various aspects of the quality concept with the measured parameters. In §20.1 we summarise thethree aspects of the vital quality both as processes and as properties and in §20.2 we describe our first ideas aboutthe relationship between parameters and vital quality aspects.
20.1 A More detailed description of the three aspects of vital quality
Based on the outlines of the series in §19, we are now able to describe in more detail what we consider to begrowth, differentiation and integration processes in apples and what the corresponding properties are.Dividing the reality into two basic life processes is only a mental tool to get a better grip on the meaning of thebalance. When a living organism grows, it is always the result of the co-operation of both processes, sometimeswith the emphasis on growth processes (vegetative phase) sometimes on differentiation processes (generativephase). Besides distinguishing the two basic life processes, as is performed in this first report, a more detailedqualification in specific processes is possible(Bockemühl 1972 and 1995, and many others).
20.1.1 Growth processesGrowth is defined as the expanding process of filling space with basic unformed substance, e.g. cell division, twiggrowth, root growth and trunk growth, unfolding of leaves and flowers in a cluster and fruiting. The basic cellsubstances are formed by photosynthesis ( the primary production system of sugar) and by biosynthesis of starch,malic acid, amino acids and the more complex cellulose and protein. Although the photosynthesis integrates theuptake of carbon dioxide, water and minerals (typical growth processes) using energy and warmth of sunlight(differentiation aspects) we find the emphasis lays on growth.The phytohormones involved in growth are auxins, gibberellins and cytokinins and in human physiology thesegrowth processes are related to anabolic processes.Fruit growers stimulate growth processes, for example by watering, fertilising, defruiting and pruning in a growth-stimulating way. On the other side they know how to reduce growth by root pruning, pruning in a growth-reducingway, trunk notching and controlled water stress.
Vitality is a property resulting from growthA vital crop has a lot of green mass and a good yield. Vital fruit is well-sized, is firm, crispy and juicy due to a hightension. Vital seeds are eager to germinate. The product has a high amount of starch, acid and sugar and theproportion depends on the ripening stage. The acidity (pH) of fruit is low. Fruit is amino acid and protein rich. Avital growing product is still metabolising, busy building and dissolving, many easy-transportable substances arefound (sucrose, amino acids) and the delayed luminescence immediately after excitation is high. In thecrystallisations we find a well-filled plate with dense needles.
20.1.2 Differentiation processesDifferentiation is defined as the process of refinement or getting a specialised form and function likedifferentiation in cells, leaf serration, flower bud formation and pollination, forming secondary metabolites duringthe ripening process: colouring the fruit skin and autumn leaves, flavour and compounds for resistance. (We arenot sure weather we consider the transport of calcium by hormonal processes to the fruit flesh as a differentiationprocess too).The phytohormones involved in differentiation are ethylene and absisin and in human physiology differentiationare related to catabolic processes.Fruit growers stimulate differentiation processes, for example by choosing a light and warm habitat, pruning thetree to an open architecture to expose to light and sun as much as possible, reducing heavy growth, bringing inbeehives for pollination and binding down young twigs.

Parameters for apple quality and an outline for a new quality concept, part 1. 97
Structure is a property resulting from differentiationThe product has a detailed form and colour. Twigs have flower buds for the next year. Autumn leaves are coloured,fruit have a yellow ground colour and a blush and are aromatic with a waxy, glossy skin. Secondary metabolitesfor resistance like phenolic compounds and vitamins are found in the fruit, the tree bark contains tannin. The fruitcontains a lot of seeds and has a high calcium/potassium-ratio, the tissue is ordered with optimal texture and hasa high storage potential. After excitation in the delayed luminescence test, the tissue is capable to store lightenergy and release it slowly as biophotons, which produce a clear hyperbolic curve (small lagtime). Thecrystallisation-image shows one-centred, well formed and open angled side-branches.
20.1.3 Integration processesNormally, growth processes should be at a moderate level to allow differentiation processes to occur in a properway. Looking at plants with stress, emergency flowering can be seen as an example of differentiation withoutenough growth. Fruit growers know that twigs with canker in the wood, mildew or fruit with rosy apple aphid willbear a lot of poor quality fruit of poor quality. These are examples of differentiation without enough growth,resulting in a dry preserving process. Examples of the other extreme are the very growthfull twigs with pests anddiseases like scab and green aphid.These examples show different ratios between growth and differentiation. But, realise there is a differencebetween ‘balance’ and ‘integration’. Balance is the ratio between growth and differentiation, both processes mayoccur alongside each other. Integration is the co-operation between growth and differentiation. When growth anddifferentiation processes intermingle and co-operate at the same time in rhythm we are truly talking aboutintegration. We expect some balance in the ratio between growth and differentiation as a prerequisite for theintegration process. This is no static balance, but a dynamic alternation of polar conditions.
The typical balance between the two processes depends on the context. Firstly, we distinguish a ‘nature context’,like species and variety choice and developing stage, and secondly a ‘nurture context’ like soil, climate andorchard management. The integration process helps a crop or a fruit to self-regulate after fruit growers’interference. The contrary is compartimentalisation.
Fruit growers exhibited the knowledge of the importance of balance between growth and differentiation for fruitquality. In practise they try to obtain this balance mainly by stimulating or slowing down the growth process. Bio-dynamic growers expect the bio-dynamic field preparations to play a role in the integration process, Although thishas not been proven yet (Lammerts van Bueren & Beekman 1995; Bisterbosch 1994). Managing the integrationprocess is still the most elusive process. Also during breeding and selection the germ is laid for the possibility ofthe integration process.
Coherence is a property resulting from integrationThe final product shows combinations of the polar properties. Apples have a good taste ànd a high storagepotential. The product should be tasty, juicy, crispy, sweet/sour-balanced and aromatic for a long time ànd have aspecies and context typical form and taste. The product is ready for harvest, amino acids are incorporated intoprotein and the ratio protein/amino acids is high. Crops or seeds are capable of reproduction. The crop or fruit isresistant to disintegration, stress and diseases. The tissue is elastic and keeps turgor for a long time. The electricresistance and self-maintenance are high and the redox-potential is low.The delayed luminescence tests shows a high start, a hyperbolic delay and a species-typical spectrum.The crystallisation shows a coherent image, the parts are connected (no separate ‘marbles’) and a species-typicalgesture isshown. The Bovis-value is high.
Integration/coherence is a relational aspect of qualityIn judging vitality or structural aspects, the observer may be objectively and non-involved. Also in thecrystallisation method computers with image analysis are used to judge to a certain degree these two aspects(Anderson 2001).But to judge the third aspect (integration or coherence) the observer must be involved and related, and so asubjective part appears. An involvement is desired to choose an aim as reference for quality. The fruit grower

J. Bloksma, M. Northolt and M. Huber, Louis Bolk Institute, 200198
brings in his direction. He chooses the optimal ratio between growth and differentiation to obtain the desiredcompromise between high yield and good taste or between a high storage potential and better tasting apples.An active personal involvement is also desired to perform some of the measurements, like the sensory tests,emphatic judgement in the crystallisation test and intuitive tests like Bovis. To develop these parameters inscientific manner requires a special interest in the method of inter-subjective judgement and cluster analysis.Development of tests to measure coherence is of great importance for the vital quality concept. In our opinion theaspect of coherence is the essence of quality.
20.2 Perspective for practical relevance of the vital quality concept
The processes and properties described above for apple are generalised in a scheme in figure 11. We hope toinvestigate more series of all kinds of products to test and further develop this hypothesis as a general concept.Growers recognise (or can learn to recognise) both processes in their growing crop and should know how to bringboth processes into balance.We assume that products with well-balanced growth and differentiation processes are of high vital quality andhelp humans create coherence in their own being. This should be proven by nutritional studies. Only thenconsumers will be provoked to purchase products with high vital quality.Traders recognise both processes and their integration in the final product. And if there are some imperfections inquality the trader can communicate in terms growers can deal with.The next step, the relevance for the consumers’ health, has to be proven in a later stage.For future enlargement of figure 11, we can image a third column at the right hand side about resonancephenomenons with the human health and a fourth column at the left hand side with the cultural practices forgrowers.

Parameters for apple quality and an outline for a new quality concept, part 1. 99
Figure 11: Generalised Vital Quality concept in keywords (in Dutch on page 14 and in German on page 22)
Vital Qualitycommunication with communication with
the grower about consumer and retailer aboutPROCESSES PROPERTIES
in the growing crop of the harvested product
1. Growth 1. Vitalityhh forming mass hhgreen vegetative mass, size, yieldhh forming primary metabolites hhsugar, acid, starch, by photosynthesis amino acids, proteinhh anabolic processes hhtension, juiciness, crispnesshh hormones auxin, gibberellin, cytokinin hhmetabolic energy
hhgermination power
2. Differentiation 2. Structurehhripening, refining hhdifferentiated refined formshhordering hhorder, calcium, firm cell wallshhforming secondary metabolites hhcolour, aroma, bitterness, wax,hhhormone ethylene vitamins, phenolic compoundshhcatabolic processes hhstorage potentialhhforming pollen and flowerbuds hhgenerative organs, seeds
1+2 Integration 1+2 Coherencehhbalancing growth and differentiation hhbalance of vitality and structurehhco-operation hhintegration, resistance to
disintegrationhhself-regulating hhself-regulation, elasticity,
resistance to stress and diseases,hhrelating to species, variety, development, hhspecies typical, farm typical, etc.
season, soil, farm context, etc. hharomatic taste AND firmness AND storage potentialhhcapable to reproduce

J. Bloksma, M. Northolt and M. Huber, Louis Bolk Institute, 2001100
20.3 In which amount do the various parameters reflect vitality,structure and coherence?
In real life it is hard to distinguish between the two life processes, growth and differentiation. We cannot expectone measured parameter to represent only one aspect of vital quality. But for most parameters we can recogniseemphases on one or more aspects of the vital quality concept. We made this prelimary classification both bythinking about the concept and by looking at the experimental results. Also the conventional parameters areinterpreted as a result of these processes in a more holistic way than usual.We realise that various parameters all concerning the same aspect of our quality concept can show different levelsof the aspect. To belong to the same aspect of the quality concept does not automatically mean that theircorrelation (see annex 14.2) must be high. We still have to get a lot of more experience to validate theparameters’ character. Here we present our first research on this topic, including the unanswered questions andrealise that more experimental series will bring more and more certainty.After this first project we cannot say which parameters are so similar that it makes the other redundant. Until nowwe learned something from every parameter to develop our quality concept. Most inspiring for the new qualityconcept were the crystallisations, the delayed luminescence and the Bovis-value.
In this chapter we collected remarks about the various parameters relevant to the processes growth, differentiationand integration. These remarks are presented as text in the various parameter chapters (§5-§17) before and alsosummarised in table 12 for an overview .
Leaf seriesGrowth is reflected in leaf size and irregular leaf shape, in twig length and in internode length. Differentiation isfound in regular shape and in details like fine leaf serrations. Integration is found in regularity in the leaf formsequence (Bloksma and Jansonius 2000). Because of the polarity between twig growth and fruit growth in thetree it is not necessarily that growth full leaves reflect a growth full quality in the fruit.
Blush and ground colour and shineIn blush its easy to recognise the ripening process (differentiation) as well as in the series (A and C) and in thecorrelations. Moreover correlations are found between blush and integration parameters.In our experience we expect ripening as the main determinant for colour (green ground turns into yellow; redblush turns into purple) and also for wax formation. We expect sun exposure as main determinant for thepercentage of blush. Both parameters acting at the level of differentiation.
FirmnessFirmness is the result of turgor and cell elasticity. Turgor, after taking up water, can be seen as a growth aspectwhereas cell wall elasticity and the capacity of not loosing this water is more an integration aspect.
StarchWe recognise in starch as basic potential building material a clear growth aspect.
Sugar and sugar ratiosFor sugar we have the same argument as for starch to regard this as a growth parameter. The ratio sugar/starchcan be seen as a ripening indicator and sugar/acid as a balance for taste and an indication for the integrationprocess.
AcidFor acid we have the same argument as for sugar and starch to regard this as a growth parameter. The ratiosugar/acid as a balance for taste can be seen as an indication for the integration process.
Streif-indexIn accordance with its name the Streif-maturity-index looks like a ripening (=differentiation) parameter. In

Parameters for apple quality and an outline for a new quality concept, part 1. 101
connection with our quality concept it is worth mentioning that this index is built up by a formula consisting ofonly growth parameters of which the mutual proportions change as an indication of maturing. Maturing in thisway can also take place in the store and is not necessarily restricted to the tree. In series A the difference betweenapples matured in store versus ripened on the tree in the sun is clearly demonstrated (see §19.1). For our qualityconcept the differentiating process in the sun is obliged to reach high vital quality..
Dry matterDry matter is a complex parameter to place in the quality concept. Dry matter is the result of water uptake(growth), sugar content (growth), cell-compactness (inverse growth) and maybe more.Up to now we place dry matter with a question-mark at the growth-level.
MineralsLooking at the concept of growth (uptake from the earth, see §20.1) we expect all minerals to be growthparameters. N, P, K and Mg levels are diluted with an increased bearing in series B and are higher when grown inthe shadow. This is also found in the correlations of the experimental data.Calcium levels are the inverse of the N, P, K and Mg levels in series B and are not influenced by sun in series C.Also in many correlations Ca levels are the inverse of the other minerals’ levels. The uptake of calcium is alsoknown as an exception in a physiological way: it is sucked up by the hormone gibberellin formed in growingtissues (especially by seeds in the fruit) and ones in the tissue it is not easy to reallocate. Calcium (and especially ahigh Ca/K ratio) makes an apple more resistant against ageing or disintegration. This is why we consider placingcalcium at the level of structure, although calcium is not correlated with a lot of ripening parameters.
Free amino acidsFree amino acids are easy to recognise as building stones, so ‘amino acids’ is a clear growth parameter. Protein isalready synthesised a little further, but still can be considered as a growth parameter. The identical behaviour ofamino acids and protein in the table of correlations support this choice. The many negative correlations betweenamino acids and integration parameters suggest an arrest of differentiation/integration by high concentrations ofamino acids.The protein ratio (protein/protein+amino acid) as a measure for incorporated building stones can be seen as anintegration parameter. (Or when expressed as ‘amino acid ratio’ we must speak about a inverse integrationparameter). This is supported by the high protein ratio in apples in the sun and with preparations in series C andalso in many correlations with integration parameters as yellow/blue ratio in spectral range luminescence andelectrical resistance.
Vitamin CWith respect to the vital quality concept, we thought vitamin C, as a secondary metabolite, would be adifferentiation parameter. In the series and in the correlations we see vitamin C also behaves like a growthparameter. So we put a question –mark at both levels. The measurements are not precisely enough to distinguishbetween growth and differentiation with our experimental data.
Phenolic compoundsPhenolic compounds are secondary metabolites and that is why we place this parameter in the level ofdifferentiation. Also the higher concentrations of phenols in series C in sun grown fruit and in fruit withpreparations support this idea. The decrease in concentration of phenols with increased ripening in series A mayseem the contrary, but remember, a decrease in concentration can also mean an increase in mg per fruit. Phenolsare correlated with some integration parameters (protein ratio and electrical resistance), so maybe there is also anintegration aspect?
Disintegration and self-maintenanceWith respect to the vital quality concept, both resistance to disintegration and self-maintenance are parametersrelated to keeping its own form. This implies that the parameters exert their action on the level of integration.Looking at the series we expected a decrease during ripening and ageing and an increase with sun exposure,preparation usage and moderate bearing, which is only found in ageing and light.Looking at the correlations we found only a few correlations with other integration parameters. As mentionedpreviously, we are not satisfied about the precision of the method, maybe this is the reason we didn’t find the

J. Bloksma, M. Northolt and M. Huber, Louis Bolk Institute, 2001102
experimental evidence, or maybe our hypothesis is not correct?
Sensory propertiesAppreciation is a complex parameter. We are glad we performed such a detailed sensory test. With respect to thevital quality concept, we recognise the growth level in sweetness, sourness and juiciness. Crispness also has agrowth aspect, but similar to what is said for firmness; remaining crisp can be seen as an integration aspect too.Mealiness can be seen as a loss of vitality (growth) and as a loss of coherence between cells (integration).Physiologically seen, gaining aroma requires a high level of basic substances (sugar, etc) together with adifferentiation process, so we place gaining aroma at the integration level with a question-mark for differentiation.Loss of rawness or astringent skin can be seen as a result of ripening. Overall taste is dependent on proportions, asis seen in the sweet/sour ratio.Because of the small differences and the large variation we have only little experimental evidence from the seriesfor these hypotheses. The tendencies supporting these theories, recognised in series D, are the loss of vitality(sourness, crispness, juiciness) and integration (aroma, overall taste) during ageing. In series B the reason for alower appreciation of apples from the highest bearing trees is too little sweetness (insufficient sugar for all fruit),and thus insufficient growth.Looking at the correlations it is remarkable to see in these series that overall appreciation is mainly correlated withgrowth parameters, as juiciness, crispness and the sweet/sour ratio. The correlations withdifferentiation/integration parameters are illustrated by rawness of flesh, astringent skin and sweet/sour ratio inthe ripening process.
CrystallisationsCrystallisations are especially valuable for the vital quality concept because crystallisations can be judged on allthree aspects of the concept. Vitality is recognised as smooth, quite dense needle structures filling the whole plate.Structure is recognised as , well ordered, one-centrered, regular pattern of sharp side-needles with a wide angle.Coherence is recognised as a whole where the parts are interconnected, without isolated structures and in a waytypical for apple.
Capillary picturesWe do not have enough experience to classify the capillary pictures.
Delayed luminescenceBoth methods of delayed luminescence were important for the vital quality concept.For the delayed luminescence by Meluna the emission at t=3 is recognised as the amount of available energy forthe development of either growth or differentiation. The hyperbolicallity of the curve is indicative for a highlydifferentiated state. A combination of a highly differentiated state and a relatively high availability of energyallows the organism to have a high degree of coherence. So every aspect of the vital quality is represented.In the spectral range luminescence Kwalis assumed the yellow/blue ratio to be a parameter for fruit-character and‘being alive’. In our quality concept this is at the level of integration.
AcidityFor apples, acidity can be seen as a growth parameter, as a potential for further ripening, as is illustrated in thenegative correlation with many ripeness parameters. During ageing in series D the fruit looses its vitality, the pHincreases and so the basis for integration decreases, as is illustrated in negative correlations with taste, Bovis-value, and the positive correlation with disintegration.
ResistanceIn series A and D we saw the resistance slowly decreasing during the last phase of ripening and ageing. In series Csun and preparations and in series B the higher bearing trees had the highest resistance. These phenomenaprompted us to regard electrical resistance as an integration parameter. This is supported by good correlationswith other integration parameters like the yellow/blue ratio in spectral range luminescence and protein ratio.In series B and C the overall resistance level is lower than in series A and D. The same difference in overall levelwe see in ripeness (A and D are riper) and in the DL-emission at t=3 (A and D have less metabolic energy). So thissuggest a certain amount of differentiating is a prerequisite for integration and therefor electrical resistance is adifferentiation parameter too.

Parameters for apple quality and an outline for a new quality concept, part 1. 103
Redox-potentialIn series A and D we saw the redoxpotential decreasing heavily during ripening and increasing a little during over-ripening and ageing. Heilmann’s assumption of the redoxpotential being a parameter for order, together with thecorrelations with a number of differentiation parameters, suggest that the redoxpotential is a differentiationparameter. In these results we also see the ability to show the loss of structure in over-ripe fruit, which is an aspectof integration.
P-valueBecause of the close relation with the redoxpotential we expect the P-value also to be a differentiation parameter.Beside that we recognise also growth aspects (pH) and differentiation (Eh) and integration aspects (R) the P-value-formula. From the concept we expect ‘dissipitation’ as an inverse parameter for integration, but in thecorrelations we found aspects of all three levels. For our quality concept a complex parameter like the P-value fordifferentiation and integration will give additional information when we use the separate aspects (pH, Eh, R)apart from each other.
Bovis-valueThe big changes in Bovis-value are found in series D (a decrease during ageing) and in series C (higher for sun-exposed fruit and with preparations). These series are thought to show integration/differentiation (C) or loss ofintegration (D and last picking date in A). From the assumption that Bovis is a measure for the connectionbetween the up-going and down-going energy flow through a plant or through the fruit, Bovis is thought to belinked to integration. For the Bovis-value is positively correlated with integration parameters like taste, SRL-yellow/blue and inverse disintegration. We found weaker correlations with some growth-parameters like acid, pH,dry matter, DL-emission at t=3 and the differentiation parameter vitamin C. This makes Bovis-value a preliminaryintegration parameter.

J. Bloksma, M. Northolt and M. Huber, Louis Bolk Institute, 2001104
Figure 12: Assumed relationships between parameters and aspects of vital quality
growthvitality
differentiationstructure
integrationcoherence
remarks
leaf series ++ + + info about twigs and leaves, notnecessarily about fruit.
glossy and waxy skin ++ +skin ground colour yellowskin blush colour red
++++ +
firmness ++ + as result of turgor (growth) and cellelasticity (integration)
sugarmalic acidstarchsugar/starchsugar/malic acid
++++++
++ +
proteinamino acidsprotein/amino acids+protein
+++
+?
++nitrogen (N)phosphate (P)potassium (K)calcium (Ca)K/Ca
+++
+?+? +
vitamin Cphenolic compounds
+? ++?++ +?
general appreciationsweetsouraromamealycrispyjuicysweet/sourraw, astringent
+++++
++
++
+?
++?
++
++++
+
partly judged as sweet/sour?as a loss of vitality and coherence.
dry matter
disintegrationself-maintenance
+?
+?+?
as a contrary result of water uptake,sugar content and cell compactness.insufficient experimental evidence.insufficient experimental evidence.
crystallisationscapillary picture
++?
++?
++? still too little experience in judging.
delayed luminescence: DL emission t=3 DL lag time DL emis. t=3/lag time SRL yellow/blue
+
+?
+
+?
++
++
as metabolic energy for all processes.as the growth/differentiation ratio.as maturity of a typical organ.
P-valuepHEhR
++?
++?
+?
+?++
P-value too complex; separatecomponents are more useful.
Bovis ++ well correlated with appreciation

Parameters for apple quality and an outline for a new quality concept, part 1. 105
20.4 Recommendations for further research
This is only the first project in our ambitious FQH-program. We feel it as the first step.We hope to continue with the next recommendations for further research to concept- and method-development:• comparable experimental design with apples in a series of increasing nitrogen fertilisation, and anew series
with Bd-preparations, see discussion in § 19.3.• comparable experimental design with other products, notably carrot, red beet, potato, tomato and milk and
determine whether the three aspects of vital-quality can also be found in these products.• methodical improvement of the parameters: taste, self-disintegration, crystallisation and Bovis-value.• further development and interpretation of biophotons and copperchloride crystallisations.• which cultivation circumstances improve the integration process?• nutritional research to determine the significance of vitality, structure and coherence for human health.
With this project we hope to have sown a seed to inspire all who are working on a better suiting quality conceptfor organic production. We are open to hear all improvements and hope to find collegues to collaborate further inthe conctext of the Food, Quality and Health programme.

J. Bloksma, M. Northolt and M. Huber, Louis Bolk Institute, 2001106
21 LiteratureAhrens, E, 1988: Aspekte zum Nachernteverhalten und zur Lagerungseigung’, in Alternatieve Konzepte 66:
Lebensmittelqualität – ganzheitliche Methoden und Konzepte von A. Meier-Ploeger und H.Vogtmann, VerlagC.F.Müller Karlsruhe. p.113-146.
Amons, F; G.van der Bie, M. Huber, A. Koopmans, 1992: Verslag van het intra- en intersubjectiviteitsonderzoek aanenige basiskenmerken van het bloedkristallisatiebeeld, Louis Bolk Instituut, internal report, summaryincluded.
Amons, F; G. van der Bie, M. Huber, 1999: Grondslagen onderzoek: proefpersoon-bloedkristallisatie, kwalitatieveoordelen in de beelddiagnostiek gekwantificeerd. Louis Bolk Institute publ.no. M019, Driebergen, NL.
Andersen, J.O, 2001: Development and application of the biocrystallization method. Ph.D. thesis Dep. of Agr. Sc.section org. farming, the Royal veterinary and Agricultural Univ. Copenhagen.
Awad, M.A, 2001: The apple skin: colourful healthiness – Developmental and environmental regulation offlavonoids and chlorogenic acid in apples. Dissertation Univ. Wageningen.
Barden and Bramlage (1994) in Postharvest Biol. Technol. 4, 23-33.Berendt, U, 1983: Ein Vergleich der wild- und kulturform des Salates. Elementen der Naturwissenschaft 39, p. 15-
22.Bisterbosch, L; 1994: Een experimentele aanzet tot het ontwikkelen van inzicht in de voedingskundige betekenis
van het gebruik van spuitpreparaten. Een goetheanistisch-fenomenologisch experiment met biologisch-dynamische spuitpreparaten bij vollegrondssla. Louis Bolk Institute, Driebergen, NL.
Bloksma, J., and M. van Brakel, 1990: De zelfontbindingstest als mogelijke kwaliteitsbepaling bij appelen’ LouisBolk Institute publ.no.LF09, Driebergen, NL (with English and German summary).
Bloksma, J; J.de Jonge, L. Brands, 1997: Zelfsontbindingstest bij appels met verschillende rijpheid. Louis BolkInstitute internal report 23-3-97, Driebergen, NL (only Dutch).
Bloksma, J; PJ Jansonius, 2000: Leaf series as an image of shoot growth; method, examples and interpretation.Louis Bolk Institute publ.no. LF58, Driebergen, NL.
Bockemühl, J. 1972: Characterisierung von Qualitäten in der Pflanzenentwicklung. Elementen in derNaturwissenschaft 17, p.1-15.
Bockemühl, J. 1975: Ein weg zur Charakterisierung von Pflanzenprozessen und zur beurteilung vonNahrungspflanzen am Beispiel des Radieschens. Elementen in der Naturwissenschaft 22, p.1-12.
Bouter L.M. & M.C.J.M. van Dongen (1995). Epidemiologisch onderzoek. Opzet en interpretatie. Bohn Stafleu.Chariton, J., G. Frank, et al. (1930). Über die Wellenlänge und Intensität mitogenetischer Strahlung. Die
Naturwissenschaften 18(19): 411-413.Colli, L. and U. Facchini (1954). Light emission by germinating plants. Il nuovo cimento 12(1): 150-153.Colli, L., U. Facchini, et al. 1955). Further Measurements on the Bioluminescence of the Seedlings. Experientia XI
/12: 479 - 481.Engquist, M., 1970: Gestaltungskräfte des Lebendigen, Die kupferchlorid-Kristallisation, eine Methode zur
Erfassung biologischer Veränderungen pflanzelicher Substanzen, Verlag Vittorio Klostermann, Frankfurt amMain.
Friedrich, G; D. Neumann; M. Vogl, 1986: Physiologie der Obstgehölze. Ac. Verlag Berlin.Fritzsche, G, 1984.: Die elektrochemische Messung der Biosphäre in drei Dimensionen. Vortrag auf der
medizinischen Woche in Baden 1984, Sonderdruck München.Geijn, F.vd; M. Kers, 1999: Achtergronden kwaliteit van appel op de voorgrond. DLV –adviesgroep, cursus 1999.Gersons, L, 1972: Snelle Vitamine C – bepaling, Sprenger Instituut, bulletin 119.Günther, K. (1983). Zellstrahlungsforschung: neue Aspekte. Naturwissenschaftliche Rundschau 36(10): 442-444.Hideg, E. and H. Inaba (1991). Biophoton emission (ultraweak photoemission) from dark adapted spinach
chloroplasts. Photochemistry and Photobiology 53(1): 137-142.Hagel. I, 2000: Sekundäre Pflanzenstoffe und Nahrungsmittelqualität, Lebendige Erde 5, p.12-15.Heilmann, H.,2000: Internationale elektrochemische Forschung weitet sich aus. Ökologie und Landbau 3/2000.Heilmann, H.: Materialsammlung der 7. Internationalen Tagung Elektrochemischer Qualitätstest 16. –
18.03.2000 („Thermodynamische Aspekte von Lebensmittelqualität)Heilmann, H, 2001: Die Qualität von Boden und Pflanze hängt zusammen. Ökologie & Lanbau 117 (1) p.52-53.Hoffmann, M, 1997: Vom Lebendigen in Lebensmitteln. Ökologische Konzepte 92, Stiftung Ökologie und Landbau
& Deukalion, Holm (D).Jager, de A., 1995: Annual report, Fruit Research Station, Holland.

Parameters for apple quality and an outline for a new quality concept, part 1. 107
Keppel, H., K. Pieber, F. Solar, 1997: Untersuchungen zum Redoxpotential am Standort und zur PotentialdifferenzBoden –Pflanze als allgemeines Vitalitätsmaß. Mitteilungen Klosterneubürg 47, p. 205-…
Kollath, W, 1978: Regulatoren des Lebens - Vom Wesen der Redox-Systeme, 2. Auflage Heidelberg.Kolisko,E. u. Kolisko.L., 1939: Agriculture of tomorrow. 2nd Ed.1978, Kolisko Archive Publications, Bournemouth,
England.Kraft, A, von, 1995: Das Zellprinzip bei Tier und Mensch: organismus-bezogenen Selbstaufhebung in Entwicklung
und Lebensfuktionen und das Phänomenon der Geschwulstbildung. Tycho de Brake Jahrbuch fürGoetheanismus, p.67-92.
Kulpe, M., 1959: Qualitätsprüfungen an Kopfkohl und Blumenkohl bei vergleichender Lagerung sowieUntersuchungen über eine Methode zur Vorbestimmung der Lager-fähigkeit von Kopfkohl. DissertatieHalle/Saale.
Lammerts van Bueren, E en J. Beekman-de Jonge; 1995: Biologische-dynamische spuitpreparaten in ontwikkeling;70 jaar praktijk, onderzoek en visie. Louis Bolk Institute, Driebergen, NL.
Leenstra, C, 1996: differentiationtherapie, een nieuwe benadering van antitumortherapie, Janssen-Cilag Medischwetenschappelijk Nieuws.
Loghum, van/Houten/Diegem. P.J.D. Drenth & K. Sijtsma (1990). Testtheorie. Bohn Stafleu Van Loghum.Houten/Diegem.
Mandera,M.,1995: Zur Metamorphose von Pflanzenorganen, Substanzqualitäten und Bildtypen im Steigbild. Tychode Brahe-Jahrbuch für Goetheanismus 1995, p. 281-310.
Mamedov, T. G., G. A. Popov, et al. (1969). Ultaweak luminescence of various organisms. Biophysics 14: 1102-1107.
Mayr, U., Treutter, D., Santos-Buelga, Bauer, H. und Feucht, W,1995: Developmental changes in the phenolconcentrations of Golden Delicious apple fruit and leaves. Phytochemistry 38, 1151-1155.
Meier-Ploeger, A und H. Vogtmann (ed), 1988: Lebensmittelqualität – ganzheitliche Methoden Und Konzepte.Alternative Konzepte 66; Verlag C.F. Müller, Karlruhe (D).
Neurohr, R. (1992). Untersuchungen zur spontanen und induzierten Lichtemission von Kresse und Kressesamen.Saarbrücken, Universität des Saarlandes, Saarbrücken: 143.
Norušis, M.J,1998: Guide to data Analysis SPSS 8.0. Prentice Hall, Upper Saddle River, New Jersey.Popp, F.-A. (1984). Biologie des Lichts. Berlin, Hamburg, Paul Parey.Popp, F.-A. (1986). On the coherence of ultraweak photonemission from living tissues. Disequilibrium and self-
organisation. C. W. Kilmister, D.Reidel Publishing Company: 207-230.Popp, F.-A. and K.-h. Li (1993). Hyperbolic Relaxation as a Sufficient Condition of a Fully Coherent Ergodic Field.
Sonderdruck aus: International Journal of Theoretical Physics 32(9): 1573-1583.Popp, F.-A., B. Ruth, et al. (1979). Emission of Visible and Ultraviolet Radiation by Active Biological Systems.
Collective Phenomena 1981 3: 187-214.Ruth, B. and F. A. Popp (1976). Experimentelle Untersuchungen zur ultraschwachen Photonenemission
biologischer Systeme. Zeitschrift für Naturforschung(31c): 741-745.Samaras, I, 1980: Die epifytische Mikroflora in beziehung zu einigen biochemischen Merkmahlen und zu einigen
Kriterien der Verderbnisanfälligkeit ausgewähter Nahrungspflanzen, insbesondere getreide. DissertationGiessen.
Schamhart, D.H.J. en R. van Wijk, 1986: Photon emission and the degree of differentiation. In: Photon Emissionfrom Biological Systems. Eds. Jezowska-Trzebiatowska, Kochel, Slawinski, Strek (World Scientific, Singapore)p.137-152.
Seymour, G.B.; J.E. Taylor; G.A. Tucker, 1993: Biochemistry of Fruit Ripening. § 11 Pome Fruit. Chapman & Hall.London etc.
Slawinski, J. and F.-A. Popp (1987). Temperature Hysteresis of Low Level Luminescence from Plants and itsThermodynamical Analysis. J. Plant Physiol. 130: 111-123.
Souren, J.E.M; E. Boon-Niermeijer; R. van Wijk, 2000: Germination capacity of tomato seeds and ultra-weak photoninduced delayed luminescence. In: Biophotonics and Coherent systems, Eds. Beloussov, Popp, Voeikov, VanWijk (Moscow University Press 2000) p. 419-430.
Stoll, K, 1997: Der Apfel; Inhaltstoffe, Fruchtaufbau, Qualitätserkennung. Enrico Negri AG, Buch- undOffsetdruckerei, Thurgauerstrasse 72, CH-8050 Zürich.
Streif, J, 1996: Optimum harvest date for different apple cultivars in the Bodensee area p15-20 in A. de Jager, D.Johanson and E. Holn (ed): Determination and prediction of optimum harvest date of apples and pears.Luxembourg.
Strube, J. (1998). Charakterisierung von Samen mittels Biophotonen. Seminar: Biophotonik zur ganzheitlichen

J. Bloksma, M. Northolt and M. Huber, Louis Bolk Institute, 2001108
Qualitätsbeurteilung von Getreide des Internationalen Institutes für Biophysik und der Fa. Biophotonen F.-A.Popp, Neuss (Raketenstation Hombroich), KWALIS Qualitätsforschung Fulda GmbH, Fuldaer Str. 21, D-36160 Dipperz, p. 1-9.
Strube, J. (1998). Zur Charakterisierung pflanzlicher Proben mittels Biophotonik. Fachtagung Neue Aspekte einerganzheitlichen Lebensmittelqualität des Internationalen Institutes für Biophysik und der Schweisfurth-Stiftung, 28.-30. Aug. 1998, Neuss, ehemalige Raketenstation Hombroich, p.
Strube, J. and P. Stolz (1999). Zerstörungsfreie Lebensmitteluntersuchung an Ganzproben mittels Biophotonen-Fluoreszenz-Anregungsspektroskopie. Tagung 1999 der Deutschen Gesellschaft für Qualitätsforschung DGQ,Weihenstephan, Deutsche Gesellschaft für Qualitätsforschung, p. 249-254.
Strube, J. and P. Stolz (2000). Fluorescence Excitation Spectroscopy for the Evaluation of Seeds. IFOAM 2000 - TheWorld Grows Organic, 13th International IFOAM Scient ific Conference, Basel, vdf Hochschulverlag AG an derETH Zürich, p. 306-309.
Strube. J; P. Stolz, 2001: Lichtspeicherung und Lebensmittelqualität. Ökologie & Landbau 117, (1), p.14-19.Treutter, D., Santos-Buelga, C., Gutmann, M. und Kolodziej, H.;1994. Identification of flavan-3-ols and
procyanidins by HPLC and chemical reaction detection. J. Chromatogr. A 667, 290-297.Teubner, R., M. Rattemeyer, et al. (1981). Eine neue Methode zur Untersuchung der Qualität von Pflanzen und
Früchten. Ärztezeitschrift für Naturheilverfahren 22(4/81): 204-205.Veselova, T. V., V. A. Veselovsky, et al. (1985). Delayed luminescence of air-dry soybean seeds as a measure of
their viability. Physiol. Plant. 65: 493-497.Weibel, F.P; Bickel, R.; Leuthold, S, Alföldi, T, 2000: Are organic grown apples tastier and healthier? A comparative
field stuy using conventional and alternative methods to measure fruit quality. Acta Horticultura 517, p.417-425.
Weibel, F.P; R. Bickel; S. Leuthold; T.Alphöldi; U. Niggli; U. Balzer graf, 2001: Bioäpfel – besser und gesunder ?Eine Vergleidchsstudie mit Standard- und Alternativmethoden der Qualitätserfassung. Ökologie & Landbau117 (1) p.25-28.
Wijk, R. van; D.H.J. Schamhart, 1988: Regulatory aspects of low intensity photon emission. Experientia 44, p. 586-593.
Wijk, R. van; J. van Aken, 1992: Photon emission in tumor biology. Experientia 48, p. 1092-1102.