parameter calibration of swathydrology and water quality focusing on long-term drought ... ·...
TRANSCRIPT
Theme I3 – Environmental ApplicationsRoom: Assembly Hall 2
2017 SWATJune 28-30, 2017 Centrum Wodne SGGW, Warsaw, Poland
2017 International SWAT Conference
Parameter Calibration of SWAT Hydrology and Water Quality Focusing on Long-term Drought Periods
Da Rae Kim([email protected])
Ji Wan Lee, Chung Gil Jung, and Seong Joon Kim
Dept. of Civil, Environmental and plant EngineeringKonkuk University, SOUTH KOREA
Contents
Introduction (Why this study?)
Research procedure
Materials and Method SWAT model
The study area description
SWAT parameters sensitivity
Results and Discussion SWAT hydrology calibration (Normal and Big-drought)
SWAT water quality calibration
Summary and conclusions
Introduction (Why this study?)
3
For water resources management in river watershed area, it is essential to make reliable predictions on discharge pattern including scale and frequency during flood or drought periods.
Hydrological model is employed to draw consistent predictions on the stream discharge of such watersheds. Results of hydrological models sensitively convey various factor including spatial assessment of hydrological cycle and parameter estimation scheme.
Recent droughts over past two successive years, 2014 and 2015, were a concentrated long-term drought over north central region of South Korea. In addition to existing annual chronic agricultural drought, it was a severe drought that impeded domestic and industrial water supply.
Thus, to conduct hydrological analysis on long-term drought, additional calibration on parameters should be arranged.
Introduction (Why this study?)
4
In general, the SWAT parameter values are to determine to obtain high efficiency for the whole calibration periods (including flood and drought years).
This study try to calibrate the SWAT parameters focusing on the stream discharge of drought periods. From the results, we will discuss the calibration performance (between the whole period and drought focused), and the meaning of calibrated parameter values.
Long-term droughts are expected to:• increase interception amount of trees and crops• increase evaporation from ground surfaces (especially forest litter layer) • affect infiltration capacity and hydraulic conductivity by soil aggravation• influence subsurface flow and groundwater recharge amount by the lowered groundwater
level

Research procedure
5
SWAT Model Setup
Daily weather data (2002-2015)∘ 3weather stations (SW, IC, CA)∘ Precipitation (mm/day),
Temperature (℃), Wind speed (m/s),Solar radiation (MJ/㎡),Relative humidity(%)
Meteorological Data Watershed boundatyDigital Elevation Model(30m)Soil map (1:25,000)Land use map∘ 7categories
GIS Data Daily streamflow data (2002-2015)∘ Watershed outlet (Gongdo) Daily water quality data (2002-2015)∘ Water quality Observation post
(Anseong cheon2)
Monitoring DataModel Input
Model Process
Model run (2002-2015), warm-up(1998-2001) Parameters sensivity analysisStreamflow, Sediment, T-N, T-P
Model ResultsSWAT Model application
Application of difference parameters∘ Normal vs. drought period calibrated versions Analysis of hydrologic and water quality response to climate variability Evaluation of model performance (𝑹𝑹𝟐𝟐, NSE, RMSE)
Hydrology Normal Calibration (2002-2006, 5yr) Drought period Calibration (2014-2015, 2yr)
Key Parameters Each period of normal and drought
∘ Surface runoff (CN2)∘ Canopy storage (CANMX)∘ Evapotranspiration (ESCO)∘ Soil water (SOL-K, SLSOIL, LAT-TIME)∘ Groundwater (GW-DELAY, GWQMN, ALPHA-BF)
Water Quality Normal and drought period Calibration (2002-2015, 14yr) Key parameters

SWAT (Soil and Water Assessment Tool)
SWAT model (Soil and Water Assessment Tool)
6
SWAT model operations on daily time step andbased on the concept of hydrologic responseunits (HRUs).
HRUs are portion of a sub watershed that possessunique land use / management / soil attributes.
SWAT is able to simulate surface and subsurfaceflow, sediment generation and deposit, andnutrient late and movement through thelandscape and river .
Nitrogen Phosphorus
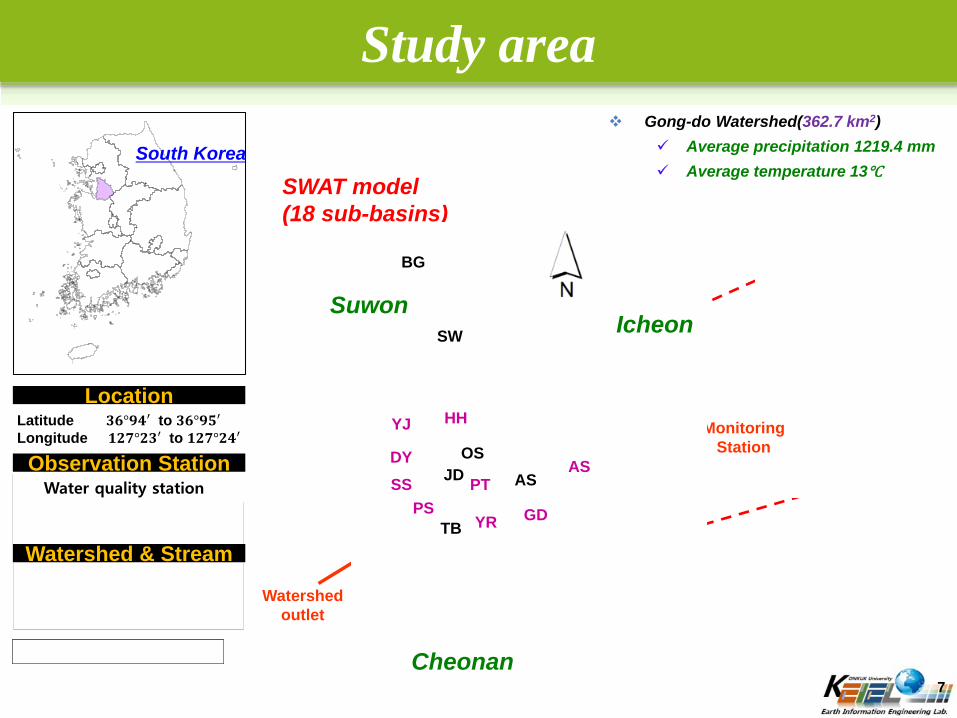
Study area
South Korea
Gong-do Watershed(362.7 km2) Average precipitation 1219.4 mm Average temperature 13℃
7
SWAT model(18 sub-basins)
MonitoringStation
Watershedoutlet
Suwon
Cheonan
Icheon
HHYJ
DYSS
PSPT
YR GD
AS
BG
SW
OSJD
TB
AS
LocationLatitude 𝟑𝟑𝟑𝟑°𝟗𝟗𝟗𝟗𝟗 to 𝟑𝟑𝟑𝟑°𝟗𝟗𝟗𝟗𝟗Longitude 𝟏𝟏𝟐𝟐𝟏𝟏°𝟐𝟐𝟑𝟑𝟗 to 𝟏𝟏𝟐𝟐𝟏𝟏°𝟐𝟐𝟗𝟗𝟗
Observation Station
Watershed & Stream
Water quality station

Materials and Methods
8
SWAT Input DATA
Data Type Source Scale / Period Data Description / Properties
TopographyWater Resources Management Infor
mation System30m by 30m DEM (Digital Elevation Model)
SoilKorea Rural Development
Administration1/25,000
Soil classifications and physical properties viz.
texture, porosity, field capacity, wilting point,
saturated conductivity, and soil depth
Land coverWater Resources Management
Information System30m by 30m 2010 Landsat land use classification (7 classes)
WeatherKorea Meteorological
Administration2002∼2015
Daily precipitation, minimum and maximum temperature, mean wi
nd speed and relative humidity data
StreamflowWater Resources Management
Information System2002∼2015
Daily precipitation, minimum and maximum temperature,
mean wind speed, solar radiation and relative humidity dat
a
Water
QualityWater Information System 2002∼2015 Water quality (SS, T-N and T-P) data

Data for SWAT model evaluation
Elevation: 15 - 540m (average: 278m)
Land cover: forest(52%) and agriculture(19%)
Soil: slit loam(49%) and slit clay loam (17%)
GIS data
9
Elevation Landcover Soil Type

Sensitivity Analysis SWAT hydrological parameters sensitivity analysis
A sensitivity analysis was conducted on the SWAT model parameters before the calibration. 3 of 9 parameters were selected and examined in terms of how they affect the quantity and the
shape of the runoff curve.
Parameter Definition
CN2 SCS curve number for moisture condition
CANMX Maximum canopy storage
ESCO Soil evaporation compensation coefficient
SOL_K Saturated hydraulic conductivity (mm/hr)
SLSOIL Slope length of lateral subsurface flow (m)
LAT_TIME Lateral flow travel time (days)
GW_DELAY Delay time for aquifer recharge (days)
GWQMNThreshold water level in shallow aquifer for
base flow (mm)
ALPHA_BF Base flow recession constant
* Neisch et al.(2002)
CN2 CANMX ESCO
SOL_K SLSOIL LAT_TIME
GW_DELAY ALPHA_BF GWQMN
Surface flow
Interflow
Base flow

Sensitivity Analysis
CN2 CANMX ESCO
SOL_K SLSOIL LAT_TIME
GW_DELAY GWQMN ALPHA_BF
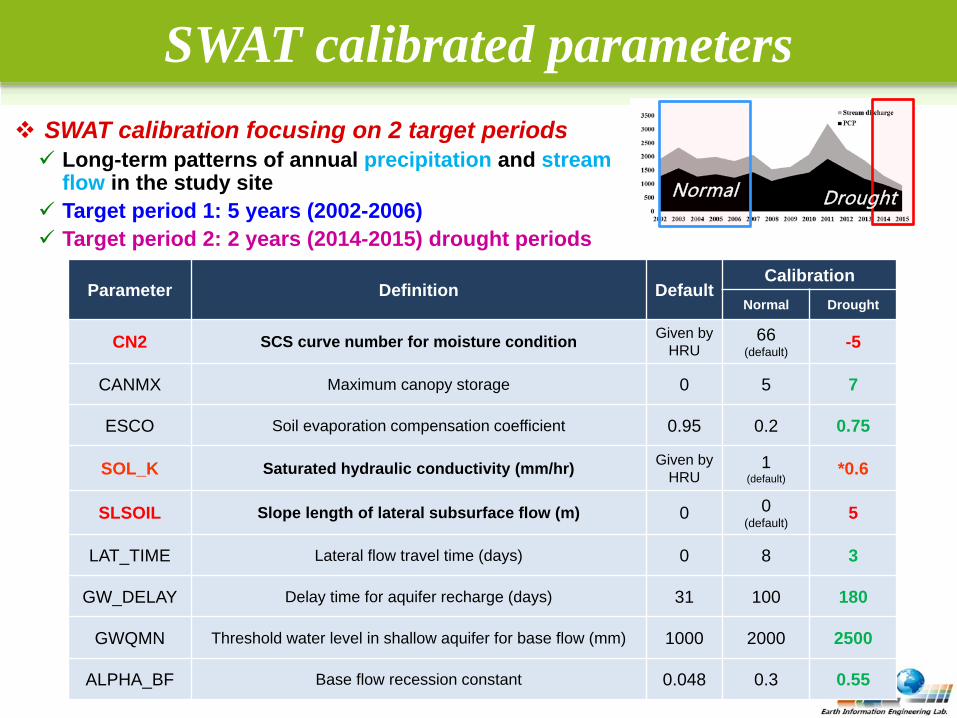
SWAT calibrated parameters SWAT calibration focusing on 2 target periods Long-term patterns of annual precipitation and stream
flow in the study site Target period 1: 5 years (2002-2006) Target period 2: 2 years (2014-2015) drought periods
Normal Drought
Parameter Definition DefaultCalibration
Normal Drought
CN2 SCS curve number for moisture condition Given by HRU
66(default)
-5
CANMX Maximum canopy storage 0 5 7
ESCO Soil evaporation compensation coefficient 0.95 0.2 0.75
SOL_K Saturated hydraulic conductivity (mm/hr) Given by HRU
1(default)
*0.6
SLSOIL Slope length of lateral subsurface flow (m) 0 0(default)
5
LAT_TIME Lateral flow travel time (days) 0 8 3
GW_DELAY Delay time for aquifer recharge (days) 31 100 180
GWQMN Threshold water level in shallow aquifer for base flow (mm) 1000 2000 2500
ALPHA_BF Base flow recession constant 0.048 0.3 0.55

SWAT model calibration
Normal calibration : 5 years (2002-2006)
Drought period calibration : 2 years (2014-2015)
SWAT calibration (Hydrology)
Calibration period
Validation period
Recession shape Low flow
R2: 0.60 (0.63)RMSE: 3.68 (3.87)NSE- Q: 0.78 (0.90)NSE- 1/Q: 0.58 (-0.15)
R2: 0.69 (0.58)RMSE: 3.25 (1.3)NSE- Q: 0.86 (0.92)NSE- 1/Q: 0.76 (0.73)
( ): 2014-2015 results
Calibration period
Focusing on 2002-2006 period, normal calibrated
Average Drought
Focusing on 2014-2015 period, overall drought parameters were calibrated
Hydrology >> Water Quality (SS >> T-P >> T-N)

Model calibration result (Hydrology) Normal vs. Big-drought results of model calibration
NSE Q : Evaluate the peak flow rate of the high-level part NSE 1/Q (inverse Q) : Low-flow simulation of the submerged part
YearPrecipitation (mm) Stream discharge(mm) Runoff Ratio (%)
NSEQ 1/Q
Total Jun. ~ Sep.
Oct. ~May Obs. Nor. Drou. Obs. Nor. Drou. Nor. Drou. Nor. Drou.
2002 1,285.0 840.7 444.3 555.0 622.0 663.5 48.4 54.3 57.9 0.91 0.96 0.56 0.512003 1,586.4 1,120.6 465.8 857.8 890.3 948.5 56.3 58.5 62.3 0.92 0.96 0.68 0.862004 1,275.9 928.3 347.6 635.2 654.3 723.3 54.4 56.0 61.9 0.92 0.94 0.95 0.902005 1,362.5 1,074.7 287.8 690.9 624.7 686.4 50.7 45.9 50.4 0.97 0.98 0.75 0.912006 1,235.8 902.3 333.5 647.8 644.9 695.5 64.2 64.0 69.0 0.78 0.82 0.63 0.882007 1,437.9 1,025.0 412.9 630.9 742.4 781.7 43.9 51.6 54.4 0.92 0.95 0.74 0.642008 1,118.8 859.6 260.2 428.5 461.6 511.6 38.3 41.3 45.7 0.89 0.92 0.79 0.792009 1,291.1 908.1 383.0 338.5 526.1 566.6 26.2 40.7 43.9 0.11 0.44 0.83 0.802010 1,426.0 1,036.4 389.6 653.8 699.2 721.7 45.8 49.0 50.6 0.32 0.49 0.69 0.752011 1,927.3 1,499.2 428.1 1285.5 1219.1 1230.0 66.7 63.3 63.8 0.64 0.81 0.60 0.752012 1,548.8 1,170.5 378.4 797.1 789.5 835.1 47.6 51.0 53.9 0.94 0.97 0.79 0.732013 1,193.4 783.4 410.0 663.8 564.7 633.5 55.6 47.3 53.1 0.85 0.90 0.43 0.712014 997.9 668.6 329.3 375.2 310.2 362.7 37.6 31.1 36.3 0.97 0.97 0.12 0.882015 514.4 331.7 418.8 201.2 130.1 169.4 39.2 25.3 32.9 0.84 0.86 -0.42 0.58AVG. 1,300.1 939.1 377.8 621.5 634.2 680.7 48.2 48.5 52.6 0.78 0.86 0.58 0.76

SWAT parameters (Water quality) Water quality calibration
• The runoff calibration should come first, since the water quality affects the surface runoff that contributes to the streamflow.
• The calibration on the sediment should be preceded because T-N and T-P are influenced by the runoff and the sediment transfer.
Hydrology >> Water Quality (SS >> T-P >> T-N)
Component Parameters Definition Default*Calibration
Normal Drought
SedimentCH_COV2 Channel cover factor 0 -0.001 -0.001
LAT_SED Sediment concentration in lateral and groundwaterflow (mg/L) 0 15 15
Nitrogen
LAT_ORGN Organic N in the baseflow (mg/L) 0 150 150RAMMO_SUB Atmospheric deposition of ammonium 0 0.95 0.95
RCN_SUB Atmospheric deposition of nitrate 0 2 2
N_UPDIS Nitrogen uptake distribution parameter 20 20 80
CMN Rate coefficient for mineralization of the humus active organic nutrients 0.0003 0.0003 0.003
NPERCO Nitrate percolation coefficient 0.2 0.25 0.25
PhosphorusLAT_ORGP Organic P in the base flow (mg/L) 0 4 4
GWSOLP Concentration of soluble phosphorus in groundwater contribution to stream from subbasin (mg P/L or ppm) 0 0.4 0.4

Model calibration (Water quality)
R2: 0.62 (0.76) R2: 0.71(0.84)
R2: 0.58 (0.69) R2: 0.65 (0.77)
R2: 0.50 (0.54) R2: 0.62 (0.60)
NormalDrought
( ): 2014-2015 results
SS
T-N
T-P
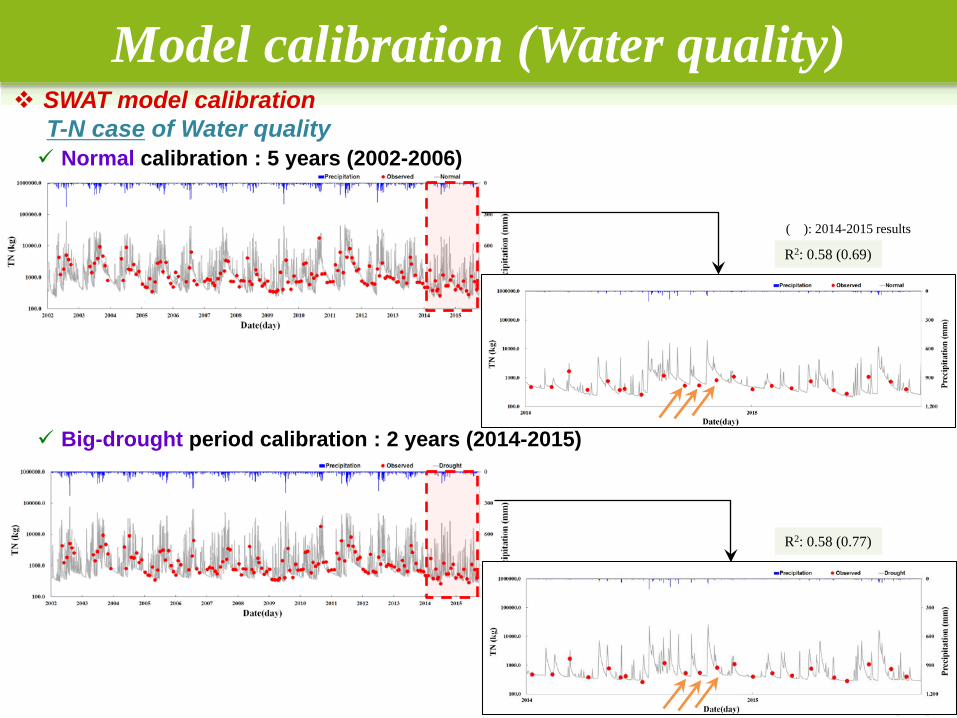
Model calibration (Water quality) SWAT model calibration
T-N case of Water quality Normal calibration : 5 years (2002-2006)
Big-drought period calibration : 2 years (2014-2015)
R2: 0.58 (0.69)
( ): 2014-2015 results
R2: 0.58 (0.77)
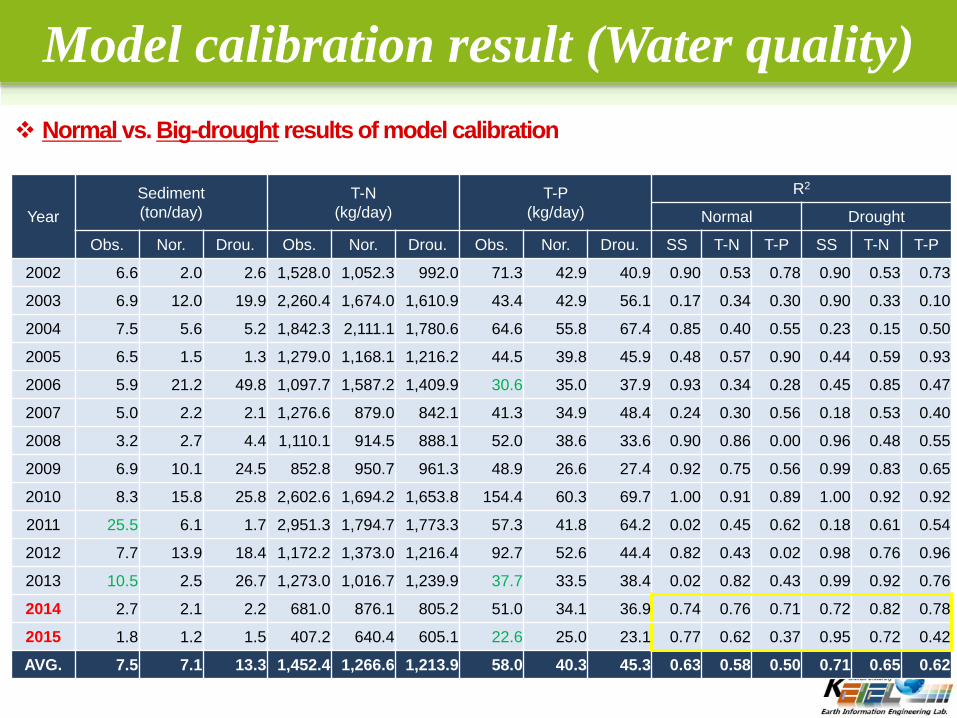
Model calibration result (Water quality) Normal vs. Big-drought results of model calibration
YearSediment(ton/day)
T-N (kg/day)
T-P(kg/day)
R2
Normal Drought
Obs. Nor. Drou. Obs. Nor. Drou. Obs. Nor. Drou. SS T-N T-P SS T-N T-P
2002 6.6 2.0 2.6 1,528.0 1,052.3 992.0 71.3 42.9 40.9 0.90 0.53 0.78 0.90 0.53 0.73
2003 6.9 12.0 19.9 2,260.4 1,674.0 1,610.9 43.4 42.9 56.1 0.17 0.34 0.30 0.90 0.33 0.10
2004 7.5 5.6 5.2 1,842.3 2,111.1 1,780.6 64.6 55.8 67.4 0.85 0.40 0.55 0.23 0.15 0.50
2005 6.5 1.5 1.3 1,279.0 1,168.1 1,216.2 44.5 39.8 45.9 0.48 0.57 0.90 0.44 0.59 0.93
2006 5.9 21.2 49.8 1,097.7 1,587.2 1,409.9 30.6 35.0 37.9 0.93 0.34 0.28 0.45 0.85 0.47
2007 5.0 2.2 2.1 1,276.6 879.0 842.1 41.3 34.9 48.4 0.24 0.30 0.56 0.18 0.53 0.40
2008 3.2 2.7 4.4 1,110.1 914.5 888.1 52.0 38.6 33.6 0.90 0.86 0.00 0.96 0.48 0.55
2009 6.9 10.1 24.5 852.8 950.7 961.3 48.9 26.6 27.4 0.92 0.75 0.56 0.99 0.83 0.65
2010 8.3 15.8 25.8 2,602.6 1,694.2 1,653.8 154.4 60.3 69.7 1.00 0.91 0.89 1.00 0.92 0.92
2011 25.5 6.1 1.7 2,951.3 1,794.7 1,773.3 57.3 41.8 64.2 0.02 0.45 0.62 0.18 0.61 0.54
2012 7.7 13.9 18.4 1,172.2 1,373.0 1,216.4 92.7 52.6 44.4 0.82 0.43 0.02 0.98 0.76 0.96
2013 10.5 2.5 26.7 1,273.0 1,016.7 1,239.9 37.7 33.5 38.4 0.02 0.82 0.43 0.99 0.92 0.76
2014 2.7 2.1 2.2 681.0 876.1 805.2 51.0 34.1 36.9 0.74 0.76 0.71 0.72 0.82 0.78
2015 1.8 1.2 1.5 407.2 640.4 605.1 22.6 25.0 23.1 0.77 0.62 0.37 0.95 0.72 0.42
AVG. 7.5 7.1 13.3 1,452.4 1,266.6 1,213.9 58.0 40.3 45.3 0.63 0.58 0.50 0.71 0.65 0.62
Summary and conclusions
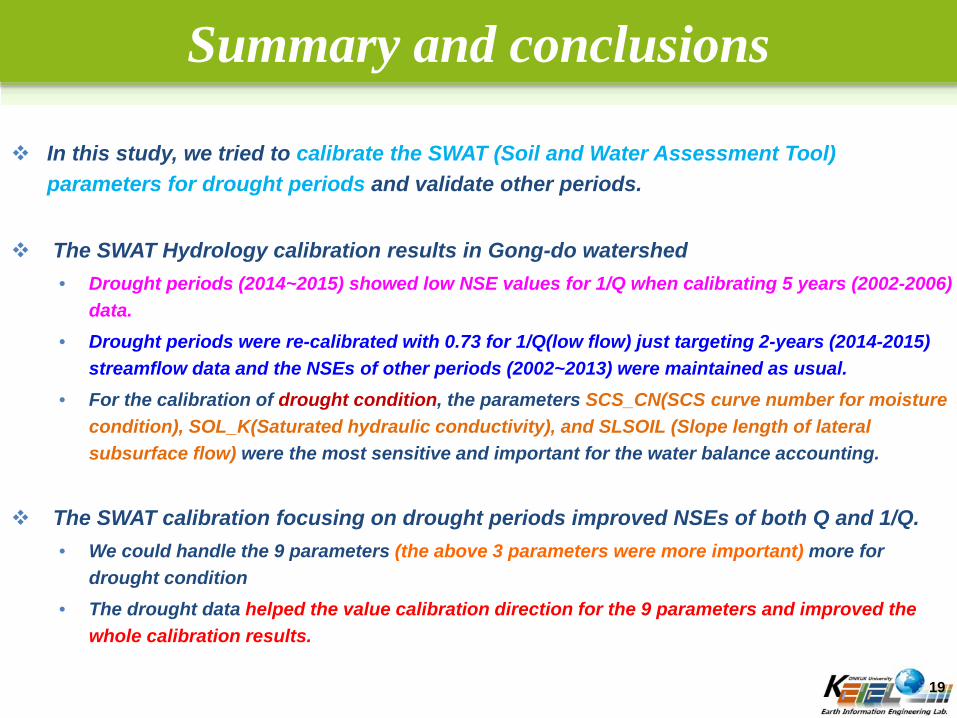
In this study, we tried to calibrate the SWAT (Soil and Water Assessment Tool) parameters for drought periods and validate other periods.
The SWAT Hydrology calibration results in Gong-do watershed• Drought periods (2014~2015) showed low NSE values for 1/Q when calibrating 5 years (2002-2006)
data.• Drought periods were re-calibrated with 0.73 for 1/Q(low flow) just targeting 2-years (2014-2015)
streamflow data and the NSEs of other periods (2002~2013) were maintained as usual.• For the calibration of drought condition, the parameters SCS_CN(SCS curve number for moisture
condition), SOL_K(Saturated hydraulic conductivity), and SLSOIL (Slope length of lateral subsurface flow) were the most sensitive and important for the water balance accounting.
The SWAT calibration focusing on drought periods improved NSEs of both Q and 1/Q.• We could handle the 9 parameters (the above 3 parameters were more important) more for
drought condition• The drought data helped the value calibration direction for the 9 parameters and improved the
whole calibration results.
19

Summary and conclusions
The SWAT Water quality calibration results in Gong-do watershed• In the case of T-N, we tried to adjust the N-UPDIS, in consideration of the soil drying effect due to
drought and to reflect the uptake phenomenon in the plant rewetting process.
• The efficiency was influenced by the runoff rate and there was no significant difference in the
correlation (R2) analysis between the normal calibration model and drought focus model.
• However, when the drought model was calibrated, it was possible to obtain more accurate results
by further considering the parameters related to the soil (N-UPDIS, CMN).
Based on the results, we propose a new method to model extreme hydrological
phenomenon, such as drought, that is more accurate and efficient than the overall
modeling methods.
20
Thank youEarth Information Engineering Lab.
Kim, Da RaeDept. of Civil and Environmental System Engineering
Konkuk University, Seoul, South Korea
Phone: +82-2-444-0186Email: [email protected],kr
Web: http://konkuk.ac.kr/~kimsj/