parallel transmission for magnetic resonance imaging of
TRANSCRIPT

HAL Id: tel-00732658https://tel.archives-ouvertes.fr/tel-00732658
Submitted on 16 Sep 2012
HAL is a multi-disciplinary open accessarchive for the deposit and dissemination of sci-entific research documents, whether they are pub-lished or not. The documents may come fromteaching and research institutions in France orabroad, or from public or private research centers.
L’archive ouverte pluridisciplinaire HAL, estdestinée au dépôt et à la diffusion de documentsscientifiques de niveau recherche, publiés ou non,émanant des établissements d’enseignement et derecherche français ou étrangers, des laboratoirespublics ou privés.
Parallel transmission for magnetic resonance imaging ofthe human brain at ultra high field : specific absorption
rate control & flip-angle homogenizationMartijn Anton Hendrik Cloos
To cite this version:Martijn Anton Hendrik Cloos. Parallel transmission for magnetic resonance imaging of the humanbrain at ultra high field : specific absorption rate control & flip-angle homogenization. Other [cond-mat.other]. Université Paris Sud - Paris XI, 2012. English. NNT : 2012PA112066. tel-00732658
UNIVERSITÉ PARIS-SUD XI
ÉCOLE DOCTORALE : STITS
Laboratoire de : NeuroSpin
DISCIPLINE : Physique
THÈSE DE DOCTORAT
soutenue le 17/04/2012
par
Martijn Anton Hendrik CLOOS
Parallel Transmission for MagneticResonance Imaging of the Human Brain at
Ultra High Field
Specific Absorption Rate Control & Flip-Angle Homogenization
Directeur de thèse : Denis Le Bihan Dr. MD. (Directeur de NeuroSpin)
Composition du jury :
Président du jury : Luc Darrasse Dr. (Directeur de l’IR4M au CNRS)Rapporteurs: Cornelis van den Berg Dr. Ir. (Directeur de recherche à l’Hôpital de l’Université d’Utrecht)
Maxim Zaitsev Dr. (Directeur de recherche à l’Hôpital de l’Université de Freiburg)Examinateur : Hans-Peter Fautz Dr. (Ingénieur chercheur à Siemens Healthcare)Encadrant : Alexis Amadon Dr. (Ingénieur chercheur à NeuroSpin)
date of print: May 15, 2012

© Martijn Anton Hendrik Cloos 2012

Preface
This thesis is submitted in partial fulfillment of the requirements for the Degree of Doctor of Philosophy atUniversity Paris-Sud XI. The results presented herein are based on the author’s scientific endeavors performedbetween February 2009 and January 2012 at NeuroSpin. In the framework of the Franco-German Iseult-INUMAC project, and in anticipation of the whole body 11.7-Tesla magnetic resonance imaging setup, thiswork focuses on the development of parallel-transmission strategies to maximize the performance of currentand future ultra-high field systems. Apart from aspiring to the realization of the above-mentioned goals, theauthor hopes this writing will assist scientists new to the field of parallel-transmission and that it will helpin the continuation of this work at NeuroSpin.
Aknowledgements
I would like to express my appreciation to all those who gave me the possibility to complete this thesis.
I thank Denis Le Bihan, Frank Lethimonnier, and Cyril Poupon for orchestrating the opportunity to workand learn in a great environment such as Neurospin, not only providing the best of tools and excellentcolleagues to interact with, but also the freedom to explore my own ideas.
I am grateful to Alexis Amadon and Nicolas Boulant for their continuous support throughout all my scientificendeavors presented in this work. Their attitude towards work was most inspiring and I fondly recall themany discussions we had, the scope of which vastly exceeds the field of MRI. Over the years I learnt toadmire Alexis’ relaxed attitude and patience, as well as Nicolas’ dedication to understand every conceptdown to the smallest detail. In addition, I would like to thank them both for proofreading my manuscriptsincluding this thesis.
It has been a pleasure interacting with all members at NeuroSpin. Among them, in particular, I thank: BachirJarraya (for introducing me to NeuroSpin), Christopher Wiggins (for his efforts to maintain and improvethe 7-Tesla system, in addition to inspiring me with his creative thinking), Eric Giacomini and Marie-FranceHang (for their support, always at the ready to help troubleshooting and repairing electronics even under thetime pressure of a waiting subject), Karl Edler (for the invigorating discussions, and explaining numerousconcepts particular to RF-engineering), the new PhD students Aurelien Massire and Alfredo Lopez (whowill be continuing the group effort to enhance the multi-transmit capabilities available to the lab).
In addition, I would like to thank Antoine Dael and Michel Luong for allowing me to benefit from theresources available at Institute de Recherche sur les Fondamentales de l’ Univers (IRFU). I particularlyenjoyed the many discussions about RF-coil design and electromagnetic simulations.
I am thankful to all my colleagues at IRFU with whom I had the pleasure to work. In particular, I wouldlike to thank my fellow PhD student Guillaume Ferrand who dedicated most of his time to the developmentof the transmit-array coils used throughout this work.
The technical support from the Siemens Healthcare team was especially appreciated. For this I thank: FranzSchmitt, Ulrich Fontius, Hans-Peter Fautz, Philippe Rouffiat, Luc Renou, and Alexandre Vignaud.
Finally, and most importantly, I would like to thank: my brother Peter and sisters Kitty and Jacqueline(whom I admire for setting an example of what could be achieved by hard work and dedicated study), mynephews and nieces (who had to tolerate my near complete absence throughout most of their years), andmy parents Anton and Joke, for their unconditional love and support.
Martijn A. H. Cloos
Gometz-la-Ville, France
January 2012


A Contents 0
Contents 5
Résumé (Extended French Summary) 7
General Introduction 17
Scientific goals addressed in this work . . . . . . . . . . . . . . . . . . . . . . . . . . . . . . . . . . 18
Overview of this thesis . . . . . . . . . . . . . . . . . . . . . . . . . . . . . . . . . . . . . . . . . . . 18
1 Background 19
1.1 Nuclear Magnetic Resonance . . . . . . . . . . . . . . . . . . . . . . . . . . . . . . . . . . . . 19
1.2 Magnetic Resonance Imaging . . . . . . . . . . . . . . . . . . . . . . . . . . . . . . . . . . . . 21
1.3 Specific Absorption Rate . . . . . . . . . . . . . . . . . . . . . . . . . . . . . . . . . . . . . . . 26
1.4 Ultra High Field MRI . . . . . . . . . . . . . . . . . . . . . . . . . . . . . . . . . . . . . . . . 27
2 Multi Dimensional RF-Pulses & Parallel Transmission 31
2.1 A k-space analysis of small-tip-angle excitations . . . . . . . . . . . . . . . . . . . . . . . . . . 31
2.2 Transmit-Arrays . . . . . . . . . . . . . . . . . . . . . . . . . . . . . . . . . . . . . . . . . . . 32
2.3 Transmit-Sense . . . . . . . . . . . . . . . . . . . . . . . . . . . . . . . . . . . . . . . . . . . . 33
3 Experimental Setup 39
3.1 Introduction . . . . . . . . . . . . . . . . . . . . . . . . . . . . . . . . . . . . . . . . . . . . . . 39
3.2 Gradient & Shim Coils . . . . . . . . . . . . . . . . . . . . . . . . . . . . . . . . . . . . . . . . 39
3.3 Radio-Frequency Chain . . . . . . . . . . . . . . . . . . . . . . . . . . . . . . . . . . . . . . . 39
3.4 Transmit-Array Coil . . . . . . . . . . . . . . . . . . . . . . . . . . . . . . . . . . . . . . . . . 40
3.5 Computational Resources . . . . . . . . . . . . . . . . . . . . . . . . . . . . . . . . . . . . . . 43
4 Specific Absorbtion Rate Assessment 45
4.1 Introduction . . . . . . . . . . . . . . . . . . . . . . . . . . . . . . . . . . . . . . . . . . . . . . 46
4.2 Part I: Validation of Electromagnetic Simulations . . . . . . . . . . . . . . . . . . . . . . . . . 46
4.3 Part II: Online SAR Assessment Based on Time-Averaged Power Measurements . . . . . . . . 51
5 Local SAR Reduction in Parallel Excitation Based on Channel-dependent TikhonovParameters. 57
5.1 Introduction . . . . . . . . . . . . . . . . . . . . . . . . . . . . . . . . . . . . . . . . . . . . . . 58
5.2 Theory . . . . . . . . . . . . . . . . . . . . . . . . . . . . . . . . . . . . . . . . . . . . . . . . . 59
5.3 Methods . . . . . . . . . . . . . . . . . . . . . . . . . . . . . . . . . . . . . . . . . . . . . . . . 59
5.4 Results . . . . . . . . . . . . . . . . . . . . . . . . . . . . . . . . . . . . . . . . . . . . . . . . . 62
5.5 Discussion . . . . . . . . . . . . . . . . . . . . . . . . . . . . . . . . . . . . . . . . . . . . . . . 65

Contents
6 kT -Points: Short Three-Dimensional Tailored RF Pulses for Flip-Angle HomogenizationOver an Extended Volume 67
6.1 Introduction . . . . . . . . . . . . . . . . . . . . . . . . . . . . . . . . . . . . . . . . . . . . . . 68
6.2 Methods . . . . . . . . . . . . . . . . . . . . . . . . . . . . . . . . . . . . . . . . . . . . . . . . 69
6.3 Results . . . . . . . . . . . . . . . . . . . . . . . . . . . . . . . . . . . . . . . . . . . . . . . . . 72
6.4 Discussion . . . . . . . . . . . . . . . . . . . . . . . . . . . . . . . . . . . . . . . . . . . . . . . 75
6.5 Conclusions . . . . . . . . . . . . . . . . . . . . . . . . . . . . . . . . . . . . . . . . . . . . . . 77
7 Non-Selective Excitations with an Arbitrary Flip-Angle 79
7.1 Introduction . . . . . . . . . . . . . . . . . . . . . . . . . . . . . . . . . . . . . . . . . . . . . . 80
7.2 Limitations of the (Extended) Small Tip Angle Approximation . . . . . . . . . . . . . . . . . 80
7.3 The Optimal Control Approach . . . . . . . . . . . . . . . . . . . . . . . . . . . . . . . . . . . 81
7.4 Adaptation to kT -points (with initial magnetization Mz = M0) . . . . . . . . . . . . . . . . . 84
7.5 Joint k-space optimization . . . . . . . . . . . . . . . . . . . . . . . . . . . . . . . . . . . . . 87
7.6 LTA pulse design: B+1 versus B0 . . . . . . . . . . . . . . . . . . . . . . . . . . . . . . . . . . 90
7.7 Summary and Recommendations . . . . . . . . . . . . . . . . . . . . . . . . . . . . . . . . . . 93
8 Parallel-Transmission-Enabled Magnetization-Prepared Rapid Gradient-Echo T1-WeightedImaging of the Human Brain at 7 Tesla 95
8.1 Introduction . . . . . . . . . . . . . . . . . . . . . . . . . . . . . . . . . . . . . . . . . . . . . . 96
8.2 Methods . . . . . . . . . . . . . . . . . . . . . . . . . . . . . . . . . . . . . . . . . . . . . . . . 97
8.3 Results . . . . . . . . . . . . . . . . . . . . . . . . . . . . . . . . . . . . . . . . . . . . . . . . . 99
8.4 Discussion . . . . . . . . . . . . . . . . . . . . . . . . . . . . . . . . . . . . . . . . . . . . . . . 107
8.5 Conclusions . . . . . . . . . . . . . . . . . . . . . . . . . . . . . . . . . . . . . . . . . . . . . . 109
9 A Minimalistic approach to Transmit-SENSE 111
9.1 Introduction . . . . . . . . . . . . . . . . . . . . . . . . . . . . . . . . . . . . . . . . . . . . . . 112
9.2 Methods . . . . . . . . . . . . . . . . . . . . . . . . . . . . . . . . . . . . . . . . . . . . . . . . 112
9.3 Results . . . . . . . . . . . . . . . . . . . . . . . . . . . . . . . . . . . . . . . . . . . . . . . . . 115
9.4 Discussion . . . . . . . . . . . . . . . . . . . . . . . . . . . . . . . . . . . . . . . . . . . . . . . 118
10 Summary & Recommendations 121
Bibliography 123
Nomenclature 136
6

Résumé
Les hauts champs magnétiques constituent une solution prometteuse
dans la poursuite d’une résolution toujours plus fine des images IRM.
Alors que la montée du champ statique améliore progressivement le
signal RMN (Ocali and Atalar, 1998), elle augmente simultanément
la fréquence de Larmor des protons. Si on considère les systèmes clin-
iques à 3 Tesla, la longueur d’onde RadioFréquence (RF) est déjà com-
parable aux dimensions transverses du corps humain. En conséquence,
lors d’investigations sur les grands organes tels que l’abdomen ou les
cuisses, des zones d’ombre et des pertes de contraste faussent l’image
(Bernstein et al., 2006). En passant à 7 Tesla, les disparités de ré-
partition spatiale du champ RF sont si fortes que les artefacts de
contraste se développent aussi dans des régions plus petites telles que
le cerveau humain. Dans la perspective des premiers systèmes à 11.7
Tesla actuellement en cours de réalisation à NeuroSpin et au NIH, il de-
vient crucial de fournir des solutions pour atténuer les non-uniformités
de l’excitation des spins. A défaut de quoi, de tels systèmes à très haut

champ ne pourront atteindre leur plein potentiel.
Pour relever ce défi, un système de transmission parallèle (pTx) à
8 canaux a été installé auprès de notre imageur à 7 Tesla. Alors
que la plupart des systèmes IRM cliniques n’utilisent qu’un seul canal
d’émission, l’extension pTx permet de jouer différentes formes
d’impulsions RF de concert sur plusieurs canaux. Si cette méthode
offre une grande souplesse dans la conception d’impulsions RF, elle
autorise également une pléthore de distributions d’énergie RF dans
le corps exposé (Angelone et al., 2006). Les dépôts d’énergie (Taux
d’Absorption Spécifique ou TAS) locaux et globaux devant être lim-
ités afin d’assurer la sécurité des patients (IEC, 2010), il s’agit de
rechercher les formes d’impulsions RF qui permettront d’exciter le
motif désiré sans introduire de « points chauds ».
Les degrés de liberté supplémentaires fournis par l’extension pTx peu-
vent être mis à profit pour orienter la solution RF vers des distributions
d’énergie favorables. Dans ce travail de thèse, cette considération est
démontrée par l’optimisation itérative d’un ensemble de paramètres
Tikhonov indexés par canal d’émission RF dans le but de supprimer
les points chauds (Cloos et al., 2010c). On montre que si cette ap-
proche intuitive est robuste et gérable sur le plan computationnel, elle
impose en revanche une légère dégradation de la fidélité d’excitation
en général. Des méthodes récentes plus élaborées ont été publiées
permettant à la solution RF d’être optimisée vis à vis du TAS, tout
en conservant un niveau de fidélité fixe (Brunner and Pruessmann,
2010; Lee et al., 2010). Cependant, ces méthodes sont encore lim-
itées à l’approximation des petits angles de bascule de l’aimantation
(Pauly and Nishimura, 1989). Compte tenu de la robustesse et de la
flexibilité offerte par l’approche du contrôle optimal (Xu et al., 2008),
les contraintes de TAS local et global pourraient être complètement
intégrées à la conception des impulsions RF même si des Angles de
Bascule (AB) élevés sont ciblés.
Au cours de cette thèse, la gestion du TAS local dans la concep-
tion d’impulsions RF a été principalement un exercice théorique pour
illustrer la flexibilité de l’approche pTx. En effet, jusqu’à présent,

l’application de ces méthodes a été entravée par les systèmes de sécu-
rité RF installés, la phase et l’amplitude transmises n’étant pas surveil-
lées en temps réel sur chaque canal, ce qui oblige à considérer la pire
des interférences de champ électrique en chaque instant et en chaque
voxel. Même si une approche pratique de l’évaluation en ligne du
TAS ainsi surestimé a été mise en œuvre, cette méthode conserva-
trice ne permet pas d’exploiter les véritables et souhaitables inter-
férences destructives du champ E. Par conséquent, l’optimisation du
vrai TAS local ne fournit que des avantages limités dans ce cadre de
travail bridé. Cependant, des systèmes de surveillance de TAS plus
sophistiqués finiront par rendre possible les bénéfices de la conception
d’impulsions sous contrainte de TAS local (Graesslin, 2008; Gagoski
et al., 2009). Notre approche conservatrice a néanmoins permis de
valider de nouvelles stratégies de conception d’impulsions in-vivo.
La conception d’impulsions RF non-sélectives de type « kT -points »,
introduite dans ce travail pour homogénéiser l’AB sur des volumes
étendus, est largement testé dans le contexte de la pTx en imagerie

du cerveau humain à 7 Tesla (Cloos et al., 2012). L’idée de principe
est de limiter la trajectoire de l’espace-k de transmission (parcourue
avec les gradients) à un petit groupe de points autour du centre de cet
espace. De cette façon, comme les inhomogénéités RF sont dominées
par de basses fréquences spatiales, la limitation des excursions dans
l’espace-k garantit qu’aucune énergie n’est gaspillée à des fréquences
spatiales élevées d’un faible intérêt pour l’uniformisation de l’AB. De
plus le temps requis pour couvrir les quelques kT -points est minimisé,
permettant une faible durée des impulsions simultanées résultantes.
En définitive, le véritable test de la stratégie des kT -points est démon-
tré par sa capacité à regagner un excellent contraste entre les tissus
cérébraux au cours de séquences 3D traditionnelles comme la MP-
RAGE (Mugler and Brookeman, 1990). En généralisant la conception
d’impulsions RF à des impulsions à grand AB (inversions) grâce à
l’approche du contrôle optimal, les impulsions adiabatiques gourman-
des en TAS peuvent être remplacées par des impulsions basées sur
les kT -points plus efficaces et moins énergivores, restorant le contraste

attendu entre matière grise et matière blanche partout dans le cerveau.
Ainsi ces inversions, rendues possibles par la pTx, améliorent simul-
tanément la qualité d’image, le TAS déposé, et ce avec une durée
d’impulsion réduite. Les effets de susceptibilité magnétique, qui aug-
mentent avec le champ statique, peuvent toutefois représenter un défi
aux impulsions d’inversion basées sur les kT -points. Bien qu’on mon-
tre que ces effets peuvent être mitigés si on prend en considération
les régions touchées dans la conception des impulsions, la qualité du
résultat final dépend grandement de la précision avec laquelle la ré-
gion d’intérêt (ROI) est démarquée. En ce qui concerne les applica-
tions en neuro-imagerie, des logiciels dédiés sont disponibles pour ex-
traire le volume du cerveau à partir d’images de qualité. Cependant,
quand on définit la ROI pour la conception d’impulsions, de telles
images ne sont pas encore disponibles. Ainsi, de tels programmes
doivent s’accommoder d’images faiblement contrastées avec une réso-
lution grossière, pour lesquels ils ne sont pas optimisés. Malgré ces

conditions défavorables, on montre qu’il est possible d’automatiser le
processus de démarcation de ROI, cependant que des améliorations de
robustesse sont encore désirables.
Dans le travail présenté ici, seules des séquences de type Echos de
Gradients sont considérées. Pour étendre la portée des kT -points aux
séquences de type Spin-Echo, l’algorithme de conception devrait être
généralisé pour inclure les impulsions refocalisantes. Des premiers
jalons ont été posés dans ce sens, de sorte à pouvoir incorporer de
telles impulsions dans des séquences 3D comme la SPACE (Mugler
et al., 2000).
Si on observe plus en détail notre conception d’impulsions RF à grand
AB, l’approche de contrôle optimal commence avec une solution ini-
tiale basée sur l’approximation des petits angles. Cependant ceci im-
pose des limitations sévères sur la solution optimisée : le minimum
local de la fonction de coût trouvé n’est pas garanti proche du min-
imum global. Par ailleurs, l’inclusion de la trajectoire de l’espace-k
comme sous-ensemble de paramètres au sein de l’optimisation fait de

la recherche de la solution optimale un défi encore plus grand. In-
tuitivement, il semble qu’en améliorant la conception d’impulsions à
grand AB, le dépôt d’énergie pourrait être encore plus réduit.
Finalement, l’implémentation de la pTx elle-même est reconsidérée
dans cette thèse. Bien que nous ayons pu montrer d’excellents résul-
tats avec une extension à 8 canaux, les coûts et l’expérience technique
nécessaires pour exploiter un tel système posent problème pour un us-
age en routine clinique. Par conséquent plusieurs configurations sim-
plifiées sont envisagées par le biais de la simulation, pour évaluer le
potentiel d’une solution hardware à moindre coût avec un nombre ré-
duit de canaux de transmission. De premiers résultats montrent que,
au moins dans le régime des petits angles de bascule, deux canaux
parallèles (ou mêmes séquentiels) sont suffisants pour homogénéiser
l’AB dans le cerveau humain à 7T. Pour le moment, ces résultats sont
basés sur des cartes de B+1 mesurées in-vivo avec notre système pTx à
8 canaux. Une des étapes suivantes est de réaliser le hardware capa-
ble de piloter une antenne à N éléments de transmission en utilisant

seulement 2 voies de transmission. En plus, pour confirmer
l’applicabilité de cette approche dans un environnement clinique, ce
concept devrait être évalué sur d’autres parties du corps humain et en
considérant tous les AB possibles. En particulier, pour chaque appli-
cation clinique particulière, les limitations en termes de TAS devraient
être investiguées pour déterminer si un système à 2 canaux est suff-
isant ou si davantage de voies sont requises au regard de la fidélité
d’excitation désirée.


A General Introduction 0
Medical imaging concerns a wide variety of methods dedicated to aid the diagnostic process and further theunderstanding of pathological conditions. From the perspective of both patient comfort and clinical perfor-mance, in particular when considering delicate anatomical structures with limited regenerative capabilitiessuch as the brain, non-invasive techniques are often preferable. Although neuroplasticity facilitates somestructural reorganization to mitigate the impact of lesions (Cao et al., 1994; Buonomano and Merzenich,1998), recent studies suggest that the vast majority of neurons in the human neocortex are created at aprenatal stage and persists throughout most of each individual’s life without replacement (Nowakowski,2006).
Over the years, several tomography methods have been developed to provide clinically relevant brain images(Abraham, 2011). Among the most well known three-dimensional imaging techniques to date are: Com-puted Tomography (CT), Positron Emission Tomography (PET) and Magnetic Resonance Imaging (MRI).Although each of the aforementioned techniques has its merits, the first two of them both involve ionizingradiation and offer either limited soft tissue contrast or a relatively coarse resolution. On the contrary, MRIallows images to be resolved down to a sub-millimeter voxel size, while facilitating multiple contrast mech-anisms that can be exploited to differentiate between tissues or indicate various pathological conditions. Inaddition, functional MRI (fMRI) provides cognitive neuro-scientists with a window into the human mind.
Considering the microscopic scale of the laminar and columnar structures in the cortex, there is a strongdesire to perform measurements with high spatial and temporal resolution. Although planar multielectrodearrays (Strumwasser, 1958) and later linear multicontact electrodes (Barna et al., 1981) allow neural ac-tivation to be measured among neighboring columnar structures or different cortical layers, these invasivetechniques are hampered by technical and ethical constraints. Apart from their limited spatial coverage,their tendency to result in glial scar formation limits their clinical applications and precludes them as in-vestigational devices for neuroscience concerning the healthy human brain (Cheung, 2007). What is more,none of these techniques offers the opportunity to provide the anatomical reference necessary to account forinter-subject morphological variability.
Magnetic resonance imaging, on the other hand, facilitates both the acquisition of functional data and theanatomical reference requisite for the averaging or comparison between multiple subjects (Friston et al.,1995; Ardekani et al., 2005). Furthermore, highly-resolved structural brain imaging provides excellent tissuedelineation, which has already provided profound insights into the ageing brain (Gur et al., 1991) and theprogression of neurodegenerative diseases such as Alzheimer (Silbert et al., 2003) and Huntington’s disease(Thieben et al., 2002). Moreover, recent findings support the notion that various pathological conditionsresult in a regional-dependent deterioration of the cortical ribbon (Dickerson et al., 2009; Kirk et al., 2009).These findings have initiated a demand for high-quality highly-resolved cross-sectional and longitudinalstudies focusing on isolated regions, such as the hippocampus (Breyer et al., 2010).
In pursuit of a MRI-based technique to satisfy the above-mentioned needs, ever-higher main magnetic fieldstrengths are explored. In the 11 years since the introduction of the first 7-Tesla MRI system suitablefor human imaging, close to fifty such ultra-high-field (UHF) systems, including several 9.4-Tesla systems,have been installed around the world. Combined with recent advances in phased-array-coil technology andsequence development, these UHF systems start to probe spatial resolutions comparable to those of thecytoarchitectonic structures in the brain (Yacoub et al., 2008; Von Economo and Koskinas, 1927). Thisallows cognitive neuroscientists to investigate the cortical activation with better spatial precision aidingthem in their understanding of the processing and computations carried out by individual cortical columns(Grinvald et al., 2000).
However, already at 3-Tesla the radio frequency (RF) wavelength corresponding to the proton Larmor fre-quency becomes comparable to the dimensions of some imaged human body parts. This results in zones ofshade and losses of contrast distributed across the images of large organs such as the abdomen or thighs(Bernstein et al., 2006). When migrating to 7-Tesla, dielectric resonances and RF interferences cause in-homogeneous excitation profiles to develop in the human brain (Yang et al., 2002; Van de Moortele et al.,

Contents
2005). Consequently, a sub-optimal signal-to-noise ratio is obtained and a strong bias introduced on thedesired contrast, hampering tissue delineation with high confidence. With the first 11.7 Tesla systems nowin active development at NeuroSpin and NIH, it becomes increasingly urgent to provide adequate solutionsto mitigate these excitation non-uniformities so that these systems can reach their full potential.
Scientific goals addressed in this work
Although there are many technical challenges associated with UHF-MRI, this study focuses on the mitigationof excitation non-uniformities and restoring the desired contrast. Considering the origin of these artifacts(Yang et al., 2002), parallel transmission (pTx) is one of the most promising solutions available to eradicatethese undesired effects. Originally proposed by Katscher et al. (2003) and Zhu (2004), pTx utilizes multipleindependently driven coil-elements to facilitate relatively short excitation pulses with the flexibility to obtainnearly any excitation pattern. However, there are certain risks inherent in this approach, stemming mainlyfrom the potential occurrence of a highly localized energy deposition in the exposed volume. Therefore,special care must be taken to prevent tissue ablation. In spite of the fact that the relevant parameter is theRF induced temperature rise, for simplicity the specific absorption rate (SAR) is often considered instead.This measure of the energy deposition may then be constrained according to standardized guidelines (IEC,2010) to provide adequate safety with respect to temperature (Massire et al., 2012).
While various interesting applications benefit from the enhanced degrees of freedom introduced by the pTx-approach (Setsompop et al., 2008a; Schneider et al., 2010; Katscher et al., 2010), the objective of this thesisis the development and demonstration of pTx-based techniques to provide substantial advances towards:
• High quality volumetric human brain imaging in UHF-MRI.
• Specific absorption rate assessment and control.
Overview of this thesis
First the fundamental concepts of MRI are introduced in chapter 1, concluding with the advantages andchallenges encountered at UHF. Subsequently, the concepts and techniques particular to the pTx approachare detailed in chapter 2, followed by an overview of the experimental setup (chapter 3) used throughoutthe succeeding chapters. Because SAR management is essential to perform in-vivo experiments, we presentin chapter 4 an progression of SAR evaluation methods that allowed along the course of this thesis to gainlatitude in RF pulse design and in MRI exams. The rest of this manuscript is devoted to radio-frequencypulse design. After presenting an original approach to iteratively minimize the local SAR by penalizingdifferent transmit-pathways (chapter 5), a new strategy named “kT -points” for non-selective excitationsachieving excellent flip angle homogenization over the whole brain is demonstrated in chapter 6. Encouragedby the small-tip-angle results and low energy excitations, its application to the large flip-angle regime isinvestigated by combining it with optimal control theory (chapter 7). Ultimately, and via the progress madein SAR assessment, the method was tested in the MP-RAGE (Mugler and Brookeman, 1990), one of themost commonly used T1-weighting 3D sequences. The results of in-vivo experiments at 7 Tesla presented inchapter 8 prove the viability of the technique as well as good mitigation of the RF and B0-field inhomogeneityartifacts for this sequence. Finally in chapter 9, simplifications in the global design of the pTx-implementationare studied to investigate more cost-effective solutions and more manageable SAR scenarios. Chapter 10concludes this thesis with a summary of the most substantial scientific contributions and a brief outlook onpossible future developments.
18

1 Background 1
1.1 Nuclear Magnetic Resonance
Most particles have, besides classical properties such as mass and charge, an intrinsic property referred toas spin1. This quantum mechanical property endows each of the nucleons with a spin value of 1/2. Althoughnuclei can be comprised of multiple nucleons, it turns out that the simplest configuration, the Hydrogenproton, is the most abundant spin 1/2 nucleus in organic tissues.
When immersed in a static magnetic field (B0) oriented along the z-axis, the Hamiltonian matrix corre-sponding to the resulting potential energy is:
H = −γB0~
2σz = −γB0~
2
1 00 −1
(1.1)
where γ is the gyromagnetic ratio ( γ2π = 42.6 106Hz T−1 ), ~ is Planck’s constant divided by 2π, and σz is
Pauli’s spin matrix matching the selected direction of the magnetic field (Griffiths, 1994). The correspondingeigenstates are:
χ− with energy : E− = −γB0~
2
χ+ with energy : E+ = +γB0~
2
(1.2)
where χ− is the lower energy state co-aligned with the main magnetic field, and χ+ the anti-aligned state.Consequently, this system could interact with a (virtual) photon of energy γB0~, corresponding to a frequencyof:
ν =E− − E+
2π~=
γB0
2π, (1.3)
which is commonly referred as the proton Larmor frequency2.
Bloch Equations
Thus far, only a single particle was considered. All biological tissues contain many nuclei of which, interms of body mass percentage, Hydrogen is the third most abundant in the human body (Zumdahl andZumdahl, 1999)3. The canonical ensemble of such spin 1/2 nuclei, when at thermal equilibrium immersed inthe above-mentioned static magnetic field, yields the following density of magnetization (Schroeder, 1999) :
M0ez =ργ~
2tanh (βE+) ez (1.4)
where ρ is the proton spin-density, βdef= (kT )−1 is defined as the reciprocal of the Boltzmann’s con-
stant times the temperature in Kelvin4. When perturbed by an RF-field, the magnetization vector M =Mx(t),My(t),Mz(t)T obays the Bloch equation:
∂
∂tM = −γBM−
0@
1/T2 0 00 1/T2 0
0 0 1−M0/Mz
T1
1AM (1.5)
1The interpretation of spin is by no means trivial; for those who are interested the author recommends a most intriguingarticle by Ohanian (1986).
2Strictly speaking, real photons do not constitute the dominant energy quanta considered in the context of MRI. It has beensuggested that the virtual photons often considered in quantum field theory are more fitting. More background regarding theseconsiderations can be found in (Hoult and Bhakar, 1997).
3Oxygen is first followed by Carbon, both of which, in their natural abundant form, have an effective spin of 0.4Most textbooks on NMR emphasize on the first order Taylor expansion: M0ez ≈
ργ2~2
4kTB0ez .

Chapter 1.
where B = Bx(t), By(t), Bz(t)T is the magnetic field which may depend on time and whose static maincomponent remains oriented along the z-axis, T1 is the longitudinal relaxation time, and T2 the transverserelaxation time (Bloch, 1946; Wangsness and Bloch, 1953). Instead of describing the magnetization fromthe perspective of an observer in the laboratory frame of reference, it is often more convenient to considerthe transverse and longitudinal magnetization in the frame rotating at the Larmor frequency Ω = γB0. Tothis end, the transformation matrix:
Λ (Ωt) = SR(Ωt) =
0@
1 i 01 −i 00 0 1
1A0@
cos (Ωt) − sin (Ωt) 0sin (Ωt) cos (Ωt) 0
0 0 1
1A (1.6)
can be used to carry the observer into a more convenient frame of reference. Defining M = Λ(Ωt)M =MT (t) ,MT (t) ,Mz (t)
T(where MT (t) = Mx (t)+iMy (t), MT (t) = Mx (t)−iMy (t), and Mx (t) &My (t)
are the Cartesian magnetization components in the rotating frame), B = Λ(Ωt)Bdef=nB+
1 (t) , B+1 (t) , B0 +∆B0
oT
(where, after neglecting the off-resonance components (Hoult, 2000b)5,
2B+1 (t) Bx (t) + iBy (t) and Bx (t) & By (t) are the Cartesian magnetic field components in the rotat-
ing frame, and ∆B0 accounts for localized deviations from the static magnetic field B0 ), and exploiting][B] = Λ (Ωt) [B]Λ−1 (Ωt) ( where [B] is a matrix such that [B]M = B M (Jaynes, 1955)), allowsEq. 1.5 to be rewritten as:
∂
∂tM = −iγ
0B@
MT (t)∆B0 −MzB+1 (t)
0MT (t)B+
1(t)−MT (t)B+
1(t)
2
1CA
| z ”Conventional description”
+ iγ
0@
0
MT (t)∆B0 −Mz (t)B+1 (t)
0
1A
| z ”Conjugate description”
−
0@
MT (t)/T2
MT (t)/T2
Mz(t)−M0
T1
1A
| z Relaxation
. (1.7)
According to these definitions, the first two rows of equation 1.7 both describe the time-evolution of thetransverse magnetization. Therefore, traditionaly, the ”Conjugate description” is disregarded in favor of amore concise expression6. Consequently, the co-rotating component of the magnetic field (B+
1 ) constitutesthat component of the transmit-field suitable to introduce a transverse component (MT ) in to the magne-tization vector. In the context of NMR, the flip-angle (FA or θ) is often adopted to express the result of aB+
1 excitation: θ = γB+1
´ T
0f(t) dt, where T is the duration and f(t) is the pulse shape. If the initial state
of the magnetization is M0ez, and Mz is the longitudinal component after the excitation, then:
θ = arccos
Mz
kMk
. (1.8)
T1 Relaxation
The longitudinal relaxation time T1 is a tissue-specific characteristic constant related to the time requiredfor the substance in question to (re-)establish its net thermal equilibrium magnetization. This can be seenwhen considering the immersion of the object into the main magnetic field at t = 0:
∂
∂tMz = −Mz −M0
T1, (1.9)
which has the solution:Mz(t) = M0
1− e−
t/T1
. (1.10)
During this process, energy is transferred to the spin-lattice as the population of the eigenstates is changed(Eq. 1.2). This characteristic time constant is inversely proportional to the efficiency at which energy canbe dissipated to other nuclei in the lattice.
5Hence the factor 1/2 in: B+1 (t) ≈
Bx(t)+iBy(t)
2.
6Note that B+1 should not be confused with B−
1 which is related to the receive sensitivity, i.e., it contains no additionalinformation.
20

Magnetic Resonance Imaging
T2 Relaxation
The transverse relaxation time T2 is a measure of how long the resonating protons remain coherent, i.e.in phase, following an excitation. Considering a simplified model where only the transverse component isconsidered:
∂
∂tMT = −MT
T2, (1.11)
the following solution is found:MT (t) = MT (0) e−
t/T2 , (1.12)
where MT (0) is the transverse component at t = 0. The resulting decay in transverse magnetization isdue to magnetic interactions occuring between protons. For example, neighboring protons bound to macro-molecules locally change the magnetic field sensed by the free protons. These local field non-uniformitiescause the free protons, which constitute the dominant component in the MR signal, to precess at slightlydifferent frequencies. Thus, following an excitation pulse, the protons lose coherence and the net transversemagnetization is gradually lost.
The NMR signal
The previous sections briefly explained how an ensemble of protons immersed in a magnetic field may beexcited, and the mechanisms that allow it to relax back to equilibrium. However, in order to exploit thisbehavior in the framework of NMR, a measurable signal needs to be extracted. To this end, let us considera Hertzian loop placed close to the sample and prependicular to the transverse plane. Following an ideal90 excitation, the magnetic moment precesses in the xy-plane (at the Larmor frequency). The rotatingmagnetic field of the nuclear magnetization induces an electromotive force (EMF) in the loop, much like abicycle dynamo (Hoult and Bhakar, 1997). Since the induced EMF is proportional to the field produced bythe oscillating magnetic moment, a suitable analog-to-digital converter (ADC) may be used to observe thetime evolution of the system and facilitate subsequent computerized post-processing. Because the currentinduced in the Hertzian loop (or a more optimized receive-coil) is directly proportional to the transversemagnetization, the loss of coherence due to T
2 relaxation will result in the recording of an attenuatingsignal7. This measurement corresponds to what is referred to as the free induction decay (FID) (Hahn,1950a).
1.2 Magnetic Resonance Imaging
Historic introduction
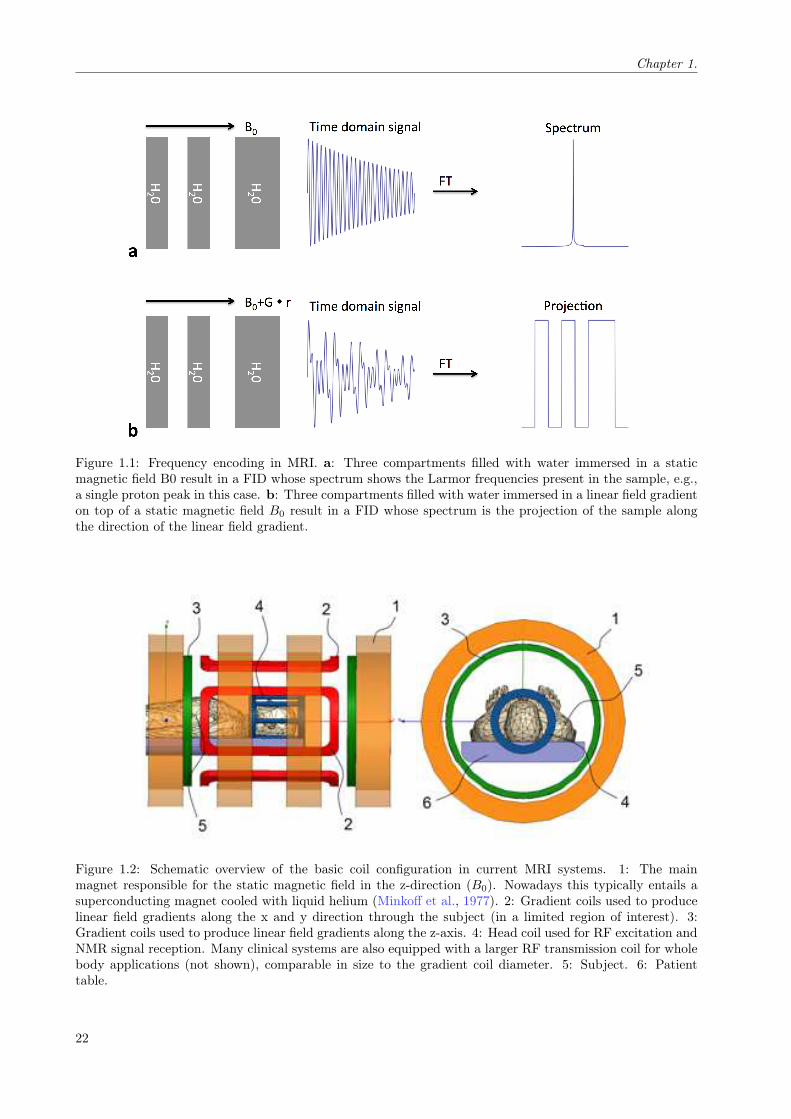
Originally only published in a PhD thesis, the first transitional steps from NMR to MRI were pioneered byCarr (1952). This was later extended by Lauterbur, P.C. (1973) to produce the first 2D images, followedby the first cross-sectional image of a living mouse (Lauterbur, P.C., 1974). These experiments were stillperformed using a standard NMR spectrometer with an added field gradient, thus introducing the concept offrequency encoding. In the absence of a magnetic field gradient, the Fourier transform of the FID results ina peak corresponding to the Larmor frequency of the sample (Fig. 1.1a). When a linear gradient is applied,multiple frequencies are introduced into the FID dependent on the location of the source. Consequently,the Fourier transform now corresponds to the spatial distribution of the sample along the direction of thefield gradient (Fig. 1.1b). Although this 1D technique was a milestone in the development of MRI, thisfirst implementation was far from practical. Considering the fixed nature of the field gradient in theseexperiments, the object under investigation had to be physically rotated to resolve a two-dimensional image.
Much faster imaging techniques involving multiple linear field gradients were pioneered by Kumar et al.(1975); Mansfield and Maudsley (1976); Mansfield (1977). These techniques resemble more closely to whatis now common practice, rather than the projection technique originally used by Lauterbur, P.C. (1974).Current clinical MRI systems provide time variable linear magnetic-field gradients in three orthogonal di-rections (Fig. 1.2) to allow 2D- and 3D-Fourier-transform based spatial encoding techniques.
7The measured attenuation corresponds to the time constant T
2 , which incorporates the loss of coherence due to T2 relax-ation, magnetic susceptibility effects, and imperfections in the external static-field.
21
Chapter 1.
Figure 1.1: Frequency encoding in MRI. a: Three compartments filled with water immersed in a staticmagnetic field B0 result in a FID whose spectrum shows the Larmor frequencies present in the sample, e.g.,a single proton peak in this case. b: Three compartments filled with water immersed in a linear field gradienton top of a static magnetic field B0 result in a FID whose spectrum is the projection of the sample alongthe direction of the linear field gradient.
Figure 1.2: Schematic overview of the basic coil configuration in current MRI systems. 1: The mainmagnet responsible for the static magnetic field in the z-direction (B0). Nowadays this typically entails asuperconducting magnet cooled with liquid helium (Minkoff et al., 1977). 2: Gradient coils used to producelinear field gradients along the x and y direction through the subject (in a limited region of interest). 3:Gradient coils used to produce linear field gradients along the z-axis. 4: Head coil used for RF excitation andNMR signal reception. Many clinical systems are also equipped with a larger RF transmission coil for wholebody applications (not shown), comparable in size to the gradient coil diameter. 5: Subject. 6: Patienttable.
22

Magnetic Resonance Imaging
Figure 1.3: Schematic overview of the basic pulse sequences in MRI. Spin Echo (Hahn, 1950b), Fast SpinEcho (Feinberg et al., 1985b), Echo Planar imaging (EPI (Mansfield, 1977)), SPACE (Mugler et al., 2000),Gradient Recalled Echo (GRE), Steady-State Free precession (SSFP (Oppelt, 1986))), Fast Low Angle Shot(FLASH, (Haase et al., 1986)), Magnetization-Prepared RApid Gradient Echo (MP-RAGE, (Mugler andBrookeman, 1990)), Others (Bernstein et al., 2004; Haacke et al., 1999).
Current Imaging Sequences
Over the years, numerous imaging methods have been introduced, commonly referred to as acquisitionsequences. Loosely speaking, two classes of sequences exist, the Gradient-Recalled-Echo (GRE) and theSpin-Echo (SE) branches (Fig. 1.3). Stepping over many important advances in the field8, only thosesequences most relevant to the work presented in this thesis will be considered in more detail (Fig. 1.3,Blue). First the GRE is explained in the context of a volumetric acquisition. Then the FLASH sequence ispresented in the framework of slice selective excitation. Finally the Magnetization-Prepared RApid GradientEcho (MP-RAGE) sequence, one of the most commonly used methods to obtain T1-weighted images of thewhole brain, is summarized.
Gradient Echo and 3D imaging
Rather than adopting a fixed field-gradient for frequency encoding, it is often more convenient to consider afield echo. This may be accomplished using two gradient lobes (Fig. 1.4, red & blue). First the prephasinglobe (Fig. 1.4, red) dephases the transverse mechanization such that the subsequent readout lobe withopposite polarity (Fig. 1.4, blue) refocuses the spins to produce the desired echo.
Mathematically, this can be seen as follows: after an excitation, the prephasing gradient introduces a spatialdependence (r) to the precession frequency:
ω (r, t) = γ (B0 +Gpre (t) · r) (1.13)
where Gpre (t) is the gradient waveform during prephasing. Therefore, in the rotating frame of reference,the relative phase accumulated during the prephasing gradient is:
φpre (r, t) = γ
ˆ t
0
Gpre (t) · r dt . (1.14)
Neglecting relaxation effects and assuming a spin density distribution ρ(r), the following expression for thesignal just after the prephasing gradient (t = t1) is obtained:
S (t1) = γ sin (θ)
ˆ 1
−1ρ (r) e−i2πkpre(r) d3r (1.15)
8For a more complete overview of the different imaging techniques, the reader is directed to one of the numerous textbookssuch as (Bernstein et al., 2004; Haacke et al., 1999).
23

Chapter 1.
Figure 1.4: Schematic overview of the basic gradient recalled echo sequence. (The prephasing gradients,including phase an partition gradient lobes, may be played at the same time to allow shorter echo times.)
where kpre(r)def= 1
2πφ(r, t1) is the k-space offset, and θ is the flip angle produced by the excitation. In orderto obtain the desired echo centered on the readout gradient lobe Gread (t), the following conditions need tobe satisfied:
ˆ TE
t1
Gread (t) · r dt =
ˆ t1
0
Gpre (t) · r dt (1.16)
where TE is the time of echo commonly specified relative to the center of the excitation (Fig. 4). Consid-ering a GRE-based sequence, the prephase and imaging gradient lobes may be concatenated into one singlecontinuous gradient waveform (Fig. 1.4).
To illustrate more clearly the Fourier relation between the signal and spatial distribution of the spin density,consider the following substitution:
ρ (r) = ρ (r) e−2πikpre(r) . (1.17)
Assuming that the gradient is constant during the readout, we can rewrite the signal corresponding to theecho as:
SEcho (t) = γ sin (θ)
ˆ 1
−1ρ(r)e−γiGread·rt d3r , (1.18)
which simply constitutes a one-dimensional Fourier-transform of the spin density. However, so far, only aprojection of the image along the read direction of Gread can be obtained, whereas the other two directions arejust integrated. In theory it is possible to reconstruct the entire volume by acquiring multiple projectionsalong different directions. More commonly, the full k-space is acquired with the aid of phase encodinggradients (Fig. 1.4, gray). Including these phase encoding gradient lobes we find:
SEcho (t, u, v) = γ sin (θ)
ˆ 1
−1ρ(r)e−2πikpha(r)ue−2πikpart(r)ve−2πikpre(r)e−γiGread·rt d3r (1.19)
where u and v are repetition-dependent scaling factors of the maximum k-space excursions (kpha, kpart)orthogonal to one another and the read direction (Gread). Iterating this strategy with a time of repetitionTR, allows k-space to be sampled uniformly and the spin density distribution ρ (r) to be recovered viathe 3D Fourier transform. However, when implemented on a physical scanner, the temporal signal hasto be discretized (sampling), and images have to be reconstructed adopting the discrete Fourier transform.Moreover, additional system limitations such as gradient amplitude, gradient slew-rate, and ADC bandwidthhave to be taken into account when building an acquisition sequence (Bernstein et al., 2004; Haacke et al.,1999). Nonetheless, the basic principles remain untouched.
24

Magnetic Resonance Imaging
Figure 1.5: Schematic overview of the basic FLASH sequence.
Fast Low Angle Shot and 2D imaging
The basic GRE sequence described in the previous section assumes the initial magnetization prior to anyRF pulse is longitudinal in all voxels. This is true if TR is very long compared to the T2 of the sample.When the TR becomes comparable or shorter than T2, unwanted stimulated echoes may arise9, corruptingthe final image. This poses a problem for most clinical applications as the total scan time would becometoo long. To allow high-quality images with a short TR, some modifications to the basic GRE sequence arenecessary (Fig. 1.5).
In order to circumvent unwanted stimulated echoes, the spoiler gradient (Fig. 1.5, blue) combined withincremental quadratic RF phase shifts are introduced (Haacke et al., 1999; Bernstein et al., 2004). The ideabehind the spoiler gradient is to dephase the spins inside every voxel so that no transverse magnetizationis left when restarting RF transmission. Considering a voxel of size ∆r, the minimum necessary gradientenvelope is:
γ
ˆ
Gspoil (t) ·∆r = 2π . (1.20)
In addition to the spoiler, re-winder gradient lobes are generally introduced (Fig. 1.5, green). Theseadditional lobes are the exact opposite of the phase encoding gradients, restoring the spin coherence in thephase encode directions10.
While the spoilers destroy the spin-coherence at the end of the TR, the longitudinal component of themagnetization remains untouched by them. After several repetitions, this leads to a steady state where T1
relaxation and excitation effects stabilize. Then the following steady state signal equation applies:
S (TR, TE , θ) / sin (θ) ρ (r)
(1− e−TR/T1
)
1− cos (θ) e−TR/T1
e−TR/T∗
2 , (1.21)
which allows the Ernst angle corresponding to the maximum signal for a given TR to be calculated via:
θE = arccose−
TR/T1
. (1.22)
Thus, for very short TR, the maximum signal will be reached for a small FA.
Although this sequence can be used to obtain volumetric images, as described in the previous section, theexample depicted in Figure 1.5 illustrates the principles of a 2D image acquisition. The rationale is to limit
9Stimulated echoes can occur due to the refocusing of magnetization initialized by RF exposure in earlier repetitions, i.e.,magnetization created more than n × TR + TE (n ∈ N) ago. These echoes do not necessarily result in an artifact, somesequences use this to their advantage (Oppelt, 1986; Mugler et al., 2000).
10Neglecting ∆B0 and relaxation effects
25

Chapter 1.
Figure 1.6: Schematic overview of one TRm of the MP-RAGE sequence. Orange: Magnetization preparation(MP) element including a non-selective inversion followed by a spoiler. Green: FLASH-based readout for asingle k-space partition. TI: Time of Inversion, defined from the center of the inversion pulse to the centerof the k-space partition in the FLASH train. TRm: the time between consecutive inversion pulses.
the excitation to a single slice through the volume, such that the integrated signal in the direction orthogonalto the slice is limited to the slice profile itself. To this end, a gradient of amplitude G is applied duringthe RF pulse (Fig. 1.5, red) to introduce a spatial linear dependency in the Larmor frequency distribution(Eq. 1.13). Combined with an RF-pulse of limited bandwidth (BW), a single slice with a finite thicknessis excited. However, during this slice selection gradient, the transverse component of the spins is dephasedalong the slice profile. Therefore, a second gradient lobe with opposite polarity and half the time integralis concatenated after the RF pulse to restore coherence. The slice selection eliminates the necessity forpartition encoding and allows the image to be reconstructed with a 2D Fourier transform. Nevertheless, theprinciple of slice-selective excitation can also be paired with volumetric imaging techniques to acquire a 3Dslab through the exposed sample.
Magnetization-Prepared Rapid Gradient Echo
The magnetization-prepared rapid gradient echo sequence (Mugler and Brookeman, 1990), referred to as“MP-RAGE”, is among the most commonly employed 3D sequences to obtain T1-weighted anatomical im-ages of the brain (Fig. 1.6). To this end, an inversion pulse is used (Fig. 1.6, orange) followed by aFLASH train (Fig. 1.6, green) acquiring one partition plane in k-space per repetition time TRm. Carefuladjustment of the delay TI between the inversion and the acquisition block, as well as of the usual imagingparameters (θ, TR, TE), allows excellent contrast between gray matter, white matter, and cerebrospinalfluid (Deichmann et al., 2000; Mugler and Brookeman, 1990).
1.3 Specific Absorption Rate
During an MRI exam, radio frequency waves are transmitted to acquire images of a subject. These RFwaves deposit energy into the subject, resulting in an increase of temperature that could potentially lead totissue damage. Therefore committees provide guidelines indicating the maximum allowed energy depositionin human subjects (IEC, 2010). These guidelines refer to the energy deposition as the specific absorptionrate (SAR), given by :
SAR (r) =1
T
σ (r)
2ρ (r)
ˆ T
0
kE (r, t)k22 dt . (1.23)
26

Ultra High Field MRI
This depends on the conductivity σ (r), the density ρ (r), the electric field distribution E (r, t) inside thesubject, and the time of integration T during which instantaneous energy deposition is averaged.
The aforementioned guidelines refer to a set of 4 limits considering the maximum allowed energy depositionin the human head. These limits pertain to the global SAR, i.e. the SAR averaged over the entire head, andthe local SAR, defined as the SAR averaged over any closed 10-g volume of tissue. The 4 limits provided bythe guidelines consider both the T=10-second average and T=6-minute average. The following provides asummary of the SAR limits as defined for diagnostic experiments exposing the human head to an RF field:
• Guideline local SAR #1
• Guideline local SAR #2
• Guideline global SAR #1
• Guideline global SAR #2
30 W/kg per 10-s window of integration, averaged over any closed 10-gvolume.
10 W/kg per 6-min window of integration, averaged over any closed10-g volume.
9.6 W/kg per 10-s window of integration, averaged over the entire head.
3.2 W/kg per 6-min window of integration, averaged over the entirehead.
In the case of human subjects, the exact fields and anatomical details are often unknown. As a result, theSAR cannot be determined with absolute accuracy for each individual. The conventional method for SARassessment revolves around simulations based on subject models to estimate the global and peak local SAR.In order to provide secure operation, suitable 10-s and 6-min average power limits are derived for the RFtransmitter to ensure compliance with the SAR guidelines.
1.4 Ultra High Field MRI
So far, the impact of the main magnetic field strength has not been considered in detail. However, boththe signal-to-noise ratio (SNR) and contrast-to-noise ratio (CNR) are dependent on the field strength. Ingeneral the MR signal is proportional to:
SNR3D / M0B−1 ∆x∆y∆z
qNphaseNparNreadNavrg
BW Sseq (TR, TE, θ)
SNR2D / M0B−1 ∆x∆y∆z
qNphaseNreadNavrg
BW Sseq (TR, TE, θ)(1.24)
where M0 is the thermal equilibrium magnetization, B−1 the receive sensitivity (RF magnetic field per unit
current in the receive coil), ∆x∆y∆z are the spatial dimensions of the voxels, Nphase the number of phaseencoding steps, Npart the number of partition encoding steps, Nread the number of samples in the readout,Navrg the number of averages, BW is the readout bandwidth, and Sseq (TR, TE, θ) is a factor dependenton the other sequence parameters11. Therefore, once receive coils and sequence parameters are adjusted totheir optimal performance, the only options left to improve the MR signal are to increase M0 or decreasethe resolution. When high(er) resolution images are desired, the only remaining possibility is to increasemagnetization. Looking back at equation 1.4, the net magnetization can be increased in two ways. Eitherthe temperature of the object under investigation can be reduced, or the magnetic field can be increased12.Considering living biological tissues, significantly decreasing the temperature is not possible, leaving onlythe magnetic field strength as a free parameter.
Advantages
Apart from the direct improvement in SNR due to to an increased M0, pushing up the main magnetic fieldstrength brings other advantages. Most notably are the enhanced T
2 contrast, and performance boost whenadopting parallel imaging methods (Sodickson and Manning, 1997; Pruessmann et al., 1999; Griswold et al.,2002).
11In the case of a FLASH-based acquisition scheme, Sseq (TR, TE, θ) would be Eq. 1.21.12Alternatively, contrast-agents or hyperpolarization may be used to locally increase the signal.
27

Chapter 1.
Figure 1.7: Comparison of the contrast-to-noise ratios, comparing gray matter and white matter, obtainedat different field strengths on a coronal slice through the brain. All images were acquired with a T
2 -weightedsequence and quadrature head coil.
Comparing T 2 -weighted images obtained at different field strengths, a substantial improvement in CNR
can be obtained when migrating from 1.5 to 7 Tesla (Fig. 1.7). This increased T 2 contrast is not only
beneficial for structural brain imaging. Considering BOLD-based fMRI for example, the physiological noisecontributions (veinous blood) are expected to decrease with increased resolutions while the BOLD signalincreases with field strength (Triantafyllou et al., 2005).
In general, it is desirable to constrain the acquisition time to a minimum, not only because of patientcomfort and cost efficiency, but also to minimize motion artifacts. As the acquisition time becomes longer,it becomes increasingly difficult for the subject to refrain from moving. Furthermore, even small artifactsdue to involuntary movements such as swallowing and breathing can be problematic when considering ultra-high-resolution structural imaging. Moreover, in the context of probing the microscopic scale of the laminarand columnar structures in the cortex, even brain movement due to variations in the cerebral spinal fluidpressure (Maier et al., 1994; Alperin et al., 1996) is a potential source of artifacts.
Parallel imaging (Sodickson and Manning, 1997; Pruessmann et al., 1999; Griswold et al., 2002) is one ofthe most potent tools available to decrease the acquisition time while maintaining contrast and resolution.This technique exploits the different sensitivity profiles from multiple receive elements (Roemer et al., 1990)to reconstruct an under-sampled image. The key principle behind these methods is the approximate or-thogonality between the different receive sensitivities. With increased field strength, therefore shortened RFwavelengths, the receive profiles corresponding to each of the coil elements become more distinct. Conse-quently, higher acceleration factors can be reached with only limited image quality degradation (Ohliger andSodickson, 2006).
Challenges
Alongside the opportunities provided by UHF-MRI, several challenges arise. As the external field (B0)increases in strength, so does the induced magnetization (M = χmH). Consequently, in those boundaryareas where the difference between susceptibility constants (χm) is large, such as the air-tissue interface,substantial fluctuations are introduced into the static field observed by the spins. Due to the dependence onthe external field, these non-uniformities become more pronounced in UHF-MRI. Although the bulk of theseeffects can be compensated with the aid of first and second-order shim coils, residual variations typicallyremain near intracranial cavities. These undesired disparities in the main field not only result in signal lossdue to intravoxel dephasing, but also in geometrical distortions originating from the bias introduced in thefrequency encoding. Looking back at the comparison shown in Figure 1.7, the appearance of an increasingly
28

Ultra High Field MRI
Figure 1.8: Comparison of the excitation uniformity obtained at 3 and 7 Tesla. a: Map of the flip-angledistribution obtained at 3 Tesla (Siemens Magnetom Tim Trio). b: Map the flip-agle distribution obtainedat 7 Tesla (Siemens Magnetom, equipped with a home-built RF-coil). c: Image acquired with a FLASHsequence at 7 Tesla (equipped with a quadrature head coil). Blue rings indicate what is commonly referred toas the central brightening effect, whereas the white rings indicate the areas of signal loss. d: Image acquiredwith the MP-RAGE sequence at 7 Tesla (home-built RF-coil). Orange arrows indicate the approximate areawhere the contrast between gray and white matter is lost.
large cavity can be seen at the bottom of the temporal lobe. Although there may be some subject variabilityinvolved, to first order, this deviation is due to increased magnetic susceptibility effects introduced by theinner-ear proximity. Interestingly, the thriving potential of parallel imaging at UHF can in some cases beadopted to mitigate these geometrical distortions and signal losses (Weiger et al., 2002).
Apart from the increased sensitivity to magnetic field susceptibilities, UHF-MRI is hampered by an increasedlevel of excitation non-uniformity (Fig. 1.8a & b). Although these effects are a hot topic with respect tocurrent endeavors in UHF-MRI, Bottomley and Andrew in 1978 already predicted their impact on MRI.Looking back at the signal equation of the FLASH sequence (Eq. 1.21), it becomes apparent that a spatialvariation of the FA will introduce unwanted contrast variations (Fig. 1.8c). Although this is just oneexample, various techniques, such as the MP-RAGE and SPACE sequence, are even more sensitive to thesevariations (Fig. 1.8d).
Besides the increased non-uniformity of the excitation field, Bottomley and Andrew (1978) also predicted anincreased energy deposition. Considering the idealized case of a homogeneous spherical phantom centeredin a quadrature coil, the following relation between absorbed power (W ) and angular-frequency (ω = γB0)is found (Hoult and Lauterbur, P.C., 1979; Hoult, 2000a):
W =2πω2B+2
1 a5
15(1.25)
where a is the radius of the sphere. Targeting a certain FA, for a fixed pulse duration the B+1 -field necessary
to yield it is independent of the main magnetic field strength B0. Although there are some correctionterms for the above-presented equation at high frequencies (Hoult, 2000a), it clearly illustrates the quadraticrelation between global SAR and B0. Moreover, depending on the setup at hand, the maximum local-SARto global-SAR ratio may increase as a result of the reduced wavelength and enhanced interference effects.Consequently, certain SAR-demanding imaging protocols commonly adopted at low field strength need tobe reconsidered before application at UHF.
29

Chapter 1.
30

2 Multi Dimensional RF-Pulses & Parallel Transmission 2
2.1 A k-space analysis of small-tip-angle excitations
Much like the slice-selective excitation introduced in the previous chapter, tailored pairs of RF and gradientwaveforms may be employed to selectively excite nearly any excitation pattern. Drawing an analogy to theFourier encoding used in the imaging processes, the concept of k-space can also be extended to the domainof multi-dimensional RF pulse design (Pauly and Nishimura, 1989). This may be observed by studying thesmall-tip-angle (STA) approximation, which assumes that the longitudinal magnetization remains constantduring RF exposure (Pauly and Nishimura, 1989). Indeed, when targeting a small flip-angle (FA , θ) andassuming an initial magnetization co-aligned with the static magnetic field, the transverse magnetization(MT ) is proportional to sin(θ) θ, whereas Mz remains approximately constant. Consequently, whentargeting a FA < 30 while neglecting both off-resonance and relaxation effects, the cumbersome non-linearBloch equation (1.7) can be linearized with the following approximation:
∂
∂tMT (r) = −iγ
(G (t) · r MT (r)−B+
1 (t)M0
)(2.1)
where G(t) and B+1 (t) are the time dependent gradient and RF waveforms, respectively. Solving this
differential equation for the final magnetization at time T results in:
MT (r) = iγM0
ˆ T
0
B+1 (t) e−ir·k(t) dt (2.2)
where, similar to the spatial frequency covered during image encoding (1.14), k(t) is defined as −γ´ T
tG (s) ds.
Hence the “k-space interpretation” is found, where k(t) constitutes a trajectory through k-space correspond-ing to a set of pre-defined gradient waveforms (Pauly and Nishimura, 1989). Then MT (r) is the FourierTransform of the RF waveform as long as the latter is played while covering the whole k-space. Given apredefined trajectory, Equation 2.2 immediately suggests a multitude of spatially selective excitations tocomplement the earlier introduced slice-selective excitations. Considering the target MT (r) distributionshown in Fig 2.1a, the RF-pulse corresponding to this excitation is simply the inverse Fourier transform ofMT (r) (Fig 2.1b) as it follows the Cartesian trajectory in Fig. 2.1c. This implies the RF-waveform is playedin concert with the gradients, resulting in an excitation with the desired characteristics (Fig. 2.1d).
Albeit a powerful tool for spatial selection, most potential applications involving multidimensional RF pulsesare hampered by hardware limitations. In particular, gradient slew-rate and amplitude constrain the minimalpulse duration due to the wide spatial-spectral range necessary to facilitate an arbitrary excitation profile.Although a judiciously chosen k-space design may be more favorable (Sersa and Macura, 1998), highly
Figure 2.1: Schematic overview of the different steps involved in the design of a single-channel Fourier-basedsmall-tip-angle 2D pulse. a: The desired target magnetization. b: The RF-waveform corresponding to theFourier-transform of target excitation pattern. c: Echo-planar (EP) k-space trajectory super-imposed ingreen on top of the Fourier-transform of the target magnetization. d: Final image after application of thedesigned RF + gradient waveforms in a suitable imaging sequence.

Chapter 2.
selective excitations generally still result in unacceptably long pulse durations. These may not only exceedthe repetition time desired in many ultra-fast sequences, but also deteriorate image quality due to off-resonance, relaxation, and magnetization transfer effects during the pulse.
2.2 Transmit-Arrays
As mentioned in the previous chapter, the RF-inhomogeneity increases with field strength, progressivelyintroducing a stronger bias in the acquired images. To mitigate these effects, transmit-arrays consisting ofmultiple independent coil-elements were introduced (Duensing et al., 1998; Ibrahim et al., 2001a; Adrianyet al., 2005). In contrast to the phased arrays used for reception (Roemer et al., 1990), most modern MRIsystems are not equipped with multi-transmit capability. Those investigational devices fitted with a multi-transmit extension are typically limited to 8 independent channels, whereas the latest clinical MRI systemsalready offer up to 128 receive channels (Magnetom Skyra, Siemens Medical Systems, Erlangen Germany).
Circularly polarized eigenmodes
Cylindrically symmetric transmit-coils, such as the popular birdcage (Jin, 1998) and TEM resonator de-signs (Röschmann, 1987; Vaughan et al., 1994), are driven in their circularly polarized (CP)-mode. At fieldstrengths well below 3 Tesla, the wavelength corresponding to the proton Larmor frequency is sufficientlylarge to justify the near-field approximation, at least in the human head. Under these conditions, conven-tional single-transmit-channel MRI systems employ a resonant coupled network of coil rungs to produce theaforementioned CP-mode (Jin, 1998). Similarly, cylindrically symmetric transmit-array coils can synthesizethis mode by simply adjusting the relative phase between the transmit-elements according to their azimuthalangle (Adriany et al., 2005; Van de Moortele et al., 2005). However, when migrating to higher field strengths,the near-field approximation becomes less appropriate, causing the RF uniformity deteriorate.
The transmit-array system is not limited to the above-mentioned CP-mode. In addition, a N -channel designsupports N − 1 more orthogonal CP-eigenmodes(Alagappan et al., 2007), each of which may be obtainedby shifting the relative phase between the coil-elements by n 2 [2;N ] times the azimuthal angle. Althoughdriving the transmit-array coil by its CP-eigenmodes has its merits (Alagappan et al., 2007; Setsompop et al.,2008a), the full set spans the same basis as the individually driven coil-elements (Fig. 2.2).
Figure 2.2: Top row: Transmit sensitivity profiles measured at 7 Tesla with the cylindrically symmetrictransmit-array-coil shown on the left. Measurements were performed in a 16-cm diameter spherical waterphantom. Bottom row: CP eigenmodes synthesized from the main CP mode (at the left), which was foundby adjusting the phases of the transmit channels such that their propagation coincides in a constructiveinterference in the center of the phantom.
32

Transmit-Sense
RF-shimming
At UHF, none of the CP-eigenmodes demonstrates a homogenous RF-field. Some improvement can beobtained by adjusting the relative phases and amplitudes between the coil-elements (or eigenmodes). Whenpushed to the extreme, .i.e., using a large number of channels, this method, referred to as RF-shimming,can substantially reduce the RF non-uniformity (Mao et al., 2006). In practice, at 7 Tesla, RF-shimmingwith a typical 8-channel multi-transmit configuration does not allow the desired level of FA uniformity to bereached throughout the entire human brain (Setsompop et al., 2008a; Cloos et al., 2012). However, recentadvances in the field of transmit-array coil design could yield more flexible solutions(Kozlov and Turner,2011).
B1-mapping
Before an optimized RF-shim configuration can be deduced, the spatially-dependent transmit sensitivities(B+
1,n(r)) have to be estimated. These transmit-sensitivities quantify the amplitude and relative phase of theco-rotating RF-field produced by each coil-element. Because, on resonance, this field is proportional to the FA(1.21), the B+
1,n-maps can be deduced from a dedicated MRI measurement. To this end, numerous techniqueshave been proposed (Hornak et al., 1988; Akoka et al., 1993; Stollberger and Wach, 1996; Cunninghamet al., 2006; Yarnykh, 2007). Although B1-mapping sequence development is still an active field of research,the actual flip-angle imaging (AFI) sequence (Yarnykh, 2007), including various improvements proposed byAmadon and Boulant (2008), Boulant et al. (2010a) and Nehrke (2009), is currently among the most popularmethods. Due to its steady-state implementation, short repetition times are feasible without the need for aSAR intensive reset pulse. Nevertheless, the AFI sequence applied to transmit-arrays is still relatively time-consuming and SAR-demanding. Considering that these calibrations have to be repeated for each subjectbefore clinically relevant measurements can be started, various faster yet less accurate methods have beenproposed (Van De Moortele et al., 2007; Fautz et al., 2008; Chung et al., 2010; Amadon et al., 2010; Clooset al., 2011a; Amadon et al., 2012).
In a transmit-array, regions far away from the transmitting element under investigation are usually dominatedby noise. To counteract this problem, Brunner and Pruessmann (2008) & Nehrke and Bornert (2010) pro-posed the matrix-based field mapping approach. This procedure combines the transmit-channels in differentlinear combinations, allowing the transmit-sensitivities corresponding to the individual transmit-channelsto be retrieved after post-processing. To this end, typically the CP-mode is considered as a “reference”,which is perturbed by cyclically adding π to the phase on each one of the channels. The advantage of thismethod is that the peak power per channel can be reduced while simultaneously obtaining a more favorablesignal-to-noise distribution1.
2.3 Transmit-Sense
Similar to the way parallel imaging allows the acquisition process to be accelerated, parallel-transmission(pTx) can be employed to reduce the duration of multi-dimensional RF pulses. The imaging SENSE method(Pruessmann et al., 1999) takes advantage of the distinct receive-sensitivity profiles of the coil-elementsto reconstruct an un-aliased image from a reduced k-space acquisition (Fig. 2.3). In the same manner,Transmit-SENSE (Katscher et al., 2003; Zhu, 2004) allows a desired target excitation to be reached with areduced k-space sampling during RF transmission (Fig. 2.4). Consequently, significantly shorter excitationscan be designed while maintaining the desired excitation fidelity (Katscher et al., 2003; Zhu, 2004; Grissomet al., 2006). This enables multidimensional RF-pulses to be included in fast sequences with short repetitiontimes, while simultaneously reducing the impact of relaxation and off-resonance effects during the RF pulse.
Based on the principles proposed by Pauly and Nishimura (1989), multidimensional RF pulse design was firstformulated in the frequency domain (Katscher et al., 2003), and later in the spatial domain considering EPtrajectories only (Zhu, 2004). Currently, the most popular method is the spatial domain method proposed byGrissom et al. (2006), which permits k-space trajectories of arbitrary shape and accounts for the measuredoff-resonance effects. This method is summarized in the Theory section of chapter 5 where we simultaneouslyintroduce some minor modifications to improve the controllability of the RF power deposition.
1This method can be combined with any of the above-mentioned sequences.
33

Chapter 2.
Figure 2.3: Schematic overview of 3 imaging strategies, each one indicated with arrows of a different color.Green: the standard reconstruction method (sum of squares) sampling the full k-space. Yellow: sum-of-squares reconstruction applied to a 2x under-sampled acquisition, resulting in an aliased image. Blue:parallel imaging (SENSE), using the receive sensitivities (purple) corresponding to the different coil-elements,applied to a 2x under-sampled acquisition.
Figure 2.4: Schematic overview of 3 transmission strategies, each one indicated with arrows of a differentcolor. Green: the standard single-channel-tailored RF-excitation as described in section 1 of this chapter.Yellow: the effect of under-sampling k-space by a factor 2 during transmission. Purple: adopting paralleltransmission, taking into account the transmit-sensitivity of each coil-element, to produce the same targetmagnetization while under-sampling k-space by a factor 2.
34

Transmit-Sense
Trajectories through k-space
Apart from the EP (Fig. 2.4) and 2D-Spiral trajectory (Fig. 2.5a), several other interesting designs havebeen published (Sersa and Macura, 1998; Saekho et al., 2005, 2006; Schneider et al., 2010; Cloos et al.,2012). Each of these techniques addresses a different goal, ranging from slice-selective RF non-uniformitymitigation to selectively exciting an arbitrarily shaped three-dimensional sub-volume.
Among the above-mentioned methods, the “fast-kz” trajectory (Saekho et al., 2006) is probably studiedmost extensively (Yip et al., 2006; Setsompop et al., 2006, 2008a; Zelinski et al., 2008d,c; Jankiewicz et al.,2010; Ma et al., 2010). The sparse design of this trajectory allows slice-selective uniform excitations withrelatively short pulse durations. The key principle of this method resides in the combination of a densek-space sampling along the slice direction interleaved with a few short gradient blips orthogonal to thisdirection. When viewed as a path through k-space, the fast-kz trajectory resembles a set of spokes (Fig.2.5b), hence their nickname “spokes”. Due to the fixed bandwidth necessary to assure the desired sliceprofile, the RF sub-pulses played in concert with each spoke are generally of a fixed duration. Consequently,in order to minimize the pulse duration, a sparse selection of optimally chosen spoke locations is desired(Yip et al., 2006; Zelinski et al., 2008d; Ma et al., 2010).
Recently, thanks to pTx enabled k-space acceleration, there has been some renewed interest in multidimen-sional RF pulse design dedicated to volumetric imaging. Designs that selectively excite an inner-volume areexplored to facilitate un-aliased “zoomed” MRI (Feinberg et al., 1985a). Instead of a sparse k-space distri-bution, the 3D-selectivity necessitates sampling an extensive portion of 3D k-space by adopting acceleratedstacks of 2D-spirals (Saekho et al., 2005) or 3D-spirals as proposed by Schneider et al. (2010) and Vahedipouret al. (2010) (Fig. 2.5c).
Finally, non-selective uniform excitations can benefit from the multidimensional tailored RF pulse designapproach by only exploring a few locations in k-space (Fig. 2.5d). This is a novel strategy original to thework presented here and will be the topic of Chapter 6.
Figure 2.5: Different k-space trajectories considered for pTx applications, each one addressing a differentgoal. 2D-Spiral: 2-dimensionnal excitation pattern (a), Spokes: uniform slice (b), 3D-spiral: inner-volumeselection (c), kT -points: uniform non-selective excitation (d).
35

Chapter 2.
Magnitude-least-squares optimization
The spatial domain method as originally formulated by Grissom et al. (2006), summarized in the theorysection of chapter 5, not only considerers a predefined |MT (r)| but also a spatial phase target Arg(MT (r)).Because the associated optimization method is convex, the global optimum can be approximated directly(Yip et al., 2005; Bazaraa et al., 1993). But selecting an alternative target phase distribution results in adifferent RF-solution. Considering that, in many cases, the quantity of interest is limited to the magnitudeonly (Katscher et al., 2007), the optimal solution among all possible phase distributions is desired2. To thisend, the variable exchange method was introduced (Kassakian, 2006; Setsompop et al., 2008c). This methoditeratively relaxes the target phase to the previously obtained phase pattern. In general, this magnitude-least-squares optimization procedure greatly reduces the RF power while enhancing the excitation fidelity(Chapter 5). Yet selecting an alternative initial target phase distribution may still result in a different RF-pulse, whose performance may vary significantly. In particular, some of the initial targets may not work wellat all. Therefore, the initial phase distribution has to be selected with some care. Although not necessarilythe optimal solution, selecting the phase distribution corresponding to the CP-mode as an initial targetgenerally performs well (Kerr et al., 2007).
Specific Absorption Rate Considerations
Conventional MRI systems (without parallel transmission) evaluate the SAR based on the anticipated for-ward or transmitted power. This assessment typically relies on a single simulation of the RF coil in use,loaded with a human model exposed to a CP mode. This leads to a fixed scaling factor between the trans-mitted power and the maximum local/global SAR, which is tabulated on the console so the system canvalidate the compliance with a set of pre-defined limits such as those summarized in section 1.3 (IEC, 2010).When the proposed acquisition is expected to exceed these SAR limits, the system will prevent the userfrom starting the measurement. Otherwise, the imaging process is started during which both the 10-s and6-min-averaged transmitted power is monitored to ensure that the RF-power remains within the appropriatelimits. In the event that any of these power limits is exceeded, the acquisition is terminated.
Introducing a pTx-extension complicates the SAR evaluation due to the multiplicity of interference scenariosthat can occur between the fields produced by the different transmit-channels playing in concert. For agiven set of RF-sources in the array, the combination of incident amplitudes and phases can vary over timedepending on the pulse design. Consequently, a generalized version of the single-channel SAR equation 1.23must be considered:
SAR (r) =1
T
σ (r)
ρ (r)
ˆ T
0
∥∥∥∥∥
NX
n=1
↵n (t)En (r)
∥∥∥∥∥
2
2
dt , (2.3)
which now includes a summation over the electric field distributions produced by the N RF sources. Fora given pTx excitation pulse, i.e. a combination of complex coefficients ↵n(t), the ratio between peak localand global SAR can be quite high (Collins et al., 2007). Therefore, in contrast to the conventional systems,it is no longer viable to derive the local and global SAR from a concise set of parameters (Mao et al., 2007).Nonetheless, based on the maximum ratio between peak local and global SAR, a conservative generalizationof the conventional RF safety method is possible (Collins et al., 2007). However, this results in a largeoverestimation of the actual SAR, severely restricting pTx applications. To remedy this situation, equation2.3 has to be evaluated for every RF pulse scenario (↵n(t)), and the results compared to the guidelines. Onlythose acquisitions that are in compliance with the RF safety limits should be allowed by the system.
Only predicting the SAR before the measurement is not sufficient to fully guarantee patient safety. Withoutvalidating the implemented RF waveforms, the actual interference patterns may deviate from the antici-pated. This not only involves the amplitude but also the relative phase, which precludes simply limiting thetransmitted power, unless extra safety margins are considered. Although under certain conditions, it is stillpossible to use a set of dedicated time-averaged power-monitors, as will be detailed in chapter 4, deviationsfrom the anticipated RF-wavefoms can result in substantially different SAR distribution. Therefore, ideally,the actual current-vectors in each coil-element (associated with ↵n(t) should be monitored and validated inreal-time (Graesslin, 2008; Graesslin et al., 2009; Gagoski et al., 2009) or enforced via Cartesian feedback
2It may also be desirable to enforce a certain level of smoothness on the phase distribution to prevent intra-voxel dephasing.
36

Transmit-Sense
(Hoult et al., 2004; Zanchi et al., 2011)3. The setup currently available at NeuroSpin is detailed in the nextchapter.
3When adopting Cartesian feedback, additional safety systems may be necessary to make sure the subject has not movedexcessively (Boulant et al., 2010b).
37

Chapter 2.
38

3 Experimental Setup 3
3.1 Introduction
All experimental results presented in the subsequent chapters were obtained with the Siemens Magnetom7 Tesla MRI system (Siemens Medical System, Erlangen, Germany) located at NeuroSpin. This systemwas built around an unshielded 90-cm-diameter-bore superconducting magnet (Magnex scientific, Oxford,England). The entire setup was enclosed in a Faraday cage to minimize RF noise from the outside and a500-ton steel room to suppress stray fields outside the confines of the magnet room. Each of the subse-quent sections provides details concerning the MR components most relevant to the work presented in thesucceeding chapters.
3.2 Gradient & Shim Coils
Currently, the above-mentioned MRI system is equipped with two complete gradient sets, a whole-bodygradient system (Siemens) and a head-only gradient insert (AC84, Siemens). The first closely resembleswhat is typically available on a high-end clinical MR system (slew-rate 200 T/m/s, max amplitude 45mT/m). However, for economical reasons, this whole-body gradient is not operational at NeuroSpin forimaging purposes. Nevertheless, it can be used in static mode for shimming.
The gradient insert, on the other hand, can reach higher slew-rates (400 T/m/s) and larger gradient am-plitudes (80 mT/m)1 . However, due to its asymmetric design and smaller diameter (40 cm), gradientlinearity is limited to a head sized elliptical volume oriented along the main axis of the magnet. Bearingin mind NeuroSpin’s exclusive focus on brain imaging and particular interest in diffusion MRI, the benefitsprovided by the head gradient insert are generally considered to outweigh the constraints imposed by therestricted inner radius. However, with such a configuration, care needs to be taken not to introduce parasiticexcitations (Robitaille and Berliner, 2006). Particularly at ultra high field, where the loaded magnet boreacts somewhat as a waveguide (Brunner et al., 2009), most head-only RF-coils demonstrate an increasedsensitivity in the shoulder and chest regions. Due to the relatively small dimensions of the gradient insertand its dropping spatial encoding capacity beyond the above-mentioned ellipse, signal arising from theseareas are aliased into the region of interest (Fig. 3.1a).
To mitigate these “third-arm” artifacts, the shim coils from the body gradient set can be utilized to dephasethe signal originating from the shoulder regions (Wiggins et al., 2010). This technique, referred to as thedouble-shim method, applies opposing currents on the second order Z-shim coils of both gradient sets,effectively spoiling the signal arising from the shoulder regions (Fig. 3.1b). Nonetheless, depending on thesequence parameters, residual infolding into the brain stem area may persist. Although most prominent whenusing rapid non-selective sequences (such as MP-RAGE: Mugler and Brookeman (1990)), non-selective B+
1 -mapping techniques such as the AFI (Yarnykh, 2007) may also be affected. The later in particular was usedextensively throughout this work, to provide the necessary transmit-calibration measurements required forthe design of subject-specific excitations. Therefore, throughout the remainder of this work, the double-shimapproach was adopted for all in-vivo experiments.
3.3 Radio-Frequency Chain
In contrast to current clinical MR systems, typically equipped with only a single transmit-channel, the 7-Teslasystem at NeuroSpin has been equipped with a pTx-extension comprised of eight independent RF-pathways(Siemens). For later reference, a brief description of the architecture involved is provided here (Fig. 3.2a).
1In the context of this work, the slew-rate was limited to 333 Tm−1s−1 and the maximum gradient amplitude was constrainedto 50 mT m−1.

Chapter 3.
Figure 3.1: Coronal view from 3D MP-RAGE. a: The “V”-shaped signal artifact aliased from the neck region,extending through the brain (circled). b: Image acquired on same volunteer (without repositioning), butwith opposing currents set in the body and head gradient shim coils.
Eight independent modulators are each attached to their own power amplifier, providing up to 1-kW peakpower apiece (Dressler, Fort Collins, USA). Via a directional coupler, the forward power coming from eachamplifier is monitored in real-time, allowing the peak, 10-s, and 6-min averaged power to be constrained(power monitors for channels 1 through 7 are located in the service room, whereas the monitor for channel 8is located inside the scanner). In the event that one of the pre-specified limits is exceeded, the acquisition isterminated. However, it should be noted that currently, it remains the research institution’s responsibilityto derive the appropriate time-averaged power limits such that compliance with the SAR guidelines isensured (see also Sections 1.3, 2.3 and Chapter 4). To protect the amplifiers, the reflected and coupledenergy is dissipated in a dedicated set of circulators (Fig. 3.2b). Furthermore, these prevent unwantedinterference effects that could arise via mutual coupling and subsequent reflection into the forward path(Fig. 3.2c). Although so called loop-back test were performed to evaluate the stability of the RF-waveformunder different conditions, no detailed test were performed to evaluate potential additional power losses inthe cables leading up to the coil due to the standing wave ratio.
3.4 Transmit-Array Coil
For pTx, a transmit-array coil is necessary. To this end, a home-made transceiver-array head coil was devel-oped (Fig. 3.3) in collaboration with Institut de Recherche des lois Fondamentales de l’Univers2 (Ferrandet al., 2010). The coil itself consists of 8 stripline dipoles distributed every 42.5° on a cylindrical surface of27.6-cm diameter, leaving an 8.2-cm-wide window in front of the subject’s eyes. The housing for the dipolesis made out of two polyoxymethylene half cylinders milled to provide close-fitting slots to hold each of thecoil-elements.
The dipoles themselves consist of a 280 x 28 x 2 mm3 high purity solid copper strip (Fig. 3.3e.103). Eachof them is fed via a BALUN (BALanced UNbalanced transformer) that acts like an electrical transformerbetween the coaxial feedline and the symmetrical central feeding points (Fig. 3.3e.130). Air is used as thedielectric between ground plane (Fig. 3.3e.111) and dipole (spacing 3.2 mm). To first order, each elementwas tuned using capacitive disks (Fig. 3.3e C1 & C2); subsequent fine-tuning is provided via the pi-circuitincorporated into each element (Fig. 3.3e.150). At the end of the coil, a semi-circular polyoxymethylene“crown” is attached (Fig. 3.4) to provide the enclosure for the in-house-developed transmit/receive switches(-56-dB isolation between transmit and receive paths) and preamplifier circuits (23-dB amplification, 1.1-dBnoise figure)3. To provide the necessary shielding, the inner surface of the crown was laminated with copper
2Design and implementation by Michel Luong and Guillaume Ferrand at Commissariat à l’Energie Atomique, Direction desSciences de la Matière, Institut de Recherche des lois Fondamentales de l’Univers, Service des Accélérateurs, de la Cryogénie etdu Magnétisme.
3Design and implementation by Marie-France Hang and Eric Giacomini at Commissariat à l’Energie Atomique, Directiondes Sciences du Vivant, Institute d’ Imagerie Biomédicale, NeuroSpin, Laboratoire de Résonance Magnétique Nucléaire.
40

Transmit-Array Coil
Figure 3.2: Schematic representation of the RF-chain corresponding to the 8-channel pTx-extension. a:Each of the individual transmit-channels is provided with its own modulator (this includes the mixing tothe 297MHz carrier frequency) and amplifier. The forward power sent by each of the amplifiers is monitored(peak, 10-sec-, and 6-min-averaged power). In case any of the associated pre-defined limits is exceeded, theacquisition is terminated. The power monitors for channels 1 through 7 are located in the service room,whereas the monitor for channel 8 is located inside the scanner. b: Reflected power (black arrows to the left)and contributions from mutual coupling between coil-elements (green arrows) are dissipated in circulators.c: Illustration depicting currents introduced via coupling between the coil-elements (green arrow) reflectingback into the forward RF-chain (red arrow).
41
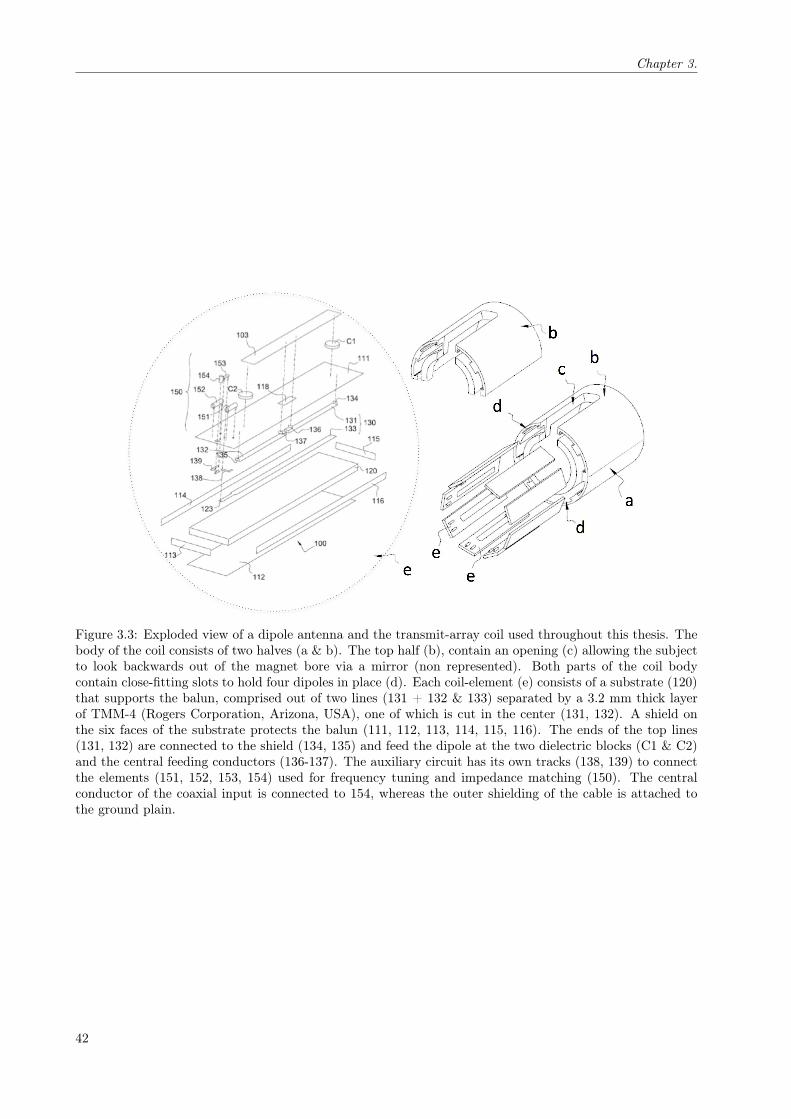
Chapter 3.
Figure 3.3: Exploded view of a dipole antenna and the transmit-array coil used throughout this thesis. Thebody of the coil consists of two halves (a & b). The top half (b), contain an opening (c) allowing the subjectto look backwards out of the magnet bore via a mirror (non represented). Both parts of the coil bodycontain close-fitting slots to hold four dipoles in place (d). Each coil-element (e) consists of a substrate (120)that supports the balun, comprised out of two lines (131 + 132 & 133) separated by a 3.2 mm thick layerof TMM-4 (Rogers Corporation, Arizona, USA), one of which is cut in the center (131, 132). A shield onthe six faces of the substrate protects the balun (111, 112, 113, 114, 115, 116). The ends of the top lines(131, 132) are connected to the shield (134, 135) and feed the dipole at the two dielectric blocks (C1 & C2)and the central feeding conductors (136-137). The auxiliary circuit has its own tracks (138, 139) to connectthe elements (151, 152, 153, 154) used for frequency tuning and impedance matching (150). The centralconductor of the coaxial input is connected to 154, whereas the outer shielding of the cable is attached tothe ground plain.
42

Computational Resources
Figure 3.4: T/R-switches and complete coil assembly.
tape. Before application to studies involving human volunteers, standard electrical and mechanical testswere performed by an external company (Bureau Veritas, France) for compliance with EC labeling.
To provide the necessary resources for SAR assessment, Finite Element (FE)-based simulations were per-formed. To this end, the coil was modeled with HFSS (ANSYS, Canonsburg, PA, USA) along with a humanhead electrical load. Since the FE method allows volume elements of variable size and shape, it is particularlyimportant to cut space into high-density regions near the coil-elements where strong spatial variations inthe conservative electric fields are expected. This, in combination with the complexity of the human headmodel, requires a large number of tetrahedrons. Therefore a dedicated computer system equipped with 64GB of working memory and 8 CPU cores was used (Dell, Precision T7500), thus allowing complex modelsmade of approximately 1 million tetrahedrons to be evaluated within a reasonable time (approximately 10hours for all eight channels simultaneously).
3.5 Computational Resources
The console used to operate the pTx-enabled system consists of 2 computer systems referred to as masterand slave. The master controls a single transmit-channel (channel 8), and provides all the necessary toolsto configure and prepare a new acquisition. The slave system allows any protocol prepared on the mastersystem to be dispatched to all 8 transmit-pathways. Furthermore, the slave system was retrofitted with ahigh-performance-computing graphics card (CUDA-enabled C2050 Tesla, NVIDA, Santa Clara, CA, USA).This board, equipped with a Graphics Processing Unit (GPU) containing 448 cores, and 3 GB of error-code-correction DDR5 memory, facilitates massive numbers of concurrent threads for the parallel evaluationof both SAR and Bloch equations. All the software tools developed in-house on this GPU are based on acombination of C++ and CUDA (NVIDA). They are detailed in the subsequent chapters.
43

Chapter 3.
44

4 Specific Absorbtion Rate Assessment 4
This chapter contains methods & principles that were published as abstracts inthe proceedings of the Annual Meeting of the International Society for MagneticResonance in Medicine 2010 and 2011.
M. A. Cloos, M. Luong, G. Ferrand, A. Amadon, D. Le Bihan, and N. Boulant.(2010) “Specific absorption rate monitor for in-vivo parallel transmission at 7Tesla.” p. 3871
N. Boulant, M. A. Cloos, M. Luong, G. Ferrand, C. J. Wiggins, and A. Amadon.(2011) “Method for monitoring safety in parallel transmission systems based onchannel-dependent average powers.” p. 3850

Chapter 4.
4.1 Introduction
Before the potential of pTx may be exploited in-vivo, an appropriate RF-safety system must be implemented(section 2.3). Although in principle both local and global SAR can be calculated from simulated field-maps,care must be taken to ensure safe operation in the event of a technical malfunction in order to always respectthe current guidelines provided by the International Electrotechnical Commission (IEC, 2010)
Many methods for SAR assessment are available in the literature (Collins et al., 2007; Brunner et al., 2008;Graesslin et al., 2009; Gagoski et al., 2009; Boulant et al., 2011), some deriving more conservative powerlimits than others. The resulting safety margins in general depend on the monitoring equipment available,which must confirm all the information used in the SAR calculation (amplitude, phase, power etc), and onthe accuracy of the simulated field maps. Thus the first part of this chapter describes our endeavors tovalidate of the electromagnetic simulations and characterize our transmit array coil via B+
1 measurements,magnetic resonance thermometry and robustness tests of the tuning/matching network. During this thesis,the only monitoring available was based on power sensors placed at the output of each amplifier (section3.3). The so-called Transmit Antenna Level Sensors (TALES) then provided the data necessary to enforcea predefined set of peak, the 10s and the 6 min average powers. Consistent with that information alone,three different methods to assure compliance with the SAR guidelines are compared in the second part ofthis chapter.
4.2 Part I: Validation of Electromagnetic Simulations
Throughout this work, the finite element method (FEM) was adopted to provide full-wave simulations (HFSS,ANSYS, Canonsburg, PA, USA) corresponding to our home-built 8-element transceiver-array coil (Section3.4). All coil-elements were tuned ideally at 297 MHz corresponding to the proton Larmor frequency at7-Tesla and matched identically to a 50-Ohm line impedance. However, each dipole resonated at a slightlydifferent frequency due to the interaction with the subject-model placed in the coil. Electric and magneticfield maps thus obtained were normalized to 1 W incident power for each coil-element and projected onto a5x5x5 mm Cartesian grid.
Comparison of Measured and Simulated B+1 -maps
The first step towards establishing the validity of the FEM-based coil model was based on a comparisonbetween simulated and measured B+
1 -maps. To this end, an acrylic sphere (15.5/16.0-mm inner/outer di-ameter) filled with dedicated liquid mimicking the averaged dielectric properties of the human brain wasimaged (Fukunaga et al. (2005), σ = 0.87, r = 45.3). The actual flip-angle imaging sequence (Yarnykh,2007) was employed to map the transmit sensitivity corresponding to each of the coil-elements in the us-ing an interferometric acquisition method (Brunner and Pruessmann, 2008), and B0 inhomogeneity effectswere corrected as proposed by Boulant et al. (2010a). Sequence parameters were: TR1/TR2=40/200ms,(TE1/TE2/TE3 = 1/2/3.5ms), 5mm-isotropic. In addition, a single high-resolution Fast Low Angle Shot(FLASH) acquisition was performed to determine the exact position of the phantom relative to the coil.
Comparing the simulated and measured∣∣B+
1
∣∣-maps (Fig. 4.1), resulted in correlation factors well above0.9 for all coil-elements (Fig 4.2a). However, demonstrating excellent correspondence between measuredand simulated
∣∣B+1
∣∣-distributions alone is not sufficient to validate the electromagnetic-simulations withhigh confidence (Alon et al., 2011). Therefore, additional verifications were performed by incorporating therelative transmit-phase:
Breln,k(r) = B+
1,n(r)e−i arg(B+
n,k(r)) , (4.1)
where Breln,k(r) is the measured transmit-sensitivity now including the transmit-phase relative the kth transmit-
channel. Although this constitutes a more noise-sensitive measurement, a relatively good correspondencewas obtained (Fig. 4.2b). Considering the obtained complex correlation factors, only the magnitude is ofinterest in the context of MR safety1. Adopting the nearest neighbor as a reference channel, the absolutecomplex correlation factors range between 0.89 and 0.93.
1The argument of the complex correlation factor constitutes the global phase offset between simulated and measured datasets which has no further consequence in the context of an MRI experiment.
46

Part I: Validation of Electromagnetic Simulations
Figure 4.1: Simulated and measured transmit-sensitivity maps in a synthetic liquid phantom (Central axialslice).
Figure 4.2: Correlation between the simulated and measured transmit-sensitivity maps. a: Scatter plotsshowing the correlation between simulated and measured
∣∣B+1
∣∣ in every voxel of the phantom. Correspondingcorrelation factors are included in the top right corner of each subfigure. b: The magnitude of the complexcorrelation matrix comparing simulated and measured relative complex transmit-sensitivity maps. Differentvoxels correspond to different combinations of transmission and phase-reference channels used to obtain therelative phase distribution. Consequently, the diagonal elements represent the correlation factors obtainedby considering the magnitude only.
47

Chapter 4.
Temperature measurements
The magnitude of the correlation factors considered so far is invariant under scalar multiplication. Therefore,this metric only concerns the comparability of the relative spatial variations. To determine the unknownscalar, the slopes between the measured and simulated
∣∣B+1
∣∣-maps were calculated. Whereas during simula-tion, exactly 1 W of incident power was applied per channel, in practice the actual incident power dependson the amplifier output and cable losses. Because the aforementioned parameters were not included in thesimulation, a set of calibration factors must be obtained before the SAR can be evaluated accurately for anarbitrary pulse.
Although all amplifiers demonstrated a linear response (Fig. 4.3a), as typically assumed during pulse designfor transmit-SENSE applications, the level of output power varies by up to about 30%. Moreover, it wasfound that the relative performance of the amplifiers can change after maintenance or repairs, thus requiringthe calibration factors to be updated. Taking into account the cable losses and amplifier characteristics,close quantitative agreement between simulated and measured field amplitudes was obtained.
Following these calibrations, additional measurements were performed on a Agar-gel phantom (acrylic sphere15.5/16.0-mm inner/outer diameter, σ = 0.78, r = 74.6). This time, the scope of the experiment wasextended to include MR temperature measurements based on the proton resonance shift method (Kurodaet al., 1997). Incorporating the previously found calibration factors, the simulated E-fields corresponding tothis new phantom were adopted to simulate the expected temperature rise by solving numerically the heatconduction equation. Comparing the simulated and measured temperature rise, a mean error in temperatureincrease of 25% was revealed (corresponding to a 12% discrepancy between simulated and measured|E|-fields).When calculating the SAR for in-vivo applications, this 25 % accuracy was incorporated as a safety margin.(Fig. 4.3b).
Figure 4.3: Amplifier lin-earity relative to the the-oretical incident power,where the red line indi-cates the ideal situation(a). Results from the tem-perature rise simulationsand corresponding MRI-based measurements (b).
Load sensitivity of the coil
Good correspondence between simulated fields obtained for a given head model and an arbitrary real subjectrequires that the coupling between coil-elements is relatively load-insensitive. In that way, even though noneof the simulations was performed specifically for the subject under examination, the field-maps remainrepresentative. This is particularly important, as the energy dissipated via mutual coupling between coil-elements is included in the simulation. Consequently, different RF-shim combinations not only effect thelocal SAR distribution but also the global SAR as the amount of energy dissipated in the circulators dependson both the phase and amplitude combination played on all channels.
To investigate the coil load-dependence, a series of measurements was performed outside of the MRI scanner.With a two-port network analyzer (MS2024A, Anritsu, Kanagawa, Japan) attached directly to the coil, thecoupling coefficients between coil-elements were measured on the bench (Tables 4.1 & 4.2). This way, severalrealistic coil loadings were evaluated, including 6 different volunteers positioned with two different cushionconfigurations (Fig. 4.4).
Due to the self-shielded coil-design, measurements in the absence of the gradient shielding do not significantlyaffect the S-parameters. Although the coupling coefficients demonstrated some variation between volunteersand different subject positions, the overall deviations remained acceptable (Tables 4.1 & 4.2). In particularwhen adopting the first cushion configuration, the variation between subjects may be expected to remainwell below 15%. Limiting the scope to the nearest neighboring elements only, which exhibit the highest levels
48

Part I: Validation of Electromagnetic Simulations
of mutual-coupling, the setup can be considered reasonably robust (-14dB ± 3%). Therefore, this cushionarrangement (Fig. 4.4a) was adopted as the standard for future studies.
Figure 4.4: Two different cushion configurations. a: Configuration 1 (thick padding). b: Configuration 2(thin padding).
Tx 1 Tx 2 Tx 3 Tx 4 Tx 5 Tx 6 Tx 7 Tx 8
Tx 1 −29 ± 8% −11 ± 4% −20 ± 3% −29 ± 3% −31 ± 8% −34 ± 5% −32 ± 7% −22 ± 4%
Tx 2 −32 ± 10% −12 ± 2% −21 ± 3% −29 ± 4% −32 ± 9% −37 ± 10% −33 ± 10%
Tx 3 −25 ± 3% −14 ± 3% −23 ± 4% −30 ± 5% −34 ± 11% −37 ± 6%
Tx 4 −19 ± 6% −14 ± 3% −24 ± 4% −30 ± 4% −32 ± 9%
Tx 5 −19 ± 7% −13 ± 3% −22 ± 3% −30 ± 4%
Tx 6 −23 ± 6% −12 ± 3% −21 ± 4%
Tx 7 −21 ± 5% −12 ± 4%
Tx 8 −25 ± 5%
Table 4.1: Measured Si,j (dB±SD) coefficients corresponding to the first cushion configuration. Mean valuecorresponding of the diagonal: −24dB±6%. Mean value of the Si,i+1 elements: −14dB±3%.
Tx 1 Tx 2 Tx 3 Tx 4 Tx 5 Tx 6 Tx 7 Tx 8
Tx 1 −28 ± 11% −11 ± 6% −21 ± 7% −31 ± 6% −31 ± 9% −36 ± 5% −33 ± 6% −22 ± 4%
Tx 2 −30 ± 11% −12 ± 3% −23 ± 6% −31 ± 5% −33 ± 8% −46 ± 21% −33 ± 7%
Tx 3 −22 ± 12% −15 ± 4% −27 ± 8% −32 ± 7% −34 ± 5% −39 ± 11%
Tx 4 −16 ± 10% −17 ± 7% −27 ± 9% −31 ± 5% −33 ± 8%
Tx 5 −19 ± 8% −13 ± 6% −22 ± 5% −31 ± 3%
Tx 6 −23 ± 7% −12 ± 3% −20 ± 3%
Tx 7 −20 ± 4% −11 ± 3%
Tx 8 −24 ± 14%
Table 4.2: Measured Si,j (dB±SD) coefficients corresponding to the second cushion configuration. Meanvalue corresponding of the diagonal: −24dB±10%. Mean value of the Si,i+1 elements: −14dB±5%.
49

Chapter 4.
Practical Considerations
Due to the construction of the gradient insert, the maximum depth of the patient-table into the bore of themagnet is limited. As the rather long coil can only be placed in a fixed position at the end of the bed, thesetup prevents most subjects from positioning the center of their brain at gradient isocenter (Fig. 4.5b).So they are asked to put their head as far inside the RF coil as they can, which is typically about 3 cmdeeper than originally assumed during RF simulation (Fig. 4.5a). Re-evaluating the simulations with amore realistically positioned head-model, resulted in a 15% increase of the 10-g local SAR2. Furthermore,this non-ideal placement requires the shoulders of the subject to touch the edge of the coil. Therefore,the severity of the third-arm artifact is increased due to the enhanced receive-sensitivity of the coil in theshoulder region (Section 3.2). In addition, the obtainable B0-shim quality and SNR are diminished due tosub-optimal placement relative to the shim- and receive-coils, respectively.
Figure 4.5: Patient positioning relative to the RF coil and gradient insert. a: Patient in the RF coiloptimal position, with the brain approximately centered relative to the dipole coil-elements. b: Actualsubject position, shoulders touching the edge of the coil, and brain positioned as close as possible to gradientisocenter.
2When applying 1W of incident power per channel and assuming constructive interference.
50

Part II: Online SAR Assessment Based on Time-Averaged Power Measurements
4.3 Part II: Online SAR Assessment Based on Time-Averaged PowerMeasurements
After validating the simulation methods necessary to assess the SAR distribution corresponding to ourparticular setup, the electric fields produced in a realistically positioned anatomically accurate human head-model were evaluated. To this end, our FEM-compatible implementation of the MRI-based MGH head-model(Makris et al., 2008; Massire et al., 2012) was considered (Fig. 4.6). Based on these simulated field-maps,three different methods to derive appropriate time-averaged power limits were evaluated.
Figure 4.6: Three-dimensional rendering of the in-house-developed, finite-element-compatible implementa-tion of the MGH-head model. a: White Matter (yellow), blood vessels (red), nerves (green) & Cerebellum(purple). b: Grey Matter (dark blue), orbital fat (yellow), eyes (blue), vertebral column (black). c: Skull(cyan), facial bones (gray). d: Air & mastoid cells (green), adipose (purple). e: cartilage (orange), subcu-taneous muscles (pink). f : Whole head (neck and shoulders not shown).
“Constructive interference”
Because the time-averaged power monitors do not allow the relative phase between RF-channels to beevaluated, all possible phase combinations have to be covered (chapter 3). One way to facilitate this is toassume constructive interference of the E-fields at every point in space. The corresponding upper limit ofthe SAR can then be found by:
SAR(r) ↵σ(r)
2(r)
1
T
ˆ T
0
NX
n=1
kbn(t)En(r)k!2
dt , (4.2)
where ↵ is the duty cycle, En(r) is the electric field produced by the nth coil-element, σ(r) the localconductivity (S/m), (r) the local density (kg m−3), bn(t) the waveform played at the nth coil-element, andT the pulse duration.
For this basic safety assessment we will consider two quantities: the local 10-g averaged SAR when assumingconstructive interference of the E-fields at every point (SARwl), and the worst-case global SAR corresponding
51

Chapter 4.
to the comulative forward power divided by the exposed body mass (SARwg). Taking the ratio between theaforementioned parameters, we define the ratio:
R =SARwl
SARwg. (4.3)
Assuming that the power is equally distributed over all available transmit-channels a conservative timeaveraged power limit (Plim) can be deduced as follows:
Plim =1
N
SARlim
RM 0.9 , (4.4)
where N is the number of transmit-pathways, M is the head mass, and SARlim is the local SAR limitspecified in the guidelines (IEC, 2010). To take the approximately ±10% accuracy of the power metersin to consideration, the enforced limits are scaled down by a factor 0.9. For simplicity, and to provide anadditional safety margin, both the 10-s and 6-min time averaged power limits were restricted to the moreconservative guidelines corresponding to the 6-min SAR limits. Furthermore, a conservative average headmass of 5 kg is assumed to provide a subject independent power limit3.
Sending 1 W of power to each of the coil-elements results in a simulated worst-case global SAR of 1.54 W/kgand a maximum local 10-g SAR of 8.12 W/kg. This results in a 10-s time-averaged power limit of 0.7 W perchannel. At this point the 25% accuracy of our simulations is assumed to be well within the safety marginsof these conservative power constraints. Thus assuming constructive interference, no cable loss, completeabsorption of the incident power by the head, and a relatively light average head, a very conservative butusable time-averaged power constraint was derived
“Total incident power”
Alternatively, a suitable time-averaged power limit can be calculated based on the method proposed byBrunner et al. (2008). In contrast to the assumption of constructive interference at every point, whichis physically impossible, this approach incorporates the effects of destructive interference. Consequently,the thus obtained maximum 10-g local SAR could be lower than the worst-case scenario considered in theprevious section. However, this method is very general and does not allow channel dependent constraints tobe incorporated.
When applied to our 8-channel transmit-array, considering a 1 W total power budget at the coil level, weobtain a maximum local 10-g SAR of 2.74 W/kg. Assuming that the guidelines for the local SAR will beexceeded before the global one, another conservative time-averaged power limits can be obtained from:
Plim =1
N
SARlim
2.74 0.9 = 0.41W , (4.5)
where N is the number of transmit-pathways, SARlim is the local SAR limit specified in the guidelines (IEC,2010), and again assuming that there are no cable losses. Although this method provided a clean analyticalsolution for the peak 10-g local SAR, it does not provide a more favorable set of time-averaged powerlimits. Investigating this worst-case scenario in more detail reveals that 70% of the power was depositedon a single channel. This situation, effectively, corresponds to what most closely resembles a single surfacecoil configuration, which is of limited interest in the context of pTx. Because this approach does not allowchannel specific limits to be considered, the benefits of channel dependent time-averaged power-monitorscannot be exploited. On the other hand, compared to the previous method, this approach does allow a muchlarger time-averaged power limit to be applied on one channel, provided that the power transmitted throughthe other channels is negligible.
“CEASAR”
Theory
Omitting the assumption that the energy is distributed evenly among channels, a less restrictive yet alsoconservative approach can be derived to enforce compliance with the SAR guidelines (Boulant et al., 2011).
3It should be noted that currently only adults are allowed in the 7-Tesla scanner at NeuroSpin.
52

Part II: Online SAR Assessment Based on Time-Averaged Power Measurements
Considering the set of N RF-waveforms fn(t) to be played on each of the coil elements, the SAR at point r
is defined as:
SAR(r) =σ(r)
2(r)
1
T
ˆ T
0
∥∥∥∥∥
NX
n=1
En(r)fn(t)
∥∥∥∥∥
2
2
dt . (4.6)
Again discarding the phase information and assuming constructive interference at every point, we obtain thefollowing conservative expression:
SAR(r) σ(r)
2(r)
1
T
ˆ T
0
NX
n=1
kEn(r)fn(t)k!2
dt . (4.7)
Limitation of the average incident power on each transmit channel implies the following constraints:
1
T
ˆ T
0
|fn(t)|2 dt Pn . (4.8)
Taking these inequalities into account, Eq. 4.7 can be simplified to:
SAR(r) σ(r)
2(r)
NX
n=1
kEn(r)k22 Pn + C(r)
!, (4.9)
where C(r) is defined as
C(r) =2
T
NX
n=1
NX
m=n+1
(kEn(r)k kEm(r)kˆ T
0
|fn(t)| |fm(t)|dt) . (4.10)
Applying the Cauchy-Schwarz inequality, we find that
C(r) 2
NX
n=1
NX
m=n+1
(kEn(r)k kEm(r)kp
PnPm) . (4.11)
This way, tailored to the set of RF waveforms at hand, a set of appropriate average power limitations canbe derived for each one of the available transmit-cannels4.
Implementation
In order to reach the full potential of the above proposed SAR-assessment, the time-averaged power limitshave to be re-evaluated based on the RF pulses to be played. To this end, our SAR assessment tool (Fig. 4.7),referred to as “CEASAR”, evaluates both the global and local 10-g SAR over several pre-simulated data sets(Cloos et al., 2010a)5. Each one of them contains the simulated fields corresponding to all of the transmit-elements in the presence of a human head-model. In addition, a pre-calculated “averaging-matrix” is includedto facilitate rapid evaluation of the corresponding 10-g-averaged SAR. Although inter-subject variabilityprecludes predictions with absolute certainty regarding local SAR, these differences may be encompassed,to some extent, by evaluating different head-models. Therefore, in addition to our 20-anatomical-structurehead-model (Fig. 4.6), the 8-anatomical-structure head from the Ansoft human body model (Aarkid, EastLothian, Scotland) was considered et slightly different positions relative to the coil.
When operating in pTx-mode, before the subject enters the scanner, CEASAR is started (on the slaveconsole). At this point, all available simulations corresponding to the selected coil are loaded. First a de-fault protocol is evaluated to obtain a set of initial time-averaged power limits for each of the individualtransmit-channels. These limits typically facilitate all the calibration acquisitions such as B0-shimming, fre-quency adjustments, and transmit-sensitivity mapping. Nevertheless, every time a new protocol is prepared,
4Note that eq 4.9 applies regardless of the RF waveform, i.e., only the average power need to be monitored.5With the current GPU-enabled implementation of CEASAR, protocols including 10-ms transmit-SENSE pulses defined at
a 1-µs raster-time can be evaluated over all models in seconds, thus introducing only a minimal delay between acquisitions.
53

Chapter 4.
CEASAR evaluates the SAR and if necessary provides an appropriate set of alternative time-averaged powerlimits. When excessive SAR is predicted, the option to alter the repetition time or FA is provided (Fig.4.7a). Only protocols that passed the CEASAR evaluation may be played on the scanner (Fig. 4.7b&c).Effectively, this is enforced by only copying validated protocols to the slave-system used to operate the pTx-extension. Meanwhile, the power out of the amplifiers is measured through the use of directional couplersand time-averaged power meters (Section 3.3). In the event that one of the limits is exceeded, the acquisitionis terminated6.
Taking into account the cable losses, amplifier variability, the 10% accuracy of our power monitors, the25% accuracy of our SAR simulations, the initial time-averaged power limit is now approximately 1.2 Wper channel. Adjustments are then only made if a particular protocol requires it. The possibility to fixdifferent average power limits on different channels gives additional flexibility in pulse design, while strictlyenforcing safety. Although a plethora of said subspaces exist, most of them only partially overlap one-another.Therefore, depending on the pTx pulses configuration, CEASAR may suggest a different combination oftime-averaged power constraints. In this way, transmit-SENSE-based acquisitions with substantially highertime-averaged forward power levels on some channels are possible (up to about 3.0 W).
Comparison
Each of the three approaches SAR-assessment considered above have their advantages. Although the methodproposed by Brunner et al. provides an elegant solution to obtain the peak 10-g local SAR correspondingto fixed total-power input, it does not provide the tools necessary to exclude scenarios that are of limitedinterest in the context of pTx. This is illustrated by the peak 10-g local SAR corresponding to our setup,where approximately 70% of the power deposited on a single channel.
Simply assuming constructive interference, on the other hand, allows the additional constrains enforced bychannel-depend power monitors to be incorporated. Consequently, a much higher average power per channelcan be achieved when adopting this method. Considering our interest in pTx-enabled FA-homogenization,where relatively uniform levels of power among channels may be expected, the initial in-vivo pTx experimentspresented in chapter 6 were performed based on the assumption of constructive interference.
Although CEASAR is also based on the assumption of constructive interference, it is more refined allowingthe power to be distributed differently between acquisitions. Moreover, “CEASAR” is calibrated differ-ently, directly considering the global and 10-g local SAR rather then a fixed ratio. Although this methodstill incorporates a substantial safety margin compared to the true SAR (Buchenau et al., 2010), adoptingCEASAR allowed slightly more RF intensive sequences to be explored, such as the MPRAGE in chapter8. However, even more RF intensive applications, such as spin-echo based sequences, would likely requirea more elaborate safety system that allows the true SAR limits to be approached more closely (Graesslin,2008; Graesslin et al., 2009; Gagoski et al., 2009).
6Note that all protocols that can operate within the enforced time-averaged power limits are (IEC, 2010)-compliant. There-fore, running an invalid protocol would not endanger the subject. However, the acquisition may be terminated even if the SARlimits were not reached.
54

Part II: Online SAR Assessment Based on Time-Averaged Power Measurements
Figure 4.7: Screenshots taken from CEASAR. a: The main screen showing a 10-ms pTx RF-waveform. Someof the main features are indicated with arrow and labels. b: Example of a protocol that is in compliancewith the SAR guidelines, but requires the time-averaged power-limits to be updated. c: Example hostinga protocol exceeding the SAR-guideline specifications. Apart from the message window, the SAR levelindicators are orange indicating an excess of the guidelines. Note that, in the background the k-spacetrajectory and gradient waveforms are shown. Although not relevant in the SAR assessment, CEASAR alsovalidates the compliance of the gradient waveforms with respect to the system limitations.
55

Chapter 4.
56

5Local SAR Reduction in Parallel Excitation Based on
Channel-dependent Tikhonov Parameters.5
This chapter has been accepted for publication as: Martijn Anton Cloos, MichelLuong, Guillaume Ferrand, Alexis Amadon, Denis Le Bihan, and Nicolas Boulant.“Local SAR Reduction in Parallel Excitation Based on Channel-DependentTikhonov Parameters” Journal of Magnetic Resonance Imaging 2010 November;32(5):1209-16.
The priciple idea described in this chapter was filed as patent application09290696.5 (EP 2 296 000 A1), “Parallel excitation of nuclear spins with localSAR control”.
Abstract
Purpose: To reduce the local SAR obtained with tailored pulses using paralleltransmission while obtaining homogenous flip angle distributions.
Materials and Methods: Finite-element simulations on a human head modelwere performed to obtain the individual magnetic and electric field maps for eachchannel of a parallel transmit array. Based on those maps, SAR calculations werecarried out for "spoke" pulses designed to homogenize the flip angle in an axialslice of a human brain at 7 Tesla. Based on the assumption that the coil elementnearest to the maximum local energy deposition is the dominant contributor tothe corresponding hot spot a set of channel-dependent Tikhonov parameters isoptimized. Resulting SAR distributions are compared to the ones obtained whenusing standard pulse design approaches based on a single Tikhonov parameter.
Results: In both the small- and large-tip-angle domain the simulations showlocal SAR reductions by over a factor of 2 (4) for a well-centered (off-centered)head model at the expense of roughly 1% increment in flip-angle spread over theslice.
Conlusion: Significant SAR reductions can be obtained by optimizing channel-dependent Tikhonov parameters based on the relation between coil elements andSAR hot spot positions.

Chapter 5.
5.1 Introduction
High local specific absorption rates (SAR) have become an important problem severely limiting the potentialof ultra high field MRI. Increased field strength yields an improved signal-to-noise ratio (Collins and Smith,2001), and therefore promises better image resolution. However, as the Larmor frequency is proportionalto the static field strength, at high field spin excitation requires high radio frequencies (RF). Compared tovacuum, the wavelengths inside the body are reduced considerably due to the dielectric properties of thetissues (Gabriel et al., 1996; Yang et al., 2004). Wavelengths comparable to or shorter than the dimensionsof the body create interferences inside the patient, which can result in complex magnetic and electric fielddistributions. These field distributions can lead to strongly inhomogeneous excitation profiles (Collins andSmith, 2001; Ibrahim et al., 2001b), resulting in non-uniform tissue contrast and signal intensity. Variousmethods have been proposed to achieve homogenous excitation at high field strengths, including alternativecoil designs (Brunner et al., 2009), passive B1 shimming (Yang et al., 2006), shaped pulses (Boulant et al.,2008; Bernstein et al., 2004), static B1 shimming (Ibrahim et al., 2001b; Metzger et al., 2008), and transmit-SENSE (Katscher et al., 2003; Zhu, 2004). With the latter technique, excellent excitation homogeneity wasdemonstrated both in vitro (Ullmann et al., 2005; Setsompop et al., 2006, 2009) and in vivo (Angelone et al.,2006; Setsompop et al., 2008a). Independent control over phase and amplitude for each of the coil elementsduring parallel transmission provides a great wealth of possible RF schemes, which can distribute energydifferently over the patient’s anatomy. Furthermore it was shown that for tailor-made excitation pulses usingparallel transmission, local SAR could show considerable variations (Zelinski et al., 2008b) and high peakvalues (Collins et al., 2007). Hence taming the SAR during parallel transmission requires extensive studiesand calculations (Angelone et al., 2006; Zelinski et al., 2008b; Collins et al., 2007; Mao et al., 2007).
For patient safety reasons, both global, i.e. averaged over the whole exposed body, and local SAR limits mustbe enforced (IEC, 2002). Currently, methods are in development to measure the dielectric properties andestimate the SAR (Katscher et al., 2008; Voigt et al., 2009; Cloos and Bonmassar, 2009) using transmit sen-sitivity maps (B+
1 ). Alternatively, pre-calculated patient models can be used to evaluate the SAR (Graesslinet al., 2009; Kini et al., 2009). In the end, the local SAR peak value imposes more restrictive conditionsthan the global SAR limit on the application of parallel transmission (by limiting repetition times and/orflip angles). Zhu (2004) indicated that if the electric-field distribution is known, global SAR minimizationcould be encompassed in the design procedure of the excitation pulse. Extending this method by adding alimited number of control points during pulse design (Graesslin et al., 2008), i.e. by imposing a quadraticconstraint at these particular points, also allows the local SAR to be reduced at those points.
In this work, we present a new method allowing the maximum local SAR to be reduced via an optimizationtechnique that considers the entire object. The procedure iteratively optimizes a set of channel-dependentregularization parameters, effectively applying channel-specific power penalties. We assume that the coil-element closest to the maximum local SAR location contributes the most to the corresponding hot spot, anassumption that we will justify later on. By using this property, a minimal number of calculations is neededto determine the next iterative step, significantly reducing the overall calculation time.
In the theory section of this paper we first introduce channel-dependent (also possibly time-dependent)Tikhonov regularization parameters in the spatial domain method (Grissom et al., 2006). Following the de-tails about the computation of the electric and magnetic field maps, the optimization procedure for local SARreduction using channel-dependent Tikhonov parameters is provided in the method section. Results obtainedusing the proposed technique are then reported, analyzed and compared with a global SAR minimizationapproach (Zhu, 2004; Zelinski et al., 2007).
58
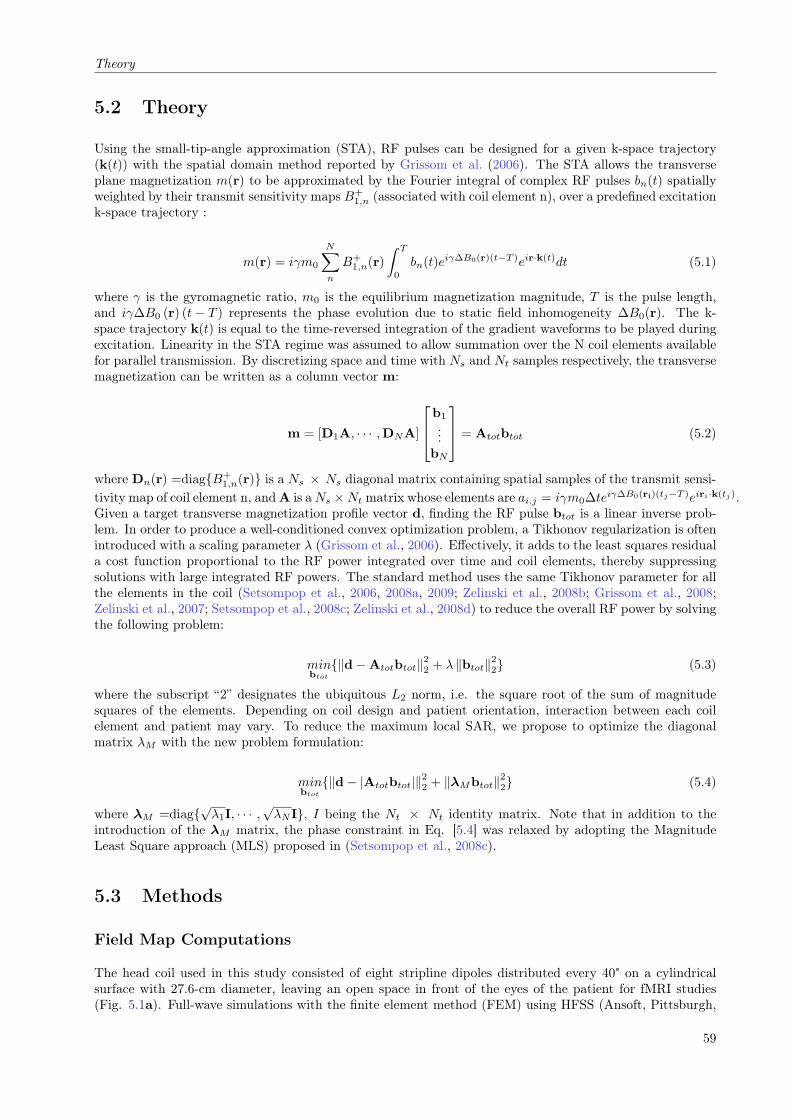
Theory
5.2 Theory
Using the small-tip-angle approximation (STA), RF pulses can be designed for a given k-space trajectory(k(t)) with the spatial domain method reported by Grissom et al. (2006). The STA allows the transverseplane magnetization m(r) to be approximated by the Fourier integral of complex RF pulses bn(t) spatiallyweighted by their transmit sensitivity maps B+
1,n (associated with coil element n), over a predefined excitationk-space trajectory :
m(r) = iγm0
NX
n
B+1,n(r)
ˆ T
0
bn(t)eiγ∆B0(r)(t−T )eir·k(t)dt (5.1)
where γ is the gyromagnetic ratio, m0 is the equilibrium magnetization magnitude, T is the pulse length,and iγ∆B0 (r) (t− T ) represents the phase evolution due to static field inhomogeneity ∆B0(r). The k-space trajectory k(t) is equal to the time-reversed integration of the gradient waveforms to be played duringexcitation. Linearity in the STA regime was assumed to allow summation over the N coil elements availablefor parallel transmission. By discretizing space and time with Ns and Nt samples respectively, the transversemagnetization can be written as a column vector m:
m = [D1A, · · · ,DNA]
264b1
...bN
375 = Atotbtot (5.2)
where Dn(r) =diagB+1,n(r) is a Ns Ns diagonal matrix containing spatial samples of the transmit sensi-
tivity map of coil element n, and A is a Ns Nt matrix whose elements are ai.j = iγm0∆teiγ∆B0(ri)(tj−T )eiri·k(tj).Given a target transverse magnetization profile vector d, finding the RF pulse btot is a linear inverse prob-lem. In order to produce a well-conditioned convex optimization problem, a Tikhonov regularization is oftenintroduced with a scaling parameter λ (Grissom et al., 2006). Effectively, it adds to the least squares residuala cost function proportional to the RF power integrated over time and coil elements, thereby suppressingsolutions with large integrated RF powers. The standard method uses the same Tikhonov parameter for allthe elements in the coil (Setsompop et al., 2006, 2008a, 2009; Zelinski et al., 2008b; Grissom et al., 2008;Zelinski et al., 2007; Setsompop et al., 2008c; Zelinski et al., 2008d) to reduce the overall RF power by solvingthe following problem:
minbtot
kd−Atotbtotk22 + λ kbtotk22 (5.3)
where the subscript “2” designates the ubiquitous L2 norm, i.e. the square root of the sum of magnitudesquares of the elements. Depending on coil design and patient orientation, interaction between each coilelement and patient may vary. To reduce the maximum local SAR, we propose to optimize the diagonalmatrix λM with the new problem formulation:
minbtot
kd− |Atotbtot|k22 + kλMbtotk22 (5.4)
where λM =diagpλ1I, · · · ,
pλNI, I being the Nt Nt identity matrix. Note that in addition to the
introduction of the λM matrix, the phase constraint in Eq. [5.4] was relaxed by adopting the MagnitudeLeast Square approach (MLS) proposed in (Setsompop et al., 2008c).
5.3 Methods
Field Map Computations
The head coil used in this study consisted of eight stripline dipoles distributed every 40° on a cylindricalsurface with 27.6-cm diameter, leaving an open space in front of the eyes of the patient for fMRI studies(Fig. 5.1a). Full-wave simulations with the finite element method (FEM) using HFSS (Ansoft, Pittsburgh,
59

Chapter 5.
A B C
D E
Figure 5.1: a: The coil and nominal head position used for magnetic and electric field simulation. b–e:Head positions used for simulation: the centered human head is shown in gray. a: Dark gray wedge andthe black outline of the head indicate rotations in the transverse and sagittal plane. b: 2º- rotation insagittal plane. c: 2º-rotation in transverse-plane. d: 10º-rotation in the sagittal plane. e: 10º-rotation inthe transverse-plane.
PA) (Vogel and Kleihorst, 2007; Kozlov and Turner, 2009) provided the electric and magnetic field mapsnormalized to 1 W incident power for each dipole. All dipoles were tuned ideally at 297 MHz corresponding tothe proton Larmor frequency at 7 Tesla, and matched identically to a 50-Ohm line impedance. However eachdipole resonated at a slightly different frequency due to the interaction of the human head model placed inthe centre of the coil; but the reflected power coefficient on all channels was still maintained below 0.1 at thecommon field excitation frequency. The head and shoulders of the Ansoft human body model (Aarkid, EastLothian, Scotland) were used to provide an 8-anatomical-structure head model. The FEM uses tetrahedronsof various sizes and shapes, instead of the Cartesian Yee cells frequently used in finite difference time domain(FDTD) methods. Appropriate tetrahedron density distributions were provided by the HFSS mesh adaptiontool. Nonetheless, it was validated that a further increase in the tetrahedron density by a factor of 3 resultsin nearly identical field-distributions. To facilitate fast SAR evaluation and pulse optimization, the fieldmaps obtained using the FEM were projected onto a 5x5x5mm3 Cartesian grid (Kozlov and Turner, 2009).Before performing SAR computations, the electric field maps were verified by computing a histogram of theiramplitudes. Voxels corresponding to relatively high isolated peak values were then inspected and removedif affected by partial voluming.
Using non-patient specific models, inter-patient anatomical differences remain unaccounted. Furthermore,the position of the patient can be different from the model placement in the simulation. To test the robustnessof our method with respect to head displacement, additional simulations were performed with the head modelrotated (Fig. 5.1b-e), first rotated by f around the z-axis followed by the same rotation around the x-axis(f = 2°, 10°).
SAR Calculation
The local SAR is defined as a function of the local conductivity σ (r), local mass density (r), the durationof the pulse T , and the local electric field strength E(r, t):
SAR(r) =σ(r)
2(r)
1
T
ˆ T
0
kE(r, t)k22 dt (5.5)
Assuming linearity of the E-field with respect to the input currents in the coil elements, the complex sum ofthe bn(t)-scaled electric field components of all coils was used to calculate the SAR value in each voxel:
60

Methods
A
!1 0 1FOVx
!1
!1
0
1
FOVy
!1
B
!1 0 1FOVx
!1
!1
0
1
FOVy
!1
C
!1 0 1FOVx
!1
!1
0
1
FOVy
!1
Figure 5.2: Spoke locations used for pulse design, in the (kx, ky) plane, where FOV denotes the field ofview (x 1/4 23 cm, y 1/4 27 cm). Two (a), three (b), and five (c) spoke k-space trajectory used to generatehomogenous excitation profiles.
E(r, t) =
NX
n
bn(t)En(r) (5.6)
where En is the three-component electric field associated with coil element n, as found from the full-wavesimulation. Local SAR distributions were averaged over 10-g closed volume elements, as specified in the IECguidelines (IEC, 2002), by using a region growing algorithm. This algorithm was implemented in C++ byprogressively increasing the size of an averaging box until 10 grams of matter were contained in it. Thuson average, the size of a 10-g box was about 82.7-voxels. The head model used in the simulations providedboth the conductivity and mass density maps needed for this calculation. In this work, although the pulseswere designed to homogenize the flip angle over an axial slice through the central region of the brain, SARcalculations were performed over the whole head and neck. In the remainder of this text, wherever localSAR is mentioned, it will refer to the 10-g averaged SAR.
Pulse Design and SAR Optimization
We focused on slice selective excitation pulses with a homogeneous excitation profile over a central axialslice of the brain using a spokes-shaped k-space trajectory (Saekho et al., 2006). We quantified the flip angle(FA) inhomogeneity by calculating the root mean square error of the flip angle, divided by the target FA.The latter was chosen to be either 20° or 90°, to explore different FA regimes. The linear model of Eq. 5.2was used to compute an RF solution targeting 20°, while the additive flip-angle method was used to designRF solutions targeting 90° (Grissom et al., 2008). Full Bloch simulations were performed to quantify theperformance of each pulse. Trajectories with 2, 3, and 5 spokes (Fig. 5.2) were tested. Individual sub-pulseswere 0.7-ms sinc waveforms apodized with Hanning windows and time-bandwidth product equal to 4. Blipsused to travel between k-space locations (duration = 80 ms maximum slewrate = 200 mT/m/s) were playedbarely overlapping with the excitation pulses. The placement of the spokes was not optimized but couldpotentially be determined with sparsity-enforced algorithms (Zelinski et al., 2008d).
For a given number of spokes, the optimization started from a pulse designed with the standard methodusing the spatial domain method (Grissom et al., 2006) with the MLS approach (Setsompop et al., 2008a)Eq. 5.4, by using a set of identical Tikhonov parameters (λM = λI) obtained from the L-curve criterion(Hansen, 1992). For the 90 pulse, which no longer fulfills the STA, first a pulse with target flip angle of45 was designed and then simply multiplied by 2 to provide a first order solution. Results from the fullBloch simulations were then used to design the correction term in the additive flip angle method (Grissomet al., 2008). For any set of regularization parameters, the local variable exchange method (Setsompop et al.,2008c) was implemented in order to disregard the phase information in the output transverse magnetization,hence only taking into account the flip angle distribution. Subsequently the 10-g average local SAR map wascalculated by using the returned initial RF pulses. Then for each iteration in the optimization procedure, the
61

Chapter 5.
Figure 5.3: Flowchart illustrating the iterative optimization procedure used to optimize the coil-element-dependent Tikhonov parameters.
Tikhonov parameter of the coil element closest to the spatial location of the maximum local SAR value wasincremented by a small number D, 1/5 of the initial value, while leaving the other parameters unchanged.For instance, if the penalty on coil 1 is incremented, the new matrix containing the updated Tikhonovparameters now becomes gλM = diag
pλ1 +∆I, . . . ,
pλNI. In this way, a higher penalty on the RF power
is imposed on the coil mainly responsible for the maximum local SAR. By redesigning the RF pulse usingthe updated Tikhonov parameters, the location of the maximum local SAR shifts from its previous positionand its value decreases. Depending on the application, the procedure can then be stopped if the desired localSAR criteria have been satisfied, for instance if the maximum local SAR drops below a given threshold, orif a maximum number of iterations is reached. The procedure is illustrated in Fig. 5.3.
Pulses designed assuming a well-centered head were directly applied to the head model rotated by 2 or 10
to assess the robustness of our optimization result with respect to the head position. In these simulations,the full effects of detuning and dematching of the coil elements due to changed head position were taken intoaccount. Subsequently both B+
1 and E-maps obtained with the rotated head models were used to evaluatethe performance of the proposed method under these new conditions.
For comparison we also implemented global SAR minimization as proposed by Zelinski et al. (2007). First weconstruct a matrix where is a single vector containing the concatenation of the complex SAR contributionsq
σ(r)2ρ(r)Ej (r) at every point r from the jth coil element. Using this expression Eq. 5.3 can be modified to
include a cost function proportional to the global SAR:
minkd− |Atotbtot|k22 + λbHtotG
Hbtot (5.7)
Where describes the interaction of the electric fields for each of the N sub-pulses, such that is proportional tothe global SAR. Again the phase constraint was relaxed by adopting the MLS approach (Setsompop et al.,2008c). To allow fair comparison with our local SAR optimized pulses the Tikhonov scalar term was chosento match the corresponding FA homogeneity. Pulse design and SAR calculations were implemented in C++& CUDATM , while the results were analyzed with Mathematica (Wolfram Research, Champain, IL, USA).
5.4 Results
For each spoke trajectory, incrementing the Tikhonov parameter associated with the coil element closest tothe maximum local SAR showed an approximately exponential decrease in peak local SAR (Fig. 5.4a). Thecost of this decrease in maximum local SAR is a slight increase in the excitation inhomogeneity (Table 5.1).Compared to merely imposing a penalty on the total power, i.e. increasing the Tikhonov parameter in itsscalar form, the proposed coil-specific optimization provides a more favorable trade-off (Fig.5.4b). Table 5.1shows the proposed method reduces the maximum local SAR by more than 50% for a 1% increment of theFA inhomogeneity. In comparison, global SAR minimization demonstrated only minor local SAR reductions(see “Global SAR minimization 20°” results in Table 5.1). Furthermore, in some instances the local SARwas increased. Investigation of the local SAR evolution during the variable exchange method (Fig. 5.4c)
62

Results
0 20 40 60 80 100Iter.
1
0.5
a.u.
3 4 5!
10
20
30
40
W!kg
0 10 20 30 40 50Iter.
50
100
150
W!kg
0 10 20 30 40 50Iter.
2
4
6
8
10
12
14
W!kg
A B C D
Figure 5.4: Local SAR and FA error evolution for a 20º pulse. a: The ratio between the initial maximum localSAR and the max- imum local SAR after the Nth iteration. Results from the various k-space trajectoriesare indicated with different lines: solid black (2 spokes), dashed gray (3 spokes), dotted black (5 spokes). b:The same maximum local SAR ratio as a function of the FA inhomogeneity in the target slice (in %) for a2-spoke excitation pulse. Results from various optimization strategies are indicated with different lines: solidblack (the standard design method), solid gray (global SAR minimization), dashed black (channel-specificTikhonov-parameters). c: The maximum 10-g SAR for a 2-spoke trajectory after the Nth iteration of thevariable exchange method starting from a spatially invariant target phase. The final set of optimized valueswas used for the channel-specific Tikhonov-parameters. Results obtained using various design methods: samelabeling as subfigure b. d: The global SAR evolution for the same conditions as in sub-figure c. Resultsobtained using various design methods: same labeling as used in subfigures b and c.
showed a significant initial SAR reduction. However, as the phase constraint is relaxed both methods, i.e.Zelinski’s and the standard design method, converge to comparable local minima. Considering the globalSAR, the coil specific Tikhonov parameter optimized pulse even outperforms the pulse designed using theglobal SAR optimization method (Fig. 5.4d).
Figure 5.5 shows the transverse slice of the head containing the maximum local SAR. SAR distributionsfor the initial pulses, obtained using the scalar Tikhonov parameter (L-curve criterion), are shown in thetop row of Figure 5.5, while the results obtained after 100 iterations are shown in the bottom row. Coil-element-dependent Tikhonov parameters are displayed (Fig. 5.5) after optimization. For comparison the FAdistributions obtained using a 3 spokes trajectory targeting a 90 FA, before and after SAR optimization,are also included in Figure 5.5.
Looking at the evolution of the SAR distribution over several optimization iterations (Fig. 5.6) reveals thatthe maximum hot spot changes position as expected. By comparing different pulse designs (for instance 20
vs 90 ), it was found that the evolution of the SAR distribution may vary.
For both initial and optimized pulses, rotation of the head model by 2 or 10 significantly affected the localSAR while barely changing the global one (see Table 5.1). However, our optimized pulses initially designedfor the head in the reference position always yielded a lower maximum local SAR than with the initial pulsesobtained with a single Tikhonov parameter. Especially short pulses containing only 2 or 3 spokes got a largereduction in the maximum local SAR. Note that, a SAR reduction of more than a factor 3 was found at thecost of a 2.3% -increment in FA error using the 2 spoke trajectory, a 2-fold SAR reduction could be obtainedwith an 1% -increment by halting the optimization procedure at an earlier stage. In general, the localSAR maxima found for the rotated head models were all reduced by a factor larger than 1.84.
Finally, changing the reference position of the head model from centered to 10°-rotated and repeating theoptimization procedure with the “rotated” E-fields & B1-maps allowed over a 4-fold reduction in local SARif the head stays in the rotated configuration (result not reported in table above). For example, optimizationof the 2-spoke 20° pulse reduced the maximum local SAR from 42 W/kg to less than 10 W/kg for 100%duty cycle. In general, the maximum local SAR could be reduced to values similar to the optimized resultsobtained from the centered head configuration.
63

Chapter 5.
Centered 2 Rotation 10 RotationLocal Global FA error Mean FA Local Global Local Global
Initial 202 33.9 3.87 3.0% 19.6 30.6 4.48 42.7 3.85
3 9.8 1.40 2.0% 19.7 10.7 1.69 13.1 1.41
5 4.8 0.67 1.4% 19.48 4.7 0.80 6.1 0.67
Global SARminimization 20
2 31.5 3.84 5.3% 19.3 34.3 5.30 46.9 4.56
3 10.0 1.35 3.1% 19.7 14.1 2.00 18.2 1.72
5 6.3 0.65 2.1% 19.8 5.9 0.79 7.7 0.65
Optimized 202 10.3 3.11 5.3% 19.4 16.5 4.33 12.8 3.02
3 4.5 1.44 3.1% 19.6 6.4 1.95 5.8 1.38
5 2.1 0.62 2.1% 19.8 3.3 0.85 2.7 0.62
Initial 902 797.2 88.46 2.9% 88.0 680.7 102.64 976.2 87.16
3 238.6 30.75 1.6% 88.9 250.0 37.06 310.8 30.91
5 106.4 14.36 1.4% 89.0 101.7 17.120 133.9 14.49
Optimized 902 262.8 73.05 4.4% 86.7 361.1 98.09 313.4 68.36
3 107.7 30.72 2.4% 88.5 143.8 41.51 139.9 29.45
5 47.0 14.21 1.7% 88.5 68.2 17.71 60.6 12.91
Table 5.1: ‘Local’ corresponds to the maximum 10-g local SAR while ‘Global’ stands for the SAR averagedover the entire head (both in W/kg). Bold numbers indicate the number of spokes used in the k-spacetrajectory. RF pulses were designed and optimized for the head model in the centered position. Global andmaximum local SAR were calculated when applying these pulses to the centered and rotated head models.
Figure 5.5: Ten-g local SAR distributions found for slice selective excitation pulses with a homogeneousexcitation target profile (100% RF duty cycle is assumed). SAR distributions for pulses designed withrespectively 3- and 5-spoke k-space trajectories are shown for both 20 and 90 FA targets. The top rowshows the slice that includes the maximum 10-g local SAR for the initial excitation pulses. The bottomrow shows the displaced equivalent slice for the optimized excitation pulses. Coil element positions areindicated by the gray squares. Optimized coil-element-dependent Tikhonov parameters are shown next totheir associated coil elements (to be multiplied by 10−6). For the 90-tip-angle target, the initial pulse has thesame scalar Tikhonov parameter as for the 20 FA. Optimized coil-element-dependent Tikhonov parametersfor the correction term are shown (to be multiplied by 10−6) next to their associated coil elements, whilethe parameters for the first-order term were the same as for the 20 FA scenario. In the center the FAdistribution in the target slice (brain only) is shown before (top) and after optimization (bottom).
64

Discussion
Figure 5.6: Ten-g local SAR distributions found for a 2-spoke slice selective excitation pulse with a 20°homogeneous excitation target profile (100% duty cycle). Slices containing the maximum local SAR atdifferent stages during the optimization procedure are shown. The location of the maximum hot spot isindicated with a circle for each iteration.
5.5 Discussion
The above results show that coil-element-dependent Tikhonov parameters can be used to reduce and movehot spots. The assumption that it is the coil closest to the hottest spot that contributes the most to themaximum local SAR was a key element in our optimization procedure. This assumption originates from theobservation that for the studied microstrip coil, the electric fields inside the head are strongly attenuated.Then it was indeed confirmed by observing the change of location of the hottest spot with our optimizationiterations. However this assumption could break with different coil geometries, in particular if the diameterof the coil is much larger than the one proposed in this study1. By applying the optimization in a coil-element-dependent fashion, we showed that reductions of more than a factor of 2 in the maximum local SARare possible on a well-centered head at the expense of approximately a 1%-increment in FA inhomogeneity2.
As an alternative to the nearest coil element approach, algorithms such as the simplex or the gradientdescent could be used to optimize the coil-dependent Tikhonov parameters. However, the 10-g local SARwould have to be evaluated for every parameter change in the design, greatly increasing the computationaltask. Even with the NVIDIA® CUDATM -based optimizations available to us at this time, local SARevaluation integrating all degrees of freedom can still be a tremendous constraint. On the other hand, thechannel-dependent Tikhonov parameter method has a more restricted number of degrees of freedom and couldtherefore be easily applied to k-space trajectories with large numbers of time steps. For instance, it couldbe potentially used in combination with variable density spirals (Liu et al., 2008), to obtain an additionalSAR reduction. Furthermore, although the hot spot can often be found at similar initial positions, manydifferent hot spot positions can be found during optimization. The channel-dependent method allows all thesescenarios to be optimized without increasing the computational complexity, unlike adding additional controlpoints needed to minimize possible new hot spot locations. Based on the performance of relatively standardhardware (2.4GHz Intel® CoreTM 2 Duo laptop including a NVIDIA® GeForce® 9600m graphics card),pulses optimized over 100 iterations can be found in less than 1 min. In the demonstrated optimizationprocedure, the parameters were incremented equally for all time steps based on the maximum 10-g localSAR location, a “step” being a spoke in the reported work. By replacing the identity matrix I in λM
with an optimized diagonal matrix, independent Tikhonov parameters can be defined for each time step ti
1Since the publication of the work presented here (Cloos et al., 2010c), generalized local SAR optimization techniques haveunderlined the relation between local SAR of the coil geometry for close fitting micro-strip array-coils (Sbrizzi et al., 2012).In these scenarios such methods indirectly enforce our assumption that it is the coil-element closest to the hottest spot thatcontributes the most to the maximum local SAR.
2Although the performance of the off-slice magnetization suppression was not explicitly validated in this work, it may beexpected to remain relatively unaffected by the optimization procedure, at the very least in the linear domain of the small-tip-angle approximation, as long as the selectivity of the individual sub-pulses is of sufficient quality.
65

Chapter 5.
defining the amplitude of the sub-pulses bn(ti). To keep the problem reasonably simple, we have chosento keep the regularization parameters the same for every time step while allowing them to vary amongcoil elements. Nevertheless, allowing the Tikhonov parameters to vary with time steps could yield a bettersolution since a larger number of degrees of freedom would be available for optimization. Compared to otherSAR-reducing methods such as global SAR optimization and increasing the scalar Tikhonov parameter, themethod proposed here showed considerable advantages. Increasing the Tikhonov parameter in its scalarform allows the local SAR to be decreased (Fig. 5.4b) at the expense of a large FA error. Global SARoptimization can potentially result in significant SAR reductions (Fig. 5.4c&d). However, in combinationwith the variable exchange method sub-optimal local-minima can be found. Furthermore, the local SAR canalso be increased while the global one is reduced (Table 5.1). Considering a head displaced from the coilcentre, the local SAR can be increased substantially. For all the head positions we tried, pulses obtainedby the proposed method from the centered reference head model yielded a lower peak SAR value thanthe one found by the standard design method, making our approach more robust with respect to headdisplacement. Furthermore, using Tikhonov regularization in its scalar form somewhat assumes that all coilelements deposit similar amounts of power in the patient, therefore that the head is round, well-centered andthat all channels transmit equally well. In practice it might be hard to perfectly centre each patient’s headdue to differences in size and asymmetries in head geometry. The 4-fold reduction in peak local SAR weobtained for the head model rotated by 10° suggests that the more asymmetric the geometry/position of thehead is in the coil, the more likely the optimization method reported here can help decrease the peak SARvalue. Also often the power available per channel is limited. Under these conditions, it can be advantageousto optimize pulses based on the method described here. Incrementing the coil-element-dependent Tikhonovparameters based on the power per channel allows pulses to be found that maximize the utilizable powerand suppress solutions where too large amplitudes occur on a single channel.
In conclusion, a novel method was demonstrated to reduce the local SAR in excitation pulses for magneticresonance imaging systems using parallel transmission. Patient-specific local SAR mitigation is possiblein both the small and the large-tip-angle domain by introducing coil-element-dependent regularization pa-rameters. Under the assumption that the coil element closest to the maximum local SAR is the dominantcontributor, the local SAR could be reduced by a factor of 2 to 4 for a variety of spoke-based k-space trajec-tories. This should be useful in high field applications where reductions of local SAR in parallel excitationare strongly desired.
66

6kT -Points: Short Three-Dimensional Tailored RF Pulses for
Flip-Angle Homogenization Over an Extended Volume6
This chapter has been accepted for publication as: M. A. Cloos, N. Boulant, M.Luong, G. Ferrand, E. Giacomini, D. Le Bihan, and A. Amadon.”kT -Points: ShortThree-Dimensional Tailored RF Pulses for Flip-Angle Homogenization Over anExtended Volume” Magnetic Resonance in Medicine 2012 January; 67 (1): 72–80.
The priciple idea described in this chapter was filed as patent aplication10290205.3 (WO 2011/12 8847 A1), “Method and apparatus for compensatingfor B1 inhomogenity in magnetic resonance imaging by nonselective tailored RFpulses”.
Abstract
With Transmit-SENSE, we demonstrate the feasibility of uniformly exciting avolume such as the human brain at 7T through the use of an original minimalisttransmit k-space coverage, referred to as “kT -points”. Radio-frequency energyis deposited only at a limited number of k-space locations in the vicinity of thecenter to counteract transmit sensitivity inhomogeneities. The resulting non-selective pulses are short and need little energy compared to adiabatic or otherB+
1 -robust pulses available in the literature, making them good candidates forshort-TR 3D sequences at high field. Experimental verification was performedon 3 human volunteers at 7 T by means of an 8-channel transmit array system.On average, whereas the standard circularly polarized excitation resulted in a33% flip angle spread (standard deviation over mean) throughout the brain, anda static RF-shim showed flip angle variations of 17% and up, application of kT -point-based excitations demonstrated excellent flip angle uniformity (8%) for asmall target flip angle and with sub-millisecond durations.

Chapter 6.
6.1 Introduction
Increased static magnetic fields enhance the signal-to-noise ratio so that finer spatial resolutions can beachieved. However at high field, the proton Larmor frequency increases to the extent where the wavelengthbecomes smaller than the volumes of interest (VOI). As a result of dielectric resonances and radio-frequency(RF) interferences, inhomogeneous transmit profiles (B+
1 ) develop through the body to be observed (Yanget al., 2002; Van de Moortele et al., 2005). This translates into zones of shade and losses of contrastdistributed across the image.
Several methods have been proposed to counteract the B+1 inhomogeneity issue. Already in the fifties, Carr,
Purcell, Meiboom and Gill noticed that shifting the phase by 90° of a train of pulses with respect to thephase of an initial pulse cancels the B+
1 inhomogeneity errors at zero order (Carr and Purcell, 1954; Meiboomand Gill, 1958). In the eighties, a plethora of RF pulsing techniques was developed to counteract that sameproblem, in particular frequency-sweeping adiabatic pulses (Baum et al., 1985; Silver et al., 1985; Staewenet al., 1990), nowadays used in many standard sequences to invert the magnetization. Optimal performanceof these methods usually requires long pulses and high power, i.e. highly energetic pulses. This results in anotable specific absorption rate (SAR) contribution, limiting their applicability.
In more recent years, several techniques have appeared to tackle these problems. Strongly modulating pulseshave shown to be useful at 3T and 7T (Boulant et al., 2008, 2009), but have also shown their limits. UsingRF pulses in combination with magnetic field gradients (Pauly and Nishimura, 1989) have demonstratedtheir ability to counteract minor spatial B+
1 variations in both volumes (Saekho et al., 2005) and single slices(Saekho et al., 2006). In the presence of stronger B+
1 variations, as observed in the brain at 7 Tesla, againlong pulses are needed to obtain a homogeneous excitation profile (Zelinski et al., 2008c). To further facilitateB+
1 -inhomogeneity mitigation at high fields, parallel transmission (Katscher et al., 2003; Zhu, 2004; Grissomet al., 2006) was introduced, providing better control of the RF distribution and helping homogenizationof the spins flip angle (FA) within the VOI. Static RF shimming solely relies on setting fixed optimizedamplitude and phase combinations on each transmitting channel to reach good homogenization of the B+
1
distribution in a limited VOI (Mao et al., 2006). Dynamic RF shimming, or “Transmit-SENSE” (Katscheret al., 2003; Zhu, 2004), addresses instead a FA target distribution by allowing RF waveforms to be differenton every channel as gradient pulses are played to cover a predetermined k-space trajectory. “Spokes-based”waveforms (Saekho et al., 2006) perform especially well in the framework of parallel transmission due to theextra degrees of freedom available for pulse design with good FA homogenization over a slice in the humanbrain at 7 Tesla (Setsompop et al., 2008a). But until now, no demonstration was made which shows similarperformance in 3D over an extended volume such as a human brain. Although multishot 3D coverage ofthe transmission k-space has been proposed with trajectories such as a stack of spirals (Saekho et al., 2005),it has never led to successful application at high fields because, again, it is penalized by lengthy RF pulsedurations, bringing B0-inhomogeneity, relaxation and magnetization transfer issues up front (Boulant, 2009;Matson and Liu, 2010).
In this paper, we introduce a concept that provides spatially uniform excitation in an extended volume withtailored, yet non-selective, RF pulses. These pulses rely on an original transmit k-space trajectory whichcovers a minimal number of locations, the so-called “kT -points”, so as to not waste time and energy atspatial frequencies which need not be addressed in the context of smooth RF inhomogeneities. Applied inconjunction with parallel transmission, sub-millisecond pulses are thus possible, leading to a broad spectrumof potential applications in 3D-acquired sequences with short repetition time (TR). While the original methodwas first reported in (Cloos et al., 2010b; Amadon and Cloos, 2010), a more comprehensive description isgiven here, alongside a demonstration of its application to 3D fast low angle shot sequences (FLASH) inthe human brain at 7 Tesla. Results are analyzed and discussed by comparing them with those obtained bymore standard methods such as static RF shimming.
68

Methods
6.2 Methods
Pulse design
The method presented below allows the design of RF-inhomogeneity-counteracting pulses which are non-selective based on an original transmit k-space trajectory, hereafter referred to as “kT -points” (Cloos et al.,2010b). It is inspired from the slice-selective Fast-kz trajectory (Saekho et al., 2006), often referred to as“spokes” in the literature (Setsompop et al., 2008a; Zelinski et al., 2008c,d; Setsompop et al., 2008c), whichis used to homogenize the excitation in a single slice, therefore solving a 2D problem even though spokesspread in 3D k-space. The location of spokes in the (kx, ky) plane proves to be very sparse in the contextof parallel transmission, with only 2 spokes being sufficient to homogenize to a good extent an axial slicein the center of the human brain at 7T (Setsompop et al., 2008a). In the same manner, for a homogeneous3D excitation, kT -points embody a limited number of excitation sub-pulses interleaved with gradient blipsto travel between transmission sites in three-dimensional k-space. In our case, sub-pulses will simply besquare and no gradient is played a priori whilst pulsing RF. The name “kT -points” indicates that RF-poweris applied only while stationary in k-space, “kT ” standing for Transmission k-space. Attributable to thesimilarity to the spoke trajectory in the (kx,ky) plane (Saekho et al., 2005), techniques introduced to refinespoke placement (Zelinski et al., 2008d; Yip et al., 2006; Ma et al., 2010) can also be applied to find kT -point locations. In this work, such locations were obtained by applying a threshold on the inverse Fouriertransform of the mask, similarly to the method introduced by Ma et al. (2010). Although more thoroughmethods could potentially improve excitation uniformity, the aforementioned approach was selected for itscomputationally simplicity allowing real-time evaluation for in-vivo experiments.
To show the validity of the method, we applied it to homogenize the FA over the entire human brain at7T, by implementation on a transmit-array system with 8 independently-driven channels. The brain volumewas first extracted from initial images acquired with a short B0-mapping sequence (preliminary step detailedlater on). Subsequent to the Fourier transform of the 3D brain mask, the kT -point locations were determinedby the position of the N largest magnitude components in k-space1. From these N locations, the trajectorywas deduced by solving the associated traveling salesman problem. Then, pulse design was performed withMathematica (Wolfram Research, Champaign, IL, USA) using the small tip approximation in the spatialdomain (Grissom et al., 2006), and the local variable exchange method to solve the magnitude least squares(MLS) problem (Setsompop et al., 2008a). Optimal Tikhonov parameters were found by applying the L-curve criteria (Hansen, 1992; Cloos et al., 2010c). All pulse design calculations were performed on the samegrid as was used for B+
1 -mapping, taking into consideration only the voxels inside the VOI (the entire brainin our case).
As kT -points are targeted towards 3D sequences with no spatial selectivity and small TR, such as theMP-RAGE sequence (Bernstein et al., 2004), short excitation pulses are favored. Repeating the designprocedure over several iterations, as illustrated in Fig. 6.1, facilitated the optimization of the individualsub-pulse durations. First an initial candidate is obtained by designing an excitation pulse with extremelyshort sub-pulse durations (10-ms). Comparing this initial candidate’s sub-pulse amplitudes to a pre-definedmaximum voltage, a set of new sub-pulse durations was obtained by keeping the sub-pulse time integralsthe same between iterations. From these sub-pulse durations, a new candidate excitation pulse was foundtaking ∆B0 evolution into account. Due to the change in ∆B0 evolution between iterations, this procedurehad to be repeated a few times until an RF solution was found that both minimized sub-pulse duration andsatisfied the amplitude constraint. In order to allow relatively low TR values, the amplitude was constrainedto 90 V per channel, so as to keep the output RF power below the threshold later discussed in the SARmonitoring section.
Setup & B0 shimming
Three volunteers were scanned to demonstrate the kT -point method as a way to homogenize excitation in theirentire brain. Informed consent was obtained from them in accordance with guidelines of our institutionalreview board. Experimental validation was performed on a Siemens 7T Magnetom scanner (Erlangen,Germany), equipped with an 8-channel transmit array (1 kW peak power per channel). Our AC84 head
1Magnitude of FFT(Abs[CP-mode] - Abs[Target])
69
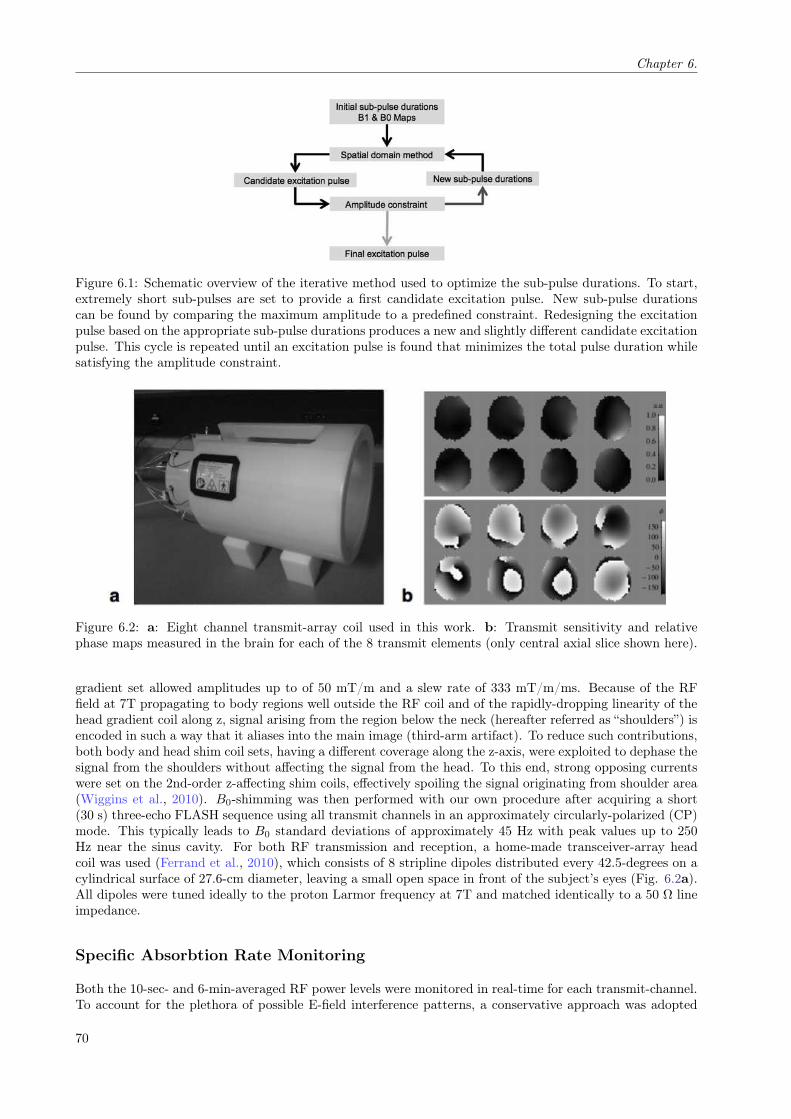
Chapter 6.
Figure 6.1: Schematic overview of the iterative method used to optimize the sub-pulse durations. To start,extremely short sub-pulses are set to provide a first candidate excitation pulse. New sub-pulse durationscan be found by comparing the maximum amplitude to a predefined constraint. Redesigning the excitationpulse based on the appropriate sub-pulse durations produces a new and slightly different candidate excitationpulse. This cycle is repeated until an excitation pulse is found that minimizes the total pulse duration whilesatisfying the amplitude constraint.
Figure 6.2: a: Eight channel transmit-array coil used in this work. b: Transmit sensitivity and relativephase maps measured in the brain for each of the 8 transmit elements (only central axial slice shown here).
gradient set allowed amplitudes up to of 50 mT/m and a slew rate of 333 mT/m/ms. Because of the RFfield at 7T propagating to body regions well outside the RF coil and of the rapidly-dropping linearity of thehead gradient coil along z, signal arising from the region below the neck (hereafter referred as “shoulders”) isencoded in such a way that it aliases into the main image (third-arm artifact). To reduce such contributions,both body and head shim coil sets, having a different coverage along the z-axis, were exploited to dephase thesignal from the shoulders without affecting the signal from the head. To this end, strong opposing currentswere set on the 2nd-order z-affecting shim coils, effectively spoiling the signal originating from shoulder area(Wiggins et al., 2010). B0-shimming was then performed with our own procedure after acquiring a short(30 s) three-echo FLASH sequence using all transmit channels in an approximately circularly-polarized (CP)mode. This typically leads to B0 standard deviations of approximately 45 Hz with peak values up to 250Hz near the sinus cavity. For both RF transmission and reception, a home-made transceiver-array headcoil was used (Ferrand et al., 2010), which consists of 8 stripline dipoles distributed every 42.5-degrees on acylindrical surface of 27.6-cm diameter, leaving a small open space in front of the subject’s eyes (Fig. 6.2a).All dipoles were tuned ideally to the proton Larmor frequency at 7T and matched identically to a 50 W lineimpedance.
Specific Absorbtion Rate Monitoring
Both the 10-sec- and 6-min-averaged RF power levels were monitored in real-time for each transmit-channel.To account for the plethora of possible E-field interference patterns, a conservative approach was adopted
70

Methods
to ensure patient safety and compliance with the SAR guidelines (IEC, 2002). Power limits were derivedfrom finite element simulations (HFSS, Ansoft, Pittsburgh, PA) (Cloos et al., 2010c; Kozlov and Turner,2009) performed for this specific coil loaded with different human head models in various positions, takingthe worst-case scenario amongst those. Trust in our simulations was gained by matching B+
1 -maps obtainedfrom them with that obtained from measurements on a spherical phantom of well-known electric permittivityand conductivity. Then, assuming E-field constructive interference in every voxel of the human-head models,a conservative power constraint was found for both 10-sec and 6-min averages.
B+1 & B0-mapping
Currently, non-selective B+1 -mapping is particularly difficult due to the combination of time and conservative
SAR constraints for parallel transmission studies on human volunteers. Measuring relative B+1 -maps in the
low-tip-angle regime provides a low SAR solution that can be upgraded to provide quantitative FA mapsusing a single high angle measurement (Setsompop et al., 2008a; Van De Moortele et al., 2007). In orderto minimize T1-weighting, these relative B+
1 -maps are obtained from a small-tip-angle spoiled-gradient-echosequence (FLASH) with relatively long TR (0.2-1.0s) to remain in the domain where the signal intensityis linearly dependent on the FA over a sufficiently large range. Considering 3D tailored excitation pulses,such TR values extend the total duration of the B+
1 -mapping and pulse validation procedures beyond themaximum scan time appropriate for a single human volunteer. Still, fast B+
1 -mapping is desired to validatenon-selective tailored RF-pulses such as kT -points. Considering the T1 values corresponding to the maintissues in the human brain, gray and white matter (T1 < 2s (Rooney et al., 2007)), the signal intensitydifference is approximately 5% or less if FA < 6° and TR 50ms at 7T. In this domain, intensity attenuationdue to T1 in a FLASH image can then be corrected, to first order, for a known FA distribution, by assumingan average T1 in the signal equation (Bernstein et al., 2004). In order to increase the overall accuracy, therelative B+
1 -mapping procedure was implemented in the framework of the matrix-based method proposed byBrunner et al. (Brunner and Pruessmann, 2008). To this end, from an approximately CP-mode, a FLASHimage set was obtained with 8 different phase combinations by cyclically shifting the transmit-phase by 180°on each one of the transmit-channels. The FLASH sequence parameters were: TR = 50 ms, 5-mm isotropicresolution with a 48x48x36 matrix in sagittal acquisition, and 8 simultaneous 100-µs 30V broad pulses latervalidated to yield peak FAs smaller than 6°. Subsequently, more time-consuming quantitative complex FA-maps, AFIi & AFIj , were obtained for two approximately orthogonal phase combinations contained in theset of FLASH acquisitions. Two quantitative measurements were performed rather than a single one inorder to increase the accuracy of the resulting FA-maps in regions with low SNR. For this purpose, the AFIsequence (Yarnykh, 2007), including spoiling improvements (Nehrke, 2009) and two additional echoes forDB0 mapping (Amadon and Boulant, 2008), was used with the following sequence parameters: TR1/TR2= 40/200ms, TE1/TE2/TE3 = 1/2/3ms, same acquisition matrix as for FLASH, and 8 simultaneous 900-µs60V broad pulses. From the 8 FLASH images and the 2 AFI maps, a complete set of 8 FA-maps (FAn) wasobtained in the following way:
FAn =
8<:
cFLASHn(|AFI1|+|AFI2|)|FLASH1|+|FLASH2| if n 6= 1, 2
cAFIn otherwhise
(6.1)
where FLASHn indicates acquisitions obtained with the nth phase combination in the set and c is thescaling factor between the AFIi & FLASHi excitations. The B+
1 - or equivalent FA-map for each individ-ual transmit-channel can then be retrieved by inverting the corresponding encoding matrix (Brunner andPruessmann, 2008). Typical individual B+
1 -maps obtained with our coil on a human brain at 7T are shownin Fig. 6.2b.
Validation
Substituting the tailored pulses for the square pulses in the FLASH sequence allows validation of theirperformance. To this end, the two previously acquired AFI acquisitions and their associated FLASH imagesnow allow the results to be quantified by:
FAres = cFLASHres(|AFI1|+ |AFI2|)
|FLASH1|+ |FLASH2|(6.2)
71

Chapter 6.
where FLASHres is the image obtained using the tailored excitation pulse under consideration and c is thescaling constant introduced in the B+
1 -mapping section. For comparison, both a pseudo CP-mode and astatic RF shim were considered. The pseudo CP-mode was synthesized by aligning the 8 transmit phasesin the center of the brain. The static shim was obtained with the same method as for the kT -points pulsedesign, now limited to only one sub-pulse played at the center of k-space. For each case, a suitable targetFA was selected based on the criterion that the expected peak would remain below 6°, bearing in mind thattoo low FA would result in poor SNR. Measured FA variations in the VOI were quantified by means of thestandard deviation over the mean.
Qualitive comparison
Both square pulses in a pseudo CP-mode and kT -point-based excitation pulses were inserted in a higherresolution multi-echo FLASH sequence. Sequence parameters were: target FA = 6°, TR = 50 ms, TE =4 ms and 20 ms, 2-mm isotropic resolution with a 128x128x80 matrix in sagittal acquisition. The shorterecho time yielded a mostly proton-density weighted image whereas the second echo led to a T2*-weightedimage. Receive sensitivity correction was applied during image reconstruction to provide a direct qualitativecomparison between the different excitation pulses (Wang et al., 2005).
Off-resonance & k-space location sensitivity
To investigate the sensitivity of the proposed method with respect to off-resonance effects and kT -pointplacement, a series of simulations was performed. Measured B+
1 and ∆B0 maps from subject #3 were usedto design kT -point-based excitations from both our implementation of the inverse Fourier method and agreedy-algorithm. In the latter, similar to the sequential optimal selection method proposed by Ma et al.(2010), k-space is searched to yield the next best kT -point location. To incorporate the magnitude leastsquares approach (Setsompop et al., 2008c) and pulse duration optimization, the complete pulse designprocedure was performed when evaluating each potential k-space location, finally leading to an optimizedkT -point trajectory. Subsequently, full Bloch simulations of the obtained excitation pulses were evaluatedunder different off-resonance conditions, by introducing an artificial ∆B0 offset ranging from -300 to +300Hzin 100Hz increments. In addition, some indication of the pulse bandwidth was provided by calculating thefull width at half maximum of the central lobe averaged over all transmit-channels as well as the standarddeviation.
6.3 Results
Quantitative analysis
As anticipated from earlier phantom studies (Cloos et al., 2010b), we found the low spatial frequency compo-nents to dominate k-space upon Fourier-transforming the 3D brain mask. Bloch simulations indicated that,for our setup, 5 kT -points were sufficient to achieve spatial excitation uniformity better than 10% in thehuman brain. Although the exact locations showed some variations between subjects, they were commonlycontained within a / FOV radius around the DC component (Fig. 6.3a). The associated k-space trajectories,targeting a 5°-FA everywhere in the brain, resulted in excitation pulses of less than 450-ms (Fig. 6.3b). Thesesolutions were typically found in 3 to 4 iterations of the pulse duration optimization procedure. Based onthe performance of an Intel core 2 duo 2.4-Ghz with 4-GB RAM, the complete pulse design procedure couldbe performed in roughly 30 s.
Results obtained with different excitations pulses are shown in Fig. 6.4 for subject #1. In addition to thecentral brightening effect, the pseudo CP-mode demonstrated low FA’s in the frontal lobe and cerebellum(Fig. 6.4a – 31.7% FA variation across the whole brain). As expected, the static-shim (a single kT -pointoptimized at the center of k-space) produced a significant improvement over the synthesized CP-mode (Fig.6.4b). Still, large spatial variations remain in the excitation profile (16.7% FA variation). Using 5 kT -points,good FA homogenization was achieved throughout the volume of the brain (Fig. 6.4c – 7.8% FA spread).Considering the many potential experimental inaccuracies, the measured and simulated result corresponds
72

Results
Figure 6.3: Example kT-point-based k-space trajectory, RF subpulse train and gradient blips designed forFA homogenization in the human brain at 7T. a: The trajectory used to move between the different points intransmission k-space. Spheres indicate stationary points where RF-power is applied. b: The RF amplitudesolution found for one of the 8 channels and the corresponding gradient blips along x, y and z. The differentsub-pulse durations are optimized to minimize the total duration of the excitation without exceeding themaximum allowed amplitude on transmit-channels. A long low power sub-pulse on one channel implies thatat least one of the other channels requires a high level of power.
well with the full Bloch simulation (Fig. 6.4d, – 5.5% FA spread). Still, adding two additional kT -points canprovide a further improvement at the expense of an increase in pulse duration (Table 6.1).
In addition to the homogeneity results obtained for each experiment of this study, Table 6.1 depicts thetotal energy required by the RF coil in each case, i.e. the sum of the integrals of the squared pulse voltageamplitudes (assuming 50 W load). It becomes clear that the trade-off for the improved FA distributionis an increase in total incident energy. In this case, we observe that the pseudo CP-mode requires onaverage about 2/3 of the energy required by the 5 kT -point excitation. Interestingly, although the kT -pointsdeposit significantly more energy than the RF-shim, the energy is much more evenly distributed among thetransmit-channels, as shown from the maximum total energy per channel in Table 6.1.
Qualitative comparison
The impact of the FA-homogenizing quality of the excitation strategies can clearly be seen in the proton-density-weighted 3D FLASH images (Fig. 6.5). The very low FA’s produced by the CP-mode (FA = 6°,pulse duration = 270-ms) in the cerebellum, occipital, frontal and temporal lobes are manifest by the lackof signal in these regions (Fig. 6.5a). With 5 kT -points (FA = 6°, pulse duration = 490-ms), the signal inthese areas is mostly recovered (Fig. 6.5b). Most dramatic is the improvement obtained in the cerebellum,which is now clearly visible with the same uniform excitation as throughout the rest of the brain, even inT2*-weighted images (Fig. 6.5). Yet complete FA-recovery did not occur near the brain stem region, becausethis is the most affected by the residual third-arm artifact mentioned in the B0-shimming section.
Off-resonance & k-space location sensitivity
Empirically we found that the proposed implementation of the inverse Fourier method produced adequatek-space locations for FA homogenization throughout the human brain by means of kT -point-based excitation(Table 6.1). Nonetheless, simulations indicate that more thorough methods such as a greedy algorithm can
73

Chapter 6.
Figure 6.4: Measured and simulated FA distributions in subject #1. They are displayed in central coronal,sagittal and axial brain cross-sections for three RF strategies: a: CP-mode (measured). b: Static shim(measured). c: 5 kT-points (measured). d: 5 kT-points (full Bloch simulation). The CP-mode and RF-shimwere scaled to produce an average of 5°. For each measurement, the corresponding histogram is superimposedon the color bar.
Subject 1 Subject 2 Subject 3
CP
-mode
RF-s
him
5kT
-poin
ts
7kT
-poin
ts
CP
-mode
RF-s
him
5kT
-poin
ts
7kT
-poin
ts
CP
-mode
RF-s
him
5kT
-poin
ts
7kT
-poin
ts
Pulse duration 100 100 440 570 100 100 430 540 100 100 430 630 µs
Fore-& midbrain 28.9 17.0 7.2 7.0 29.2 25.6 7.4 8.3 35.4 16.7 8.0 6.2 %
Cerebellum 47.8 13.8 11.3 10.6 53.2 38.6 16.0 18.7 60.4 19.4 15.5 11.0 %
Total Brain 31.7 16.7 7.8 7.5 31.5 26.6 8.3 9.4 35.5 17.0 8.9 6.8 %
Total energy 67.8 88.7 95.4 108 71.5 111.0 102.0 111.0 81.6 113.6 103.0 80.2 mJ
MTE channel 8.5 29.8 19.0 22.6 8.9 42.0 16.4 20.6 10.2 40.2 17.6 31.4 mJ
Table 6.1: Measured FA homogeneity and energy-balance obtained with different excitation pulse strategies.The CP-mode and RF-shim pulse amplitudes were scaled to produce an average of 5°. The spatial variationof the FA in different regions (Fore- & midbrain, Cerebellum, Total brain) of the brain is expressed as thestandard deviation as percentage of the mean. Total Energy: the total incident energy per RF excitationon all channels. MTE channel: the maximum total incident energy per pulse per channel. Considering thatthe simulation consistently predicts improved results with an increased number of k-space locations, thatthe decreased excitation fidelity obtained with 7 rather than 5 kT -points in subject 2 is most likely relateddue to subject movement between.
74

Discussion
Figure 6.5: FLASH images obtained using the pseudo CP-mode and 5 kT -points (subject #2). The receiveprofile was removed in post processing. a: Proton-density-weighted followed by T2*-weighted images fromthe CP-mode (pulse duration: 270-ms). b: Same using 5 kT -points (490-ms).
further improve the excitation uniformity (Table 6.2). However, this method produced trajectories travelingslightly further out in k-space (up to 2/FOV). Therefore, in order to accommodate the slew-rate constraints,some of the gradient blips would need to be lengthened from 40 to 60 ms. When small FA’s are targeted,this results in significantly longer excitation pulses (Table 6.2). Considering off-resonance effects, we observethat not only the mean FA decreases as may be expected from the average bandwidth, but also the FAhomogeneity achieved by the proposed method degrades with increased frequency offsets. Yet even with a±300 Hz offset, this degradation does not reach the level of FA variation obtained at resonance with thestatic RF-shim. This is especially true for kT -points found from the inverse Fourier-method as they areshorter than those found from the greedy algorithm, which therefore demonstrates their robustness againstB0-offsets. Although slightly different results are obtained depending on the sign of the frequency offset,significant deviations only appear with long excitation pulses applied to a large frequency offset.
6.4 Discussion
We have introduced a novel 3D k-space trajectory, the kT -points, towards B+1 inhomogeneity mitigation over
an extended volume. It is comprised of a minimal number of k-space locations in conjunction with non-selective sub-pulses. Implemented on an eight-channel parallel transmit-array, spatially uniform excitationwas demonstrated in the entire brain at 7 Tesla. In a previous work by Setsompop et al. (2008a), slice-selectiveFA homogenization was demonstrated in central transversal slices of the brain, with 7.5% FA variation acrossthe slice. Our results obtained in the entire brain volume showed comparable FA variations (Table 6.1). Itshould be noted that although this method provided good excitation uniformity in the brain, artifacts relatedto external effects remain. With our setup, depending on the patient position, some residual in-folding wasobserved in the cerebellum as mentioned above. This not only affected the validation procedure but also theB+
1 -maps and consequently the pulse design. Furthermore, small discrepancies between the designed andexecuted k-space trajectory may be expected as well as minor temporal variations in transmit and receivesensitivity due to patient movement. Nonetheless, good correspondence between the simulated and measuredFA distributions was observed, as shown in Fig. 6.4d.
To find the location of the kT -points, although the inverse Fourier method (Yip et al., 2006) has been shownto be sub-optimal, it provides a less computationally-demanding alternative to methods such as the sparsity-enforced algorithm (Zelinski et al., 2008d). When optimizing the FA over an extended volume, the inverseFourier method allows adequate kT -point placement in a time-scale compatible with human in-vivo studies.Nonetheless, further improvements in FA uniformity can be achieved by improved optimization of the k-space trajectory (Table 6.2). In particular excitations targeting higher FA’s could benefit from optimizedk-space trajectories as the sub-pulse durations become significantly longer than the interleaving gradient-blips. Although our implementation of the greedy algorithm required more time than appropriate for in-vivostudies, a computationally optimized implementation such as suggested by Ma et al. (2010) could possibly
75

Chapter 6.
RF-s
him
3kT-p
oin
ts
FFT
3kT-p
oin
ts
GA
5kT-p
oin
ts
FFT
5kT-p
oin
ts
GA
7kT-p
oin
ts
FFT
7kT-p
oin
ts
GA
Pulse duration 500 320 410 430 590 630 810 µs
Bandwidth 2.4±0.0 3.5±0.9 3.0±0.8 2.7±0.5 2.0±0.3 1.8±0.1 1.4±0.3 Hz
FA variation B0 4.9±17.1 4.9±8.8 4.9±7.7 4.9±6.9 5.0±6.1 4.9±6.1 5.0±5.5 º ± %
FA variation B0 +100Hz 4.8±17.1 4.9±8.8 4.9±7.7 4.9±6.9 5.0±6.6 4.8±6.5 4.9±6.1 º ± %
FA variation B0 -100Hz 4.8±17.1 4.9±8.9 4.9±7.7 4.9±7.0 4.9±6.4 5.0±6.4 4.9±6.0 º ± %
FA variation B0 +200Hz 4.8±17.1 4.9±9.2 4.8±7.8 4.8±7.0 4.9±7.4 4.7±7.7 4.7±7.8 º ± %
FA variation B0 -200Hz 4.8±17.1 4.9±9.1 4.9±7.9 4.9±7.2 4.7±7.6 4.9±7.4 4.7±8.1 º ± %
FA variation B0 +300Hz 4.7±17.1 4.8±9.8 4.7±8.0 4.7±7.3 4.8±8.8 4.4±9.8 4.3±11.0 º ± %
FA variation B0 -300Hz 4.7±17.1 4.8±9.6 4.9±8.0 4.7±7.6 4.5±9.6 4.7±8.6 4.3±12.3 º ± %
Table 6.2: Simulated results obtained with different excitation pulses targeting an average FA of 5°. Thereported bandwidth (Mean±SD) is estimated from the full width at half maximum of the Fourier transformof the excitation pulses played on all 8 channels. Excitation pulses designed for the measured B0-map wereevaluated (mean FA° ± FA variation %) in the presence of an additional B0-offset.
mitigate this problem. Considering parallel transmission, additional improvements in excitation uniformityor pulse duration could possibly be obtained by inclusion of coil elements segmented along the magnet mainaxis, as in our setup, the azimuthal segmentation of the coil could a priori only provide a reduction of thenumber of kT -points in the transverse direction. Furthermore, such tri-directional coil segmentations wouldpotentially allow FA homogenization over volumes larger than the brain like the thighs, pelvis or abdomen.
In this work, kT -points were implemented as a set of discrete sub-pulses interleaved with 40-ms gradient blips.We also investigated on the side whether pulsing RF continuously while covering the same trajectory withoutstopping at the kT -points could yield some gain in pulse duration or energy. Simulations indicated thatcontinuous RF solutions could indeed provide even shorter pulse durations, but with higher energy demand.Depending on the k-space trajectory and the pace at which it is followed, increased power deposition canoccur, especially when the velocity at which the kT -point is transected is not slow enough with respectto the energy deposition required in its vicinity (Lee et al., 2009). Furthermore, even without trajectoryoptimization, the increased number of time points involved along the trajectory prolongs the pulse designprocedure by over 5 min. Interestingly, although these solutions provide increased degrees of freedom, onlyminor improvements in FA homogeneity were found. Possibly, this could be related to the close proximityof the k-space locations. Therefore, if the pulse duration at the end of Fig.6.1’s algorithm is found to besufficiently short for the application under study, a further decrease in pulse duration at the expense of anincrease in power and SAR seems unfavorable. On the other hand, the slew-rate required to execute thesecontinuous excitations can be less demanding and could benefit systems with lower gradient specifications.
By comparing the energy deposited by different excitation pulses, we saw from Table 6.1 that the trade-offfor an improved FA distribution is an increase in energy deposition. In particular, the maximum total energyper channel shows a significant increase for the RF-shim, while the CP-mode and kT -point-based excitationsdistribute the energy more evenly over the available coil elements. Based on the pulses demonstrated,the kT -point method requires roughly 6 times the total energy used by the CP-mode. Although this is asubstantial difference, for many applications, this energy increase seems manageable. Simulations indicatedthat, a 5° FA obtained with a 5 ms BIR4 adiabatic pulse (Bernstein et al., 2004) requires several hundredtimes more energy even when the coil was driven in RF-shim configuration. Moreover, even strongly-modulating pulses (Boulant et al., 2008), 3.9 ms duration targeting the same FA and error, needed over50 times more energy than required by the kT -points based excitations. Although these differences mightbe less severe when targeting high FA’s, the proposed method clearly excels at small angles, thus makingthem ideally suited for small excitations in fast sequences. For example in the MP-RAGE sequence, wheretypical conventional excitation pulses in the turbo-FLASH echo train are typically 100-ms in duration (12.0kHz bandwidth), replacing these with 440-ms kT -point excitations (2.7 kHz bandwidth) will only increasethe total RF deposition by approximately a factor 3/2 (Table 6.1). Furthermore, it is important to note
76

Conclusions
that an increase in total energy deposition does not necessarily imply a similar increase in local SAR. Dueto the increased number of degrees of freedom available in Transmit-Sense, the energy can be distributedmore evenly over the volume, potentially reducing the local SAR. This is suggested by the results of Table6.1 which show large differences in the maximum total energy per channel. In our RF coil configuration,where the transmit elements are fairly close to the head, this points to a somewhat better management ofthe local SAR with kT -points compared to the static RF shim. Moreover, various optimization methodshave been proposed to facilitate local SAR minimization (Cloos et al., 2010c; Lee et al., 2010; Brunner andPruessmann, 2010). Under current conditions, where the average RF power per transmit-path is monitored,channel-dependent Tikhonov parameters (Cloos et al., 2010c) could readily be implemented to improve theminimum TR and/or maximum FA. Another important factor that should be taken into consideration isthe region of interest. Here the comparison was performed considering the entire brain. However, someregions in the brain would require a significant increase in power to obtain the same FA by simply using theCP-mode. In these areas, kT -point excitations could outperform the CP-mode even in terms of total energydeposition. Although the small tip angle approximation was assumed in the work reported here, kT -pointscan allow to design large tip angles by using extensions such as the additive method (Grissom et al., 2008)or optimal control theory (Xu et al., 2008). With the former method, our simulations show that RF pulsescan be found with angles up to at least 90° yielding good FA-homogeneity (less then 9.0%) performance inthe brain. Additional work is being pursued to reach equivalent homogeneity with 180° pulses. However,the increased power requirements preclude high-FA in-vivo validation with our current setup because ourconservative power thresholds would be exceeded. In the future, we plan to use a different approach toevaluate the SAR, which includes real-time amplitude and phase monitoring on every transmit-channel(Gagoski et al., 2009). This, coupled to future improvements of our coil design, should allow us to raise ourpower thresholds substantially, which will then open up the possibility to demonstrate high-FA kT -pointsin-vivo. Then, virtually all non-selective 3D sequences could benefit from the kT -points. This includes notonly GRE-based sequences like the MP-RAGE sequence (Bernstein et al., 2004), but also Turbo-Spin-Echo-type sequences with variable FA refocusing pulses like the SPACE sequence (Busse et al., 2006). This is thesubject of future work.
In this study, kT -point-based excitation pulses have been demonstrated in the framework of parallel trans-mission. In principle, the presented method could also be implemented on a conventional single channeltransmit MRI system, provided that the excitation coil produces sufficient B+
1 throughout the ROI. Simula-tions assuming a synthesized single channel system constructed from the RF shim of our transmit-array coilcould indeed homogenize the FA throughout the brain. To obtain such results, we found from the inverse-Fourier method that 30 distinct k-space locations were necessary to reduce the corresponding FA variationto approximately 10%. Presumably, in this case, the sparsity-enforced method could provide a more man-ageable solution by optimizing the visited k-space locations (Zelinski et al., 2008d; Ma et al., 2010). Still,significantly longer excitation pulses should be expected when implementing kT -points on a single channelat high field.
6.5 Conclusions
Spatially uniform excitation throughout the volume of the human brain by means of Transmit-SENSE hasbeen demonstrated in 3 volunteers at 7 Tesla, through the use of an original minimalist k-space cover-age, the kT -points. This limited number of k-space locations where RF energy is deposited to counteractB+
1 -inhomogeneities leads to short non-selective excitation pulses with good FA uniformity over extendedvolumes. Thus a whole range of 3D sequences with short TR can be targeted for applications at high fields,with less SAR limitations than energy-consuming pulses like standard adiabatic or strongly-modulatingpulses on single channel systems.
77

Chapter 6.
78

7 Non-Selective Excitations with an Arbitrary Flip-Angle 7
This chapter contains methods & principles that were accepted for publication asabstracts in the proceedings of the Annual Annual Meeting of the InternationalSociety for Magnetic Resonance in Medicine 2012.
M.A. Cloos, N. Boulant, M. Luong, G. Ferrand, E. Giacomini, M-F. Hang, C.J.Wiggins, D. Le Bihan, and A. Amadon. (2012) “kT -points-based Inversion PulseDesign For Transmit-sense Enabled MP-RAGE Brain Imaging At 7T.”

Chapter 7.
7.1 Introduction
Since the introduction of Transmit-SENSE (Katscher et al., 2003; Zhu, 2004), various methods have beenproposed to design dedicated pTx-enabled RF-waveforms (Katscher et al., 2003; Zhu, 2004; Grissom et al.,2006; Xu et al., 2007; Setsompop et al., 2008b; Grissom et al., 2008; Xu et al., 2008; Grissom et al., 2009).Initially, most of these approaches were limited to the small-tip-angle (STA) regime, where the transversemagnetization upholds an approximately linear relation with the excitation field (Pauly and Nishimura,1989). Beyond this domain, i.e. targeting a FA exceeding 30, the non-linear behavior of the Blochequations must be considered to achieve a high excitation fidelity. Nonetheless, a careful analysis of thisnon-linear system revealed that under certain conditions, the STA approximation may also yield viable large-tip-angle (LTA) results (Pauly et al., 1989). In a similar fashion, large FA excitations may also be designedin the framework of pTx (Xu et al., 2007).
Although the pTx-approach allows excellent STA excitation fidelity in conjunction with under-sampled ex-citation k-space trajectories (Grissom et al., 2006; Setsompop et al., 2006), adhering to constraints imposedby the linear class of LTAs significantly impairs its potential to reach the desired result with a short RFexposure (Xu et al., 2007). Therefore, optimization techniques have been proposed to mitigate excitationdefects that arise due the non-linear behavior of the Bloch equations. Although not ensuring a global op-timum, LTA excitations designed via optimal control methods have been demonstrated to provide robustresults (Xu et al., 2008; Grissom et al., 2009).
So far, the sparse non-selective uniform excitations introduced in the previous chapter have only beendemonstrated in the STA domain. In this chapter, the methods relevant to the design of kT -point excitationstargeting an arbitrary FA are detailed. Although some of these principles could also be considered forapplications such as spin-echo pulse design, the focus of this chapter lays on inversion pulses. To this end,a series of Bloch simulations will be considered based on the B+
1 and B0 profiles measured in 6 differenthuman brains at 7 Tesla. Thus allowing the different design parameters to be explored without the need fortime consuming pulse validation experiments. All the data, perquisite for this study, was acquired conformthe methods described in the previous chapter.
This chapter is structured as follows, firstly, to aid the LTA pulse design, an observation on the STAapproximation is brought forward which broadens the STA scope. Subsequently, the optimal control approach(OCA) introduced by Xu et al. (2008) is recast into the form of a magnitude-least-squares optimizationproblem constrained by the hardware limitations. The performance of this method, hereafter referred to asthe magnitude optimal control approach (MOCA), is then compared to the original implementation proposedby Xu et al. (2008). Subsequently, the joint k-space design method (Grissom and Pauly, 2010) is introducedto adjust kT -point locations, and integrated into MOCA. Finally, several considerations specific to in-vivoapplications are illustrated and discussed.
7.2 Limitations of the (Extended) Small Tip Angle Approximation
Methods
The STA approximation (Pauly and Nishimura, 1989) assumes that the longitudinal magnetization remainsconstant during the RF pulse (Section 2.1). Albeit not an exact representation of the physics involved,this simplification can be applied to small FA excitations. In this domain, the transverse magnetizationdemonstrates an approximately linear dependence on the applied excitation field. Therefore, excitationspulses based on the STA approximation generally perform well when targeting a FA up to 30. Outsideof the STA domain, the magnetization no longer upholds a linear relation, and variation of the longitudinalmagnetization can no longer be neglected (Fig. 7.1). Consequently, when designing LTA pulses based onthe STA approximation, sub-optimal levels of excitation fidelity are obtained.
The following observation leads to a simple trick aiding the design of LTA RF-pulses. Supposing a FA of 90
is desired, the STA approximation suggests that the normalized transverse magnetization of MT = M0 = 1should be targeted. However, due to the non-linear dynamics in the Bloch equations, a FA of 1 rad ( 57)will be obtained (Fig. 7.1, brown). Extrapolation based on this observation indicates that a “virtualtransverse magnetization” of /2 should be targeted instead (Fig. 7.1, green). In general, it turns out
80

The Optimal Control Approach
Figure 7.1: The normalized transverse magneti-zation (MT ) as a function of the flip-angle (FA).
Figure 7.2: Symmetrically distributed 13-kT -points k-space trajectory.
that substituting the transverse magnetization with the FA (in radians) in the Bloch equation yields anappreciably better excitation fidelity when targeting LTA based on the STA assumptions. This was recentlyderived more rigorously by Boulant and Hoult (2012).
Based on this extended STA method, 13-kT -point-based excitations were designed targeting 5, 90, and180 FA’s1. To this end, a symmetric excitation k-space trajectory was adopted (Fig. 7.2), approximatingone of the design constraints of the linear-class LTA approach (Pauly et al., 1989). Based on the B+
1 andB0 maps measured in-vivo, the obtainable normalized root mean square error (NRMSE) was evaluated. Tothis end, the FAs obtained throughout the brain were simulated as a function of the Tikhonov regularizationparameter λ introduced in section 5.2.
Results and Discussion
When targeting a 5 FA, the characteristic shape of the L-curve is revealed (Fig. 7.3a & b). By selecting asuitable Tikhonov parameter at the L-corner, a good compromise between excitation fidelity and RF-poweris obtained (Fig. 7.3c). Regarding 90-excitations, the proposed method still allows high quality solutionsto be found (Fig. 7.3d). However, in order to assure a near optimal NRMSE, the Tikhonov parameter mustto be evaluated more carefully (Fig. 7.3a & b). When targeting an 180-inversion pulse, on the other hand,the corresponding L-curve only shows a shallow minimum with relatively poor performance (Fig. 7.3e).
7.3 The Optimal Control Approach
Although the OCA has been shown to be a robust LTA pulse design tool, the implementations published upuntil now are subject to sub-optimal constrain (Xu et al., 2008; Grissom et al., 2009). In particular, bothdemonstrations enforce a pre-defined target phase distribution, while in most cases, the quantity of interestis limited to the magnitude of the magnetization (Katscher et al., 2007; Setsompop et al., 2008c). Moreover,neither method takes the peak RF-power limitations into account.
Optimal Control Theory applied to MR pulse design
As proposed by Xu et al. (2008), in the rotating frame of reference, the Bloch equation without relaxationterms can be written as:
d
dtM(r, t)=γ
0@
0 G(t) · r+∆B0(r) −B+1,y(r, t)
−G(t) · r−∆B0(r) 0 B+1,x(r, t)
B+1,y(r, t) −B+
1,x(r, t) 0
1AM(r, t), (7.1)
114 sub-pulses, but 13 kT -points (starting and ending at k = 0, 0, 0).
81
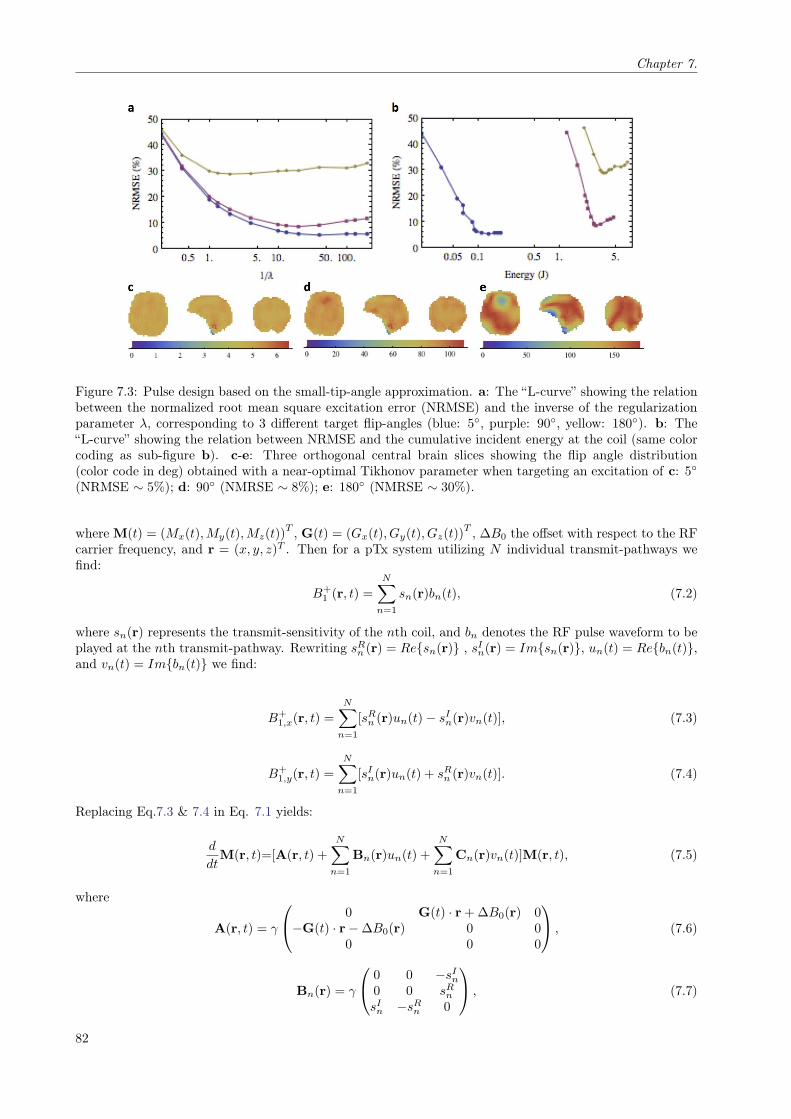
Chapter 7.
Figure 7.3: Pulse design based on the small-tip-angle approximation. a: The “L-curve” showing the relationbetween the normalized root mean square excitation error (NRMSE) and the inverse of the regularizationparameter λ, corresponding to 3 different target flip-angles (blue: 5, purple: 90, yellow: 180). b: The“L-curve” showing the relation between NRMSE and the cumulative incident energy at the coil (same colorcoding as sub-figure b). c-e: Three orthogonal central brain slices showing the flip angle distribution(color code in deg) obtained with a near-optimal Tikhonov parameter when targeting an excitation of c: 5
(NRMSE 5%); d: 90 (NMRSE 8%); e: 180 (NMRSE 30%).
where M(t) = (Mx(t),My(t),Mz(t))T , G(t) = (Gx(t), Gy(t), Gz(t))
T , ∆B0 the offset with respect to the RFcarrier frequency, and r = (x, y, z)T . Then for a pTx system utilizing N individual transmit-pathways wefind:
B+1 (r, t) =
NX
n=1
sn(r)bn(t), (7.2)
where sn(r) represents the transmit-sensitivity of the nth coil, and bn denotes the RF pulse waveform to beplayed at the nth transmit-pathway. Rewriting sRn (r) = Resn(r) , sIn(r) = Imsn(r), un(t) = Rebn(t),and vn(t) = Imbn(t) we find:
B+1,x(r, t) =
NX
n=1
[sRn (r)un(t)− sIn(r)vn(t)], (7.3)
B+1,y(r, t) =
NX
n=1
[sIn(r)un(t) + sRn (r)vn(t)]. (7.4)
Replacing Eq.7.3 & 7.4 in Eq. 7.1 yields:
d
dtM(r, t)=[A(r, t) +
NX
n=1
Bn(r)un(t) +
NX
n=1
Cn(r)vn(t)]M(r, t), (7.5)
where
A(r, t) = γ
0@
0 G(t) · r+∆B0(r) 0−G(t) · r−∆B0(r) 0 0
0 0 0
1A , (7.6)
Bn(r) = γ
0@
0 0 −sIn0 0 sRnsIn −sRn 0
1A , (7.7)
82

The Optimal Control Approach
and
Cn(r) = γ
0@
0 0 −sRn0 0 −sInsRn sIn 0
1A . (7.8)
Concatenating vectors and matrices in Eq. 7.5 along different r gives:
d
dtM(t)=[A(t) +
NX
n=1
Bnun(t) +
NX
n=1
Cnvn(t)]M(t), (7.9)
whereM(t) = [MT (r1, t),M
T (r2, t), · · · ,MT (rp, t)]T , (7.10)
A(t) = diagA(r1, t),A(r2, t), · · · ,A(rp, t)], (7.11)
Bn = diagBn(r1),Bn(r2), · · · ,Bn(rp)], (7.12)
andCn = diagCn(r1),Cn(r2), · · · ,Cn(rp)], (7.13)
with p equal to the number of voxels in the space.
Analogous to the “minimum-distance” formulation proposed by (Conolly et al., 1986), we minimize a costfunctional J over all possible controls:
min[un(t),vn(t)]Nn=1
J [u1(t), · · ·uN (t), v1(t), · · · , vN (t)] =
ϕ(M(T )) +´ T
0F (u1(t), · · ·uN (t), v1(t), · · · , vN (t))dt,
(7.14)
subject to the Bloch equation (Eq. 7.9). In 7.14, ϕ(M(T )) is a weighted l2 norm representing the deviationof the final state M(T ) from the desired magnetization D via the metric:
ϕ(M(T )) = (M(T )−D)TW ([M(T )−D]) , (7.15)
where W is a diagonal matrix containing the weights for different spatial locations to emphasize regions ofinterest (e.g. binary weights to exclude the regions outside the object, and/or heuristically-chosen fractionalweights for different regions-of-interest), and F (u1(t), · · ·uN (t), v1(t), · · · , vN (t)) is a penalty function on RFpower:
F (u1(t), · · ·uN (t), v1(t), · · · , vN (t)) =1
2α
"NX
n=1
u2l (t) +
NX
n=1
v2n(t)
#, (7.16)
where α is a relative weighting parameter to balance the two terms in Eq. 7.14.
Adopting Lagrange multipliers λ(t), Eq. 7.14 can be recast in the from of an unconstrained problem:
min[un(t),vn(t)]Nn=1
J [u1(t), · · ·uN (t), v1(t), · · · , vN (t)] =
ϕ(M(T )) +´ T
0H(M(t),λ(t), u1(t), · · ·uN (t), v1(t), · · · , vN (t))dt,
(7.17)
where the Hamiltonian in the integral is:
H(M(t),λ(t), u1(t), · · ·uN (t), v1(t), · · · , vN (t)) = F (u1(t), · · ·uN (t), v1(t), · · · , vN (t))
+λ(t)[A(t) +
PNn=1 Bnun(t) +
PNn=1 Cnvn(t)]M(t)− d
dtM(t).
(7.18)
Solutions of the corresponding two-point boundary-value problem, which does not have a closed-form solution(Bryson and Ho, 1975), can numerically be approximated using a first-order gradient algorithm (Xu et al.,2008):
Step 1 Initialize u0n(t) and v0n(t), n = 1, 2, · · · , N , based on the STA aproximation (Pauly and Nishimura,
1989; Grissom et al., 2006).
Step 2 Given M (0), integrate Eq. 7.9 forward to obtain M0(t), for all 0 t T .
83

Chapter 7.
Step 3 Evaluate λ(T ) = W (M(T )−D). Integrate Eq. 7.9 backwards, substituting M(t) with λ(t) toobtain λ
k(t), corresponding to the kth iteration for all 0 t T .
Step 4 Update un(t) and vn(t) for n = 1, 2, · · · , N :
uk+1n (t) = uk
n(t)− µ[(λk)T (t)BnMk(t) + ↵uk
n(t)], (7.19)
, vk+1n (t) = vkn(t)− µ[(λk)T (t)CnM
k(t) + ↵vkn(t)], (7.20)
where µ is the step size.
Step 5 Given M (0), integrate Eq. 7.9 forward to obtain Mk+1(t), for all 0 t T .
Step 6 • If (Mk+1(T ) −D)TW(Mk+1(T )−D
)is smaller than a given error toler-
ance ", the algorithm is stopped (the waveforms ukn & vkn, n = 1, 2, · · · , N ,
have satisfactory performance).
• Else if (Mk(T ) − D)TW(Mk(T )−D
)is smaller than (Mk+1(T ) −
D)TW(Mk+1(T )−D
), then half the step size µ and return to Step 4.
• Else if 4 consecutively correct updates have been performed, double the stepsize µ, increase k by one and continue to the next iteration (Step 3).
• Else, increase k by one and continue to the next iteration (Step 3).
7.4 Adaptation to kT -points (with initial magnetization Mz = M0)
To enhance the performance of arbitrary-FA pulses in the framework of the kT -points method, several smallmodifications were made to the original optimal control implementation. Considering the non-selectivenature of the kT -points strategy, regions outside the volume of interest (ROI) can be excluded from theoptimization process. Thus instead of nulling their relative weights in the diagonal matrix W, all points r
not in the ROI may be dropped from Eq. 7.15. In practice, when selecting a 3D brain mask from initialmeasurements, this dramatically reduces both the computational load and memory requirements for theoptimization procedure. Furthermore, additional constraints are applied to the OCA procedure detailed-above: the voltage amplitude of each channel bn(t) is constrained to stay below a threshold set by the RFamplifier limitations (Step 5 below). In-addition, the RF is nulled between the kT -points, i.e. during thegradient blips (Step 6 below).
Instead of solving ul(t) and vl(t) to find a specific (M(T )−D)T (M(T )−D) < ", the following Mz magnitude-only criterion is targeted:
(Mz(T )−Dz)T (Mz(T )−Dz) < ", (7.21)
and neglecting the phase contribution in the second boundary value:
λz(T ) = (Mz(T )−Dz) & λx(T ) = λy(T ) 0 , (7.22)
where the subscript z indicates the longitudinal magnetization and x,y correspond to the transverse compo-nents2. Solutions of the corresponding magnitude only two-point boundary-value problem, can numericallybe approximated using the following implementation of the first-order gradient algorithm.
Step 1 Initialize u0n(t) and v0n(t), n = 1, 2, · · · , N , based on the STA aproximation (Pauly and Nishimura,
1989; Grissom et al., 2006).
Step 2 Given M (0), integrate Eq. 7.9 forward to obtain M0(t), for all 0 t T .
Step 3 Evaluate λz(T ) =(Mk
z(T )−Dz
)and set all transversal components of λ(T ) equal to 0. Integrate
Eq. 7.9 backwards, substituting M(t) with λ(t) to obtain λk(t), corresponding to the kth iteration for
all 0 t T .
2Alternativly, a constraint on the spatial phase variation can be enforced by replacing the previous target phase with asmoothed version of the obtained phase profile.
84

Adaptation to kT -points (with initial magnetization Mz = M0)
Step 4 Update un(t) and vn(t) for n = 1, 2, · · · , N :
uk+1n (t) = uk
n(t)− µ[(λk)T (t)BnMk(t) + ↵uk
n(t)], (7.23)
vk+1n (t) = vkn(t)− µ[(λk)T (t)CnM
k(t) + ↵vkn(t)], (7.24)
where µ is the step size.
Step 5 Ifq(
uk+1n (t)
)2+(vk+1n (t)
)2> δ at any given 0 t T :
uk+1n (t) = δ
uk+1n (t)
q
(uk+1n (t))
2+(vk+1
n (t))2,
vk+1n (t) = δ
vk+1n (t)
q
(uk+1n (t))
2+(vk+1
n (t))2,
(7.25)
where δ corresponds to the maximum amplitude allowed by the system (or user).
Step 6 If G(t)TG(t) > 0 at any given 0 t T :
uk+1n (t) = 0,
vk+1n (t) = 0,
(7.26)
thus ensuring that no RF is played during the gradient blips (Although this is not essential for theRF-pulse design at this stage, it will be beneficial when considering k-space optimization techniquesoriginally designed for the spokes trajectory (Saekho et al., 2006).
Step 7 Given M (0), integrate Eq. (7.9) forward to obtain Mk+1(t), for all 0 t T .
Step 8 • If(Mk+1
z (T )−Dz
)T(Mk+1
z (T )−Dz
)is smaller than a given error toler-
ance ", the algorithm is stopped (the waveforms ukn & vkn, n = 1, 2, · · · , N ,
have satisfactory performance).
• Else if(Mk
z(T )−Dz
)T(Mk
z(T )−Dz
)is smaller than(
Mk+1z (T )−Dz
)T(Mk+1
z (T )−Dz
), then half the step size µ and
return to Step 4.
• Else if 4 consecutively correct updates have been performed, double the stepsize µ, increase k by one, and continue to the next iteration (Step 3).
• Else, increase k by one and continue to the next iteration (Step 3).
Methods
Both OCA and MOCA were adopted to optimize initial candidate 90-excitations and 180-inversion pulsesbased on the STA approximation, as described in the previous section. To this end, the spatial domainmethod was adopted (Grissom et al., 2006) including the variable exchange method to relax the phaseconstraints (Setsompop et al., 2008c). It should be pointed out that the performance of this method dependsheavily on the initial target phase. We found, as suggested by Kerr et al. (2007), that adopting the phasedistribution corresponding to the CP-mode as an initial target yielded good results. Furthermore, becauseit is likely that the LTA optimized pulses will require additional power, the STA pulse design is constrainedto 50% of the available peak power (Cloos et al., 2012).
In contrast to 180-refocusing pulses, the component of interest for inversion pulses is the longitudinal mag-netization only. Therefore, the normalized root mean square inversion error (NRMSIE)3 will be adopted toquantify the performance of the inversion pulses, whereas 90-excitations will be quantified by the normalizedroot mean square excitation error (NRMSEE):
NRMSEE = 1pp
qPr(Mz(r))
2,
NRMSIE = 1pp
qPr(Mz(r) + 1)
2,
(7.27)
3The NRMSIE varies between 0 and 2, i.e., without applying RF a NRMSIE 200% is obtained.
85

Chapter 7.
Figure 7.4: Comparison of the different optimal control implementations: OCA (purple), MOCA (blue).Results shown, correspond to the averaged results based on the calibration measurements performed on 6different volunteers scanned at 7-Tesla. a: The evolution of the NRMSEE when targeting a 90-excitation. b:The evolution of the normalized root mean square inversion error (NRMSIE) when targeting a 180-inversion.c-d: The evolution of the cumulative incident energy at the coil, corresponding to the optimization illustratedin subfigure a-b.
with r designating a voxel location in the brain and p their number.
Because dipolar coupling among spins is ignored, the Bloch equations corresponding to each voxel in theROI may be evaluated in parallel without introducing inter-thread latency issues. Consequently, most stepsin the OCA and MOCA algorithm can be performed in parallel on a multi-core Graphic Processing Unit(GPU). Considering the numerical accuracy of this implementation, the waveforms were discretized with a1µs time-step to assure reliable results.
Results & Discussion
The initial 90-excitation candidates, based on the STA approximation, already demonstrate an acceptablelevel of performance. Nonetheless, both optimal-control-based solutions provide substantial improvements inexcitation uniformity (Fig. 7.4a). Although the MOCA outperforms the original implementation suggestedby Xu et al. (2008), either method could be used to obtain kT -point-based tailored excitations of excellentquality, depositing similar levels of energy (Fig. 7.4c).
Considering 180-inversion pulses, the phase constraint imposed in the OCA limits the obtainable excitationfidelity to a suboptimal 30% NRMSIE (Fig. 7.4b). It should be pointed out that the performance ofthe original OCA depends heavily on the initial target phase. Clearly the final target phase produced bythe variable exchange method in the STA approximation (Setsompop et al., 2008c) is far from optimalwhen approaching 180. Unfortunately, obtaining the optimal target phase corresponding to the desiredLTA solution constitutes a non-trivial problem. However, neglecting the phase contribution, as proposedin MOCA, effectively extends the principle of the MLS approach into to inversion pulses. Nonetheless, theperformance of these methods still depends on the initial “candidate” solution, which is then iterativelyoptimized. Therefore, alternative initial solutions could potentially better approach the global optimal.
Starting from the same STA-based candidate RF waveform, the MOCA outperforms the original implemen-tation suggested by Xu et al. (2008). Although a near-perfect inversion fidelity is reached (5% NRMSIE), thefinal MOCA-based 180-inversion pulse requires nearly 3 times the energy required for a high-fidelity 90-
86

Joint k-space optimization
Figure 7.5: Comparison of the RF waveform targeting 180° before (STA) and after optimization (OCA &MOCA). The normalized amplitude (corresponding to a peak amplitude of 180V per channel) is depicted inblue, whereas the relative phase is superimposed in green.
excitation (Fig. 7.4c&d). To ensure that these solutions remain compatible with the hardware limitations,the cut-off filter implemented in step 5 of the MOCA is essential (Fig. 7.5).
7.5 Joint k-space optimization
Theory
Inspired by (Grissom and Pauly, 2010) the joint k-space optimization routine was incorporated into MOCAas an additional improvement towards a higher FA-fidelity to energy-cost ratio. Although, in the STAdomain, square sub-pulses generally provide sufficient degrees of freedom to obtain good excitation fidelity(Fig. 7.6a), the sub-pulses obtained after optimal control can be of arbitrary shape (Fig. 7.6b).
Considering MOCA as detailed earlier, Step 6 ensures that no RF is played during the gradient blips. Thusneglecting the relatively small ∆B0 effects during the short gradient blips4, a general operator A(gk
i ) canbe constructed:
A(gkj ) =
ΓY
i=t2j+1
0@ID+ γ
0@
0 gkj (ti) · r 0
−gkj (ti) · r 0 00 0 0
1A∆t
1A , (7.28)
where ID is the identity matrix, ∆t corresponds to the duration of a single the time-step, g is a vectorcorresponding to the k-space segment from one kT -point location to the next, and Γ = (t2j+2 − t2j+1) /∆tsuch that the evolution of the magnetization vector during the gradient blips is described by:
4In general, this assumption is not necessary. Considering the short gradient blip durations, the phase variation inducedby ∆B0 effects may be expected to remain well below 5. Therefore, their contribution was neglected in favor of a simplifiedimplementation.
87

Chapter 7.
Figure 7.6: Simplified illustration showing kT -points-based excitations during different stages of the jointk-space optimization procedure. a: Exemplary initial candidate RF waveform based on the small-tip-angleapproximation. b: The RF waveform after the kth optimization iteration.
M(t2i+2)=A(gki )M(t2i+1). (7.29)
Although A(gki ) does not constitute a proper rotation matrix, the approximations is adequate provided that
the time-step ∆t and gradient amplitude∥∥gk
j
∥∥ are sufficiently small. Similarly, if the RF waveforms areknown, an operator RFk
j can be constructed for every sub-pulse j such that:
RFkj =
ΓY
i=t2j
ID+A (t)∆t+∆t
NX
n=1
Bnukn(t) + ∆t
NX
n=1
Cnvkn(t)
!, (7.30)
where Γ = (t2j+1 − t2j) /∆t for each of the j sub-pulses such that:
M(t2i+1)=RFkiM(t2i). (7.31)
Again, this approximation requires a sufficiently small time-step to assure numerical stability. On the otherhand, the advantage is that the operators RFk
j have already been constructed during step 7 of the MOCAalgorithm. Therefore, given a RF-waveform the performance of different kT - point locations can efficientlybe explored by varying gk
i and concatenating the operators for each of the L sub-pulses as follows :
M(T ) =
"L−1Y
i=0
A(gki )RFk
2i
#M(0). (7.32)
The joint design is then inserted after Step 8 before returning to Step 3 for the next iteration. Encouragedby earlier results (Boulant et al., 2008), the simplex method (Nelder and Mead, 1965) was adopted to searchfor possible improvements in the k-space trajectory. To this end, an initial step size 1/FOV was adopted afterwhich the algorithm was allowed to freely evolve. Note that although this does not take ∆B0 in to account,the next iteration of Step 7 will. Furthermore, this approach does not consider the energy deposition, as ithas no direct influence on the RF-waveforms. Although at each step the improvements provided require noadditional energy, the final RF-solution obtained may not be the most energy efficient.
Methods
First the norm of M was investigated after evaluating Eq. 7.32 to ensure that the time-step considered issufficiently small to allow the gradient and RF induced rotations to be approximated by Eq. 7.28 and 7.30,
88

Joint k-space optimization
Figure 7.7: Different initial (green) and optimized (red) k-space trajectories evaluated in this work. Resultsshown correspond to a single subject. a: Symmetric 7-kT -point-based trajectory. b: Symmetric 13-kT -point-based k-space trajectory. c: Symmetric 19-kT -point-based k-space trajectory. d: STA-optimized k-spacetrajectory consisting of 7 different kT -point locations.
respectively. Based on these initial trails a 1/30µs time step was adopted, i.e., 30 sub-steps per sample pointin the RF waveform5.
To evaluate the impact of the joint k-space optimization, 180º-inversion pulses were based on four differentinitial kT -point trajectories. The first three (Fig. 7.7a-c) are symmetric patterns, loosely approximating thedesign constraints suggested in the linear-class of LTA pulses (Pauly et al., 1989), where the initial kT -pointlocations are on the kx, ky, kz axes, 1/FOV away from one-another, adding one more layer at a time. Thefourth trajectory (Fig. 7.7d) is a STA optimized design based on a greedy algorithm (Ma et al., 2010).Simulated results, obtained from MOCA with or without a simplex-based joint k-space optimization (Nelderand Mead, 1965; Grissom and Pauly, 2010), were evaluated based on B+
1 and B0 profiles measured in a totalof 6 different subjects.
Results & Discussion
All k-space trajectories considered in this evaluation allow inversion pulses to be found with a NRMSIE of lessthan 8% (Fig. 7.8). Nonetheless, adopting our implementation of the joint k-space design generally results ina slightly better inversion fidelity. Advantages in energy deposition, on the other hand, only become apparentwhen considering large numbers of k-space locations (Fig. 7.8c). Considering that the results shown in Fig.7.8 start after the first complete iteration of the MOCA algorithm, the initial energy and NRMSIE reductionsuggest that these initial trajectories are less optimal. Inaddition, adding more k-space locations tends tolengthen the overal pulse duration. Consequently the off resonance effects become even more challenging,thus mitigating the advantage of the additional degrees of freedom. In general, the initial gradient waveformappears to be of greater significance than the added degrees of freedom provided by our implementation ofthe joint design method. Moreover, optimization of the k-space trajectory based on the STA approximationdoes not seem to improve the overall performance. Therefore, these results illustrate the need for a moredirect method to design optimized k-space trajectories when targeting LTA excitations. Nonetheless, in theabsence of such a method, with our current setup, the presented 13 kT -point-based design can be adoptedto provide high fidelity inversion pulses.
Conclusions
The joint-design method provides some additional robustness by allowing the initial k-space trajectory toevolve to a more suitable one. However, our current implementation quickly converges to a local optimum,thus providing only minimal improvements. More elaborate search methods, such as originally proposed byGrissom and Pauly (2010), could perhaps yield better results. Nonetheless, the problem originates from theapplication of the STA approximation in the initial design stage. Consequently, to obtain truly optimizedRF-wavefrorms, a more direct LTA design method is needed.
5The same internal time-step as used in the forward and backwards integration steps of the OCA and MOCA
89

Chapter 7.
Figure 7.8: Comparison of the optimal control implementations: MOCA (blue), MOCA + joint k-spaceoptimization (purple). Results correspond to the k-space trajectories illustrated in Figure 7.7. Top row:evolution of the NRMSIE when targeting a 180-inversion. To aid comparison between subfigures, the 8%NRMSIE line is indicated in green, whereas the 5% NRMSIE line is marked in brown. Bottom row: evolutionof the cumulative energy deposition when targeting a 180-inversion. To aid comparison between subfigures,the 8 J mark is indicated with a brown line.
Figure 7.9: Effective bandwidth of a 6-ms 13-kT -point-based inversion pulse. Top: Three orthogonal slicesthrough the brain showing the measured B0-field. Bottom row: Effect of a single inversion-pulse based onthe perturbed B0-maps. From left to right: the simulated excitation fidelity from the measured B0-map, thesame assuming a 25Hz offset on top of the measured B0-map, the same with double the frequency offset.
7.6 LTA pulse design: B+1 versus B0
In the previous sections, it was demonstrated how the B+1 inhomogeneities can be mitigated considering an
arbitrary target FA. However, potential inaccuracies in the calibration measurements were not considered.Apart from systematic errors in the B+
1 -estimation method (Pohmann, 2011), the biased demarcation of theregion of interest and partial volume effects at the edges of the brain-mask also affect the final excitationfidelity.
Although STA excitations are also influenced by the aforementioned error sources, the short pulse durationsallow for a sufficiently large bandwidth to moderated the impact of minor deviations from the measured B0
field. Therefore, minor edge defects in the ROI, where generally the strongest B0 variations occur, bear littleimpact on the final excitation fidelity.
Due to the SAR constraints and limited peak RF-power permissible on the amplifiers LTA excitations requiremuch longer pulse durations. Consequently, the effective pulse bandwidth is substantially reduced. In thecontext of inversion pulses, the bandwidth may even become comparable to the spatial variations in theB0 field (Fig 7.9). Therefore, in the subsequent sections, special attention is given to brain masking andRF-bandwidth.
90

LTA pulse design: B+1 versus B0
Region of Interest (Brain masking)
For optimal performance, the kT -points-based RF-pulse optimization should be limited to the ROI only. Al-though this region can manually be defined, it is both a cumbersome and error-prone procedure. Thereforeit is most desirable to have a fast and robust automated method to identify the ROI. Currently, various soft-ware packages are available that allow the brain volume to be extracted automatically (BrainVisa, FreeSurfer,FSL). However, measurements obtained for this purpose, during the pTx calibration stage, generally yielda relatively poor contrast. Indeed a short calibration time is used to maximize the time available for sub-sequent optimized pTx acquisitions. Taking this into consideration, the FSL brain extraction tool (Smith,2002) appears to be suitable6.
So far, attempts to perform brain delineation based on images with a 5-mm isotropic resolution have notyielded robust results. Due to partial-volume effects, the skull-brain interface is often not well defined, causingportions of non-brain tissue to be included into the ROI, or brain tissue to be excluded from it. More robustautomated brain extraction was achieved by selecting an in-plane resolution of 2.5 x 2.5 mm paired witha slice thickness of 5 mm (FLASH with TR=25ms, FA 10, TE1/TE2=10/15ms, total acquisition time 1.5 min). After post-processing, the obtained brain mask may be down-sampled to match the B+
1 and B0
calibrations. Even so, it may still be beneficial to allow some T2*-weighting to suppress signal originatingfrom areas outside of the brain.
Comparing inversion pulses based on two different brain masks, one with 15-ms and the other with 10-msecho-time, it becomes clear how important the accuracy of the brain mask is in the context of LTA pulsedesign (Fig. 7.10). Although the longer TE results in a visually more appealing brain mask, some crucialareas close to intracranial cavities are excluded due to intra-voxel dephasing. Evaluating the waveformobtained from either mask on a more accurate delineated brain volume (the union of both masks) revealssubstantial defects in the excitation profile (Fig. 7.10, black arrows). The brain mask obtained with theshorter TE, on the other hand, mostly includes these cavity-neighboring regions, resulting in better overallexcitation fidelity. Nonetheless, some small defects can still be observed in areas where the mask excludedsmall parts of the brain.
Bandwidth
Compared to the STA excitations detailed in the previous chapter, the LTA inversions demonstrate a muchsmaller bandwidth. Although the measured B0-map is taken into account during the pulse design, its coarseresolution may average out some of the high magnetic susceptibility effects at the edges of the brain. Inprinciple, a higher resolution B0-map could be incorporated in the pulse design to mitigate these effects.This not only substantially lengthens the calibration procedure, but also enhancing the resolution by a factorx increases the computational load by a factor x3. Alternatively, an extended bandwidth can be enforcedlocally. To this end, the broad bandwidth pulse design method proposed by Setsompop et al. (2009) can beadopted. This allows the pulse design to be optimized simultaneously at multiple frequency offsets in everyvoxel. In order not to overly constrain the problem, this approach can be confined to potential trouble areas.To automate the determination of such regions, the ROI can be convolved with an edge detection filterto obtain the boundaries most sensitive to magnetic susceptibility effects. Specifying different frequencyoffsets for these regions, i.g., ±25% on top of the measured value, and incorporating them into MOCA forsimultaneous optimization, an extended bandwidth is enforced in these regions only (Fig. 7.11).
Initial results
Based on the simulations presented in this chapter, the impact of automated brain masking for the purposeof LTA pulse design was evaluated in-vivo (Fig. 7.12). This experiment clearly illustrates the negativeimpact associated with the exclusion of small critical brain areas (Fig. 7.12a). Although the above detailedapproach is still under evaluation, initial measurements suggest that, once a good brain mask is obtained,it is generally sufficient to enforce a 25% margin around the measured B0-field near the intracranial cavities(Fig. 7.12b).
6At first sight, FreeSurfer appears to be relatively computationally demanding, whereas BrainVisa seems to rely heavilyon the contrast. Nonetheless, both BrainVisa and FreeSurfer may prove equally reliable and efficient, when optimized by anexperienced user.
91

Chapter 7.
Figure 7.10: Illustration of the sensitivity of LTA pulse design with respect to imperfections in the definitionof the ROI.
Figure 7.11: Illustration of the procedure adopted to define localized areas where an extended bandwidthwill be enforced during MOCA-based optimization. On the left hand side: application of the brain maskand edge detection filter, are used to produce a set of 3 distinct B0-maps for consideration during pulsedesign. The central one of these three corresponds to the measured ∆B0-map throughout the entire brain,whereas the ones next to it correspond to a ±25% deviation to be incorporated on the edges only. On theright hand side: the same mask and filter is applied to obtain the B1-maps corresponding to this extendedspace, where the voxels on the edges of the brain mask are now represented 3 times (collectively covering a±25% bandwidth around the expected off-resonance frequencies) during the MOCA based optimization.
92

Summary and Recommendations
Figure 7.12: Preliminary result illustrating the impact of the pulse bandwidth on the image quality. Bothsubfigures were acquired with the MP-RAGE sequence including a 13-kT -point-based inversion pulse (samesubject). a: Inversion pulse designed with MOCA, based on a brain mask with a 15-ms echo time. b:Inversion pulse designed with broad-bandwidth MOCA, based on a brain mask with a 10-ms echo time.
7.7 Summary and Recommendations
Although the spatial domain method (Grissom et al., 2006) with the magnitude least squares approach(Setsompop et al., 2008c) can readily be adopted to design LTA excitations up to 90, provided transversemagnetization is substituted by the target FA in radians (Boulant and Hoult, 2012) the excitation signifi-cantly deteriorates as the targeted FA approaches 180. Going to the presented MOCA provides a robustoptimization procedure to account for the non-linear dynamics of the Bloch equations. Nonetheless, theoptimal control-based solutions presented in this chapter could still be improved. For instance to enhancethe control of the RF-deposition, the sub-pulse duration could be considered as a free parameter, like in theSTA approach. Recasting the problem formulation into the spin-domain (Jaynes, 1955; Pauly et al., 1991)as proposed by Grissom et al. (2009), would reduce the computational load, and could provide valuabletools to enforce limited-phase constraints when designing refocusing pulses. Ultimately a direct (very) large-tip-angle pulse design method, omitting the small-tip-angle approximation and including a direct k-spaceoptimization routine, is desired to approximate a truly optimized RF solution. However, such a method hashitherto remained elusive.
93

Chapter 7.
94

8
Parallel-Transmission-Enabled Magnetization-Prepared
Rapid Gradient-Echo T1-Weighted Imaging of the Human
Brain at 7 Tesla
8
This chapter contains methods & principles that were accepted for publication asabstracts in the proceedings of the Annual Annual Meeting of the InternationalSociety for Magnetic Resonance in Medicine 2012.
M.A. Cloos, N. Boulant, M. Luong, G. Ferrand, E. Giacomini, M-F. Hang, C.J.Wiggins, D. Le Bihan, and A. Amadon. (2012) “kT -points-based Inversion PulseDesign for Transmit-SENSE Enabled MP-RAGE Brain Imaging at 7T.”
M.A. Cloos, A. Amadon, N. Boulant, M. Luong, G. Ferrand, E. Giacomini, M-F.Hang, C.J. Wiggins, and D. Le Bihan. (2012) “Parallel-Transmission-Enabled T1-Weighted Human Brain Imaging for Robust Volumetric and Morphologic Studiesat 7T.”
Abstract
One of the promises of UHF MRI scanners is to bring finer spatial resolution in thehuman brain images due to an increased signal to noise ratio. However, at suchfield strengths, the spatial non-uniformity of the RF transmit profiles challengesthe applicability of most MRI sequences, where the signal and contrast levelsstrongly depend on the FA homogeneity. In particular, the MP-RAGE sequence,one of the most commonly employed 3D sequences to obtain T1-weighted anatom-ical images of the brain, is highly sensitive to these spatial variations. These causedeterioration in image quality and complicate subsequent image post-processingsuch as automated tissue segmentation at UHF.
In this work, we evaluate the potential of pTx to obtain high-quality MP-RAGEimages of the human brain at 7 Tesla. To this end, non-selective transmit-SENSEpulses were individually tailored for each of 8 subjects under study, and applied toan 8-channel transmit-array. Such RF pulses were designed both for the low-FAexcitation train and the 180° inversion preparation involved in the sequence, bothutilizing the recently introduced kT -points trajectory. The resulting images werecompared with those obtained from the conventional method and from subject-specific RF-shimmed excitations. In addition, four of the volunteers were scannedat 3 Tesla for benchmarking purposes (clinical setup without pTx). Subsequently,automated tissue classification was performed to provide a more quantitativemeasure of the final image quality.
Results indicated that pTx could already significantly improve image quality at7 Tesla by adopting a suitable RF-Shim. Exploiting the full potential of thepTx-setup, the proposed kT -points method provided excellent inversion fidelity,comparable to what is commonly only achievable at 3 Tesla with energy intensiveadiabatic pulses. Furthermore, the cumulative energy deposition was simultane-ously reduced by over 40% compared to the conventional adiabatic inversions.Regarding the low-FA kT -points based excitations, the FA uniformity achieved at7 Tesla surpassed what is typically obtained at 3 Tesla. Subsequently, automatedwhite and gray matter segmentation confirmed the expected improvements in im-age quality, but also suggest that care should be taken to properly account forthe strong local susceptibility effects near cranial cavities. Overall, these findingsindicate that the kT -point-based pTx solution is an excellent candidate for UHF3D imaging, where patient safety is a major concern due to the increase of specificabsorption rates.

Chapter 8.
8.1 Introduction
The magnetization-prepared rapid gradient echo sequence (Mugler and Brookeman, 1990) referred to as “MP-RAGE”, is among the most commonly employed 3D sequences to obtain T1-weighted anatomical images ofthe brain. To this end, typically an inversion pulse is used followed by a spoiled fast low angle shot (FLASH)train acquiring one partition plane in k-space per repetition (TR). Careful adjustment of the delay betweenthe inversion and the acquisition block, as well as of the usual imaging parameters, allows excellent contrastbetween gray matter (GM), white matter (WM) and (CSF) at field strengths up to 3 Tesla (Deichmannet al., 2000; Han et al., 2006; Mugler and Brookeman, 1990).
Strong GM/WM/CSF contrast is a prerequisite for both manual and automated tissue segmentation. Anal-ysis based on such segmented data allows the study and potentially diagnosis of various pathological condi-tions. Measurements of change in GM, WM and CSF volume for example provide profound insights into theageing brain (Gur et al., 1991) and pathologic progression in neurodegenerative diseases such as Alzheimer(Silbert et al., 2003) and Huntington’s disease (Thieben et al., 2002). Moreover, thinning of the cerebralcortex is often region-dependent, stressing the importance of high quality highly-resolved images. Asidefrom its applications in pathology, the MP-RAGE sequence has become the current standard for anatomicalreference images in functional studies such as in fMRI, PET, EEG and MEG. In the quest for ever moredetailed images of the human brain, increasingly higher main-magnetic field strengths are being explored toreap the benefits of increased signal and contrast (Ocali and Atalar, 1998). Already at 3 Tesla, the RF wave-length corresponding to the proton Larmor frequency becomes comparable to the dimensions of some imagedhuman body parts. Consequently, non-uniformities arise in the transmit sensitivity (B1+), which resultsin zones of shade and losses of contrast distributed across the images of large organs such as the abdomenor thighs (Bernstein et al., 2006). Considering the application of the MP-RAGE sequence to human brainimaging, a combination of adiabatic inversion-pulses (Bernstein et al., 2004) and hard excitations can stillbe considered adequate to obtain high quality T1-weighted images at 3 Tesla (Han et al., 2006). Moving upin field strength to 7 Tesla and beyond, the increased Larmor frequency results in strong transmit sensitivity(B+
1 ) variations throughout the volume of the human brain (Yang et al., 2002). Consequently, contrastartifacts form due to unwanted spatial variations of the flip-angle (FA). Coincidentally, the uniformity of thereceive sensitivity (B−
1 ) deteriorates with the decrease in wavelength. This results in additional unwantedsignal intensity variations (bias-field) throughout the image.
Various methods have been proposed to alleviate both the deteriorated T1 contrast and spatial B−1 variation in
MP-RAGE images. These include post-processing techniques exploiting the relatively low spatial frequenciesin the bias-fields to remove unwanted signal intensity variations (Wald et al., 1995; Styner et al., 2000;Ashburner and Friston, 2005). Alternatively, an adaptation on the MP-RAGE sequence, referred to as theMP2RAGE sequence, has been proposed in the form of a second acquisition block following the inversion(Van de Moortele et al., 2009). Combined with a suitable post-processing scheme, the images produced bythe two acquisition blocks can be combined to produce high-quality bias-field-corrected T1-weighted images.Although this method is less sensitive to B+
1 non-uniformities, the contrast may not be recovered in severelyaffected areas. At 7 Tesla, depending on the RF coil in use, such areas may typically reside in the cerebellum,potentially extending out into the occipital or temporal lobes (Van De Moortele et al., 2007; Marques et al.,2010). Post-processing-based correction of these contrast artifacts induced by strong B+
1 non-uniformitiesrequires a priory knowledge of the anatomical structures, therefore defeating the general purpose of mostT1-weighted imaging techniques (Wang et al., 2005). Considering the foreseeable continued increase infield strength, several 9.4 Tesla scanners readily in operation and the development of an 11.7-Tesla humanMRI system at our site, increased B+
1 artifacts may be expected, possibly limiting the applicability of theMP-RAGE and MP2RAGE approaches. Furthermore, the inclusion of the second acquisition block in theMP2RAGE significantly lengthens the TR (Marques et al., 2010). Thus high parallel imaging accelerationfactors must be employed, at the expense of SNR, to achieve acceptable acquisition times (Sodickson andManning, 1997; Pruessmann et al., 1999; Griswold et al., 2002).
Parallel transmission (pTx) was proposed to alleviate these limitations (Katscher et al., 2003; Zhu, 2004).This technique utilizes multiple independently-driven coil elements distributed around the subject. In itssimplest form, referred to as RF-Shimming (Adriany et al., 2005), the B+
1 -fields from all coil elementsare combined to optimize the B+
1 -distribution in a region of interest (ROI). Similarly to the conventionalCircularly-Polarized (CP) mode utilized by most clinical systems today, a single pulse shape is transmitted atany particular time point in the pulse sequence. However, the RF-Shimming technique allows the amplitude
96

Methods
and phase combination between coil-elements to be tailored to a specific ROI. Further generalization ofthis concept led to the introduction of Transmit-SENSE (Katscher et al., 2003; Zhu, 2004), exploiting thefull potential of the transmit-array by tailoring the RF-waveforms to be applied to each of the individualcoil-elements. This transmission generally occurs in concert with magnetic field gradients (usually used forspatial selectivity) so as to provide additional degrees of freedom to maximize the final excitation uniformity.Thus the RF pulses are played while pursuing a trajectory in k-space, where k is the spatial frequencyvector: k (t) = −γ
´ T
tG () · rd , T being the RF pulse duration and G(t) the controlled linear magnetic
field gradient at time t.
In the framework of Transmit-SENSE, whole-brain non-selective uniform excitations were recently demon-strated at 7 Tesla with the kT -points method introduced by the authors (Cloos et al., 2012). This techniqueproposes a minimalist transmit k-space coverage in the vicinity of the k-space center to compensate for thesmooth RF inhomogeneities without depositing high levels of energy. The few k-space locations where RFis transmitted are the so-called kT -points. The objective of this manuscript is to extend this work beyondthe small-tip-angle regime (Pauly and Nishimura, 1989) and validate the applicability of kT -point pulses toT1-weighted whole brain imaging in the MP-RAGE sequence. This would demonstrate the ability of suchpulses to retain the desired contrast in short-TR sequences (here we refer to the FLASH inter-echo time),where earlier attempts have shown their limitations (Boulant, 2009). In addition, the in-vivo demonstra-tion of pTx-based inversion pulses would provide a prospective on their potential to replace SAR-intensiveadiabatic pulses in UHF MRI.
The RF energy control is an important issue, as it will directly impact the SAR level in the patient. Tofacilitate our demonstration, an approach to SAR management for parallel-transmission will be presented inthe next section, which while conservative, is less restrictive than the commonly adopted worst-case approach(Collins et al., 2007; Brunner et al., 2008).
Experimental results obtained at 7 Tesla with both the conventional and proposed pTx methods were com-pared to images acquired at 3 Tesla without pTx. Subsequently, the potential impact of the attained imagequality on volumetric and morphological studies is quantified by analysis of the outcome from automatedtissue classification and evaluation of the cortical ribbon.
8.2 Methods
Pulse design
Prior to on-line RF pulse design, the main field offset ∆B0-map as well as transmit and receive mapswere collected with a low resolution (5-mm) as detailed in Cloos et al. (2012). From these calibrationmeasurements, a brain mask was created with the brain extraction tool from the FSL software package(Smith, 2002) to define the three-dimensional ROI on which pulse design should focus.
The FLASH train excitation pulse design was performed in the small-tip-angle regime (Pauly and Nishimura,1989). To this end, the spatial domain method (Grissom et al., 2006) was adopted including the MagnitudeLeast Squares approach introduced by Setsompop et al. (2008c), with an initial target transmit phase mapobtained from the conventional CP mode. Non-selective uniform excitation of the brain volume was achievedby selecting a 5 kT -point trajectory as described in Cloos et al. (2012). Targeting an average FA of 6.5°, theRF voltage per channel was limited to 45 Volts so as to constrain their SAR contribution.
Magnetization preparation pulses were designed in two stages. First a candidate pulse was obtained utilizingthe tools developed for the excitation pulse design, now targeting 180° (Fig. 8.1a, step 1). Constraints onthe inversion pulse duration are more lenient, hence 13 kT -points were selected to reap the benefits providedby the increased degrees of freedom. The symmetric spread of the kT -points in a diamond-like shape sur-rounding the center of transmission k-space (Fig. 8.1b) allowed to approximate the linear class of large tipangle pulses introduced by (Pauly et al., 1989). Subsequently the optimal control approach was applied totake into account the non-linear behavior of the Bloch-equations at large tip angles (Fig. 8.1a, step 2). Ourimplementation differs slightly from that demonstrated by Xu et al. (2008), since, for an inversion, the pro-duced phase distribution can be neglected. Consequently a magnitude-only optimization problem is solved,
where the normalized root mean square inversion error (NRMSIE) defined as N−1/2qP
r(Mz (r) + 1)
2 isminimized, with r designating a voxel location in the brain and N their number. In addition, the phase
97

Chapter 8.
Figure 8.1: Schematic overview of the large tip angle pulse design method used to design inversion pulses. a:Step 1: Small-tip-angle pulse design as described by Cloos et al. (2012). Step 2: Optimal control approachas described by Xu et al. (2008) modified to optimize the longitudinal magnetization magnitude only whiletaking the ∆B0 evolution into account. Step 3: Cut-off filter to constrain the peak amplitude. Step 4:Nelder–Mead search of k-space for improved kT -point locations. b: k-space trajectory used for the kT -point-based parallel transmission inversion pulses. RF energy is deposited only at the k-space locations indicatedby the spheres. Gradient blips (60-ms, no RF) are played in-between to move to the next k-space location.
evolution due to ∆B0(r) was encompassed in the optimization procedure. In the end, for optimal flexibility,the sub-pulse shapes at each kT -point are allowed to vary rather than staying square as was the case inCloos et al. (2012). The peak amplitude of the designed waveforms was constrained to almost the max-imum voltage available per channel (180 V). For this purpose, a cutoff filter was applied to the obtainedRF waveforms between iterations in the optimal control approach (Fig. 8.1a, step 3). Inspired by Grissomand Pauly (2010), the Nelder–Mead method (Nelder and Mead, 1965) was applied to search k-space forimproved kT -point locations (Fig. 8.1a, step 4). These steps (2-4) were iterated until either the NRMSIEdropped below 5%, 120 such iterations were performed, or the cumulative energy on a single channel reached1.8 Joules. The later constraint was selected to exclude solutions where the RF energy was not properlydistributed over the brain, in which case the last solution obtained still fulfilling the constraints was adopted.
The complete procedure was implemented in C++ including GPU-enabled CUDA extensions allowingsubject-specific inversion pulse design within a time scale compatible with in-vivo studies performed onhuman subjects.
For comparison at 7 Tesla, 7-ms hyperbolic-secant adiabatic inversion pulses (Silver et al., 1985) in combi-nation with 500-ms hard-pulse excitations were set for both the conventional CP mode and subject-specificstatic RF-shims. The latter were obtained by applying the small-tip-angle pulse design method to a singlekT -point at the center of k-space. Channel-dependent Tikhonov parameters (Cloos et al., 2010c) were usedto constrain the maximum amplitude variation among channels in the RF-shim, thereby minimizing themaximum local SAR deposited in the head while allowing the adiabatic condition to be satisfied as much aspossible with the peak power available in our setup. The 7- and 0.5-ms durations of the conventional pulseswere chosen so as to not exceed the SAR limitations and yet keep as close as possible to the pulse durationsobtained with the kT -points approach.
At 3 Tesla, standard native pulses were applied in the MP-RAGE sequence. Because of a lower RF energydemand, their durations varied slightly from the ones we used at 7 Tesla: adiabatic hyperbolic secant andexcitation hard pulse durations were 10.2 ms and 0.1 ms respectively.
Setup
Four volunteers were scanned at 7 Tesla to evaluate the applicability of the proposed methods for adaptationin the MP-RAGE sequence. In addition, B+
1 -maps were measured in four more volunteers to investigate thevariation in energy deposition and achievable excitation fidelity. Our institutional review board approvedthe study and informed consent was obtained from all volunteers. Experimental validation was performedon a 7 Tesla Magnetom scanner (Siemens, Erlangen, Germany), equipped with an 8-channel transmit array(1 kW peak power per channel) and an AC84 head gradient system (Siemens, Erlangen) allowing amplitudesup to of 50 mT/m and a slew rate of 333 mT/m/ms.
98

Results
Figure 8.2: Transmit-array coil used at 7 Tesla in this study (a) and the corresponding transmit (B+1 ) and
receive (B−1 ) sensitivity profiles measured in the human brain (b).
For both RF transmission and reception, a home-made transceiver-array head coil was used (Ferrand et al.,2010). The array consists of 8 stripline dipoles distributed every 42.5-degrees on a cylindrical surface of 27.6-cm diameter, leaving a small open space in front of the subject’s eyes (Fig. 8.2a). All dipoles were tunedideally to the proton Larmor frequency at 7 T and matched identically to a 50-W line impedance. Transmitand receive sensitivity profiles as well as ∆B0-maps were determined as described in Cloos et al. (2012).Typical transmit and receive profiles measured in the human brain are shown in Fig. 8.2b. Variations inB0 demonstrated standard deviations of approximately 45 Hz with peak values up to about 300 Hz near thesinus cavity.
In addition, for benchmarking purposes, the same volunteers were also scanned at 3 T (without paralleltransmission). The clinical system used for that purpose was a Magnetom Tim Trio (Siemens, Erlangen)equipped with a whole-body transmit RF coil and a 12-channel receive head coil.
Sequence parameters and validation
Each of the pulse shapes as described by the above designs was inserted into the MP-RAGE sequence andapplied to the human brain at 7 Tesla. Sequence parameters were: inversion time TI = 1.1 s, inversionTR = 2.6 s, FLASH TR or IET = 7.1 ms, TE = 3.5 ms, FA = 6.5, 0.8-mm isotropic resolution with a256x256x192 matrix in sagittal acquisition and a phase-encode SENSE factor of 1.33 (Pruessmann et al.,1999), total acquisition time 8 min. First-order receive sensitivity correction (Wang et al., 2005) wasapplied to provide a more direct qualitative comparison between the different MP-RAGE implementations.The somewhat strong AC84 gradient spatial non-linearities were corrected for at the end of the image recon-struction procedure. Both the RF-shim and kT -point-based approaches were compared to the conventionalCP-mode configuration obtained at 3 T and 7 T.
The MP-RAGE images obtained at 3 Tesla were acquired with routinely-used parameters: 1.04x1.0x1.1mmresolution, TI = 0.9 s, TR = 2.3 s, TE/IET = 3.0/7.1ms, FA = 9°, partial Fourier 7/8, 256x230x160 matrixin sagittal acquisition, total acquisition time 8 min.
Considering that the images obtained with the conventional combined transmission at 3 Tesla are oftendeemed to be of sufficient quality to be used in a variety of studies, they may be regarded as a frame of ref-erence. Moreover, they provide a gauge to estimate the applicability of the proposed method for automatedGM/WM/CSF segmentation. To this end, automated tissue classification was attempted with two commonlyemployed software packages: SPM (distributed through the website http://www.fil.ion.ucl.ac.uk/spm/) andFreeSurfer (freely available to the research community through the websitehttp://surfer.nmr.mgh.harvard.edu/). In addition, the latter tool also provided a more quantitative metricfor the assessment of the obtained tissue classification in the form of localized cortical gray matter thicknessmeasurements (Fischl and Dale, 2000).
8.3 Results
Pulse design
Based on the B+1 -maps measured in all eight volunteers, full Bloch simulations were performed to evaluate
the theoretical performance of the inversion pulses (Fig. 8.3a). On average, the 7-ms hyperbolic secant
99

Chapter 8.
Figure 8.3: A comparison of the different inversion pulses tailored for all 8 subjects. a: The normalized rootmean square inversion error (NRMSIE) as a function of the iteration number in the optimal control approach.The CP-mode, RF-shim and kT -points method are indicated in blue, orange and green respectively. Thedark lines indicate the mean values whereas the light areas indicate standard deviation from the mean. b:The total RF energy required as a function of the iteration number in the optimal control approach. Thesame color-coding was used as in a.
adiabatic inversion applied to the conventional CP-mode resulted in a 38±6% NRMSIE (cerebrum only:22±8%). Similar to what is achieved at 3 Tesla (Fig. 8.4a), typically good inversion is established inthe parietal and frontal lobes. However, extremely poor results are obtained in the cerebellum in this case,extending up into the lower parts of the occipital lobe (Fig. 8.4b). Note that although these values may seemrelatively large for adiabatic pulses, adopting the same metric for optimally-chosen square pulses resultedin a 63±6% NRMSIE (cerebrum only: 49±8%). Application of a subject-specific RF-shim with the aboveadiabatic pulse improved the inversion quality to 18±6% NRMSIE (cerebrum only: 14±4%). Nevertheless,substantial FA variations remained in the cerebellum. Furthermore, additional fluctuations were sometimesintroduced along the edges of the parietal, frontal and temporal lobes (Fig. 8.4c).
Although the initial candidate kT -point-based inversions typically result in an NRMSIE in excess of 40%,application of the optimal control approach rapidly improves the performance beyond what was achievedwith the adiabatic pulses (Fig. 8.4d). On average the optimization reaches a NRMSIE of 5±2% (cerebrumonly: 5±1%) within about 100 iterations (Fig. 8.3a). Based on the performance of a 3-Ghz Intel Xenonsystem paired with an NVIDIA Tesla C2050 GPU, these pulses, optimized with 1-µs raster time, can be foundwithin about 3 minutes. Considering the cumulative energy deposition, the kT -points method demonstratesa clear tradeoff between inversion quality and the energy required (Fig. 8.3b). Although improvement of theNRMSIE results in an increased energy deposition, the 5%-target is achieved with less energy than neededby the RF-shim, and requires 40% less energy than the conventional CP mode. Another way of comparingthe pulse performance is to fix the level of NRMSIE to that of the RF-shim (18%), and look at the energyrequired by the kT -points to reach it: this energy (4 J) is half the one used by the RF-shimmed adiabaticpulse whereas the kT -point pulse duration is 1-ms shorter. This tends to show optimally-controlled kT -pointsare not only excellent candidates for FA homogenization, but also with respect to SAR management.
In addition to the inversion, the excitation pulses also have an impact on the contrast (Deichmann et al.,2000). The relatively minor spatial variations in the transmit sensitivity at 3 Tesla are generally of littleconcern for clinical human brain imaging applications (Fig. 8.4e). On the other hand, at 7 Tesla, theconventional method clearly shows a strong central brightening effect (Fig. 8.4f), that even the applicationof a subject-specific RF-shim cannot completely subdue (Fig. 8.4g). However, adopting the kT -pointsmethod, superior excitation fidelity was achieved compared to what is typically obtained at 3 Tesla (Fig.8.4h).
Image quality
The combined impact of inversion and excitation can be seen in the T1-weighted MP-RAGE images (Fig. 8.5).Whereas the images obtained at 3 Tesla with a transmit body coil are barely affected by B+
1 -inhomogeneities(Fig. 8.5a), the conventional method applied at 7 Tesla results in strong contrast artifacts (Fig. 8.5b). Due to
100

Results
Figure 8.4: A comparison of the different inversion and excitation pulses applied to a representative subject(simulation only). The inversion pulses from left to right: a: hyperbolic secant adiabatic inversion pulse at3 Tesla (NRMSIE 1.3%), b: CP-mode with a 7-ms hyperbolic secant adiabatic inversion pulse (NRMSIE30.1%), c: RF-shim with the same pulse (NRMSIE 15.7%), and d: kT -point-based 6.1-ms inversion pulse(NRMSIE 5%). The FA-maps of excitation pulses, all targeting an average of 6.5°, are shown alongsidetheir corresponding FA histogram. From left to right: e: 3 Tesla, f : conventional method at 7 T, g:subject-specific RF-Shim at 7 T, h: kT -point-based excitations at 7 T.
101

Chapter 8.
the poor inversion quality produced, distinction between GM and WM is no longer possible in the cerebellum.Furthermore, as expected from the simulation (Fig. 8.4b), the contrast artifact can also be seen extendinginto the occipital lobe.
Application of a subject-specific RF-shim significantly improved image quality (Fig. 8.5c), thus allowingcerebellar GM/WM to be distinguished. Even so, residual B+
1 non-uniformities (Fig. 8.4c) introducedartificial contrast variations complicating distinction between GM & WM with confidence. This can beseen, for example, in the frontal part of the temporal lobe (Fig 8.5g). Furthermore, the arachnoids cyst, aCSF-filled lesion observable in front of the temporal lobe of this subject (white arrow), now appears slightlybrighter than the CSF in the ventricles.
The proposed combination of kT -point-based inversion and excitation pulses significantly reduces the afore-mentioned residual contrast artifacts (Fig. 8.5d). In particular, intricate structures can now be resolvedin greater detail (Fig. 8.5h). Regarding the central part of the brain, where the conventional methodstypically produce fair results, a reduction in signal intensity is observed. This coincides with the absence ofa central brightening effect typical of the CP-mode and, to a lesser extent, RF-shim excitations. Therefore,even though all excitations were designed to produce an average FA of 6.5°, both the CP-mode and RF-shimproduce substantially higher FA in the center of the brain. Consequently they demonstrate relatively moresignal in this area. However, these deviations from the target FA also lead to a change in contrast, whereasthe kT -point-based method produces a uniform FA distribution resulting in the expected contrast.
Considering off-resonance effects, only the kT -point-based method incorporated the measured ∆B0 spatialvariations in its design. This allowed greater inversion and excitation fidelity in the regions with significantfrequency offsets. Although this is of little concern for the excitation pulses, which, even with a 500-msduration, have sufficient bandwidth to uniformly cover the entire volume, the adiabatic inversion pulses candeteriorate significantly with large ∆B0 variations. This can be observed, for example, near the orbito-frontal sinus cavity on the sagittal slice (Fig. 8.5b). This is corrected by the kT -points-based pulses (Fig.8.5d), except for the orbital gyrus where a hypersignal remains because of either localized inaccuracies inthe ∆B0-measurement or brain mask.
Histograms of the brain voxel intensities obtained with the different methods provide a first indicationtowards their applicability for automated tissue segmentation. Before bias correction, a small plateau wasfound in the histogram at 3 Tesla indicating the presence of separable GM and WM peaks (Fig 8.6a, gray).Moving to 7 Tesla, such a plateau was no longer present with either the conventional CP-mode (Fig 8.6a) orRF-shim (Fig 8.6b). Only with the application of the kT -points method, a small dip appears suggesting thecoexistence of two populations (Fig 8.6c, black). However, with the advanced tools available, the existenceof such a local minimum before bias-field correction is by no means an absolute criterion to estimate thesuitability of these images for automated tissue classification 1. Analysis of the bias-field corrected dataas returned by SPM (Ashburner and Friston, 2005) facilitated a more straightforward comparison of theobtained histograms. Application of the conventional approach at 7 Tesla revealed a significantly diminishedcontrast compared to what was obtained at 3 Tesla (Fig 8.6d). Adopting a suitable RF-shim improves thecontrast substantially (Fig 8.6e). Again, the proposed kT -point-based method approximated most faithfullywhat was observed at lower field strength (Fig 8.6f).
Automated Tissue Segmentation
To investigate the fidelity of the automated tissue classification, the spatial distributions of the labeled voxelshave to be considered. Bearing in mind that minor imperfections in the obtained GM/WM delineationmay still be anticipated, a comparison can be made to the 3 Tesla benchmark (Fig. 8.7a). Moving to 7Tesla, images acquired with the conventional strategy can essentially no longer be used for automated tissuesegmentation throughout the entire volume of the brain. Utilizing the SPM software package, the observedcontrast deterioration in portions of the cerebellum, temporal and occipital lobes no longer allows properGM/WM differentiation (Fig. 8.7b). Application of a suitable RF-shim configuration largely mitigates thisproblem. Nonetheless, minor artifacts remained scattered throughout cerebral hemispheres. One exampleof this is indicated with a white arrow in Fig. 8.7c. Using the proposed combination of kT -point-based
1Note that; although bias-field correction is a powerful tool, if due to excitation defects the contrast is lost it may not berecovered by post-processing only. In addition, bias-field correction methods may also remove valuable information regardinglocal intra GM T1 relaxation variations.
102

Results
Figure 8.5: A qualitative comparison of the different pulses applied to the MP-RAGE sequence at 7T andthe conventional 3T implementation (Subject #1). a: 1-mm-resolved images obtained with the conventionaladiabatic inversion and non-selective excitation at 3 T (CP-mode). b: Same method as in a applied at 7 Twith isotropic 0.8-mm resolution (NRMSIE 34.7%). c: Application of the conventional adiabatic inversionand non-selective excitation at 7 T using a subject-optimized RF-shim (NRMSIE 19.6%). d: Image acquiredwith the proposed kT -points method (NRMSIE 6.7%). Zoomed sections corresponding to the region indicatedin the axial view (a-d) illustrate the more subtle differences in contrast and signal. From left to right: 3T(e), conventional method at 7T (f), subject-specific RF-shim (g), the proposed method (h). White arrow:contrast artifact resulting in the relatively bright appearance of CSF in the arachnoids cyst.
103
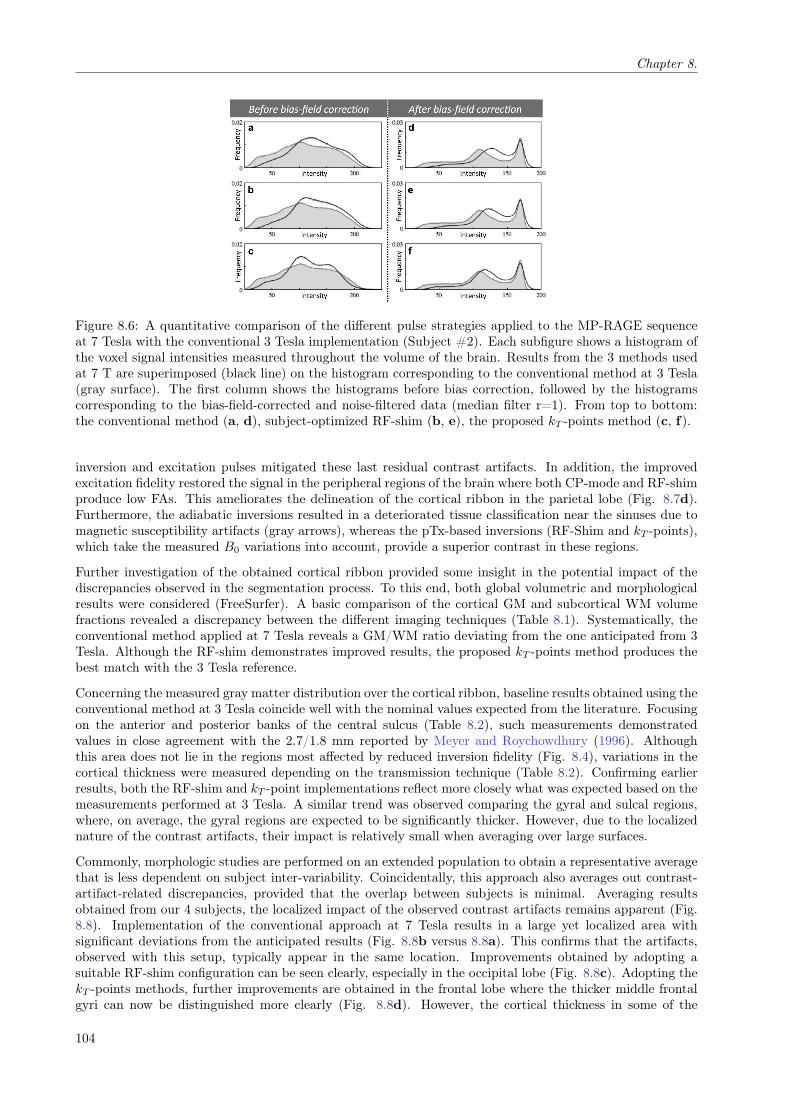
Chapter 8.
Figure 8.6: A quantitative comparison of the different pulse strategies applied to the MP-RAGE sequenceat 7 Tesla with the conventional 3 Tesla implementation (Subject #2). Each subfigure shows a histogram ofthe voxel signal intensities measured throughout the volume of the brain. Results from the 3 methods usedat 7 T are superimposed (black line) on the histogram corresponding to the conventional method at 3 Tesla(gray surface). The first column shows the histograms before bias correction, followed by the histogramscorresponding to the bias-field-corrected and noise-filtered data (median filter r=1). From top to bottom:the conventional method (a, d), subject-optimized RF-shim (b, e), the proposed kT -points method (c, f).
inversion and excitation pulses mitigated these last residual contrast artifacts. In addition, the improvedexcitation fidelity restored the signal in the peripheral regions of the brain where both CP-mode and RF-shimproduce low FAs. This ameliorates the delineation of the cortical ribbon in the parietal lobe (Fig. 8.7d).Furthermore, the adiabatic inversions resulted in a deteriorated tissue classification near the sinuses due tomagnetic susceptibility artifacts (gray arrows), whereas the pTx-based inversions (RF-Shim and kT -points),which take the measured B0 variations into account, provide a superior contrast in these regions.
Further investigation of the obtained cortical ribbon provided some insight in the potential impact of thediscrepancies observed in the segmentation process. To this end, both global volumetric and morphologicalresults were considered (FreeSurfer). A basic comparison of the cortical GM and subcortical WM volumefractions revealed a discrepancy between the different imaging techniques (Table 8.1). Systematically, theconventional method applied at 7 Tesla reveals a GM/WM ratio deviating from the one anticipated from 3Tesla. Although the RF-shim demonstrates improved results, the proposed kT -points method produces thebest match with the 3 Tesla reference.
Concerning the measured gray matter distribution over the cortical ribbon, baseline results obtained using theconventional method at 3 Tesla coincide well with the nominal values expected from the literature. Focusingon the anterior and posterior banks of the central sulcus (Table 8.2), such measurements demonstratedvalues in close agreement with the 2.7/1.8 mm reported by Meyer and Roychowdhury (1996). Althoughthis area does not lie in the regions most affected by reduced inversion fidelity (Fig. 8.4), variations in thecortical thickness were measured depending on the transmission technique (Table 8.2). Confirming earlierresults, both the RF-shim and kT -point implementations reflect more closely what was expected based on themeasurements performed at 3 Tesla. A similar trend was observed comparing the gyral and sulcal regions,where, on average, the gyral regions are expected to be significantly thicker. However, due to the localizednature of the contrast artifacts, their impact is relatively small when averaging over large surfaces.
Commonly, morphologic studies are performed on an extended population to obtain a representative averagethat is less dependent on subject inter-variability. Coincidentally, this approach also averages out contrast-artifact-related discrepancies, provided that the overlap between subjects is minimal. Averaging resultsobtained from our 4 subjects, the localized impact of the observed contrast artifacts remains apparent (Fig.8.8). Implementation of the conventional approach at 7 Tesla results in a large yet localized area withsignificant deviations from the anticipated results (Fig. 8.8b versus 8.8a). This confirms that the artifacts,observed with this setup, typically appear in the same location. Improvements obtained by adopting asuitable RF-shim configuration can be seen clearly, especially in the occipital lobe (Fig. 8.8c). Adopting thekT -points methods, further improvements are obtained in the frontal lobe where the thicker middle frontalgyri can now be distinguished more clearly (Fig. 8.8d). However, the cortical thickness in some of the
104

Results
Figure 8.7: Results of automated tissue segmentation (SPM version 8) for each of the different imagingtechniques (Subject #2). Voxels identified as GM are superimposed in blue, from left to right: conventionalmethod at 3 Tesla (a), conventional method at 7 T (b), RF-shim (c), the proposed kT -points method at 7T (d).
Subject Method NRMSIE (%) cGM/sWM
Brain Cerebrum
#1
3T CP-mode NA* NA* 1.07
7T CP-mode 34.7 22.6 1.03
7T RF-shim 19.6 15.8 1.08
7T kT -points 6.7 5.5 1.07
#2
3T CP-mode NA* NA* 1.07
7T CP-mode 46.5 29.8 0.95
7T RF-shim 22.9 16.8 1.05
7T kT -points 5.0 5.0 1.07
#3
3T CP-mode NA* NA* 1.00
7T CP-mode 39.1 17.4 0.97
7T RF-shim 24.1 17.7 1.01
7T kT -points 8.1 5.4 1.00
4#
3T CP-mode NA* NA* 0.99
7T CP-mode 35.6 15.0 0.92
7T RF-shim 21.2 12.8 1.01
7T kT -points 9.9 6.0 1.01
Table 8.1: Results from automated segmentation analysis (FreeSurfer). For each of the different imagingtechniques, the ratio of the cumulative cortical gray matter (cGM) and subcortical white matter (sWM)volumes of the two hemispheres is reported in the last column. NMRSI simulation results have also beenreported here for the sake of completeness. *Based on the B+
1 -map measured in a different volunteer, the10.2-ms adiabatic inversion applied at 3 Tesla, a NRMSIE of 1% (cerebrum only: 1%) may be expected.
105

Chapter 8.
Source Subject Method Central sulcus Gyral regions Sulcal regionsAnterior
bankPosterior
bank
Thisstudy
#1
3T CP-mode 2.6± 0.60 1.4± 0.32 2.8± 0.63 2.4± 0.56
7T CP-mode 2.6± 0.66 1.7± 0.32 2.6± 0.75 2.3± 0.64
7T RF-shim 2.6± 0.51 1.7± 0.33 2.7± 0.70 2.3± 0.60
7T kT -points 2.6± 0.71 1.6± 0.31 2.7± 0.72 2.3± 0.58
Thisstudy
#2
3T CP-mode 2.7± 0.63 1.7± 0.42 2.9± 0.62 2.5± 0.53
7T CP-mode 2.5± 0.72 1.8± 0.48 2.6± 0.77 2.4± 0.66
7T RF-shim 2.6± 0.75 1.8± 0.38 2.7± 0.73 2.4± 0.61
7T kT -points 2.8± 0.79 1.8± 0.42 2.8± 0.75 2.4± 0.63
Thisstudy
#3
3T CP-mode 2.6± 0.58 1.5± 0.31 2.7± 0.63 2.3± 0.53
7T CP-mode 2.4± 0.59 1.7± 0.36 2.5± 0.67 2.2± 0.59
7T RF-shim 2.5± 0.58 1.6± 0.31 2.6± 0.68 2.3± 0.55
7T kT -points 2.6± 0.64 1.6± 0.30 2.6± 0.67 2.2± 0.55
Thisstudy
#4
3T CP-mode 2.6± 0.51 1.5± 0.61 2.8± 0.60 2.4± 0.53
7T CP-mode 2.6± 0.63 1.7± 0.56 2.7± 0.69 2.3± 0.57
7T RF-shim 2.5± 0.64 1.6± 0.58 2.7± 0.69 2.3± 0.57
7T kT -points 2.6± 0.69 1.6± 0.51 2.7± 0.60 2.3± 0.57
(Fischl and Dale, 2000)Averaged
over 30subjects
1.5T CP-mode 2.6± 0.4 1.9± 0.2 2.7± 0.3 2.3± 0.3
Table 8.2: Cortical thickness (in mm) measured by automated analysis (FreeSurfer) for the banks of graymatter anterior and posterior to the central sulcus and averaged over both hemispheres. In addition, theaverage thicknesses measured in the gyral and sulcal regions are reported.
106

Discussion
Figure 8.8: Cortical thickness (in mm) of the inflated brain from automated analysis (FreeSurfer). For eachof the different imaging methods, the measured thickness of cortical ribbon is averaged over all 4 subjects.From left to right: the conventional method at 3 Tesla (a), the conventional method applied at 7 Tesla (b),subject-specific RF-Shim (c), the proposed kT -point method (d).
lower parts of the temporal lobe was still underestimated, especially near the middle ear where strong ∆B0
variations occur.
8.4 Discussion
Pulse design
Due to the low-energy demand of the kT -point RF pulses, the absence of relaxation-related contrast deterio-ration (Boulant, 2009) confirms their applicability as excitations in short-TR echo trains such as used in theMP-RAGE sequence. Furthermore, their extension beyond the small-tip-angle domain provided inversionpulses with excellent spatial uniformity throughout the human brain at UHF, not only outperforming theconventional adiabatic hyperbolic secant pulses (Silver et al., 1985) in terms of NRMSIE, but also simulta-neously reducing the cumulative energy deposition.
These results are especially compelling considering the ambitions of various institutions to explore fieldstrengths well beyond 7 Tesla, where the T1-contrast quality obtained with conventional imaging methodsmay be expected to deteriorate even further due to stronger B+
1 inhomogeneities and the relative T1 con-vergence between white and gray matter. Coincidently, the average energy deposition is expected to rise onaccount of the increased Larmor frequency. Thus although, in theory, increased power levels may be usedto enhance the performance of adiabatic pulses, unacceptable levels of energy deposition may be requiredto minimize residual artifacts. With the adiabatic pulses used in this work, the relative energy depositionbetween the 7-ms adiabatic inversion and 0.5-ms excitation pulse train was approximately 2:1. Thus whennearing the SAR limit, such adiabatic pulses may limit the obtainable resolution by constraining the max-imum number of partitions per TR or demanding the elongation of the acquisition time. Thus, if suchcompromise was deemed acceptable, simulations based on the measured B+
1 -maps suggest that substantialimprovements of the inversion fidelity could be obtained using more energetic adiabatic inversions (Table8.3). However, increasing the pulse duration reduces its bandwidth, therefore diminishing the performancein regions strongly affected by susceptibility effects.
The use of adiabatic sech pulses with application of a suitable subject-specific RF-shim demonstrated theability to produce significant improvements in image quality while reducing the total energy deposition.Nonetheless, small residual artifacts may remain especially if the available power per channel is limited. On allaccounts, significantly better inversion quality was achieved using the kT -points method while decreasing bothpulse duration and total energy deposition. Although the total energy deposition is only a first indicationtowards the actual SAR, techniques such as channel-dependent Tikhonov parameters (Cloos et al., 2010c)or virtual observation points (Eichfelder and Gebhardt, 2011) can be employed to further control the localSAR distribution produced by the kT -point-based excitations if necessary.
Additional improvements in performance may be obtained with the continued advancements in pulse designtechniques for parallel transmission. In this work, ∆B0-maps with a 5mm-isotropic resolution were used tooptimize the kT -point-tailored inversion pulses. When later applied to high resolution imaging sequences,
107

Chapter 8.
Field Method Duration (ms) Energy (J) NRMSIE (%)
brain cerebrum
3T CP-mode 10.2 14.9 1 1
3T CP-mode 8.2 12.0 3 3
7T CP-mode 7.0 11.5 38± 6 22± 8
7T CP-mode 8.5 14.0 31± 6 18± 6
7T CP-mode 10.0 16.4 27± 5 17± 5
7T RF-shim 7.0 8.1± 0.4 18± 6 14± 4
7T RF-shim 8.5 9.8± 0.4 12± 4 10± 3
7T RF-shim 10.0 11.6± 0.5 12± 4 11± 4
7T kT -points 5.9± 0.7 7.3± 0.6 6± 2 5± 1
Table 8.3: Simulated gain observed on the inversion sech pulse performance when lengthening its duration,based on B+
1 -maps measured at 7 Tesla in all 8 volunteers. For comparison, the result from the canonical3-Tesla system was based on the B+
1 -map measured on a single volunteer.
such as MP-RAGE, some of the strongly localized susceptibility gradients may remain unaccounted for, dueto coarse-voxel averaging. This may explain the observed residual artifacts near the sinus cavity (Fig. 8.5d)and middle ear. Instead of incorporating higher resolution maps in the pulse design, it may be beneficialto optimize the pulse design over a more extended bandwidth near the cranial cavities (Setsompop et al.,2009). This would make the pulses more robust to deviations from the measured B0-map.
Although simulations based on the measured B+1 -maps confirmed the robustness of the proposed pulse design
method, it is known to be sensitive to the initial pulse candidate (Xu et al., 2008). In addition, selectingthe optimal k-space locations can have a significant impact on the pulse duration and energy deposition(Grissom and Pauly, 2010). The initial k-space locations selected in this work were the same for eachsubject. Presumably, this is not the optimal solution and extensions to methods such as the sparsity-enforced(Zelinski et al., 2008d) and joined-design (Ma et al., 2010) approaches into the large-tip-angle domain wouldbe favorable. Nonetheless, the fixed k-space trajectory adopted in this manuscript produced robust resultswithout the need for long additional computations. It allowed, with our current setup, the tailored pulsesto be designed in approximately 3 minutes. Additional improvements in both code and hardware could helpto further reduce the computation time limiting the delay between consecutive sequences.
Beyond the scope of the MP-RAGE sequence, kT -points may be applied advantageously as non-selectivepulses in a variety of 3D-imaging sequences, which are becoming more and more prominent at high field.This will be the topic of future work.
Image Quality
High-quality MP-RAGE images of the human brain were acquired with pTx and the kT -points method.Previous studies have shown that, at least up to 7 Tesla, the MP2RAGE approach can be utilized to obtainhigh-quality T1-weighted images, provided the setup allows adequate performance of the adiabatic inversionover the entire ROI. However, even then, the MP2RAGE demands at least double the TR needed forthe conventional MP-RAGE sequence between inversion pulses, thereby doubling the acquisition time forequivalent parallel imaging acceleration factors. Thus potentially higher-resolution images could be obtainedwithin the same allotted time using the kT -point-based pulse design in MP-RAGE.
With our current transmit-array coil, 0.8-mm isotropic is approximately the maximum achievable resolutionfor an 8-min acquisition. However, this coil uses stripline transceiver-elements that may be considered sub-optimal for reception, especially in the top part of the brain, as shown on the sagittal images. Improvementsin SNR by about a factor 3 have been reported with the aid of dedicated multiple-loop receive arraysclosely fitting the patient’s head (Wiggins et al., 2006). Nonetheless, we were able to demonstrate higher-resolution MP-RAGE images than at 3 T, with a factor 2 smaller voxel volume and less receive elements,in approximately the same acquisition time, even though the longitudinal relaxation time is lengthened at 7Tesla (Rooney et al., 2007).
108

Conclusions
Adopting the kT -points method, the residual contrast losses observed with the RF-shim can be correctedresulting in robust tissue segmentation with results most comparable to what may be expected with a con-ventional 3 Tesla setup. This was also reflected by the histograms, where measurements with the proposedsolution demonstrated a close match with the 3 Tesla data (Fig. 8.6). Due to the shortening of T2 andlengthening of T1 on top of the increased excitation non-uniformity observed at UHF strengths, lower fieldsystems are generally expected to be more reliable for whole-brain T1-weighted imaging. Even at 3 Tesla,transmit non-uniformities produced by the excitation pulses may produce minor contrast artifacts and un-desired spatial variation in signal intensity (Fig. 8.4e). Using the proposed method at 7 Tesla resulted inan excitation fidelity surpassing what is commonly observed at 3 Tesla (Fig. 8.4h). Therefore, even clinical3-Tesla systems could benefit from the proposed method if equipped with parallel transmission hardware(Malik et al., 2012).
Considering the measurements of the cortical thickness, on average sulcal regions seem to be least affected.Presumably this is related to their more central location where the adiabatic condition can be satisfied moreeasily. On the other hand, in the gyral areas, the proposed method appears more reliable. Apart from theimproved magnetization preparation, this may be attributed to the increased excitation FA in the peripheralregions resulting in increased signal levels.
Even when averaged over several subjects, areas with severely under- and over-estimated cortical thicknesswere observed when applying the conventional transmission in our 7 Tesla setup. This suggests that theselocalized artifacts have a tendency to overlap between volunteers scanned in the same setup. Thus adoptinga larger subject population may not be sufficient to average out the erroneous data (Fig. 8.8). On the otherhand, the most dramatic deviations may be resolved by adopting a suitable RF-shim. Nonetheless, the bestresults were obtained using the proposed method. Especially in the frontal cortex where now the presenceof a thicker middle frontal gyrus region can be distinguished, as was also observed in a more extensive studyperformed on healthy volunteers at 1.5 Tesla (Fischl and Dale, 2000). Although, good inversion fidelity maybe expected at 3 Tesla (Table 8.3), spatial variation in the excitation profile may still introduce a bias in themeasurements (Fig. 8.4). The superior excitation homogeneity produced at 7-Tesla by the kT -points methodcould explain the observed difference in this region. On the other hand, all three methods implemented at 7-Tesla showed a reduced cortical thickness near the middle ear. Presumably, these regions could be improvedby increasing the bandwidth of the kT -point-based inversion pulses as discussed in the previous section.
So far, no particular care was taken to include the dura in the ROI when producing the brain mask forexcitation homogenization. In general, segmentation of the dura from the GM remains challenging in someareas (Van der Kouwe et al., 2008). When adopting the kT -point approach, the FA distribution is onlyoptimized in a low-resolution brain mask. However tissue outside of the brain will still be excited with FAsthat are arbitrary. This potentially leads to anomalous contrast effects just outside the brain. Thus careshould be taken not to exclude any essential volume of interest in the mask used to define the optimizedregion of excitation.
8.5 Conclusions
We have demonstrated the soundness of the kT -points method in the framework of parallel transmissionapplied to T1-weighted 3D-imaging of the human brain at 7 Tesla. The derived inversion pulses providedexcellent spatial uniformity throughout the human brain (NRMSIE 5%), outperforming the adiabaticpulses played in the conventional CP-mode (NRMSIE 38%) and in subject-specific RF-shim ( 18%), whilesimultaneously reducing the cumulative energy deposition. Thus the proposed method showed that the meritsof T1-weighted human brain imaging could remain accessible at UHF without the need of SAR-intensiveadiabatic inversion pulses. Although there has been some suspicion in the neuro-radiology community thathigh field systems are not competitive for T1-weighted imaging, this study shows that a 7 Tesla system is ableto produce high-quality highly-resolved T1-weighted images with allotted time equivalent to those used atlower field strength, provided it is equipped with a true parallel-transmit capability. Still, because of shorterand relatively more distinct T1’s for white and gray matter at lower field strengths, similar or better contrastmay be obtained at 1.5 or 3 Tesla especially if a parallel transmission setup can also be used. Nonetheless,for equivalent coil technology and voxel resolution, the SNR will be lower in these cases.
109

Chapter 8.
110

9 A Minimalistic approach to Transmit-SENSE 9
This chapter contains methods & principles that were published as abstracts inthe proceedings of the Annual Meeting of the International Society for MagneticResonance in Medicine 2011.
M. A. Cloos, G. Ferrand, N. Boulant, M. Luong, C. J. Wiggins, D. Le Bihan, andA. Amadon. (2011) “Dual-channel transmit-SENSE for flip-angle homogenizationin the human brain at 7 Tesla: a feasibility study.” p. 325
Abstract
Purpose: To investigate the minimal number of independent RF-channels nec-essary to obtain FA homogenization in the framework of Transmit-SENSE.
Materials and Methods: Imposing fixed linear combinations on an 8-channelpTx-setup, four different RF-transmit configurations were investigated. Thesesynthesized configurations, comprised out of 1, 2, 4, or 8 independent RF-pathways, by means of Bloch simulations. To this end, transmit-sensitivity pro-files were measured at 7 Tesla in 10 human volunteers. In addition, full-waveelectromagnetic-simulations were considered to evaluate the impact on the SAR.
Results: It is possible to design a dual-channel pTx-setup, suitable for clinicalneuro-imaging applications at 7 Tesla. Such a setup could even be simplified toa serial mode configuration, witch a single amplifier. However, compared to thedual-channel approach, the here-evaluated 4-channel implementation reduces thelevel of FA non-uniformity and energy deposition by almost a factor 2. The bestperformance is obtained when all coil-elements are driven independently.
Conclusion: The level of FA uniformity obtainable, in the human brain at 7Tesla, with only two independent channels can easily outperform conventionalclinical system operating at 3 Tesla. Although it is feasible to reduce the numberof transmit-channels to a bare minimum, overly constraining them may limit theapplicability to SAR lenient protocols only.

Chapter 9.
9.1 Introduction
In the previous chapters, we exhibited the potential of the pTx-solution for FA-homogenization at UHFMRI. However, the 8-channel configuration used in these demonstrations entails a substantial increase incomplexity compared to current clinical MR systems. More specifically, as described in Chapter 3, theimplementation of the transmit-SENSE approach with 8 parallel channels requires numerous duplicate MRcomponents. In addition, the necessary safety systems are complicated, requiring specialized componentsto facilitate secure operation without imposing overly conservative constraints (Chapters 2 and 4). Apartfrom the added financial expenses, additional calibration measurements are mandatory to exploit the fullpotential of the pTx system. Typically this includes the mapping of the subject specific transmit-sensitivitiesassociated with each of the transmit-channels, in addition to ∆B0 variations (Chapter 2).
To properly balance the benefits and costs associated with the implementation of a pTx-enabled MRI system,some insight towards the minimal number of independent RF channels is desirable. Currently most UHFsites have adopted an 8-channel pTx-extension, while some actively explore the potential benefits providedby doubling the number of transmit-pathways. Although the general consensus seems to be that additionaltransmit-channels are advantageous when targeting short RF-pulse durations or exercising local SAR control,the necessity of this performance boost remains unclear. Furthermore, driving each of the coil elementsseparately may not be optimal. Considering an 8-transmit-element coil, it was shown that driving the coilwith the 4 most efficient circularly polarized eigen-modes provides a level of performance comparable towhat could be achieved when driving each of the 8 elements directly (Alagappan et al., 2007). Adoptingthis approach, sometimes referred to as mode-compression, a 2N-element transmit-array-coil can efficientlybe driven with only N independent transmit-pathways (Alagappan et al., 2007, 2008).
When pursuing FA homogenization in the human brain at 7 Tesla with an 8-channel pTx-system, only a smallnumber of k-space locations need to be visited to achieve excellent excitation uniformity (Setsompop et al.,2008a; Cloos et al., 2012). Although short excitation pulses are generally favorable, it could be consideredto visit several additional k-space locations provided that this allows the complexity of the required pTx-setup to be reduced substantially. Moreover, clinically-viable MRI systems operating at 3 Tesla typicallydemonstrate less homogeneous excitation patterns than what can be achieved using an 8-channel pTx-setupat 7 Tesla (Chapter 8). With the understanding that the aforementioned clinical systems can be consideredsuitable for most medical applications focusing on the human brain we explore the viability of a minimalisticpTx-extension to facilitate similar levels of excitation fidelity at 7 Tesla.
9.2 Methods
Four different configurations were explored to provide some insight towards the minimum requirements tofacilitate adequate FA non-uniformity mitigation for human brain imaging at 7 Tesla based on the Transmit-SENSE method:
pTx: 8-channel setup where every coil-element is driven independently.
mTx: 4-channel setup where an 8-element coil is driven using the four most efficient circularly polarized modes.
dTx: 2-channel setup where an 8-element coil is driven with two optimized linear combinations in parallel.
sTx: 1-channel setup where an 8-element coil is sequentially driven with two optimized linear combinations .
A more detailed description of the differences between the dTx and sTx configurations is detailed below.
112

Methods
(a) Schematic overview of the dTx system. The gray surfaceindicates the RF-related components present in a typicalN-channel pTx-enabled MRI setup.
(b) Schematic overview of the sTx system. The gray sur-face indicates the RF-related components already present ina conventional MRI setup. The inclusion of monitors 1 and2 may provide additional benefits as detailed in section x.
Figure 9.1
Dual-Channel (dTx)
The dual-channel approach, hereafter referred toas dTx, constitutes a minimalistic pTx setup.Whereas the pTx-enabled MRI implementationsconsist of multiple independent waveform modula-tors, amplifiers and power- or waveform-monitors,the dTx system is restricted to only two in-dependent transmit-pathways combined with aspecially designed driving matrix to distributethe power over all available transmit-coil-elements(Fig. 9.1a).
Serial-Transmission (sTx)
The serial-transmission approach, hereafter re-ferred to as sTx, requires some comparatively low-cost adaptations to the standard MRI setup. Con-ventional MRI transmit implementations consist ofsingle waveform modulator, amplifier and powermonitor. To facilitate the sTx-method, a switchis included to re-direct the power to one of twotransmit-pathways and distribute the energy overall available transmit-coil elements via a special-ized driving matrix (Fig. 9.1b). Provided that thisswitch is fast enough that it can dispatch RF powerbetween the two transmit pathways during a singleRF pulse; typically the first half of the pulse couldbe played on the first pathway, and the second halfon the second one.
Linear driving matrix
It is well established that, in order to prevent high local SAR values, it is beneficial to distribute the powerover multiple coil-elements surrounding the subject (Lattanzi et al., 2009). However, to obtain a Transmit-SENSE solution, a set of independent transmit-sensitivities is required (Katscher et al., 2005). Instead ofdriving each of the coil-elements directly, all elements can be driven simultaneously using different linearcombinations. One convenient way to drive all coil elements simultaneously on an approximately orthogonalbasis of CP eigen-modes can be implemented via a Butler matrix (Butler and Lowe, 1961). Selecting onlythe N most efficient eigen-modes (dropping the anti-CP modes, Section 2.2), a 2N-element coil can be drivenusing N independent RF-channels (Alagappan et al., 2008; Setsompop et al., 2008a).
In general, any linear combination can be implemented in the form of a passive RF circuit (Ferrand et al.,2011). Assuming that the transmit-sensitivities do not deviate dramatically between subjects, a set of op-timized combinations can be deduced for an average subject. Based on these principles, a set of linearcombinations was optimized to produce complementary B+
1 distributions for both the dTx and sTx ap-proaches (Cloos et al., 2011b; Ferrand et al., 2012). To this end, the normalized standard deviation over
all voxels of the sumP2
j
∣∣∣Bjint(r)
∣∣∣ produced by two linear combinations of N coil-elements (Bjint(r)) was
minimized, thus ensuring sufficient magnetic field at every point in the volume of interest.
113

Chapter 9.
Safety and local SAR control in the sTx configuration
Each transmit-pathway contributes to the SAR distribution that needs to be considered to guarantee patientsafety and compliance with the guidelines (Section 1.3; IEC (2010)). However, in the sTx approach, thesetransmit pathways are never used simultaneously. This allows the expression of the SAR (Section 2.3; Eq.2.3) for the sTx system to be simplified to:
SARsTx(r) =σ(r)
2(r)
1
T
ˆ T
0
NX
n
|a(t)|2 kEn (r)k22 dt (9.1)
where N is the number of available transmit-pathways (inputs to the driving matrix), T is the duration,and an(t) is the time-dependent modulation of the RF pulse amplitude. This implies that the sum of thepower measured on the transmit paths is directly proportional to both the global and local SAR. Thus wecan write for the global and local SAR:
SARglobal =1
T
NX
n
"SARn
ˆ T
0
|an (t)|2 dt#
(9.2)
SARlocal = max|zr
(1
T
NX
n
"SARn (r)
ˆ T
0
|an (t)|2 dt#)
(9.3)
where SARnand SARn (r) represent the global and local 10-gram-averaged SAR corresponding to the nthtransmit-mode, respectively. Consequently, independent average power monitors on each of the transmitchannels (Fig. 9.1b) would allow both the global and local SAR to be restricted, without imposing overlyconservative approximations or additional constraints.
Nonetheless, optimal performance still requires the time-averaged power limits to be reevaluated for eachacquisition. To this end, an approach similar to CEASAR’s could be adopted (Chapter 4; Cloos et al.(2010a)). However, due to the simple additive nature of these equations, the local SAR can simply beretrieved from a look-up table, greatly reducing the computational load. Furthermore, the simple relationbetween local SAR and pulse shapes implies that the weighting factors introduced by the channel-dependentTikhonov regularization allow direct local and global SAR minimization (Chapter 5, Cloos et al. (2010c)).
To evaluate the global and local SAR produced by each of the considered transmission configurations,full wave (FEM) based electromagnetic field simulations were performed (Chapter 4; Chapter 5; Massireet al. (2012)). The head model used in this study consists of our in-house-developed FEM-compatibleimplementation of the 49-anatomical-structure model originally presented by Makris et al. (2008), convertedto a surface based model containing 20 different tissues (Section 4.7, Massire et al. (2012)). However, itshould be noted that the pulse design performance evaluated in this work was based on B+
1 -maps measuredwith the actual coil in-vivo. Due to variations in coil-loading and anatomical differences between the imagedvolunteers and simulated head-model, the obtained SAR profiles can only be considered to provide anindication towards typical distributions produced.
Setup
In the absence of the required switch and driving-matrices, the proposed setups can be emulated by a pTx-setup. For this proof-of-concept, experimental verification was performed on a Siemens 7T Magnetom scanner(Siemens Medical Systems, Erlangen, Germany), equipped with 8 separate transmit-channels. Although the8-channel system was limited to 1 kW per coil-element, the synthesized dTx and sTx systems were allowedup to 2 kW per driving mode. The same coil configuration and calibration methods were used as describedin Chapter 6. FA-maps obtained in 10 human volunteers were used to validate the concept by synthesizingthe proposed dTx and sTx systems. Informed consent was obtained from all subjects in accordance withguidelines of our institutional review board.
The first set of data (subject #1) was used to determine appropriate linear combinations to drive the 8 coil-elements from 2 independent transmit-pathways (Fig. 9.1). These combinations were then fixed to evaluatethe potential of the proposed methods(Fig. 9.2).
114

Results
Figure 9.2: B+1 -maps corresponding to the dual-channel system (based on the measured maps of the individ-
ual coil-elements for Subject #1). The two linear combinations are shown side by side in three orthogonalslices through the subject’s brain.
Pulse design
Using the synthesized systems, spokes (Saekho et al., 2006) and kT -points (Cloos et al., 2012) based excitationpulses were designed targeting a uniform excitation profile (FA = 5°) in the human brain. To this end, thespatial domain method (Grissom et al., 2006) was adopted in the framework of the magnitude least squaresapproach (Setsompop et al., 2008c) as described in Chapters 5 & 6. In order to incorporate the time-switchingnature of the sTx approach, the pulse design must enforce only a single active transmit-pathway at any giventime-step. Moreover, two sequential pulses have to be played at every kT -point or spoke to obtain a similarlevel of performance. Inactive channels are excluded by setting the corresponding matrix elements ai,j in A
(Eq. 5.2) to 0 (Section 5.2). Obtained excitation pulses were analyzed by numerical evaluation of the fullBloch equations including the measured DB0 evolution. Subsequently, the FA inhomogeneity was quantifiedby calculating the Normalized Root Mean Square Error (NRMSE) normalized to the mean FA obtained.
9.3 Results
Excitation uniformity
In order to facilitate the proposed dual-channel methods, one of the key requirements is the relative robustnessof the transmit-sensitivity profiles corresponding to the two modes in which the transmit-array coil is driven.Due to inter-subject variability, the actual resulting relative phase and effective currents in each of the coil-elements may vary. Regarding the 10 subjects evaluated thus far, the general shape of the transmit-sensitivityprofiles appears to be well preserved (Fig. 9.3). Nonetheless, substantial variations between subjects can beobserved. Considering the relative phases measured in the approximate center of each brain, phase variationsup to 10-20° were observed due to the differences in coil loading.
Based on transmit-sensitivity maps measured in a clinical 3-Tesla MRI system with a body RF coil (Magen-tom Tim Trio, Siemens Medical Systems, Erlangen, Germany), a reasonably uniform FA distribution maybe expected (Fig. 9.4a). On the other hand, a strong central brightening effect appears when employing theconventional birdcage mode at 7 Tesla (Fig. 9.4b – 29% NMRSE1). Confirming earlier findings (Cloos et al.,2012), the kT -points approach in the context of an 8-channel pTx-extension leads to an excellent FA unifor-mity throughout the brain (Fig. 9.4c – 5% NMRSE). The excitation fidelity thus obtained vastly exceeds thequality achieved with a conventional clinical 3-Tesla system. Merely driving the four most efficient circularlypolarized eigen-modes, only minimal deterioration in excitation fidelity was observed (Fig. 9.4d). Adopt-ing the proposed dTx-approach, the FA-uniformity is slightly more deteriorated (Fig. 9.4e – 9% NMRSE).Nonetheless, the obtained excitation fidelity still outperforms the benchmark set by the conventional clinicalMR setup at 3 Tesla (12% NMRSE). Constraining the available degrees of freedom even further by adoptingthe sTx-approach, a similar excitation quality is reached (Fig. 9.4f – 9% NMRSE).
1this pseudo-CP mode was found by aligning the phases of all channels in the center of the brain
115

Chapter 9.
Figure 9.3: Transmit-sensitivity profiles obtained for different subjects. The modes originally designed for thefirst subject were directly applied to each of the subsequent volunteers (axial slice in at gradient iso-center).
Figure 9.4: Synthesized FA distributions in the human brain (based on B+1 -mapping measurements from
individual pTx channels in Subject #8). a: Clinical 3-Tesla MRI setup with a body RF coil (12% NRMSE).b: Pseudo CP-mode at 7 Tesla (29% NRMSE). c: Eight-channel transmit system, patient-specific 7-kT-points tailored RF excitation (5% NRMSE). d: Four-channel transmit system, patient-specific 7-kT-pointstailored RF excitation (6% NRMSE). e: Dual-channel transmit system, patient-specific 7-kT-point-tailoredRF excitation (9% NRMSE). f : Serial-transmit system, patient-specific 7-kT-points tailored RF excitation(9% NRMSE).
116

Results
RF System Puls
eD
esig
n
Mea
nN
RM
SE
(%±
SD
)
Min
NR
MSE
(%)
Max
NR
MSE
(%)
Mea
nD
ura
tion
(ms±
SD
)
Tota
lE
ner
gy
(mJ±
SD
)
Conventional system Square 32.5±3.3 28.3 40.1 0.1±0.0 80±9
Eight channel RF shim Square 18.7±1.0 17.7 20.6 0.1±0.0 110±16
3D
pTx system 7–kT -points 5.1±0.2 5.0 5.7 0.49±0.01 148±13
mTx system 7–kT -points 6.7±0.8 5.6 8.3 0.49±0.01 134±35
dTx system 7–kT -points 9.2±1.0 7.8 10.8 0.50±0.01 241±35
sTx system 7–kT -points 9.3±1.0 7.8 10.7 0.62±0.02 337±79
2D
pTx system 4-Spokes 5.4±0.4 5.0 6.3 3.0±0.0 12.9±2.7
mTx system 4-Spokes 5.7±0.5 5.0 6.4 3.0±0.0 11.6±1.4
dTx system 4-Spokes 7.9±1.3 6.1 10.7 3.0±0.0 29.6±4.4
sTx system 4-Spokes 8.4±1.3 6.8 11.2 6.0±0.0 32.6±3.4
Table 9.1: Measured FA homogeneity and energy-balance obtained with different excitation pulse strategies.The CP-mode and RF-shim pulse amplitudes were scaled to produce an average of 5°. The spatial variationof the FA in different regions (Fore- & midbrain, Cerebellum, Total brain) of the brain is expressed as thestandard deviation as percentage of the mean. Total Energy: the total incident energy per RF excitation onall channels. MTE channel: the maximum total incident energy per pulse per channel.
A more extensive evaluation based on measurements performed in 10 different subjects is summarized inTable 9.1. Although in the context of the kT -points method the sTx-approach allows for a similar levelof performance as obtained with the dual-channel setup, the pulse durations are lengthened by almost25%. Considering a spoke-like pulse design, where the sub-pulse waveforms have a fixed duration, thereduced degrees of freedom available in the sTx-approach impaired the obtainable excitation fidelity dueto the inherently enhanced sensitivity to magnetic susceptibility effects. Nonetheless, adequate excitationuniformity could be obtained in all axial slices through the brain using only two sequential channels, albeita significant increase in both energy deposition and pulse duration (Table 9.1).
Safety considerations
Considering in-vivo applications, both the local and global SAR must be constrained to remain within safelimits (IEC, 2010). Although the time-averaged incident power at the coil level is not directly proportional tothe local SAR, it may be considered a first indication towards the global SAR. Compared to the conventionalquadrature excitation, all other transmission methods evaluated here demonstrated a reduced level of energyefficiency. However, considering the tailored waveforms assessed in this work, the added value of additionaltransmit pathways clearly represents itself as a reduction in energy deposition (Table 9.1).
Due to the possibility of high local SAR values, the spatial distribution of the energy deposition needs tobe considered. Whereas the conventional CP-mode demonstrates a maximum local to global SAR ratio ofapproximately a factor 3, the two dual modes demonstrate a ratio about 50% larger (Table 9.2). Therefore,considering the guidelines (Section 1.3; IEC (2010)), the maximum allowed incident power for each of thetransmit-pathways would be significantly smaller than in CP-mode due to the occurrence of localized RFhot-spots (Fig. 9.5).
However, the spatial distributions of the SAR produced by Mode 1 & Mode 2 are very different (Fig.9.5). Therefore, depending on the tailored RF-waveform, the time-averaged local SAR can be reducedsubstantially. Considering the modes used here, the time averaged optimal combination, corresponds to amaximum local SAR to global SAR ratio of 4.0. Although the simple relation between RF-waveform andlocal SAR allows this best-case scenario to be found easily, a typical 7-kT -point-based excitation producing
117

Chapter 9.
CP-mode Mode1 Mode2 sTx dTx mTx pTxMaximum local 10-g SAR / global SAR. 3.2 5.4 4.6 4.8 4.4 4.2 3.8
NRMSE for tailored pulses based 9.8% 9.8% 7.0% 5.4%
Table 9.2: Simulated global and peak 10-gram local SAR in the human head (W/kg). The sTx, dTx, mTxand pTx results correspond to 7-kT -point-based excitations targeting a 5° FA throughout the volume of thebrain.
Figure 9.5: Simulated 10-gram local SAR distributions in the human head (all on the same scale). Axialand corneal slices intersect with the hot spot corresponding to the maximum local SAR, while the positionof the sagittal slice was fixed through the center of the brain. Top to bottom: (a) circularly polarized mode,(b) the first transmit-pathway in the dTx and sTx approaches, (c) the second transmit-pathway in the dTxand sTx approaches.
adequate FA uniformity (9.8 %) resulted in a local to global SAR ratio of 4.8 (Table 9.2). On the other hand,the dTx-approach allows the interference patterns between the two modes to be exploited. Therefore theRF-energy can be distributed more favorably over the exposed volume while maintaining adequate excitationfidelity (local to global SAR ratio = 4.4) . Extending the available degrees of freedom to four independenttransmit-channels, again a slightly lower global to local SAR ratio was found. However, considering that thetotal energy required is reduced by almost a factor 2 (Table 9.1), the overall system can be considered muchless SAR-constrained than the dual channel approaches. Moreover, when driving all available coil-elementsindividually, the best excitation fidelity was achieved while most favorably distributing the RF energy overthe exposed volume (local to global SAR ratio = 3.8).
9.4 Discussion
Considering neuro-imaging applications where the excitation fidelity obtained with a clinical 3 Tesla MRsystem may be considered sufficient, the proposed dTx and sTx approaches allow adequate excitation uni-formity for clinical brain imaging at 7 Tesla. Therefore, the increased signal and contrast enhancementsprovided by the stronger main magnetic field can be accessed without deterioration of the excitation fidelity.This level of performance was achieved using only two distinct transmit-sensitivity profiles, by minimizingthe standard deviation of the sum of magnitudes of the two driving modes. Alternatively, considering thegood results obtained by driving an 8-channel coil with mode-compression, a logical choice for a dual chan-nel system would be to adopt only the two most efficient circularly polarized modes. However, based on
118

Discussion
the measured B+1 -maps for our current setup, it appears more difficult to obtain an adequate level of FA
uniformity in this way. This may in part be related to the design of our coil (Chapter 3). Other methodsto optimize the linear combinations used to drive the coil could be conceived, potentially providing furtherimprovements in excitation fidelity or more favorably distributing the energy over the exposed volume. Inparticular, considering the relatively high local SAR produced by the modes selected in this work, integrationof the electric field distributions in the optimization procedure may prove beneficial. However, consideringthe interferences produced by the superposition of modes in the dTx configuration, merely optimizing themodes as RF-shimming solutions independently of the pulse design may not be optimal (Zelinski et al.,2008a).
Although the performance of the dual channel systems could be considered adequate, appreciably betterFA uniformity could be obtained using either a 4 or 8-channel system. The increased degrees of freedomassociated with the additional transmit pathways allow the pulse duration to be shortened and energydeposition to be reduced. Moreover, adopting an 8-channel setup allows the energy to be distributed moreevenly over the exposed body, thereby reducing the local SAR compared to the 4-channel configuration.Therefore more RF-energy could be used while remaining in compliance with the safety guidelines whentransmitting on 8 independent transmit-channels.
In this work, only small-tip-angle excitations were considered. Whereas the benefits of the 8-channel pTx-system have been established in the large tip angle domain (Chapter 7), adequate performance of the dTx/sTx-approach has yet to be demonstrated for large angles. Initial results based on the optimal control approach(Xu et al., 2008) indicate that it is feasible to design such pulses at least up to 90. However the tradeoffbetween SAR minimization and excitation fidelity requires further investigation, especially when consideringthe high requirements associated with inversion and refocusing pulses.
In conclusion, we have demonstrated the feasibility of a minimalistic 2-channel setup to obtain adequateexcitations fidelity for clinical neuro-imaging applications at 7 Tesla in the framework of pTx. We evenshowed such a setup could be simplified to a serial mode configuration, where no pTx is needed, greatlyreducing the cost of the required hardware while still benefiting from the Transmit-SENSE pulse designapproach. However, although it is feasible to reduce the number of transmit-channels to a bare minimum,overly constraining the number of available transmit-channels may limit the applicability to SAR lenientprotocols only. Nonetheless, the excitation fidelity obtainable with two channels can easily be reduced to anapproximately 10% NRMSE. Although this is comparable to what can typically be expected with a clinicalsystem at 3 Tesla, a more extensive 4-channel pTx-implementation improves the excitation fidelity to anapproximately 6% NRMSE, while reducing the total energy deposition by a factor of 2.
119

Chapter 9.
120

10 Summary & Recommendations 10
In pursuit of increasingly better-resolved MR images, ever higher main magnetic field strengths are explored.While progressively ramping up the static field enhances the NMR signal (Ocali and Atalar, 1998), it si-multaneously increases the proton Larmor frequency. Considering clinical systems operating at 3 Tesla, thecorresponding RF wavelength already becomes comparable to the dimensions of the human body. As aresult, when investigating large organs such as the abdomen or thighs, zones of shade and losses of contrastbias the image (Bernstein et al., 2006). Migrating to 7-Tesla, the resulting RF non-uniformities are so strongthat contrast artifacts develop even in smaller regions such as the human brain. In anticipation of the first11.7 Tesla systems now in active development at NeuroSpin and NIH, it becomes increasingly urgent toprovide adequate solutions to mitigate these excitation non-uniformities. Otherwise, such ultra-high fieldsystems cannot reach their full potential.
To develop the techniques necessary to tackle the above-mentioned challenges, an 8-channel parallel trans-mission (pTx) setup was installed in our 7-Tesla MRI system. Whereas most clinical MRI systems only useone transmit-channel at a time, the pTx extension allows different RF waveforms to be played through mul-tiple channels in concert. Although this method provides great flexibility in RF-pulse design, it also allowsa plethora of RF-energy distributions to establish in the exposed body (Angelone et al., 2006). Consideringthat both the localized and global energy deposition has to be limited in order to ensure patient safety(IEC, 2010), RF waveforms that establish the desired excitation pattern without introducing so called RF“hot-spots” are desirable.
The additional degrees of freedom provided by the pTx extension can be used to steer the RF solutiontowards more favorable energy distributions. This was demonstrated in this work by iteratively optimizinga set of coil-dependent Tikhonov parameters to suppress RF hot-spots (Cloos et al., 2010c). Although thisintuitive approach was shown to be robust and computationally manageable, it generally imposes a smalldegradation in excitation fidelity. Recently more elaborate methods have been published allowing the RFsolution to be optimized while retaining a fixed level of performance (Brunner and Pruessmann, 2010; Leeet al., 2010). However, these methods are still limited to the small-tip-angle domain (Pauly and Nishimura,1989). Considering the robustness and flexibility provided by the optimal control approach (Xu et al., 2008),thorough integration of local and global specific absorption rate (SAR) constraints might be feasible evenwhen targeting arbitrary flip-angles (FA).
During this thesis, the management of local SAR in RF pulse design has mainly been a theoretical exercise toillustrate the flexibility of the pTx approach. So far, the application of such methods has been hampered bythe RF safety systems installed, whereby the phase of the power transmitted by each channel is not monitored.Although a practical approach for online SAR assessment was implemented, this conservative method doesnot allow the desirable effects of destructive E-field interferences to be exploited. Therefore, optimizing thetrue local SAR provides only limited advantages. However, more sophisticated SAR-management systemswill eventually make it possible to reap the benefits of local-SAR-constrained RF-pulse designs (Graesslin,2008; Gagoski et al., 2009). Nonetheless, our conservative approach did allow new pulse design strategies tobe validated in-vivo.
The kT -points RF pulse design, introduced in this work to homogenize the FA for volumetric applications,was extensively tested in the context of pTx enabled human brain imaging at 7 Tesla (Cloos et al., 2012).The principle idea is to constrain the sampled subset of excitation k-space locations to a sparse clustersurrounding the DC component. In this way, considering that the RF non-uniformities are dominated bylow spatial frequencies, limiting the excursions in k-space makes sure that no energy is “wasted” at highfrequency components that are of limited interest in the context of flip-angle homogenization. Moreover thetime required to cover the few kT -points is minimized, allowing short pulse durations to be obtained.
Ultimately, the real test for the kT -points method was to demonstrate the ability to retain excellent tissuecontrast when employed in fast 3D sequences such as the MP-RAGE (Mugler and Brookeman, 1990). Bygeneralizing the design to include inversion pulses with an optimal control approach, the SAR-intensiveadiabatic pulses could be replaced by the more efficient kT -points, restoring the expected contrast between

Chapter 10.
white and gray matter everywhere in the brain. These pTx-enabled inversions simultaneously improve imagequality, decrease the energy deposition, and reduce the pulse duration. Nonetheless, the increased magneticsusceptibility effects at 7 Tesla can still pose a challenge for the kT -point based inversion pulses. Although wehave shown that these effects can be mitigated provided that these regions are correctly incorporated into thepulse design, the quality of the final result now also depends strongly on the accuracy with which the regionof interest (ROI) is demarcated. Regarding applications in neuroimaging, dedicated software packages areavailable to extract the brain volume from high quality images. However, when defining the ROI to be usedduring pulse design, such images are typically not available. Therefore, such programs will have to make dowith a low-resolution poor-contrast image, for which they are not optimized. Despite of these non-optimalconditions, we showed that it is possible to automate the ROI demarcation process. Nonetheless, furtherimprovements in robustness are desirable.
In the work presented here, only gradient-recalled sequences were considered. To extend the scope of thekT -points, the design should be generalized to encompass refocusing pulses. Currently, the first steps havebeen set to incorporate the kT -point design into non-selective spin-echo-based methods such as the SPACEsequence (Mugler et al., 2000).
Returning our focus to RF-pulse design, our optimal control approach so far starts with a small-tip-angle-based solution as an initial guess. However this imposes severe limitations on the optimized solution: thefound local minimum of the cost function is not guaranteed to be near the global optimum. Moreover,including the k-space trajectory as a set of parameters in the optimization makes the search even morechallenging. Intuitively, it seems that by improving the large FA design method, the energy deposition couldbe reduced even further.
Finally, the pTx implementation itself was reconsidered. Although we were able to demonstrate excellentresults with an 8-channel pTx-extension, the costs and technical experience needed to operate the system area concern for routine operations. Therefore, several simplified implementations were investigated to evaluatethe potential of a more cost-effective setup with a reduced number of transmit pathways. These initialresults showed that, at least in the small-tip-angle regime, 2 parallel (or even sequential) transmit channelsare sufficient to homogenize the FA throughout the human brain at 7 Tesla. So far these initial experimentsare limited to Bloch simulations based on B+
1 -maps measured in-vivo with a full-scale pTx system. One ofthe next steps is to implement the hardware to physically drive an N-element transmit array coil using only2 parallel transmit pathways. In addition, to enhance the applicability of this approach in a more clinicallyoriented setting, this concept should be evaluated in other parts of the body and targeting all possible FA.In particular, focusing on the most desired clinical applications, it should be investigated whether the SARlimitations imposed by a 2-channel system are sufficiently lenient or if a larger set of channels is required.
122

A Bibliography 0
Abraham, T., May 2011. Evolution of brain imaging instrumentation. Semin. Nucl. Med. 41 (3), 202–219.
Adriany, G., van de Moortele, P.-F., Wiesinger, F., Moeller, S., Strupp, J. P., Andersen, P., Snyder, C.,Zhang, X., Chen, W., Pruessmann, K. P., Boesiger, P., Vaughan, T., Ugurbil, K., Feb. 2005. Transmitand receive transmission line arrays for 7 Tesla parallel imaging. Magn. Res. Med. 53 (2), 434–445.
Akoka, S., Franconi, F., Seguin, F., Le Pape, A., 1993. Radiofrequency map of an NMR coil by imaging.Magn. Res. Med. 11 (3), 437–441.
Alagappan, V., Nistler, J., Adalsteinsson, E., Setsompop, K., Fontius, U., Zelinski, A., Vester, M., Wiggins,G. C., Hebrank, F., Renz, W., Schmitt, F., Wald, L. L., 2007. Degenerate mode band-pass birdcage coilfor accelerated parallel excitation. Magn. Res. Med. 57 (6), 1148–1158.
Alagappan, V., Setsompop, K., Polimeni, J., Potthast, A., Zelinski, A., Wiggins, G., Fontius, U., Schmitt,F., Adalsteinsson, E., Wald, L., 2008. Mode compression of transmit and receive arrays for parallel imagingat 7T. In: Proc. Intl. Soc. Mag. Reson. Med. Toronto, p. 619.
Alon, L., Deniz, C. M., Sodickson, D. K., Zhu, Y., Nov. 2011. Do constrains on |B1+| also constrain |E| andSAR in high field MR? In: Proc. Intl. Soc. Mag. Reson. Med. Montreal, p. 491.
Alperin, N., Vikingstad, E., Gomez Anson, B., Levin, D., 1996. Hemodynamically independent analysis ofcerebrospinal fluid and brain motion observed with dynamic phase contrast MRI. Magn. Res. Med. 35 (5),741–754.
Amadon, A., Boulant, N., 2008. Simultaneous measurement of B0- and B1-maps with modified Actual FlipAngle Imaging sequence. In: Proc. Intl. Soc. Mag. Reson. Med. Toronto, p. 1248.
Amadon, A., Boulant, N., Cloos, M. A., Giacomini, E., Wiggins, C. J., Luong, M., Ferrand, G., Fautz, H.-P.,2010. B1 mapping of an 8-channel TX-array over a human-head-like volume in less than 2 minutes: theXEP sequence. In: ISMRM. p. 2828.
Amadon, A., Cloos, M. A., 2010. Method And Apparatus For Compensating For B1 Inhomogeneity In Mag-netic Resonance Imaging By Nonselective Three-Dimensional Tailored RF Pulses. Patent: EU (10290205).
Amadon, A., Cloos, M. A., Boulant, N., Hang, M.-F., Wiggins, C. J., Fauzt, H.-P., 2012. Validation of avery fast B1-mapping sequence for parallel transmission on a human brain at 7T. In: Proc. Intl. Soc. Mag.Reson. Med. Melbourne, p. in press.
Angelone, L., Makris, N., Vasios, Christos ans Wald, L., Giorgio, B., 2006. Effect of Transmit Array PhaseRelationship on Local Specific Absorption Rate (SAR). In: Proc. Intl. Soc. Mag. Reson. Med. Seattle, p.2038.
Ardekani, B. A., Guckemus, S., Bachman, A., Hoptman, M. J., Wojtaszek, M., Nierenberg, J., 2005. Quan-titative comparison of algorithms for inter-subject registration of 3D volumetric brain MRI scans. J.Neurosci. Methods. 142 (1), 67–76.
Ashburner, J., Friston, K. J., 2005. Unified segmentation. NeuroImage 26 (3), 839–851.
Barna, J., Arezzo, J., Vaughan Jr, H., 1981. A new multielectrode array for the simultaneous recording offield potentials and unit activity. Electroencephalogr. Clin. Neurophysiol. 52 (5), 494–496.
Baum, J., Tycko, R., Pines, A., 1985. Broadband and adiabatic inversion of a two-level system by phase-modulated pulses. Phys. Rev. A 32 (6), 3435–3447.
Bazaraa, M. S., Sherali, H. D., Shetty, C. M., 1993. Nonlinear Programming: Theory and Algorithms, 2ndEdition, 2nd Edition. Wiley.

Bibliography
Bernstein, M., Huston III, J., Ward, H., 2006. Imaging artifacts at 3.0 T. J. Magn. Reson. Imaging. 24 (4),735–746.
Bernstein, M., King, K., Zhou, X., 2004. Handbook of MRI Pulse Sequences. 2004. Elsevier Academic Press,Burlington, MA.
Bloch, F., 1946. Nuclear Induction. Phys. Rev. 70 (7 and 8), 460–474.
Bottomley, P. A., Andrew, E. R., 1978. RF magnetic field penetration, phase shift and power dissipation inbiological tissue: implications for NMR imaging. Phys. Med. Biol. 23 (4), 630–643.
Boulant, N., 2009. T1 and T2 effects during radio-frequency pulses in spoiled gradient echo sequences. J.Magn. Reson. 197 (2), 213–218.
Boulant, N., Cloos, M., Amadon, A., 2010a. A simple and analytical way to correct for B0 inhomogeneity inthe evaluation of B1 maps relying on flip angle measurements and nons-elective square pulses. In: Proc.Intl. Soc. Mag. Reson. Med. Stockholm, p. 4918.
Boulant, N., Cloos, M., Amadon, A., Ferrand, G., Luong, M., Wiggins, C., Le Bihan, D., Hoult, D. I., 2010b.Flip angle and SAR maps induced by a head displacement in parallel transmission and with Cartesianfeedback. In: Proc. Intl. Soc. Mag. Reson. Med. Stiockholm, p. 1453.
Boulant, N., Cloos, M., Luong, M., Ferrand, G., Wiggins, C., Amadon, A., 2011. Method for monitoringsafety in parallel transmission systems based on channel-dependent average powers. In: Proc. Intl. Soc.Mag. Reson. Med. Montreal, p. 3850.
Boulant, N., Hoult, D. I., 2012. High tip angle approximation based on a modified Bloch-Riccati equation.Magn. Res. Med., in press.
Boulant, N., Le Bihan, D., Amadon, A., 2008. Strongly modulating pulses for counteracting RF inhomo-geneity at high fields. Magn. Res. Med. 60 (3), 701–708.
Boulant, N., Mangin, J.-F., Amadon, A., 2009. Counteracting radio frequency inhomogeneity in the humanbrain at 7 Tesla using strongly modulating pulses. Magn. Res. Med. 61 (5), 1165–1172.
Breyer, T., Wanke, I., Maderwald, S., Woermann, F., Kraff, O., Theysohn, J., Ebner, A., Forsting, M.,Ladd, M., Schlamann, M., 2010. Imaging of patients with hippocampal sclerosis at 7 Tesla: initial results.Acad. Radiol. 17 (4), 421–426.
Brunner, D., Pruessmann, K., 2008. A matrix approach for mapping array transmit fields in under a minute.In: Proc. Inl. Soc. Mag. Reson. Med. Toronto, p. 354.
Brunner, D. O., de Zanche, N., Fröhlich, J., Paska, J., Pruessmann, K. P., 2009. Travelling-wave nuclearmagnetic resonance. Nature 457 (7232), 994–998.
Brunner, D. O., Paska, J., Froehlich, J., Pruessmann, K., 2008. SAR assesment of transmit arrays: Deter-ministic calculation of worst- and best-case performance. In: Proc. Inl. Soc. Mag. Reson. Med. p. 4803.
Brunner, D. O., Pruessmann, K. P., 2010. Optimal design of multiple-channel RF pulses under strict powerand SAR constraints. Magn. Res. Med. 63 (5), 1280–1291.
Bryson, J. A. E., Ho, Y.-C., 1975. Applied Optimal Control: Optimization, Estimation and Control. Taylor& Francis.
Buchenau, S., Haas, M., Hennig, J., Zaitsev, M., 2010. On the SAR averaging nature of parallel excitationpulses and its impact on conservative worst-case analysis. In: Proc. Inl. Soc. Mag. Reson. Med. Stockholm,p. 3884.
Buonomano, D., Merzenich, M., 1998. Cortical plasticity: from synapses to maps. Annu. Rev. Neurosci.21 (1), 149–186.
Busse, R. F., Hariharan, H., Vu, A., Brittain, J. H., 2006. Fast spin echo sequences with very long echotrains: design of variable refocusing flip angle schedules and generation of clinical T2 contrast. Magn. Res.Med. 55 (5), 1030–1037.
124

Bibliography
Butler, J., Lowe, R., 1961. Beam-forming matrix simplifies design of electronically scanned antennas. Elec-tron. Des. 9 (8), 170–173.
Cao, Y., Vikingstad, E., Huttenlocher, P., Towle, V., Levin, D., 1994. Functional magnetic resonance studiesof the reorganization of the human hand sensorimotor area after unilateral brain injury in the perinatalperiod. Proc. Nat. Acad. Sci. 91 (20), 9612.
Carr, H., 1952. Free Precession Techniques in Nuclear Magnetic Resonance. Ph.D. thesis, Reprinted inEncyclopedia of Nuclear Magnetic Resonance, Vol.I, J.Wiley & Sons 1996, Boston.
Carr, H., Purcell, E., 1954. Effects of Diffusion on Free Precession in Nuclear Magnetic Resonance Experi-ments*t. Phys. Rev. 3, 630–638.
Cheung, K. C., 2007. Implantable microscale neural interfaces. Biomed. Microdevices. 9 (6), 923–938.
Chung, S., Kim, D., Breton, E., 2010. Rapid B1+ mapping using a preconditioning RF pulse with Tur-boFLASH readout. Magn. Res. Med. 64 (2), 439–446.
Cloos, M. A., Bonmassar, G., 2009. Towards Direct B1 Based Local SAR Estimation. In: Proc. Intl. Soc.Mag. Reson. Med. Honolulu, p. 2966.
Cloos, M. A., Boulant, N., Ferrand, G., Luong, M., Wiggins, C. J., Le Bihan, D., Amadon, A., 2011a. T1-nonlinearity corrections for fast Transmit-Array B1+-mapping of the human brain in the small-tip-angleregime. In: Proc. Intl. Soc. Mag. Reson. Med. Montreal, p. 4409.
Cloos, M. A., Boulant, N., Luong, M., Ferrand, G., Bihan, D. L., Amadon, A., 2010a. Specific absorptionrate monitor for in-vivo parallel transmission at 7 Tesla. In: Proc. Intl. Soc. Mag. Reson. Med. Stockholm,p. 3871.
Cloos, M. A., Boulant, N., Luong, M., Ferrand, G., Giacomini, E., Le Bihan, D., Amadon, A., 2012. k(T) -points: Short three-dimensional tailored RF pulses for flip-angle homogenization over an extended volume.Magn. Res. Med. 67 (1), 72–80.
Cloos, M. A., Boulant, N., Luong, M., Ferrand, G., Wiggins, C. J., Giacomini, E., France, A., Bihan, D. L.,Amadon, A., 2010b. Kt points: Fast Three-Dimensional Tailored RF Pulses for flip-angle homogenizationover an extended volume. In: Proc. Intl. Soc. Mag. Reson. Med. Stockholm, p. 102.
Cloos, M. A., Ferrand, G., Boulant, N., Luong, M., Wiggins, C. J., Le Bihan, D., Amadon, A., 2011b.Dual-channel transmit-SENSE for flip-angle homogenization in the human brain at 7 Tesla: a feasibilitystudy. In: Proc. Intl. Soc. Mag. Reson. Med. Stockholm, p. 325.
Cloos, M. A., Luong, M., Ferrand, G., Amadon, A., Le Bihan, D., Boulant, N., 2010c. Local SAR reductionin parallel excitation based on channel-dependent Tikhonov parameters. J. Magn. Reson. Imaging. 32 (5),1209–1216.
Collins, C. M., Smith, M. B., 2001. Signal-to-noise ratio and absorbed power as functions of main magneticfield strength, and definition of "90 degrees " RF pulse for the head in the birdcage coil. Magn. Res. Med.45 (4), 684–691.
Collins, C. M., Zhangwei, W., Smith, M. B., 2007. A Conservative Method for Ensuring Safety WithinTransmit Arrays. In: Proc. Intl. Soc. Mag. Reson. Med. Berlin, p. 1092.
Conolly, S., Nishimura, D., Macovski, A., 1986. Optimal control solutions to the magnetic resonance selectiveexcitation problem. IEEE Trans Med Imaging. 5 (2), 106–115.
Cunningham, C. H., Pauly, J. M., Nayak, K. S., 2006. Saturated double-angle method for rapid B1+ mapping.Magn. Res. Med. 55 (6), 1326–1333.
Deichmann, R., Good, C. D., Josephs, O., Ashburner, J., Turner, R., 2000. Optimization of 3D MP-RAGEsequences for structural brain imaging. Neuroimage 12 (1), 112–127.
125

Bibliography
Dickerson, B. C., Bakkour, A., Salat, D. H., Feczko, E., Pacheco, J., Greve, D. N., Grodstein, F., Wright,C. I., Blacker, D., Rosas, H. D., Sperling, R. A., Atri, A., Growdon, J. H., Hyman, B. T., Morris,J. C., Fischl, B., Buckner, R. L., 2009. The Cortical Signature of Alzheimer’s Disease: Regionally SpecificCortical Thinning Relates to Symptom Severity in Very Mild to Mild AD Dementia and is Detectable inAsymptomatic Amyloid-Positive Individuals. Cerebral Cortex 19 (3), 497–510.
Duensing, G., Peterson, D., Wolverton, B., Fitzsimmons, J., 1998. Transcieve Phased Array Design forImaging at 3.0T. In: Proc. Intl. Soc. Mag. Reson. Med. Sydney.
Eichfelder, G., Gebhardt, M., 2011. Local specific absorption rate control for parallel transmission by virtualobservation points. Magn. Res. Med. 66 (5), 1468–1476.
Fautz, H., Vogel, M., Gross, P., Kerr, A., Zhu, Y., 2008. B1 mapping of coil arrays for parallel transmission.In: Proc. Int. Mag. Reson. Med. Torronto, p. 1247.
Feinberg, D., Hoenninger, J., Crooks, L., Kaufman, L., Watts, J., Arakawa, M., 1985a. Inner Volume MRImaging: Technical Concepts and their Applications. Radiology 156 (3), 743–747.
Feinberg, D., Mills, C., Posin, J., Ortendahl, D., Crooks, L., Watts, J., Kaufman, L., Arakawa, M., Hoen-ninger, J., Brant-Zawadzki, M., 1985b. Multiple spin-echo magnetic resonance imaging. Radiology 155 (2),437–442.
Ferrand, G., Luong, M., Amadon, A., Cloos, M. A., Giacomini, E., Darrasse, L., 2012. Generalized double-acquisition imaging for radiofrequency inhomogeneity mitigation in high-field MRI: Experimental proofand performance analysis. Magn. Res. Med. 67 (1), 175–182.
Ferrand, G., Luong, M., Cloos, M. A., France, A., Amadon, A., Boulant, N., Darrasse, L., 2011. SVD-basedHardware Concept to Drive N Transmit Elements of a Phased Array Coil with M<N Channels for HeightField MRI. In: Proc. Intl. Soc. Mag. Reson. Med. Montreal, p. 3888.
Ferrand, G., Luong, M., France, A., 2010. Antenne pour systeme IRM. Patent: EU (1050905).
Fischl, B., Dale, A., 2000. Measuring the thickness of the human cerebral cortex from magnetic resonanceimages. Proc. Natl. Acad. Sci. USA. 97 (20), 11050–11055.
Friston, K., Ashburner, J., Frith, C., Poline, J., Heather, J., Frackowiak, R. S. J., 1995. Spatial registrationand normalization of images. Human brain mapping 3 (3), 165–189.
Fukunaga, K., Watanabe, S., Sato, K., 2005. Dielectric properties of non-toxic tissue-equivalent liquids forradiowave safety tests. In: IEEE Int. Conf. on Dielectric Liquids.
Gabriel, S., Lau, R. W., Gabriel, C., 1996. The dielectric properties of biological tissues: II. Measurementsin the frequency range 10 Hz to 20 GHz. Phys. Med. Biol. 41 (11), 2251–2269.
Gagoski, B. A., Gumbrecht, R., Hamm, M., Setsompop, K., Keil, B., Lee, J., Makhoul, K., Mareyam, A.,Fujimoto, K., Witzel, T., Fontius, U., Pfeuffer, J., Adalsteinsson, E., Wald, L. L., 2009. Real time RFmonitoring in a 7T parallel transmit system. In: Proc. Intl. Soc. Mag. Reson. Med. Stockholm, p. 781.
Graesslin, I., 2008. Parallel Transmission: A Comprehensive RF Safety Concept. In: Proc. PIERS. Boston,pp. 698–700.
Graesslin, I., Biederer, S., Annighoefer, B., Homann, H., Stahl, H., Vernickel, B., Katscher, U., Glaesel, D.,Harvey, P., 2009. Real-time global and local SAR monitoring for parallel transmission systems. In: Proc.Intl. Soc. Mag. Reson. Med. Honolulu, p. 302.
Graesslin, I., Schweser, F., Annighoefer, B., Biederer, S., Katscher, U., Nehrke, K., Stahl, H., Dingemans,H., Mens, G., Brnert, P., 2008. A minimum SAR RF pulse design approach for parallel Tx with local hotspot suppression and exact fidelity constraint. In: Proc. Intl. Soc. Mag. Reson. Med. Toronto, p. 621.
Griffiths, D. J., 1994. Introduction to Quantum Mechanics, 3rd Edition. Prentice Hall.
Grinvald, A., Slovin, H., Vanzetta, I., 2000. Non-invasive visualization of cortical columns by fMRI. Nat.Neurosci. 3 (2), 105–107.
126

Bibliography
Grissom, W., Yip, C.-y., Zhang, Z., Stenger, V. A., Fessler, J. A., Noll, D. C., 2006. Spatial domain methodfor the design of RF pulses in multicoil parallel excitation. Magn. Res. Med. 56 (3), 620–629.
Grissom, W. A., Pauly, J., 2010. Joint Design of Dual-Band Large-Tip-Angle RF and Gradient Waveformsin Parallel Excitation. In: Proc. Inl. Soc. Mag. Reson. Med. Stockholm, p. 99.
Grissom, W. A., Xu, D., Kerr, A. B., Fessler, J. A., Noll, D. C., 2009. Fast large-tip-angle multidimensionaland parallel RF pulse design in MRI. IEEE Trans. Med. Imaging. 28 (10), 1548–1559.
Grissom, W. A., Yip, C.-y., Wright, S. M., Fessler, J. A., Noll, D. C., 2008. Additive angle method for fastlarge-tip-angle RF pulse design in parallel excitation. Magn. Res. Med. 59 (4), 779–787.
Griswold, M. A., Jakob, P. M., Heidemann, R. M., Nittka, M., Jellus, V., Wang, J., Kiefer, B., Haase,A., 2002. Generalized autocalibrating partially parallel acquisitions (GRAPPA). Magn. Res. Med. 47 (6),1202–1210.
Gur, R., Mozley, P., Resnick, S., Gottlieb, G., Kohn, M., Zimmerman, R., Herman, G., Atlas, S., Grossman,R., Berretta, D., 1991. Gender differences in age effect on brain atrophy measured by magnetic resonanceimaging. Proc. Natl. Acad. Sci. USA. 88 (7), 2845.
Haacke, E. M., Brown, R. W., Thompson, M. R., Venkatesan, R., Jun. 1999. Magnetic Resonance Imaging:Physical Principles and Sequence Design, 1st Edition. Wiley-Liss.
Haase, A., Frahm, J., Matthaei, D., Hanicke, W., Merboldt, K., 1986. FLASH imaging. Rapid NMR imagingusing low flip-angle pulses. J. Magn. Reson. 67 (2), 258–266.
Hahn, E., 1950a. Nuclear induction due to free Larmor precession. Phys. Rev. 77 (2), 297–298.
Hahn, E., 1950b. Spin echoes. Phys. Rev. 80 (4), 58.
Han, X., Jovicich, J., Salat, D., van der Kouwe, A., Quinn, B., Czanner, S., Busa, E., Pacheco, J., Albert,M., Killiany, R., Maguire, P., Rosas, D., Makris, N., Dale, A., Dickerson, B., Fischl, B., 2006. Reliabilityof MRI-derived measurements of human cerebral cortical thickness: the effects of field strength, scannerupgrade and manufacturer. NeuroImage 32 (1), 180–194.
Hansen, P. C., 1992. Analysis of Discrete Ill-Posed Problems by Means of the L-Curve. SIAM Rev. 34 (4),561–580.
Hornak, J. P., Szumowski, J., Bryant, R. G., 1988. Magnetic field mapping. Magn. Res. Med. 6 (2), 158–163.
Hoult, D., 2000a. Sensitivity and Power Deposition in a High-Field Imaging Experiment. J. Magn. Reson.Imaging. 12 (1), 46–67.
Hoult, D., 2000b. The principle of reciprocity in signal strength calculations: a mathematical guide. ConceptMagnetic Res. 12 (4), 173–187.
Hoult, D., Bhakar, B., 1997. NMR signal reception: virtual photons and coherent spontaneous emission.Concept Magnetic Res. 9 (5), 277–297.
Hoult, D., Lauterbur, P.C., 1979. The sensitivity of the zeugmatographic experiment involving human sam-ples. J. Magn. Reson. 34 (2), 425–433.
Hoult, D. I., Kolansky, G., Kripiakevich, D., King, S. B., 2004. The NMR multi-transmit phased array: aCartesian feedback approach. J. Magn. Reson. 171 (1), 64–70.
Ibrahim, T. S., Abduljalil, A. M., Baertlein, B. A., Lee, R., Robitaill, P. M., 2001a. Analysis of B1 fieldprofiles and SAR values for multi-strut transverse electromagnetic RF coils in high field MRI applications.Phys. Med. Biol. 46 (10), 2545–2555.
Ibrahim, T. S., Lee, R., Abduljalil, A. M., Baertlein, B. A., Robitaille, P.-M.-L., 2001b. Dielectric res-onances and B(1) field inhomogeneity in UHFMRI: computational analysis and experimental findings.Magn. Reson. Imaging. 19 (2), 219–226.
127

Bibliography
IEC, Dec. 2002. International Electrotechnical Commission. International standard, medical electrical equip-ment. Part 2. Particular requirements for the safety of magnetic resonance equipment for medical diagnosis,2nd ed. . Geneva: International Electrotechnical Commission.
IEC, Mar. 2010. International Electrotechnical Commission. International standard, medical electrical equip-ment. Part 2. Particular requirements for the safety of magnetic resonance equipment for medical diagnosis,3nd ed. . Geneva: International Electrotechnical Commission.
Jankiewicz, M., Zeng, H., Moore, J. E., Anderson, A. W., Avison, M. J., Welch, E. B., Gore, J. C., 2010.Practical considerations for the design of sparse-spokes pulses. J. Magn. Reson. 203 (2), 294–304.
Jaynes, E., 1955. Matrix treatment of nuclear induction. Phys. Rev. 98 (4), 1099–1105.
Jin, J., Sep. 1998. Electromagnetic Analysis and Design in Magnetic Resonance Imaging (Biomedical Engi-neering), 1st Edition. CRC Press.
Kassakian, P., 2006. Convex Approximation and Optimization with Applications in Magnitude Filter Designand Radiation Pattern Synthesis. Ph.D. thesis, University of California at Berkeley.
Katscher, U., Boernert, P., Leussler, C., 2003. Transmit sense. Magn. Res. Med. 49 (1), 144–150.
Katscher, U., Lisinski, J., Börnert, P., 2010. RF encoding using a multielement parallel transmit system.Magn. Res. Med. 63 (6), 1463–1470.
Katscher, U., Röhrs, J., Bornert, P., 2005. Basic considerations on the impact of the coil array on theperformance of Transmit SENSE. Magma 18 (2), 81–88.
Katscher, U., Vernickel, P., Graesslin, I., Boernert, P., 2007. RF Shimming Using a Multi-Element TransmitSystem in Phantom and In Vivo Studies. In: Proc. Intl. Soc. Mag. Reson. Med. Berlin, p. 1693.
Katscher, U., Voigt, T., Findeklee, C., Nehrke, K., Weiss, S., Doessel, O., 2008. Estimation of local SARusing B1 mapping. In: Proc. Intl. Soc. Mag. Reson. Med. Toronto, p. 1191.
Kerr, A. B., Zhu, Y., Pauly, J. M., 2007. Phase Constraint Relaxation in Parallel Excitation Pulse Design.In: Proc. Inl. Soc. Mag. Reson. Med. Berlin, p. 1694.
Kini, L., Wald, L. L., Adalsteinsson, E., 2009. Fast E1, B1 and SAR simulation with the use of graphicsprocessors. In: Proc. Intl. Soc. Mag. Reson. Med. Honolulu, p. 4776.
Kirk, G. R., Haynes, M. R., Palasis, S., Brown, C., Burns, T. G., McCormick, M., Jones, R. A., 2009.Regionally Specific Cortical Thinning in Children with Sickle Cell Disease. Cerebral Cortex 19 (7), 1549–1556.
Kozlov, M., Turner, R., 2009. Fast MRI coil analysis based on 3-D electromagnetic and RF circuit co-simulation. J. Magn. Reson. 200 (1), 147–152.
Kozlov, M., Turner, R., 2011. Analysis of RF Transmit Performance for a 7T Dual Row Multi-Channel MRILoop Array. In: Conf Proc IEEE Eng Med Biol Soc. Boston, pp. 547–53.
Kumar, A., Welti, D., Ernst, R., 1975. NMR Fourier zeugmatography. J. Magn. Reson. 18 (1), 69–83.
Kuroda, K., Oshio, K., Chung, A. H., Hynynen, K., Jolesz, F. A., 1997. Temperature mapping using thewater proton chemical shift: a chemical shift selective phase mapping method. Magn. Res. Med. 38 (5),845–851.
Lattanzi, R., Sodickson, D. K., Grant, A. K., Zhu, Y., 2009. Electrodynamic constraints on homogeneityand radiofrequency power deposition in multiple coil excitations. Magn. Res. Med. 61 (2), 315–334.
Lauterbur, P.C., 1973. Image formation by induced local interactions: examples employing nuclear magneticresonance. Nature 242 (5394), 190–191.
Lauterbur, P.C., 1974. Magnetic resonance zeugmatography. Pure Appl. Chem 40 (1-2), 149–157.
Lee, D., Lustig, M., Grissom, W. A., Pauly, J. M., 2009. Time-optimal design for multidimensional andparallel transmit variable-rate selective excitation. Magn. Res. Med. 61 (6), 1471–1479.
128

Bibliography
Lee, J., Gebhardt, M., Wald, L. L., Adalsteinsson, E., 2010. Parallel Transmit RF Design with Local SARConstraints. In: Proc. Intl. Soc. Mag. Reson. Med. Stockholm, p. 105.
Liu, Y., Feng, K., McDougall, M. P., Wright, S. M., Ji, J., 2008. Reducing SAR in parallel excitation usingvariable-density spirals: a simulation-based study. Magn. Res. Med. 26 (8), 1122–1132.
Ma, C., Xu, D., King, K. F., Liang, Z.-P., 2010. Joint Design of Spoke Trajectories and RF Pulses for ParallelExcitation. Magn. Res. Med. 65 (4), 973–985.
Maier, S., Hardy, C., Jolesz, F. A., 1994. Brain and cerebrospinal fluid motion: real-time quantification withM-mode MR imaging. Radiology 193 (2), 477–483.
Makris, N., Angelone, L. M., Tulloch, S., Sorg, S., Kaiser, J., Kennedy, D., Bonmassar, G., 2008. MRI-basedanatomical model of the human head for specific absorption rate mapping. Med. Biol. Eng. Comput.46 (12), 1239–1251.
Malik, S. J., Keihaninejad, S., Hammers, A., Hajnal, J. V., 2012. Tailored excitation in 3d with spiralnonselective (spins) rf pulses. Magn. Res. Med. 67, 1303–15.
Mansfield, P., 1977. Multi-planar image formation using NMR spin echoes. J. Phys. C: Solid State Phys. 10,L55.
Mansfield, P., Maudsley, A., 1976. Planar spin imaging by NMR. J. Phys. C: Solid State Phys. 9, L409.
Mao, W., Smith, M. B., Collins, C. M., 2006. Exploring the limits of RF shimming for high-field MRI of thehuman head. Magn. Res. Med. 56 (4), 918–922.
Mao, W., WANG, Z., Smith, M., 2007. Calculation of SAR for transmit coil arrays. Concept Magn. Reson.B. 31 (2), 127–131.
Marques, J. P., Kober, T., Krueger, G., van der Zwaag, W., van de Moortele, P.-F., Gruetter, R., 2010.MP2RAGE, a self bias-field corrected sequence for improved segmentation and T1-mapping at high field.NeuroImage 49 (2), 1271–1281.
Massire, A., Cloos, M. A., Luong, M., Amadon, A., Vignaud, A., Wiggins, C. J., Feb. 2012. Thermalsimulations in the human head for high field MRI using parallel transmission. J. Magn. Reson. Imaging.,in press.
Matson, G., Liu, H., 2010. Computer Simulations of 3D MPRAGE in Human Brain with Inclusion ofInadvertent Magnetization Transfer Effects. In: Proc. Intl. Soc. Mag. Reson. Med. Stockholm, p. 3008.
Meiboom, S., Gill, D., 1958. Modified Spin-Echo Method for Measuring Nuclear Relaxation Times. Rev. Sci.Instrum. 29 (8), 688–691.
Metzger, G. J., Snyder, C., Akgun, C., Vaughan, T., Ugurbil, K., van de Moortele, P.-F., 2008. Local B1+shimming for prostate imaging with transceiver arrays at 7T based on subject-dependent transmit phasemeasurements. Magn. Res. Med. 59 (2), 396–409.
Meyer, J., Roychowdhury, S., 1996. Location of the central sulcus via cortical thickness of the precentral andpostcentral gyri on MR. AJNR Am. J. Neuroradiol. 17 (9), 1699–1706.
Minkoff, L., Damadian, R., Thomas, T. E., Hu, N., Goldsmith, M., Koutcher, J., Stanford, M., 1977. NMRin cancer: XVII. dewar for a 53-inch superconducting NMR magnet. Physiol. Chem. Phys. 9 (1), 101–104.
Mugler, J., Brookeman, J., 1990. Three-dimensional magnetization-prepared rapid gradient-echo imaging(3D MP RAGE). Magn. Res. Med. 15 (1), 152–157.
Mugler, J. P., Bao, S., Mulkern, R. V., Guttmann, C. R., Robertson, R. L., Jolesz, F. A., Brookeman, J. R.,2000. Optimized single-slab three-dimensional spin-echo MR imaging of the brain. Radiology 216 (3),891–899.
Nehrke, K., 2009. On the steady-state properties of actual flip angle imaging (AFI). Magn. Res. Med. 61 (1),84–92.
129

Bibliography
Nehrke, K., Bornert, P., 2010. Eigenmode analysis of transmit coil array for tailored b1 mapping. Magn.Reson. Med. 63 (3), 754–764.
Nelder, J., Mead, R., 1965. A simplex method for function minimization. Comput. J. 7 (4), 308–313.
Nowakowski, R. S., 2006. Stable neuron numbers from cradle to grave. Proc. Natl. Acad. Sci. USA. 103 (33),12219–12220.
Ocali, O., Atalar, E., 1998. Ultimate intrinsic signal-to-noise ratio in MRI. Magn. Res. Med. 39 (3), 462–473.
Ohanian, H., 1986. What is spin? Am. J. Phys. 54 (6), 500–505.
Ohliger, M. A., Sodickson, D. K., 2006. An introduction to coil array design for parallel MRI. NMR Biomed.19 (3), 300–315.
Oppelt, A., 1986. FISP-a new fast MRI sequence. Electromedica 54 (1), 15–18.
Pauly, J., Le Roux, P., Nishimura, D., Macovski, A., 1991. Parameter relations for the Shinnar-Le Rouxselective excitation pulse design algorithm [NMR imaging]. IEEE Trans. Med. Imaging. 10 (1), 53–65.
Pauly, J., Nishimura, D., Macovski, A., 1989. A linear class of large-tip-angle selective excitation pulses. J.Magn. Reson. 82 (3), 571–587.
Pauly, J. M., Nishimura, D., 1989. A k-space analysis of small-tip-angle excitation. J. Magn. Reson. 81 (1),43–56.
Pohmann, R., 2011. An experimental comparison of B1-mapping Techniques at two field strengths. In: Proc.Inl. Soc. Mag. Reson. Med. Montreal, p. 4410.
Pruessmann, K., Weiger, M., Scheidegger, M., 1999. SENSE: sensitivity encoding for fast MRI. Magn. Res.Med. 42 (5), 952–962.
Robitaille, P.-M., Berliner, L., 2006. Ultra High Field Magnetic Resonance Imaging (Biological MagneticResonance). Springer.
Roemer, P., Edelstein, W., Hayes, C., 1990. The NMR phased array. Magn. Res. Med. 16 (2), 192–225.
Rooney, W. D., Johnson, G., Li, X., Cohen, E. R., Kim, S.-G., Ugurbil, K., Springer, C. S., 2007. Magneticfield and tissue dependencies of human brain longitudinal 1H2O relaxation in vivo. Magn. Res. Med.57 (2), 308–318.
Röschmann, P., 1987. Radiofrequency penetration and absorption in the human body: limitations to high-field whole-body nuclear magnetic resonance imaging. Med. Phys. 14 (6), 922–931.
Saekho, S., Boada, F. E., Noll, D. C., Stenger, V. A., 2005. Small tip angle three-dimensional tailoredradiofrequency slab-select pulse for reduced B1 inhomogeneity at 3 T. Magn. Res. Med. 53 (2), 479–484.
Saekho, S., Yip, C.-y., Noll, D. C., Boada, F. E., Stenger, V. A., 2006. Fast-kz three-dimensional tailoredradiofrequency pulse for reduced B1 inhomogeneity. Magn. Res. Med. 55 (4), 719–724.
Sbrizzi, A., Hoogduin, H., Lagendijk, J. J., Luijten, P., Sleijpen, G. L. G., van den Berg, C. A. T., 2012.Fast design of local n-gram-specific absorption rate–optimized radiofrequency pulses for parallel transmitsystems. Magn. Res. Med. 67, 824–834.
Schneider, J. T., Kalayciyan, R., Haas, M., Ruhm, W., Doessel, O., Hennig, J., Ullmann, P., 2010. Inner-Volume-Imaging Using Three-Dimensional Parallel Excitation. In: Proc. Inl. Soc. Mag. Reson. Med. Stock-holm, p. 103.
Schroeder, D. V., Aug. 1999. An Introduction to Thermal Physics, 1st Edition. Addison Wesley.
Sersa, I., Macura, S., 1998. Excitation of complicated shapes in three dimensions. J. Magn. Reson. 135 (2),466–477.
130
Bibliography
Setsompop, K., Alagappan, V., Gagoski, B., Witzel, T., Polimeni, J., Potthast, A., Hebrank, F., Fontius, U.,Schmitt, F., Wald, L. L., Adalsteinsson, E., 2008a. Slice-selective RF pulses for in vivo B1+ inhomogeneitymitigation at 7 tesla using parallel RF excitation with a 16-element coil. Magn. Res. Med. 60 (6), 1422–1432.
Setsompop, K., Alagappan, V., GAGOSKI, B. A., Potthast, A., Hebrank, F., Fontius, U., Schmitt, F.,Wald, L. L., Adalsteinsson, E., 2009. Broadband slab selection with B1+ mitigation at 7T via parallelspectral-spatial excitation. Magn. Res. Med. 61 (2), 493–500.
Setsompop, K., Alagappan, V., Zelinski, A. C., Potthast, A., Fontius, U., Hebrank, F., Schmitt, F., Wald,L. L., Adalsteinsson, E., 2008b. High-flip-angle slice-selective parallel RF transmission with 8 channels at7 T. J. Magn. Reson. 195 (1), 76–84.
Setsompop, K., Wald, L. L., Alagappan, V., Gagoski, B., Hebrank, F., Fontius, U., Schmitt, F., Adal-steinsson, E., 2006. Parallel RF transmission with eight channels at 3 Tesla. Magn. Res. Med. 56 (5),1163–1171.
Setsompop, K., Wald, L. L., Alagappan, V., Gagoski, B. A., Adalsteinsson, E., 2008c. Magnitude leastsquares optimization for parallel radio frequency excitation design demonstrated at 7 Tesla with eightchannels. Magn. Res. Med. 59 (4), 908–915.
Silbert, L., Quinn, J., Moore, M., Corbridge, E., Ball, M., Murdoch, G., Sexton, G., Kaye, J., 2003. Changesin premorbid brain volume predict Alzheimer’s disease pathology. Neurology 61 (4), 487–492.
Silver, M., Joseph, R., Hoult, D., 1985. Selective spin inversion in nuclear magnetic resonance and coherentoptics through an exact solution of the Bloch-Riccati equation. Phys. Rev. A. 31 (4), 2753–2755.
Smith, S. M., 2002. Fast robust automated brain extraction. Hum. Brain. Mapp. 17 (3), 143–155.
Sodickson, D. K., Manning, W. J., 1997. Simultaneous acquisition of spatial harmonics (SMASH): fastimaging with radiofrequency coil arrays. Magn. Res. Med. 38 (4), 591–603.
Staewen, R. S., Johnson, A. J., Ross, B. D., Parrish, T., Merkle, H., Garwood, M., 1990. 3-D FLASH imagingusing a single surface coil and a new adiabatic pulse, BIR-4. Invest. Radiol. 25 (5), 559–567.
Stollberger, R., Wach, P., 1996. Imaging of the active B1-field in vivo. Magn. Res. Med. 35 (2), 246–251.
Strumwasser, F., 1958. Long-term recording’ from single neurons in brain of unrestrained mammals. Science127 (3296), 469–470.
Styner, M., Brechbühler, C., Székely, G., Gerig, G., 2000. Parametric estimate of intensity inhomogeneitiesapplied to MRI. IEEE Trans. Med. Imaging. 19 (3), 153–165.
Thieben, M. J., Duggins, A. J., Good, C. D., Gomes, L., Mahant, N., Richards, F., McCusker, E., Frackowiak,R. S. J., 2002. The distribution of structural neuropathology in pre-clinical Huntington’s disease. Brain125 (8), 1815–1828.
Triantafyllou, C., Hoge, R. D., Krueger, G., Wiggins, C. J., Potthast, A., Wiggins, G. C., Wald, L. L., 2005.Comparison of physiological noise at 1.5 T, 3 T and 7 T and optimization of fMRI acquisition parameters.NeuroImage 26 (1), 243–250.
Ullmann, P., Junge, S., Wick, M., Seifert, F., Ruhm, W., Hennig, J., 2005. Experimental analysis of parallelexcitation using dedicated coil setups and simultaneous RF transmission on multiple channels. Magn. Res.Med. 54 (4), 994–1001.
Vahedipour, K., Stocker, T., Brenner, D., Shah, N., 2010. Parallel excitation of a 3D ROI inside a postmortem brain. In: Proc. Intl. Soc. Mag. Reson. Med. Stockholm, p. 4917.
Van de Moortele, P.-F., Akgun, C., Adriany, G., Moeller, S., Ritter, J., Collins, C. M., Smith, M. B.,Vaughan, J. T., Ugurbil, K., 2005. B(1) destructive interferences and spatial phase patterns at 7 T witha head transceiver array coil. Magn. Res. Med. 54 (6), 1503–1518.
131

Bibliography
Van de Moortele, P.-F., Auerbach, E. J., Olman, C., Yacoub, E., Ugurbil, K., Moeller, S., 2009. T1 weightedbrain images at 7 Tesla unbiased for Proton Density, T2* contrast and RF coil receive B1 sensitivity withsimultaneous vessel visualization. NeuroImage 46 (2), 432–446.
Van De Moortele, P.-F., Snyder, C., Delabarre, L., Gregor, A., Vaughan, T., Ugurbil, K., 2007. CalibrationTools for RF Shim at Very High Field with Multiple Element RF Coils: From Ultra Fast Local RelativePhase to Absolute Magnitude B1+ Mapping. In: Proc. Inl. Soc. Mag. Reson. Med. Berlin, p. 1676.
Van der Kouwe, A., Benner, T., Salat, D., 2008. Brain morphometry with multiecho MPRAGE. NeuroImage40 (2), 559–569.
Vaughan, J. T., Hetherington, H., Otu, J., Pan, J., Pohost, G., 1994. High frequency volume coils for clinicalNMR imaging and spectroscopy. Magn. Res. Med. 32 (2), 206–218.
Vogel, M., Kleihorst, R., 2007. Large-scale simulations including a human-body model for MRI. In: IEEEInt. Microwave Symp. Honolulu, pp. 1345–1348.
Voigt, T., Doessel, O., Katscher, U., 2009. Imaging conductivity and local SAR of the human brain. In:Proc. Intl. Soc. Mag. Reson. Med. Honolulu, p. 4513.
Von Economo, C., Koskinas, G., 1927. Die Cytoarchitektonik der Hirnrinde des erwachsenen Menschen.Springer, Berlin.
Wald, L. L., Carvajal, L., Moyher, S. E., Nelson, S. J., Grant, P. E., Barkovich, A. J., Vigneron, D. B., 1995.Phased array detectors and an automated intensity-correction algorithm for high-resolution MR imagingof the human brain. Magn. Res. Med. 34 (3), 433–439.
Wang, J., Qiu, M., Yang, Q. X., Smith, M. B., Constable, R. T., 2005. Measurement and correction oftransmitter and receiver induced nonuniformities in vivo. Magn. Res. Med. 53 (2), 408–417.
Wangsness, R., Bloch, F., 1953. The dynamical theory of nuclear induction. Phys. Rev. 89 (4), 728–739.
Weiger, M., Pruessmann, K. P., Österbauer, R., Bornert, P., Boesiger, P., Jezzard, P., 2002. Sensitivity-encoded single-shot spiral imaging for reduced susceptibility artifacts in BOLD fMRI. Magn. Res. Med.48 (5), 860–866.
Wiggins, C. J., Caillat, M., Bihan, D. L., Schmitt, F., Eberlein, E., 2010. Use of Opposed Shim Currentsfor Infold Reduction on a UHF MRI System with Head Gradient. In: Proc. Inl. Soc. Mag. Reson. Med.Stockholm, p. 2339.
Wiggins, G. C., Triantafyllou, C., Potthast, A., Reykowski, A., Nittka, M., Wald, L. L., 2006. 32-channel3 Tesla receive-only phased-array head coil with soccer-ball element geometry. Magn. Res. Med. 56 (1),216–223.
Xu, D., King, K., Zhu, Y., McKinnon, G. C., Liang, Z.-P., 2008. Designing multichannel, multidimensional,arbitrary flip angle RF pulses using an optimal control approach. Magn. Res. Med. 59 (3), 547–560.
Xu, D., King, K. F., Zhu, Y., McKinnon, G. C., Liang, Z.-P., 2007. A noniterative method to design large-tip-angle multidimensional spatially-selective radio frequency pulses for parallel transmission. Magn. Res.Med. 58 (2), 326–334.
Yacoub, E., Harel, N., Ugurbil, K., 2008. High-field fMRI unveils orientation columns in humans. Proc. Natl.Acad. Sci. USA. 105 (30), 10607–10612.
Yang, Q. X., Mao, W., Wang, J., Smith, M. B., Lei, H., Zhang, X., Ugurbil, K., Chen, W., 2006. Manipulationof image intensity distribution at 7.0 T: passive RF shimming and focusing with dielectric materials. J.Magn. Reson. Imaging. 24 (1), 197–202.
Yang, Q. X., Wang, J., Collins, C. M., Smith, M. B., Zhang, X., Ugurbil, K., Chen, W., 2004. Phantomdesign method for high-field MRI human systems. Magn. Res. Med. 52 (5), 1016–1020.
Yang, Q. X., Wang, J., Zhang, X., Collins, C. M., Smith, M. B., Liu, H., Zhu, X.-H., Vaughan, J. T., Ugurbil,K., Chen, W., 2002. Analysis of wave behavior in lossy dielectric samples at high field. Magn. Res. Med.47 (5), 982–989.
132

Bibliography
Yarnykh, V. L., 2007. Actual flip-angle imaging in the pulsed steady state: a method for rapid three-dimensional mapping of the transmitted radiofrequency field. Magn. Res. Med. 57 (1), 192–200.
Yip, C., Fessler, J. A., Noll, D. C., 2005. Iterative RF pulse design for multidimensional, small-tip-angleselective excitation. Magn. Res. Med. 54 (4), 908–917.
Yip, C., Fessler, J. A., Noll, D. C., 2006. Advanced three-dimensional tailored RF pulse for signal recoveryin T2*-weighted functional magnetic resonance imaging. Magn. Res. Med. 56 (5), 1050–1059.
Zanchi, M. G., Stang, P., Kerr, A., Pauly, J. M., Scott, G. C., 2011. Frequency-offset Cartesian feedback forMRI power amplifier linearization. IEEE Trans. Med. Imaging. 30 (2), 512–522.
Zelinski, A., Alagappan, V., Goyal, V., Adalsteinsson, E., Wald, L., 2008a. Sparsity-Enforced Coil ArrayMode Compression for Parallel Transmission. In: Proc. Intl. Soc. Mag. Reson. Med. Toronto, p. 1302.
Zelinski, A., Goyal, V. K., Angelone, L., Bonmassar, G., Wald, L., Adalsteinsson, E., 2007. Designing RFPulses with Optimal Specific Absorption Rate (SAR) Characteristics and Exploring Excitation Fidelity,SAR and Pulse Duration Tradeoffs. In: Proc. Intl. Soc. Mag. Reson. Med. Berlin, p. 1699.
Zelinski, A. C., Angelone, L. M., GOYAL, V. K., Bonmassar, G., Adalsteinsson, E., Wald, L. L., 2008b.Specific absorption rate studies of the parallel transmission of inner-volume excitations at 7T. J. Magn.Reson. Imaging. 28 (4), 1005–1018.
Zelinski, A. C., Wald, L. L., Setsompop, K., Alagappan, V., GAGOSKI, B. A., GOYAL, V. K., Adalsteinsson,E., 2008c. Fast slice-selective radio-frequency excitation pulses for mitigating B+1 inhomogeneity in thehuman brain at 7 Tesla. Magn. Res. Med. 59 (6), 1355–1364.
Zelinski, A. C., Wald, L. L., Setsompop, K., GOYAL, V. K., Adalsteinsson, E., 2008d. Sparsity-enforcedslice-selective MRI RF excitation pulse design. IEEE Trans. Med. Imaging. 27 (9), 1213–1229.
Zhu, Y., 2004. Parallel excitation with an array of transmit coils. Magn. Res. Med. 51 (4), 775–784.
Zumdahl, S. S., Zumdahl, S. A., 1999. Chemistry), 5th Edition. Brooks Cole.
133

Bibliography
134

A Nomenclature 0
ADC analog-to-digital converter
AFI actual flip-angle imaging sequence
B0 static magnetic field
B1+ transmit sensitivity
B1- receive sensitivity
BOLD blood oxygen level dependent effect
BW bandwidth
cGM cortical gray matter
CNR contrast-to-noise ratio
CP circularly polarized
CSF cerebrospinal fluid
CT Computed Tomography
dTx 2-channel setup where an 8-element coil is driven with two optimized linear combinations inparallel
EMF electromotive force
FA flip-angle
FEM finite element methods
FID free induction decay
FLASH fast low angle shot (sequence)
fMRI functional magnetic resonance imaging
GM gray matter
GRAPPA generalized autocalibrating partial parallel acquisition
GRE gradient recalled echo (sequence)
IET inter echo time
IRFU institute de recherche sur les fondamentales de l’ univers
kT-points k-space transmission points: non-selective excitations based on a series of arbitrarily shaped RF-waveforms interleaved with gradient blips to transverse a sparse set of k-space locations.:
LTA large-tip-angle
MOCA magnetude optimal control approach
MP-RAGE magnetization-prepared rapid gradient echo (sequence)
MR magnetic resonance
MRI magnetic resonance imaging

Bibliography
mTx 4-channel setup where an 8-element coil is driven using the four most efficient circularly polarizedmodes.
NMR nuclear magnetic resonance
NRMSE normalized root mean square error
NRMSIE normalized root mean square inversion error
OCA optimal control approach
PET Positron Emission Tomography
pTx In chapter 9: parallel transmission with an 8-channel setup where every coil-element is drivenindependently
pTx parallel transmission
RF radio frequency
SAR specific absorption rate
SE spin echo (sequence)
SENSE sensitivity encoding
SMASH simultaneous acquisition of spatial harmonics
SNR signal-to-noise ratio
SPACE sampling perfection with application optimized contrasts using different flip angle evolution (se-quence)
Spokes slice-selective excitation based on a series of frequency-selective pulses played at a select set oflocations in k-space 2D k-space while densely sampling a 3rd dimension
STA small-tip-angle
sTx 1-channel setup where an 8-element coil is sequentially driven with two optimized linear combi-nation.
sWM subcortical white matter
TE time of echo
TI inversion time
TR time of repetition
UHF ultra high field (3-Tesla and up)
WM white matter
136