paptac – june 2005 · paptac – june 2005 technology comparison seminar ... • plants with...
TRANSCRIPT

PAPTAC – June 2005Technology Comparison Seminar
Scott Whittaker
Jean-Marc Vanasse

DiscussionTopics
• Hercules Alliance• When and Why to Look at Upgrading• Typical Process Flow• Pretreatment Issues and Comparisons• Demineralization Issues and
Comparisons• Questions

Hercules / GE PartnershipThe partnership is a natural fit for the strategies of both companies
The benefits of this partnership are:
• Global Technical Resources• Expertise in Water Treatment• Experience in Turnkey
Equipment and Solutions
Global TechnicalResourcesExpertise in UtilityServiceExperienced fieldservice teams
“Hercules is GE’s channel to Water Treatment and Equipment Solutions to the pulp and paper industry

When to Look at Upgrading• Areas with Limited, High Cost, or Increasing Cost
Supplies
• Increased operational and maintenance costs.
• Increased costs for wastewater disposal
• Raw water TDS/TSS has changed for the worse
• Demand for treated water has recently increased
• Plants with Older Water Treatment Equipment
• Plants with Boiler Feed Water Problems
• Plants with Secondary Treatment (for Water Reuse)
• Flows >50 gpm or 10 m3/hr
• Decentralized Systems
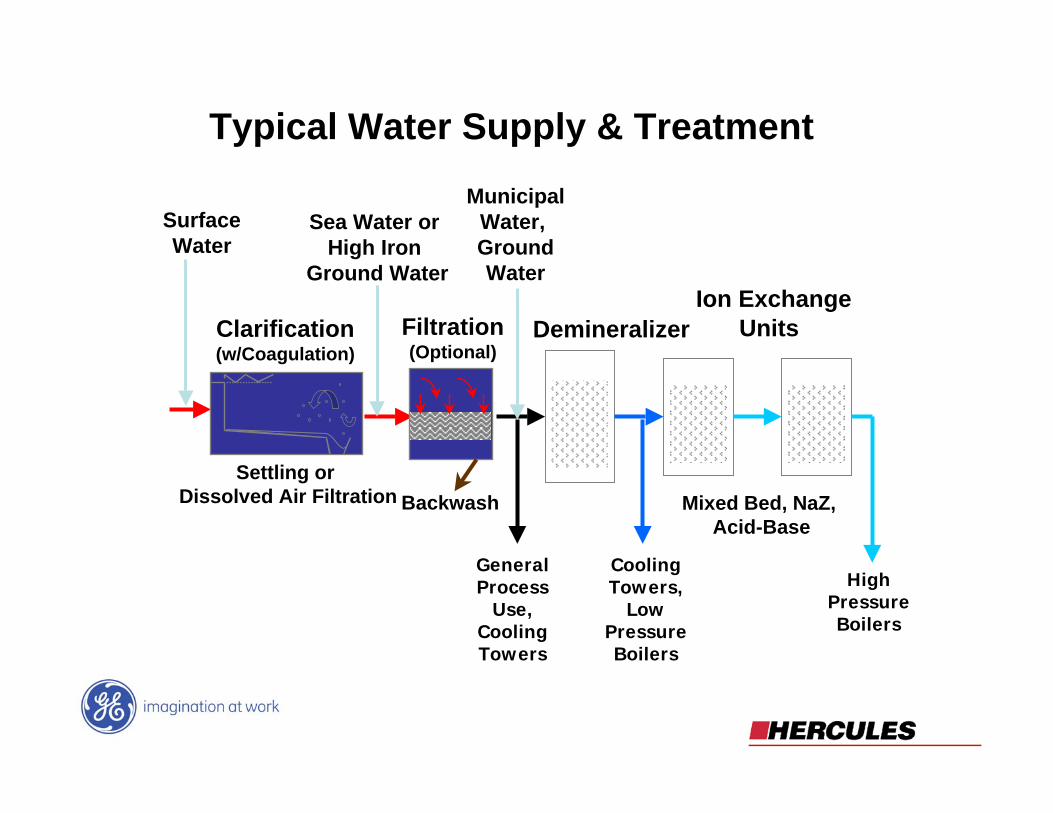
SurfaceWater
Mixed Bed, NaZ, Acid-Base
Settling or Dissolved Air Filtration
Filtration(Optional)
Backwash
Clarification(w/Coagulation)
Sea Water or High Iron
Ground Water
Demineralizer Ion Exchange
Units
GeneralProcess
Use,CoolingTowers
CoolingTowers,
LowPressureBoilers
HighPressureBoilers
MunicipalWater, GroundWater
Typical Water Supply & Treatment

Cartridge Filtration
Multi Media FiltrationClarifier
Cation Anion Mixed BedDegasifier
Aging ConventionalInfrastructure

GE Approach to Water Supply & Treatment
HighPressureBoilers
HighTurbiditySurfaceWater
Sea Water,Surface Water, Ground Waterw/ Fe or High
Turbidity
2nd StageRO or
EDI Process
GeneralProcess
Use,CoolingTowers
CoolingTowers,
LowPressureBoilers
Municipal Water,Ground Water
MicroFiltration
1st StageRO
Oxidation,Coagulation,As Needed

ROMF EDI
Best Available Infrastructure

Demineralizers vs. MF + RO + IX
River, Lake orSecondary
Effluent
Micro-filtration RO
MF + RO Alternative
CationBed
MixedBed
High Purity BoilerFeed Water
AnionBed
CationBed
MixedBed
High Purity BoilerFeed Water
AnionBed
Typical Demin System
MunicipalWater
Settling w/Coagulation
Riveror Lake

MF-RO System at Dryden Mill

MF-RO System at Dryden Mill

MF-RO System at Dryden Mill

MF-RO System at Dryden Mill


Demineralizers vs. MF + RO + EDI
River, Lake orSecondary
Effluent
Micro-filtration RO
MF + RO + EDI Alternative
High Purity BoilerFeed Water
CationBed
MixedBed
High Purity BoilerFeed Water
AnionBed
Typical Demin System
MunicipalWater
Settling w/Coagulation
Riveror Lake
EDI

Demineralizers vs. MF + RO
Feed Water
Micro-filtration RO
MF + RO Alternative
Low/MediumPressure Boiler
Feed Water
Water Softening
Low PressureBoiler Feed
Water
Typical Demin System
Hot/Cold Lime Softening
FeedWater

Clarifier Review
Clarifier Costs
• Chemical coagulantcosts
• Power costs
• Sludge dewatering,transportation, anddisposal costs
• Maintaining clarifiervessel—mechanical andstructural
• Operationalrequirements
• Chemical storage
• Effluent quality variability--inability tomake proper quality filtered waterduring spikes in influent waterturbidity
• Potential for polyelectrolyte carry-overto pressure filters
• Increased softener or demineralizerrisks, e.g., silica spikes resulting inturbine deposition and efficiency lossor vibration damage
• Increased reverse osmosis or EDIrisk--potential damage to steamequipment during BFW quality upsetscaused by sodium deposition andsubsequent corrosion or cracking
Clarifier Risks

Clarifier Cost Break Out• Real annual cost of operating a Clarifier includes:
• Coagulant chemical costs = ________________________$
• Chemical storage costs = ________________________$
• Maintaining clarifier vessel/drives = ________________________$
• Sludge dewatering, transportation, and disposal cost = ________________________$
• Operator/Maintenance = ________________________$
• Chemical handling costs (spills, etc.) = ________________________$
• Total Clarifier Operation Costs = ________________________$/yr.
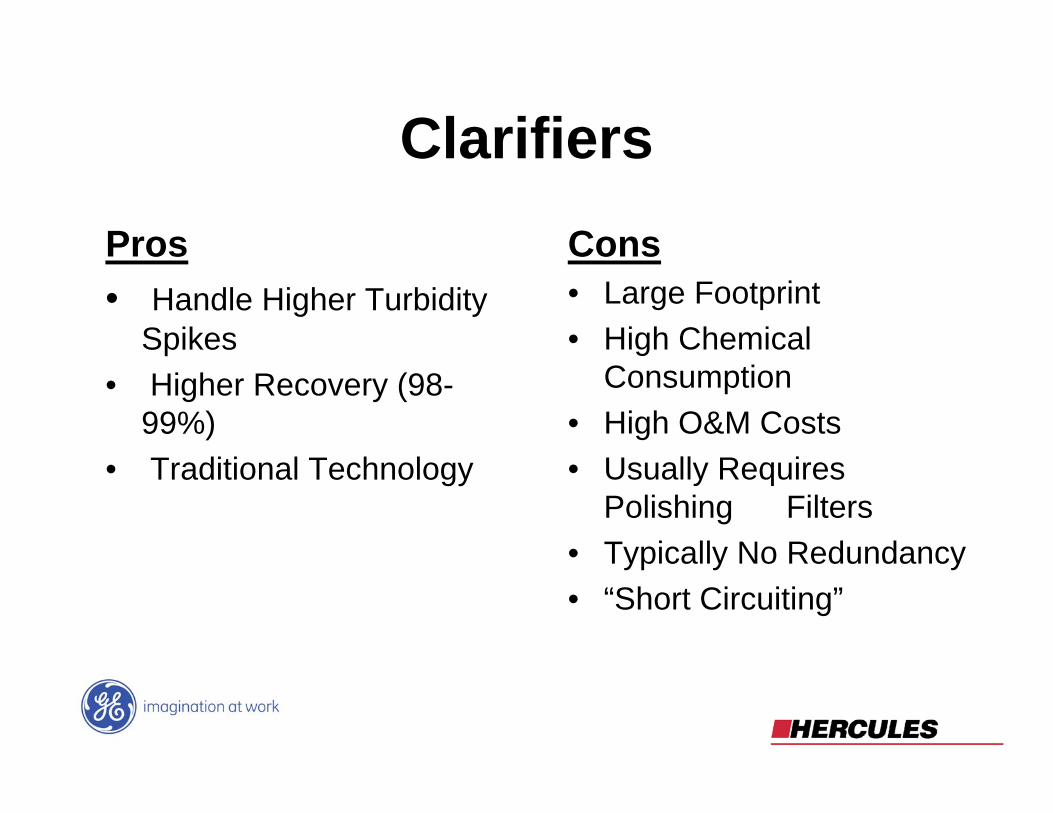
ClarifiersPros• Handle Higher Turbidity
Spikes• Higher Recovery (98-
99%)• Traditional Technology
Cons• Large Footprint• High Chemical
Consumption• High O&M Costs• Usually Requires
Polishing Filters• Typically No Redundancy• “Short Circuiting”

Hot/Cold Lime SoftenersHot Lime Costs
• Excess fuel cost associated withblowdown
• Cleaning chemical costs
• Boiler treatment chemicals
• Waste water disposal
• Operations
• Lime handling
• Heavy maintenance burden
• System fouling and clogging, reducingability to conduct rough softening
• Energy needs due to reduced number ofboiler cycles
• Handling of lime slurry
• High touch maintenance requirements
• Pressure filter failure due to lime carryover
• Sodium Zeolite failure due to excessivebaskwashing, reduced capacity, andexceeding design regeneration cycles.
• Downstream process and potentialdamage to steam equipment duringBFW quality upsets.
• Potential for major feedwater problems.
Hot Lime Risks

Hot Lime System Cost Break Out
• Real annual cost of operating a Hot Lime system includes:
• Cleaning chemical costs = ____________________ $• Lime costs = ____________________ $• Maintaining system = ____________________ $• Operations = ____________________ $• Lime storage = _____________________$• Excess fuel = _____________________$
• Total Hot Lime Operation Costs = _____________________$/yr.

Hot/Cold Lime SofteningPros• Some Silica Removal• Dissolved Oxygen
Reduction• Can Operate at Moderate
Influent Turbidity
Cons• Removes Hardness to
17-25 ppm only• Extra steps required for
lower hardness levels• Expensive Chemicals• Sludge and Lime
Disposal• Temperature

Pressure Filter ReviewPressure Filter Costs• Maintaining vessels
• Coagulant chemical cost
• Chemical coagulant storage
• Media replacement
• Backwash -wastewater disposal
• Inability to make proper qualityfiltered water for demin use duringspikes in influent water turbidity
• Potential for particulate leakage dueto channeling, mudballs, and mediarearrangement.
• No way to determine filter failure asmedia is inside vessel.
• Silica spikes resulting in turbinedeposition and efficiency loss orvibration damage due to silicaleakage from clarifier and pressurefilter.
• Potential for downstream problemsdue to mis-feed of coagulant orpolyelectrolyte carry-over due toturbidity spikes, and poor clarifierperformance.
Pressure Filter Risks

Pressure Filter Cost Break Out•Real annual cost of operating a Pressure Filter includes:
•(Clarifier Operating costs) = _____________________$•Coagulant chemical costs = _____________________$•Maintaining vessels = _____________________$•Media replacement = _____________________$•Operations = _____________________$•Chemical handling costs (spills, etc.) = _____________________$•Backwash disposal = _____________________$•Total Pressure Filter Operation Costs = _____________________$/yr.
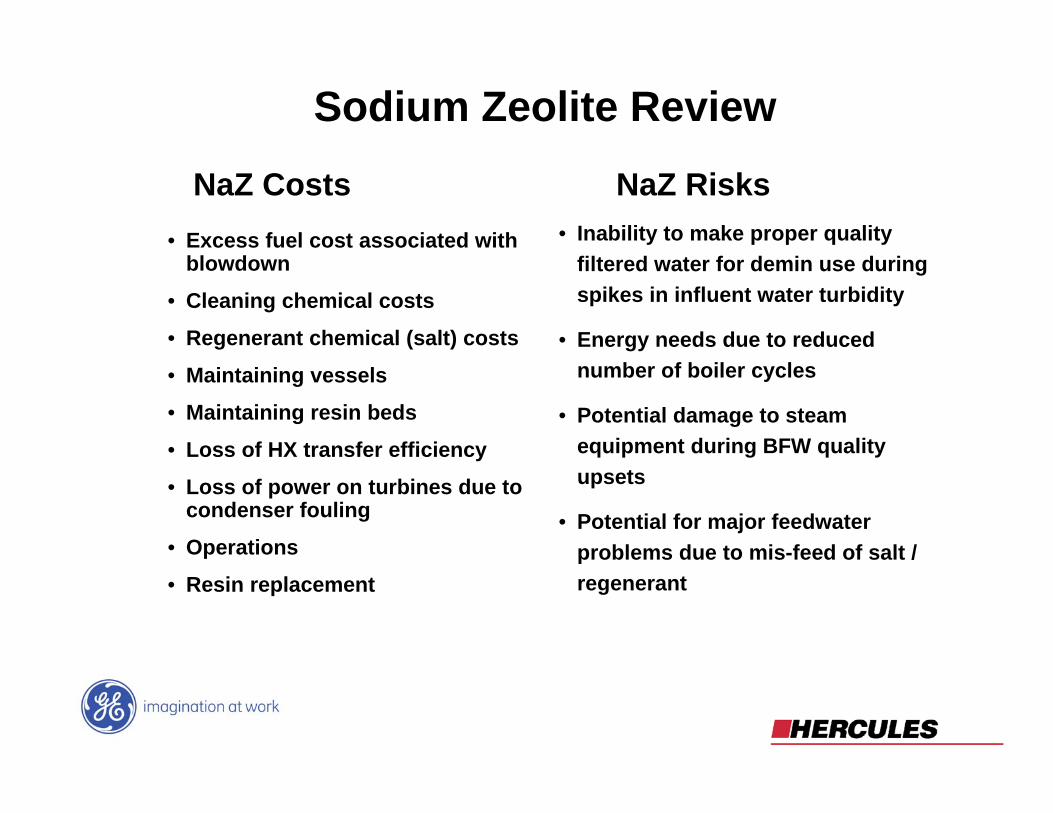
Sodium Zeolite Review
NaZ Costs• Excess fuel cost associated with
blowdown
• Cleaning chemical costs
• Regenerant chemical (salt) costs
• Maintaining vessels
• Maintaining resin beds
• Loss of HX transfer efficiency
• Loss of power on turbines due tocondenser fouling
• Operations
• Resin replacement
• Inability to make proper qualityfiltered water for demin use duringspikes in influent water turbidity
• Energy needs due to reducednumber of boiler cycles
• Potential damage to steamequipment during BFW qualityupsets
• Potential for major feedwaterproblems due to mis-feed of salt /regenerant
NaZ Risks

Sodium Zeolite SofteningPros• High Hardness Removal
(<1 ppm)• Operates at Ambient
Temps• Can operate at High
Temps• Inexpensive Chemical for
Regeneration (NaCl)
Cons• No Silica Removal• Need Low Feed Turbidity
(<1 ntu)• Susceptible to Fouling

NaZ Cost Break Out
• Real annual cost of operating a NaZ unit includes:
• Cleaning chemical costs = ___________________$• Regenerant chemical costs = ___________________$• Maintaining vessels = ___________________$• Resin replacement = ___________________$• Operations = ___________________$• Chemical storage = ___________________$• Excess Fuel = ___________________$• Total NaZ Operation Costs = ___________________$/yr.

Demineralizer Review
Demineralizer Costs
• Inability to make proper quality waterduring spikes in influent water turbidity
• Potential for colloidal silica leakage• Silica spikes resulting in turbine
deposition and efficiency loss orvibration damage
• Potential damage to steam equipmentduring BFW quality upsets
• Potential for major feedwater problemsdue to mis-feed of acid or caustic inregeneration process
• Cleaning chemical costs• Regenerant chemical costs• Maintaining demin vessels• Resin replacement• Operations• Chemical storage• Resin replacement• Regenerant /backwash/ rinse• water disposal
Demineralizer Risks

Source(s) of WaterWater Quality - Feed(Cond. Hard, etc) - Finished
Flow (gpm) – Average(or other units) – Peak
Concentrate DisposalLocation
Labor for Existing Treatment(hr / day)
Resin Life (year)Labor cost ($ / hour)Downtime Losses (per yr)Electric Cost ($ / kwh)
Caustic Usage (ton / year)Sewer Cost ($ / 1000 gal)Acid Usage (ton / year)Water Cost ($ / 1000 gal)
Caustic Cost ($ / ton)Operating hours / dayAcid Cost ($ / ton)Operating days / year
Demineralizer Cost Break Out

Demineralizer Cost Break Out
• Real annual cost of operating a Demineralizer includes:
• Cleaning chemical costs = ____________$• Regenerant chemical costs = ____________$• Maintaining demin vessels = ____________$• Resin replacement = ____________$• Operations = ____________$• Chemical handling costs (spills, etc.) = ____________$• Resin = ____________$• Total Demin Operation Costs = ____________$/yr.

Ion ExchangePros• High Effluent Quality• Less Pretreatment• High Recovery
Cons• Chemical Regenerations• Acid/Caustic Storage• Batch Process• Higher O&M Costs• Waste Neutralization• Chemical Waste Disposal

Microfilter Review
Microfilter Costs• Chemical coagulant costs
• Power costs
• Mechanical Maintenance
• Operational requirements
• Chemical storage
• Fouling of Membranes– Reduced Flow– No Flow
Microfilter Risks

Microfilter Cost Break Out
• Real annual cost of operating a MF includes:
• Coagulant chemical costs = ________________________$
• Chemical storage costs = ________________________$
• Maintenance = ________________________$
• Concentrate Discharge = ________________________$
• Operator/Maintenance = _______________________ $
• Chemical handling costs (spills, etc.) = _______________________ $
• Total MF Operation Costs = ________________________$/yr.

MicrofilterPROS• Small Footprint• Lower O&M Costs• High Effluent Quality• Partial Flow During
Maintenance• “Guaranteed” Effluent
CONS• Restricted Influent
Turbidity• Lower Recovery
(94%)• Required Periodic
Cleanings• Temperature
Restricted

Reverse Osmosis Review
RO Costs
• Pretreatment
• Power costs
• Mechanical Maintenance
• Membrane Replacements
• Operationalrequirements
• Fouling of Membranes– Reduced Flow due to CIP– No Flow
• Damage to Membranes
RO Risks

RO Cost Break Out
• Real annual cost of operating a RO includes:
• Pretreatment costs = ____________________________
• Membrane Cleaning costs = ______________________
• Maintenance = _________________________________
• Concentrate Discharge =_________________________
• Operator/Maintenance = _________________________
• Membrane Replacement = _______________________
• Total RO Operation Costs = _________________/yr.

Reverse OsmosisPROS• Small Footprint• Lower O&M Costs• Continuous Process• Low Chemical Use• TOC/Organic
Removal
CONS• Continuous Waste
Flow• Lower Recovery (70-
80%)• Required Periodic
Cleanings• Temperature
Restricted• Greater Pretreatment

Reverse Osmosis UnitStandard 200 gpm Design

Example:
MF-RO Versus Clarifier-IX

Demineralizers vs. MF + RO + EDI
River, Lake orSecondary
Effluent
Micro-filtration RO
MF + RO + EDI Alternative
High Purity BoilerFeed Water
CationBed
High Purity BoilerFeed Water
AnionBed
Typical Demin System
MunicipalWater
Settling w/Coagulation
Riveror Lake
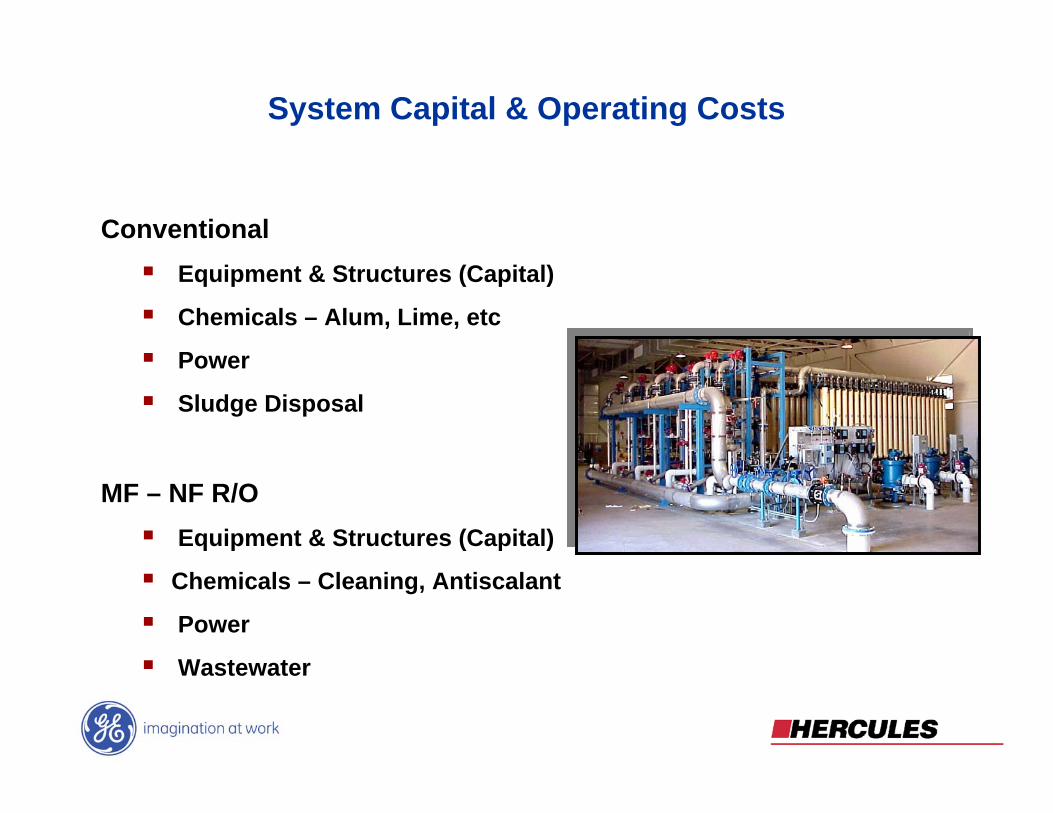
Conventional Equipment & Structures (Capital)
Chemicals – Alum, Lime, etc
Power
Sludge Disposal
MF – NF R/O Equipment & Structures (Capital)
Chemicals – Cleaning, Antiscalant
Power
Wastewater
System Capital & Operating Costs

Cost Comparison
• $ .078/ 1000 gal• Membrane Replacement
• Cost
• $ .219 /1000 gal.• Cost Savings
• $ .07/ 1000 gal• Power• $ .16/ 1000 gal• Waste Disposal• $ .02/ 1000 gal• Chemicals• $ .23/ 1000 gal• Capital (includes building)
• MF/RO System• $ .007 /1000 gal• Power
• $ .39 /1000 gal• Waste Disposal• $ .22 /1000 gal• Chemicals• $ .16 /1000 gal• Capital
• Conventional System

Example:
Hot/Cold Lime Soda SofteningSystem Replacement

Demineralizers vs. MF + RO
Feed Water
Micro-filtration RO
MF + RO Alternative
Low/MediumPressure Boiler
Feed Water
Water Softening
Low PressureBoiler Feed
Water
Typical Demin System
Hot/Cold Lime Softening
FeedWater

Hot Lime vs. Reverse OsmosisSample Case Study
• Reduction of boiler blowdown 13.3% of steam 1.5%of steam
• Increase in boiler cycles 7.5 65• Fuel savings $ 200,000/yr.• Boiler treatment chemical savings $ 36,000/yr.• Maintenance savings $ 4,300/yr.• Cleaning of RO membranes $ 4,000/yr.• Membrane replacement $ 20,000/yr.• Electricity to run RO pumps $ 12,000/yr.
• Net savings $ 200,000/yr.

Possible MembraneApplications
Color Removal
Boiler Feed Water
Water/White Water Reuse
Mill Supply

Ecolochem Mobile EquipmentEcolochem Mobile Equipment
ASME Code VesselsASME Code Vessels
FiltrationDemineralizationDeoxygenationDeltaFlowReverse OsmosisGas Transfer MembranesElectrodeionization (EDI)Condensate PolishingCarbon Adsorption
FiltrationDemineralizationDeoxygenationDeltaFlowReverse OsmosisGas Transfer MembranesElectrodeionization (EDI)Condensate PolishingCarbon Adsorption

Emergency ServiceEmergency Service
Unscheduled OutagesEquipment FailureUnscheduled OutagesEquipment Failure

• Guaranteed water quality and quantity• No capital investment• Focus manpower and financial resources on core business• Guaranteed operating reliability• Transfer risk management• No unbudgeted costs
Extended Term Outsourcing
Since 1973

• Upgrade plant and equipment without up-front capitalexpenditure and ensure predictable ongoing coststructure
• Improve regulatory/compliance management
• Transfer operational risks
• Focus on core competencies: providing power to the grid,not water systems management
• Improve cost competitiveness
• Access and retain focused and experienced watertreatment professionals
• Look for opportunities at your customers’ sites where aCS arrangement will improve efficiency
Benefits from Upgrading or Outsourcing

Benefits of Water Outsourcing
Guaranteed Performance & CostEliminate water cost variationMore efficient use of chemicals/electricity/waterGuaranteed water quality and quantityWater is Our Core CompetencyUtilize in-house resources more effectively - focus on core processesAvoid Capital Investment in Non-Revenue Producing AssetsImprove Risk Management Position (operational, financial, environmental)Improved return on capitalOff balance sheet financingFinancially Sound PartnerTransfer risk of operation to outsourcing specialistGuidance from Concept through Long Term OperationSix Sigma Philosophy Helps Ensure Operational Excellence
Let Hercules/GE W&PT handle the water while you handle your business

Current State vs.Outsourcing
Operations
Acid &Caustic Maintenance
Rental Demin
ResinCleaning
Chemicals
Mixed BedRegenerant
ResinReplacement
OldSystem$
$
$$
$
$
$
$
WaterSystems
Outsourcing
PredictableMonthly Fee
$
Guaranteedquality andquantity ofwater
Variable qualityand quantity ofwater
VS.
