paper2 justwan
TRANSCRIPT
241Journal of Petroleum Geology, Vol. 28(3), July 2005, pp 241-268
Source facies and quality of the Late to Middle Jurassic source rock system in the South VikingGraben between 58ºN and 60º15’N are highly variable both regionally and stratigraphically. Inorder to assess the degree of variability and to create a model of source rock quality and potential,isochore maps of the syn- and post-rift sections of the Upper Jurassic Draupne Formation andunderlying Heather Formation were generated from seismic and well data, and maturity-correctedRock-Eval data were used to generate quantitative maps of oil and gas potential. The thin post-riftsection at the top of the Draupne Formation is a rich oil-prone source, while the up to 1,600 mthick syn-rift section contains a mixture of Type III and Type II material with substantial amountsof gas-prone and inert organic matter. The Heather Formation, which reaches modelled thicknessesof up to 930 m, is a lean source and is generally gas-prone.
Detailed analyses and interpretations of biomarker and isotopic characteristics support thisupward increase in oil-prone Type II material. The analytical parameters include increasing relativeamounts of C27 regular steranes; decreasing ratios of C30 moretane relative to C30 hopane; and anincreasing predominance of short chain n-alkanes and progressively lighter isotopic values forsaturate and aromatic fractions of source rock extracts. In addition, increasing amounts of17α(H),21β(H)-28,30-bisnorhopane and decreasing amounts of C34 homohopanes relative toC35 homohopanes, as well as decreasing Pr/Ph ratios, suggest a general decrease in oxygenationupwards. Maps of average Pr/Ph ratios for the syn- and post-rift Draupne Formation and for theHeather Formation are consistent with permanent water column stratification and gradual ascentof the O2:H2S interface from the Callovian to the Ryazanian.
Interpretation of oil and gas potential maps, molecular parameters and estimates of sedimentaccumulation rates in combination suggest that the source facies of the upper, post-rift DraupneFormation is controlled by widespread anoxia, reduced siliciclastic dilution and reduced input ofgas-prone organic and inert material; by contrast, the potential of the lower, syn-rift DraupneFormation is strongly controlled by dilution by gas-prone and inert organic matter resulting frommass flows and also by varying degrees of oxygenation. The oil and gas potential of the HeatherFormation is mainly controlled by the degree of oxygenation and siliciclastic dilution.
(Huc et al., 1985; Isaksen and Ledje, 2001; Kubala etal., 2003; Justwan and Dahl, 2005). In the areabetween 58º N and 60º15’ N in the Norwegian SouthViking Graben, major differences can be observedbetween syn- and post-rift sections of the DraupneFormation (Justwan and Dahl, 2005). As more dataconcerning Jurassic source rocks in the matureexploration area of the South Viking Graben becomeavailable, it is becoming evident that source faciesdistribution can no longer be explained by simplemodels and that it is controlled by numerous factors.The new data has enabled us to construct a more
LATE TO MIDDLE JURASSIC SOURCE FACIESAND QUALITY VARIATIONS, SOUTH VIKINGGRABEN, NORTH SEA
H. Justwan*1, B. Dahl1, G.H. Isaksen2 and I. Meisingset3
1Department of Earth Science, University of Bergen,Allegaten 41, 5007 Bergen, Norway.2 ExxonMobil Exploration Company, 233 Benmar,Houston, Texas 77210, USA.3 Aker Kvaerner Geo AS, PO Box 242, Lilleaker, 0216Oslo, Norway.*corresponding author, email: [email protected]
INTRODUCTION
Source facies and quality of Jurassic source rocks inthe Viking Graben vary both laterally and vertically
242 Late to Middle Jurassic source facies and quality variations, South Viking Graben, North Sea
reliable model of source rock distribution, potentialand quality than was previously possible. We havefocussed on the Upper Jurassic source interval becauseonly a small amount of new data on the MiddleJurassic source rocks in the study area was available.
This paper forms the first part of a larger study ofthe petroleum system in the South Viking Grabenwhich will also include an oil-source correlation studyand a basin modelling project. The objectives of thepresent paper are threefold. The first aim is to producemaps of the thickness and quality of the Upper Jurassicsource rock section which can be used in basinmodelling. Much attention in recent basin modellingprojects has been given to kinetic parameters (e.g.Dieckmann et al., 2004) and phase predictions (e.g.di Primio, 2002), while the issue of source rockvariability as an important input parameter is rarelyaddressed. We hope to shed light on this importantaspect of the petroleum systems of the South VikingGraben by presenting quantitative maps of the oil andgas potential in the area. The second objective of thisstudy is to gain a detailed knowledge of variations insource rock quality (including molecular properties)which will later be used in an oil-source correlationstudy within the South Viking Graben. Finally, weattempt to explain the development of source faciesand oil and gas potential in the area in terms of basindevelopment through time.
GEOLOGICAL SETTING
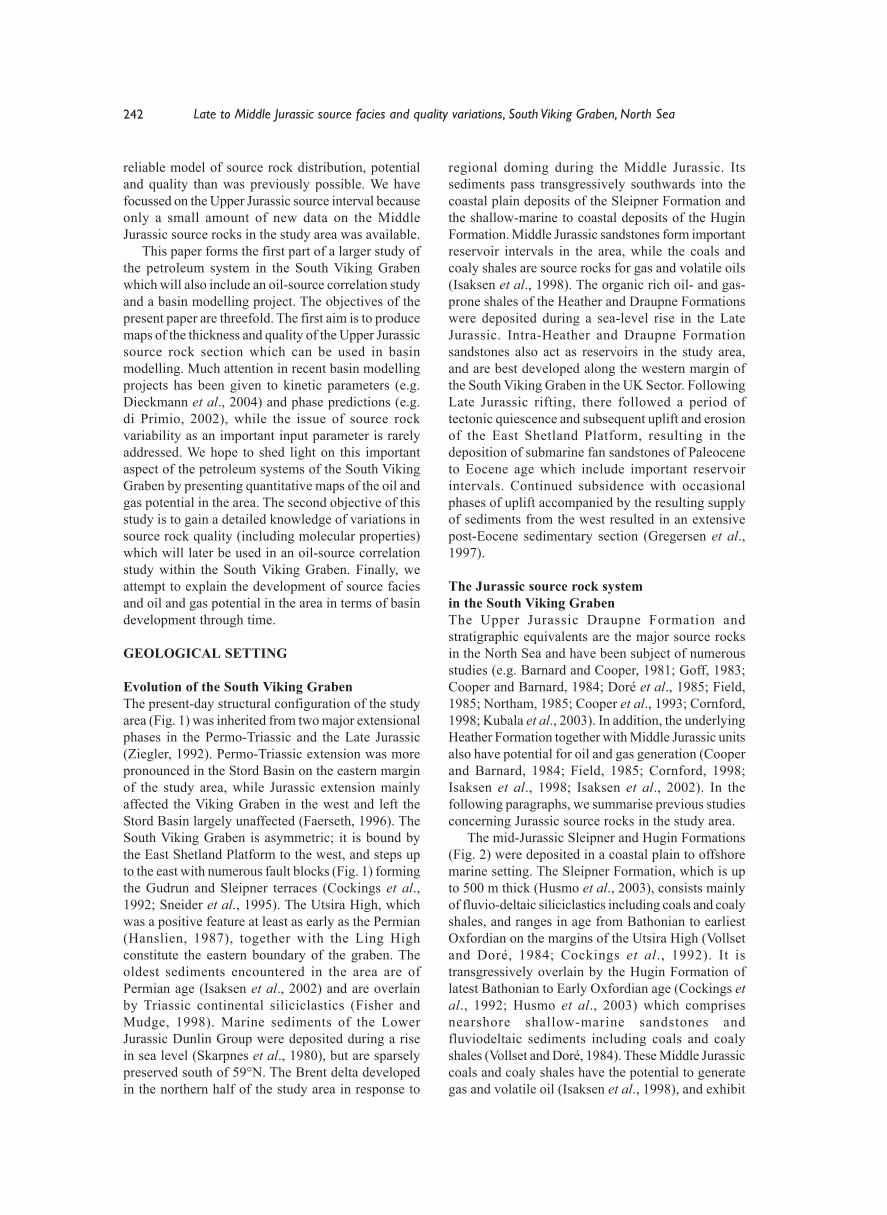
Evolution of the South Viking GrabenThe present-day structural configuration of the studyarea (Fig. 1) was inherited from two major extensionalphases in the Permo-Triassic and the Late Jurassic(Ziegler, 1992). Permo-Triassic extension was morepronounced in the Stord Basin on the eastern marginof the study area, while Jurassic extension mainlyaffected the Viking Graben in the west and left theStord Basin largely unaffected (Faerseth, 1996). TheSouth Viking Graben is asymmetric; it is bound bythe East Shetland Platform to the west, and steps upto the east with numerous fault blocks (Fig. 1) formingthe Gudrun and Sleipner terraces (Cockings et al.,1992; Sneider et al., 1995). The Utsira High, whichwas a positive feature at least as early as the Permian(Hanslien, 1987), together with the Ling Highconstitute the eastern boundary of the graben. Theoldest sediments encountered in the area are ofPermian age (Isaksen et al., 2002) and are overlainby Triassic continental siliciclastics (Fisher andMudge, 1998). Marine sediments of the LowerJurassic Dunlin Group were deposited during a risein sea level (Skarpnes et al., 1980), but are sparselypreserved south of 59°N. The Brent delta developedin the northern half of the study area in response to
regional doming during the Middle Jurassic. Itssediments pass transgressively southwards into thecoastal plain deposits of the Sleipner Formation andthe shallow-marine to coastal deposits of the HuginFormation. Middle Jurassic sandstones form importantreservoir intervals in the area, while the coals andcoaly shales are source rocks for gas and volatile oils(Isaksen et al., 1998). The organic rich oil- and gas-prone shales of the Heather and Draupne Formationswere deposited during a sea-level rise in the LateJurassic. Intra-Heather and Draupne Formationsandstones also act as reservoirs in the study area,and are best developed along the western margin ofthe South Viking Graben in the UK Sector. FollowingLate Jurassic rifting, there followed a period oftectonic quiescence and subsequent uplift and erosionof the East Shetland Platform, resulting in thedeposition of submarine fan sandstones of Paleoceneto Eocene age which include important reservoirintervals. Continued subsidence with occasionalphases of uplift accompanied by the resulting supplyof sediments from the west resulted in an extensivepost-Eocene sedimentary section (Gregersen et al.,1997).
The Jurassic source rock systemin the South Viking GrabenThe Upper Jurassic Draupne Formation andstratigraphic equivalents are the major source rocksin the North Sea and have been subject of numerousstudies (e.g. Barnard and Cooper, 1981; Goff, 1983;Cooper and Barnard, 1984; Doré et al., 1985; Field,1985; Northam, 1985; Cooper et al., 1993; Cornford,1998; Kubala et al., 2003). In addition, the underlyingHeather Formation together with Middle Jurassic unitsalso have potential for oil and gas generation (Cooperand Barnard, 1984; Field, 1985; Cornford, 1998;Isaksen et al., 1998; Isaksen et al., 2002). In thefollowing paragraphs, we summarise previous studiesconcerning Jurassic source rocks in the study area.
The mid-Jurassic Sleipner and Hugin Formations(Fig. 2) were deposited in a coastal plain to offshoremarine setting. The Sleipner Formation, which is upto 500 m thick (Husmo et al., 2003), consists mainlyof fluvio-deltaic siliciclastics including coals and coalyshales, and ranges in age from Bathonian to earliestOxfordian on the margins of the Utsira High (Vollsetand Doré, 1984; Cockings et al., 1992). It istransgressively overlain by the Hugin Formation oflatest Bathonian to Early Oxfordian age (Cockings etal., 1992; Husmo et al., 2003) which comprisesnearshore shallow-marine sandstones andfluviodeltaic sediments including coals and coalyshales (Vollset and Doré, 1984). These Middle Jurassiccoals and coaly shales have the potential to generategas and volatile oil (Isaksen et al., 1998), and exhibit
243H. Justwan et al.
TOC values of up to 80 wt % and Hydrogen Indicesup to 400 g HC/kg Corg (Isaksen et al., 2002). Shalesand grey silty mudstones of the Callovian to OxfordianHeather Formation have average TOC values up to4% (Goff, 1983; Cooper and Barnard, 1984; Field,1985; Thomas et al., 1985). It is generally thoughtthat this formation is a lean dry gas source, althoughit shows large variations in source potential and hasgood hydrocarbon potential in some small sub-basins(Cooper and Barnard, 1984; Field, 1985; Thomas etal., 1985; Scotchman, 1991; Gormly et al., 1994;Isaksen et al., 2002). Thomas et al. (1985) describeda widespread basal-Heather “hot shale” depositedunder dysoxic to anoxic conditions beneath a stratified
water column, whose deposition was terminated byincreasing oxygenation accompanying a progressivetransgression.
The Heather Formation is diachronously overlainby the Oxfordian to Ryazanian (Kimmeridge ClayEquivalent) Draupne Formation (Vollset and Doré,1984) (Fig. 2). Various depositional models for thisunit have been put forward (e.g. Hallam andBradshaw, 1979; Tyson et al., 1979; Demaison andMoore, 1980; Parrish and Curtis, 1982; Oschmann,1988; Miller, 1990). The well studied onshoreoutcrops are however not easily comparable in age orfacies with the offshore equivalent (Wignall, 1994).It is generally agreed that deposition of the offshore
Stord Basin
Utsira High
Patch Bank Ridge
Sele HighLing
Depression
EastShetlandPlatform
GudrunTerrace
Vana Sub-basin
HeimdalTerrace
FriggRidge
FensalSub-basin
SleipnerTerrace
HeimdalHigh
BjørgvinArch
6S17
11
5S
31/1131/1030/1230/1130/10
26/1126/10
26/826/7
26/526/4
26/226/1
25/1225/1125/10
25/925/8
25/625/525/4
25/325/225/1
24/12
24/9
17/1117/10
17/817/7
17/517/4
17/217/1
16/1216/1116/10
16/916/816/7
16/616/516/4
16/316/216/1
15/12
15/915/8
15/6
15/5
15/3
16/29
16/3
9/24
9/19
9/15
9/10
9/59/4
9/9
9/14
9/3
9/8
9/13
9/18
9/23
9/28
3/303/293/28
58°00'
59°00'
60°00'
2°00'
2°00'
3°00'
3°00'
25/7
16/8
16/13
16/1816/23
16/28
10
2
2
1
1
1 2
15
1R 8A
22
1
1S3
5
1
8S
18
3
4
1
14
11
3
3
7
2
32
1
2
11S
22
12
3
10S
71
1
2
Upper Ju
rassic
Cretaceous
Tertiary
Viking Graben UtsiraHigh
StordBasin
A A’
Schematic SW-NE Cross-section
A
A’
U.K.
Norway
Denmark
PrimeMeridian
60 No
55 No
Stavanger
Bergen
StudyArea
0 10 20 30 40 50
km
Cretaceous Basin
Pre-Jurassic Basin
Terrace, Intra-basinal High
Platform, High
Fig.1. General map of the South Viking Graben showing major structural elements (after NorwegianPetroleum Directorate, 2005) and the location of the wells used in quantitative source rock mapping.The schematic SW-NE cross-section (after Isaksen and Ledje, 2001) displays the structure of the South VikingGraben, the flanking highs and the adjacent Stord Basin (line of section A-A’ in main map). The location of thestudy area in the North Sea is shown in the overview map (lower right).

244 Late to Middle Jurassic source facies and quality variations, South Viking Graben, North Sea
Kimmeridge Clay occurred in a shallow sea with anoxicbottom waters (Cornford, 1998), although the degreeof oxygenation appears to decrease from the lower tothe upper Draupne Formation (Thomas et al., 1985;Justwan and Dahl, 2005). The Draupne Formation hasTOC up to 12 wt% (Thomas et al., 1985) and HydrogenIndices which are well over 600 g HC/kg Corg.However, the formation has large lateral and verticalvariations in source quality (Field, 1985; Huc et al.,1985; Scotchman, 1991; Cooper et al., 1993; Isaksenand Ledje, 2001; Kubala et al. 2003), especially in thenarrow South Viking Graben whose fringing land areaswere the source of terrestrial organic matter. It has beenobserved not only that the terrestrial contributiondecreases upwards (Huc et al., 1985), but also that thereis a distinct difference in source facies and potentialbetween the upper and lower parts of the formation.Thus, the upper section has better source quality andrichness, while the lower part has a higher content ofType III kerogen (Field, 1985; Huc et al., 1985; Isaksenand Ledje, 2001; Isaksen et al., 2002; Kubala et al.,
2003). The upper and lower parts of the DraupneFormation were therefore considered separately inthe present study.
In general, these sections correspond to post- andsyn-rift successions although the identification ofthese intervals is difficult in the study area(Gabrielsen et al., 2001; see also Rawson and Riley,1982; and Rattey and Hayward, 1993). For this study,the base of the J70 sequence of Rattey and Hayward(1993) was chosen as the base of the post-rift section.This corresponds to the base of genetic sequence Dof Middle Volgian age of Fraser et al. (2003), andthe Ti5 sequence boundary of Jacquin et al. (1998)(Fig. 2). Gamma-ray log pattern and geochemical datawere utilized in addition (see below). The lowermostsection of the syn-rift lower Draupne Formation wasdeposited during intensifying rift activity and risingrelative sea level (genetic sequence B, see Fig. 2)with fan systems shedding sands from the surround-ing highs. The South Viking Graben contains a seriesof these basinward-thinning and -fining sandy
140
150
160
Jurassic
Cretaceous
Ryazanian
Volgian
Kimmeridgian
Oxfordian
Callovian
Bathonian
E
D
C
A
PreA
Late
Middle
Early
Late
Early
Upper
Lower
Lower
Upper
Middle
Middle
Middle
Lower
Lower
Upper
Upper
B
Rel.Seaevel*L
Age(after Hardenbol .
1998)et al
Lithostratigraphy(after Dor . 1985; Thomas .1985; Cockings 1992; Fraser
2003)
et al et alet al.
et al.
é
MaHigh Low W E
*Relative sea-level and genetic sequences after Fraser (2003)et. al
Gen.Seq.*
Transition syn- to post-rift
-Basin flushing in Late Ryazanian ends Draupne deposition
-Thermal subsidence prevails
-No active fan systems
-Upper Draupne deposited as draping post-rift clay layer
-Only minor extension, thermal subsidence dominates, onset of post-riftphase, abandonment of fan systems
-Deep water fan systems become very abundant and prograde eastwards fromEast Shetland Platform, also sand input from Utsira High
-Deposition of Lower Draupne Formation with widespread change to dysoxicfacies
-Intensification of rifting activity
-Active fan systems sourced from Utsira High and East Shetland Platform
-Accelerated rifting and deepening
-Continuing southward transgression of Boreal sea along graben axis gives riseto deposition of Heather shales
-Deposition of coastal plain sediments including sands, coals and coaly shales ofthe Sleipner Formation and nearshore sands to coastal plain deposits of theHugin Formation
Major Events(after Rawson & Riley 1982; Cockings 1992; Cornford, 1998; Fraser 2003)et al. et al.
Utsira High
Upper DraupneFormation
Lower DraupneFormation
HeatherFormation
SleipnerFormation
HuginFormation
Intra-Heathersands
Intra-Draupnesands
Intra-Draupnesands
Fig. 2. General stratigraphic chart of the Upper to Middle Jurassic succession in the South Viking Graben witha summary of the major tectonic and depositional events. The Oxfordian to Kimmeridgian DraupneFormation can be divided into an upper post-rift section including genetic sequences D and E (Fraser et al.,2003) and a lower syn-rift section. The Draupne and Heather Formation contain a series of sands sourcedfrom the flanking highs, the East Shetland Platform and the Utsira High.

245H. Justwan et al.
wedges of Kimmeridgian to Volgian age (Thomas etal., 1985; Sneider et al., 1995; Underhill, 1998;Isaksen and Ledje, 2001) which are interpreted to beproximal deep-water slope apron complexes sourcedfrom the East Shetland Platform and the Utsira High(Underhill, 1998; Fraser et al., 2003). They containlarge amounts of reworked terrestrial organic matter(Cooper et al., 1993; Isaksen and Ledje, 2001; Justwanand Dahl, 2005). Rifting intensified in the EarlyVolgian and widespread dysoxic conditions wereestablished (Fraser et al., 2003). A regressive episodefollowed in the Middle Volgian while fan depositioncontinued.
The upper Draupne Formation represents a claylayer deposited during thermal subsidence after thecessation of rifting. Its lowermost section wasdeposited during the late Middle Volgian when fansystems became less common. The uppermost section,corresponding to genetic sequence E of Fraser et al.(2003), does not show the influence of fans (Fig.2).Mass flows from surrounding highs therefore hadmuch less of an influence in the upper DraupneFormation.
In general, areas surrounding highs and close tothe palaeo-shoreline were dominated by the depositionof Type III and IV organic matter (Thomas et al., 1985;Cooper et al., 1993; Kubala et al., 2003). The deep,basinal sections are richest in Type II organic matter(Thomas et al., 1985; Miller, 1990; Cornford, 1998),with a typical concentric, outward-decreasing TOCdistribution (Huc, 1988; Cooper et al., 1993).Although the basinal sections are generally oil prone,they can potentially contain large amounts of inertinitetransported by mass flow processes (Tyson, 1989;Thomas et al., 1985). Below, using recently-acquireddata, we investigate if these general assumptions arestill applicable to the South Viking Graben, andattempt to determine the controls on the distributionof organic facies in this area.
SAMPLES, DATA, ANALYTICAL METHODS
A large Rock-Eval database was available comprisingsamples from 47 wells in the study area, of whicheight where analysed during this project using a VinciTechnologies Rock-Eval 6 in bulk rock mode. Theremaining data is derived from geochemical servicereports publicly available from the NorwegianPetroleum Directorate or were provided by EssoNorway. Cuttings provided by the NorwegianPetroleum Directorate for this project from the sourcerock sections of eight wells were analysed by gaschromatography (GC) and gas chromatography-massspectrometry (GC-MS). In addition, the isotopiccomposition of 15 samples from well 15/9-18 wereanalysed. Vitrinite reflectance data (36 wells), GC and
GC-MS data (26 wells) and isotope data (21 wells)obtained from the Norwegian Petroleum Directorate,Esso Exploration and Production A/S Norway orprevious projects at the University of Bergen werealso used.
Solvent extraction was carried out with a SOXTECSystem HT2 1045 extraction unit on washed, crushedand ground cutting samples with dichloromethane/methanol (93:7) as solvent. The asphaltene fractionof all samples was precipitated by adding an excessamount of n-pentane, following the proceduresuggested in Weiss et al. (2000). For GC, GC-MS andisotope analysis, preparative group-type separation ofthe maltene fraction was carried out using mediumpressure liquid chromatography (MPLC) followingmethods modified from Radke et al. (1980). Thecarbon isotopic analysis of the saturate and aromaticfractions was carried out on a Carlo Erba NA 1500elementary analyser and a Finnigan MAT Delta Eonline mass spectrometer. All results are reportedagainst PDB. The saturate hydrocarbon fraction ofextracts of all source rock samples from wells 15/9-18, 25/5-5, 25/7-2, 16/7-2 and 25/1-10 were analysedusing a Hewlett Packard GC-MSD, consisting of aHP 6890 GC Plus, a HP 5973 Mass Selective Detectoroperating in SIM mode at the University of Bergen.The GC unit was equipped with two HP 19091Z-105HP-1 methyl siloxane columns each of 50 m nominallength, 200 µm nominal diameter and 0.33 µmnominal film thickness. The oven’s initial temperaturewas 50°C and increased regularly during 20 minutesto an end temperature of 310°C until 80 minutes.Helium was used as the carrier gas. The temperatureof the FID was 320°C and the hydrogen flow was 40ml/min, while the airflow was held at 400 ml/min.
The saturate hydrocarbon fractions of samplesfrom wells 15/3-3, 15/3-5 and 16/1-2 (location seeFig.1) were analysed on the same system, but usingtwo HP 19091J-102 HP-5 5% phenyl methyl siloxanecolumns of 25 m nominal length. The oven’s initialtemperature was 70°C, increased during 20 minutesto an end temperature of 310°C until 60 minutes, andthe airflow was held at 450 ml/min. GC and GCMSratios were calculated from measured peak heights.For all analyses performed, standards were run everytenth sample to ensure analytical quality andcomparability of results.
RESULTS AND DISCUSSION
Thickness, areal extent and accumulation ratesof the Upper Jurassic source rock intervalsFor basin modelling, the quality and potential of thesource rock as well as the thickness of the respectivesource intervals should be investigated. To produceisochore maps of the upper Draupne, lower Draupne
246 Late to Middle Jurassic source facies and quality variations, South Viking Graben, North Sea
10
1010
10
10
10
10
50
5050
50
50
50
100
200
26/1
0
26/7
26/4
26/1
25/1
225
/10
25/9
25/8
25/7
25/6
25/5
25/4
25/3
25/2
25/1
24/1
2
24/9
17/1
0
17/7
17/4
17/1
16/1
216
/1116
/10
16/9
16/8
16/7
16/6
16/5
16/4
16/3
16/2
16/1
15/1
2
15/9
15/8
15/6
15/3
16/30
16/29
16/2
4
9/29
9/24
9/19
9/15
9/10
9/5
9/4
9/9
9/14
9/3
9/8
9/13
9/18
9/23
9/28
3/30
3/29
3/28
4/26
1
1S
2 3
45
1
2
3
2
4
5
7 8S
1
1
23
47
8 10
11
12
1415
16
17
18
1
3 10S
11S
2
3
4
5 1
2 4
5
2
3
4
2
1
1
1R2
104
56
7
1314
1
1 5
2
34
12
2
5S
8S9
11 12S
13
1
4
6S
8
115 17
19S
1
1
1
1 0
10
10
10
10
50
50
50
50
50
100
200
800
1000
1200
26/10
26/7
26/4
26/1
25/12
25/11
25/10
25/9
25/8
25/7
25/6
25/5
25/4
25/3
25/2
25/1
24/12
24/9
17/10
17/7
17/4
17/1
16/12
16/11
16/10
16/9
16/8
16/7
16/6
16/5
16/4
16/3
16/2
16/1
15/12
15/9
15/8
15/6
15/5
15/3
16/30
16/29
16/24
10/6
9/29
9/24
9/19
9/15
9/10
9/5
9/4
9/9
9/14
9/3
9/8
9/13
9/18
9/23
9/28
3/30
3/29
3/28
4/26
1
1S
2 3
45
1
2
3
2
4
568
S
1
1
23
47
8 10
11
12
1415
16
17
18
1
3 10S
11S
2
3
4
5 1
2 4
5
2
3
4
2
1
1
1R2
104
56
7
1314
1
1 5
2
34
12
2
5S
7
8S
9
12S
13
1
4
6S
8
115 17
19S
23
1
1
1
2°00
'3°
00'
58°0
0'
59°0
0'
60°0
0'
2°00
'3°
00'
2°00
'3°
00'
58°0
0
59°0
0
60°0
0
010
2030
4050
km
050
200
600
1000
1400
10100
400
800
1200
1600m
0400
800
1200
TotalThickness-UpperJurassicinm
0
200
400
600
800
PartialThicknessesinm
y=0.144x+1.513
R=0.59
n=76
2
10
10
10
10
10
10
10
10
50
50
50
50
50
50
50
50
100
100
100
200
400
400
400
400 600
26/10
26/7
26/4
26/1
25/12
25/10
25/9
25/8
25/7
25/6
25/5
25/4
25/3
25/1
24/12
24/9
17/10
17/7
17/4
17/1
16/12
16/11
16/10
16/9
16/8
16/7
16/6
16/5
16/4
16/3
16/2
16/1
15/12
15/8
15/6
15/3
16/30
16/24
10/6
9/24
9/19
9/15
9/10
9/5
9/4
9/9
9/14
9/3
9/8
9/13
9/18
9/23
9/28
3/30
3/29
3/28
1
1S
2 3
45
1
2
3
2
4
56
7 8S
1
1
23
456 7
89
10
11
12
13
1415
16
17
18
1
3 4510
S
11S
2
3
4
5 1
2
3
4
5
12
3
4
2
1
1R2
104
56
7
12
1314
1
1 5
12
34
12
2
5S
79
11 12S
13
1
2R
4
6S
8
115 17
19S
1
1
16
23
ab
c
0400
800
1200
TotalThickness-UpperJurassicinm
0
200
400
600
800
PartialThicknessesinm
y=0.546x-11.204
R=0.84
n=76
2
0400
800
1200
TotalThickness-UpperJurassicinm
0
200
400
600
800
PartialThicknessesinm
y=0.311x+11.514
R=0.50
n=90
2
Fig.
3. I
soch
ore
map
s of
(a)
the
upp
er D
raup
ne, (
b) t
he lo
wer
Dra
upne
and
(c)
the
Hea
ther
For
mat
ion.
The
map
s w
ere
deri
ved
from
an
Upp
er Ju
rass
ic t
hick
ness
map
bet
wee
n th
e ne
ar b
ase-
Cre
tace
ous
and
the
top-
Mid
dle
Jura
ssic
sur
face
whi
ch w
as s
plit
usi
ng w
ell d
ata
and
the
stat
isti
cal r
elat
ions
hip
betw
een
the
tota
l Upp
erJu
rass
ic t
hick
ness
and
the
par
tial
thi
ckne
sses
of t
he r
espe
ctiv
e un
its
from
wel
l dat
a (s
ee in
set
grap
hs).

247H. Justwan et al.
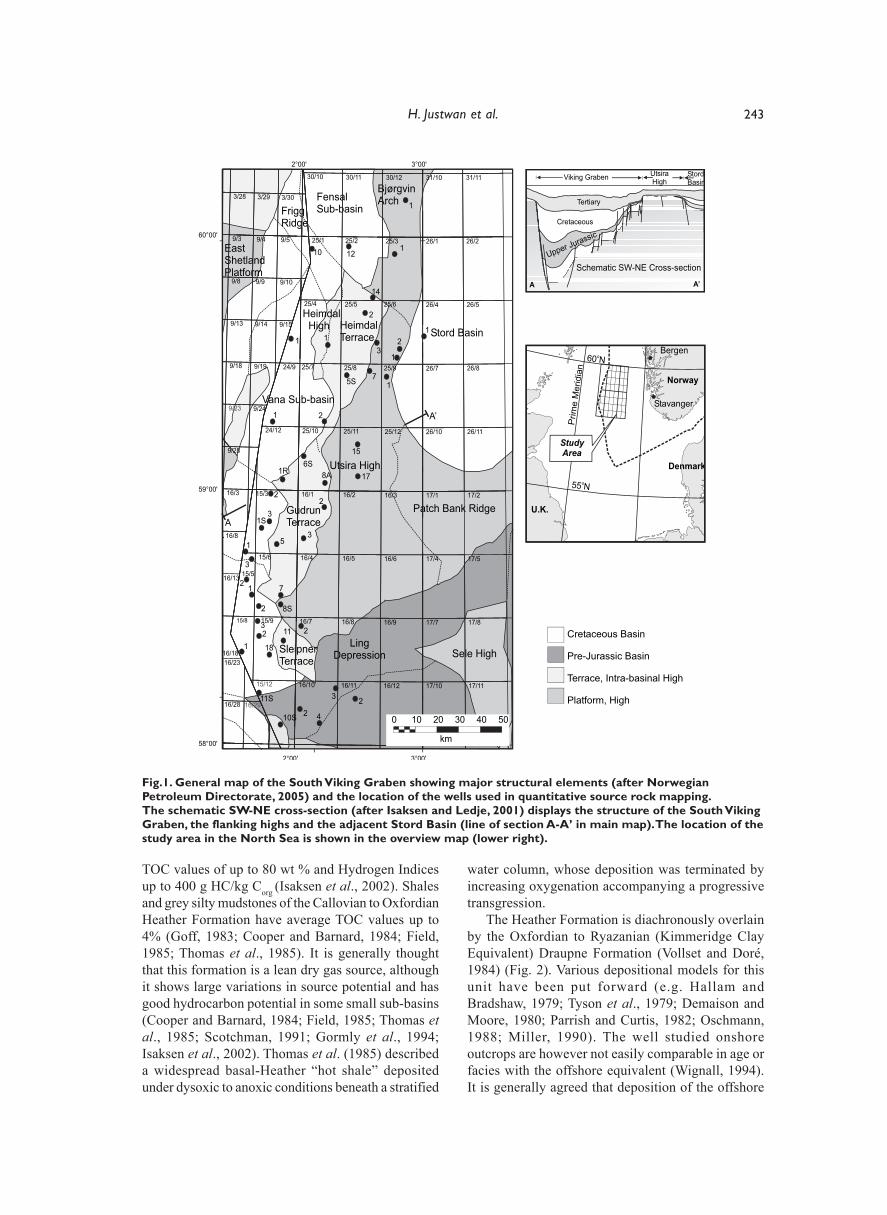
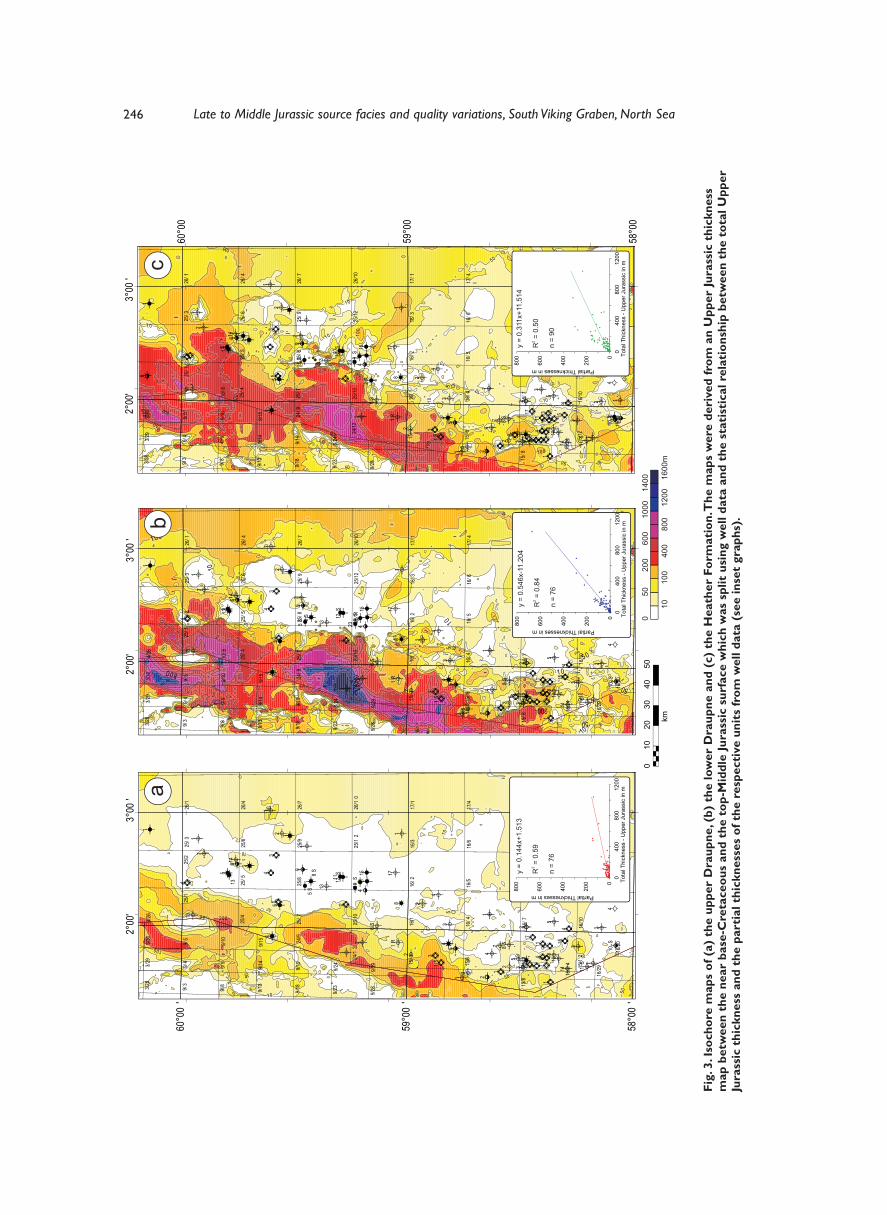
and Heather Formation, a pragmatic statistical approachwas chosen because the intra-Upper Jurassic surfacesare not discernable on seismic sections. This method isvery coarse, but gives a general idea about thedistribution of the analysed source rock sections andtheir thicknesses. The information used comprised anUpper Jurassic thickness map which was based on thenear base-Cretaceous and top-Middle Jurassic surfaces,as well as data from 90 well penetrations. In this process,linear regression analysis was performed to investigatethe statistical relationship between the total thicknessof the Upper Jurassic succession and the partialthicknesses of the upper and lower Draupne and HeatherFormations (Fig. 3, insets).
The total Upper Jurassic thickness and the partialthickness of the lower Draupne Formation are stronglycorrelated (R2 = 0.84) (Fig. 3b, insets), while total andpartial thicknesses for the upper Draupne and theHeather Formation have lower correlation coefficientsof 0.59 and 0.50 respectively (Fig. 3a,c, inset). Basedon the observed statistical relationships (equations seeFig. 3, inset), the total Upper Jurassic isochore wassubdivided into three sections, corresponding to theupper and lower Draupne and Heather Formations.
The maximum modelled thickness of the HeatherFormation is approximately 930 m in the deepest partsof the graben, while the maximum observed thicknessis 315 m in well 24/12-2 (Fig. 3c). The thicknessdecreases to the east and although the Heather Formationdoes not cover the entire Utsira High area, it is the mostwidespread of the three analysed source rock units. Thelower Draupne Formation is up to about 1,600 m thickin depocentres in the graben, with a maximum observedthickness of 671 m in well 15/3-1S and decreases rapidlyin thickness towards the Utsira High in the east (Fig.3b). The upper Draupne Formation is considerablythinner, with thicknesses of up to approximately 330 mand a maximum observed thickness of 142 m in well15/3-3 (Fig. 3a); it appears to fill relief in the graben asa draping clay layer deposited after the cessation ofrifting (Fig. 3a). The Utsira High remained partlyemergent during the deposition of the upper DraupneFormation (Fraser et al., 2003) which is less than 10 mthick on the high.
Average compacted linear sediment accumulationrates were determined for the studied section from welldata using Esso’s proprietary sequence stratigraphicframework. While hiatuses are included, the mass flowsand units have been removed because they representvery rapid events which would introduce additionalerror, increasing the accumulation rates. Theaccumulation rate in the Heather Formation ranges from1 m/Ma to over 50 m/Ma, with an average value ofaround 20 m/Ma in the analysed wells. Linear sedimentaccumulation rates in the lower Draupne Formation arebetween 1 and 47 m/Ma with an average of 11.7 m/Ma.
The upper Draupne Formation appears sedimentstarved and has even lower accumulation rates,reaching a maximum of 20m/Ma in the deep grabenand around 1m/Ma for the condensed sections onthe Utsira High, with an average of only 7m/Ma.Sediment starvation in the mid-Volgian toRyazanian has also been observed in the DanishCentral Graben (Ineson et al., 2003).
Similar accumulation rates were reported byMiller (1990) for the Kimmeridge Clay Equivalentin the Northern North Sea. These values are,however, significantly lower than the 40 to 100 m/Ma for the Kimmeridge Clay of the Wessex Basin(Tyson, 2004) which is the approximate time-equivalent of the offshore lower DraupneFormation. Considering the much larger thicknessesin the undrilled sections of the South Viking Grabennot used in the calculations above, values in theSouth Viking Graben might however approach thoseof Tyson (2004).
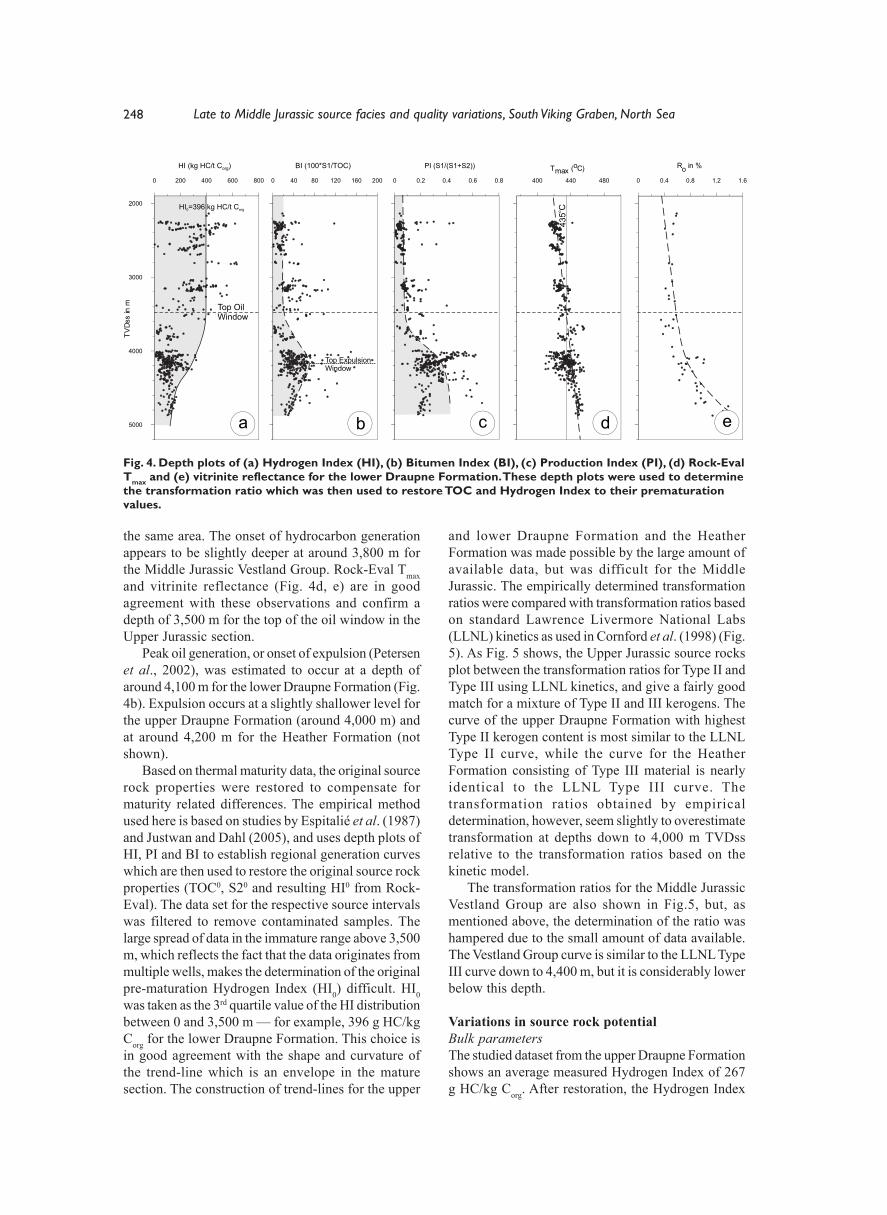
Source rock thermal maturityand hydrocarbon generationThe analysed sections exhibit a wide range ofthermal maturities as a function of burial depth,ranging from immature on the highs to late maturein the deeper parts of the graben. Maturitydetermination is strongly dependent on kerogen type(Tissot and Welte, 1984; Waples and Marzi, 1998;Kubala et al., 2003). Various studies (e.g. Huc etal., 1985; Isaksen and Ledje, 2001; Kubala et al.,2003; Justwan and Dahl, 2005) have shown thatthe Draupne and Heather Formation containvariable mixtures of terrestrial and marine organicmatter. Source rocks in the Middle Jurassic VestlandGroup, which were deposited in a generallyterrestrial environment, are dominated by Type IIIkerogen. Due to these variations, the source rockthermal maturity was determined for each sectionseparately. The onset of generation was determinedfrom depth plots of the Hydrogen Index (HI),Bitumen Index (BI=S1/TOC*100) and ProductionIndex (PI=S1/(S1+S2)), and cross-checked withhigh-quality vitrinite reflectance and Rock-Eval Tmaxvalues (Fig. 4a-e).
The HI versus depth plot (Fig. 4a) is a goodindicator for the onset of generation (Petersen etal., 2002; Kubala et al., 2003; Justwan and Dahl,2005). In the study area, within the Upper Jurassic,a decline in the HI trend at around 3,500 m coincideswith vitrinite reflectance values of 0.6% and Tmaxvalues of 435 ºC, all indicating the onset ofhydrocarbon generation. Baird (1986) determinedthe onset of generation to be at 3,340 m, whileIsaksen and Ledje (2001) proposed a depth of 3,400m and Kubala et al. (2003) a depth of 3,500 m for
248 Late to Middle Jurassic source facies and quality variations, South Viking Graben, North Sea
the same area. The onset of hydrocarbon generationappears to be slightly deeper at around 3,800 m forthe Middle Jurassic Vestland Group. Rock-Eval Tmaxand vitrinite reflectance (Fig. 4d, e) are in goodagreement with these observations and confirm adepth of 3,500 m for the top of the oil window in theUpper Jurassic section.
Peak oil generation, or onset of expulsion (Petersenet al., 2002), was estimated to occur at a depth ofaround 4,100 m for the lower Draupne Formation (Fig.4b). Expulsion occurs at a slightly shallower level forthe upper Draupne Formation (around 4,000 m) andat around 4,200 m for the Heather Formation (notshown).
Based on thermal maturity data, the original sourcerock properties were restored to compensate formaturity related differences. The empirical methodused here is based on studies by Espitalié et al. (1987)and Justwan and Dahl (2005), and uses depth plots ofHI, PI and BI to establish regional generation curveswhich are then used to restore the original source rockproperties (TOC0, S20 and resulting HI0 from Rock-Eval). The data set for the respective source intervalswas filtered to remove contaminated samples. Thelarge spread of data in the immature range above 3,500m, which reflects the fact that the data originates frommultiple wells, makes the determination of the originalpre-maturation Hydrogen Index (HI0) difficult. HI0was taken as the 3rd quartile value of the HI distributionbetween 0 and 3,500 m — for example, 396 g HC/kgCorg for the lower Draupne Formation. This choice isin good agreement with the shape and curvature ofthe trend-line which is an envelope in the maturesection. The construction of trend-lines for the upper
and lower Draupne Formation and the HeatherFormation was made possible by the large amount ofavailable data, but was difficult for the MiddleJurassic. The empirically determined transformationratios were compared with transformation ratios basedon standard Lawrence Livermore National Labs(LLNL) kinetics as used in Cornford et al. (1998) (Fig.5). As Fig. 5 shows, the Upper Jurassic source rocksplot between the transformation ratios for Type II andType III using LLNL kinetics, and give a fairly goodmatch for a mixture of Type II and III kerogens. Thecurve of the upper Draupne Formation with highestType II kerogen content is most similar to the LLNLType II curve, while the curve for the HeatherFormation consisting of Type III material is nearlyidentical to the LLNL Type III curve. Thetransformation ratios obtained by empiricaldetermination, however, seem slightly to overestimatetransformation at depths down to 4,000 m TVDssrelative to the transformation ratios based on thekinetic model.
The transformation ratios for the Middle JurassicVestland Group are also shown in Fig.5, but, asmentioned above, the determination of the ratio washampered due to the small amount of data available.The Vestland Group curve is similar to the LLNL TypeIII curve down to 4,400 m, but it is considerably lowerbelow this depth.
Variations in source rock potentialBulk parametersThe studied dataset from the upper Draupne Formationshows an average measured Hydrogen Index of 267g HC/kg Corg. After restoration, the Hydrogen Index
0 200 400 600 800
HI (kg HC/t Corg)
5000
4000
3000
2000
TVDssinm
0 40 80 120 160 200
BI (100*S1/TOC)
0 0.2 0.4 0.6 0.8
PI
400 440 480
Tmax (oC)
0 0.4 0.8 1.2 1.6
Ro in %
HI =396 kg HC/t C0 org
Top ExpulsionWindow
Top OilWindow
435Co
a b c d e
PI (S1/(S1+S2))
Fig. 4. Depth plots of (a) Hydrogen Index (HI), (b) Bitumen Index (BI), (c) Production Index (PI), (d) Rock-EvalTmax and (e) vitrinite reflectance for the lower Draupne Formation. These depth plots were used to determinethe transformation ratio which was then used to restore TOC and Hydrogen Index to their prematurationvalues.

249H. Justwan et al.
0 0.2 0.4 0.6 0.8 1Tr in %
5000
4000
3000
TVDssinm
LLNL TypeIILLNL TypeIIIUpper Draupne FmLower Draupne FmHeather FmVestland Group
shows a bimodal distribution (Fig. 6) with peaks ataround 300 and 450 g HC/kg Corg. This derives fromthe fact that only the mature samples are corrected,which form a second peak. The distribution suggeststhat the upper Draupne Formation contains a mixtureof Type II and Type III kerogen with a highercontribution of Type II source material. Averagerestored TOC is 5.3 wt% and the samples show a TOCrange of up to 12 wt%. The lower Draupne Formationshows a considerable lower average restoredHydrogen Index of 234.2 g HC/kg Corg and a moreunimodal distribution, indicating a greater proportionof terrestrial dominated kerogen of Type III to II (Fig.6). The average restored TOC is 4.1 wt%. Even loweraverage restored TOC and Hydrogen Index values of3.6 wt% and 184.2 g HC/kg Corg respectively, aretypical for the Heather Formation. The MiddleJurassic Vestland Group is difficult to evaluate andaverage values for TOC and Hydrogen Index are oflittle use as no lithological differentiation betweencoals and non-coaly samples has been made. TOCranges up to 80 wt%, while restored Hydrogen Indicesreach up to 400 g HC/kg Corg (Fig. 6).
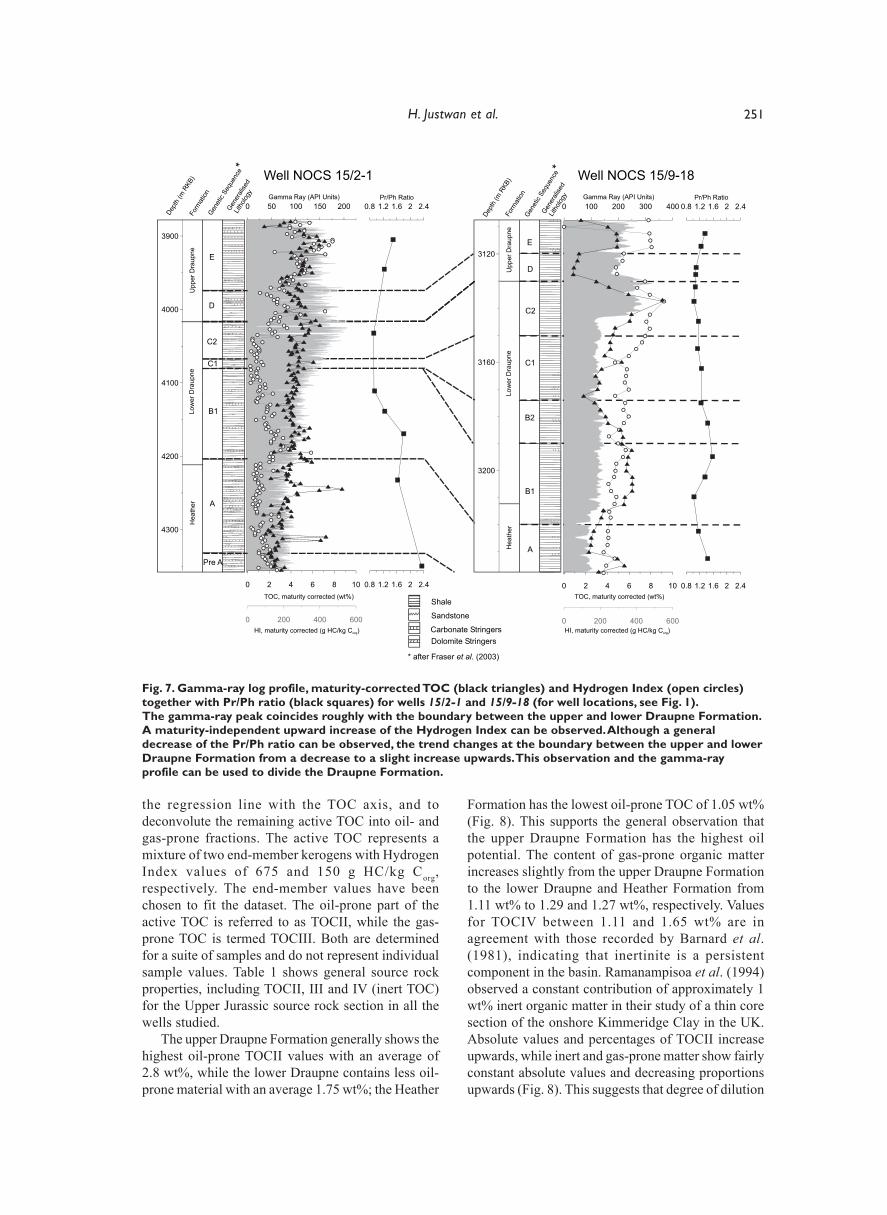
Gamma-ray log character and vertical changesin HI and TOCCorrelation of the Upper Jurassic section using welllogs is difficult in the South Viking Graben. Whilethe basinal sections are thick, are often expanded bymass flow deposits and span a long time interval, thesections on the high are thin and incomplete due toerosion and non-deposition. The upper DraupneFormation is often found to rest directly on the HeatherFormation on highs in the area. However, a numberof general observations can be made. Thus, a generalincrease in gamma-ray values up to the top of geneticsequence C2 or the base of sequence D (Fraser et al.,2003) in the Middle Volgian can be observed, withgamma-ray API values up to 300 (Fig. 7). This peak
appears to be of basinwide extent and is only missingwhere the section is eroded. Overlying this “hot”interval, which corresponds to the hot shale of Kubalaet al. (2003), is one unit with slightly lower gamma-ray values and another unit with elevated values ontop of the section which is not present everywhere.Kubala et al. (2003) made similar observations in theEast Shetland Basin and defined a hot shale unitfollowed by an upper cool shale and an upper hot shale.
The peak of the gamma-ray log coincides with theboundary chosen for the syn- and post-rift sections inthis study, for example in wells 15/2-1, 15/3-3 and15/9-18 (Fig. 7). In other wells, for example 15/3-1Sand 15/3-5, this peak occurs slightly earlier or later.The time of this gamma-ray peak coincides roughlywith a regressive period in the mid-Volgian (Fig. 2)(Fraser et al., 2003).
These observations were used to divide the UpperJurassic into syn- and post-rift packages, incombination with the Pr/Ph ratio which tends to changefrom a general upward decrease to a slight increase atthe same time (Fig. 7). Kubala et al. (2003) used asimilar subdivision and grouped their “hot shale” andthe overlying units as an “upper facies” and theunderlying units as a “lower facies” of the KimmeridgeClay Equivalent. TOC values generally tend to followthe gamma-ray trend and are overall higher in theupper Draupne Formation. In addition, a generalupwards increase of the Hydrogen Index was observed(Fig. 7) as previously described by Dahl and Speers(1985), Huc et al. (1985) and Justwan and Dahl (2005).Hydrogen Index values were all maturity corrected;therefore, this trend must be related to the sourcefacies. The topmost section may, however, show aslight decrease in Hydrogen Index, as was alsoobserved by Justwan and Dahl (2005).
The similarity between the East Shetland Basin andthe South Viking Graben suggests the rather uniformdevelopment of the Kimmeridge Clay Equivalent in
Fig. 5. Comparison of empirically-determinedtransformation ratios for the upper and lowerDraupne Formation, the Heather Formation andthe Middle Jurassic Vestland Group, withtransformation ratios for Type II and III kerogenbased on standard Lawrence Livermore NationalLab kinetics (as used in Cornford et al., 1998). Ratiosare plotted versus depth (not vitrinite reflectance),based on a regional vitrinite reflectance-depthrelationship.

250 Late to Middle Jurassic source facies and quality variations, South Viking Graben, North Sea
the North Sea area, extending south into the CentralGraben (pers. comm. Iain Scotchman).
Oil and gas potentialThe source rock potential of the Upper Jurassic sourcerock intervals was quantified using the methoddescribed by Dahl et al. (2004) and Justwan and Dahl
(2005). This method is a practical and rapid means toassess the average amount of oil- and gas-producingconstituents in a source rock when only Rock-Evaland TOC data are available, as is the case for thisstudy. A cross-plot of maturity-corrected Rock-EvalS2 and TOC was used to determine the amount ofinert organic carbon represented by the intercept of
Fig. 6. Histograms for measured and maturity-corrected TOC and Hydrogen Index for the Upper and MiddleJurassic source rock sections. The histograms for the Vestland Group include samples from the Hugin andSleipner Formations. Hydrogen Indices are much more affected by the maturity correction than TOC values.
0 10 20 30 0 200 400 600 800
0 10 20 30 0 200 400 600 800
0 10 20 30 0 200 400 600 800
0 10 20 30 0 200 400 600 800
Upper Draupne Formation (210 samples, 32 wells)
Lower Draupne Formation (520 samples, 33 wells)
Heather Formation (334 samples, 36 wells)
Vestland Group (152 samples, 24 wells)
Average Values:
TOC: 4.9 wt%
TOC : 5.3 wt%0
Average Values:
TOC: 3.9 wt%
TOC : 4.1 wt%0
Average Values:
TOC: 3.5 wt%
TOC : 3.6 wt%0
Average Values:TOC: 9.2 wt%
TOC : 9.4 wt%0
Average Values:
HI: 266.6 g HC/kg C
HI : 340.1 g HC/kg C
org
org0
Average Values:
HI: 191.7 g HC/kg C
HI : 234.2 g HC/kg C
org
org0
Average Values:
HI: 162.7 g HC/kg C
HI : 184.2 g HC/kg C
org
org0
Average Values:
HI: 204.2 g HC/kg C
HI : 224.4 g HC/kg C
org
org0
0
10
20
30
%
TOC in wt%
0
8
12
16
%
4
HI in g HC/kg Corg
0
10
20
30
%
0
10
20
30
%
0
10
20
30
%
TOC in wt%
TOC in wt%
TOC in wt%
0
8
12
16
%
4
0
8
12
16
%
4
0
15
20
25
%
HI in g HC/kg Corg
HI in g HC/kg Corg
HI in g HC/kg Corg
10
540 60 80
1.2
0.8%
wt%
Maturity corrected values Measured values
251H. Justwan et al.
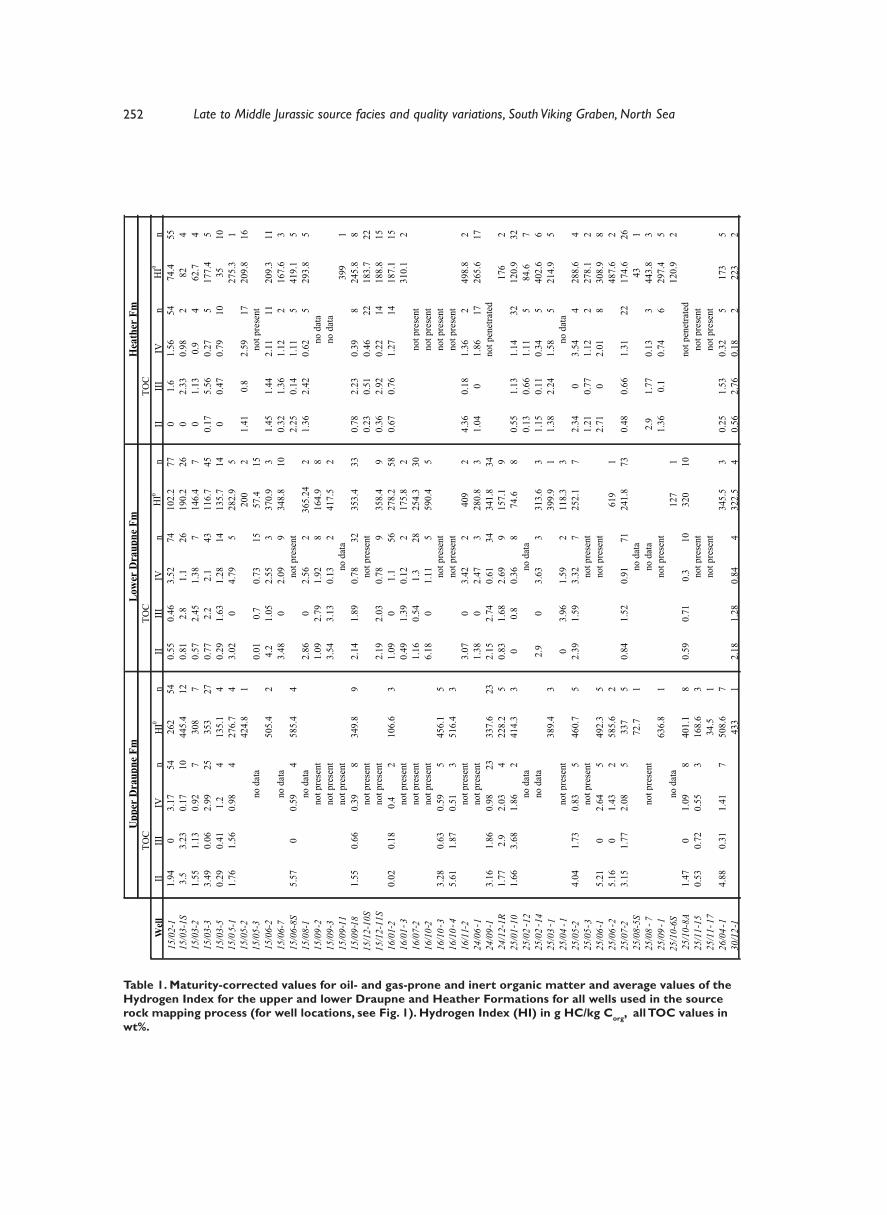
the regression line with the TOC axis, and todeconvolute the remaining active TOC into oil- andgas-prone fractions. The active TOC represents amixture of two end-member kerogens with HydrogenIndex values of 675 and 150 g HC/kg Corg,respectively. The end-member values have beenchosen to fit the dataset. The oil-prone part of theactive TOC is referred to as TOCII, while the gas-prone TOC is termed TOCIII. Both are determinedfor a suite of samples and do not represent individualsample values. Table 1 shows general source rockproperties, including TOCII, III and IV (inert TOC)for the Upper Jurassic source rock section in all thewells studied.
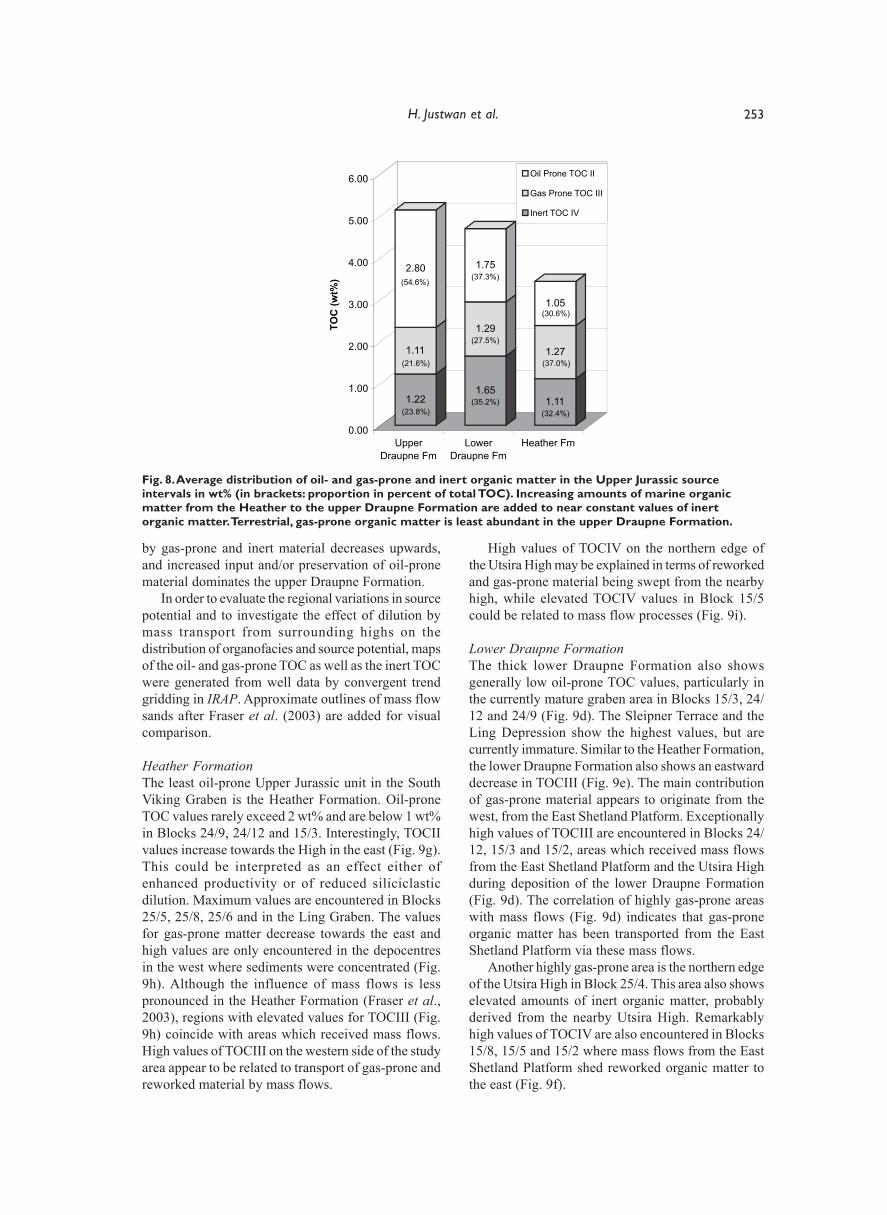
The upper Draupne Formation generally shows thehighest oil-prone TOCII values with an average of2.8 wt%, while the lower Draupne contains less oil-prone material with an average 1.75 wt%; the Heather
Formation has the lowest oil-prone TOC of 1.05 wt%(Fig. 8). This supports the general observation thatthe upper Draupne Formation has the highest oilpotential. The content of gas-prone organic matterincreases slightly from the upper Draupne Formationto the lower Draupne and Heather Formation from1.11 wt% to 1.29 and 1.27 wt%, respectively. Valuesfor TOCIV between 1.11 and 1.65 wt% are inagreement with those recorded by Barnard et al.(1981), indicating that inertinite is a persistentcomponent in the basin. Ramanampisoa et al. (1994)observed a constant contribution of approximately 1wt% inert organic matter in their study of a thin coresection of the onshore Kimmeridge Clay in the UK.Absolute values and percentages of TOCII increaseupwards, while inert and gas-prone matter show fairlyconstant absolute values and decreasing proportionsupwards (Fig. 8). This suggests that degree of dilution
Depth(mRKB)
Gamma Ray (API Units) Pr/Ph Ratio Gamma Ray (API Units) Pr/Ph Ratio
GeneticSequence*
Generalised
Lithology
TOC, maturity corrected (wt%)
HI, maturity corrected (g HC/kg C )org
TOC, maturity corrected (wt%)
HI, maturity corrected (g HC/kg C )org
Depth(mRKB)
Formation
GeneticSequence*
Formation
UpperDraupne
LowerDraupne
Heather
E
D
C1
C2
B1
A
E
D
C1
C2
B2
B1
APre A
UpperDraupne
LowerDraupne
Heather
Generalised
Lithology
Well NOCS 15/2-1 Well NOCS 15/9-18
Dolomite Stringers
Shale
Sandstone
Carbonate Stringers
* after Fraser (2003)et al.
0 2 4 6 8 10
0 200 400 600
0 50 100 150 200
0.8 1.2 1.6 2 2.4
4300
4200
4100
4000
3900
0.8 1.2 1.6 2 2.4
0 200 400 600
0 2 4 6 8 10
0 100 200 300 400
3200
3160
3120
0.8 1.2 1.6 2 2.4
0.8 1.2 1.6 2 2.4
Fig. 7. Gamma-ray log profile, maturity-corrected TOC (black triangles) and Hydrogen Index (open circles)together with Pr/Ph ratio (black squares) for wells 15/2-1 and 15/9-18 (for well locations, see Fig. 1).The gamma-ray peak coincides roughly with the boundary between the upper and lower Draupne Formation.A maturity-independent upward increase of the Hydrogen Index can be observed. Although a generaldecrease of the Pr/Ph ratio can be observed, the trend changes at the boundary between the upper and lowerDraupne Formation from a decrease to a slight increase upwards. This observation and the gamma-rayprofile can be used to divide the Draupne Formation.
252 Late to Middle Jurassic source facies and quality variations, South Viking Graben, North Sea
Table 1. Maturity-corrected values for oil- and gas-prone and inert organic matter and average values of theHydrogen Index for the upper and lower Draupne and Heather Formations for all wells used in the sourcerock mapping process (for well locations, see Fig. 1). Hydrogen Index (HI) in g HC/kg Corg, all TOC values inwt%.
Wel
lII
IIIIV
nH
I0n
IIIII
IVn
nII
IIIIV
nn
1.94
03.
1754
262
540.
550.
463.
5274
102.
277
01.
61.
5654
74.4
5515/03-1S
3.5
3.23
0.17
1044
5.4
120.
812.
81.
126
190.
226
02.
330.
982
824
1.55
1.13
0.92
730
87
0.57
2.45
1.38
714
6.4
70
1.13
0.9
462
.74
3.49
0.06
2.99
2535
327
0.77
2.2
2.1
4311
6.7
450.
175.
560.
275
177.
45
0.29
0.41
1.2
413
5.1
40.
291.
631.
2814
135.
714
00.
470.
7910
3510
1.76
1.56
0.98
427
6.7
43.
020
4.79
528
2.9
527
5.3
142
4.8
120
02
1.41
0.8
2.59
1720
9.8
160.
010.
70.
7315
57.4
1550
5.4
24.
21.
052.
553
370.
93
1.45
1.44
2.11
1120
9.3
113.
480
2.09
934
8.8
100.
321.
361.
122
167.
63
15/06- - - -8S
15/08-1
5.57
00.
594
585.
44
2.25
0.14
1.11
541
9.1
52.
860
2.56
236
5.24
21.
362.
420.
625
293.
85
15/09-2
1.09
2.79
1.92
816
4.9
815/093
3.54
3.13
0.13
241
7.5
215/0911
399
115/0918
1.55
0.66
0.39
834
9.8
92.
141.
890.
7832
353.
433
0.78
2.23
0.39
824
5.8
815/12-10S
0.23
0.51
0.46
2218
3.7
2215/12-11S
2.19
2.03
0.78
935
8.4
90.
362.
920.
2214
188.
815
16/012
0.02
0.18
0.4
210
6.6
31.
090
1.1
5627
8.2
580.
670.
761.
2714
187.
115
16/013
0.49
1.39
0.12
217
5.8
231
0.1
216/072
1.16
0.54
1.3
2825
4.3
3016/102
6.18
01.
115
590.
45
16/103
3.28
0.63
0.59
545
6.1
516/104
5.61
1.87
0.51
351
6.4
316/112
3.07
03.
422
409
24.
360.
181.
362
498.
82
24/061
1.38
02.
473
280.
83
1.04
01.
8617
265.
617
24/091
3.16
1.86
0.98
2333
7.6
232.
152.
740.
6134
341.
834
24/12- - - - - - - - - - -1R
1.77
2.9
2.03
422
8.2
50.
831.
682.
699
157.
19
176
225/0110
1.66
3.68
1.86
241
4.3
30
0.8
0.36
874
.68
0.55
1.13
1.14
3212
0.9
3225/0212
0.13
0.66
1.11
584
.67
25/021 4
2.9
03.
633
313.
63
1.15
0.11
0.34
540
2.6
625/031
389.
43
399.
91
1.38
2.24
1.58
521
4.9
525/041
03.
961.
592
118.
33
25/052
4.04
1.73
0.83
546
0.7
52.
391.
593.
327
252.
17
2.34
03.
544
288.
64
25/053
1.21
0.77
1.12
227
8.1
225/061
5.21
02.
645
492.
35
2.71
02.
018
308.
98
25/062
5.16
01.
432
585.
62
619
148
7.6
225/072
3.15
1.77
2.08
533
75
0.84
1.52
0.91
7124
1.8
730.
480.
661.
3122
174.
626
25/08-- -5S
72.7
143
125/087
2.9
1.77
0.13
344
3.8
325/091
636.
81
1.36
0.1
0.74
629
7.4
525/10-6S
127
112
0.9
225/10- - - - -8A
1.47
01.
098
401.
18
0.59
0.71
0.3
1032
010
25/1115
0.53
0.72
0.55
316
8.6
325/1117
34.5
126/041
4.88
0.31
1.41
750
8.6
734
5.5
30.
251.
530.
325
173
530/121
433
12.
181.
280.
844
322.
54
0.56
2.76
0.18
222
32
not p
rese
ntno
t pre
sent
not p
rese
ntno
dat
ano
t pen
etra
ted
not p
rese
ntno
t pre
sent
not p
rese
nt
no d
ata
not p
rese
ntno
dat
a
not p
rese
ntno
dat
a
not p
rese
ntno
t pre
sent
not p
enet
rate
d
no d
ata
no d
ata
no d
ata
not p
rese
ntno
t pre
sent
not p
rese
ntno
t pre
sent
not p
rese
ntno
t pre
sent
not p
rese
ntno
t pre
sent
not p
rese
nt
not p
rese
ntno
t pre
sent
not p
rese
nt
not p
rese
ntno
dat
a
not p
rese
ntno
t pre
sent
no d
ata
not p
rese
ntno
dat
ano
t pre
sent
no d
ata
no d
ata
not p
rese
nt
no d
ata
not p
rese
nt
Upp
er D
raup
ne F
mLo
wer
Dra
upne
Fm
Hea
ther
Fm
TOC
TOC
TOC
HI0
HI0
15/02-1
15/03-2
15/03-3
15/03-5
15/05-1
15/05-2
15/05-3
15/06-2
15/06-7 - - - - - - - - -
253H. Justwan et al.
by gas-prone and inert material decreases upwards,and increased input and/or preservation of oil-pronematerial dominates the upper Draupne Formation.
In order to evaluate the regional variations in sourcepotential and to investigate the effect of dilution bymass transport from surrounding highs on thedistribution of organofacies and source potential, mapsof the oil- and gas-prone TOC as well as the inert TOCwere generated from well data by convergent trendgridding in IRAP. Approximate outlines of mass flowsands after Fraser et al. (2003) are added for visualcomparison.
Heather FormationThe least oil-prone Upper Jurassic unit in the SouthViking Graben is the Heather Formation. Oil-proneTOC values rarely exceed 2 wt% and are below 1 wt%in Blocks 24/9, 24/12 and 15/3. Interestingly, TOCIIvalues increase towards the High in the east (Fig. 9g).This could be interpreted as an effect either ofenhanced productivity or of reduced siliciclasticdilution. Maximum values are encountered in Blocks25/5, 25/8, 25/6 and in the Ling Graben. The valuesfor gas-prone matter decrease towards the east andhigh values are only encountered in the depocentresin the west where sediments were concentrated (Fig.9h). Although the influence of mass flows is lesspronounced in the Heather Formation (Fraser et al.,2003), regions with elevated values for TOCIII (Fig.9h) coincide with areas which received mass flows.High values of TOCIII on the western side of the studyarea appear to be related to transport of gas-prone andreworked material by mass flows.
High values of TOCIV on the northern edge ofthe Utsira High may be explained in terms of reworkedand gas-prone material being swept from the nearbyhigh, while elevated TOCIV values in Block 15/5could be related to mass flow processes (Fig. 9i).
Lower Draupne FormationThe thick lower Draupne Formation also showsgenerally low oil-prone TOC values, particularly inthe currently mature graben area in Blocks 15/3, 24/12 and 24/9 (Fig. 9d). The Sleipner Terrace and theLing Depression show the highest values, but arecurrently immature. Similar to the Heather Formation,the lower Draupne Formation also shows an eastwarddecrease in TOCIII (Fig. 9e). The main contributionof gas-prone material appears to originate from thewest, from the East Shetland Platform. Exceptionallyhigh values of TOCIII are encountered in Blocks 24/12, 15/3 and 15/2, areas which received mass flowsfrom the East Shetland Platform and the Utsira Highduring deposition of the lower Draupne Formation(Fig. 9d). The correlation of highly gas-prone areaswith mass flows (Fig. 9d) indicates that gas-proneorganic matter has been transported from the EastShetland Platform via these mass flows.
Another highly gas-prone area is the northern edgeof the Utsira High in Block 25/4. This area also showselevated amounts of inert organic matter, probablyderived from the nearby Utsira High. Remarkablyhigh values of TOCIV are also encountered in Blocks15/8, 15/5 and 15/2 where mass flows from the EastShetland Platform shed reworked organic matter tothe east (Fig. 9f).
1.22
1.11
2.80
1.65
1.29
1.75
1.11
1.27
1.05
0.00
1.00
2.00
3.00
4.00
5.00
6.00
TOC(wt%)
UpperDraupne Fm
LowerDraupne Fm
Heather Fm
Oil Prone TOC II
Gas Prone TOC III
Inert TOC IV
(54.6%)(37.3%)
(30.6%)
(21.6%)
(27.5%)
(37.0%)
(23.8%)(35.2%)
(32.4%)
Fig. 8. Average distribution of oil- and gas-prone and inert organic matter in the Upper Jurassic sourceintervals in wt% (in brackets: proportion in percent of total TOC). Increasing amounts of marine organicmatter from the Heather to the upper Draupne Formation are added to near constant values of inertorganic matter. Terrestrial, gas-prone organic matter is least abundant in the upper Draupne Formation.

254 Late to Middle Jurassic source facies and quality variations, South Viking Graben, North Sea
0.50
0.50
1
1
1
1
1 . 50
1.50
1.50
2
2
2
2
2
2 . 503
3 .50
25/1225/1125/10
25/925/825/7
25/625/525/4
25/325/225/1
24/12
24/9
16/1116/10
16/816/7
16/516/4
16/216/1
15/12
15/915/8
15/6
15/3
1
1 S
2
3
5
1
8 S
18
2
3
4
1
1 R
10
2
12
2
8
15
1
58°00'
59°00'
60°00'
2°00' 3°00'
26/1
26/4
26/7
26/10
16/3
16/6 17/4
17/1
16/9 17/7
16/12 17/10
3/28 3/29 3/30
9/59/3
9/8 9/9 9/10
9/13 9/14 9/15
9/18 9/19
9/23 9/24
9/28
16/29
Utsira High
SleipnerTerrace
Ling Graben
Stord Basin
EastShetlandPlatform
Viking Graben
0.50
0. 501
1
1. 50
1.50
2
2
2
2. 50
2.50
3
3
3.50
3.504
4.5055.506
26/7
25/1225/1125/10
25/925/825/7
25/625/525/4
25/325/225/1
24/12
24/9
16/10
16/7
16/4
16/216/1
15/12
15/915/8
15/615/5
15/3
10/6
1
1 S
2
3
5
18 S
18
2
3
4
1
1 R
10
2
12
2
8
15
1
58°00'
59°00'
60°00'
2°00' 3°00'3/303/293/28
9/3 9/5
9/8 9/9 9/10
9/13 9/14 9/15
9/249/23
9/18 9/19
9/28 9/29
17/7
17/416/616/5
16/8 16/9
17/1016/1216/11
26/10
16/3 17/1
26/1
26/4
Utsira High
SleipnerTerrace
Ling Graben
Stord Basin
EastShetlandPlatform
Viking Graben
. 50
0. 50
0.50
1
1
1
1. 50 1 . 50
1.50
2
2
2
2
2.50
2.50
2.50
3
3
3
3.50
3. 5
0
3.50
4
4
4
4.50
4.50
4.50
5
5
5
5.50
5. 50
5.50
6 6. 50 6.50
26/7
25/1225/1125/10
25/925/825/7
25/625/525/4
25/325/225/1
24/12
24/9
16/1116/10
16/8
16/516/4
16/216/1
15/12
15/8
15/6
15/3
1
1 S
2
3
5
1
8 S
18
2
3
4
1
1 R
10
2
12
2
8
15
1
58°00'
59°00'
60°00'
2°00' 3°00'
26/1
26/4
26/10
16/3 17/1
16/6 17/4
16/9 17/7
16/12 17/10
3/28 3/29 3/30
9/5
9/8 9/9 9/10
9/149/13
9/18 9/19
9/28
9/23
Utsira High
SleipnerTerrace
Ling Graben
Stord Basin
EastShetlandPlatform
Viking Graben
0.50
0.50
1
1
1.50
1.50
2
2
2
2.50
3
3
3
3.50
3.50
4
4
4.50 5
25/1125/10
25/825/7
25/525/4
25/325/225/1
24/12
24/9
16/1116/10
16/816/7
16/516/4
16/216/1
15/12
15/915/8
15/6
15/3
3/293/28
1
1 S
2
3
5
1
3
27
1
2
3
18
11 S
2
3
2
22
1
1
1 R
10
14
1
2
2
8
1
58°00'
59°00'
60°00'
2°00' 3°00'3/30
9/5
9/8 9/9 9/10
9/13 9/14
9/18 9/19
9/23 9/24
9/28
26/1
26/425/6
25/9 26/7
25/12 26/10
16/3 17/1
16/6 17/4
16/9 17/7
17/1016/12
Utsira High
SleipnerTerrace
Ling Graben
Stord Basin
EastShetlandPlatform
Viking Graben
0.50
0.50
1
1
1
1.50
1.50
2
2
2
2.50
2.50
25/1125/10
25/825/7
25/525/4
25/225/1
24/12
24/9
16/1116/10
16/7
16/516/4
16/216/1
15/12
15/915/8
15/6
15/3
1
1 S
2
3
5
1
3
27
1
2
3
18
11 S
2
3
2
22
1
1
1 R
10
14
1
2
2
8
1
58°00'
59°00'
60°00'
2°00' 3°00'
25/3
25/6
16/12 17/10
16/8 16/9 17/7
26/1
26/4
25/9 26/7
25/12 26/10
16/3 17/1
16/6 17/4
9/8 9/9 9/10
9/59/3
3/28 3/29 3/30
9/13 9/14
9/23 9/24
9/28
9/18 9/19
Utsira High
SleipnerTerrace
Ling Graben
Stord Basin
EastShetlandPlatform
Viking Graben
0.50
1
1
1
1
1.50
1.50
1.50
1.50
2
2
2
2
2
2.50
2.50
2.50
3
3
3.50
3.50
4
4
25/1125/10
25/825/7
25/625/525/4
25/325/225/1
24/12
24/9
16/10
16/7
16/516/4
16/216/1
15/12
15/915/8
15/6
15/3
16/29
1
1 S
2
3
5
1
3
27
1
2
3
18
11 S
2
3
2
22
1
1
1 R
10
14
1
2
2
8
1
58°00'
59°00'
60°00'
2°00' 3°00'
26/4
26/1
25/9 26/7
25/12 26/10
16/3 17/1
16/6 17/4
16/9 17/7
17/1016/1216/11
16/8
3/28 3/29 3/30
9/3 9/5
9/8 9/9 9/10
9/13 9/14
9/18 9/19
9/23 9/24
9/28
Utsira High
SleipnerTerrace
Ling Graben
Stord Basin
EastShetlandPlatform
Viking Graben
(a) TOCII (b) TOCIII (c) TOCIV
(d) TOCII (e) TOCIII (f) TOCIV
Upper Draupne Formation
Lower Draupne Formation
Fig. 9. Quantitative source rock potential maps (maturity-corrected) of the Upper Jurassic section in theSouth Viking Graben.(a-c) oil-prone, gas-prone and inert organic matter for the upper Draupne Formation.(d-f) oil-prone, gas-prone and inert organic matter for the lower Draupne Formation.(g-i) (facing page) oil-prone, gas-prone and inert organic matter for the Heather Formation.Approximate maximum extent of mass flow sands after Fraser et al. (2003).

255H. Justwan et al.
The maps in Fig. 9 clearly show the influence ofgas-prone and inert organic matter transported by massflows and their dilution effect. In the fairly narrowSouth Viking Graben, gas-prone as well as reworkedmaterial may have reached the deepest part of thegraben from both flanks. This led to a complex mixingof oil- and gas-prone organic matter.
Upper Draupne FormationThe maps for the upper Draupne Formation illustratethe significantly different organic facies within thissection. Oil-prone organic matter reaches 3.5 wt % inmost of the study area (Fig. 9a). Maxima occur on thewestern flank of the Stord Basin in Blocks 25/6 and26/4, on the southern edge of the Utsira High in Block15/6 and in the Ling Depression, areas which are allcurrently immature. Minimum values are encounteredon the Utsira High in Blocks 16/1 and 25/11. A furtherzone of low oil potential is located in Blocks 24/12,15/3 and 15/5, where mass flows of the Brae trendremained active (Fraser et al., 2003).
The amount of gas-prone organic matter isgenerally lower than of oil-prone material and againshows an eastward decrease towards the Utsira High(Fig. 9b). In contrast to the lower Draupne Formation,mass flows are scarce and are only present in thelowermost section of the post-rift upper Draupne
Formation (Fraser et al., 2003). The input of gas-proneand inert organic matter resulting from mass flows istherefore greatly reduced.
Another factor that may contribute to smallamounts of gas-prone material is that during late phaserifting and subsequent quiescence, the greater depthand the elongated basin shape favoured waterstratification and algal productivity, while the upliftof the shoulders restricted terrestrial input (Huc,1990). Wignall and Ruffell (1990) related the reducedterrestrial input in the Wessex Basin to climatic changetowards arid conditions from the Early Volgianonwards. This may also be applicable to the study area.Elevated values for TOCIII are shown in Block 25/1and can be interpreted as run-off from the EastShetland Platform, as this area shows an additionalregional low in oil-prone organic matter content. Inert,reworked organic matter (Fig. 9c) ranges from 0.5 toaround 2 wt% in the graben area in the upper DraupneFormation. The maximum values encountered inBlocks 15/3 and 15/2 as well as Block 25/7 appear tobe associated with mass flows originating from theEast Shetland Platform and the Utsira High (Fig. 9c).
Another area showing elevated values of TOCIV,which can be related to transport of reworked organicmatter from the nearby Utsira High, is located in Block25/6 on the western flank of the Stord Basin.
00.5
11.5
22.5
33.5
44.5
55.5
66.5
77.5
8Oil-, gas-prone and inert TOC in wt%
0 10 20 30 40 50km
Approximate outline of mass flowunits (after Fraser 2003)et al.
Major structuralelements
0.50
0.50
0. 50
. 50
1
1
1
1
1. 50
1.50
1 . 5
0
1.50
1.
50
2
2
2
2
2 . 50
2. 50
33 .
50
25/1125/10
25/825/7
25/625/525/4
25/325/225/1
24/12
24/9
16/1116/10
16/816/7
16/4
16/216/1
15/12
15/915/8
15/6
15/3
16/29
9/15
1
1 S
2
3
5
27
8 S
1
18
10 S
11 S
2
2
1
10 12
14
1
2
3
1
2
71
1
1
58°00'
59°00'
60°00'
2°00' 3°00'
26/1
26/4
26/7
26/1025/12
17/116/3
16/5 17/416/6
17/716/9
16/12 17/10
3/28 3/29 3/30
9/5
9/109/99/8
9/14
9/199/18
9/23 9/24
9/28
9/13
4
Utsira High
SleipnerTerrace
Ling Graben
Stord Basin
EastShetlandPlatform
Viking Graben0.50
1
1
1
1.50
1.50
1.50
2
2
2
2.50
2.50
3
3.50
26/4
25/1125/10
25/925/825/7
25/625/525/4
25/325/225/1
24/12
24/9
16/10
16/816/7
16/516/4
16/216/1
15/12
15/915/8
15/6
15/3
1
1 S
2
3
5
27
8 S
1 18
10 S
11 S
2
2
1
10 12
14
1
2
3
1
2
71
1
1
58°00'
59°00'
60°00'
2°00' 3°00'
26/1
26/7
26/1025/12
16/3 17/1
17/416/6
17/716/9
16/11 16/12 17/10
3/28 3/29 3/30
9/3 9/5
9/109/99/8
9/13 9/14 9/15
9/18 9/19
9/28
9/23 9/24
3
Utsira High
SleipnerTerrace
Ling Graben
Stord Basin
EastShetlandPlatform
Viking Graben
1
1
11
1.50
1.50
2
26/4
25/1125/10
25/925/825/7
25/625/525/4
25/325/225/1
24/12
24/9
17/10
17/7
16/12
17/4
16/1116/10
16/8 16/916/7
16/516/4 16/6
16/216/1
15/12
15/915/8
15/6
15/3
16/29
1
1 S
2
3
5
278 S
1
18
10 S
11 S
2
2
1
10 12
14
1
2
3 1
2
71
1
1
58°00'
59°00'
60°00'
2°00' 3°00'
26/7
26/1025/12
17/116/3
9/28
9/23 9/24
9/18 9/19
9/149/13
9/8 9/9 9/10
9/3 9/5
3/28 3/29 3/30
26/1
16/6 17/4
16/9 17/7
16/12 17/10
Utsira High
SleipnerTerrace
Ling Graben
Stord Basin
EastShetlandPlatform
Viking Graben
(g) TOCII (h) TOCIII (i) TOCIV
Heather Formation
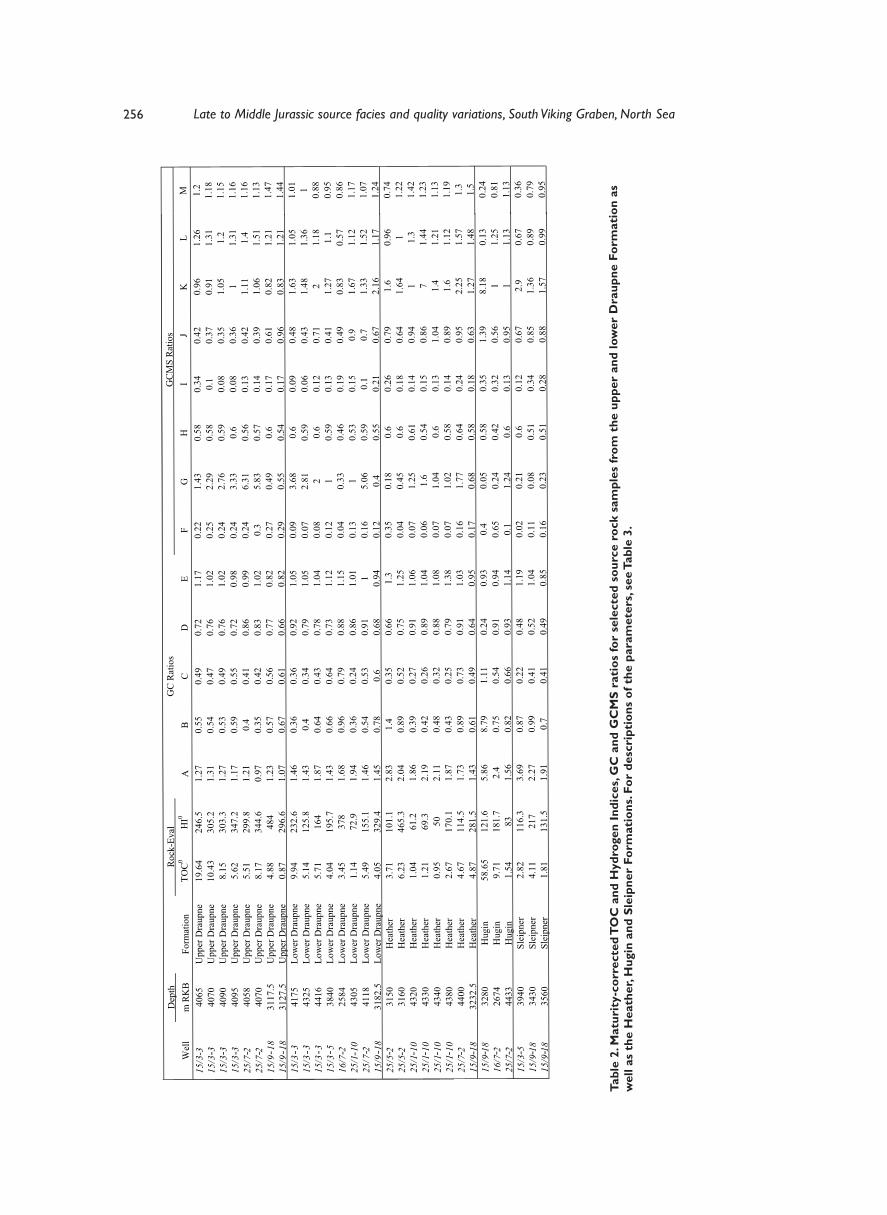
256 Late to Middle Jurassic source facies and quality variations, South Viking Graben, North Sea
Tabl
e 2.
Mat
urit
y-co
rrec
ted
TO
C a
nd H
ydro
gen
Indi
ces,
GC
and
GC
MS
rati
os fo
r se
lect
ed s
ourc
e ro
ck s
ampl
es fr
om t
he u
pper
and
low
er D
raup
ne F
orm
atio
n as
wel
l as
the
Hea
ther
, Hug
in a
nd S
leip
ner
Form
atio
ns. F
or d
escr
ipti
ons
of t
he p
aram
eter
s, se
e Ta
ble
3.
Dep
thW
ell
m R
KB
Form
atio
nTO
C0
HI0
AB
CD
EF
GH
IJ
KL
15/3- 3
4065
Upp
er D
raup
ne19
.64
246.
51.
270.
550.
490.
721.
170.
221.
430.
580.
340.
420.
961.
2615/33
4070
Upp
er D
raup
ne10
.43
305.
21.
310.
540.
470.
761.
020.
252.
290.
580.
10.
370.
911.
3115/33
4090
Upp
er D
raup
ne8.
1530
3.3
1.27
0.53
0.49
0.76
1.02
0.24
2.76
0.59
0.08
0.35
1.05
1.2
15/33
4095
Upp
er D
raup
ne5.
6234
7.2
1.17
0.59
0.55
0.72
0.98
0.24
3.33
0.6
0.08
0.36
11.
3125/72
4058
Upp
er D
raup
ne5.
5129
9.8
1.21
0.4
0.41
0.86
0.99
0.24
6.31
0.56
0.13
0.42
1.11
1.4
25/72
4070
Upp
er D
raup
ne8.
1734
4.6
0.97
0.35
0.42
0.83
1.02
0.3
5.83
0.57
0.14
0.39
1.06
1.51
15/918
3117
.5U
pper
Dra
upne
4.88
484
1.23
0.57
0.56
0.77
0.82
0.27
0.49
0.6
0.17
0.61
0.82
1.21
15/918
3127
.5U
pper
Dra
upne
0.87
296.
61.
070.
670.
610.
660.
820.
290.
550.
540.
170.
960.
831.
2115/33
4175
Low
er D
raup
ne9.
9423
2.6
1.46
0.36
0.36
0.92
1.05
0.09
3.68
0.6
0.09
0.48
1.63
1.05
15/33
4325
Low
er D
raup
ne5.
1412
5.8
1.43
0.4
0.34
0.79
1.05
0.07
2.81
0.59
0.06
0.43
1.48
1.36
15/33
4416
Low
er D
raup
ne5.
7116
41.
870.
640.
430.
781.
040.
082
0.6
0.12
0.71
21.
1815/35
3840
Low
er D
raup
ne4.
0419
5.7
1.43
0.66
0.64
0.73
1.12
0.12
10.
590.
130.
411.
271.
116/72
2584
Low
er D
raup
ne3.
4537
81.
680.
960.
790.
881.
150.
040.
330.
460.
190.
490.
830.
5725/110
4305
Low
er D
raup
ne1.
1472
.91.
940.
360.
240.
861.
010.
131
0.53
0.15
0.9
1.67
1.12
25/72
4118
Low
er D
raup
ne5.
4915
5.1
1.46
0.54
0.53
0.91
10.
165.
060.
590.
10.
71.
331.
5215/918
3182
.5Lo
wer
Dra
upne
4.05
329.
41.
450.
780.
60.
680.
940.
120.
40.
550.
210.
672.
161.
1725/52
3150
Hea
ther
3.71
101.
12.
831.
40.
350.
661.
30.
350.
180.
60.
260.
791.
60.
9625/52
3160
Hea
ther
6.23
465.
32.
040.
890.
520.
751.
250.
040.
450.
60.
180.
641.
641
25/110
4320
Hea
ther
1.04
61.2
1.86
0.39
0.27
0.91
1.06
0.07
1.25
0.61
0.14
0.94
11.
325/110
4330
Hea
ther
1.21
69.3
2.19
0.42
0.26
0.89
1.04
0.06
1.6
0.54
0.15
0.86
71.
4425/110
4340
Hea
ther
0.95
502.
110.
480.
320.
881.
080.
071.
040.
60.
131.
041.
41.
2125/110
4380
Hea
ther
2.67
170.
11.
870.
430.
250.
791.
380.
071.
020.
580.
140.
891.
61.
1225/72
4400
Hea
ther
4.67
114.
51.
730.
890.
730.
911.
030.
161.
770.
640.
240.
952.
251.
5715/918
3232
.5H
eath
er4.
8728
1.5
1.43
0.61
0.49
0.64
0.95
0.17
0.68
0.58
0.18
0.63
1.27
1.48
15/918
3280
Hug
in58
.65
121.
65.
868.
791.
110.
240.
930.
40.
050.
580.
351.
398.
180.
1316/72
2674
Hug
in9.
7118
1.7
2.4
0.75
0.54
0.91
0.94
0.65
0.24
0.42
0.32
0.56
11.
2525/72
4433
Hug
in1.
5483
1.56
0.82
0.66
0.93
1.14
0.1
1.24
0.6
0.13
0.95
11.
1315/35
3940
Slei
pner
2.82
116.
33.
690.
870.
220.
481.
190.
020.
210.
60.
120.
672.
90.
6715/918
3430
Slei
pner
4.11
217
2.27
0.99
0.41
0.52
1.04
0.11
0.08
0.51
0.34
0.85
1.36
0.89
15/918
3560
Slei
pner
1.81
131.
51.
910.
70.
410.
490.
850.
160.
230.
510.
280.
881.
570.
99
Roc
k-Ev
alG
C R
atio
sG
CM
S R
atio
sM 1.
21.
181.
151.
161.
161.
131.
471.
441.
01 1 0.88
0.95
0.86
1.17
1.07
1.24
0.74
1.22
1.42
1.23
1.13
1.19 1.3
1.5
0.24
0.81
1.13
0.36
0.79
0.95
- - - - - - - - - - - - - - - - - - - - - - - - - - - --

257H. Justwan et al.
The distribution of oil- and gas-prone organicmatter does not follow the commonly observed patternwhereby the highest potential is in the deepest partsof the graben and there is increasing terrestrialdominance towards the highs (Fisher and Miles, 1983;Thomas et al., 1985). Rather, the deeper graben areas,acting as sediment traps, show the highest content ofterrestrial material.
Molecular source faciesand isotopic characteristicsThe molecular and carbon isotopic characteristics ofthe Upper and Middle Jurassic source rocks wereinvestigated to support the source potential mappingand to gain a better understanding of the regional andstratigraphic trends in geochemical properties. Thecarbon isotopic composition of the saturate andaromatic fraction of source rock extracts reflectsvariations in kerogen type and source maturity, butmight also be affected by factors such as temporalvariations in carbon cycling or local changes inpaleoproductivity (Tyson, 2004). The distribution oftriterpanes and steranes analysed by GCMS also givesvaluable information on source rock depositionalenvironment and development of the Jurassic sourcerock system. Biomarker ratios for selected samplesare listed in Table 2.
Geochemical characteristicsof Middle Jurassic source rocksMolecular and isotopic characteristics of MiddleJurassic source rocks show a great deal of variationas the samples represent different lithofacies rangingfrom mudrocks to coaly shales and coals. Middle
Jurassic source rocks in the Hugin and SleipnerFormation are isotopically heaviest with δ13C valuesranging from -24 to -28 ‰PDB for saturate andaromatic fractions (Fig. 10). Coaly samples show theheaviest ratio values while the shaly and sandysamples are generally lighter. This can be interpretedin terms of kerogen type (Cooper et al., 1993) as TypeIII facies for the coaly samples and a higher Type IIcontribution for the shaly samples.
The extracts from the Middle Jurassic section aredominated by higher molecular weight compounds inthe range of n-C23 to n-C30 (Fig. 11); the MiddleJurassic source rocks therefore show in general a lown-C17/(n-C17 + n-C27) ratio. The presence of these highmolecular weight n-alkanes in the Hugin and SleipnerFormation can be attributed to terrestrial plant input(c.f. Tissot and Welte, 1984), while the short chain n-alkanes are reported to be constituents of algae (Gelpiet al., 1970). The dominance of high molecular weightcompounds is more pronounced in the SleipnerFormation and the coaly samples, while the shales ofthe Hugin Formation show a higher proportion of shortchain compounds.
The distribution of C30 17β(H),21α(H)-moretaneand the corresponding C30 17α(H),21β(H)-hopanealso shows high variability. Middle Jurassic samplescommonly exhibit the highest moretane contents,indicating the highest terrestrial contribution to thekerogen (Isaksen and Bohacs, 1995) (Fig. 12d). Theratio of rearranged (dia-) steranes to regular steranesalso differs in the various sections. Middle Jurassicsamples show values approaching unity, whileoverlying sections show values above unity. Thedistribution of C27 to C29 regular steranes was
Table 3. Description of selected facies-indicating GC and GCMS parameters given in Table 2.
A Pristane/Phytane ratio Brooks et al. (1969); Didyk et al. (1978)
B Pristane/n-C17 -
C Phytane/n-C18 -
D Waxiness: n-C17/(n-C17+n-C27) -
E Carbon Preference Index (CPI) Bray and Evans (1961)
F Isaksen et al. (1998)
G Ts/Tm Seifert and Moldowan (1985)
H Seifert and Moldowan (1986)
I Isaksen and Bohacs (1995)
J C29 versus C30 hopanes after Peters and Moldowan (1993)
K C34/C35 : Ratio of C34 versus C35 homohopanes after Peters and Moldowan (1991)
L Ratio of C27-C29 diasteranes versus C27-C29 regular steranes after Peters and Moldowan (1993)
MC27/C29: Ratio of C27 ββ(R+S) steranes versus C29
regular steranes, measured in m/z 218Huang and Meinschein (1979)
BNH%: 17α(H),21β(H) -28,30-bisnorhopane versus 17α(H),21β(H)-28,30-bisnorhopane + C30 hopane
22S: Ratio of 17α(H),21β(H), 22(S) bishomohopane versus 17α(H),21β(H),22(S) + (R) bishomohopanes
30βα/30αβ: ratio of C30 moretane versus C30 hopane
ββ(R+S)

258 Late to Middle Jurassic source facies and quality variations, South Viking Graben, North Sea
-32 -30 -28 -26 -2413C SAT
-32
-28
-24
-20
13CARO
Upper Draupne FmLower Draupne FmHeather FmHugin FmSleipner Fm
-32 -30 -28 -26 -2413C SAT
-32
-28
-24
-20
13CARO
Upper Draupne FmLower Draupne FmHeather FmHugin FmSleipner Fm
Entire data set Well 15/9-18
Increasing marineinfluence
3410m
3390m
3280m
3232.5m3175m
3145m3137.5m
3155m
3195m3202.5m
3112.5m
3117.5m
3125m3132.5m
a b
δ
δδ
δ
determined in the m/z 218 fragmentograms. Accordingto Huang and Meinschein (1979), the dominant sourceof C27 sterols is zooplankton while C29 sterols occurmainly in higher plants. It has been found that theratio of C27 versus C29 regular steranes increases onaverage upwards from the Sleipner to the upperDraupne Formation, suggesting an increase in marine,algal influence. Coaly shales and coals show ratiovalues as low as 0.2 while the ratio in shaly samplescan reach 1.1 (Table 2). In general however, theMiddle Jurassic extracts show a dominance by C29steranes, indicating a higher input of terrestrialmaterial.
The distribution of acyclic isoprenoids can be usedto distinguish the source intervals. Pr/Ph ratios rangefrom ca 1.5 for shaly samples in the Hugin Formationto over 6 for coals and coaly shales (Fig. 12c). ThePr/Ph ratio is considered to indicate the degree ofoxygenation in the depositional environment (Brookset al., 1969; Didyk et al., 1978), although itssignificance as an indicator of palaeoenvironmentalconditions is still debated (Brassell et al., 1987; tenHaven et al., 1987). High values of the Pr/Ph ratiofor Middle Jurassic samples are consistent with thefact that the coaly shales and coals were deposited inan oxygenated fluvio-deltaic environment with a highterrestrial OM input.
Geochemical characteristicsof the Heather FormationThe samples of the Upper Jurassic Heather Formationare isotopically slightly lighter than the MiddleJurassic samples with δ13C for saturate fractionsranging from -26.5 to -28.5 ‰, and for aromaticfractions from -25 to -28.5 ‰PDB (Fig. 10). This canbe interpreted using the approach of Cooper et al.
(1993) in terms of an increased Type II contributionrelative to the Middle Jurassic samples. The samplesof the Heather Formation often show a bimodal n-alkane distribution with maxima from n-C14 to n-C18and n-C21 to n-C29 and an odd-over-even carbonnumber dominance (Fig. 11). Similar to the MiddleJurassic samples, the Heather Formation samplesexhibit a high C30 moretane content relative to C30hopane (Fig. 12d). The ratio of C29 hopane to C30hopane is similar to that in the Middle Jurassic samplesand distinctively higher than that in the DraupneFormation samples. C34 homohopanes dominate overthe C35 homologues in the Heather Formation (Fig.12b), indicating oxidising conditions (Peters andMoldowan, 1993). The Pr/Ph ratio varies significantlybetween 1.16 and 3.29; its average (1.98) is lowerthan the average for the Middle Jurassic (Fig.12c),indicating more reducing conditions in the HeatherFormation.
Geochemical characteristicsof the Draupne FormationThe molecular and isotopic characteristics of the syn-and post-rift sections of the Draupne Formation arevery similar. However, certain parameters, such as thePr/Ph ratio, carbon isotopic composition and thecontent of 17α(H),21β(H)-28,30-bisnorhopane, maydistinguish the syn- and postrift facies.
The samples derived from the upper DraupneFormation are on average isotopically lightercompared to those from the lower Draupne Formation,although there is a large variation in the analysed data(Fig. 10). The bulk of the upper Draupne data showsδ13C saturate values from -29.5 to 32 ‰PDB andaromatic values between -28.5 and -32 ‰, indicatinga relatively high algal contribution to the kerogen
Fig. 10. Stable carbon isotopic composition of aromatic and saturate fraction of source rock extracts.(a) Entire data set; (b) well 15/9-18, displaying a trend of progressively lighter isotopic compositions from theMiddle Jurassic upwards.
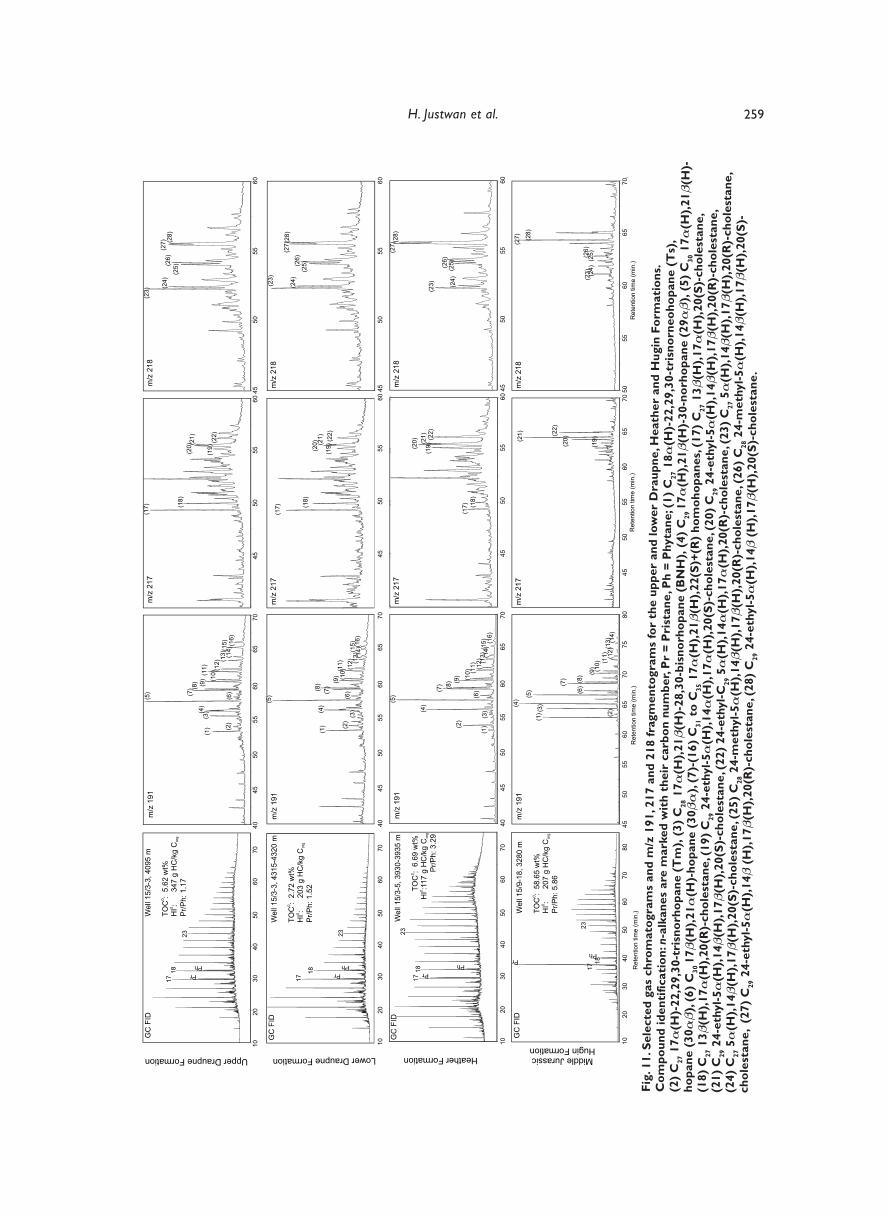
259H. Justwan et al.
4045
5055
6065
7040
4550
556045
5055
6010
2030
4050
6070
4045
5055
6065
7045
5055
60
PrPh
PrPh
1718
23
17
18
23
(1) (2)
(3)(4)
(5)
(6)(7) (8) (9) (10)
(15) (16)
(14)
(13)
(12)
(11)
(1) (2)(3)(4)
(5) (6)(7)(8) (9) (10)
(15) (16)
(14)
(13)
(12)
(11)
(27) (28)
(26)
(25)
(24)
(23)
(27)(28)
(26)
(25)
(24)(23)
(21)
(20)
(19)(22)
(18)
(17)
(21)
(20)
(19)(22)
(18)
(17)
4045
5055
6065
7010
2030
4050
6070
4045
5055
6045
5055
6010
2030
4050
6070
4045
5055
6065
7045
5055
6045
5055
60
1020
3040
5060
7040
4550
5560
6570
4550
556045
5055
60
Well15/3-3,4095m
TOC:5.62wt%
HI:
347gHC/kgC
Pr/Ph:1.17
0
0org
m/z191
Well15/3-3,4315-4320m
TOC:2.72wt%
HI:
203gHC/kgC
Pr/Ph:1.52
0
0org
GCFID
GCFID
m/z217
m/z218
m/z191
m/z217
m/z218
UpperDraupneFormation LowerDraupneFormation
1020
3040
5060
7080
4550
5560
6570
758040
4550
5560
657050
5560
6570
PrPh
1718
23
(1) (2)(3)(4) (5) (6)(7) (8) (9) (10)
(14)
(13)
(12)
(11)
(27) (28)
(26)
(25)
(24)
(23)
(21)
(20)
(19)
(22)
1020
3040
5060
7080
4550
5560
6570
7580
4550
5560
657050
5560
6570
Well15/9-18,3280m
TOC:58.65wt%
HI:
207gHC/kgC
Pr/Ph:5.86
0
0org
GCFID
m/z191
m/z217
m/z218
Retentiontime(min.)
Retentiontime(min.)
Retentiontime(min.)
Retentiontime(min.)
MiddleJurassicHuginFormation
4045
5055
6010
2030
4050
6070
PrPh
1718
23
(1)(2) (3
)(4)(5) (6)(7) (8) (9) (10)
(15) (16)
(14)
(13)
(12)
(11)
(27)(28)
(25)
(24)
(23)
(26)
(21)
(20)
(19)(22)
(18)
(17)
Well15/3-5,3930-3935m
TOC:6.69wt%
HI:117gHC/kgC
Pr/Ph:3.29or
g
0
0
GCFID
m/z191
m/z217
m/z218
HeatherFormation
1020
3040
5060
7040
4550
5560
6570
4550
556045
5055
60
Fig.
11.
Sel
ecte
d ga
s ch
rom
atog
ram
s an
d m
/z 1
91, 2
17 a
nd 2
18 fr
agm
ento
gram
s fo
r th
e up
per
and
low
er D
raup
ne, H
eath
er a
nd H
ugin
For
mat
ions
.C
ompo
und
iden
tific
atio
n: n
-alk
anes
are
mar
ked
wit
h th
eir
carb
on n
umbe
r, P
r =
Pri
stan
e, P
h =
Phy
tane
; (1)
C27
18α
(H)-
22,2
9,30
-tri
snor
neoh
opan
e (T
s),
(2)
C27
17α
(H)-
22,2
9,30
-tri
snor
hopa
ne (
Tm
), (
3) C
28 1
7α(H
),21β(
H)-
28,3
0-bi
snor
hopa
ne (
BN
H),
(4)
C29
17α
(H),
21β(
H)-
30-n
orho
pane
(29αβ)
, (5)
C30
17α
(H),
21β(
H)-
hopa
ne (
30αβ)
, (6)
C30
17β
(H),
21α
(H)-
hopa
ne (
30βα
), (7
)-(1
6) C
31 t
o C
35 1
7α(H
),21β(
H),
22(S
)+(R
) ho
moh
opan
es, (
17)
C27
13β
(H),
17α
(H),
20(S
)-ch
oles
tane
,(1
8) C
27 1
3β(H
),17α
(H),
20(R
)-ch
oles
tane
, (19
) C
29 2
4-et
hyl-5α
(H),
14α
(H),
17α
(H),
20(S
)-ch
oles
tane
, (20
) C
29 2
4-et
hyl-5α
(H),
14β(
H),
17β(
H),
20(R
)-ch
oles
tane
,(2
1) C
29 2
4-et
hyl-5α
(H),
14β(
H),
17β(
H),
20(S
)-ch
oles
tane
, (22
) 24
-eth
yl-C
29 5α
(H),
14α
(H),
17α
(H),
20(R
)-ch
oles
tane
, (23
) C
27 5α
(H),
14β(
H),
17β(
H),
20(R
)-ch
oles
tane
,(2
4) C
27 5α
(H),
14β(
H),
17β(
H),
20(S
)-ch
oles
tane
, (25
) C
28 2
4-m
ethy
l-5α
(H),
14β(
H),
17β(
H),
20(R
)-ch
oles
tane
, (26
) C
28 2
4-m
ethy
l-5α
(H),
14β(
H),
17β(
H),
20(S
)-ch
oles
tane
, (2
7) C
29 2
4-et
hyl-5α
(H),
14β
(H),
17β(
H),
20(R
)-ch
oles
tane
, (28
) C
29 2
4-et
hyl-5α
(H),
14β
(H),
17β(
H),
20(S
)-ch
oles
tane
.
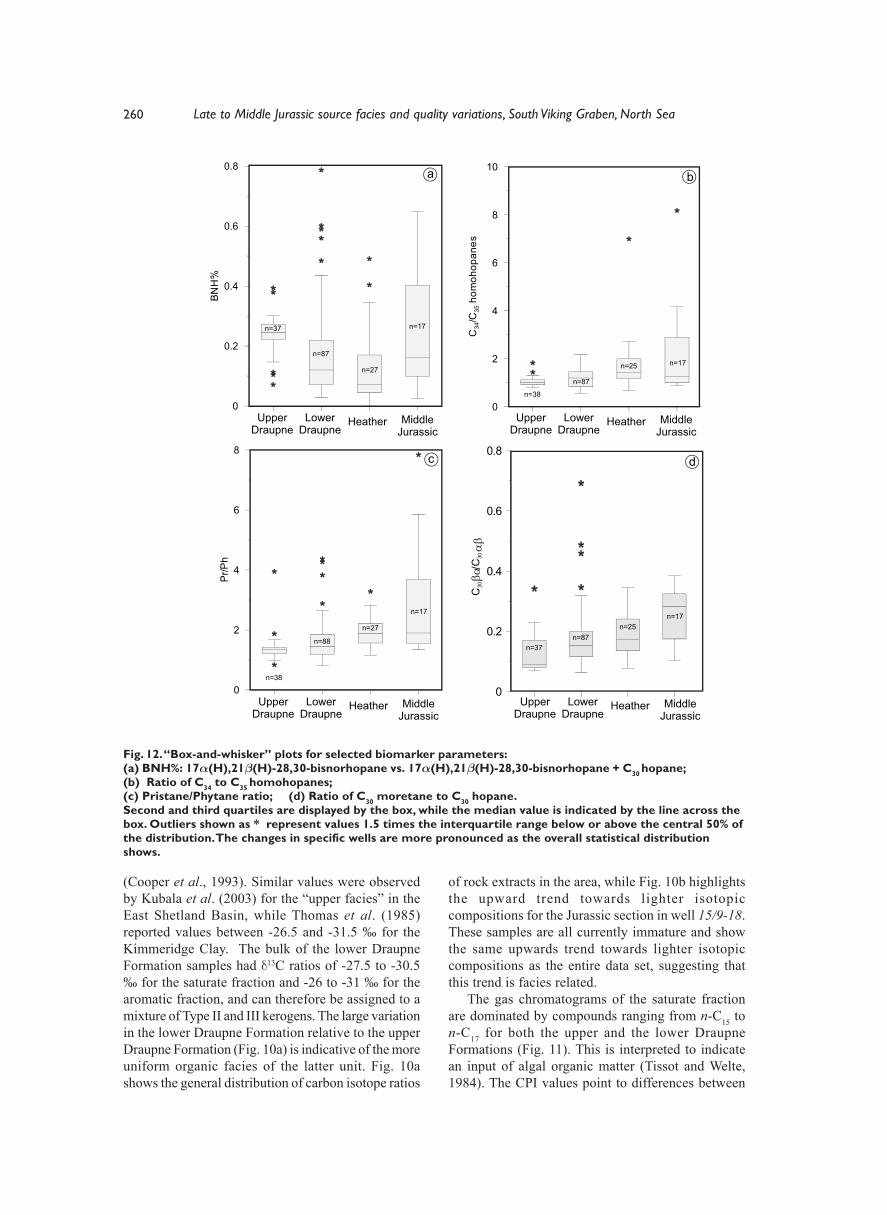
260 Late to Middle Jurassic source facies and quality variations, South Viking Graben, North Sea
(Cooper et al., 1993). Similar values were observedby Kubala et al. (2003) for the “upper facies” in theEast Shetland Basin, while Thomas et al. (1985)reported values between -26.5 and -31.5 ‰ for theKimmeridge Clay. The bulk of the lower DraupneFormation samples had δ13C ratios of -27.5 to -30.5‰ for the saturate fraction and -26 to -31 ‰ for thearomatic fraction, and can therefore be assigned to amixture of Type II and III kerogens. The large variationin the lower Draupne Formation relative to the upperDraupne Formation (Fig. 10a) is indicative of the moreuniform organic facies of the latter unit. Fig. 10ashows the general distribution of carbon isotope ratios
of rock extracts in the area, while Fig. 10b highlightsthe upward trend towards lighter isotopiccompositions for the Jurassic section in well 15/9-18.These samples are all currently immature and showthe same upwards trend towards lighter isotopiccompositions as the entire data set, suggesting thatthis trend is facies related.
The gas chromatograms of the saturate fractionare dominated by compounds ranging from n-C15 ton-C17 for both the upper and the lower DraupneFormations (Fig. 11). This is interpreted to indicatean input of algal organic matter (Tissot and Welte,1984). The CPI values point to differences between
0
0.2
0.4
0.6
0.8
BNH%
0
2
4
6
8
10
C34/C
35homohopanes
0
2
4
6
8
Pr/Ph
0
0.2
0.4
0.6
0.8
C30ba/C
30ab
a
c d
b
UpperDraupne
LowerDraupne
Heather MiddleJurassic
UpperDraupne
LowerDraupne
Heather MiddleJurassic
UpperDraupne
LowerDraupne
Heather MiddleJurassic
UpperDraupne
LowerDraupne
Heather MiddleJurassic
n=37
n=87
n=27
n=17
n=38
n=88
n=27
n=17
n=38
n=87
n=25 n=17
n=37n=87
n=25n=17
C/C
3030
αβ
βα
Fig. 12. “Box-and-whisker” plots for selected biomarker parameters:(a) BNH%: 17α(H),21β(H)-28,30-bisnorhopane vs. 17α(H),21β(H)-28,30-bisnorhopane + C30 hopane;(b) Ratio of C34 to C35 homohopanes;(c) Pristane/Phytane ratio; (d) Ratio of C30 moretane to C30 hopane.Second and third quartiles are displayed by the box, while the median value is indicated by the line across thebox. Outliers shown as * represent values 1.5 times the interquartile range below or above the central 50% ofthe distribution. The changes in specific wells are more pronounced as the overall statistical distributionshows.
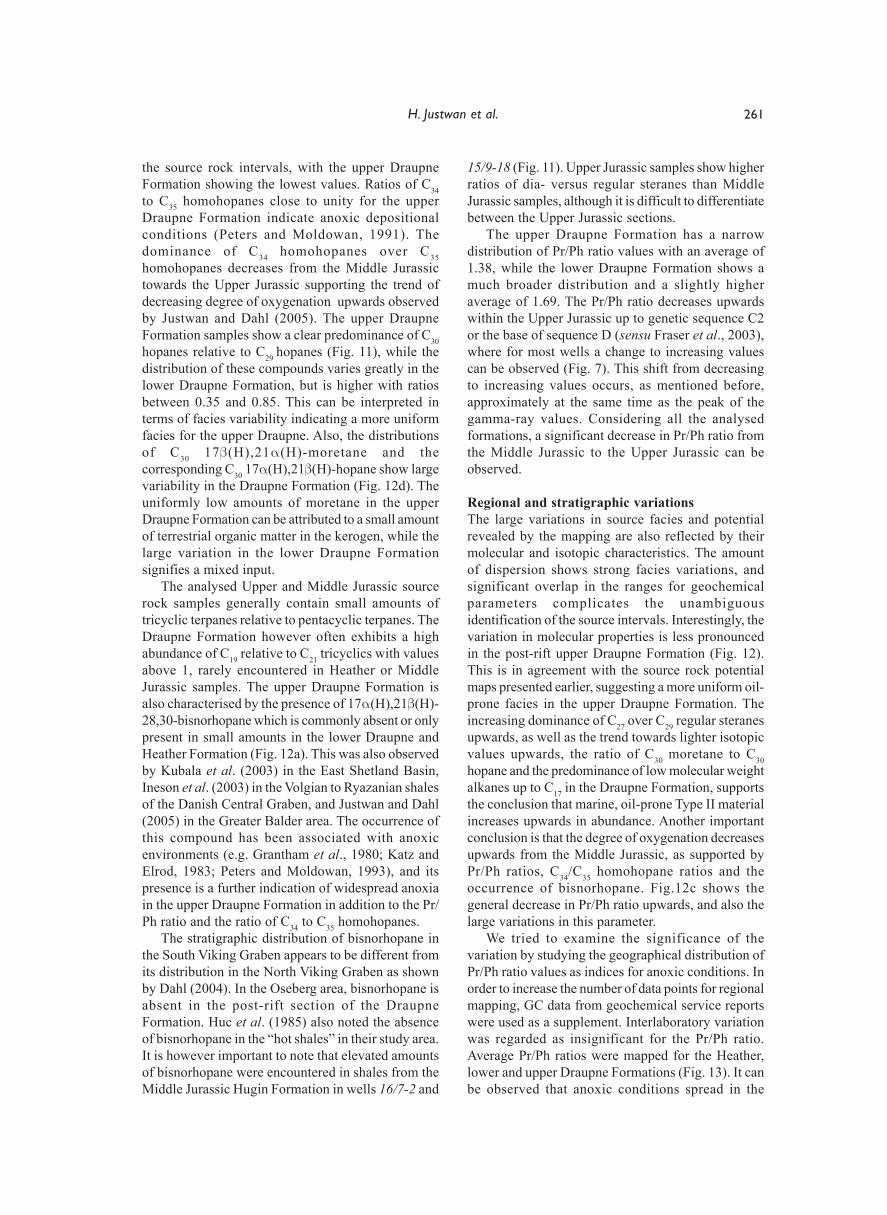
261H. Justwan et al.
the source rock intervals, with the upper DraupneFormation showing the lowest values. Ratios of C34to C35 homohopanes close to unity for the upperDraupne Formation indicate anoxic depositionalconditions (Peters and Moldowan, 1991). Thedominance of C34 homohopanes over C35homohopanes decreases from the Middle Jurassictowards the Upper Jurassic supporting the trend ofdecreasing degree of oxygenation upwards observedby Justwan and Dahl (2005). The upper DraupneFormation samples show a clear predominance of C30hopanes relative to C29 hopanes (Fig. 11), while thedistribution of these compounds varies greatly in thelower Draupne Formation, but is higher with ratiosbetween 0.35 and 0.85. This can be interpreted interms of facies variability indicating a more uniformfacies for the upper Draupne. Also, the distributionsof C30 17β(H),21α(H)-moretane and thecorresponding C30 17α(H),21β(H)-hopane show largevariability in the Draupne Formation (Fig. 12d). Theuniformly low amounts of moretane in the upperDraupne Formation can be attributed to a small amountof terrestrial organic matter in the kerogen, while thelarge variation in the lower Draupne Formationsignifies a mixed input.
The analysed Upper and Middle Jurassic sourcerock samples generally contain small amounts oftricyclic terpanes relative to pentacyclic terpanes. TheDraupne Formation however often exhibits a highabundance of C19 relative to C21 tricyclics with valuesabove 1, rarely encountered in Heather or MiddleJurassic samples. The upper Draupne Formation isalso characterised by the presence of 17α(H),21β(H)-28,30-bisnorhopane which is commonly absent or onlypresent in small amounts in the lower Draupne andHeather Formation (Fig. 12a). This was also observedby Kubala et al. (2003) in the East Shetland Basin,Ineson et al. (2003) in the Volgian to Ryazanian shalesof the Danish Central Graben, and Justwan and Dahl(2005) in the Greater Balder area. The occurrence ofthis compound has been associated with anoxicenvironments (e.g. Grantham et al., 1980; Katz andElrod, 1983; Peters and Moldowan, 1993), and itspresence is a further indication of widespread anoxiain the upper Draupne Formation in addition to the Pr/Ph ratio and the ratio of C34 to C35 homohopanes.
The stratigraphic distribution of bisnorhopane inthe South Viking Graben appears to be different fromits distribution in the North Viking Graben as shownby Dahl (2004). In the Oseberg area, bisnorhopane isabsent in the post-rift section of the DraupneFormation. Huc et al. (1985) also noted the absenceof bisnorhopane in the “hot shales” in their study area.It is however important to note that elevated amountsof bisnorhopane were encountered in shales from theMiddle Jurassic Hugin Formation in wells 16/7-2 and
15/9-18 (Fig. 11). Upper Jurassic samples show higherratios of dia- versus regular steranes than MiddleJurassic samples, although it is difficult to differentiatebetween the Upper Jurassic sections.
The upper Draupne Formation has a narrowdistribution of Pr/Ph ratio values with an average of1.38, while the lower Draupne Formation shows amuch broader distribution and a slightly higheraverage of 1.69. The Pr/Ph ratio decreases upwardswithin the Upper Jurassic up to genetic sequence C2or the base of sequence D (sensu Fraser et al., 2003),where for most wells a change to increasing valuescan be observed (Fig. 7). This shift from decreasingto increasing values occurs, as mentioned before,approximately at the same time as the peak of thegamma-ray values. Considering all the analysedformations, a significant decrease in Pr/Ph ratio fromthe Middle Jurassic to the Upper Jurassic can beobserved.
Regional and stratigraphic variationsThe large variations in source facies and potentialrevealed by the mapping are also reflected by theirmolecular and isotopic characteristics. The amountof dispersion shows strong facies variations, andsignificant overlap in the ranges for geochemicalparameters complicates the unambiguousidentification of the source intervals. Interestingly, thevariation in molecular properties is less pronouncedin the post-rift upper Draupne Formation (Fig. 12).This is in agreement with the source rock potentialmaps presented earlier, suggesting a more uniform oil-prone facies in the upper Draupne Formation. Theincreasing dominance of C27 over C29 regular steranesupwards, as well as the trend towards lighter isotopicvalues upwards, the ratio of C30 moretane to C30hopane and the predominance of low molecular weightalkanes up to C17 in the Draupne Formation, supportsthe conclusion that marine, oil-prone Type II materialincreases upwards in abundance. Another importantconclusion is that the degree of oxygenation decreasesupwards from the Middle Jurassic, as supported byPr/Ph ratios, C34/C35 homohopane ratios and theoccurrence of bisnorhopane. Fig.12c shows thegeneral decrease in Pr/Ph ratio upwards, and also thelarge variations in this parameter.
We tried to examine the significance of thevariation by studying the geographical distribution ofPr/Ph ratio values as indices for anoxic conditions. Inorder to increase the number of data points for regionalmapping, GC data from geochemical service reportswere used as a supplement. Interlaboratory variationwas regarded as insignificant for the Pr/Ph ratio.Average Pr/Ph ratios were mapped for the Heather,lower and upper Draupne Formations (Fig. 13). It canbe observed that anoxic conditions spread in the
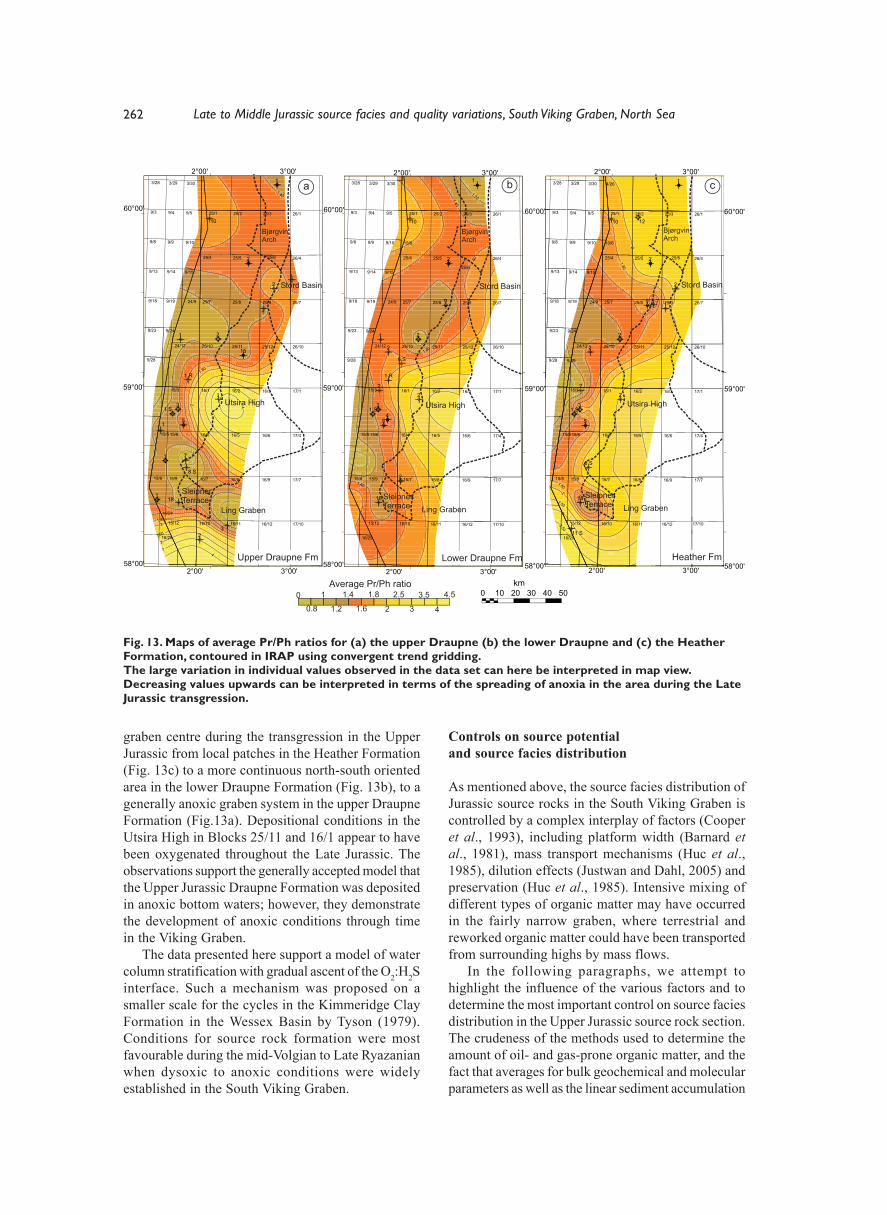
262 Late to Middle Jurassic source facies and quality variations, South Viking Graben, North Sea
1
1
1.20
1.20
1.40
1.60
1.80
1.80
2
2
2.50
2.50
3
3
3.50 4
4
25/1225/1125/10
25/925/825/7
25/625/525/4
25/325/225/1
24/12
24/9
16/10
16/816/7
16/516/4
16/216/1
15/12
15/915/8
15/615/5
15/3
16/29
16/24
9/15
1
1 S3
5
1 7
8 S
118
2
23
1
1 R
10
2
2
2
1
15
1
1
58°00'
59°00'
60°00'
2°00'
2°00'
3°00'
3°00'
16/11 16/12 17/10
17/716/9
16/6 17/4
16/3 17/1
26/10
26/7
26/4
26/1
9/28
9/23 9/24
9/199/18
9/13 9/14
9/8 9/9 9/10
9/3 9/4 9/5
3/28 3/29 3/301
1.20
1.40
1.40
1.40
1.60
2
2
2.50
3
25/1125/10
25/925/825/7
25/6
25/525/4
25/325/225/1
24/12
24/9
16/10
16/7
16/516/4
16/216/1
15/12
15/915/8
15/615/5
15/3
16/29
10/6
1 S
2
3
45
18
2
2
1
1 R
10
2
2
9
6 S
1
2
58°00' 58°00'
59°00' 59°00'
60°00' 60°00'
2°00' 3°00'
2°00' 3°00'
3/28 3/29 3/30
9/3 9/4 9/5
9/109/99/8
9/13 9/14 9/15
9/199/18
9/23 9/24
9/28
26/1
26/4
25/12 26/10
26/7
17/116/3
16/6 17/4
16/8 17/716/9
16/11 16/12 17/10
Utsira High
SleipnerTerrace
Ling Graben
Stord Basin
BjørgvinArch
BjørgvinArch
Utsira High
Ling Graben
Stord Basin
11.20
1.40
1.60
1.80
1.80
2
2
2.50
3
3.50
3.50
4
4
25/1225/1125/10
25/925/825/7
25/625/525/4
25/225/1
24/12
24/9
17/1016/10
16/7
16/516/4
16/216/1
15/12
15/915/8
15/615/5
15/3
16/29
10/6
9/29
4/26
1 S
2
3
5
8 S
18
11 S
2
2
10 12
2
2
2
79 1
1
58°00'
59°00'
60°00'
2°00' 3°00'
2°00' 3°00'
25/3 26/1
26/4
26/7
26/10
17/116/3
16/6 17/4
16/8 16/9 17/7
3/303/293/28
9/59/49/3
9/109/99/8
9/159/149/13
9/18 9/19
9/23 9/24
9/28
16/11 17/1016/12
Utsira High
SleipnerTerrace Ling Graben
Stord Basin
BjørgvinArch
0
0.8
1
1.2
1.4
1.6
1.8
2
2.5
3
3.5
4
4.5 0 10 20 30 40 50kmAverage Pr/Ph ratio
Upper Draupne Fm Lower Draupne Fm Heather Fm
a b c
SleipnerTerrace
Fig. 13. Maps of average Pr/Ph ratios for (a) the upper Draupne (b) the lower Draupne and (c) the HeatherFormation, contoured in IRAP using convergent trend gridding.The large variation in individual values observed in the data set can here be interpreted in map view.Decreasing values upwards can be interpreted in terms of the spreading of anoxia in the area during the LateJurassic transgression.
graben centre during the transgression in the UpperJurassic from local patches in the Heather Formation(Fig. 13c) to a more continuous north-south orientedarea in the lower Draupne Formation (Fig. 13b), to agenerally anoxic graben system in the upper DraupneFormation (Fig.13a). Depositional conditions in theUtsira High in Blocks 25/11 and 16/1 appear to havebeen oxygenated throughout the Late Jurassic. Theobservations support the generally accepted model thatthe Upper Jurassic Draupne Formation was depositedin anoxic bottom waters; however, they demonstratethe development of anoxic conditions through timein the Viking Graben.
The data presented here support a model of watercolumn stratification with gradual ascent of the O2:H2Sinterface. Such a mechanism was proposed on asmaller scale for the cycles in the Kimmeridge ClayFormation in the Wessex Basin by Tyson (1979).Conditions for source rock formation were mostfavourable during the mid-Volgian to Late Ryazanianwhen dysoxic to anoxic conditions were widelyestablished in the South Viking Graben.
Controls on source potentialand source facies distribution
As mentioned above, the source facies distribution ofJurassic source rocks in the South Viking Graben iscontrolled by a complex interplay of factors (Cooperet al., 1993), including platform width (Barnard etal., 1981), mass transport mechanisms (Huc et al.,1985), dilution effects (Justwan and Dahl, 2005) andpreservation (Huc et al., 1985). Intensive mixing ofdifferent types of organic matter may have occurredin the fairly narrow graben, where terrestrial andreworked organic matter could have been transportedfrom surrounding highs by mass flows.
In the following paragraphs, we attempt tohighlight the influence of the various factors and todetermine the most important control on source faciesdistribution in the Upper Jurassic source rock section.The crudeness of the methods used to determine theamount of oil- and gas-prone organic matter, and thefact that averages for bulk geochemical and molecularparameters as well as the linear sediment accumulation

263H. Justwan et al.
rates were used, does not allow detailed discussion ofproductivity and organic matter accumulation models;however, the most significant controls on the faciescan be determined.
The highest overall amount of organic matter canbe observed in depocentres in the graben due tosediment focusing and sea-floor topography. Oil-proneorganic matter, however, is not restricted to the basinalarea, but occurs also on the flanks of the highs andeven on the highs. One important example is the flankof the Stord Basin which shows high TOCII values.
Figs 8 and 9 illustrate the role of dilution by gas-prone and inert material on the source faciesdistribution. Average values for oil- and gas-proneTOC as well as inert organic matter show that organicmatter capable of hydrocarbon generation is mixedin variable amounts with a near-constant input of inertorganic matter; the maps of the lower DraupneFormation show that dilution of oil-prone material bygas-prone material locally plays an important role. Theinput of inert organic matter is higher in the vicinityof mass flow sands as was also observed by Tyson(1989). The absolute amount of gas-prone organicmatter is fairly constant, with slightly elevated levelsin the lower Draupne Formation indicating theinfluence of mass flows which transported largevolumes of reworked and gas-prone organic matterfrom the East Shetland Platform and the Utsira High.As discussed earlier, the upper Draupne Formationshows a reduction in the proportion of gas-pronematerial. This is related to the decreased occurrenceof mass flows and the generally decreased input ofterrestrial organic matter. This reduced input ofterrestrial organic matter is probably related to an arid
climatic episode from the early Volgian to the lateRyazanian (c.f. Wignall and Ruffell, 1990).
Both absolute amount and proportion of oil-proneorganic matter increase from the Heather to the upperDraupne Formation. This is supported by moleculardata including C27 to C29 regular steranes and GCparameters. The oil-prone nature of the upper DraupneFormation must therefore be explained by factors otherthan reduced dilution by terrestrial and reworkedorganic matter (Justwan and Dahl, 2005).
The effect of anoxia on the preservation of organicmatter was therefore evaluated. The increasingimportance of anoxia from the Middle Jurassic to theupper Draupne Formation is shown by a series offactors including increasing Pr/Ph ratios, increasingrelative amounts of bisnorhopane and C34/C35homohopane indices. Cross-plots of TOC and Pr/Phindicate that TOC values increase with decreasing Pr/Ph ratios. Both plots of measured Pr/Ph ratios versusrestored TOC values (Fig. 14a), as well as a plot ofaverage Pr/Ph ratios versus TOCII values used in themapping (Fig. 14b), show negative correlations. Thereis a stronger dependency of TOC and TOCII on thePr/Ph ratio in the lower Draupne and HeatherFormation. The large variation in TOC values in theupper Draupne Formation, however, cannot beattributed to variations in oxygenation, as anoxia iswidespread from the Middle Volgian onwards.
In order to investigate further the cause of thevariations in TOCII in the upper Draupne Formation,the relationship between the amount of oil-pronematerial and the average compacted linear sedimentaccumulation rate for the wells used in Fig. 9 wasexamined using a log-log cross-plot (Müller and Süss,
0 5 10 15 20 25TOC in wt% (restored)
0
1
2
3
4
5
6
Pr/Ph
0 2 4 6TOC II (wt%)
0
2
4
6
AveragePr/Ph
a b Upper Draupne FmLower Draupne FmHeather Fm
Upper Draupne FmLower Draupne FmHeather Fm
Fig. 14. Cross-plots of TOC and Pr/Ph ratios. (a) Measured Pr/Ph ratios and restored TOC for individualsamples. (b) Average Pr/Ph ratios and TOCII (as shown on maps in Figs 9 and 13).The amount of oil-prone organic mater appears to increase with decreasing Pr/Ph ratios in the lowerDraupne and Heather Formation. No direct relationship is evident in the upper Draupne Formation, low Pr/Ph values are common. This relation can be interpreted as an effect of increased preservation of organicmatter in increasingly more anoxic environments.
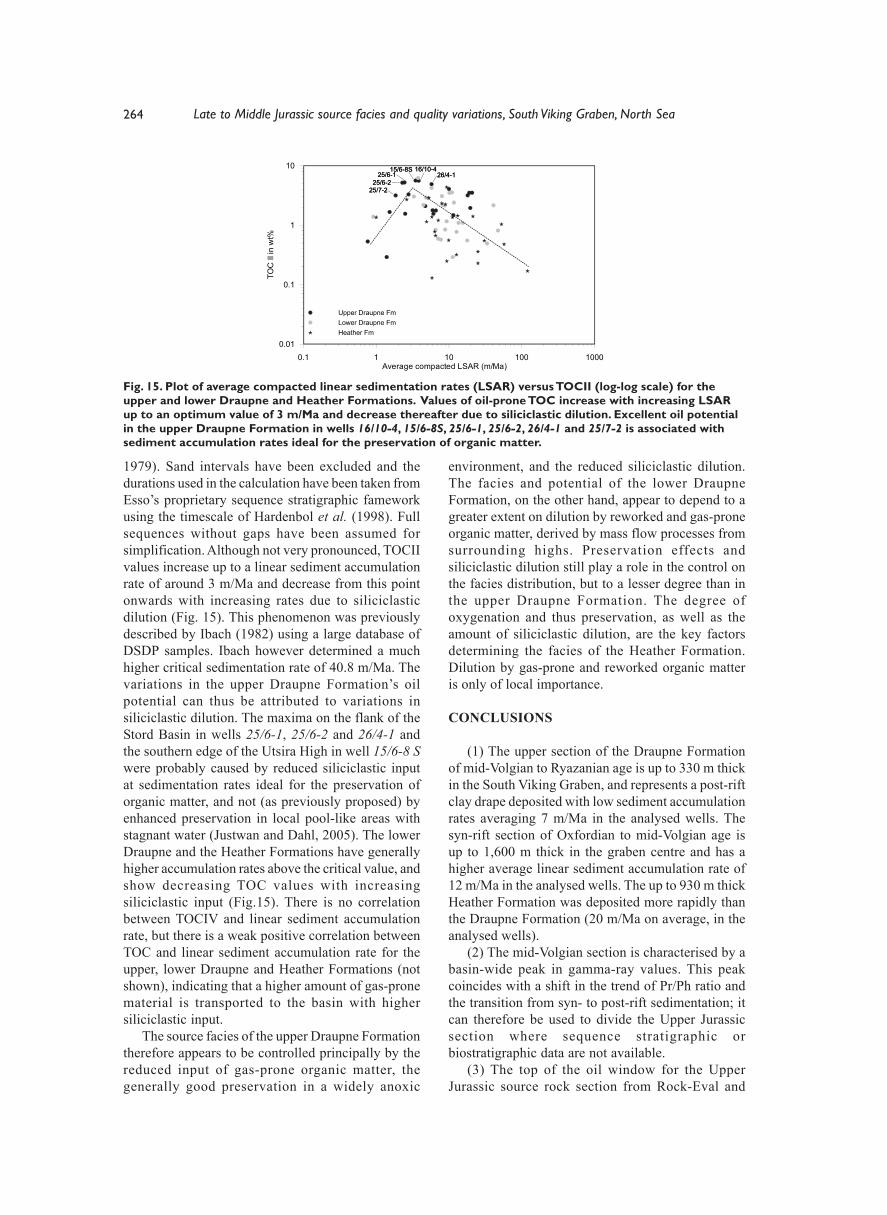
264 Late to Middle Jurassic source facies and quality variations, South Viking Graben, North Sea
1979). Sand intervals have been excluded and thedurations used in the calculation have been taken fromEsso’s proprietary sequence stratigraphic fameworkusing the timescale of Hardenbol et al. (1998). Fullsequences without gaps have been assumed forsimplification. Although not very pronounced, TOCIIvalues increase up to a linear sediment accumulationrate of around 3 m/Ma and decrease from this pointonwards with increasing rates due to siliciclasticdilution (Fig. 15). This phenomenon was previouslydescribed by Ibach (1982) using a large database ofDSDP samples. Ibach however determined a muchhigher critical sedimentation rate of 40.8 m/Ma. Thevariations in the upper Draupne Formation’s oilpotential can thus be attributed to variations insiliciclastic dilution. The maxima on the flank of theStord Basin in wells 25/6-1, 25/6-2 and 26/4-1 andthe southern edge of the Utsira High in well 15/6-8 Swere probably caused by reduced siliciclastic inputat sedimentation rates ideal for the preservation oforganic matter, and not (as previously proposed) byenhanced preservation in local pool-like areas withstagnant water (Justwan and Dahl, 2005). The lowerDraupne and the Heather Formations have generallyhigher accumulation rates above the critical value, andshow decreasing TOC values with increasingsiliciclastic input (Fig.15). There is no correlationbetween TOCIV and linear sediment accumulationrate, but there is a weak positive correlation betweenTOC and linear sediment accumulation rate for theupper, lower Draupne and Heather Formations (notshown), indicating that a higher amount of gas-pronematerial is transported to the basin with highersiliciclastic input.
The source facies of the upper Draupne Formationtherefore appears to be controlled principally by thereduced input of gas-prone organic matter, thegenerally good preservation in a widely anoxic
environment, and the reduced siliciclastic dilution.The facies and potential of the lower DraupneFormation, on the other hand, appear to depend to agreater extent on dilution by reworked and gas-proneorganic matter, derived by mass flow processes fromsurrounding highs. Preservation effects andsiliciclastic dilution still play a role in the control onthe facies distribution, but to a lesser degree than inthe upper Draupne Formation. The degree ofoxygenation and thus preservation, as well as theamount of siliciclastic dilution, are the key factorsdetermining the facies of the Heather Formation.Dilution by gas-prone and reworked organic matteris only of local importance.
CONCLUSIONS
(1) The upper section of the Draupne Formationof mid-Volgian to Ryazanian age is up to 330 m thickin the South Viking Graben, and represents a post-riftclay drape deposited with low sediment accumulationrates averaging 7 m/Ma in the analysed wells. Thesyn-rift section of Oxfordian to mid-Volgian age isup to 1,600 m thick in the graben centre and has ahigher average linear sediment accumulation rate of12 m/Ma in the analysed wells. The up to 930 m thickHeather Formation was deposited more rapidly thanthe Draupne Formation (20 m/Ma on average, in theanalysed wells).
(2) The mid-Volgian section is characterised by abasin-wide peak in gamma-ray values. This peakcoincides with a shift in the trend of Pr/Ph ratio andthe transition from syn- to post-rift sedimentation; itcan therefore be used to divide the Upper Jurassicsection where sequence stratigraphic orbiostratigraphic data are not available.
(3) The top of the oil window for the UpperJurassic source rock section from Rock-Eval and
Fig. 15. Plot of average compacted linear sedimentation rates (LSAR) versus TOCII (log-log scale) for theupper and lower Draupne and Heather Formations. Values of oil-prone TOC increase with increasing LSARup to an optimum value of 3 m/Ma and decrease thereafter due to siliciclastic dilution. Excellent oil potentialin the upper Draupne Formation in wells 16/10-4, 15/6-8S, 25/6-1, 25/6-2, 26/4-1 and 25/7-2 is associated withsediment accumulation rates ideal for the preservation of organic matter.
0.1 1 10 100 1000Average compacted LSAR (m/Ma)
0.01
0.1
1
10
TOCIIinwt%
Upper Draupne FmLower Draupne FmHeather Fm
25/6-225/6-225/6-125/6-1
15/6-8S15/6-8S
25/7-225/7-2
16/10-416/10-426/4-126/4-1

265H. Justwan et al.
vitrinite reflectance data occurs at 3,500 m, while theMiddle Jurassic source rocks enter the oil window ataround 3,800 m. Significant expulsion ofhydrocarbons occurs at approximately 4,000 m fromthe upper Draupne Formation, and at 4,100 m and4,200 m, respectively, from the lower Draupne andHeather Formations.
(4) Quantitative oil- and gas-potential maps basedon maturity-corrected Rock-Eval data point to the veryhigh oil potential for the thin upper DraupneFormation with maxima on the southern flank of theUtsira High and the flank of the Stord Basin. This isnot consistent with previous assumptions that oilpotential on highs and flanks is reduced. The lowerDraupne Formation has predominantly gas potential,with the strong influence of mass flow processeswhich transported gas-prone and inert organic matterto the deep basin. The gas potential of all sectionsdecreases to the east, suggesting the main sedimentsource was the East Shetland Platform. The HeatherFormation is the least oil-prone section and exhibitsmainly gas potential.
(5) Source potential and molecular and isotopicproperties show major variations in the Middle toUpper Jurassic section. Biomarker and isotope dataindicate changes in depositional environment from theMiddle Jurassic to the upper Draupne Formationwhich support the results of Rock-Eval data.
(6) Decreasing Pr/Ph ratios, decreasing dominanceof C34 homohopanes over C35 homohopanes as wellas increasing relative amounts of 17α(H),21β(H)-28,30-bisnorhopane indicate a decreasing degree ofoxygenation from the Heather to the upper DraupneFormation. Maps of the Pr/Ph ratio show that thisdevelopment is consistent with a permanentlystratified water column with an ascending O2:H2Sinterface.
(7) The distribution of organofacies and sourcepotential in the South Viking Graben is the result ofthe interplay of factors including siliciclastic dilution,dilution by gas-prone and inert material, preservationand basin geometry. The highest overall TOC valuesare encountered in depocentres in the graben, and thenarrow shape of the graben allowed terrestrial andreworked organic matter to reach the graben centrefrom the surrounding highs on both eastern andwestern flanks. While the source facies of the upperDraupne Formation is controlled by preservationunder anoxic to dysoxic conditions together withreduced dilution by siliciclastic, terrestrial andreworked material, that in the lower Draupne is mainlycontrolled by dilution by terrestrial and reworkedorganic matter transported by mass flows. The HeatherFormation’s facies can be explained by siliciclasticdilution and preservation effects. The exceptionallyhigh oil potential in the upper Draupne Formation on
the flank of the Stord Basin and the Utsira High isrelated to deposition under sedimentation ratespromoting preservation of organic matter.
ACKNOWLEDGEMENTS
Financial support for this project was provided by EssoExploration and Production Norway A/S and theResearch Council of Norway (Grant NFR 157825/432). We are indebted to Norsk Hydro A/S for theRock-Eval analyses. Jørgen Bojesen-Koefoed andPeter Nytoft at GEUS (Denmark) are thanked for theuse of the MPLC system and technical assistance inthe laboratory. The authors would also like to thankthe Norwegian Petroleum Directorate for the releaseof sample material, and Esso Exploration andProduction Norway A/S for all the data received andvaluable technical discussions. Aurélie Nowinski isthanked for fruitful comments on earlier versions ofthe manuscript. Reviews by Iain Scotchman andRichard Tyson on a previous version of the manuscriptare acknowledged with thanks.
REFERENCES
BAIRD, R.A., 1986. Maturation and source rock evaluation ofKimmeridge Clay, Norwegian North Sea. AAPG Bull., 70, 1-11.
BARNARD, P.C., COLLINS, A.G., and B.S. COOPER, B.S., 1981.Identification and distribution of kerogen facies in a sourcerock horizon - examples from the North Sea basin, In:BROOKS, J. (Ed.), Organic maturation studies and fossilfuel exploration. Academic Press, London, 271-282.
BARNARD, P.C. and COOPER, B.S., 1981. Oils and sourcerocks of the North Sea area. In: ILLING, L.V. and HOBSON,G.D. (Eds), Petroleum geology of the continental shelf ofNorth-West Europe: Proceedings of the 2nd Conference.Heyden and Son, London, 169-175.
BRASSELL, S.C., EGLINTON, G. and HOWELL, V.J., 1987.Palaeoenvironmental assessment for marine organic-richsediments using molecular organic geochemistry. In:BROOKS, J. and FLEET, A.J. (Eds), Marine petroleum sourcerocks. Geol. Soc. London Spec. Publ., 26, 79-98.
BRAY, E.E. and EVANS, E.D., 1961. Distribution of n-paraffinsas a clue to recognition of source beds. Geochim.Cosmochim. Acta, 22, 2-15.
BROOKS, J.D., GOULD, K. and SMITH, J.W., 1969. Isoprenoidhydrocarbons in coal and petroleum. Nature, 222, 257-259.
COCKINGS, J.H., KESSLER, L.G., MAZZA, T.A. and RILEY, L.A.,1992. Bathonian to mid-Oxfordian sequence stratigraphyof the South Viking Graben, North Sea. In: HARDMAN,R.F.P. (Ed.), Exploration Britain; geological insights for thenext decade. Geol. Soc. London Spec. Publ., 67, 65-105.
COOPER, B.S. and BARNARD, P.C., 1984. Source rock andoils of the central and northern North Sea. In: DEMAISON,G. and MURRIS ROELEF, J. (Eds), Petroleum geochemistryand basin evaluation. AAPG Memoir, 35, 303-314.
COOPER, B.S., BARNARD, P.C. and TELNAES, N., 1993. TheKimmeridge Clay Formation of the North Sea. In: BROOKS,J. and FLEET, A.J. (Eds), Marine petroleum source rocks.Geol. Soc. London Spec. Publ., 26, 89-110.
CORNFORD, C., 1998. Source rocks and hydrocarbons ofthe North Sea. In: GLENNIE, K.W. (Ed.), Petroleum geology
266 Late to Middle Jurassic source facies and quality variations, South Viking Graben, North Sea
of the North Sea; basic concepts and recent advances.Blackwell, Oxford, 376-462.
CORNFORD, C., GARDNER, P. and BURGESS, C., 1998.Geochemical truths in large data sets; I, Geochemicalscreening data. Org. Geochem., 29, 519-530.
DAHL, B., 2004. The use of bisnorhopane as a stratigraphicmarker in the Oseberg Back Basin, North Viking Graben,Norwegian North Sea. Org. Geochem., 35, 1551-1571.
DAHL, B., BOJESEN-KOEFOED, J., HOLM, A., JUSTWAN, H.,RASMUSSEN, E. and THOMSEN, E., 2004. A new approachto interpreting Rock-Eval S2 and TOC data for kerogenquality assessment. Org. Geochem., 35, 1461-1477.
DAHL, B. and SPEERS, G.C., 1985. Organic Geochemistry ofthe Oseberg Field (I). In: THOMAS, B.M., DORE, A.G.,EGGEN, S.S., HOME, P.C. and LARSEN, R.M. (Eds),Petroleum geochemistry in exploration of the NorwegianShelf. Graham and Trotman, London, 185-195.
DEMAISON, G.J. and MOORE, G.T., 1980. Anoxicenvironments and oil source bed genesis. AAPG Bull., 64,1179-1209.
di PRIMIO, R., 2002. Unraveling secondary migration effectsthrough the regional evaluation of PVT data; a case studyfrom Quadrant 25, NOCS. Org. Geochem., 33, 643-653.
DIDYK, B.M., SIMONEIT, B.R.T., BRASSELL, S.C. andEGLINTON, G., 1978. Organic geochemical indicators ofpalaeoenvironmental conditions of sedimentation. Nature,272, 216-222.
DIECKMANN, V., FOWLER, M. and HORSFIELD, B., 2004.Predicting the composition of natural gas generated bythe Duvernay Formation (Western Canada SedimentaryBasin) using a compositional kinetic approach. Org.Geochem., 35, 845-862.
DORE, A.G., VOLLSET, J. and HAMAR, G.P., 1985. Correlationof the offshore sequences referred to the KimmeridgeClay Formation; relevance to the Norwegian sector. In:THOMAS, B.M., DORE, A.G., EGGEN, S.S., HOME, P.C.and LARSEN, R.M. (Eds), Petroleum geochemistry inexploration of the Norwegian Shelf. Graham and Trotman,London, 27-37.
ESPITALIE, J., 1987. Organic Geochemistry of the Paris Basin.In: BROOKS, J. and GLENNIE, K.W. (Eds), Petroleumgeology of Northwest Europe. Graham and Trotman,London, 71-86.
FAERSETH, R.B., 1996. Interaction of Permo-Triassic andJurassic extensional fault-blocks during the developmentof the northern North Sea. Journ. Geol. Soc. London, 153,931-944.
FIELD, J.D., 1985. Organic geochemistry in exploration of thenorthern North Sea. In: THOMAS, B.M., DORE, A.G.,EGGEN, S.S., HOME, P.C. and LARSEN, R.M. (Eds),Petroleum geochemistry in exploration of the NorwegianShelf. Graham and Trotman, London, 39-57.
FISHER, M.J. and MILES, J.A., 1983. Kerogen types, organicmaturation and hydrocarbon occurrences in the MorayFirth and South Viking Graben, North Sea basin. In:BROOKS, J. (Ed.), Petroleum geochemistry and explorationof Europe. Geol. Soc. London Spec. Publ., 12, 195-201.
FISHER, M.J. and MUDGE, D.C., 1998. Triassic. In: GLENNIE,K.W. (Ed.), Petroleum geology of the North Sea; basicconcepts and recent advances. Blackwell, Oxford, 212-244.
FRASER, S.I., ROBINSON, A.M., JOHNSON, H.D., UNDERHILL,J.R., KADOLSKY, D.G.A., CONNELL, R., JOHANNESSEN,E.P. and RAVNAS, R., 2003. Upper Jurassic. In: EVANS, D.,GRAHAM, C., ARMOUR, A. and BATHURST, P. (Eds), TheMillennium Atlas: petroleum geology of the central andnorthern North Sea. Geol. Soc. London, 289-316.
GABRIELSEN, R.H., KYRKJEBØ, R., FALEIDE, J.I., FJELDSKAAR,W. and KJENNERUD, T., 2001. The Cretaceous post-riftbasin configuration of the northern North Sea. PetroleumGeoscience, 7, 137-154.
GELPI, E., SCHNEIDER, H., MANN, J. and ORO, J., 1970.Hydrocarbons of geochemical significance in microscopicalgae. Phytochemistry, 9, 603-612.
GOFF, J.C., 1983. Hydrocarbon generation and migration fromJurassic source rocks in the E Shetland Basin and VikingGraben of the northern North Sea. Journ. Geol. Soc. London,140, 445-474.
GORMLY, J.R., BUCK, S.P. and CHUNG, H.M., 1994. Oil-sourcerock correlation in the North Viking Graben. Org. Geochem.,22, 403-413.
GRANTHAM, P.J., POSTHUMA, J. and DE GROOT, K., 1980.Variation and significance of the C-27 and C-28 triterpanecontent of a North Sea core and various North Sea crudeoils. Physics and Chemistry of the Earth, 12, 29-38.
GREGERSEN, U., MICHELSEN, O. and SØRENSEN, J.C., 1997.Stratigraphy and facies distribution of the Utsira Formationand the Pliocene sequences in the northern North Sea.Mar. Petrol. Geol., 14, 893-914.
HALLAM, A. and BRADSHAW, M.J., 1979. Bituminous shalesand oolitic ironstones as indicators of transgressions andregressions. Journ. Geol. Soc. London, 136, 157-164.
HANSLIEN, S., 1987. Balder. In: SPENCER, A.M. (Ed.), Geologyof the Norwegian oil and gas fields. Graham and Trotman,Norwell, 193-201.
HARDENBOL, J., THIERRY, J., FARLEY, M.B., DE GRACIANSKY,P.C. and VAIL, P.R., 1998. Mesozoic and Cenozoic sequencechronostratigraphic framework of European basins In:Mesozoic and Cenozoic sequence stratigraphy of Europeanbasins. SEPM Spec. Publ., 60, 3-13.
HUANG, W.Y. and MEINSCHEIN, W.G., 1979. Sterols asecological indicators. Geochim. Cosmochim. Acta, 43, 739-746.
HUC, A.Y., 1988. Aspects of depositional processes of organicmatter in sedimentary basins. Org. Geochem., 13, 263-272.
HUC, A.Y., 1990. Understanding organic facies; a key toimproved quantitative petroleum evaluation of sedimentarybasins. In: HUC, A.Y. (Ed.), Deposition of organic facies.AAPG Studies in Geol., 30, 1-11.
HUC, A.Y., IRWIN, H. and SCHOELL, M., 1985. Organic matterquality changes in an Upper Jurassic shale sequence fromthe Viking Graben. In: THOMAS, B.M., DORE, A.G., EGGEN,S.S., HOME, P.C. and LARSEN, R.M. (Eds), Petroleumgeochemistry in exploration of the Norwegian Shelf.Graham and Trotman, London, 179-183.
HUSMO, T., HAMAR, G.P., HØILAND, O., JOHANNESSEN,E.P., RØMULD, A., SPENCER, A.M. and TITTERTON, R.,2003. Lower and Middle Jurassic. In: EVANS, D., GRAHAM,C., ARMOUR, A. and BATHURST, P. (Eds), The MillenniumAtlas: petroleum geology of the central and northernNorth Sea. Geol. Soc. London, 129-156.
IBACH, L.E.J., 1982. Relationship between sedimentation rateand total organic carbon content in ancient marinesediments. AAPG Bull., 66, 170-188.
INESON, J.R., BOJESEN-KOEFOED, J.A., DYBKJAER, K. andNIELSEN, L.H., 2003. Volgian-Ryazanian “hot shales” of theBo Member (Farsund Formation) in the Danish CentralGraben, North Sea; stratigraphy, facies and geochemistry.In: INESON, J.R. and SURLYK, F. (Eds), The Jurassic ofDenmark and Greenland. Geological Survey of Denmark andGreenland Bulletin, 1, 403-436.
ISAKSEN, G.H. and BOHACS, K.M., 1995. Geological controlsof source rock geochemistry through relative sea level;Triassic, Barents Sea. In: KATZ, B.J. (Ed.), Petroleum SourceRocks. Springer, Berlin, 25-50.
ISAKSEN, G.H., CURRY, D.J., YEAKEL, J.D. and JENSSEN, A.I.,1998. Controls on the oil and gas potential of humic coals.Org. Geochem., 29, 23-44.
ISAKSEN, G.H. and LEDJE, K.H.I., 2001. Source rock qualityand hydrocarbon migration pathways within the greaterUtsira High area, Viking Graben, Norwegian North Sea.

267H. Justwan et al.
AAPG Bull., 85, 861-883.ISAKSEN, G.H., PATIENCE, R., VAN GRAAS, G. and JENSSEN,
A.I., 2002. Petroleum system analysis in a rift basin withmixed marine and nonmarine source rocks; the SouthViking Graben, North Sea. AAPG Bull., 86, 557-591.
JACQUIN, T., DARDEAU, G., DURLET, C., DE GRACIANSKY,P.C. and HANTZPERGUE, P., 1998. The North Sea cycle;an overview of 2nd-order transgressive/ regressive faciescycles in Western Europe. In: Mesozoic and Cenozoicsequence stratigraphy of European basins. SEPM Spec. Publ.,60, 445-466.
JUSTWAN, H. and DAHL, B., 2005. Quantitative HydrocarbonPotential Mapping and Organofacies Study in the GreaterBalder Area, Norwegian North Sea. In: DORE, A.G. andVINING, B.A. (Ed.), Petroleum Geology: of North-WestEurope and Global Perspectives Proceedings of the 6thPetroleum Geology Conference. Geol. Soc. London, 1317-1329.
KATZ, B.J. and ELROD, L.W., 1983. Organic Geochemistry ofDSDP Site 467, offshore California, middle Miocene tolower Pliocene strata. Geochim. Cosmochim. Acta, 47, 389-396.
KUBALA, M., BASTOW, M., THOMPSON, S., SCOTCHMAN,I. and ØYGARD, K., 2003. Geothermal regime, petroleumgeneration and migration. In: EVANS, D., GRAHAM, C.,ARMOUR, A. and BATHURST, P. (Eds), The Millennium Atlas:petroleum geology of the central and northern NorthSea. Geol. Soc. London, 289-315.
MILLER, R.G., 1990. A paleoceanographic approach to theKimmeridge Clay Formation. In: HUC, A.Y. (Ed.), Depositionof organic facies. AAPG Studies in Geol., 30, 13-26.
MÜLLER, P.J.and SÜSS, E., 1979. Productivity, sedimentationrate, and sedimentary organic matter in the oceans; I,Organic carbon preservation. Deep-Sea Research, 26, 1347-1362.
NORTHAM, M.A., 1985. Correlation of northern North Seaoils; the different facies of their Jurassic source. In:THOMAS, B.M., DORE, A.G., EGGEN, S.S., HOME, P.C. andLARSEN, R.M. (Eds), Petroleum geochemistry inexploration of the Norwegian Shelf. Graham and Trotman,London, 93-99.
NORWEGIAN PETROLEUM DIRECTORATE, 2005. Factmaps.[22 May 2005]. Available at: <http://217.68.117.237/website/NPDGIS/viewer.htm>.
OSCHMANN, W., 1988. Kimmeridge clay sedimentation; a newcyclic model. Palaeogeography, Palaeoc l imatology,Palaeoecology, 65, 217-251.
PARRISH, J.T. and CURTIS, R.L., 1982. Atmospheric circulation,upwelling, and organic-rich rocks in the Mesozoic andCenozoic eras. Paleogeography and Climate. Elsevier,Amsterdam, 31-66.
PETERS, K.E. and MOLDOWAN, J.M., 1991. Effects of source,thermal maturity, and biodegradation on the distributionand isomerization of homohopanes in petroleum. Org.Geochem., 17, 47-61.
PETERS, K.E. and MOLDOWAN, J.M., 1993. The biomarkerguide; interpreting molecular fossils in petroleum andancient sediments. Prentice Hall, Englewood Cliffs, 363 pp.
PETERSEN, H.I., BOJESEN-KOEFOED, J.A. and NYTOFT, H.P.,2002. Source rock evaluation of Middle Jurassic coals,Northeast Greenland, by artificial maturation; aspects ofpetroleum generation from coal. AAPG Bull., 86, 233-256.
RADKE, M., WILLSCH, H. and WELTE, D.H., 1980. Preparativehydrocarbon determination by automated MediumPressure Liquid Chromatography. Analytical Chemistry, 52,406-411.
RAMANAMPISOA, L. and DISNAR, J.R., 1994. Primary controlof paleoproduction on organic matter preservation andaccumulation in the Kimmeridge rocks of Yorkshire (UK).Org. Geochem., 21, 1153-1167.
RATTEY, R.P. and HAYWARD, A.B., 1993. Sequence stratigraphyof a failed rift system; the Middle Jurassic to EarlyCretaceous basin evolution of the central and northernNorth Sea. In: PARKER, J.R. (Ed.), Petroleum geology ofNorthwest Europe: Proceedings of the 4th conference.Geol. Soc. London, 215-249.
RAWSON, P.F. and RILEY, L.A., 1982. Latest Jurassic-EarlyCretaceous events and the “late Cimmerian unconformity”in North Sea area. AAPG Bull., 66, 2628-2648.
SCOTCHMAN, I.C.,1991. Kerogen facies and maturity of theKimmeridge clay formation in southern and easternEngland. Mar. Petrol. Geol., 8, 278-295.
SEIFERT, W.K. and MOLDOWAN, J.M., 1985. Paleo-reconstruction by biological markers. In: Proceedings ofthe Annual Convention - Indonesian Petroleum Asso-ciation, 189-212.
SEIFERT, W.K. and MOLDOWAN, J.M., 1986. Use of biologicalmarkers in petroleum exploration. Methods in Geochemistryand Geophysics, 24, 261-290.
SKARPNES, O., HAMAR, G.P., JAKOBSSON, K.H. andORMAASEN, D.E., 1980. Regional Jurassic setting of theNorth Sea north of the Central Highs. In: Thesedimentation of the North Sea reservoir rocks. NPF, Oslo,8.
SNEIDER, J.S., DE CLARENS, P. and VAIL, P.R., 1995. Sequencestratigraphy of the Middle to Upper Jurassic, Viking Graben,North Sea. In: STEEL, R.J. (Ed.), Sequence Stratigraphy onthe Northwest European Margin. NPF Special Publication,5, 167-197.
TEN HAVEN, H.L., DE LEEUW, J.W., RULLKOETTER, J. andSINNINGHE-DAMSTE, J.S., 1987. Restricted utility of thepristane/phytane ratio as a palaeoenvironmental indicator.Nature, 330, 641-643.
THOMAS, B.M., MØLLER-PEDERSEN, P., WHITAKER, M.F. andSHAW, N.D., 1985. Organic facies and hydrocarbondistributions in the Norwegian North Sea. In: THOMAS,B.M., DORE, A.G., EGGEN, S.S., HOME, P.C. and LARSEN,R.M. (Eds), Petroleum geochemistry in exploration of theNorwegian Shelf. Graham and Trotman, London, 3-26.
TISSOT, B.P. and WELTE, D.H., 1984. Petroleum formation andoccurrence. Springer, Berlin, 699 pp.
TYSON, R.V. 1989. Late Jurassic palynofacies trends, Piper andKimmeridge Clay Formations, UK onshore and northernNorth Sea. In: BATTEN, D.J. and KEEN, M. (Eds), NorthwestEuropean Micropalaeontology and Palynology. BritishMicropalaeontological Society Series, Ellis Horwood,Chichester, 135-172.
TYSON, R.V., 2004. Variation in marine total organic carbonthrough the type Kimmeridge Clay Formation (LateJurassic), Dorset, UK. Journ. Geol. Soc. London, 161, 667-673.
TYSON, R.V., WILSON, R.C.L. and DOWNIE, C., 1979. Astratified water column environmental model for the typeKimmeridge Clay. Nature, 277, 377-380.
UNDERHILL, J.R., 1998. Jurassic. In: GLENNIE, K.W. (Ed.),Petroleum geology of the North Sea; basic concepts andrecent advances. Blackwell, Oxford, 245-292.
VOLLSET, J. and DORE, A.G., 1984. A revised Triassic andJurassic Lithostratigraphic Nomenclature of the NorwegianNorth Sea. Norwegian Petroleum Directorate Bull., 59, 53 pp.
WAPLES, D.W. and MARZI, R.W., 1998. The universality of therelationship between vitrinite reflectance andtransformation ratio. Org. Geochem., 28, 383-388.
WEISS, H.M., WILHELMS, A., MILLS, N., SCOTCHMER, J., HALL,P.B., LIND, K. and BREKKE, T., 2000. NIGOGA: TheNorwegian Guide to Organic Geochemical Analyses. [22Oct. 2004]. Available at: <http://www.npd.no/engelsk/nigoga/default.htm>.
WIGNALL, P.B., 1994. Black shales. Oxford University Press,Oxford, 127 pp.

268 Late to Middle Jurassic source facies and quality variations, South Viking Graben, North Sea
WIGNALL, P.B. and RUFFELL, A.H., 1990. The influence of asudden climatic change on marine deposition in theKimmeridgian of Northwest Europe. Journ. Geol. Soc. London,147, 365-371.
ZIEGLER, P.A., 1992. North Sea rift system. Tectonophysics, 208,55-75.