paper no. 11622 - institute for corrosion and multiphase
TRANSCRIPT

Effectiveness of an imidazoline-type inhibitor against CO2 corrosion
of mild steel at elevated temperatures (120C-150C)
Yuan Ding, Bruce Brown, David Young, Marc Singer
Institute for Corrosion and Multiphase Technology
Department of Chemical & Biomolecular Engineering
Ohio University
342 West State Street
Athens, OH 45701
Abstract
Production of oil and gas from increasingly aggressive geologic environments requires
the development of appropriate corrosion mitigation strategies, including the selection of
corrosion inhibitors with adequate performance characteristics. In this study, the
inhibition performance of a diethylenetriamine tall oil fatty acid imidazoline-type inhibitor
(DETA/TOFA imidazoline) against CO2 corrosion of an API 5L X65 carbon steel was
studied at two temperatures, 120C and 150C. The corrosion measurements were
performed in a CO2 saturated 1 wt.% NaCl electrolyte, via electrochemical
measurements, in a standard autoclave and in a specially designed two-autoclave
system. A two-autoclave design was developed and adopted for transferring heated,
deoxygenated aqueous electrolyte to the autoclave containing the working electrode,
thereby limiting specimen exposure to oxygen and eliminating long transition times
associated with solution heating/cooling. At 120C, the two autoclave setup successfully
enabled the identification of the true corrosion inhibitor behavior by preventing build-up
of corrosion product layers. At this temperature, the imidazoline type inhibitor did adsorb
on the steel surface with an inhibition efficiency of 61%. At 150C, the presence of
inhibitor did not affect the corrosion profile, whatever the autoclave system used. The
surfaces of the specimens retrieved from experiments were characterized using
scanning electron microscopy (SEM), energy-dispersive X-ray spectroscopy (EDS) and
X-ray diffraction (XRD). At 150C, the rapid formation of Fe3O4, rather than the effect of
inhibitor, seemed to have controlled the corrosion behavior. However, the presence of
the imidazoline-type inhibitor impeded the formation of corrosion product layers.
Key words: High temperature, CO2 corrosion, corrosion inhibition, imidazoline-type
inhibitor, magnetite
1
Paper No.
11622
©2018 by NACE International.Requests for permission to publish this manuscript in any form, in part or in whole, must be in writing toNACE International, Publications Division, 15835 Park Ten Place, Houston, Texas 77084.The material presented and the views expressed in this paper are solely those of the author(s) and are not necessarily endorsed by the Association.

Introduction and Objectives
Depletion of hydrocarbon reservoirs in relatively shallow strata has driven the oil and
gas industry to drill deeper in order to access hitherto untapped resources1. Due to
geologic reasons2, these new reservoirs usually feature high temperature and high
pressure characteristics. This can present acute technical challenges for the industry,
one of which being the management of high temperature CO2 corrosion of tubing
material. Many mitigation methods have been developed and applied to address this
challenge. The most cost-effective technique, used widely in transmission pipelines as
well as downhole, involves injection of corrosion inhibitors.
Generally, corrosion inhibitors mitigate corrosion predictably and effectively at lower
temperatures (up to 80C). The efficiency and cost effectiveness of corrosion inhibitors
have driven operators and researchers to attempt to extend their domain of validity to
higher temperatures(100C-180C)3–5. Efforts have been made to develop specific
inhibitor formulations that are effective at high temperature3–5, however, little attention is
typically paid to understand the underlying mechanisms behind failed or successful
inhibition.
In an earlier research described by the authors of this paper, inhibition performance and
adsorption characteristics of an imidazoline-type inhibitor were investigated up to 80C6.
Inhibition performance decreased with temperature, suggesting that desorption from the
steel surface was favored at higher temperature. However, whether the same
adsorption/desorption behavior governs the performance of corrosion inhibitor at
elevated temperatures (100C and above) remained unknown.
At higher temperature, CO2 corrosion product formation has greater complexity. The
kinetics for formation of corrosion products is naturally, and significantly, accelerated. In
addition, at even higher temperatures (150C and above) Fe3O4 can also form6, 7 in
addition to FeCO3. Possible interactions between this corrosion product and inhibitor
molecules are unknown.
Experimental evaluation of corrosion inhibitors at high temperature also brings its own
sets of challenges. Autoclaves are typically used in this environment, but the limited
volume of the systems (usually under 10 liters) and the inherent difficulty to monitor and
control electrolyte chemistry create an environment where aqueous chemistry, in
particular pH and [Fe2+], can change and corrosion products can be formed rapidly.
Consequently, design of new experimental setups that can effectively minimize
experimental artifacts is of paramount importance.
In the present study, the effect of an imidazoline-type inhibitor on the corrosion behavior
of carbon steel was investigated at 120C and 150C in two different autoclave systems:
• The first autoclave system consisted of a standard “closed system” autoclave
equipped with an inhibitor injector. The experiment protocols necessitated
2
©2018 by NACE International.Requests for permission to publish this manuscript in any form, in part or in whole, must be in writing toNACE International, Publications Division, 15835 Park Ten Place, Houston, Texas 77084.The material presented and the views expressed in this paper are solely those of the author(s) and are not necessarily endorsed by the Association.

lengthy heating (and cooling) periods where steel specimens were immersed in
the electrolyte and corrosion products could form, even before injection of
inhibitors.
• The second autoclave system included two autoclaves connected to each other,
one of them used to heat (and cool) the electrolyte and the other used to perform
the inhibition test. In this scenario, the steel specimens and solution were heated
separately. The heating (and cooling) periods were eliminated as the specimens
were exposed to the inhibited solution at the tested conditions only. This limited
the formation of corrosion product compared to the one autoclave system.
In addition, the role of the thermal stability of the corrosion inhibitor was also
investigated to understand its effect on its performance at high temperature.
Corrosion rates were measured using linear polarization resistance (LPR). The surfaces
of the specimens retrieved after the experiments were characterized using scanning
electron microscopy (SEM), energy-dispersive X-ray spectroscopy (EDS) and X-ray
diffraction (XRD).
Experimental Procedure
Equipment
Single autoclave system
The single autoclave system contains a 4-liter autoclave equipped with an inhibitor
injector, as shown in Figure 1(a). There are three electrodes mounted through the
autoclave’s stainless steel lid, namely an Ag/AgCl reference probe, a Pt-coated Nb
counter electrode, and the working electrode (API 5L X65 steel, UNS K03014, Table 1).
In addition, the pH is monitored using a ZrO2-based pH probe that can operate in high
temperature and high pressure environments; calibration is performed using standard
solutions. Linear polarization resistance (LPR) and open circuit potential (OCP)
measurements are performed using a Gamry † Reference 600™ potentiostat. The
temperature in the autoclave is continuously monitored and controlled using a digital
reader. The test electrolyte is stirred using an impeller.
In the injection system, 200 mL of 1 wt.% NaCl containing the desired molar amount of
corrosion inhibitor is loaded into a pressure bomb; the electrolyte is purged beforehand
with N2 to minimize the presence of O2. The injection bomb is connected to the
autoclave lid by appropriate fittings. When it is the time for injection, the bomb is
pressurized with N2 so its internal pressure is higher than in the autoclave. Upon
opening of the valve connecting the bomb and the autoclave, the pressure difference
drives the inhibitor solution into the autoclave.
† Trade Name.
3
©2018 by NACE International.Requests for permission to publish this manuscript in any form, in part or in whole, must be in writing toNACE International, Publications Division, 15835 Park Ten Place, Houston, Texas 77084.The material presented and the views expressed in this paper are solely those of the author(s) and are not necessarily endorsed by the Association.

Each experiment was conducted in 3L of 1 wt.% NaCl solution. After it was poured into
the autoclave body, the electrolyte was purged continuously with CO2 for more than 2
hours at 80C to remove O2. After purging, the stainless steel lid, with pre-installed
specimens, electrodes and probes, was attached to the autoclave body. The gas outlet
and inlet valves were then closed and the temperature set to the desired target value.
When the desired temperature was achieved, the system was pressurized with CO2 to
apply an additional 2 bar of pressure. Electrochemical measurements (LPR and OCP)
were started after this pressurizing step, for use as a baseline condition. After
completion of the baseline measurements, the inhibitor solution was injected into the
system. The corrosion rate was monitored using LPR for 24 hours. Measurements were
carried out every 30 minutes over the first 2 hours and every hour for the next 22 hours.
Bulk solution pH was measured at the end of the experiments and solution samples
were taken for Fe2+ concentration analysis. The system was then cooled to around 80C,
depressurized, the lid detached, and the hanging specimens removed. The retrieved
specimens were stored in a N2 flushed cabinet for subsequent surface characterization
by SEM and EDS. The corrosion product was characterized using XRD. Solution
samples were taken immediately after the injection of corrosion inhibitor and at the end
of the experiment for analysis by ultraviolet-visible (UV-Vis) spectroscopy.
(a) Single autoclave system (b) Two-autoclave system
Figure 1. Configuration of the autoclave systems (CI stands for solution containing inhibitor)
Table 1. Chemical composition of API 5L X65
C Mn Si S P V Mo Ni Fe
0.13% 1.16% 0.26% 0.009% 0.009% 0.047% 0.16% 0.36% Balance
4
©2018 by NACE International.Requests for permission to publish this manuscript in any form, in part or in whole, must be in writing toNACE International, Publications Division, 15835 Park Ten Place, Houston, Texas 77084.The material presented and the views expressed in this paper are solely those of the author(s) and are not necessarily endorsed by the Association.

The test conditions are given in Table 2. The critical micelle concentration (CMC) of the
imidazoline-type inhibitor used in the set of experiments was measured as 36ppm (by
volume) at 25C. However, in the earlier work6, 1 CMC of the inhibitor was proven to be
insufficient to control corrosion at higher temperatures (50-80C). Therefore, in this work,
the system was “overdosed” with 440ppm corrosion inhibitor at the tested temperatures.
Table 2. Test matrix at 120C and 150C
Parameters Description
Temperature/C 120, 150
Imidazoline-type inhibitor concentration/ppm 0, 440
Solution 3L 1 wt.% NaCl saturated with CO2
Initial pH at 80C 4.30
Material APL 5L X65
Impeller speed/rpm 200
Electrochemical measurements LPR, OCP
Two-autoclave system
The second autoclave system is shown in Figure 1(b). The major difference between
the single autoclave system and the 2-autoclave system is that the solutions and the
specimens are heated to the desired temperature in two different autoclaves.
Otherwise, the components in the autoclave are similar. There are also three electrodes
as well as a high temperature high pressure pH probe mounted through the autoclave
lid. The temperature is monitored and controlled using the same digital controller. The
solution is mixed with an impeller set to 200rpm.
The procedure in the two-autoclave system is slightly different from the single-autoclave
system. The main differences are in the heating up and cooling down periods. First, the
solution was heated at 80C in autoclave 2 and sparged with CO2 continuously to
remove oxygen. Autoclave 1, which contained the specimens but no electrolyte, was
also sparged with CO2 and heated to 80C. After 2-3 hours of purging, both autoclaves
were closed and heated to the desired temperature. Later, the solution was transferred
from autoclave 2 to autoclave 1 with N2 gas by opening valves between the two
autoclaves. After the solution was completely transferred, electrochemical
measurements were started in autoclave 1. One LPR measurement was taken as a
baseline and then the inhibitor solution was injected into the system through the
injection vessel. Similarly, the corrosion rate was monitored using LPR for 24 hours.
Bulk solution pH was measured at the end of the experiments and solution samples
were taken for Fe2+ concentration analysis. After electrochemical measurements ended,
autoclave 1 was pressurized with N2 and the valve between the two autoclaves was
opened. The pressure difference drove the solution from autoclave 1 back into
autoclave 2. Therefore, the cooling-down of solution and specimens were also done in
5
©2018 by NACE International.Requests for permission to publish this manuscript in any form, in part or in whole, must be in writing toNACE International, Publications Division, 15835 Park Ten Place, Houston, Texas 77084.The material presented and the views expressed in this paper are solely those of the author(s) and are not necessarily endorsed by the Association.

two separate autoclaves. Autoclave 1 was then cooled to around 80C, depressurized,
the lid detached, and the hanging specimens removed following the same procedure as
in the single-autoclave system. The retrieved specimens were characterized by SEM,
EDS and XRD. Solution samples were also taken immediately after the injection of
corrosion inhibitor and at the end of the experiment for analysis by UV-Vis spectroscopy.
The new “two-autoclave” system yields the following improvements compared to the
traditional “single-autoclave”:
➢ The solution was heated in a separate autoclave. This significantly limited any potential ingress of oxygen. The measured oxygen level at the end of purging was below 3ppb.
➢ By heating the solutions and the specimens in two separate autoclaves, the heating period decreased from 3-4 hours to less than 20 minutes. This substantially limited the formation of corrosion product.
➢ The solutions and the specimens were cooled down separately as well. The cooling-down period was reduced from 5-6 hours to 2-3 hours. By keeping the specimens in inert conditions (N2 environment) at the end of experiments, the nature of the corrosion products was not altered during the cooling period.
The tested conditions, which are the same in both autoclave systems, are given in
Table 2.
Results and Discussion
Corrosion behavior of X65 steel at 120C with and without inhibitor in the single
autoclave system
The changes of LPR corrosion rates with time for tests conducted with 440ppm
imidazoline-type inhibitor and without inhibitor are shown in Figure 2.
In the absence of inhibitor, the corrosion rate initially increased to around 10 mmy-1 and
remained at that value for about 8 hours, before gradually dropping to 1 mmy-1 over the
next 16 hours. This indicates that in the first several hours of the test, the formation of a
FeCO3 layer was not favored and that the corrosion rate was mainly “bare steel”
corrosion governed by the partial pressure of CO2. However, as corrosion progressed,
water chemistry changed in the autoclave’s closed system (increase in pH and [Fe2+])
and resulted in development of local environments favoring the growth of iron carbonate
on the working electrode surface. This led to formation of an increasingly protective
corrosion product layer and a decrease in the corrosion rate. The presence of iron
carbide in the steel microstructure may have also accelerated this phenomenon by
acting as an additional mass transfer barrier.
The test performed with corrosion inhibitor shows a different behavior. After the inhibitor
was injected into the system, the corrosion rate immediately dropped and stabilized at
around 3 mmy-1 over a period of about 3 hours. This behavior is similar to that
previously observed at temperatures of 25C to 80C in the authors’ earlier work6. This
6
©2018 by NACE International.Requests for permission to publish this manuscript in any form, in part or in whole, must be in writing toNACE International, Publications Division, 15835 Park Ten Place, Houston, Texas 77084.The material presented and the views expressed in this paper are solely those of the author(s) and are not necessarily endorsed by the Association.

demonstrates that the inhibitor can still reduce corrosion significantly at 120C. However,
the corrosion rate at the end of the experiment was still high. It is noteworthy that, at the
conclusion of each test, the uninhibited and inhibited corrosion rates were very close but
it is postulated that this behavior was obtained for two very different reasons,
specifically formation of corrosion product layer for the uninhibited test and presence of
inhibitor for the inhibited test; this is discussed in more detail below. However, the main
purpose of this study is not to investigate the effect of corrosion product layers or the
interaction between corrosion product layers and chemical inhibition. Consequently, the
true effect of chemical inhibition could be masked in this test as a consequence of using
a single “closed system” autoclave.
Figure 2. Corrosion rate with/without corrosion inhibitor at 120C and pCO2 2 bar in the single autoclave system (B=23mV/decade)
In order to confirm that the development of an iron carbonate layer was the reason
behind the decrease in corrosion rate in the uninhibited test, specimen surfaces were
characterized using SEM and EDS. The SEM images and EDS data are shown in
Figure 3 (a) and (b) for the uninhibited and inhibited tests, respectively.
Although all surfaces show extensive signs of corrosion, distinctive features were still
observed. The surfaces of specimens retrieved in the absence of corrosion inhibitor
showed two morphological features, one crystallized with an oblong growth habit (zone
1 of Figure 3(a)) and the other flat (zone 2 of Figure 3 (a)). However, for specimens
retrieved after exposure to 440 ppm imidazoline-type inhibitor, the surface appeared
relatively flat as aligned rods (zone 1 of Figure 3 (b)) or possess plate-like features
(zone 2 of Figure 3 (b)).
7
©2018 by NACE International.Requests for permission to publish this manuscript in any form, in part or in whole, must be in writing toNACE International, Publications Division, 15835 Park Ten Place, Houston, Texas 77084.The material presented and the views expressed in this paper are solely those of the author(s) and are not necessarily endorsed by the Association.

(a) 0 ppm inhibitor (b)440 ppm inhibitor
Figure 3. SEM images of the steel surfaces after 120C test
XRD patterns of the specimens exposed to the corrosive environments at 120C are
shown in Figure 4. The main corrosion product was iron carbonate for the tests without
corrosion inhibitor (Figure 4 (a)). However, no iron carbonate peak was observed in the
specimens obtained in the inhibited test (Figure 4 (b)).
(a) 0ppm inhibitor (b) 440ppm inhibitor
Figure 4.XRD patterns of the specimens retrieved after experiments in the single
autoclave system at 120C (S stands for iron carbonate, and Fe stands for iron).
Cross-section images and EDS data are shown in Figure 5. The SEM images show that
there was a corrosion product layer on the steel surface in experiments conducted in
the absence of corrosion inhibitor. Combined with the XRD results, it can be concluded
that the layer is an iron carbonate layer. In contrast, the corrosion product on the
surface of the inhibited specimen did not display any coherent structure comparable to
what was observed for the uninhibited test. The missing iron carbonate peaks suggest
that its formation was suppressed with the presence of corrosion inhibitor. Instead, the
layer visible on top of the steel surface in Figure 5 (b) is postulated to be iron carbide.
8
©2018 by NACE International.Requests for permission to publish this manuscript in any form, in part or in whole, must be in writing toNACE International, Publications Division, 15835 Park Ten Place, Houston, Texas 77084.The material presented and the views expressed in this paper are solely those of the author(s) and are not necessarily endorsed by the Association.

(a) 0 ppm inhibitor (b) 440 ppm inhibitor
Figure 5. SEM images and EDS analysis of steel cross-sections of specimens
retrieved from tests conducted at 120C (from left to right: epoxycorrosion
product layersteel matrix).
Corrosion behavior of X65 steel at 150C with and without corrosion inhibitor in
the single autoclave system
Corrosion rates of API 5L X65 specimens exposed to different concentrations of
corrosion inhibitor at 150C are shown in Figure 6. With 0 ppm corrosion inhibitor, the
corrosion rate initially increased then dropped and stabilized at around 1 mmy-1; as for
the previous test performed as 120C, this is likely due to the formation of a corrosion
product layer. With 440 ppm corrosion inhibitor, the corrosion rate decreased steadily
over the testing period until it reached a stable value of around 2 mmy-1. Since the
results with 0 and 440 ppm of inhibitor seem very close, an additional experiment with
880 ppm corrosion inhibitor was carried out. However, the corrosion behavior with
880ppm of inhibitor also ended up very similar to that observed for the other two tests.
This is significantly different from what was observed at 120C, which showed a sharp
decrease in inhibited corrosion rate immediately after injection and not a gradual
decrease as seen at 150C. At this point, it is unclear what, if any, effect the presence of
corrosion inhibitor had on the corrosion behavior.
9
©2018 by NACE International.Requests for permission to publish this manuscript in any form, in part or in whole, must be in writing toNACE International, Publications Division, 15835 Park Ten Place, Houston, Texas 77084.The material presented and the views expressed in this paper are solely those of the author(s) and are not necessarily endorsed by the Association.

Figure 6. Corrosion rate for different concentrations of corrosion inhibitor at
150C (B=23mV/decade). Purple arrow line shows when inhibitor was injected.
The surface of the specimen was characterized by SEM, as shown in Figure 7 (a), (b),
and (c). The surface morphologies of the steel specimen with and without corrosion
inhibitor show clear differences. Without corrosion inhibitor, the surface seems relatively
uniform and the presence of a homogeneous corrosion product layer is evident.
However, in the presence of corrosion inhibitor (440 or 880 ppm), a porous,
heterogeneous layer is present on the metal surface which is postulated to be iron
carbide.
(a) 0ppm inhibitor (b) 440ppm inhibitor (c) 880ppm inhibitor
Figure 7. SEM of X65 steel surface with various concentrations of corrosion
inhibitor at 150C
The XRD patterns of the specimens retrieved from the experiments at 150C in the
single autoclave system are shown in Figure 8. At 150C, a new type of corrosion
product, Fe3O4, was observed for the experiments at 150C, even in the absence of
inhibitor. This was also observed in other researchers’ work7, 8. It is noticeable that in
the tests with corrosion inhibitor, the XRD patterns feature low intensity peaks of Fe3O4
and high intensity peaks of iron. Conversely, the XRD pattern associated with the
10
©2018 by NACE International.Requests for permission to publish this manuscript in any form, in part or in whole, must be in writing toNACE International, Publications Division, 15835 Park Ten Place, Houston, Texas 77084.The material presented and the views expressed in this paper are solely those of the author(s) and are not necessarily endorsed by the Association.

uninhibited specimen shows high intensity peaks for Fe3O4, which suggests that the
thickness of the Fe3O4 layer for the test with corrosion inhibitor was thinner than for the
test without corrosion inhibitor.
(a) 0ppm inhibitor (b) 440ppm inhibitor
(c) 880ppm inhibitor
Figure 8. XRD patterns of the specimens retrieved after experiments in the single
autoclave system at 150C (S stands for iron carbonate, M for Fe3O4 and Fe for iron).
In addition, specimen cross-sections were examined by SEM/EDS as shown in Figure 9
(a), (b), and (c). Figure 9 (a) clearly indicates the presence of a thick corrosion product
layer (40m) for the uninhibited conditions. However, no apparent layer was observed in
inhibited environments, as shown in Figure 9 (b), or (c). This again confirms that the
formation of corrosion product was significantly hindered by the presence of the
imidazoline-type corrosion inhibitor.
Although the experiments performed at 120 and 150C yielded interesting results, the
use of a single autoclave system could have significantly altered the data and masked
the true effect of the inhibitor. As stated earlier, the main issue with the single autoclave
system was the long heating and cooling transition periods that could have led to the
formation of corrosion product even before the inhibitor was injected. To address this
issue, the two-autoclave system was developed so that the solution and the specimens
were heated separately in order to reduce the transition period and, hence, the
formation of corrosion product thereby isolating the effect of corrosion inhibitor.
11
©2018 by NACE International.Requests for permission to publish this manuscript in any form, in part or in whole, must be in writing toNACE International, Publications Division, 15835 Park Ten Place, Houston, Texas 77084.The material presented and the views expressed in this paper are solely those of the author(s) and are not necessarily endorsed by the Association.

(a) 0 ppm inhibitor (b) 440 ppm inhibitor (c) 880 ppm inhibitor
Figure 9 Cross-sections images and EDS Fe element mapping of specimens with
various concentrations of corrosion inhibitor at 150C
Corrosion behavior at 120C in the two-autoclave system
The change in LPR corrosion rates with time with and without imidazoline-type inhibitor
is shown in Figure 10. In the uninhibited system, the corrosion rate was initially around 5
mmy-1 and increased gradually to 9 mmy-1 during the first 1 hour. After that, corrosion
rate remained around 9 mmy-1 for the next 22 hours of exposure. The stable corrosion
rate suggests that the formation of corrosion product layers was prevented in the 24
hour experiment without corrosion inhibitor. This behavior indicates that the formation of
corrosion product is at least significantly delayed in the new system and likely due to a
decrease in the carbon steel specimen exposure time to the solution.
In the inhibited system (440 ppm of inhibitor), the corrosion rate dropped quickly from an
initial corrosion rate of 7 mmy-1 to 3.5 mmy-1 after the addition of corrosion inhibitor.
The corrosion rate then remained stable for the rest of the experiment. This behavior is
similar to what was previously observed at 120C in the 1 autoclave system. The similar
value of the inhibited corrosion rate suggests that the performance of the inhibitor is
correctly captured in both autoclave systems.
Since the uninhibited corrosion rate could be determined with more confidence in the
two-autoclave system, the inhibition efficiency of the imidazoline-type inhibitor could
then be calculated as:
𝐼𝑛ℎ𝑖𝑏𝑖𝑡𝑖𝑜𝑛 𝑒𝑓𝑓𝑖𝑐𝑖𝑒𝑛𝑐𝑦 = (1 −
𝑖𝑛ℎ𝑖𝑏𝑖𝑡𝑒𝑑 𝑐𝑜𝑟𝑟𝑜𝑠𝑖𝑜𝑛 𝑟𝑎𝑡𝑒
𝑢𝑛𝑖𝑛ℎ𝑖𝑏𝑖𝑡𝑒𝑑 𝑐𝑜𝑟𝑟𝑜𝑠𝑖𝑜𝑛 𝑟𝑎𝑡𝑒) × 100%
= 61% (1)
12
©2018 by NACE International.Requests for permission to publish this manuscript in any form, in part or in whole, must be in writing toNACE International, Publications Division, 15835 Park Ten Place, Houston, Texas 77084.The material presented and the views expressed in this paper are solely those of the author(s) and are not necessarily endorsed by the Association.

Figure 10. Corrosion rate with/without corrosion inhibitor at 120C and 2 bar pCO2
in the two-autoclave system (B=23mV/decade).
In the absence of inhibitor, the fact that the corrosion rate remained constant during the
entire duration of the test suggests that no protective corrosion product layer formed.
This is different from what was observed in the single autoclave system. To confirm the
absence of an iron carbonate layer, the surface was characterized using XRD, SEM and
EDS.
The XRD patterns of the specimens recovered for the “120C” experiment in the new
system are shown in Figure 11. The major difference from the single autoclave system
is that even without corrosion inhibitor, the FeCO3 peaks are absent. This is likely
because, in the new system, the heating period was completely by-passed. This
decreases the exposure time of the steel specimen to the electrolyte and minimizes the
buildup of Fe2+ in solution; this delayed the formation of iron carbonate.
(a) 0ppm inhibitor (b) 440ppm inhibitor
Figure 11 XRD patterns of the specimens retrieved after experiments in the two
autoclave system at 120C (Fe stands for iron).
13
©2018 by NACE International.Requests for permission to publish this manuscript in any form, in part or in whole, must be in writing toNACE International, Publications Division, 15835 Park Ten Place, Houston, Texas 77084.The material presented and the views expressed in this paper are solely those of the author(s) and are not necessarily endorsed by the Association.

Figure 12 demonstrates formation of a very porous corrosion product layer. The
absence of FeCO3 crystals is also noticeable. In Figure 12 (b), the surface appears
relatively flat with sheet-like features, often associated with iron carbide, partly covering
the surface. The formation of FeCO3 was clearly delayed at 120C in the new system.
(a) 0 ppm inhibitor (b) 440 ppm inhibitor
Figure 12. SEM images of specimen surfaces from 120C experiments
Corrosion behavior in the 2-autoclave system with and without corrosion
inhibitor at 150C
Corrosion rates of mild steel specimens exposed to different concentrations of the
imidazoline-type corrosion inhibitor at 150C are shown in Figure 13. At 0 ppm corrosion
inhibitor, the corrosion rate increased slightly at the beginning of the test and then
decreased gradually. Once again, the decrease of the corrosion rate was likely due to
the formation of corrosion products. With 440 ppm corrosion inhibitor, the corrosion rate
trend was again very similar to what was observed without corrosion inhibitor. The
corrosion rate decreased to around 3 mmy-1 after the 24 hours experiment. Similarly,
with 880 ppm inhibitor added into the system, the corrosion rate also monotonously
decreased to around 6 mmy-1. These results are very similar to what was obtained in
the single autoclave system. This suggests that the addition of corrosion inhibitor did not
inhibit the corrosion rate at 150C.
The XRD patterns of the specimens recovered from this set of experiments are shown
in Figure 14. The patterns are similar to the XRD data in the single autoclave system at
150C (Figure 8). In the absence of corrosion inhibitor, the Fe3O4 peak intensity is high,
which suggests that a thick layer of magnetite formed on the surface of the specimen. In
the presence of inhibitor, the same Fe3O4 peak was detected but at a much lower
intensity.
14
©2018 by NACE International.Requests for permission to publish this manuscript in any form, in part or in whole, must be in writing toNACE International, Publications Division, 15835 Park Ten Place, Houston, Texas 77084.The material presented and the views expressed in this paper are solely those of the author(s) and are not necessarily endorsed by the Association.

Figure 13. Corrosion rates with various amount inhibitors at 150C in the two autoclave system. (2 bar pCO2)
(a) 0ppm inhibitor (b) 440ppm inhibitor
(c) 880ppm inhibitor
Figure 14. XRD patterns of the specimens retrieved after experiments in the two-
autoclave system at 150C. (Fe stands for iron, S stands for FeCO3 and M stands for Fe3O4)
The surface morphologies of the specimens, considering the tests with and without
corrosion inhibitor, are shown in Figure 15 (a), (b), (c). They are distinctly different. In
15
©2018 by NACE International.Requests for permission to publish this manuscript in any form, in part or in whole, must be in writing toNACE International, Publications Division, 15835 Park Ten Place, Houston, Texas 77084.The material presented and the views expressed in this paper are solely those of the author(s) and are not necessarily endorsed by the Association.
uninhibited environments, the surface of the mild steel specimen featured a uniform
surface with crystallized structures on top. However, the surfaces of the specimen
collected from the inhibited tests were uneven and partly covered with porous layers.
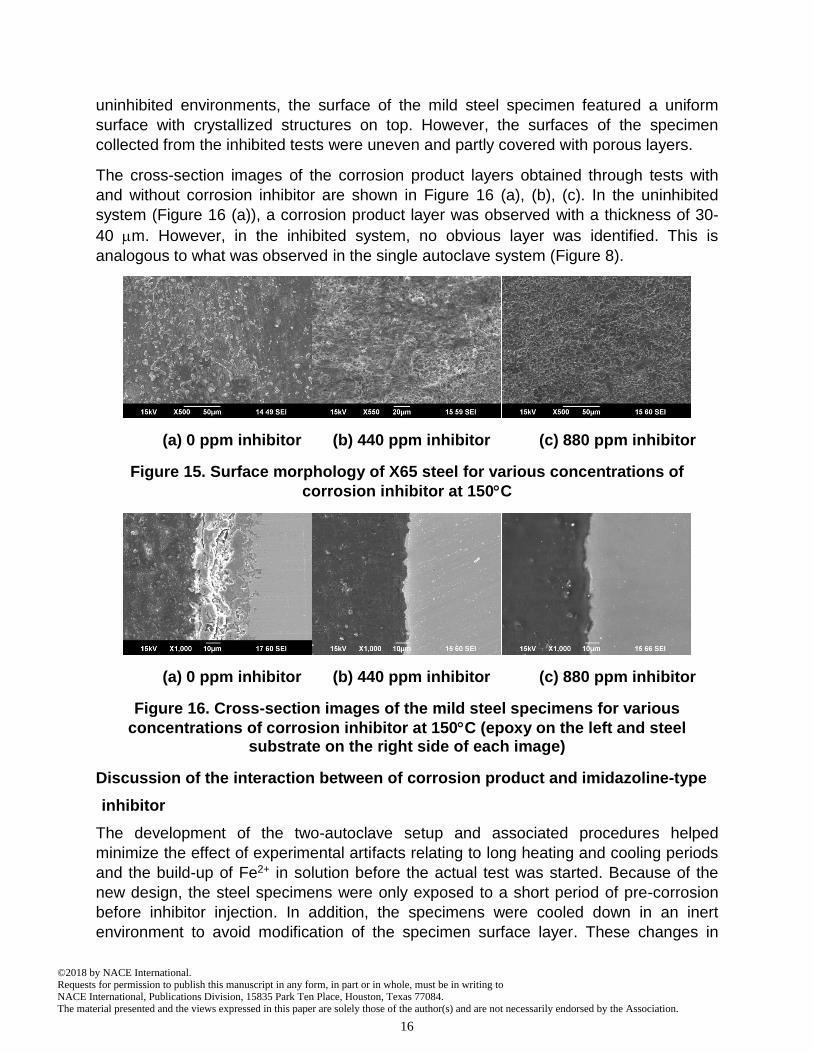
The cross-section images of the corrosion product layers obtained through tests with
and without corrosion inhibitor are shown in Figure 16 (a), (b), (c). In the uninhibited
system (Figure 16 (a)), a corrosion product layer was observed with a thickness of 30-
40 m. However, in the inhibited system, no obvious layer was identified. This is
analogous to what was observed in the single autoclave system (Figure 8).
(a) 0 ppm inhibitor (b) 440 ppm inhibitor (c) 880 ppm inhibitor
Figure 15. Surface morphology of X65 steel for various concentrations of
corrosion inhibitor at 150C
(a) 0 ppm inhibitor (b) 440 ppm inhibitor (c) 880 ppm inhibitor
Figure 16. Cross-section images of the mild steel specimens for various
concentrations of corrosion inhibitor at 150C (epoxy on the left and steel substrate on the right side of each image)
Discussion of the interaction between of corrosion product and imidazoline-type
inhibitor
The development of the two-autoclave setup and associated procedures helped
minimize the effect of experimental artifacts relating to long heating and cooling periods
and the build-up of Fe2+ in solution before the actual test was started. Because of the
new design, the steel specimens were only exposed to a short period of pre-corrosion
before inhibitor injection. In addition, the specimens were cooled down in an inert
environment to avoid modification of the specimen surface layer. These changes in
16
©2018 by NACE International.Requests for permission to publish this manuscript in any form, in part or in whole, must be in writing toNACE International, Publications Division, 15835 Park Ten Place, Houston, Texas 77084.The material presented and the views expressed in this paper are solely those of the author(s) and are not necessarily endorsed by the Association.

setup and procedures clearly affected the 120C uninhibited test results for which the
formation of iron carbonate was delayed, enabling the specimen to corrode uniformly
during the entire duration of the test. However, no noticeable changes in the uninhibited
results of the 150C experiment were observed, whether the test was performed in the
single or two autoclave setups. This suggests different uninhibited corrosion
mechanisms for these two tested temperatures, which are most likely due to the type
corrosion products that formed on the steel surface. Yet, at 150C, the inhibited
experimental results remained relatively unaffected by the change in test setup.
To better understand the role of different corrosion product, the types of corrosion
product encountered in the two-autoclave system are summarized in
Table 3.
Table 3. Corrosion products in various environments
Temperature/C XRD patterns of products without inhibitor
XRD patterns of products with inhibitor
120 None found None found
150 FeCO3/Fe3O4 Fe3O4
Compared to the single-autoclave system, the formation of FeCO3 was delayed at
120C in an uninhibited system. However, at 150C, the formation of Fe3O4 was not
significantly affected. In addition, the formation of corrosion products was impeded by
the presence of corrosion inhibitor at both temperatures. The corrosion product
formation on the inhibition effect of the imidazoline-type inhibitor is also evident by
combining the results from cross-section examination and the XRD patterns. The cross-
section images clearly show that there seems to be no formation of corrosion product
layers. Although XRD confirms the presence of Fe3O4 at 150C, a thick layer was only
seen in the absence of corrosion inhibitor.
In addition, the water chemistry at the end of each experiment in the single-autoclave
system was recorded and is given in Table 4. The water chemistry in the two-autoclave
system is similar to what was observed in the single autoclave system and, hence, is
not discussed further here. The bulk iron carbonate saturation and scaling tendency in
the table were calculated based on an in-house CO2 corrosion model. In all the tested
conditions, the corrosion product should have formed rapidly since the systems were
highly supersaturated with FeCO3. However, corrosion product layers were only
observed in uninhibited conditions. This again confirms that the imidazoline-type
inhibitor played a role in inhibition of corrosion product formation.
By inspecting the types of corrosion products in the different environments tested, it
seems that the formation of Fe3O4 governs the corrosion mechanism at 150C and that
its formation occurs rapidly at the beginning of each experiment. No matter what
autoclave system was used, Fe3O4 was always observed at 150C in the XRD patterns.
17
©2018 by NACE International.Requests for permission to publish this manuscript in any form, in part or in whole, must be in writing toNACE International, Publications Division, 15835 Park Ten Place, Houston, Texas 77084.The material presented and the views expressed in this paper are solely those of the author(s) and are not necessarily endorsed by the Association.

Literature also shows that the formation of Fe3O4 at higher temperatures is fast9, 10. In
addition, Fe3O4 has a protective role against corrosion. In this study, the experimental
corrosion rates indeed quickly decreased due to the rapid formation of Fe3O4. In the
absence of inhibitor, the Fe3O4 grew very thick, providing additional mass transfer
limitation, which might also contribute to the low final corrosion rate at the end of the
test. Comparatively, the fact that inhibitor could impede the formation of additional
Fe3O4, as shown in Figure 9 and Figure 16, could be the reason behind the slightly
higher final corrosion rates (Figure 13).
Table 4. Water chemistry at the end of each experiment in the single-autoclave system
Test conditions C(Fe2+)/ppm pH Bulk FeCO3 saturation
Scaling tendency at the
steel surface
120C, 0ppm
121 5.90 167 20
120C, 440ppm
107 5.80 144 11
150C, 0ppm
129 5.87 195 75
150C, 440ppm
80 5.80 165 34
150C, 880ppm
113 5.93 225 86
The role of thermal stability of the corrosion inhibitor
The imidazoline-type inhibitor is reported to be unstable at higher temperatures and to
hydrolyze into its amide precursor11, 12. The degradation of corrosion inhibitor might also
affect the corrosion inhibition. A method using UV-Vis was developed to measure the
imidazoline-type inhibitor concentration in 1 wt.% NaCl solution13.
The inhibitor concentration at the beginning and the end of each experiment was
measured and recorded as shown in Table 5. The residual inhibitor percentage was
defined as:
𝑅𝑒𝑠𝑖𝑑𝑢𝑎𝑙 𝑖𝑛ℎ𝑖𝑏𝑖𝑡𝑜𝑟 𝑝𝑒𝑟𝑐𝑒𝑛𝑡𝑎𝑔𝑒 =𝐼𝑛ℎ𝑖𝑏𝑖𝑡𝑜𝑟 𝑐𝑜𝑛𝑐𝑒𝑛𝑡𝑟𝑎𝑡𝑖𝑜𝑛
𝐼𝑛𝑖𝑡𝑖𝑎𝑙 𝑖𝑛ℎ𝑖𝑏𝑖𝑡𝑜𝑟 𝑐𝑜𝑛𝑐𝑒𝑛𝑡𝑟𝑎𝑡𝑖𝑜𝑛 (2)
The residual percentage was found to be similar in the two-autoclave system, at around
50-60%. There was clearly a loss of the active component (imidazoline-type) of the
corrosion inhibitor at higher temperatures.
18
©2018 by NACE International.Requests for permission to publish this manuscript in any form, in part or in whole, must be in writing toNACE International, Publications Division, 15835 Park Ten Place, Houston, Texas 77084.The material presented and the views expressed in this paper are solely those of the author(s) and are not necessarily endorsed by the Association.

Table 5. Imidazoline-type inhibitor concentration in the single autoclave system
Test conditions Initial
concentration/ppm Final
concentration/ppm Residual inhibitor
percentage/%
120C, 440ppm 257 127 49
150C, 440ppm 309 194 63
150C, 880ppm 614 295 48
Some black oily residue was found on the autoclave wall after the experiments. This
residue was insoluble in water, so UV-Vis spectroscopy was not readily able to identify
this species. Therefore, Fourier transform infrared (FTIR) spectroscopy was used to
identify components of the oily residue. The spectrum is shown in Figure 17. Two
peaks associated with the imidazoline are observed. Peak 1 at around 1645 cm-1 and
peak 2 at 1556 cm-1 stand for the stretch (st) mode of the C=O bond and the stretch and
symmetric (st sy) mode of N-C=O bond14, respectively, which only exist in the amide. It
is worthy to mention that in the literature11, for a imidazoline-type inhibitor, there is a
peak at 1610 cm-1 which represents the stretch mode of C=N. However, this peak was
not observed in the spectrum. Therefore, it can be concluded the oily residue likely
consisted of amide precursor only.
Figure 17. FTIR spectrum of black gum retrieved from experiment (peak 1: C=O st, peak 2: N-C=O, st sy)
From the above results, it can be concluded that the imidazoline-type inhibitor was
partially hydrolyzed into its amide precursor at high temperature. Due to its low solubility
in water, the amide accumulated on the wall of the autoclave. About 40-50% of the
imidazoline inhibitor was lost this way due to thermal degradation. However, there was
still plenty of “intact” imidazoline inhibitor left in the system. This means that the failure
19
©2018 by NACE International.Requests for permission to publish this manuscript in any form, in part or in whole, must be in writing toNACE International, Publications Division, 15835 Park Ten Place, Houston, Texas 77084.The material presented and the views expressed in this paper are solely those of the author(s) and are not necessarily endorsed by the Association.

of the inhibition at higher temperatures (150C) was not entirely due to the degradation
of imidazoline-type inhibitor.
Conclusions
Mild steel corrosion inhibition tests were performed at 120 and 150C in a CO2
environment with an imidazoline-type inhibitor (diethylenetriamine tall oil fatty acid
imidazoline (DETA/TOFA imidazoline)). The experiments were performed in a standard
autoclave and in a specially designed two-autoclave system. The two-autoclave design
was developed to limit specimen exposure to oxygen and eliminating long transition
times associated with solution heating/cooling.
In a single-autoclave system, the uninhibited corrosion results seem to be affected by
the formation of corrosion product (FeCO3 at 120C and Fe3O4 at 150C), possibly due
to the long heating transition period. This, in turn, masked the true role of the
imidazoline-type inhibitor on the corrosion process.
Using the two-autoclave system, the formation of iron carbonate in the uninhibited test
was mostly avoided at 120C. The efficiency of the inhibitor could then be clearly
determined at 61%. At 150C, the rapid formation of Fe3O4 could not be prevented and
seemed to control the corrosion behavior with or without inhibitor. At this temperature,
the presence of inhibitor had no visible effect on the corrosion rate.
The imidazoline-type inhibitor also showed scale inhibiting abilities. With the presence
of corrosion inhibitor, there was no noticeable corrosion product layer on the steel
surface at 120C or 150C (except for a very thin Fe3O4 layer detected in the XRD
patterns at 150C).
The imidazoline-type inhibitor degraded into its amide precursor at tested temperatures.
However, only about 40% to 50% of the inhibitor was lost due to the hydrolysis of
imidazoline. Consequently, the failure of inhibition at 150C was not entirely due to the
degradation of imidazoline-type inhibitor.
Acknowledgements
The author would like to thank the following companies for their financial support:
Anadarko, Baker Hughes, BP, Chevron, CNOOC, ConocoPhillips, DNV GL, ExxonMobil,
M-I SWACO (Schlumberger), Multi-Chem (Halliburton), Occidental Oil Company, PTT,
Saudi Aramco, Shell Global Solutions, SINOPEC (China Petroleum), TOTAL, and Wood
Group Kenny.
20
©2018 by NACE International.Requests for permission to publish this manuscript in any form, in part or in whole, must be in writing toNACE International, Publications Division, 15835 Park Ten Place, Houston, Texas 77084.The material presented and the views expressed in this paper are solely those of the author(s) and are not necessarily endorsed by the Association.

References
1. R. W. Bentley, “Global oil & gas depletion: an overview,” Energy Policy 30 (2003): pp. 189-205.
2. A. Shadravan and M. Amani, “HPHT 101-What petroleum engineers and geoscientists should know about high pressure high temperature wells environment,” Energy Science and Technology 4.2 (2012): pp.36-60.
3. N. U. Obeyesekere, A. R. Naraghi, L. Chen, S. Zhou, and S. Wang, “Novel corrosion inhibitors for high temperature applications,” CORROSION 2005, paper no. 05636.
4. S. Ramachandran, Y. S. Ahn, M. Greaves, V. Jovancicevic, and J. Bassett, “Development of high temperature high pressure corrosion inhibitor,” CORROSION 2006, paper no. 06377.
5. A. Palencsár, E. Gulbrandsen, and K. Kosorú, “High temperature testing of corrosion inhibitor performance,” CORROSION 2013, paper no. 2610.
6. Y. Ding, B. Brown, D. Young, S. Nesic, and M. Singer, “Effect of temperature on adsorption behavior and corrosion inhibition performance of imidazoline-type inhibitor,” CORROSION 2017, paper no. 9350.
7. T. Tanupabrungsun, D. Young, B. Brown, and S. Nešić, “Construction and verification of pourbaix diagrams for CO2 corrosion of mild steel valid up to 250° C,” CORROSION 2012, paper no. 0001418.
8. T. Tanupabrungsun, B. Brown, and S. Nesic, “Effect of pH on CO2 corrosion of mild steel at elevated temperatures,” CORROSION 2013, paper no. 2348.
9. J. E. Castle and H. G. Masterson, “The role of diffusion in the oxidation of mild steel in high temperature aqueous solutions,” Corrosion Science 6.3-4, (1966): pp. 93-96.
10. J. Robertson, “The mechanism of high temperature aqueous corrosion of steel,” Corrosion Science, 29. 11-12, (1989): 1275-1291.
11. J. A. Martin and F. W. Valone, “The existence of imidazoline corrosion inhibitors,” Corrosion, 41.5 (1985): pp. 281-287.
12. V. Jovancicevic, S. Ramachandran, and P. Prince, “Inhibition of carbon dioxide corrosion of mild steel by imidazolines and their precursors,” Corrosion, 55.5 (1999): pp. 449-455.
21
©2018 by NACE International.Requests for permission to publish this manuscript in any form, in part or in whole, must be in writing toNACE International, Publications Division, 15835 Park Ten Place, Houston, Texas 77084.The material presented and the views expressed in this paper are solely those of the author(s) and are not necessarily endorsed by the Association.

13. NACE student poster session. “Determination of imidazoline-type inhibitor concentrations by UV-Vis spectroscopy,” CORROSION 2017.
14. E. Pretsch, P. Bühlmann, C. Affolter, Structure determination of organic compounds, 4th ed. (Springer Berlin Heidelberg, 2009), pp. 293-295.
22
©2018 by NACE International.Requests for permission to publish this manuscript in any form, in part or in whole, must be in writing toNACE International, Publications Division, 15835 Park Ten Place, Houston, Texas 77084.The material presented and the views expressed in this paper are solely those of the author(s) and are not necessarily endorsed by the Association.